
The Impact of Building Morphology on Energy Use Intensity of High-Rise Residential Clusters: A Case Study of Hangzhou, China
 ,
,
Abstract
:1. Introduction
2. Literature Review
2.1. A Review of Building Morphology Parameters
2.2. A Review of Building Morphology and Energy Performance
3. Methodology
3.1. Research Framework
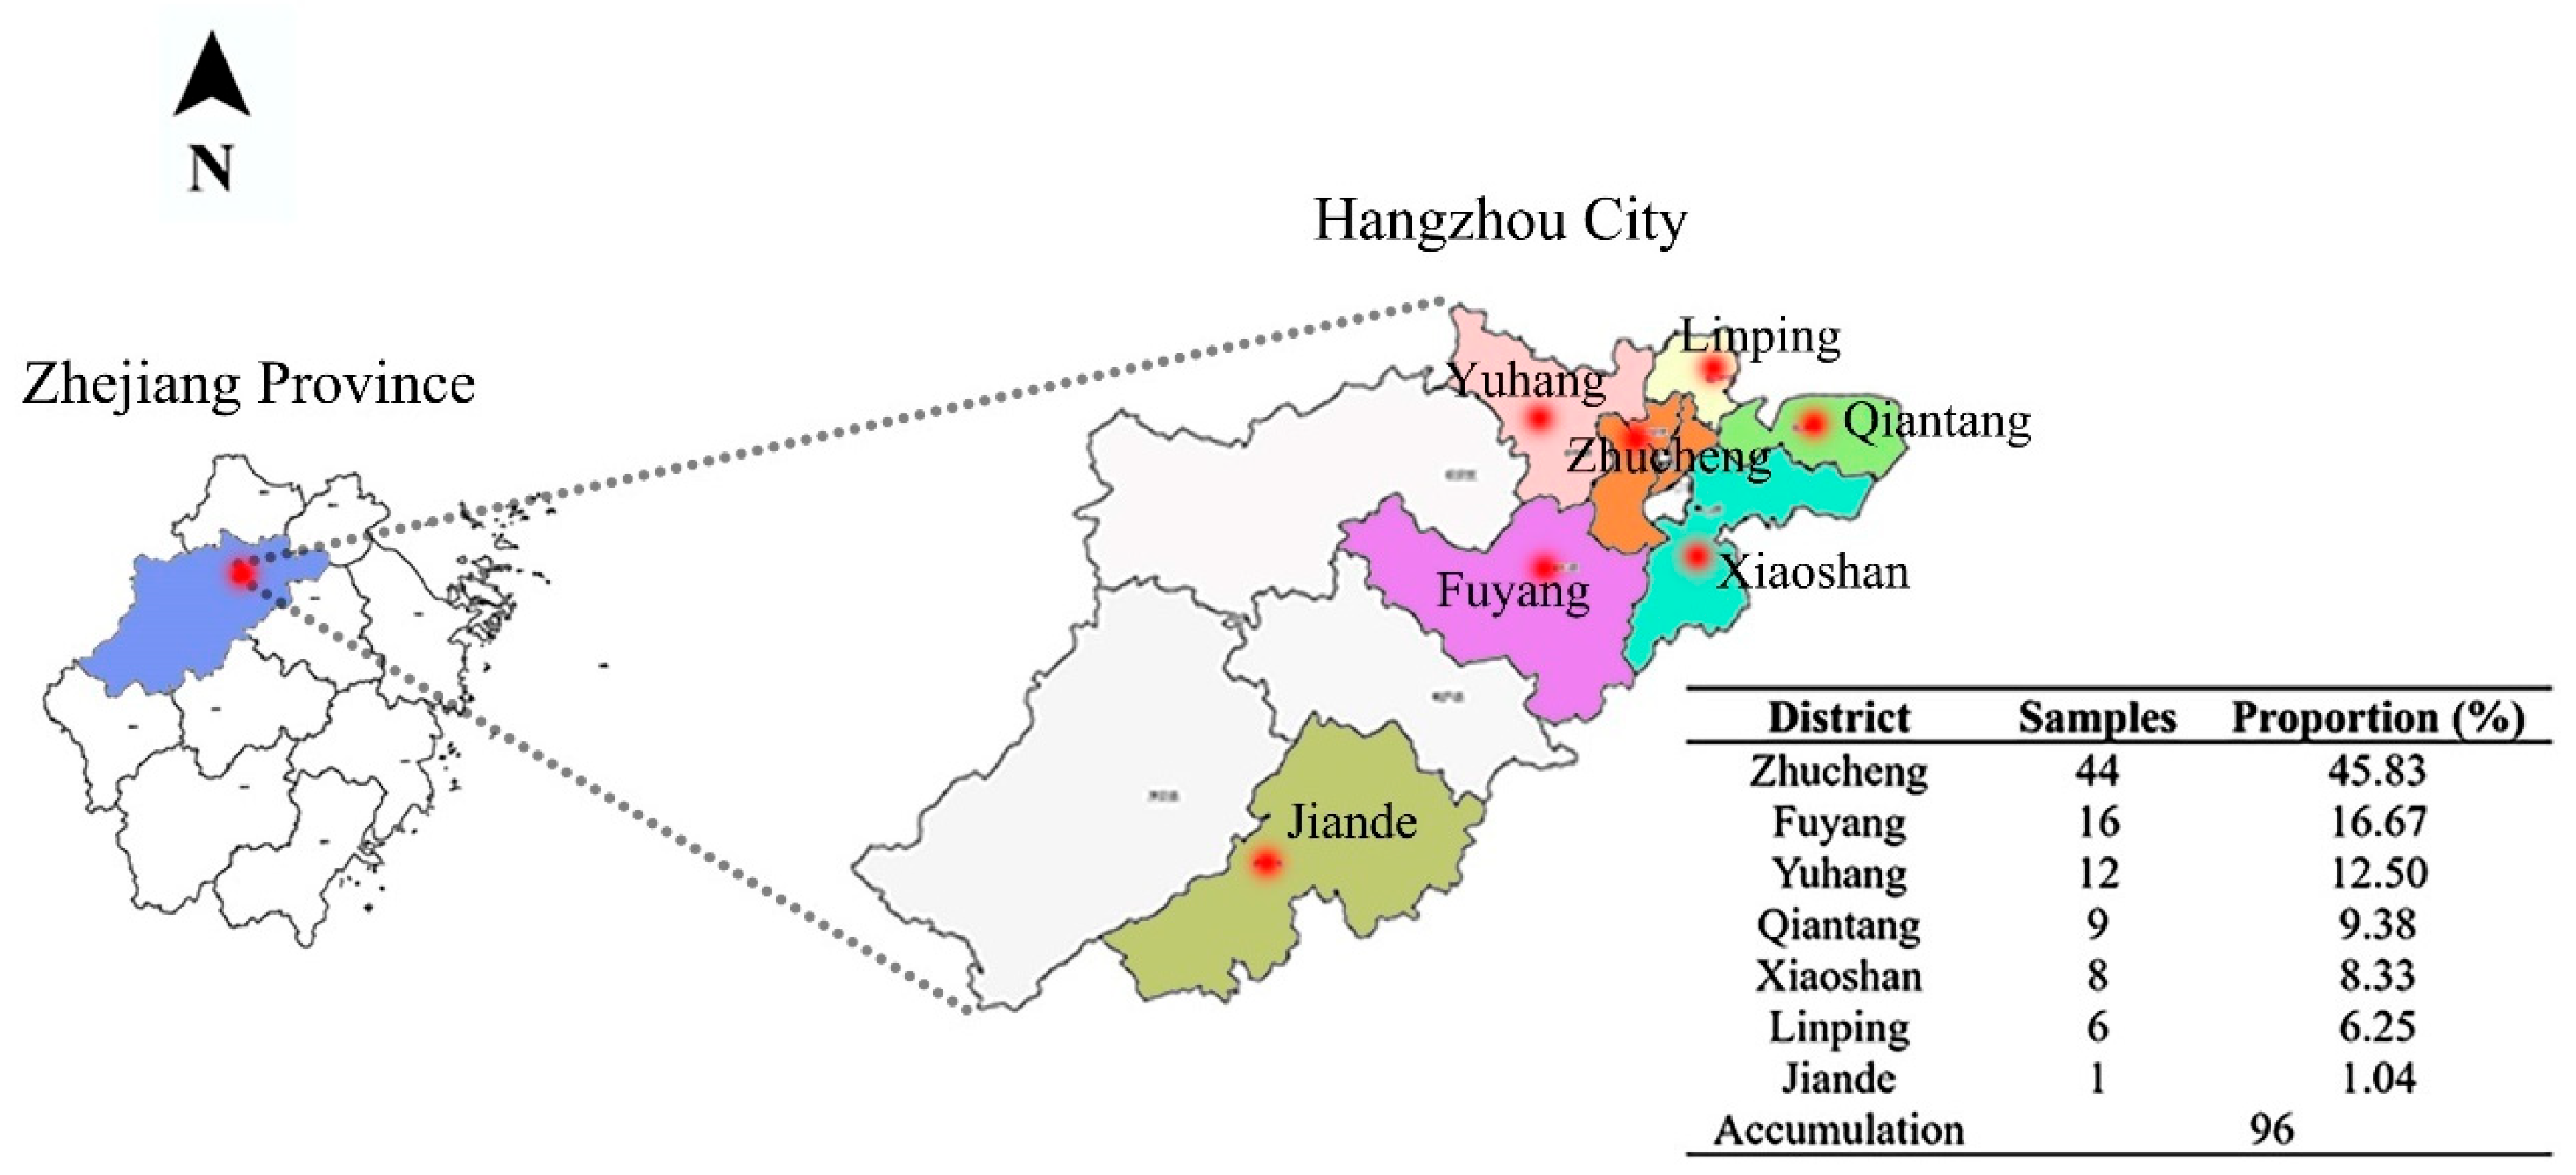
3.2. Study Area
3.3. Correlation Relationship Analysis
3.4. The Objective of Optimization
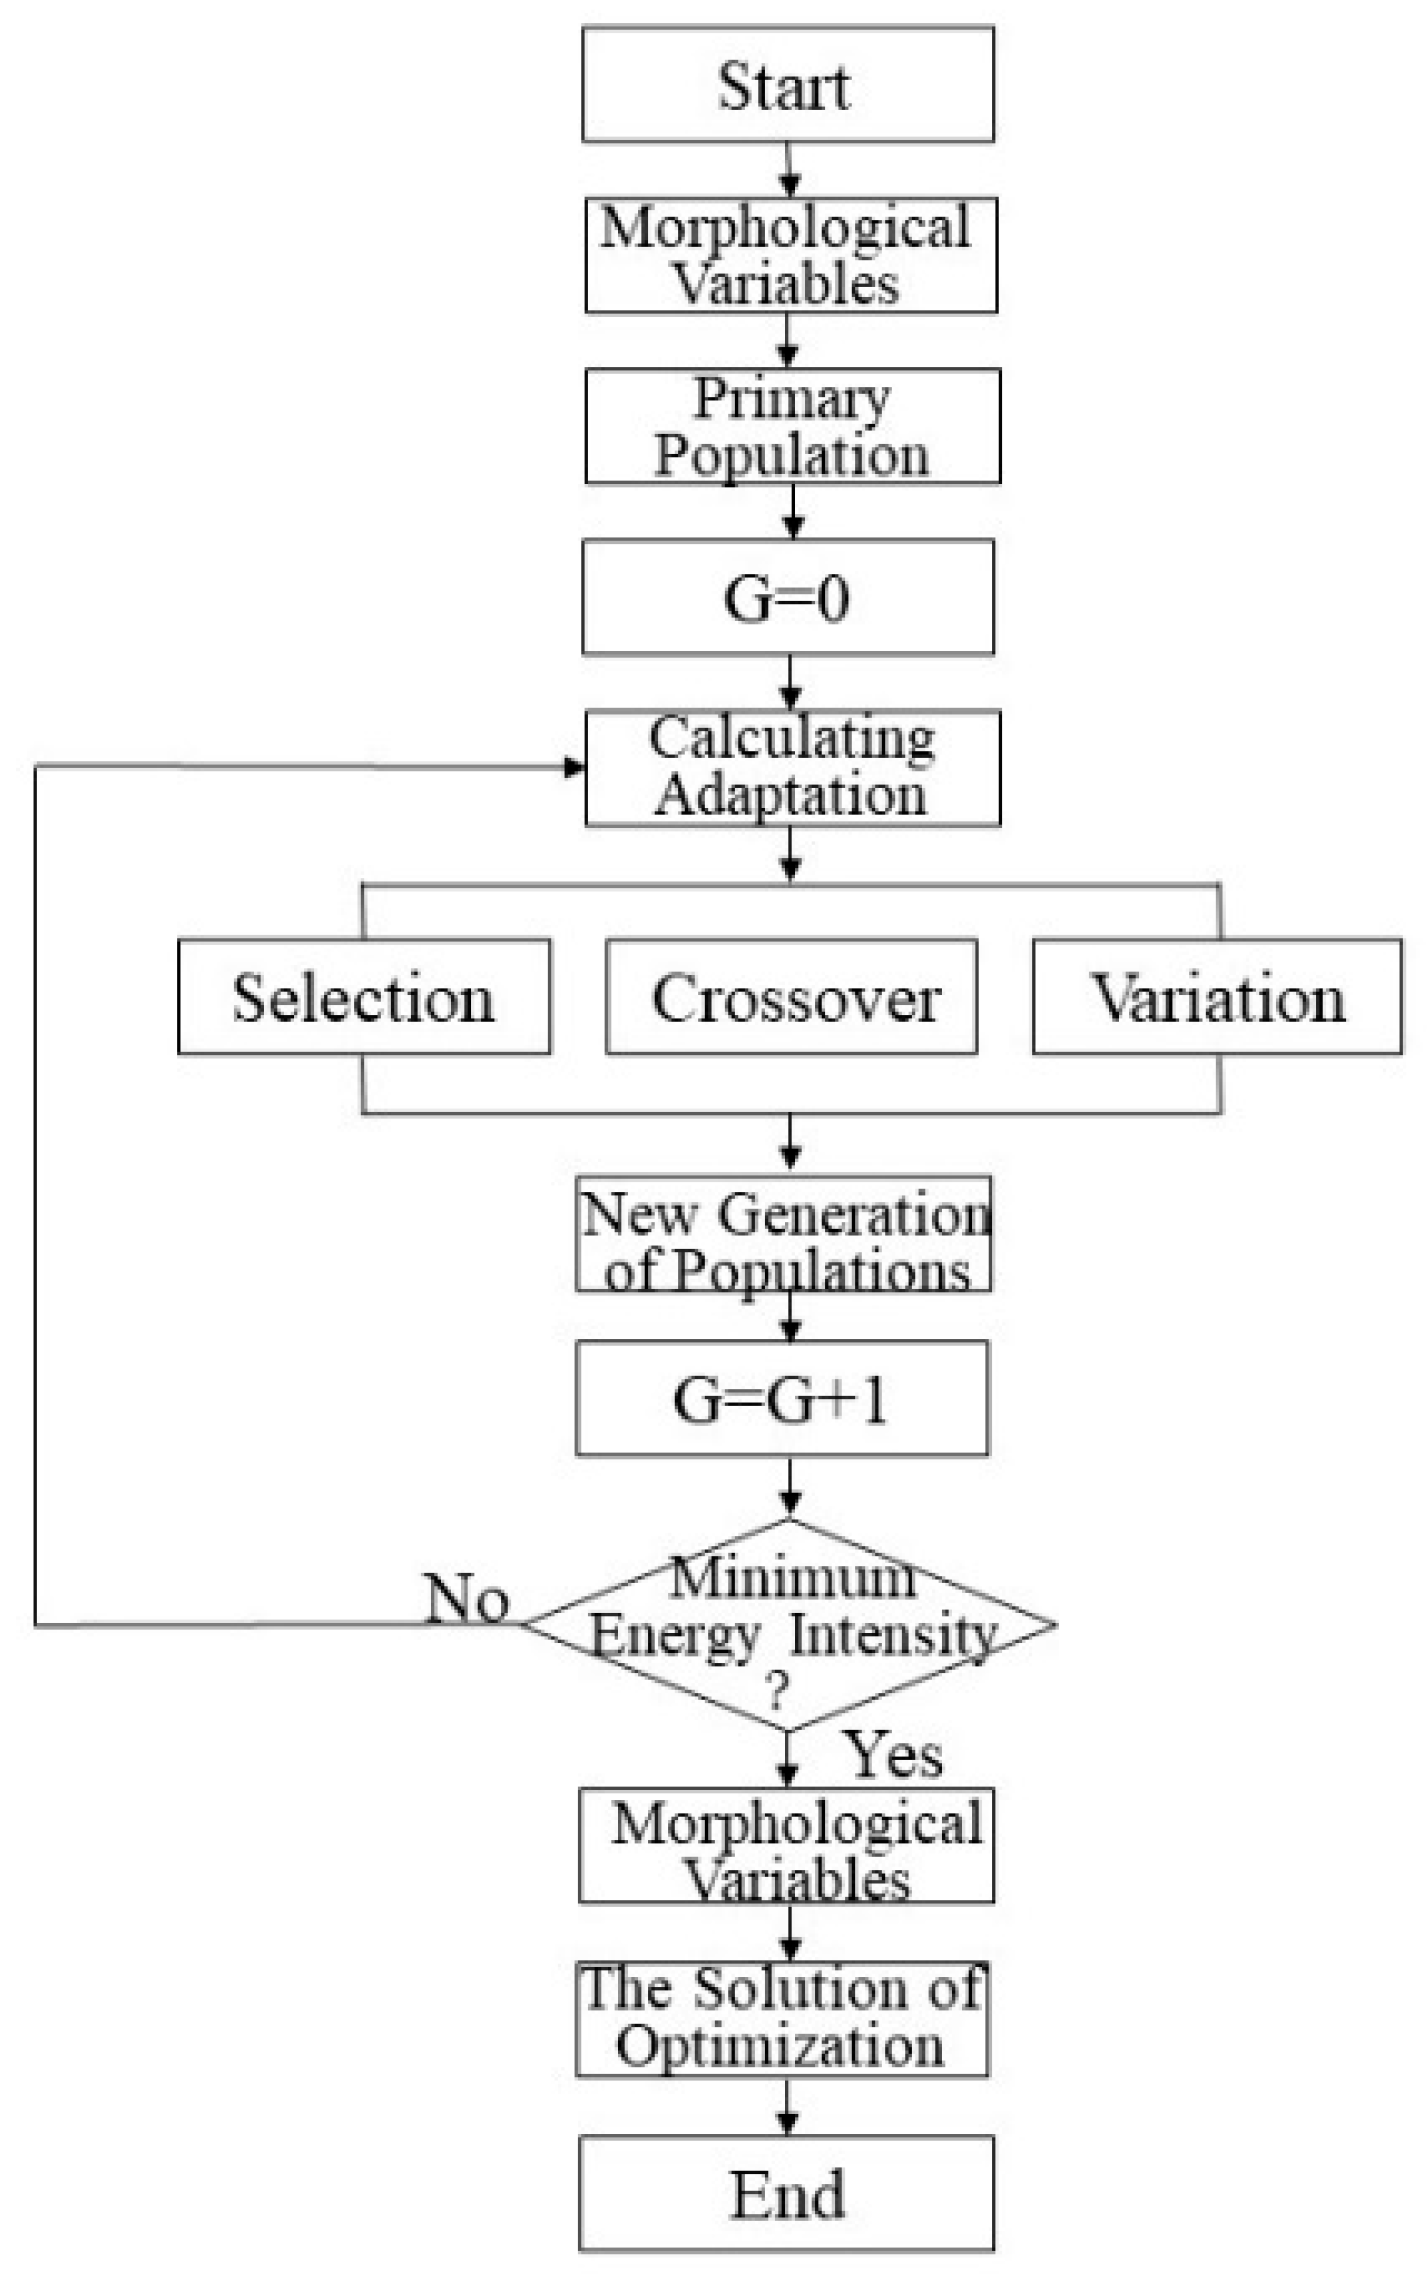
3.5. Optimization Algorithm
4. Building the Database and Optimization Model
4.1. Morphological Characteristics of Residential Clusters
- (1)
- The building shapes
- (2)
- The building layout
- (3)
- The average orientation
- (4)
- The aspect ratio and depth
4.2. Electricity Usage of Residential Clusters
4.3. Extracting the Key Parameters of Morphology Based on Energy Use Intensity
4.4. Optimization Model for the Residential Clusters
5. Results
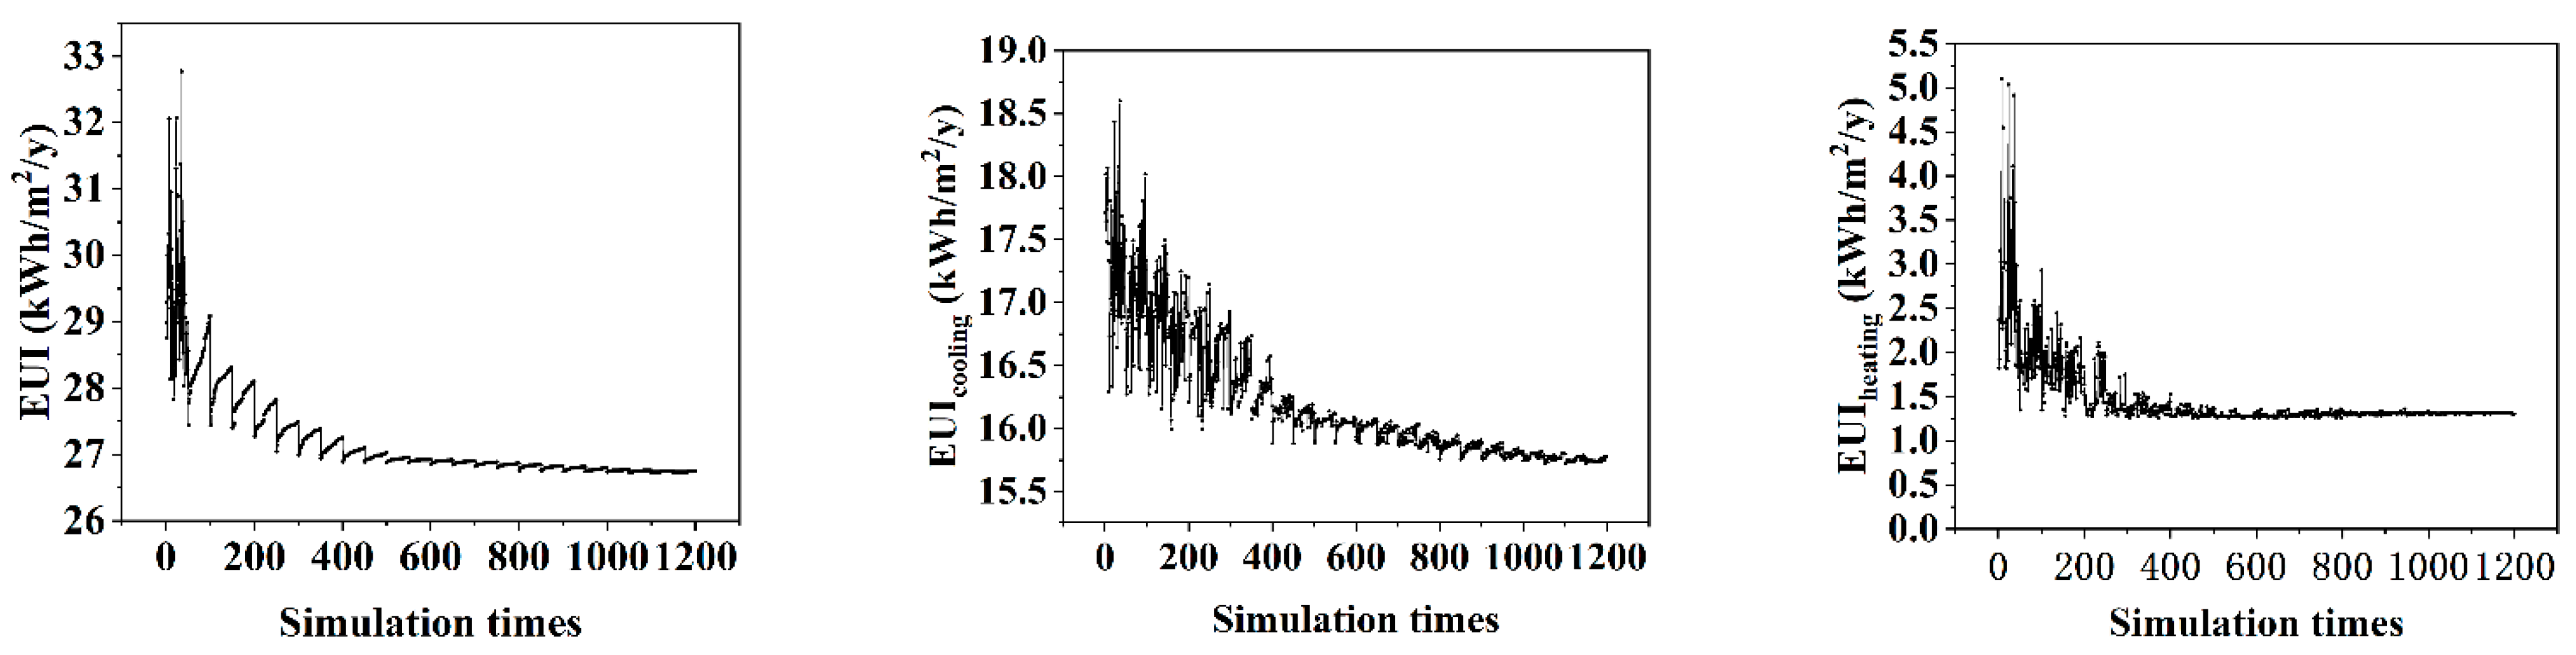
5.1. Energy Use Intensity of the Benchmark Model
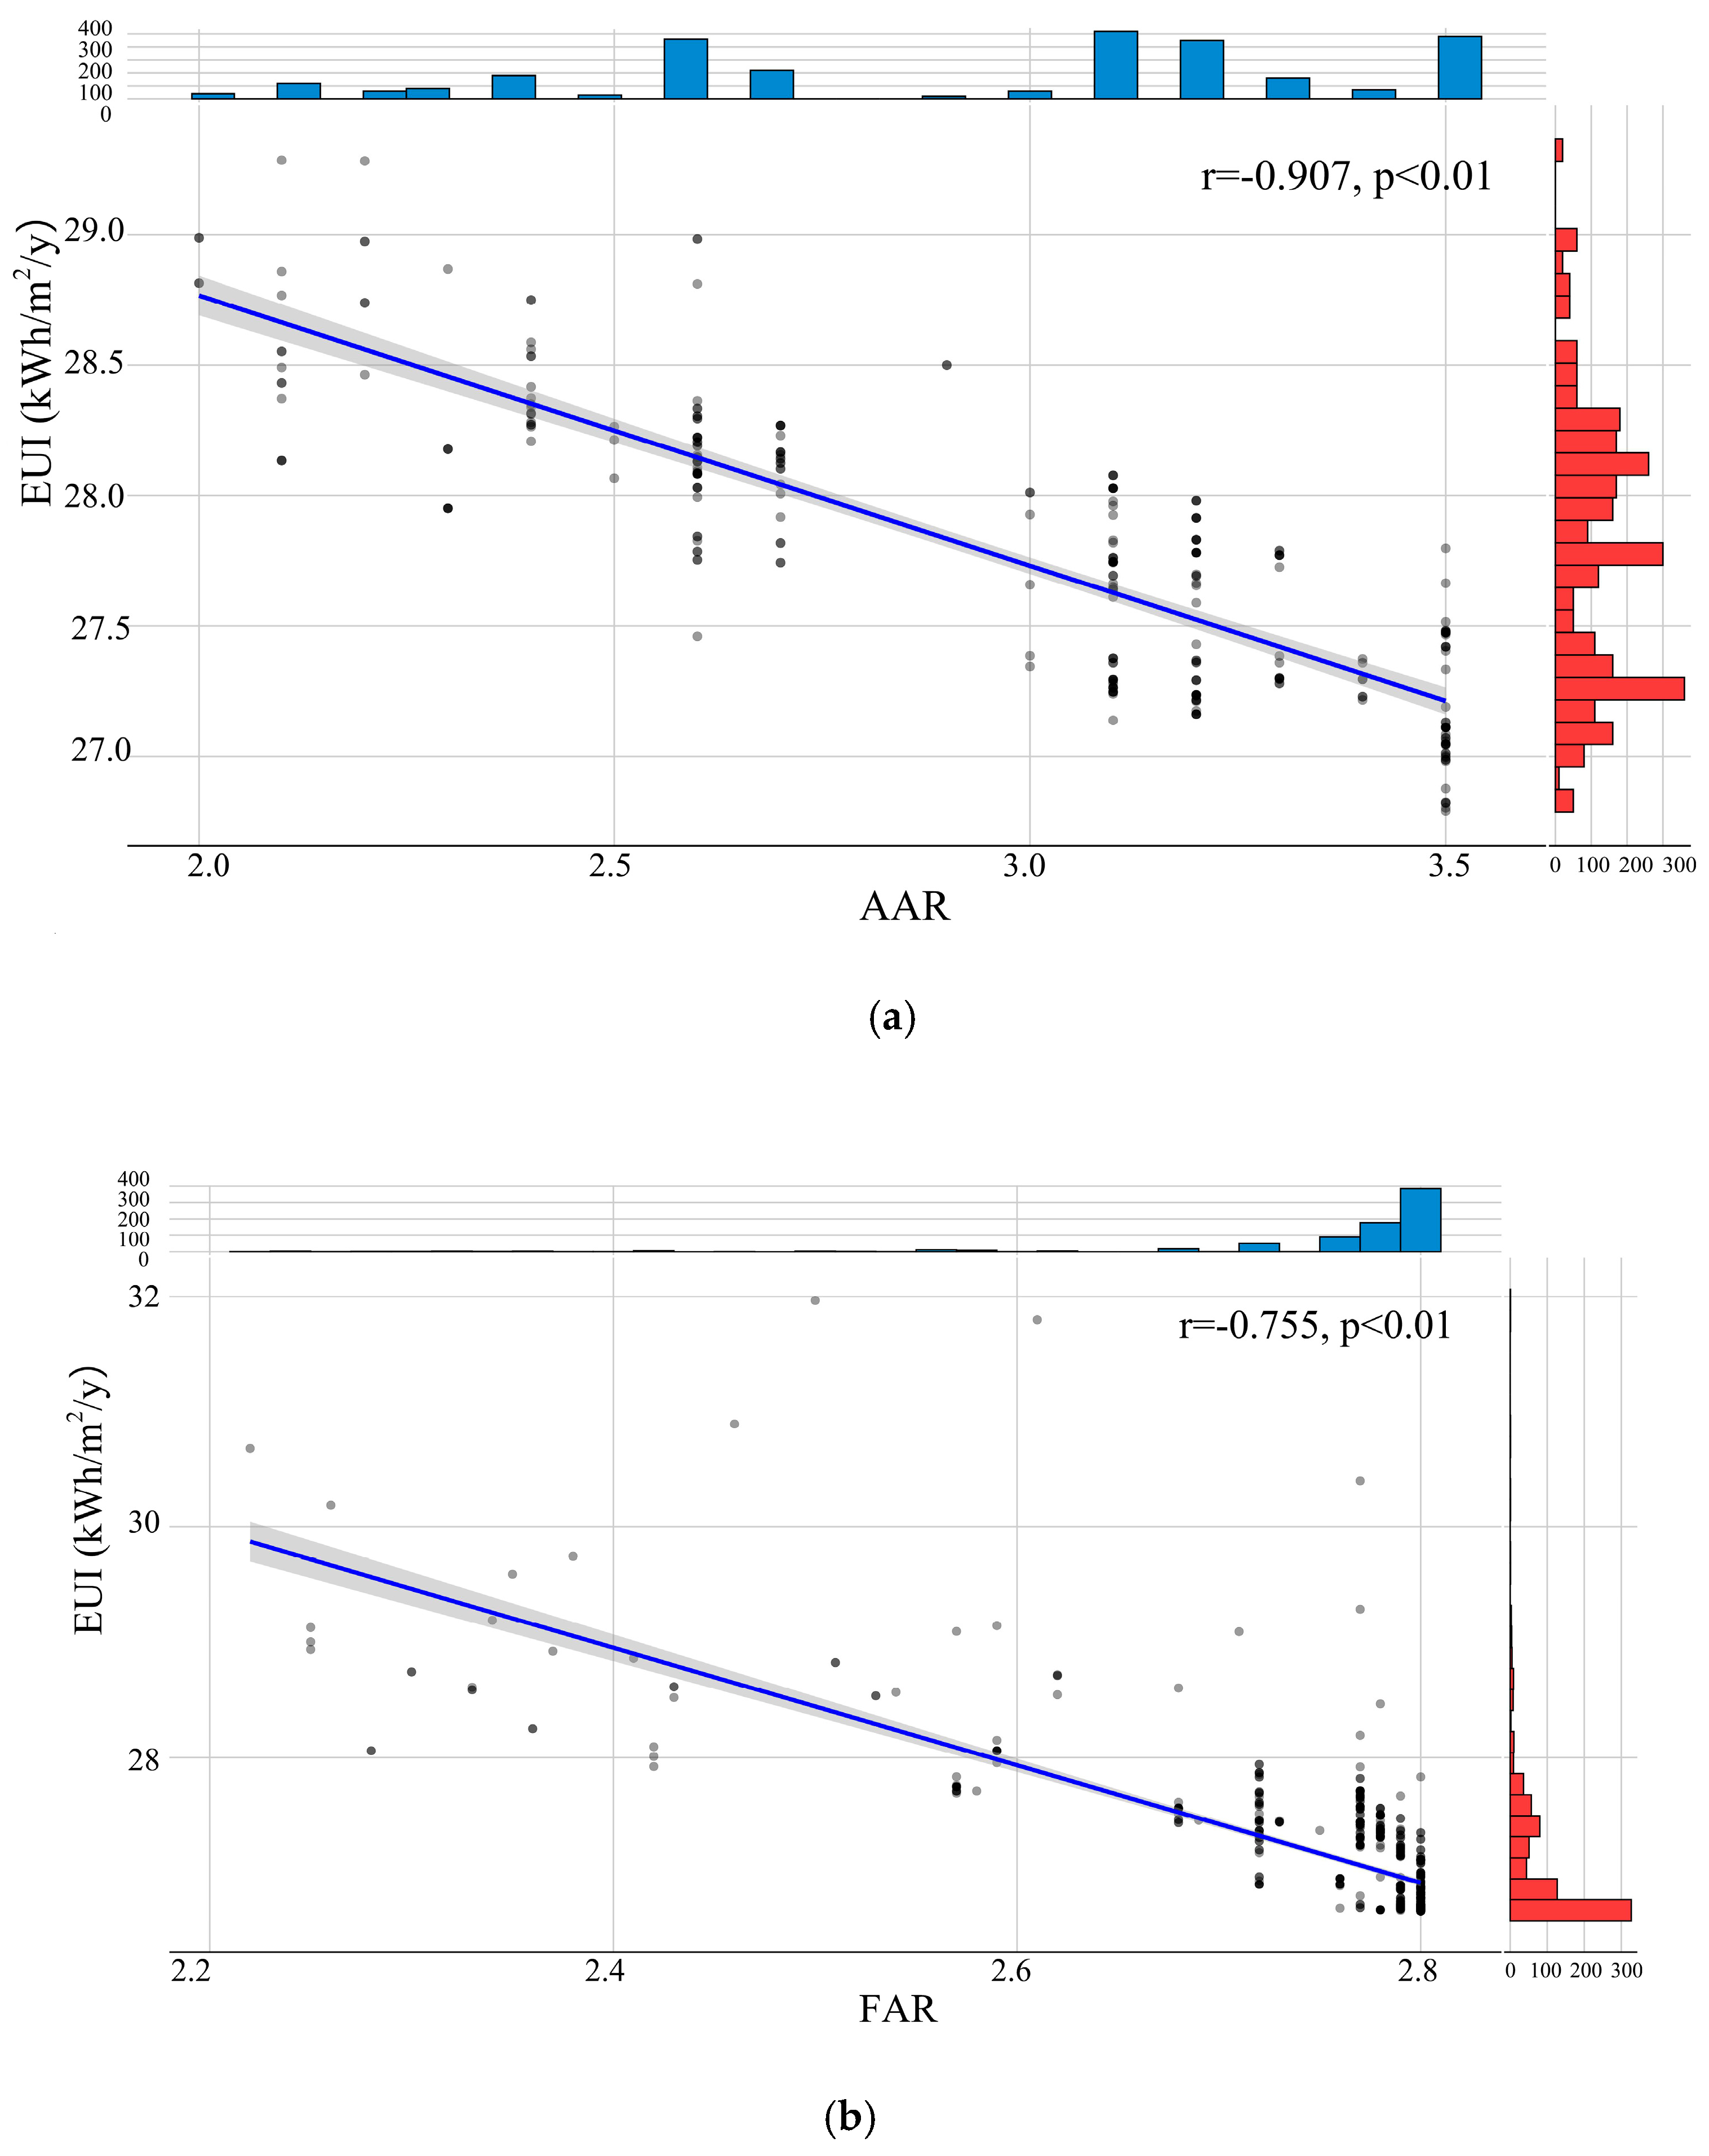
5.2. Correlation between the Morphology Parameters and Energy Use Intensity
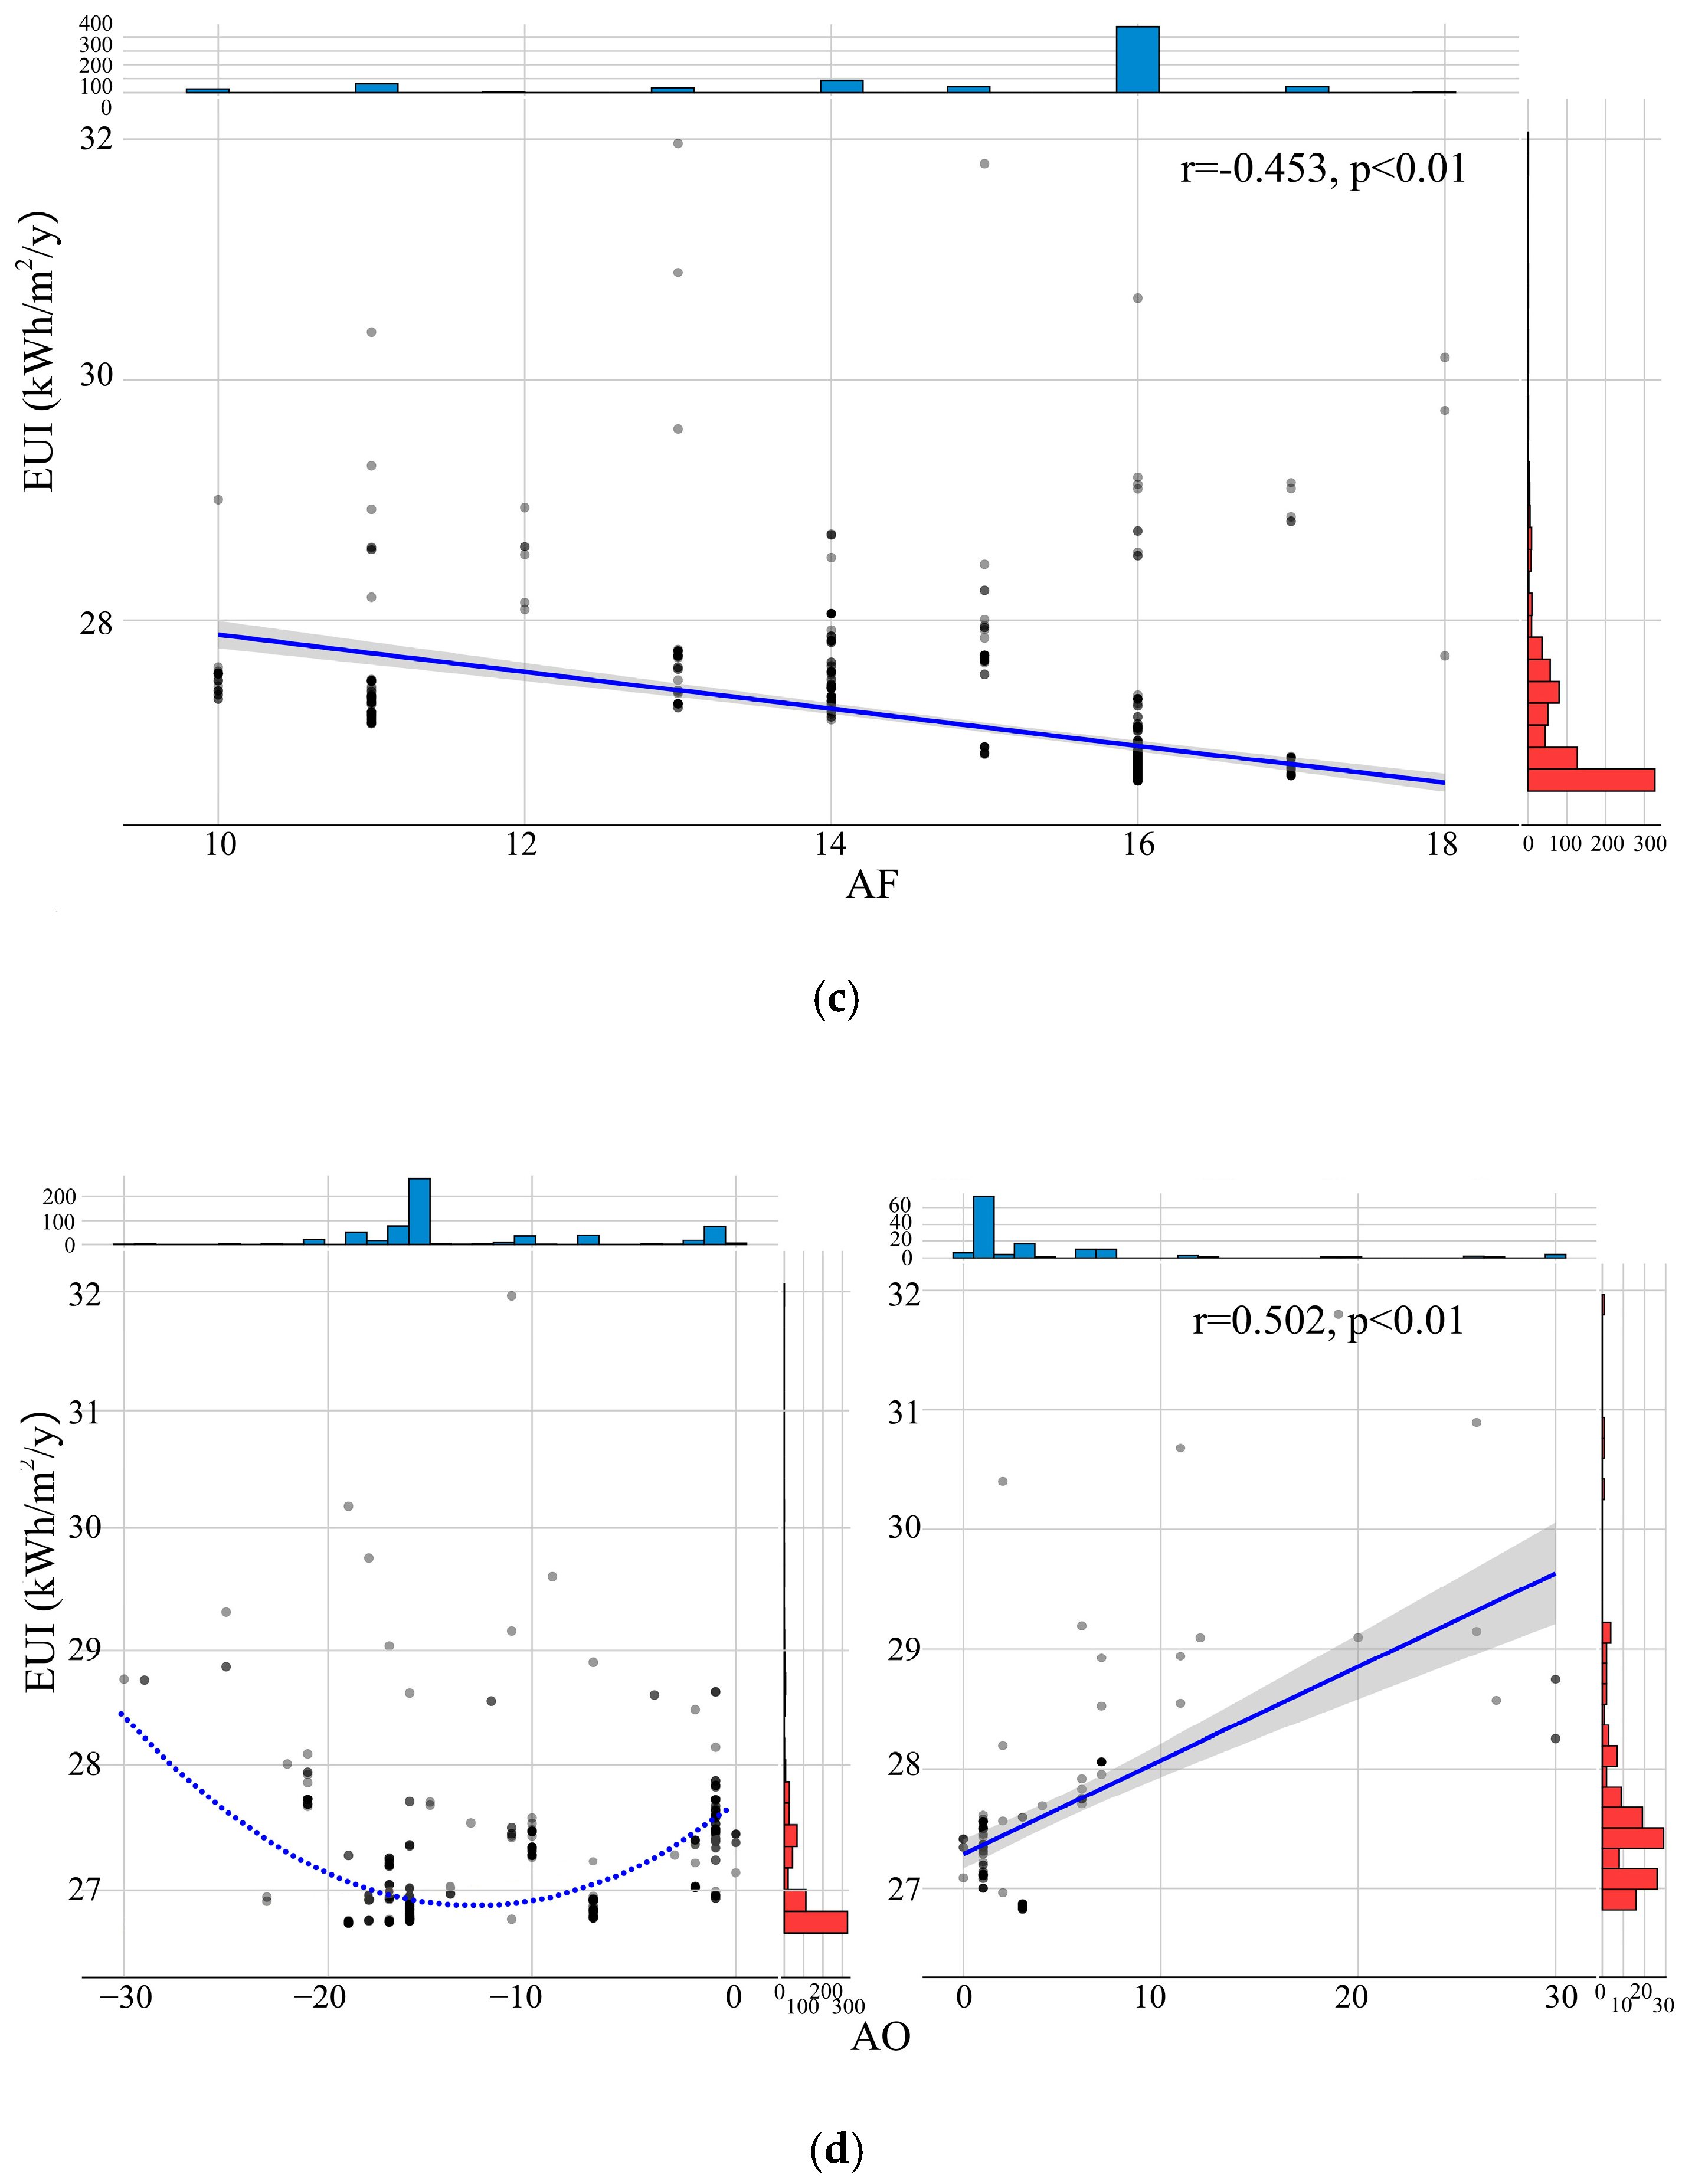
5.3. Regression between Urban Morphological Parameters and Energy Use Intensity
- (a)
- The high R2 value of 0.844 indicates that the morphology of residential clusters significantly influences energy use intensity in Hangzhou. Furthermore, the model accounts for 84.4% of the variation in EUI, leaving only 15.6% to be caused by other factors, such as the transparent envelope, materials of enclosure, occupant behavior, and so on.
- (b)
- AAR, FAR, and AF have a negative impact on the annual energy use intensity of residential clusters. Furthermore, when AO ranges from 0 to 30°, AO has a positive impact on EUI, but in the range of −30 to 0°, it has the lowest energy use intensity when AO is 15° southwest.
- (c)
- The magnitudes of the standardized coefficients indicate that among the four morphological parameters, AAR has the strongest influence on the annual energy use intensity of residential clusters (−0.719). Concordantly, FAR (−0.162), AF (−0.088), and AO (0.062) have a smaller impact on energy use intensity.
6. Discussion
7. Conclusions
Author Contributions
Funding
Data Availability Statement
Conflicts of Interest
References
- UN Environment Programme. Not yet Built for Purpose: Global Building Sector Emissions Still High and Rising. 2024. Available online: https://www.unep.org/news-and-stories/press-release/not-yet-built-purpose-global-building-sector-emissions-still-high (accessed on 1 July 2024).
- Efficiency Caobe. 2022 Series of Research Reports on Carbon Emissions from Urban and Rural Construction in China. 2022. Available online: https://www.cabee.org/site/content/24420.html (accessed on 1 July 2024).
- IEA. 2022. Available online: https://www.iea.org/reports/global-energy-review-co2-emissions-in-2021-2 (accessed on 1 July 2024).
- Arto, I.; Capellán-Pérez, I.; Lago, R.; Bueno, G.; Bermejo, R. The energy requirements of a developed world. Energy Sustain. Dev. 2016, 33, 1–13. [Google Scholar] [CrossRef]
- Srebric, J.; Heidarinejad, M.; Liu, J. Building neighborhood emerging properties and their impacts on multi-scale modeling of building energy and airflows. Build. Environ. 2015, 91, 246–262. [Google Scholar] [CrossRef]
- WUP. The World’s Cities in 2018. 2018. Available online: https://www.un.org/development/desa/pd/sites/www.un.org.development.desa.pd/files/files/documents/2020/Jan/un_2018_worldcities_databooklet.pdf (accessed on 1 July 2024).
- Javanroodi, K.; Nik, V.M.; Mahdavinejad, M. A novel design-based optimization framework for enhancing the energy efficiency of high-rise office buildings in urban areas. Sustain. Cities Soc. 2019, 49, 101597. [Google Scholar] [CrossRef]
- National Bureau of Statistics. 2020. Available online: https://data.stats.gov.cn/easyquery.htm?cn=C01&zb=A0305&sj=2021 (accessed on 1 July 2024).
- Gan, V.J.L.; Wong, H.K.; Tse, K.T.; Cheng, J.C.P.; Lo, I.M.C.; Chan, C.M. Simulation-based evolutionary optimization for energy-efficient layout plan design of high-rise residential buildings. J. Clean. Prod. 2019, 231, 1375–1388. [Google Scholar] [CrossRef]
- Zhao, H.S.; Ji, H.I. (Eds.) Multi-Target Optimization Design of Earthquake-Resistant Structure Taking Ductility and Cost into Account. In Proceedings of the International Conference on Structures and Building Materials, Guangzhou, China, 7–9 January 2011. [Google Scholar]
- Ishii, S.; Tabushi, S.; Aramaki, T.; Hanaki, K. Impact of future urban form on the potential to reduce greenhouse gas emissions from residential, commercial and public buildings in Utsunomiya, Japan. Energy Policy 2010, 38, 4888–4896. [Google Scholar] [CrossRef]
- Li, X.; Ying, Y.; Xu, X.; Wang, Y.; Hussain, S.A.; Hong, T.; Wang, W. Identifying key determinants for building energy analysis from urban building datasets. Build. Environ. 2020, 181, 107114. [Google Scholar] [CrossRef]
- Si, B.; Tian, Z.; Jin, X.; Zhou, X.; Tang, P.; Shi, X. Performance indices and evaluation of algorithms in building energy efficient design optimization. Energy 2016, 114, 100–112. [Google Scholar] [CrossRef]
- Su, B. Field study to compare and evaluate winter indoor thermal and health conditions of school buildings with different envelopes. Archit. Sci. Rev. 2016, 60, 40–48. [Google Scholar] [CrossRef]
- Su, B.; Milic, R.J.; McPherson, P.; Wu, L. Thermal Performance of School Buildings: Impacts beyond Thermal Comfort. Int. J. Environ. Res. Public Health 2022, 19, 5811. [Google Scholar] [CrossRef]
- Wu, S.J.; Yan, Z.F. (Eds.) Indoor Thermal Environment Simulation of Xi’an Residential Building in Summer. In Proceedings of the 1st International Conference on Energy and Environmental Protection (ICEEP 2012), Hohhot, China, 23–24 June 2012. [Google Scholar]
- Zhao, Z.D.; Houchati, M.; Beitelmal, A. (Eds.) An Energy Efficiency Assessment of the Thermal Comfort in an Office building. In Proceedings of the 9th International Conference on Sustainability and Energy in Buildings (SEB), Chania, Greece, 5–7 July 2017. [Google Scholar]
- Lin, Y.L.; Yuan, X.P.; Yang, W.; Chan, M.; Tian, L. Impact of outdoor particulate matter 2.5 pollution on natural ventilation energy saving potential in office buildings in China. J. Build. Eng. 2023, 76, 107425. [Google Scholar] [CrossRef]
- Zhang, J.; Xu, L.; Shabunko, V.; Tay, S.E.R.; Sun, H.; Lau, S.S.Y.; Reindl, T. Impact of urban block typology on building solar potential and energy use efficiency in tropical high-density city. Appl. Energy 2019, 240, 513–533. [Google Scholar] [CrossRef]
- Javanroodi, K.; Mahdavinejad, M.; Nik, V.M. Impacts of urban morphology on reducing cooling load and increasing ventilation potential in hot-arid climate. Appl. Energy 2018, 231, 714–746. [Google Scholar] [CrossRef]
- Strømann-Andersen, J.; Sattrup, P.A. The urban canyon and building energy use: Urban density versus daylight and passive solar gains. Energy Build. 2011, 43, 2011–2020. [Google Scholar] [CrossRef]
- Allen-Dumas, M.R.; Rose, A.N.; New, J.R.; Omitaomu, O.A.; Yuan, J.; Branstetter, M.L.; Sylvester, L.M.; Seals, M.B.; Carvalhaes, T.M.; Adams, M.B.; et al. Impacts of the morphology of new neighborhoods on microclimate and building energy. Renew. Sustain. Energy Rev. 2020, 133, 110030. [Google Scholar] [CrossRef]
- Ellefsen, R. Mapping and measuring buildings in the canopy boundary layer in ten U. S. cities. Energy Build. 1991, 16, 1025–1049. [Google Scholar] [CrossRef]
- Hong, Y.; Ezeh, C.I.; Deng, W.; Hong, S.H.; Peng, Z.; Tang, Y. Correlation between building characteristics and associated energy consumption: Prototyping low-rise office buildings in Shanghai. Energy Build. 2020, 217, 109959. [Google Scholar] [CrossRef]
- Ye, Y.; Hinkelman, K.; Zhang, J.; Zuo, W.; Wang, G. A methodology to create prototypical building energy models for existing buildings: A case study on U.S. religious worship buildings. Energy Build. 2019, 194, 351–365. [Google Scholar] [CrossRef]
- Premrov, M.; Žegarac Leskovar, V.; Mihalič, K. Influence of the building shape on the energy performance of timber-glass buildings in different climatic conditions. Energy 2016, 108, 201–211. [Google Scholar] [CrossRef]
- Li, X.; Yao, R.; Liu, M.; Costanzo, V.; Yu, W.; Wang, W.; Short, A.; Li, B. Developing urban residential reference buildings using clustering analysis of satellite images. Energy Build. 2018, 169, 417–429. [Google Scholar] [CrossRef]
- Schaefer, A.; Ghisi, E. Method for obtaining reference buildings. Energy Build. 2016, 128, 660–672. [Google Scholar] [CrossRef]
- Bhatnagar, M.; Mathur, J.; Garg, V. Development of reference building models for India. J. Build. Eng. 2019, 21, 267–277. [Google Scholar] [CrossRef]
- Samuelson, H.; Claussnitzer, S.; Goyal, A.; Chen, Y.; Romo-Castillo, A. Parametric energy simulation in early design: High-rise residential buildings in urban contexts. Build. Environ. 2016, 101, 19–31. [Google Scholar] [CrossRef]
- Li, Y.; Wang, D.; Li, S.; Gao, W. Impact Analysis of Urban Morphology on Residential District Heat Energy Demand and Microclimate Based on Field Measurement Data. Sustainability 2021, 13, 2070. [Google Scholar] [CrossRef]
- Mangan, S.D.; Koclar Oral, G.; Erdemir Kocagil, I.; Sozen, I. The impact of urban form on building energy and cost efficiency in temperate-humid zones. J. Build. Eng. 2021, 33, 101626. [Google Scholar] [CrossRef]
- Pont, M.Y.B.; Haupt, P. Space, Density and Urban Form. Ph.D. Thesis, Delft University of Technology, Delft, The Netherlands, 2009. [Google Scholar]
- Liu, K.; Xu, X.; Zhang, R.; Kong, L.; Wang, W.; Deng, W. Impact of urban form on building energy consumption and solar energy potential: A case study of residential blocks in Jianhu, China. Energy Build. 2023, 280, 112727. [Google Scholar] [CrossRef]
- Oh, M.; Kim, Y. Identifying urban geometric types as energy performance patterns. Energy Sustain. Dev. 2019, 48, 115–129. [Google Scholar] [CrossRef]
- Mechri, H.E.; Capozzoli, A.; Corrado, V. USE of the ANOVA approach for sensitive building energy design. Appl. Energy 2010, 87, 3073–3083. [Google Scholar] [CrossRef]
- Albatici, R.; Passerini, F. Bioclimatic design of buildings considering heating requirements in Italian climatic conditions. A simplified approach. Build. Environ. 2011, 46, 1624–1631. [Google Scholar] [CrossRef]
- Leng, H.; Chen, X.; Ma, Y.; Wong, N.H.; Ming, T. Urban morphology and building heating energy consumption: Evidence from Harbin, a severe cold region city. Energy Build. 2020, 224, 110143. [Google Scholar] [CrossRef]
- Taleghani, M.; Tenpierik, M.; van den Dobbelsteen, A.; de Dear, R. Energy use impact of and thermal comfort in different urban block types in the Netherlands. Energy Build. 2013, 67, 166–175. [Google Scholar] [CrossRef]
- Valladares-Rendón, L.G.; Schmid, G.; Lo, S.-L. Review on energy savings by solar control techniques and optimal building orientation for the strategic placement of façade shading systems. Energy Build. 2017, 140, 458–479. [Google Scholar] [CrossRef]
- China Association of Building Energy Efficiency. China Building Energy Consumption Research Report (2020). 2020. Available online: https://www.cabee.org/site/content/24021.html (accessed on 1 July 2024).
- Freitas, J.d.S.; Cronemberger, J.; Soares, R.M.; Amorim, C.N.D. Modeling and assessing BIPV envelopes using parametric Rhinoceros plugins Grasshopper and Ladybug. Renew. Energy 2020, 160, 1468–1479. [Google Scholar] [CrossRef]
- Roudsari, M.S.; Pak, M. (Eds.) Ladybug: A parametric environmental plugin for grasshopper to help designers create an environmentally-conscious design. In Proceedings of the 13th International Conference of the International-Building-Performance-Simulation-Association (IBPSA), Chambery, France, 25–28 August 2013. [Google Scholar]
- Konis, K.; Gamas, A.; Kensek, K. Passive performance and building form: An optimization framework for early-stage design support. Sol. Energy 2016, 125, 161–179. [Google Scholar] [CrossRef]
- Holland, J.H. Adaptation in Natural And Artificial Systems; University of Michigan Press: Ann Arbor, MI, USA, 1975. [Google Scholar]
- Goldberg, D.E. Optimization, and Machine Learning; Addison-Wesley: Reading, MA, USA, 1989. [Google Scholar]
- Charron, R. Development of a Genetic Algorithm Optimisation Tool for the Early Stage Design of Low and Net-Zero Energy Solar Homes. Ph.D. Thesis, Concordia University, Montreal, QC, Canada, 2007. [Google Scholar]
- GB50180-2018; Standard for Urban Residential Area Planning and Design. Ministry of Housing and Urban-Rural Development of China: Beijing, China, 2018.
- Xia, B.; Li, Z. Optimized methods for morphological design of mesoscale cities based on performance analysis: Taking the residential urban blocks as examples. Sustain. Cities Soc. 2021, 64, 102489. [Google Scholar] [CrossRef]
- DB33/1015-2021; Design Standard for Energy Efficiency of Residen. Zhejiang Provincial Department of Housing and Urban-Rural Development: Hangzhou, China, 2021.
- Ruiz, G.; Bandera, C. Validation of Calibrated Energy Models: Common Errors. Energies 2017, 10, 1587. [Google Scholar] [CrossRef]
- Yan, J.; Zhang, H.; Liu, X.; Ning, L.; Hien, W.N. The Impact of Residential Cluster Layout on Building Energy Consumption and Carbon Emissions in Regions with Hot Summers and Cold Winters in China. Sustainability 2023, 15, 11915. [Google Scholar] [CrossRef]
- Evins, R. A review of computational optimisation methods applied to sustainable building design. Renew. Sustain. Energy Rev. 2013, 22, 230–245. [Google Scholar] [CrossRef]
- Xu, S.; Li, G.; Zhang, H.; Xie, M.; Mendis, T.; Du, H. Effect of Block Morphology on Building Energy Consumption of Office Blocks: A Case of Wuhan, China. Buildings 2023, 13, 768. [Google Scholar] [CrossRef]
- Wang, M.; Yu, H.; Yang, Y.; Jing, R.; Tang, Y.; Li, C. Assessing the impacts of urban morphology factors on the energy performance for building stocks based on a novel automatic generation framework. Sustain. Cities Soc. 2022, 87, 104267. [Google Scholar] [CrossRef]
- Perini, K.; Magliocco, A. Effects of vegetation, urban density, building height, and atmospheric conditions on local temperatures and thermal comfort. Urban For. Urban Green. 2014, 13, 495–506. [Google Scholar] [CrossRef]
- Skarbit, N.; Stewart, I.D.; Unger, J.; Gál, T. Employing an urban meteorological network to monitor air temperature conditions in the ‘local climate zones’ of Szeged, Hungary. Int. J. Climatol. 2017, 37 (Suppl. S1), 582–596. [Google Scholar] [CrossRef]
- Krishnan, A.; Baker, N.; Yannas, S.; Szokolay, S.V. Climate Responsive Architecture: A Design Handbook for Energy Efficient Buildings; Tata McGraw-Hill Publishing Co. Ltd.: New Delhi, India, 2001. [Google Scholar]
- Natanian, J.; Auer, T. (Eds.) Balancing urban density, energy performance and environmental quality in the Mediterranean: A typological evaluation based on photovoltaic potential. In Proceedings of the Applied Energy Symposium and Forum—Low-Carbon Cities and Urban Energy Systems (CUE), Shanghai, China, 5–7 June 2018. [Google Scholar]
- Vartholomaios, A. A parametric sensitivity analysis of the influence of urban form on domestic energy consumption for heating and cooling in a Mediterranean city. Sustain. Cities Soc. 2017, 28, 135–145. [Google Scholar] [CrossRef]
- Trepci, E.; Maghelal, P.; Azar, E. Urban built context as a passive cooling strategy for buildings in hot climate. Energy Build. 2021, 231, 110606. [Google Scholar] [CrossRef]
- Coutts, A.; Beringer, J.; Tapper, N. Changing Urban Climate and CO2 Emissions: Implications for the Development of Policies for Sustainable Cities. Urban Policy Res. 2010, 28, 27–47. [Google Scholar] [CrossRef]


| Theme | Location | Parameters | References |
|---|---|---|---|
| Establish prototypical buildings using performance index system | Shanghai | Construction year Average orientation Number of floors Window:wall ratio (WWR) Plan form | Hong et al. [24] |
| Influence of the building shape on the energy performance of timber buildings | Athens and Seville | Building geometry Shape factor Glazing-to-wall area ratio on south façade | Premrov et al. [26] |
| Developing typical residential reference buildings at district level for bottom-up energy modeling purposes | Chongqing | Aspect ratio Building height Compactness ratio | Li et al. [27] |
| Build a database on geometrical features of houses | Southern Brazil | Dimensions of the façade Floor plan shape Area | Schaefer et al. [28] |
| Reference building models of office buildings and application of these models by evaluating the energy performance | India | Area Aspect ratio Number of floors | Bhatnagar et al. [29] |
| Identifying synergies and trade-offs when designing for different energy objectives of high-rise residential buildings | Beijing, New York, and Shenzhen | WWR Glass type Building orientation Building shape | Samuelson et al. [30] |
| Investigating the relationship between urban morphology parameters and residential building space heating energy performance | Qingdao | Average building height Floor area ratio Building cover ratio | Li et al. [31] |
| Impact of urban form on building energy and cost efficiency | Istanbul | Height Height-to-width ratio Orientation Typology Plan type Number of floors | Mangan et al. [32] |
| Classification | Core Parameters | Calculation Formula |
|---|---|---|
| Site plan | Floor Area Ratio (FAR) | |
| Building Density (BD) | ||
| Geometry | Average Number of Floors (AF) | |
| Average Depth (AD) | ||
| Average Orientation (AO) | ||
| Average Aspect Ratio (AAR) | ||
| Type | Building Shape (BS) | - |
| Building Layout (BL) | - |
| Shapes | Number | Proportion (%) |
|---|---|---|
| Slab type | 66 | 68.75 |
| Point type | 30 | 31.25 |
| Layout | Number | Proportion (%) |
|---|---|---|
| Parallel | 52 | 54.17 |
| Staggered | 26 | 27.08 |
| Courtyard | 6 | 6.53 |
| Other | 12 | 12.5 |
| No. | EUI (kWh/m2/y) | EUIheating (kWh/m2/y) | EUIcooling (kWh/m2/y) | FAR | BD (%) | BS | BL | AD | AF | AO | AAR |
|---|---|---|---|---|---|---|---|---|---|---|---|
| R1 | 32.82 | 3.49 | 15.20 | 2.00 | 22 | 1.00 | 4.00 | 17.28 | 18.00 | −22.52 | 4.00 |
| R2 | 28.72 | 2.72 | 13.44 | 2.15 | 32 | 1.00 | 3.00 | 18.29 | 7.00 | 3.55 | 3.80 |
| R3 | 23.74 | 1.62 | 12.89 | 2.15 | 31 | 1.00 | 1.00 | 26.64 | 8.00 | −17.42 | 4.00 |
| R4 | 29.71 | 4.71 | 14.87 | 2.15 | 31 | 2.00 | 3.00 | 21.93 | 18.00 | 0.00 | 1.00 |
| R5 | 32.01 | 4.69 | 15.25 | 2.15 | 31 | 1.00 | 1.00 | 11.35 | 10.00 | −12.69 | 3.80 |
| R6 | 36.16 | 5.26 | 15.08 | 2.15 | 31 | 1.00 | 1.00 | 16.29 | 8.00 | −19.72 | 3.50 |
| R7 | 38.33 | 5.60 | 15.09 | 2.15 | 31 | 1.00 | 1.00 | 11.17 | 8.50 | −16.31 | 3.60 |
| R8 | 29.50 | 4.45 | 14.88 | 2.15 | 31 | 1.00 | 1.00 | 16.93 | 8.40 | −20.70 | 3.00 |
| R9 | 33.62 | 6.95 | 17.40 | 1.24 | 22 | 1.00 | 1.00 | 20.75 | 6.00 | 0.00 | 4.00 |
| R10 | 34.37 | 5.40 | 15.00 | 1.24 | 22 | 1.00 | 1.00 | 20.75 | 6.00 | 23.10 | 4.00 |
| R11 | 30.37 | 3.21 | 12.39 | 2.71 | 22 | 3.00 | 3.00 | 33.02 | 19.00 | −13.94 | 1.20 |
| R12 | 22.35 | 1.91 | 13.11 | 2.60 | 19 | 1.00 | 1.00 | 14.05 | 13.00 | 13.35 | 2.40 |
| R13 | 45.91 | 2.47 | 12.83 | 2.20 | 19 | 3.00 | 1.00 | 13.95 | 14.00 | 20.00 | 3.00 |
| R14 | 23.83 | 3.60 | 17.28 | 2.71 | 22 | 3.00 | 2.00 | 14.23 | 20.00 | −25.76 | 1.10 |
| R15 | 31.16 | 3.79 | 22.35 | 2.10 | 25 | 1.00 | 1.00 | 16.00 | 13.00 | −19.79 | 3.60 |
| R16 | 30.76 | 2.58 | 16.15 | 2.59 | 18 | 1.00 | 1.00 | 16.09 | 12.00 | 16.96 | 2.60 |
| Classification Indicator | Total EUI | EUIheating | EUIcooling | |||
|---|---|---|---|---|---|---|
| Pearson Correlation | f-Value (2-Tailed Sig.) | Pearson Correlation | f-Value (2-Tailed Sig.) | Pearson Correlation | f-Value (2-Tailed Sig.) | |
| Floor area ratio (FAR) | −0.359 | 0.172 | −0.654 | 0.006 | −0.209 | 0.438 |
| Building density (BD) | −0.080 | 0.767 | 0.254 | 0.342 | −0.071 | 0.793 |
| Average number of floors (AF) | −0.176 | 0.514 | −0.345 | 0.190 | 0.019 | 0.945 |
| Average depth (AD) | −0.255 | 0.341 | −0.133 | 0.625 | −0.310 | 0.243 |
| Average orientation (AO) | 0.249 | 0.353 | −0.146 | 0.589 | −0.289 | 0.277 |
| Average aspect ratio (AAR) | 0.306 | 0.250 | 0.212 | 0.432 | 0.130 | 0.630 |
| Building Shape (BS) | 0.136 | 0.615 | −0.449 | 0.405 | −0.221 | 0.410 |
| Building Layout (BL) | −0.164 | 0.544 | −0.970 | 0.550 | −0.208 | 0.440 |
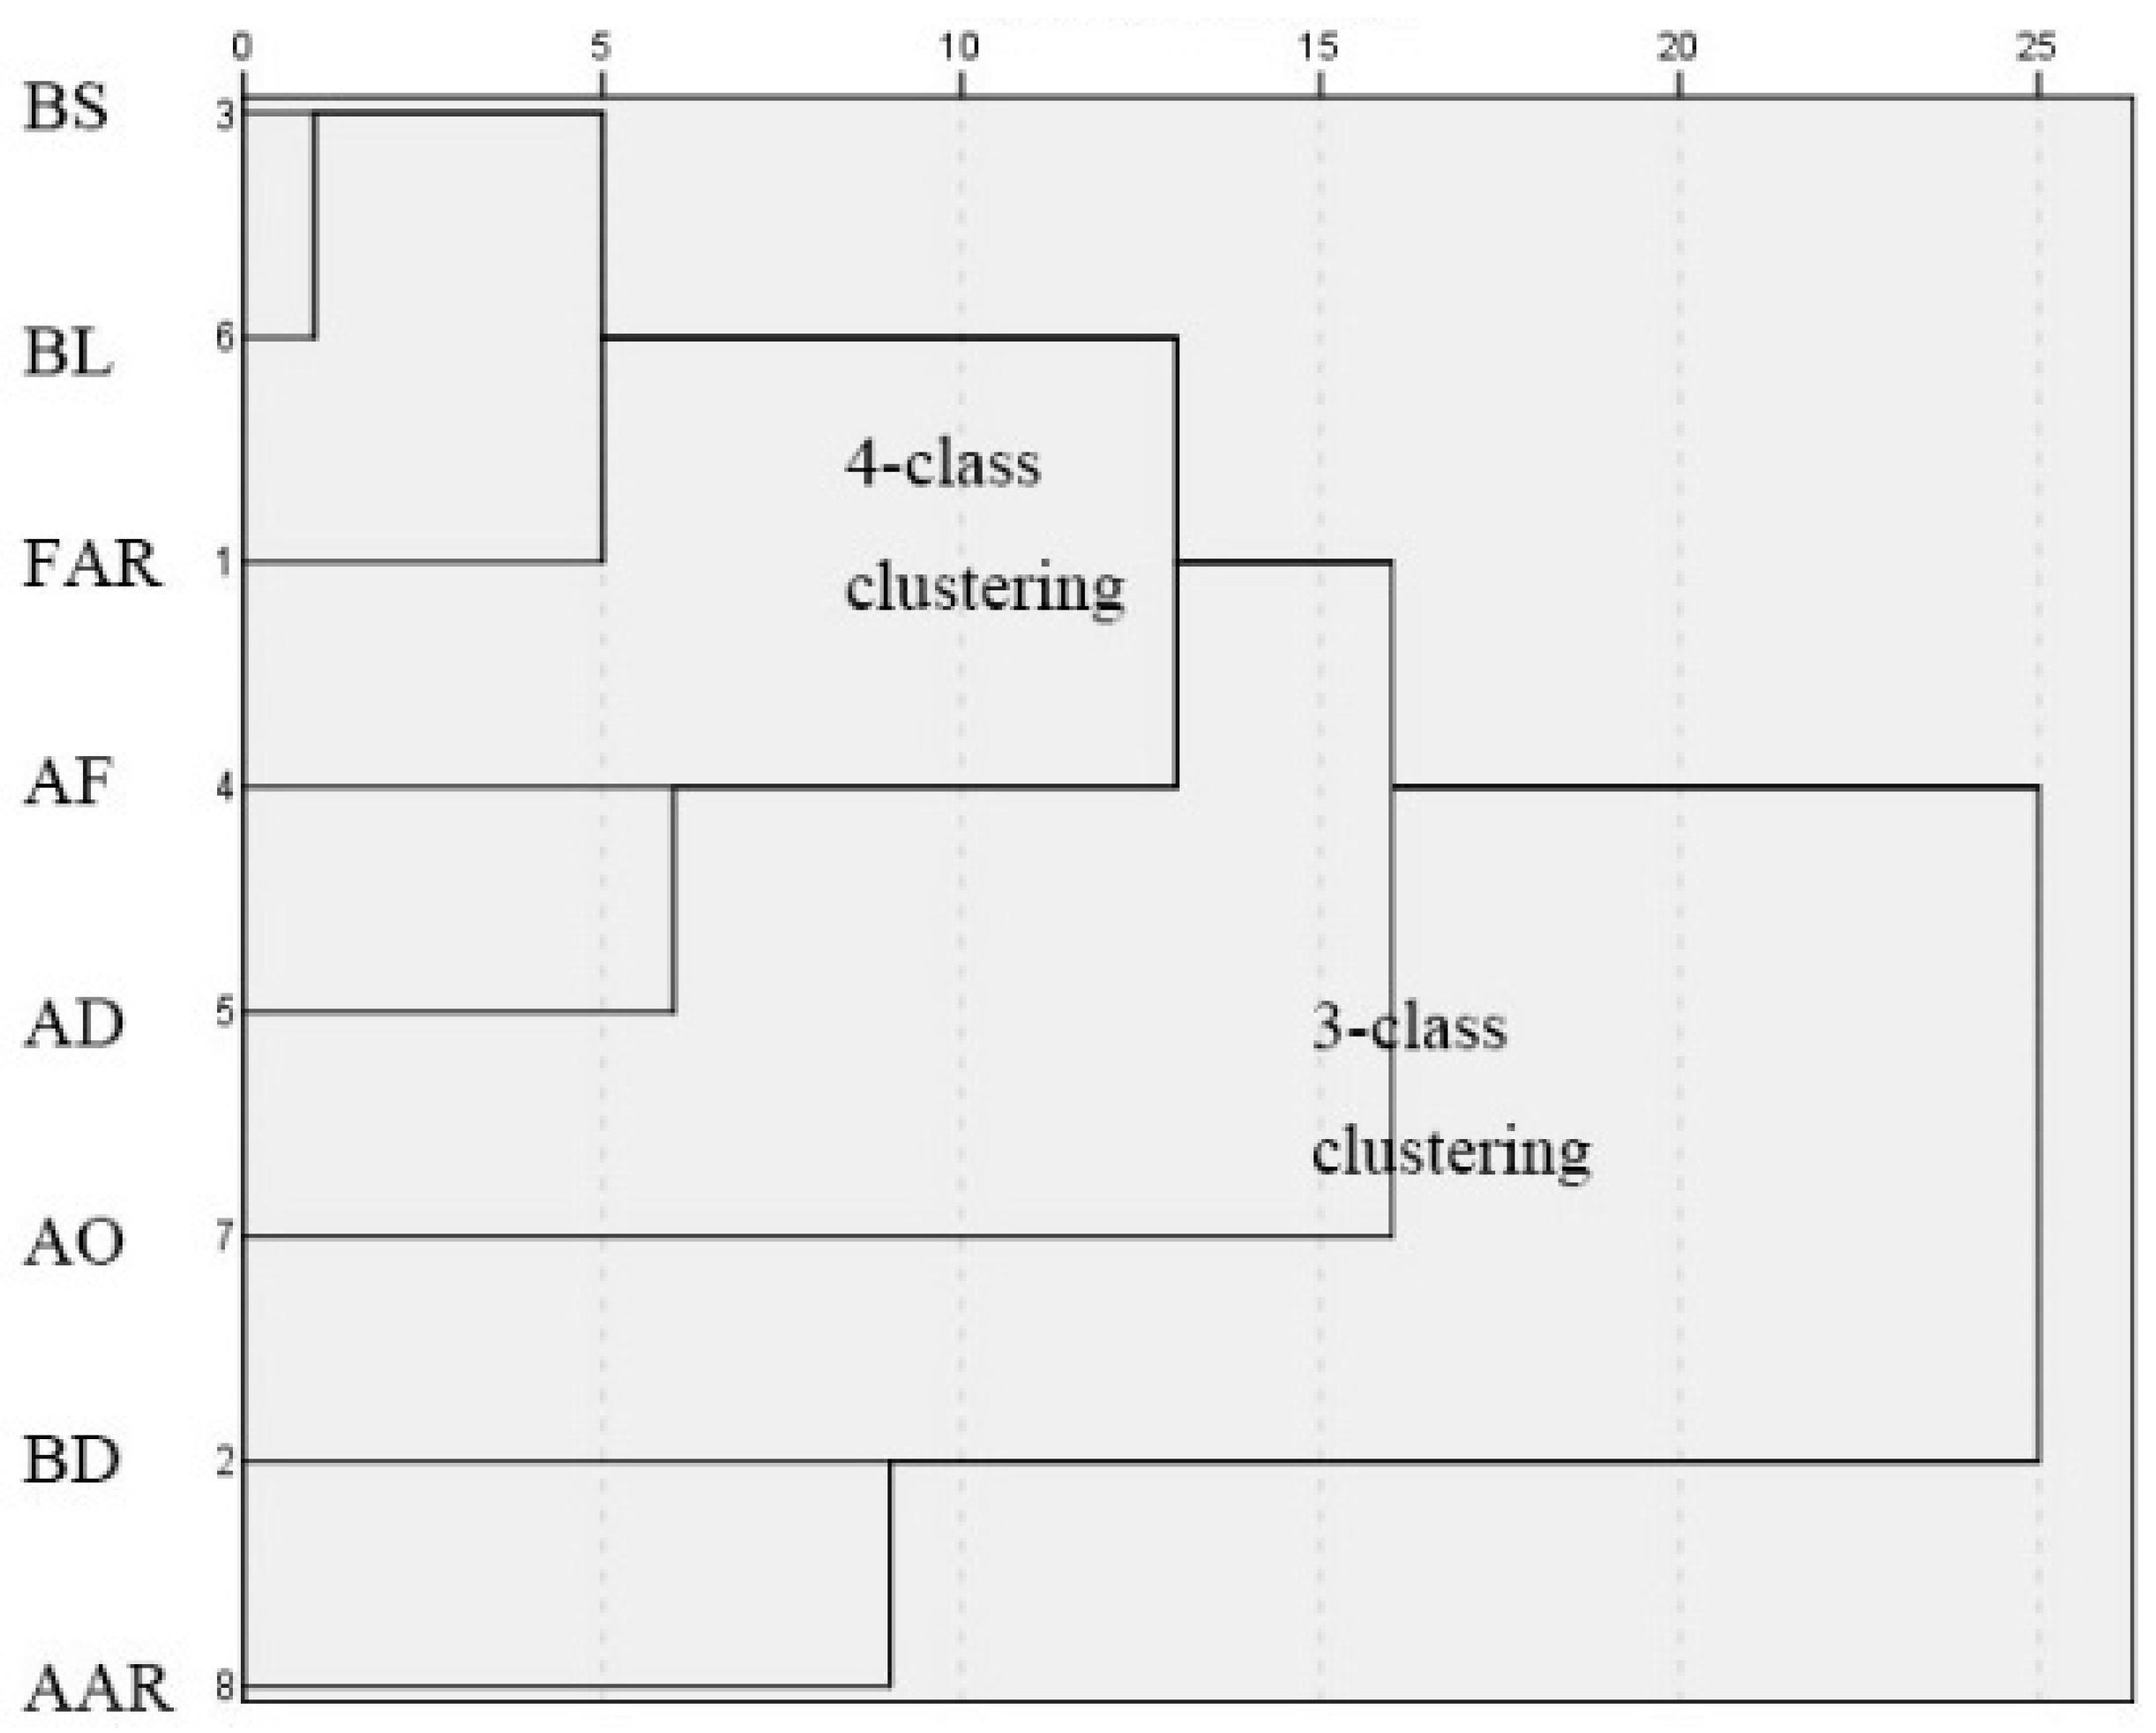
| Classification Indicator | 4-Class Clustering | 3-Class Clustering |
|---|---|---|
| FAR | 1 | 1 |
| BD | 2 | 2 |
| BS | 1 | 1 |
| BL | 3 | 1 |
| AD | 3 | 1 |
| AF | 1 | 1 |
| AO | 4 | 3 |
| AAR | 2 | 2 |
| Type | FAR | Average Number of Floors | Building Density | Green Area Ratio | Height |
|---|---|---|---|---|---|
| High-rise Class I | 2.2–2.8 | 10–18 | ≤22% | ≥35% | ≤54 |
| Factors | Range | Step |
|---|---|---|
| AF | [10, 18] | 1 |
| FAR | [2.20, 2.80] | 0.01 |
| AAR | [2.0, 3.5] | 0.1 |
| AD | [10, 25] | 1 |
| AO (°) | [−30, 30] | 1 |
| Parameters | Setting | |
|---|---|---|
| Weather data | Typical meteorological year of Hangzhou in EPW files | |
| Simulation period | From 1 January to 31 December | |
| Constructions | Wall | U value = 0.8 W/(m2·K) |
| Roof | U value = 0.25 W/(m2·K) | |
| Floor | U value = 1.2 W/(m2·K) | |
| Window | U value = 1.8 W/(m2·K), SHGC = 0.4 | |
| Internal loads | People | Occupant density:0.05 people/m2 |
| Lighting | 5 W/m2 | |
| HVAC System | Heating/cooling season and setpoints | Heating: 15 December to 20 February, 18 °C Cooling: 15 June to 15 September, 26 °C |
| Infiltration | 1 ACH |
| Benchmark Clusters | Optimization Clusters | Energy Reduction | Efficiency Ratio (%) | |
|---|---|---|---|---|
| Total EUI (kWh/m2/y) | 28.96 | 26.72 | 2.24 | 7.73 |
| EUIcooling (kWh/m2/y) | 17.43 | 15.72 | 1.71 | 9.81 |
| EUIheating (kWh/m2/y) | 2.21 | 1.32 | 0.89 | 40.27 |
| EUIlighting (kWh/m2/y) | 9.32 | 9.68 | −0.36 | −3.86 |
| Dependent Variables | R Square (R2) | Sig. | Standardized Coefficients | |||
|---|---|---|---|---|---|---|
| FAR | AF | AO | AAR | |||
| EUI | 0.844 | 0.000 | −0.162 | −0.088 | 0.062 | −0.719 |
| No. | Measured EUI (kWh/m2/y) | Predicted EUI (kWh/m2/y) | FAR | AF | AO | AAR |
|---|---|---|---|---|---|---|
| 1 | 32.82 | 27.22 | 2.00 | 18.00 | −22.52 | 4.00 |
| 2 | 28.72 | 27.65 | 2.15 | 7.0 | 3.55 | 3.8 |
| 3 | 23.74 | 27.38 | 2.15 | 8.0 | −17.42 | 4.0 |
| 4 | 32.01 | 27.50 | 2.15 | 10.0 | −12.69 | 3.8 |
| 5 | 36.16 | 27.78 | 2.15 | 8.0 | −19.72 | 3.5 |
| 6 | 38.33 | 27.70 | 2.15 | 8.5 | −16.31 | 3.6 |
| 7 | 29.50 | 28.16 | 2.15 | 8.4 | −20.70 | 3.0 |
| 8 | 33.62 | 28.50 | 1.24 | 6.0 | 0.00 | 4.0 |
| 9 | 34.37 | 28.60 | 1.24 | 6.0 | 23.10 | 4.0 |
| 10 | 22.35 | 28.15 | 2.60 | 13.0 | 13.35 | 2.4 |
| 11 | 31.16 | 27.60 | 2.10 | 13.0 | −19.79 | 3.6 |
| 12 | 30.76 | 28.04 | 2.59 | 12.0 | 16.96 | 2.6 |
Disclaimer/Publisher’s Note: The statements, opinions and data contained in all publications are solely those of the individual author(s) and contributor(s) and not of MDPI and/or the editor(s). MDPI and/or the editor(s) disclaim responsibility for any injury to people or property resulting from any ideas, methods, instructions or products referred to in the content. |
© 2024 by the authors. Licensee MDPI, Basel, Switzerland. This article is an open access article distributed under the terms and conditions of the Creative Commons Attribution (CC BY) license (https://creativecommons.org/licenses/by/4.0/).
Share and Cite
Feng, W.; Chen, J.; Yang, Y.; Gao, W.; Zhao, Q.; Xing, H.; Yu, S. The Impact of Building Morphology on Energy Use Intensity of High-Rise Residential Clusters: A Case Study of Hangzhou, China. Buildings 2024, 14, 2245. https://doi.org/10.3390/buildings14072245
Feng W, Chen J, Yang Y, Gao W, Zhao Q, Xing H, Yu S. The Impact of Building Morphology on Energy Use Intensity of High-Rise Residential Clusters: A Case Study of Hangzhou, China. Buildings. 2024; 14(7):2245. https://doi.org/10.3390/buildings14072245
Chicago/Turabian StyleFeng, Weijia, Jintao Chen, Yi Yang, Weijun Gao, Qinfeng Zhao, Haowei Xing, and Shuai Yu. 2024. "The Impact of Building Morphology on Energy Use Intensity of High-Rise Residential Clusters: A Case Study of Hangzhou, China" Buildings 14, no. 7: 2245. https://doi.org/10.3390/buildings14072245