Abstract
The reinforced part at the bottom of high-rise assembled monolithic concrete shear wall structures generally uses cast-in-place concrete due to high elastic–plastic deformation capacity requirements, which limits the advantages of prefabricated shear wall structures. This study investigates the feasibility of using cluster connections to assemble integral shear wall structures at the bottom by modifying the vertical reinforcement of the cluster connection. Numerical simulations using ABAQUS (Version 2019) were validated with laboratory test results. The seismic performance of prefabricated shear walls with cluster connections was examined under varying axial compression ratios. Results indicate that the prefabricated shear wall demonstrates higher bearing and deformation capacity compared to cast-in-place shear walls. The degradation of strength and equivalent stiffness in prefabricated walls is slower, showing better seismic performance under higher axial compression ratios. The cluster connection ensures effective force transmission, maintaining wall integrity. After optimization, the prefabricated shear wall with cluster connection meets the expected seismic performance, providing a basis for its application in reinforced bottom sections.
1. Introduction
Being produced through an industrial assembly line, prefabricated structures demand less labor and are more environmentally friendly. Prefabrication offers several advantages, including reduced construction time, improved quality control, and decreased environmental impact due to less waste generation and lower energy consumption. In China, prefabricated integral shear wall structures have been widely used in high-rise prefabricated residences to leverage these benefits [1,2,3,4]. However, the construction process of prefabricated shear wall structures still involves considerable wet work, particularly in the reinforced parts at the bottom of the shear wall structure, which are typically cast-in-place. This reliance on cast-in-place techniques diminishes some of the advantages of prefabrication, such as speed and reduced labor requirements, thereby limiting the full potential of prefabricated shear wall structures [5].
In addition to the construction efficiency, the economic benefits of prefabricated shear wall structures are significant. Prefabrication can lead to cost savings due to reduced labor requirements and shorter construction times, as well as improved quality control that minimizes rework and material wastage. Studies have shown that the initial higher costs associated with setting up prefabrication facilities are offset by the overall reduction in project costs, which can be 15–20% lower compared to traditional cast-in-place methods [6]. Furthermore, the long-term maintenance costs are also lower due to the enhanced durability and performance of prefabricated components, making them a more cost-effective solution over the lifecycle of a building.
The bottom reinforced parts of the shear wall are crucial for the overall stability and seismic performance of the structure. Their current cast-in-place nature presents challenges, such as increased construction time, higher labor costs, and potential inconsistencies in construction quality [7,8]. These issues undermine the application and broader adoption of prefabricated shear wall structures, particularly in high-rise buildings where seismic performance is a critical consideration [9,10]. Therefore, it is crucial to investigate the seismic performance of the reinforced parts at the bottom of prefabricated shear wall structures. This investigation has significant implications for the further application and acceptance of prefabricated shear wall structures in the construction industry, particularly in seismically active regions [11,12].
Currently, relevant research focuses on the connection methods for precast shear walls and the static performance of these connection nodes [13]. Studies have explored various aspects, including the bearing capacity of precast shear wall connections, their seismic performance, and other related characteristics [14,15,16,17]. For instance, Pan et al. [18]. conducted cyclic load tests on precast composite shear walls, demonstrating that precast components with different inner surface treatments shared similar failure modes and both were capable of ensuring effective cooperation between precast and cast-in-place parts. These findings highlight the potential for achieving a seamless integration of prefabricated and cast-in-place elements, which is crucial for enhancing the overall structural performance.
Additionally, recent research by Jafari et al. [19] on the cyclic response and damage status of coupled and hybrid-coupled shear walls provides valuable insights into the damage mechanisms and seismic performance of shear walls under cyclic loading. Incorporating these insights, our study aims to explore similar cyclic response characteristics in prefabricated shear walls with cluster connections, thereby contributing to a more comprehensive understanding of their seismic performance.
In recent years, there has been a growing interest in developing and optimizing connection methods for prefabricated shear wall structures to enhance their seismic performance and construction efficiency. One notable method is the cluster connection technique, proposed by Feng et al. [20]. This method involves a centralized restraint overlap connection of vertical steel bars in prefabricated shear wall structures, which has been found to be convenient for construction. Subsequently, Feng et al. [21] improved the connection method, resulting in a vertical-steel-bar concentrated restraint overlap connection structure with a more reasonable stress distribution. This improvement aimed to address some of the limitations observed in the initial implementation of the cluster connection method.
Zhang [22] further advanced the understanding of the shear resistance mechanism of cluster-connected shear wall structures. He derived a simplified formula for calculating the shear bearing capacity of precast shear walls based on the tension–compression rod model. This model was then verified through laboratory test results, providing a reliable theoretical framework for evaluating the performance of cluster-connected shear walls. Liu [23] conducted an experimental study on the seismic performance of cluster-connected precast shear walls, revealing that while removing corrugated pipes did not improve the bearing capacity, it enhanced the energy dissipation capacity and ductility of the walls. Liu also found that additional reinforcement at the height of the reserved holes could reduce crack width, though it did not alter the ultimate crack mode.
Despite these advancements, there remain gaps and limitations in the current studies on the cluster connection form of precast shear walls. Existing research primarily focuses on static performance and general seismic behavior without adequately addressing the specific challenges associated with the reinforced parts at the bottom of the shear wall. These challenges include ensuring the continuity and integrity of the connection under seismic loading conditions and optimizing the construction process to fully leverage the benefits of prefabrication.
This study aims to address these gaps by improving the cluster connection form of precast shear walls for application in the reinforced parts at the bottom of the structure. By varying the vertical steel cluster connection structure, this research explores the feasibility of employing cluster connections to assemble an integral shear wall structure within the reinforced parts at the bottom of the shear wall. This approach aims to maintain the construction convenience of the cluster connection method while enhancing its seismic performance and overall structural integrity.
To achieve this, the study employs numerical analyses using the finite element software ABAQUS (Version 2019) to evaluate the rationality of the model parameters and the seismic performance of the prefabricated components. The numerical simulations are validated against experimental data to ensure the reliability of the findings. Through this comprehensive approach, the study seeks to provide a robust framework for the application of improved cluster connection methods in prefabricated shear wall structures, thereby contributing to the advancement of prefabricated construction technologies and their broader adoption in seismic regions.
2. Tests Settings
2.1. Design of Tests
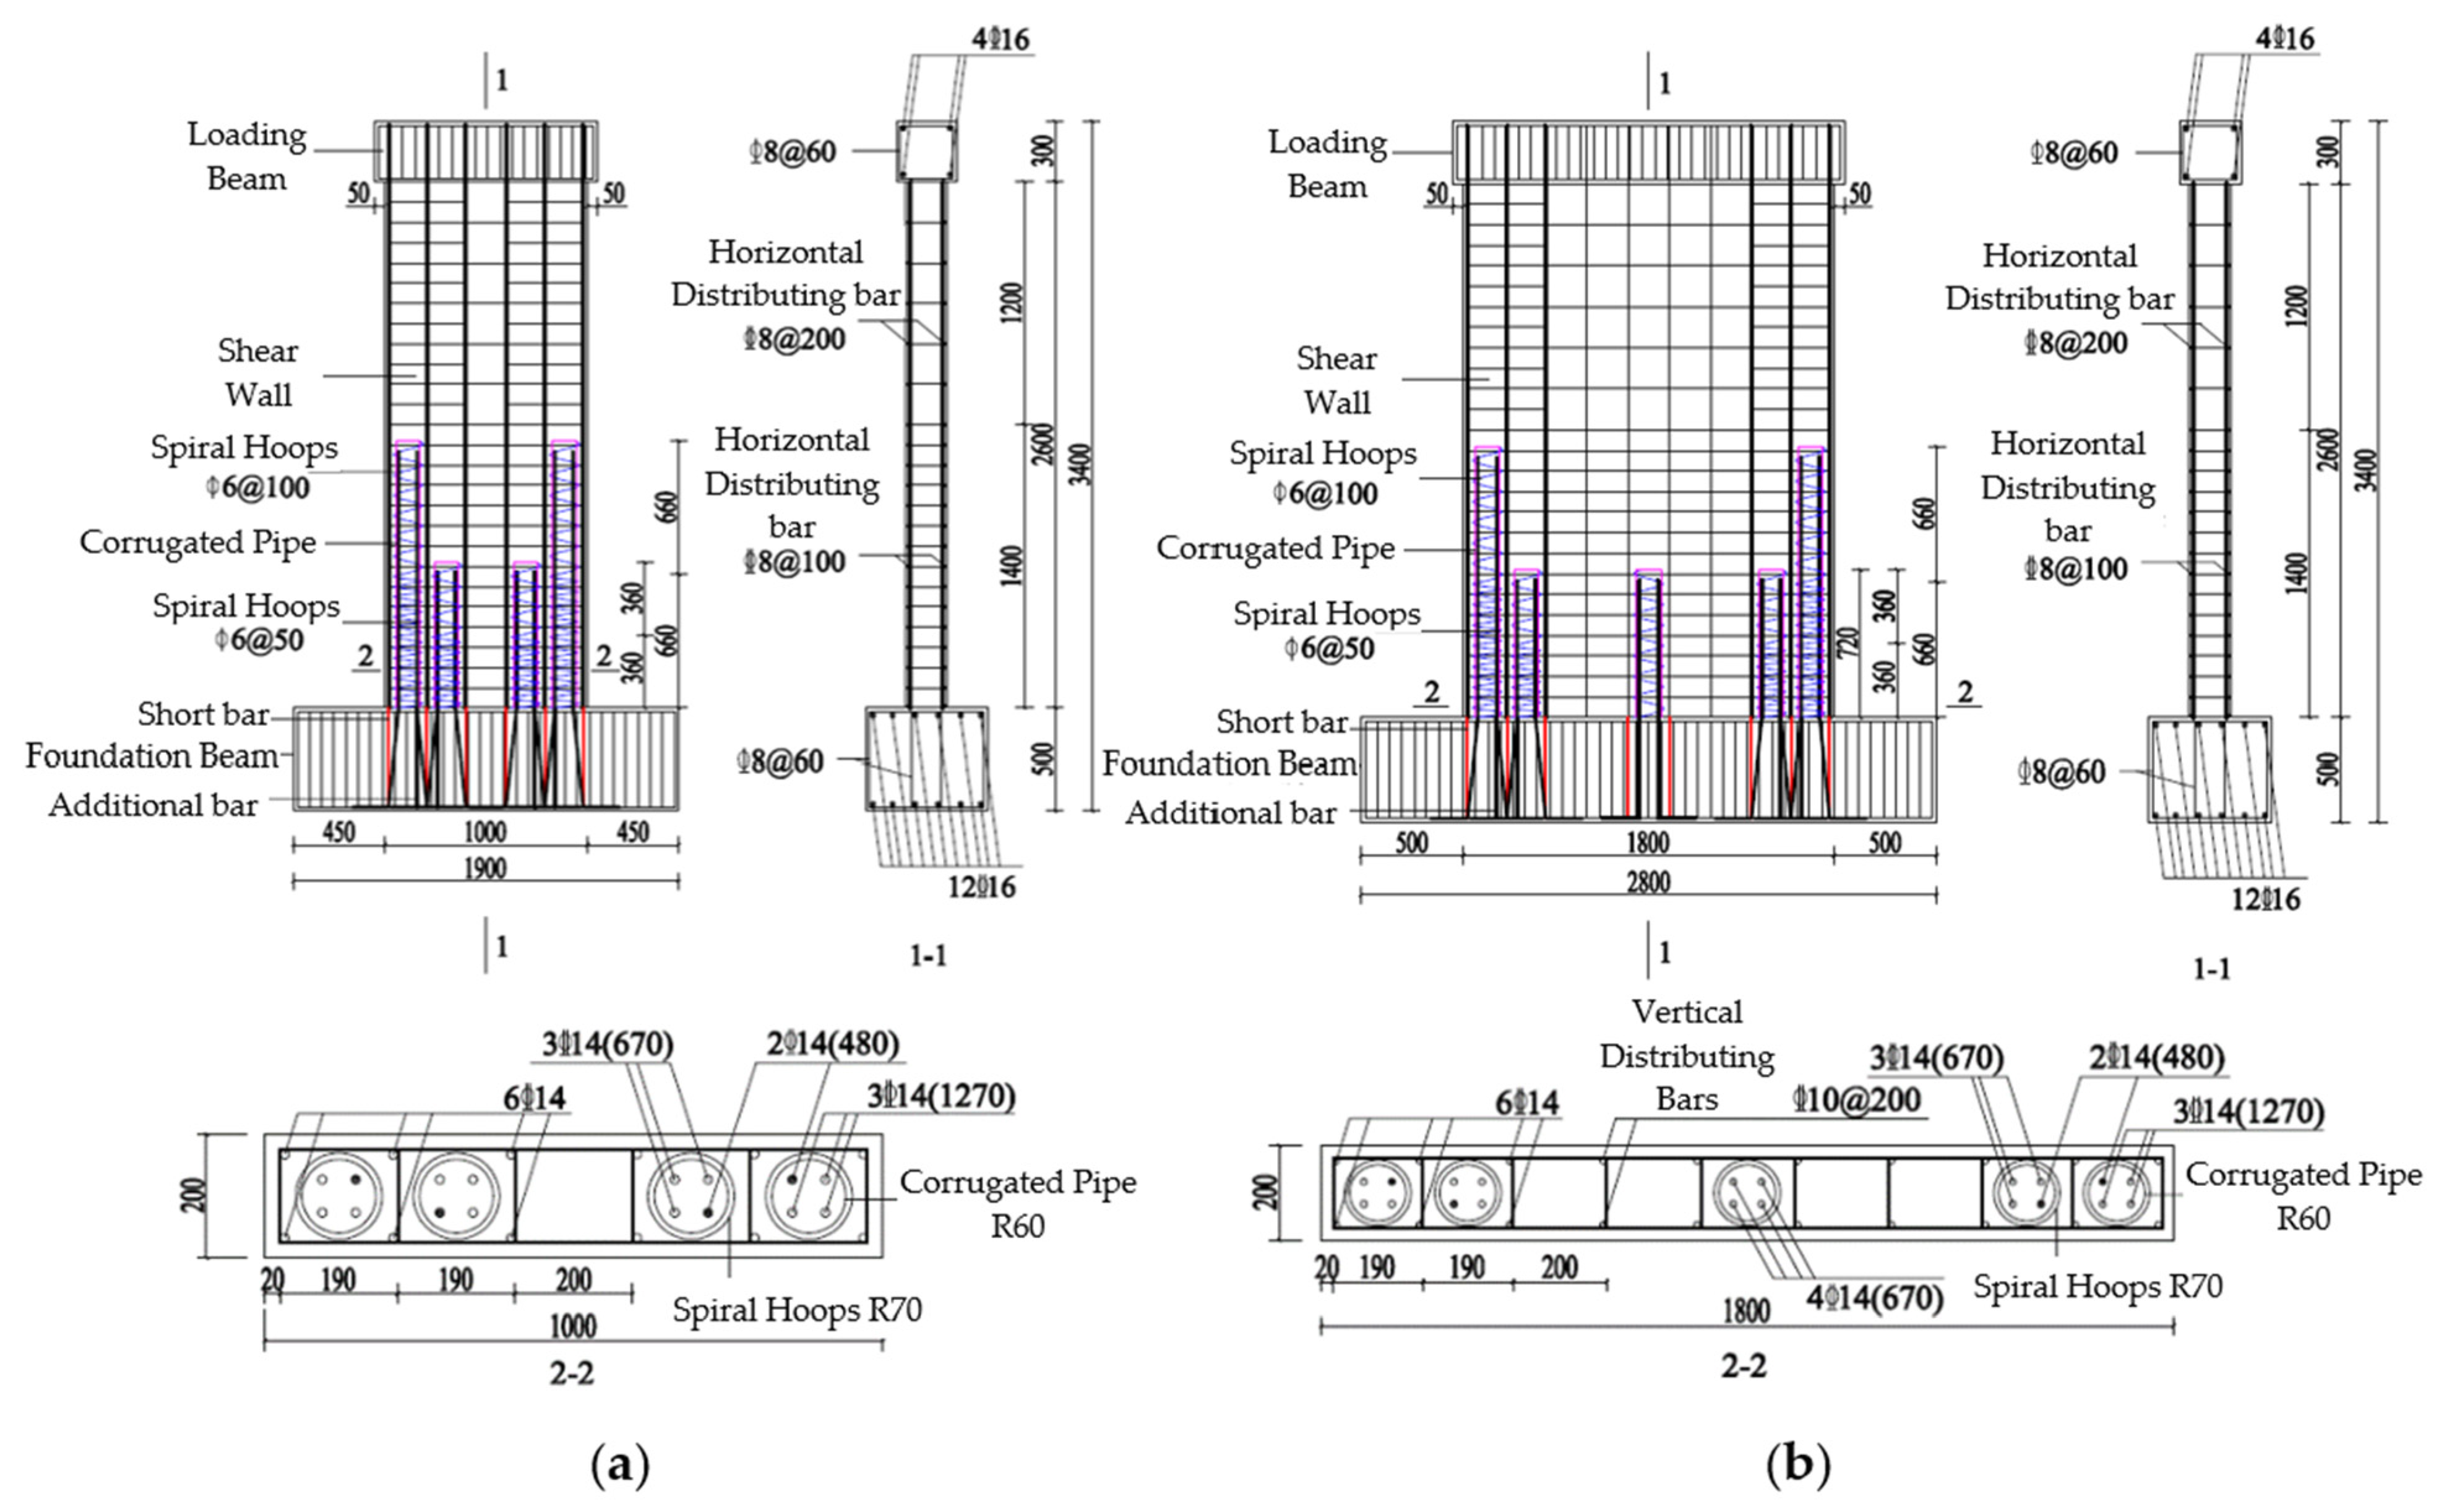
Two full-scale cluster-connected shear wall specimens, i.e., YZ-1 and YZ-2, were designed and produced for the physical laboratory tests. The specimens are composed of foundation beams, walls, and loading beams. YZ-1 is a short-limb shear wall, while YZ-2 is an ordinary shear wall. Their parameters are shown in Table 1. Considering the need to install the horizontal actuator clamping device, the cross-sectional size of the loading beam was determined as 300 mm × 300 mm. The cross-sectional dimensions of the foundation beams of specimens were all adopted as 600 mm × 500 mm. Considering the installation of anchors, the lengths of the foundation beams of two groups of specimens A and B were set as 1900 mm and 2800 mm, respectively. The dimensions and reinforcement of the specimen are shown in Figure 1.

Table 1.
Parameters of the specimen.
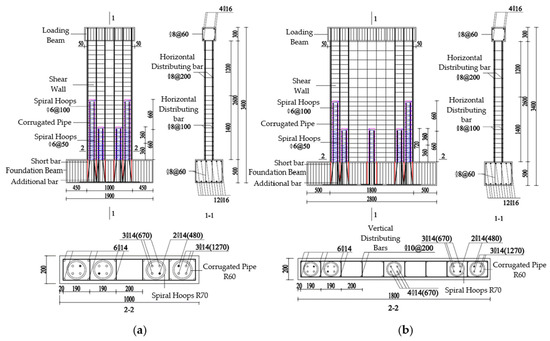
Figure 1.
Specimens’ size and reinforcement: (a) YZ-1; (b) YZ-2.
2.2. Preparation of the Specimens
The samples for laboratory tests were prepared based on the construction process of the actual project. First, the reinforcements of prefabricated walls and foundation beams were assembled according to the design drawings. Then, strain gauges were attached to it. After that, the formwork was set up to pour the concrete. When the foundation beams and prefabricated walls reached a certain strength, they were assembled. A 20 mm thick grouting layer was first laid at the splicing part of the foundation beam, and then the prefabricated shear wall was attached to it with supports. When the grouting layer mortar reached the specified strength, pressure grouting was carried out and it was cured for 28 days.
2.3. Material Properties
The materials used in this study include concrete of strength grade C40 and a high-strength, non-shrinkage cement-based grouting material (JGM®-II, purchased from Sobute, Nanjing, China). The concrete’s nominal strength grade is C40, with a 1-day compressive strength of no less than 25 MPa and a 28-day compressive strength of no less than 60 MPa. The measured 28-day compressive strength of the concrete averaged 42.5 MPa, with a standard deviation of 3.2 MPa, ranging from 39.3 MPa to 45.7 MPa, based on tests from three 150 mm × 150 mm × 150 mm cube samples. The grouting material (JGM®-II) has a 1-day compressive strength of no less than 25 MPa and a 28-day compressive strength of no less than 60 MPa. The measured 28-day compressive strength of the grouting material averaged 66.8 MPa, with a standard deviation of 2.8 MPa, ranging from 64.0 MPa to 69.6 MPa, based on tests from three 40 mm × 40 mm × 160 mm prism samples. The mechanical properties of the rebars used are detailed in Table 2. For the HPB300 rebar with a diameter of 6 mm, the yield strength is 380 MPa, the ultimate strength is 615 MPa, and the elongation is 12.1%, with a standard deviation of 10 MPa and a range of 370–390 MPa. For the HRB400 rebars with diameters of 8 mm, 10 mm, 14 mm, and 16 mm, the yield strengths are 430 MPa, 445 MPa, 450 MPa, and 435 MPa, respectively, with ultimate strengths of 645 MPa, 660 MPa, 640 MPa, and 640 MPa, and elongations of 9.2%, 9.4%, 9.9%, and 9.5%, respectively. The standard deviations for these HRB400 rebars range from 9 MPa to 12 MPa, and the yield strength ranges are 418–442 MPa, 434–456 MPa, 441–459 MPa, and 425–445 MPa, respectively.
Table 2.
Mechanical properties of rebars.
These values are based on standardized testing methods. The inclusion of variability data (standard deviation and range) for each material type enhances the robustness of the study, providing a clearer picture of the material properties and allowing for a better replication of the experiments. These data help in understanding the potential variability and ensuring that the numerical models and simulations accurately reflect real-world conditions. The sources of these materials are from certified suppliers, and their properties are validated through standardized tests conducted in accordance with relevant industry standards.
2.4. Experimental Loading System and Measurement
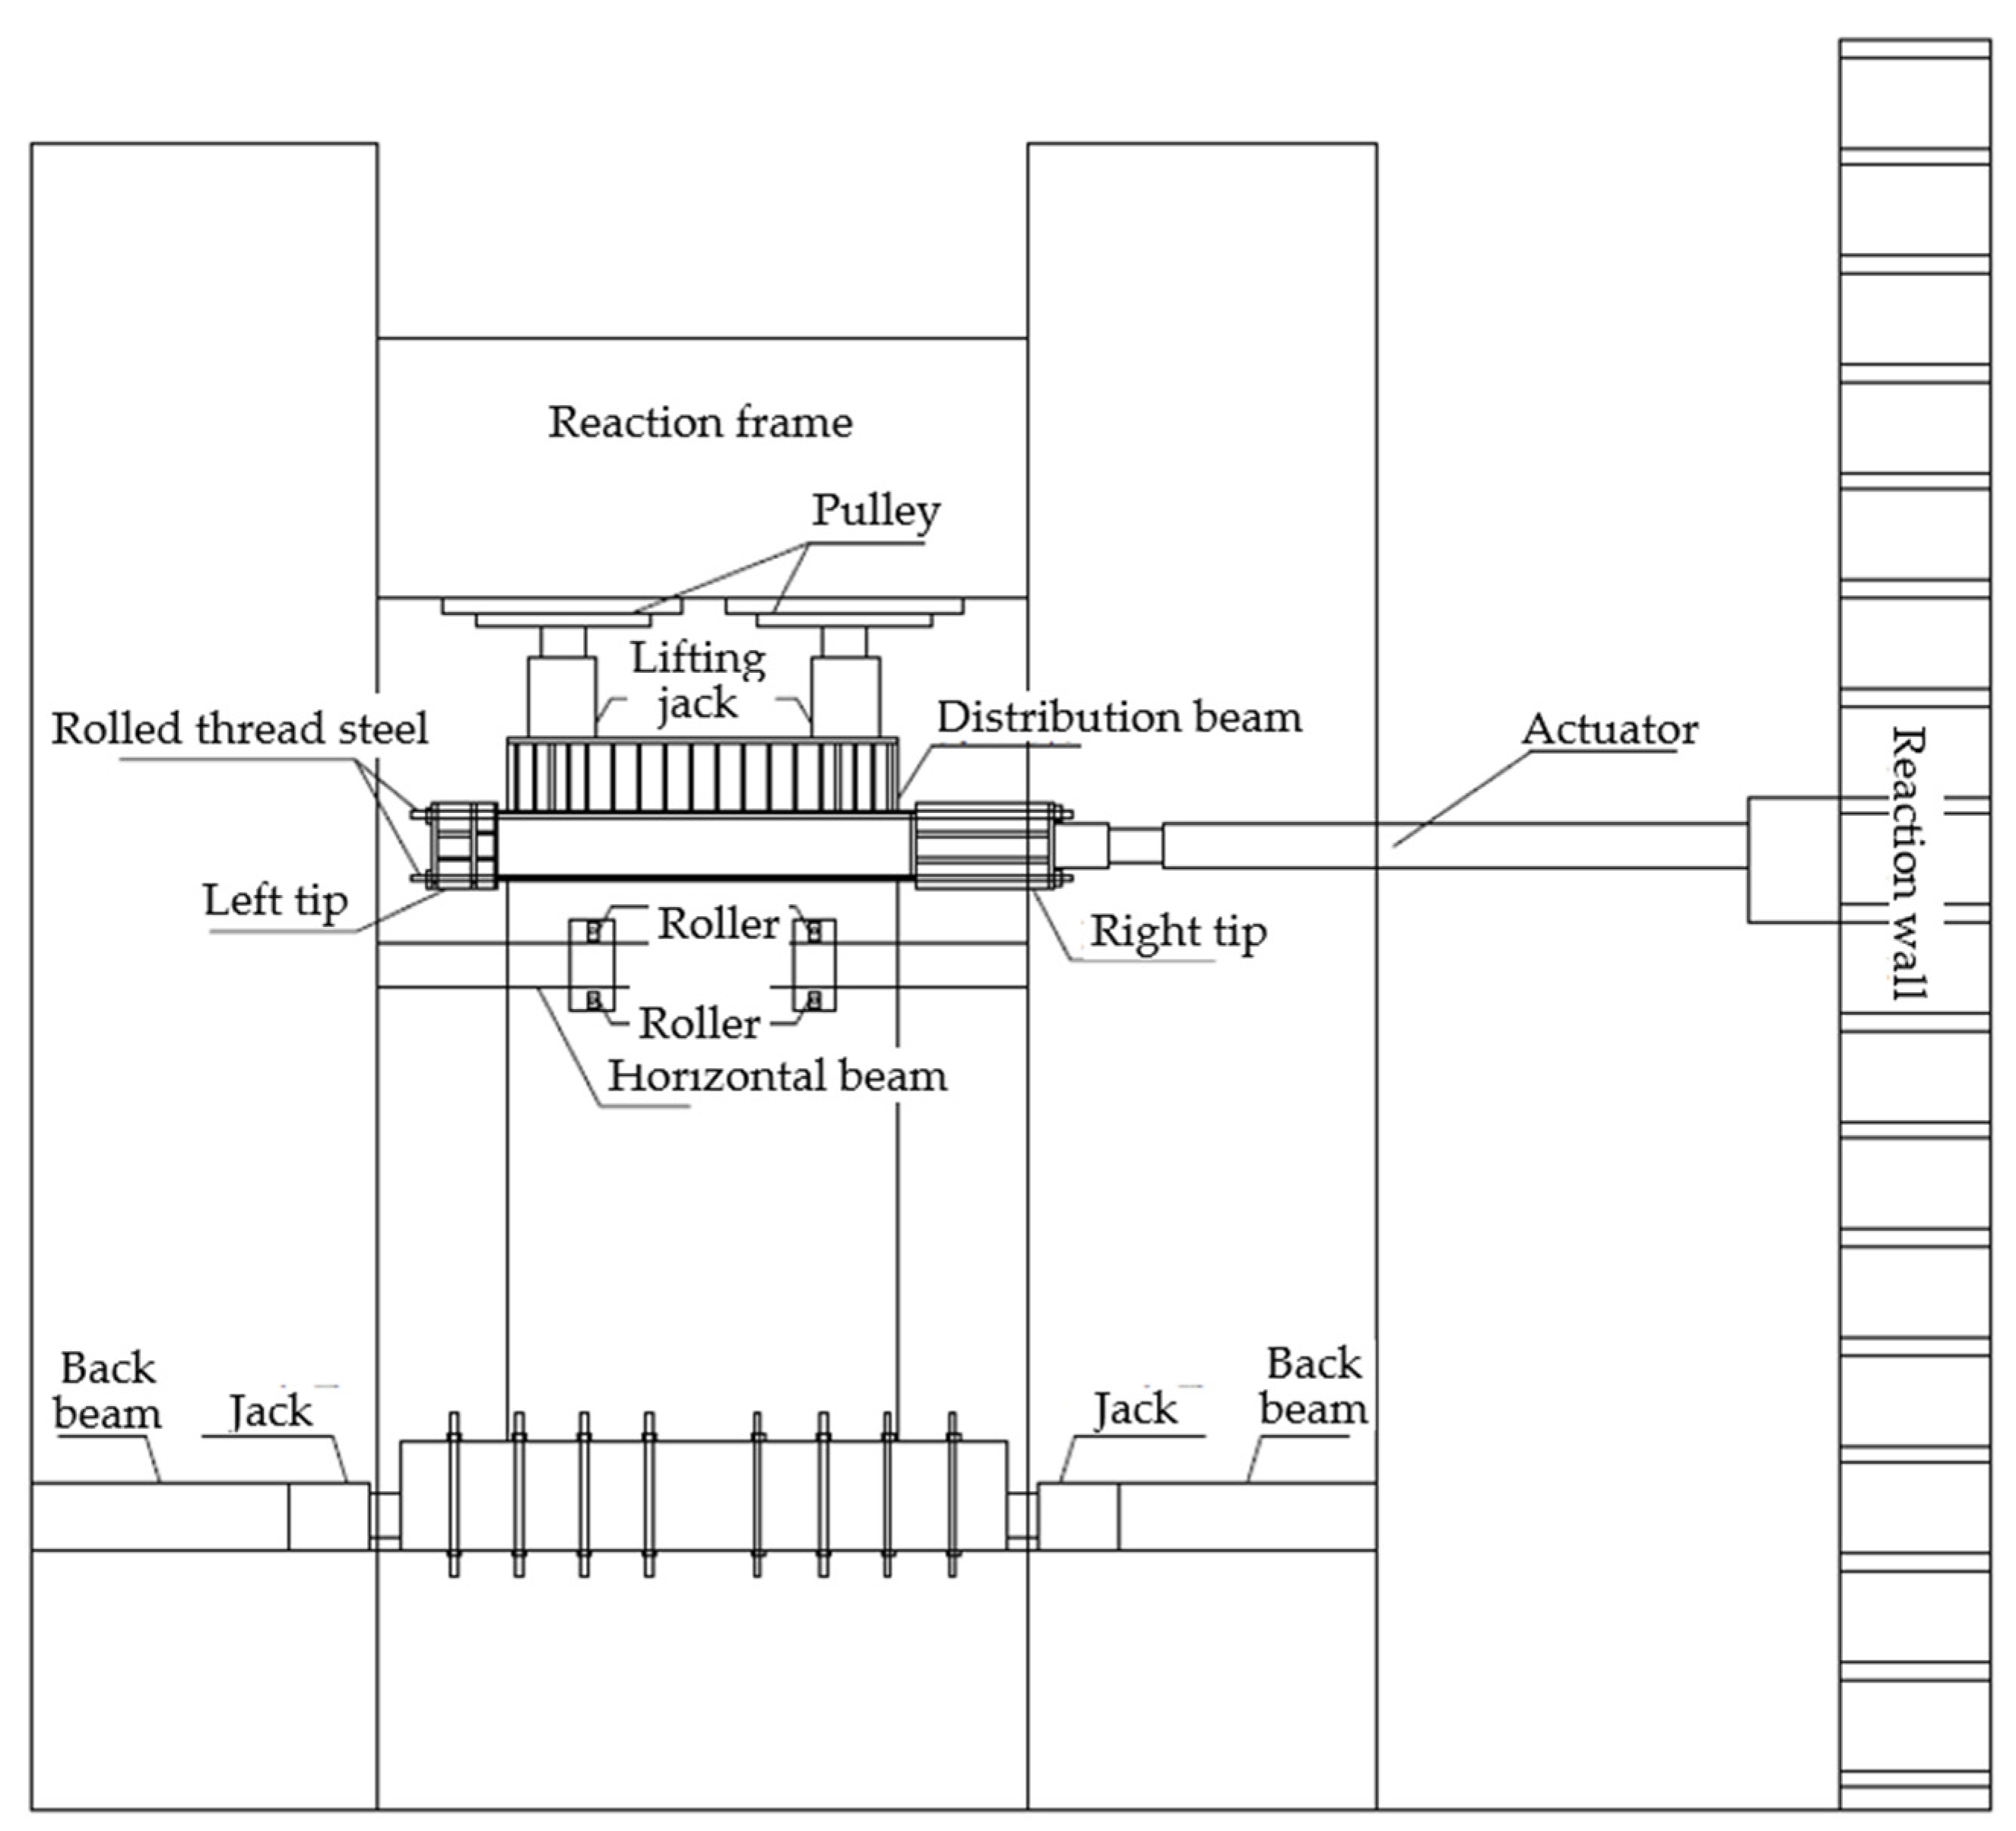
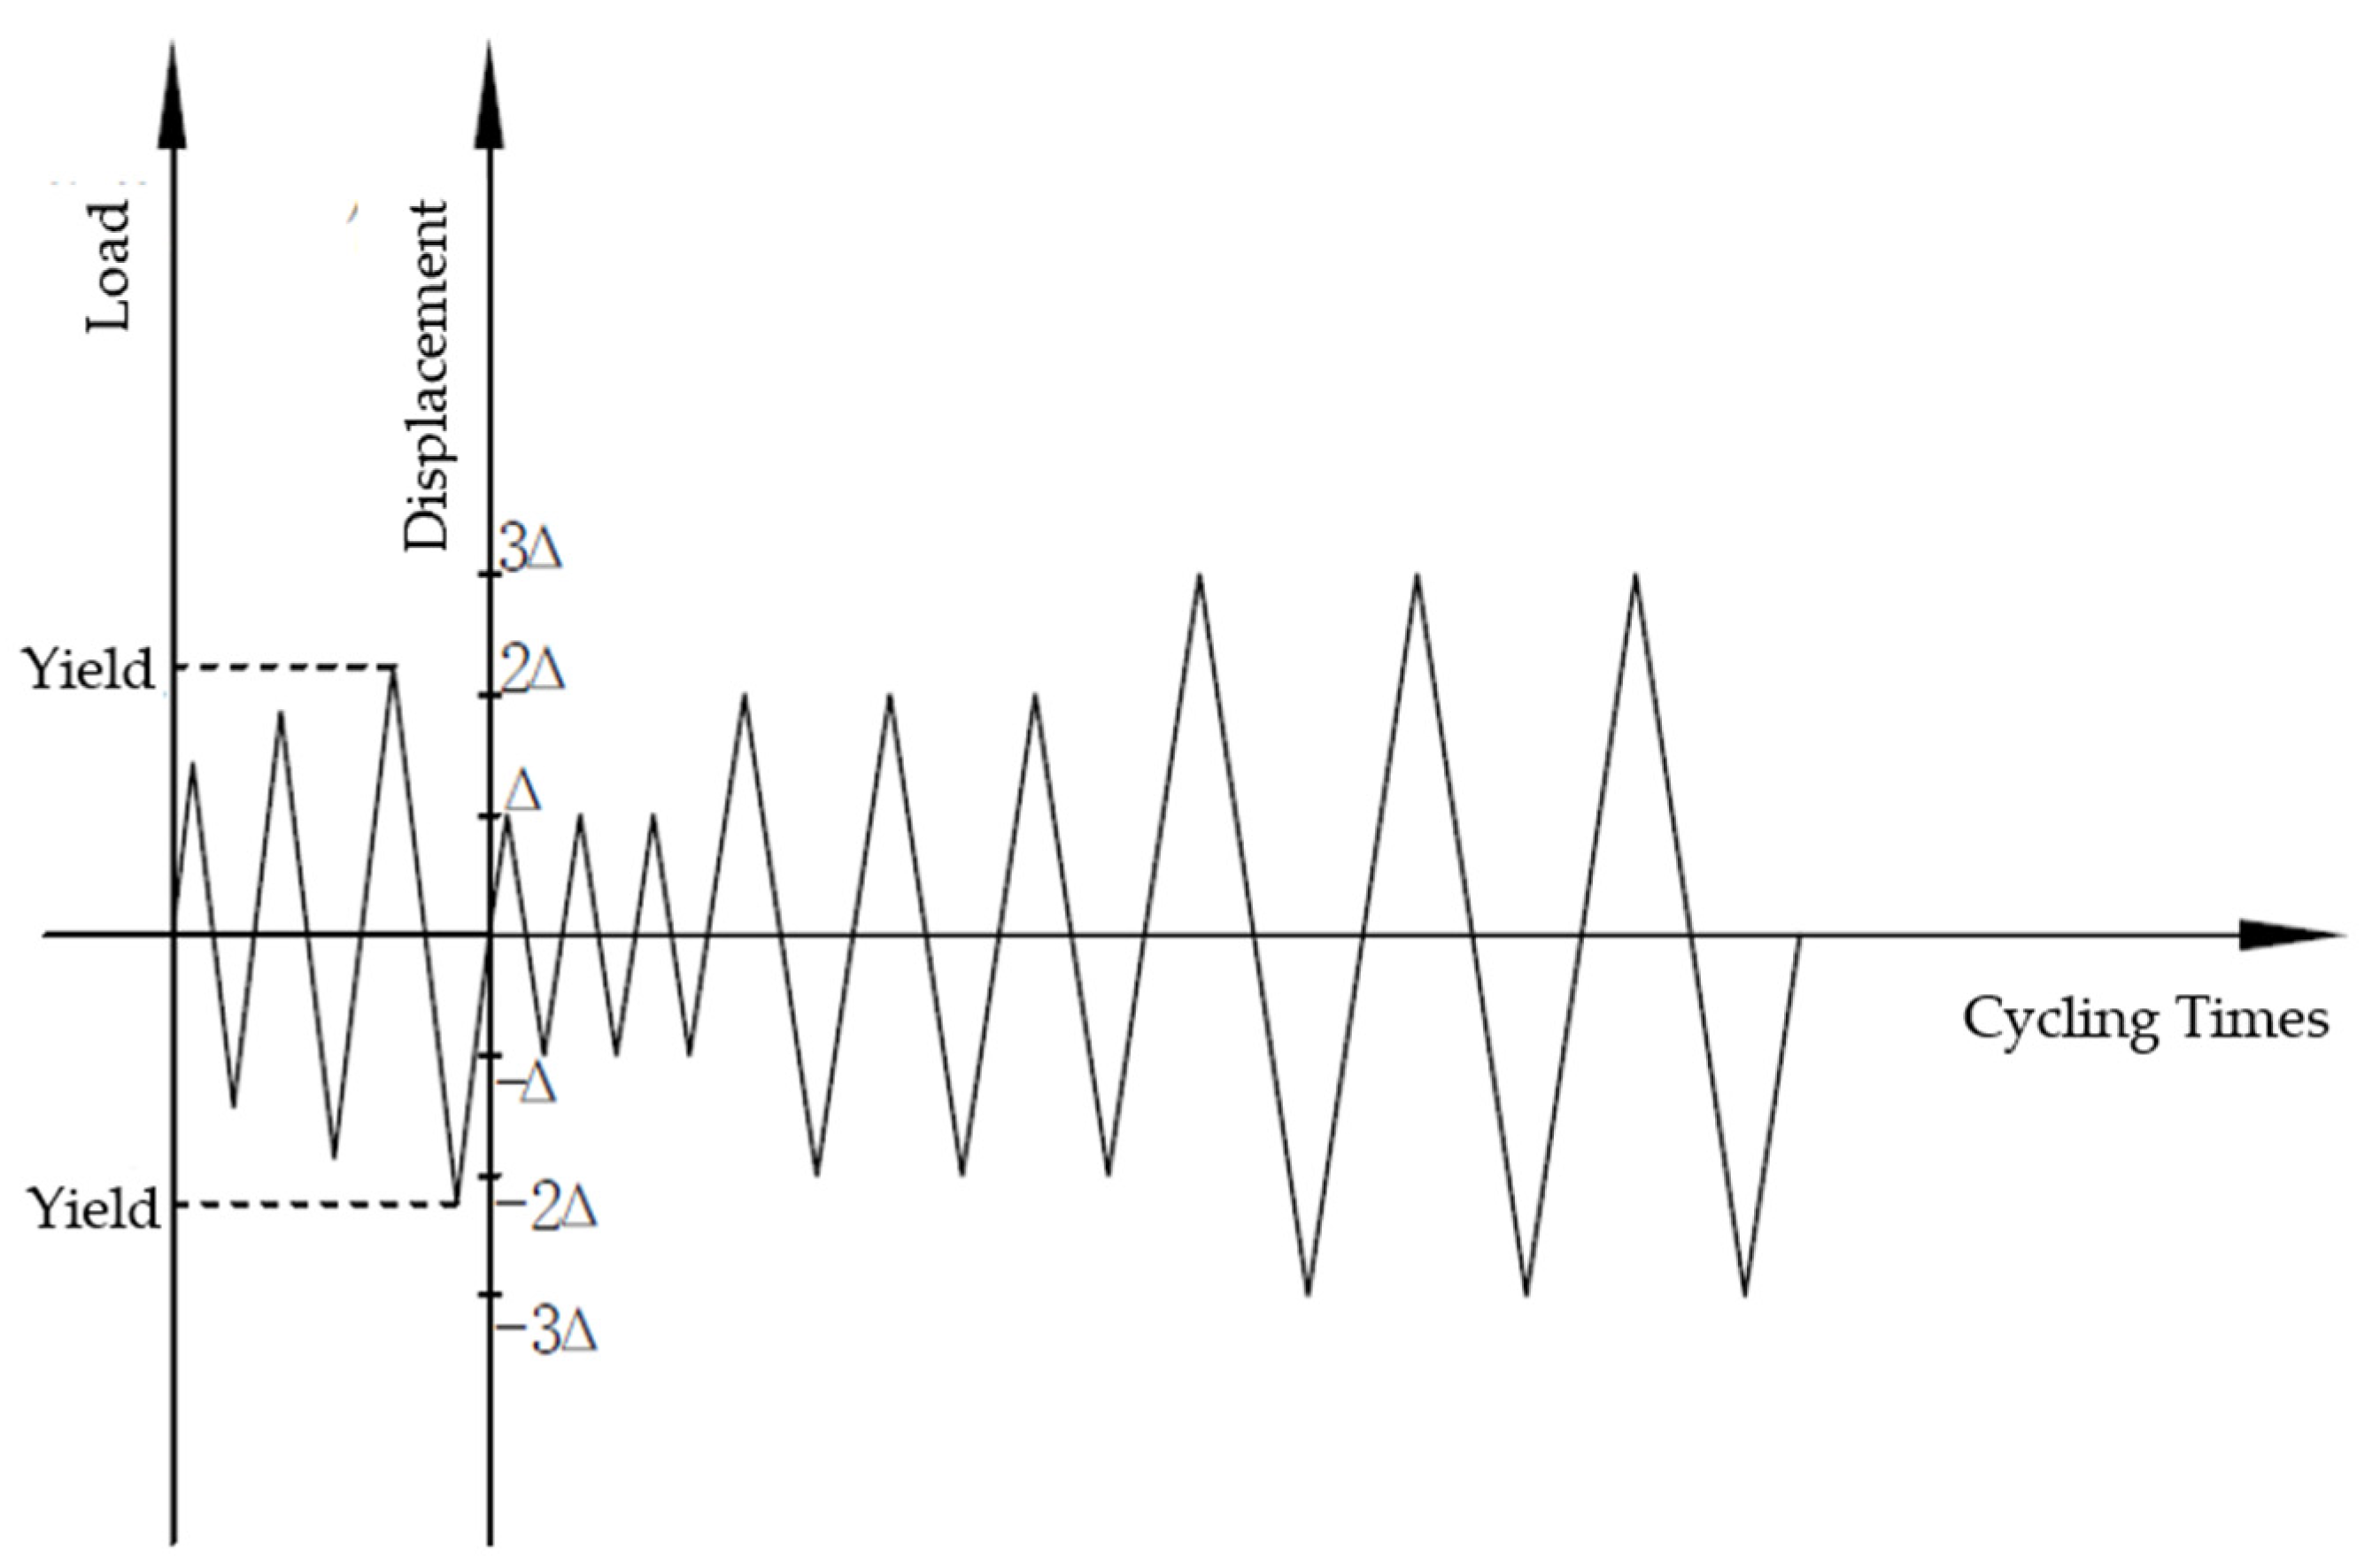
The loading device is shown in Figure 2. The device consists of five parts: a reaction frame, a vertical loading device, a horizontal loading device, a bottom fixing device, and a lateral support device. When vertical axial pressure was applied to the wall, firstly, 40% of the full load of the hydraulic jack was imposed, and the loading and unloading process was repeated twice to check the working state of the hydraulic jack. Then, the designed axial pressure was applied in four stages; in each stage the applied load increased by 25% of the designed axial pressure, but the vertical pressure was kept unchanged during the test. The loading apparatus for the test is shown in Figure 3. In the early stage of loading, the specimen was loaded with force control, and the load was increased by 20~60 kN at each level. In each stage, the applied load was cycled once. Subsequently, displacement-controlled loading was employed, and loading was performed step by step according to multiples of the yield displacement. Each level of displacement loading was cycled three times. When the specimen was damaged, the loading was stopped. The overall horizontal displacement of the specimen was measured by a dial indicator arranged at the end of the foundation beam.

Figure 2.
Schematic diagram of the setup for the laboratory test.

Figure 3.
Loading system curve of the laboratory test.
3. Setup of the Finite Element Model
ABAQUS finite element analysis software was employed in this study to perform a nonlinear analysis of prefabricated shear walls and obtain the load–displacement curve and tensile damage cloud diagram of the shear wall. The results of the finite element analysis were verified using the laboratory test results. Then, this model was used to investigate the seismic performances of the prefabricated shear walls under different axial compression ratios.
3.1. Material Properties
3.1.1. Constitutive Relationship of Concrete
In this finite element analysis, the plastic damage model was used for both concrete and grouting materials, and the constitutive equation used in the analysis is shown in Equation (1). The plastic damage model combines isotropic damage elasticity with isotropic tension and compression plasticity to represent the inelastic behavior of concrete. It can describe the damage, stiffness recovery, crack development, and closure of the material under cyclic loads. Therefore, it can be used to simulate the stress behavior of concrete structures under cyclic loads.
where is the initial elastic stiffness of the material; is the elastic stiffness after the material is damaged; d is the stiffness damage variable, and its value is between 0 and 1 (d = 0 when the material is not damaged, and d = 1 when the material is completely damaged); and is the plastic strain of concrete.
3.1.2. Constitutive Relationship of Rebars
The double-line model was adopted to characterize the constitutive relationship of steel bars. According to the stress characteristics of steel bars, their stress state was divided into the elastic stage and the strengthening stage.
3.2. Interaction between Concrete and Rebar
The steel bars were embedded into the concrete to make the rebars co-deform with concrete. In order to apply loads and boundary conditions, loading points were set on the top of the loading beam, and coupling constraints were used between the loading point and the upper surface of the loading beam to synchronize the displacements of all nodes on the selected section. Binding constraints were applied to the surface between the prefabricated walls and the loading beam as well as the surface between the prefabricated walls and ground beam, respectively.
3.3. Boundary Condition and Loading Method
The coupling point at the top of the loaded beam restrained its out-of-plane displacement and rotation. The bottom of the foundation beam was fixedly restrained. A vertical load with the designed axial pressure ratio was first applied on the loading point on the surface of the loading beam, and then a horizontal cyclic load was applied on the loading point on the upper surface of the loading beam. The loading method was consistent with the experiment.
3.4. Grid Division
In this simulation, reduced integration elements were adopted for concrete, grouting materials, and steel bars. The eight-node hexahedral linear reduced integration elements, C3D8R, were employed for the concrete and grouting materials, while two-node three-dimensional truss elements, T3D2, were adopted for steel bars.
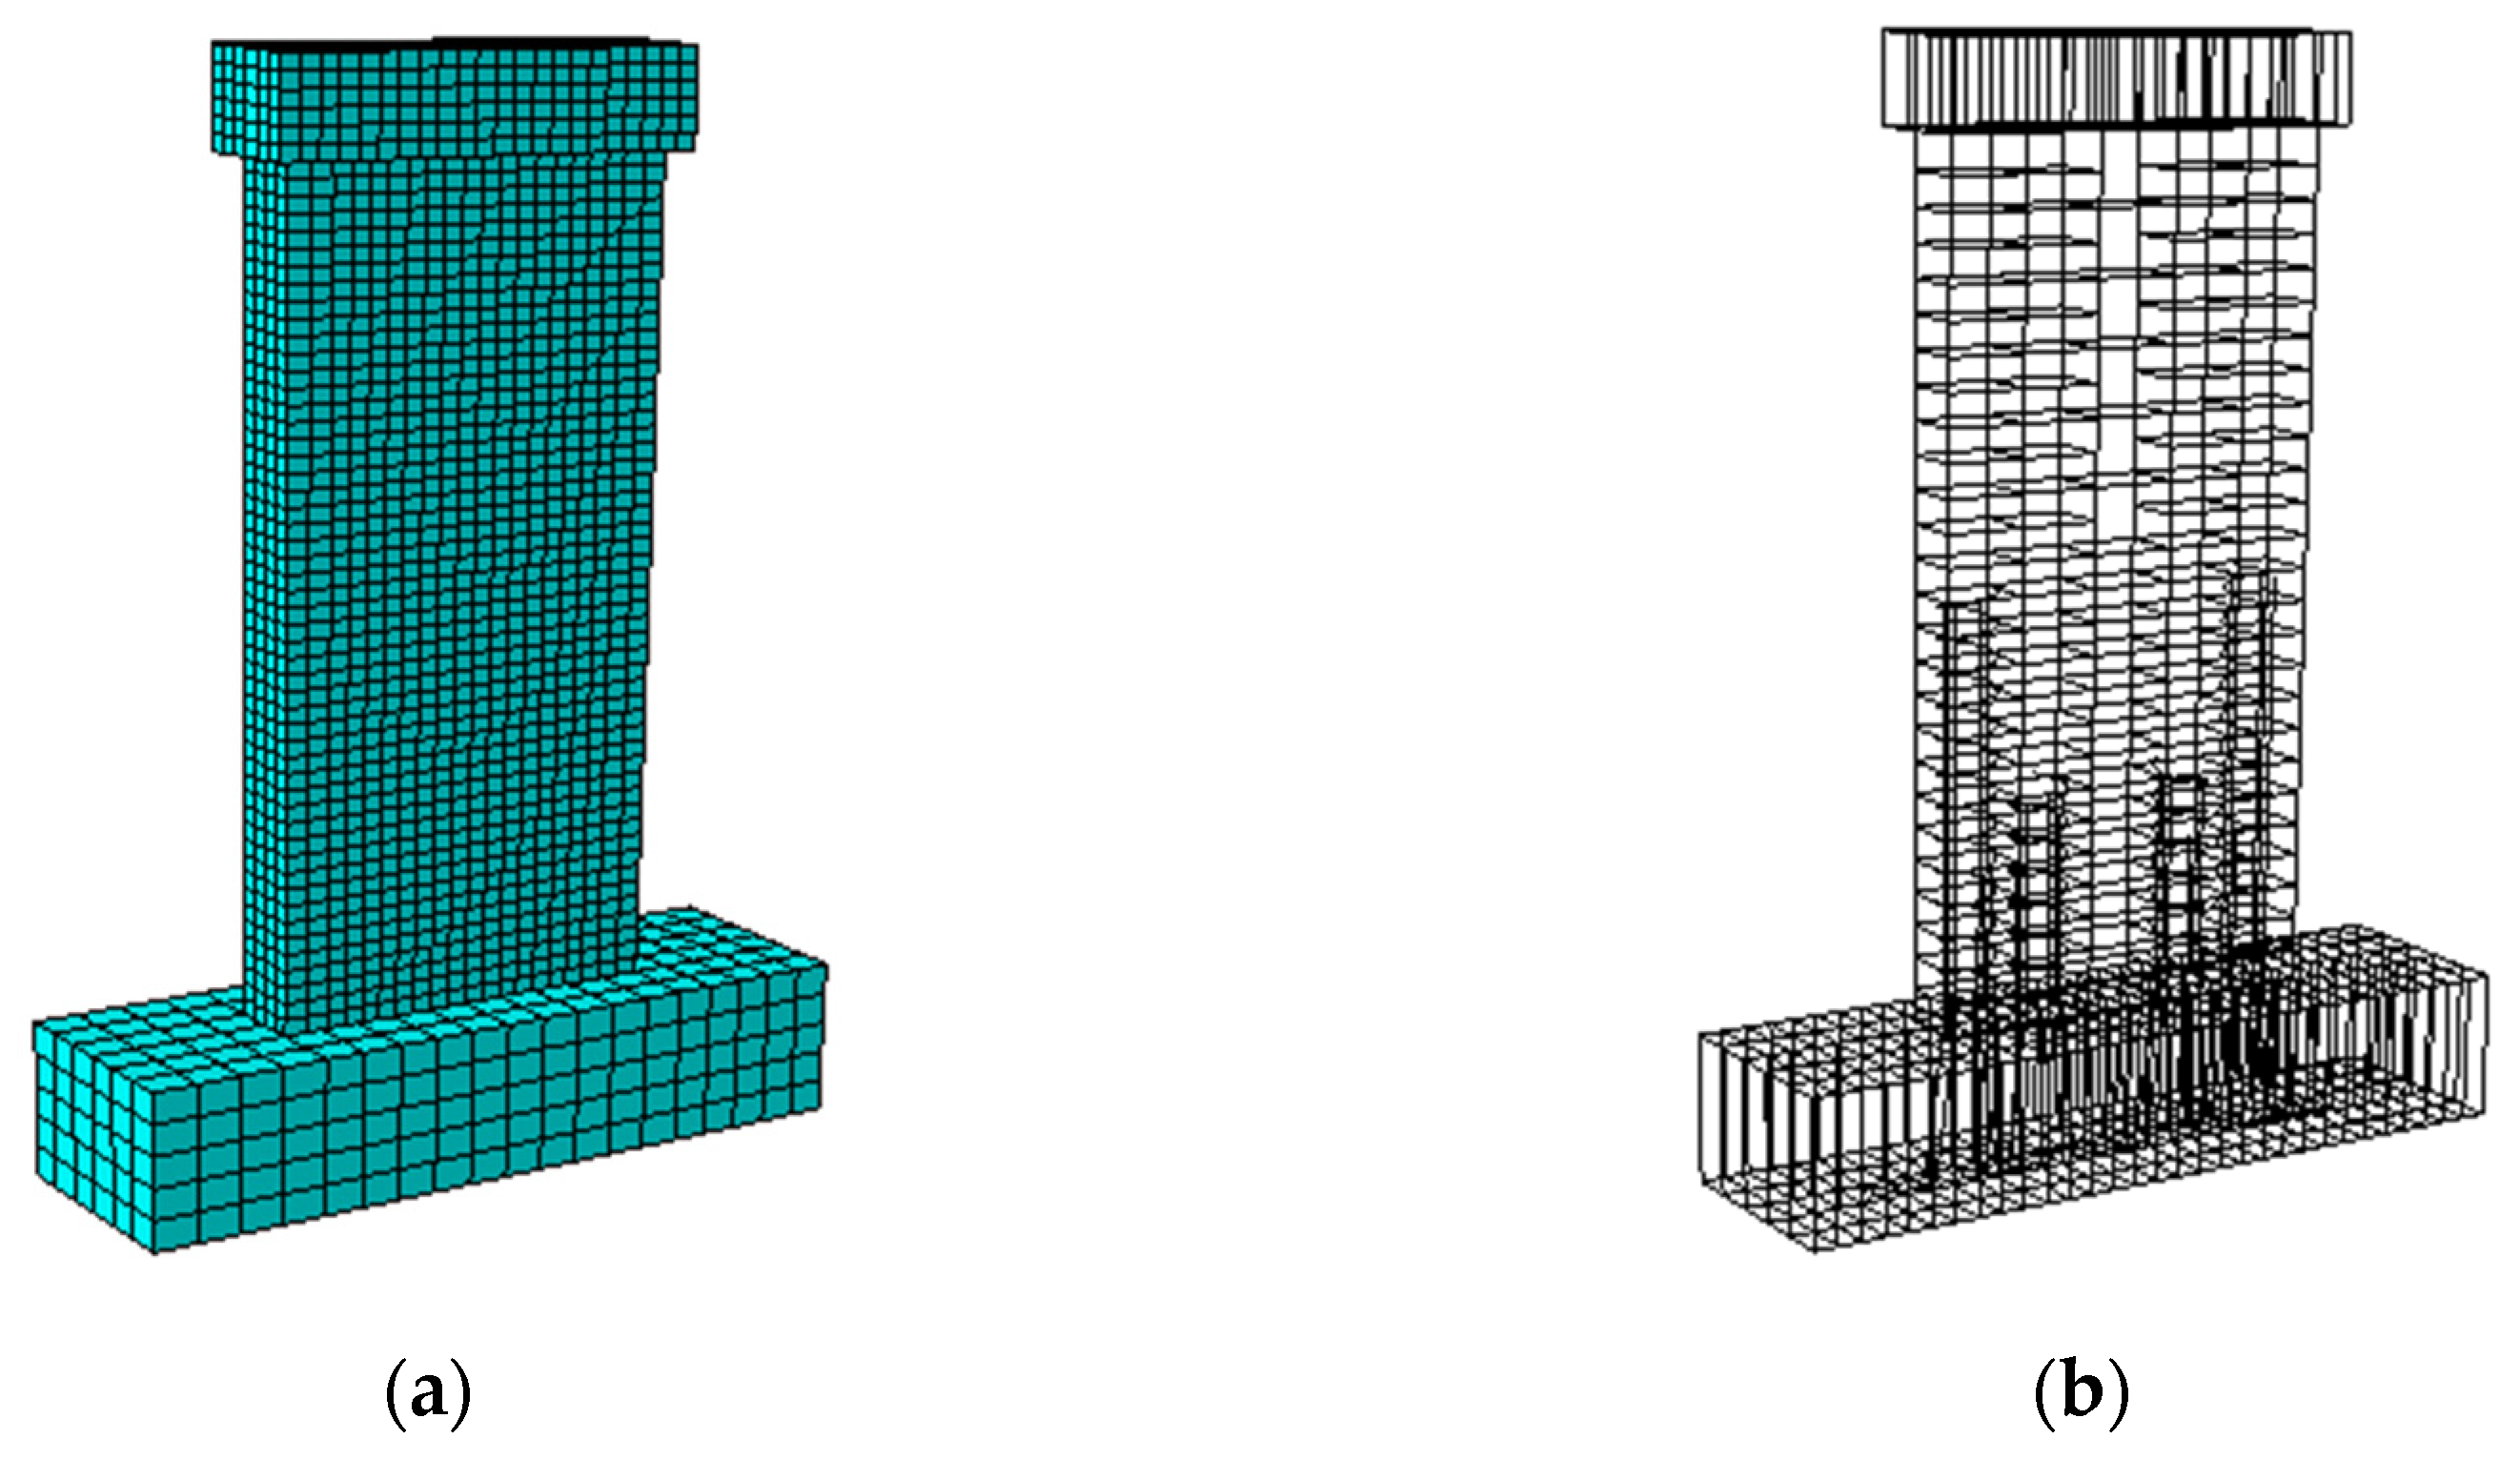
To strike a happy medium between the calculation accuracy and efficiency of the simulation, different meshing methods were employed for different areas. The wall is the focus of this study, and therefore the meshing was relatively dense. In contrast, the foundation beam is a secondary part of the study, and therefore, the meshing was relatively sparse. The meshing of the prefabricated short-limb shear wall model is shown in Figure 4.

Figure 4.
Model grid division. (a) Grid division of the wall; (b) grid division of steel bars.
4. Justification of the Finite Element Model
4.1. The Comparison of the Crack Distribution
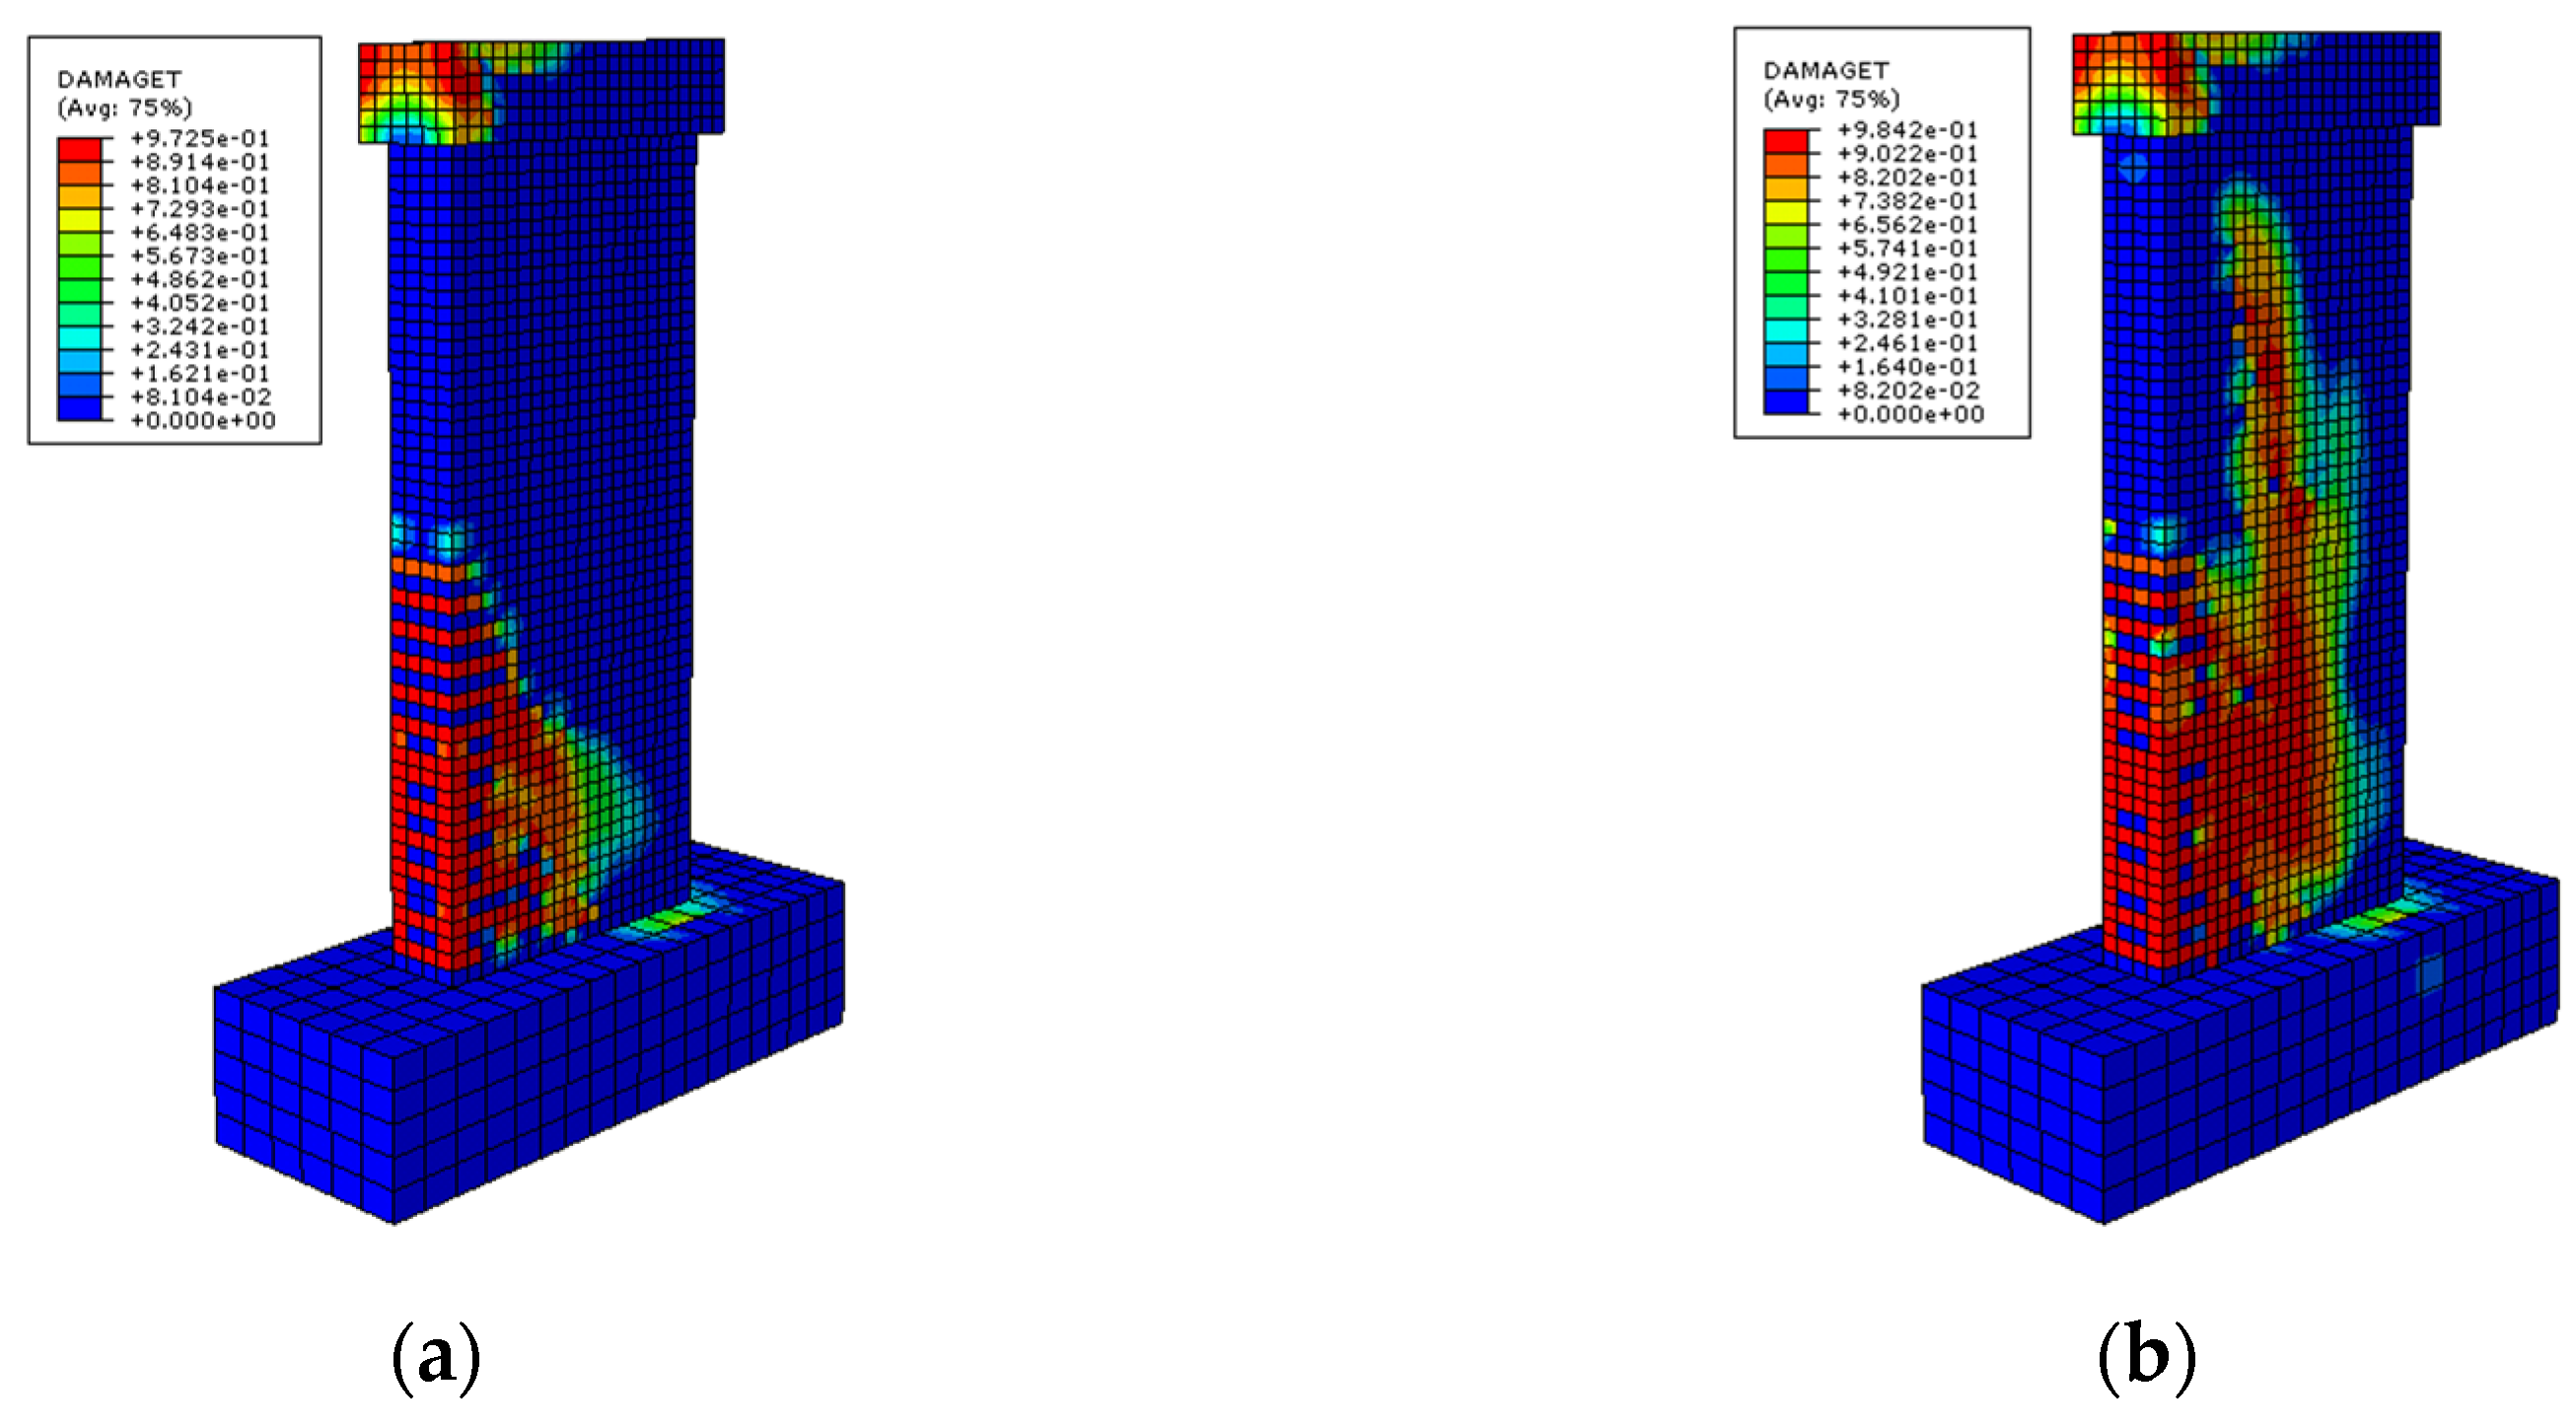
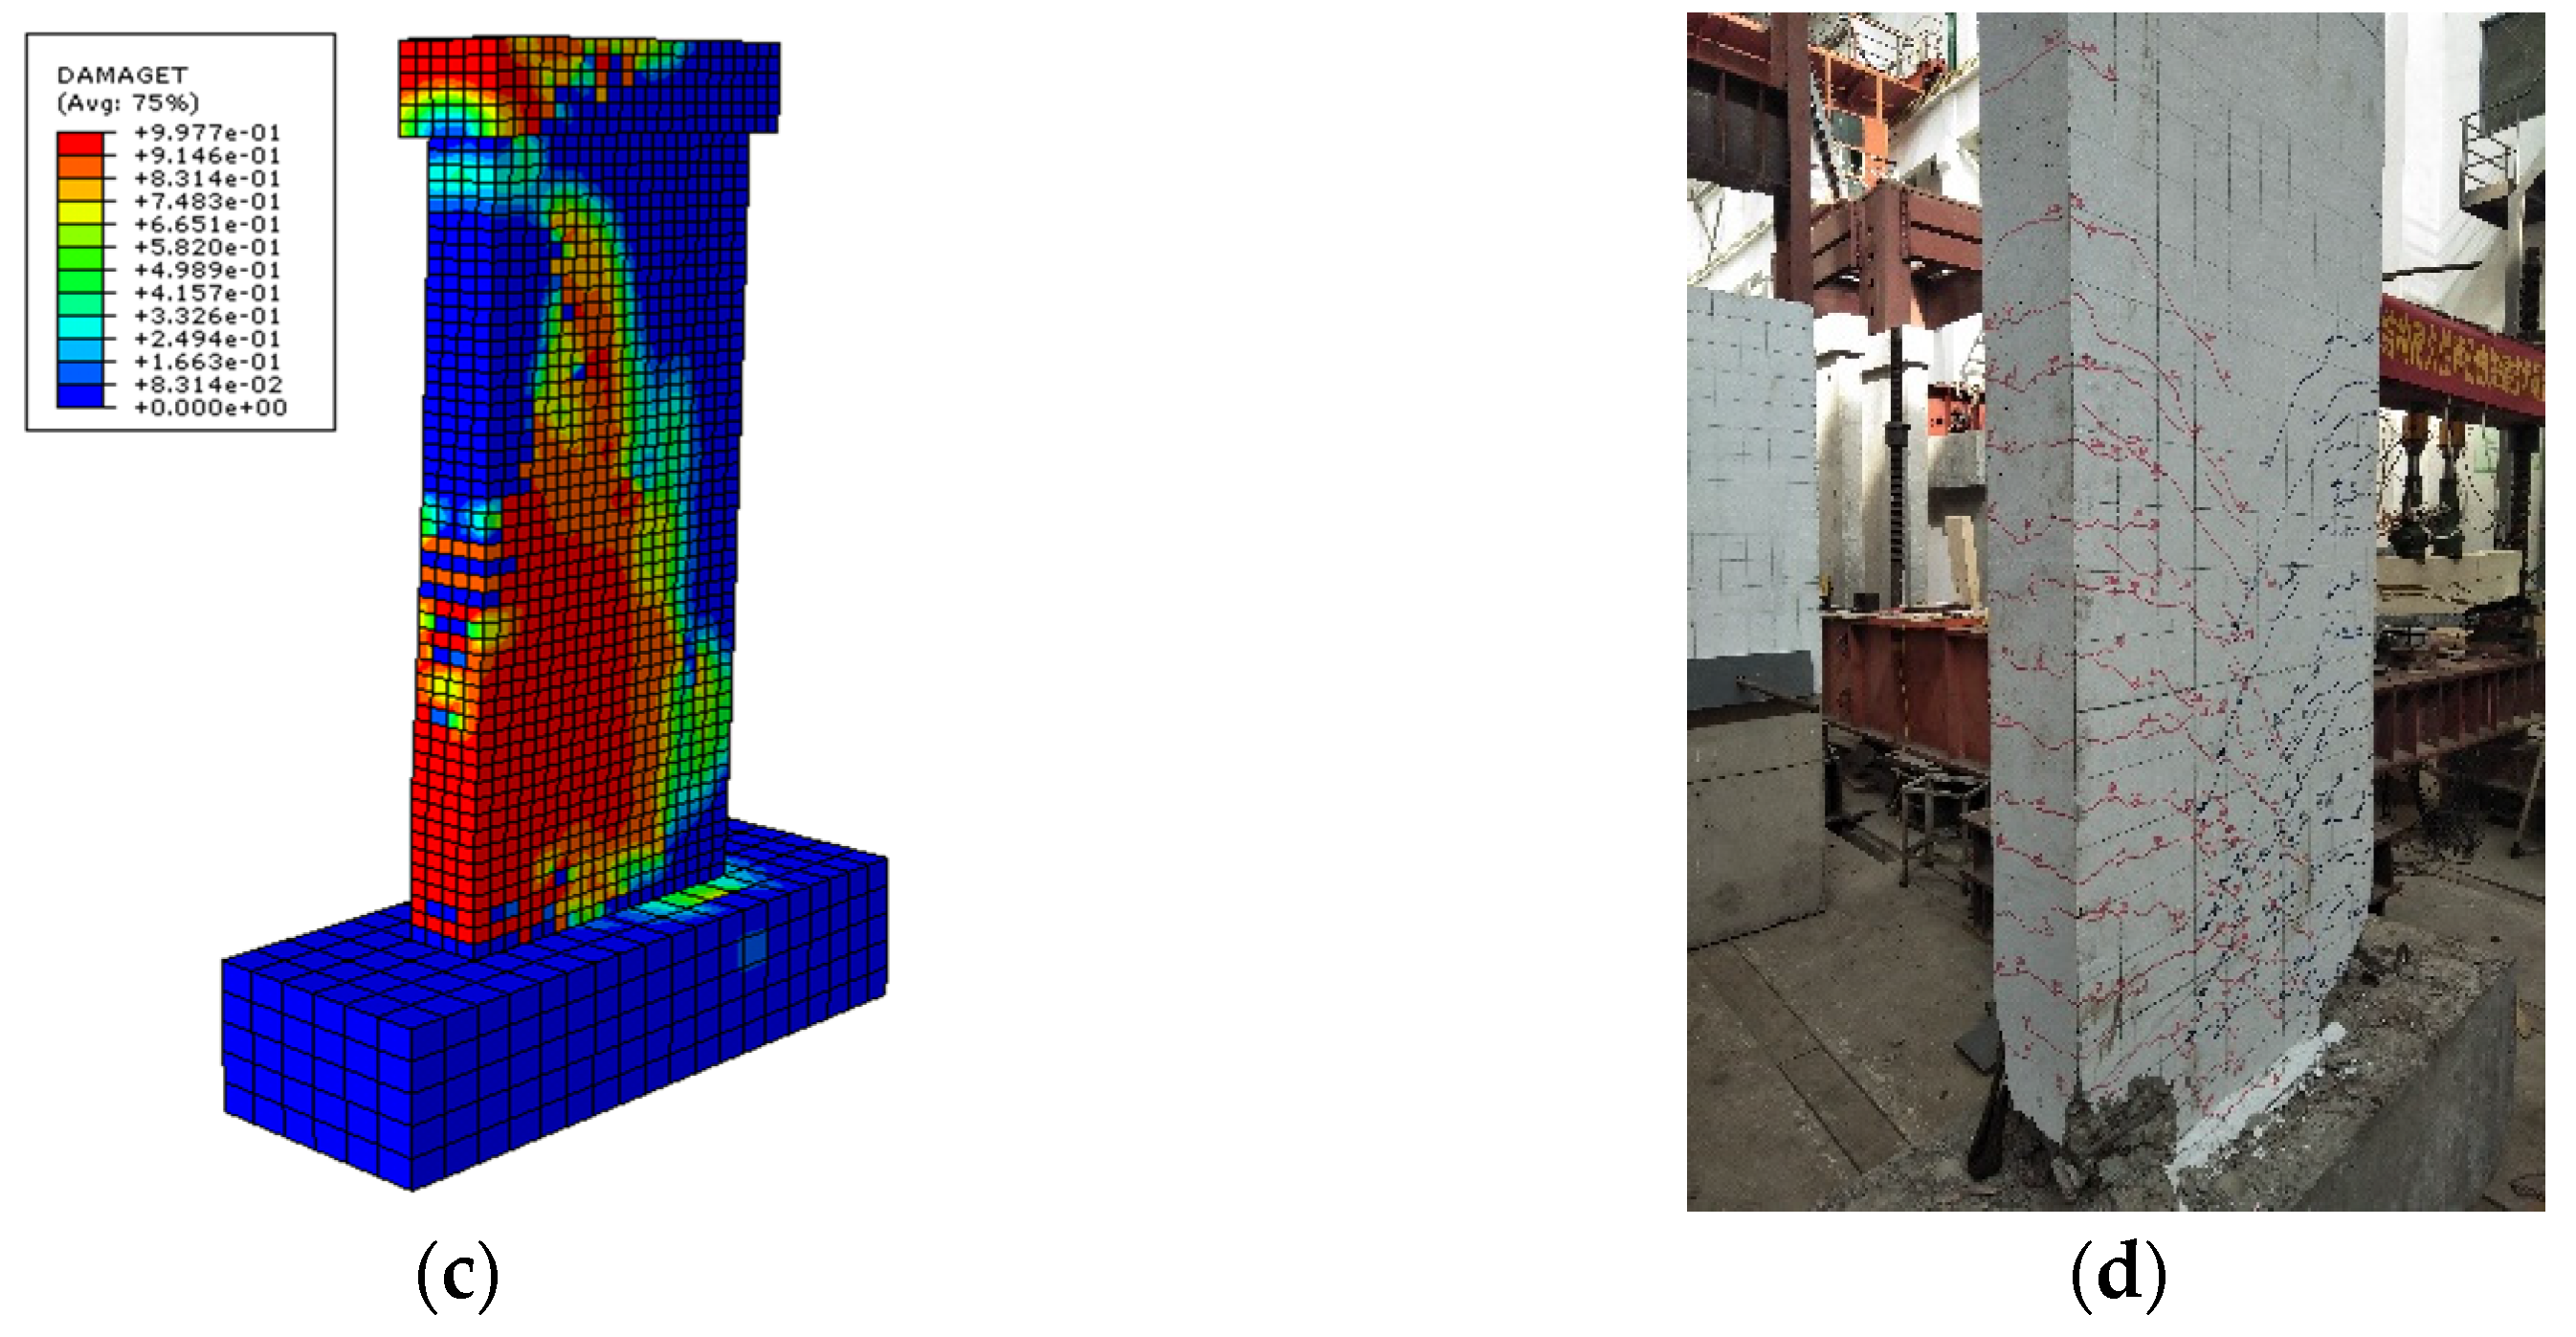
Figure 5 illustrates the crack distribution patterns in specimen YZ-1 under displacement control loading. Figure 5a,b show the experimental results at displacements of 10 mm and 23 mm, respectively, while Figure 5c presents the finite element simulation results at a displacement of 92 mm. Figure 5d displays the experimental crack pattern at a 92 mm displacement. The consistency between the experimental and simulation results confirms the model’s capability to accurately predict crack development and propagation in the shear wall. Similarly, Figure 6 shows the crack distribution diagram of specimen YZ-2 from the test and finite element model. During the displacement loading process, tensile damage was first found in the concrete at the bottom of the left tension zone of precast ordinary shear wall specimen YZ-2. As the load increased, the damage gradually expanded to the upper and right compression zones. Figure 6c shows the tensile damage distribution of specimen BYZ-2 when the displacement of the finite element model was loaded to 90 mm, and Figure 6d shows the crack distribution when the test displacement control loading level was 90 mm. Similarly, the distribution patterns of the tensile damage were relatively close to that of cracks.

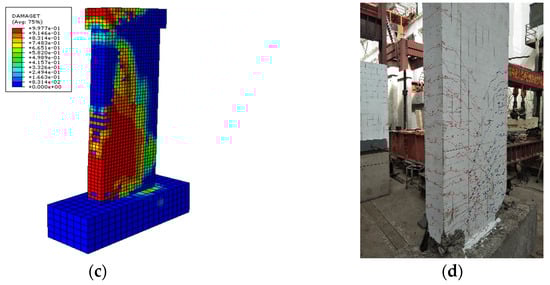
Figure 5.
Comparison of results of the laboratory test and finite element analysis of specimen YZ-1. (a) Δ = 10 mm; (b) Δ = 23 mm; (c) Δ = 92 mm; (d) crack distribution of specimen YZ-1 from the laboratory test.

Figure 6.
Comparison of results of the laboratory test and finite element analysis of specimen YZ-2. (a) Δ = 5 mm; (b) Δ = 18 mm; (c) Δ = 90 mm; (d) crack distribution of specimen YZ-2 from the laboratory test.
4.2. Load–Displacement Curve
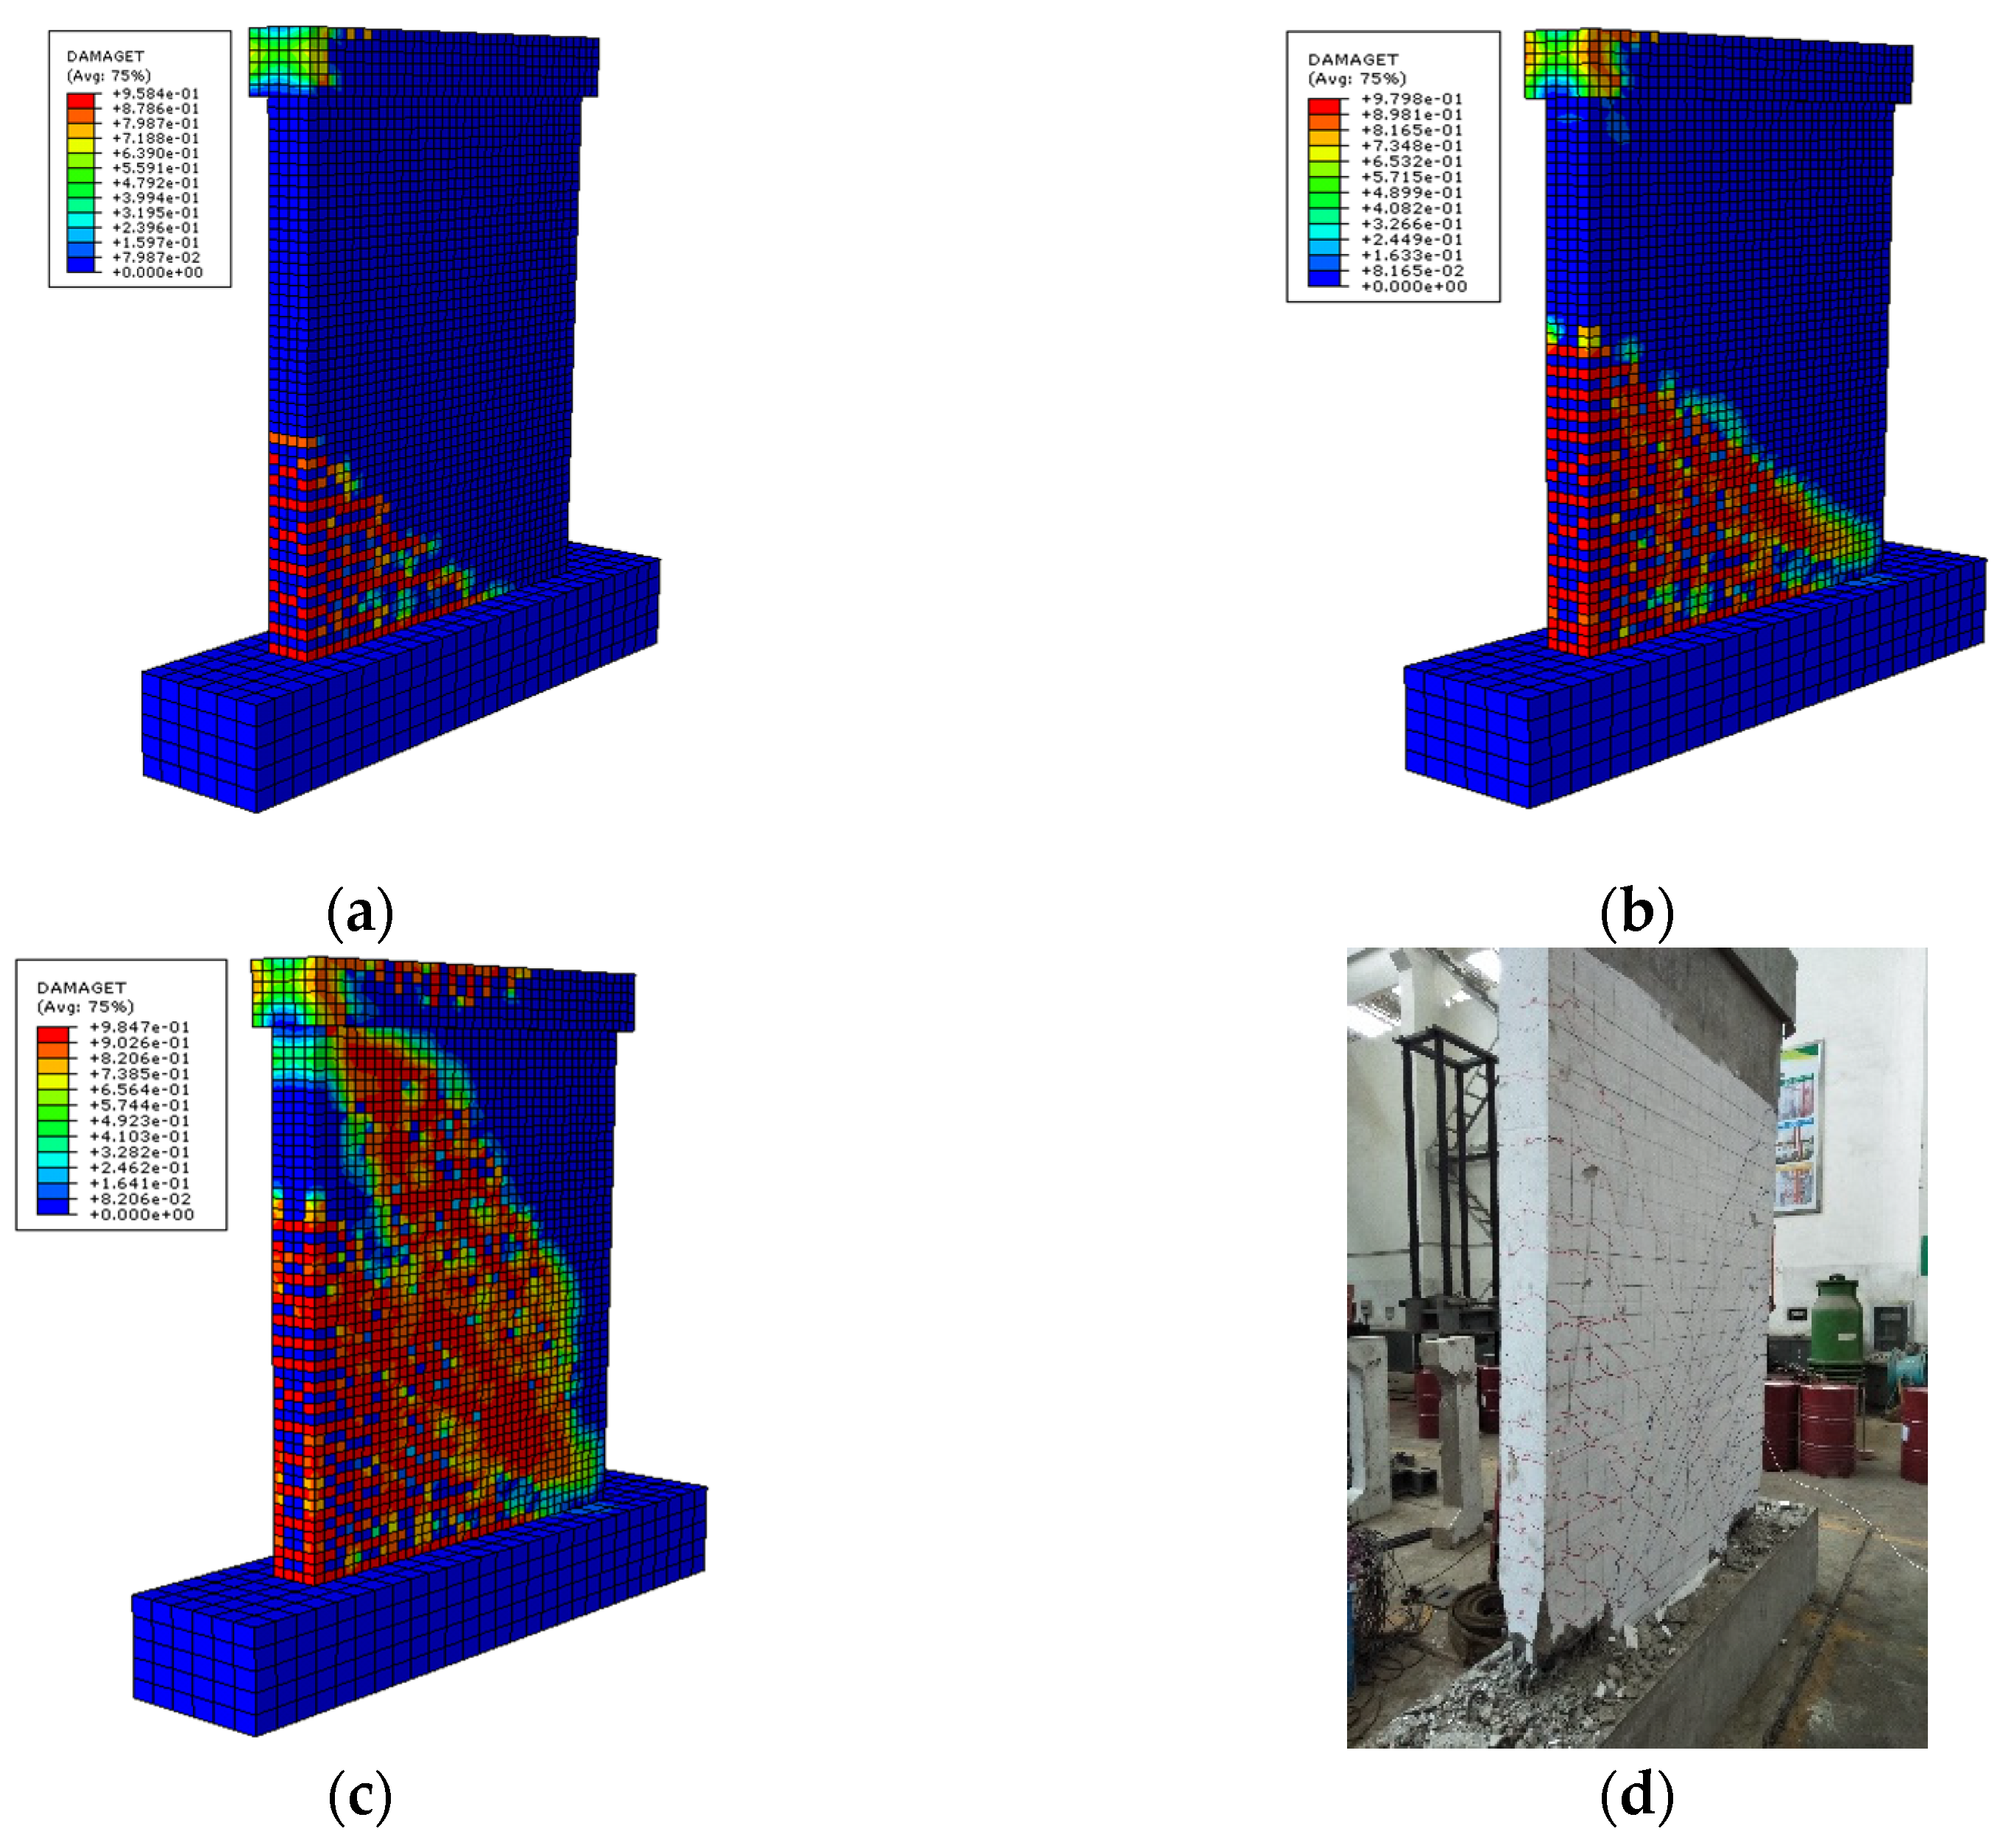
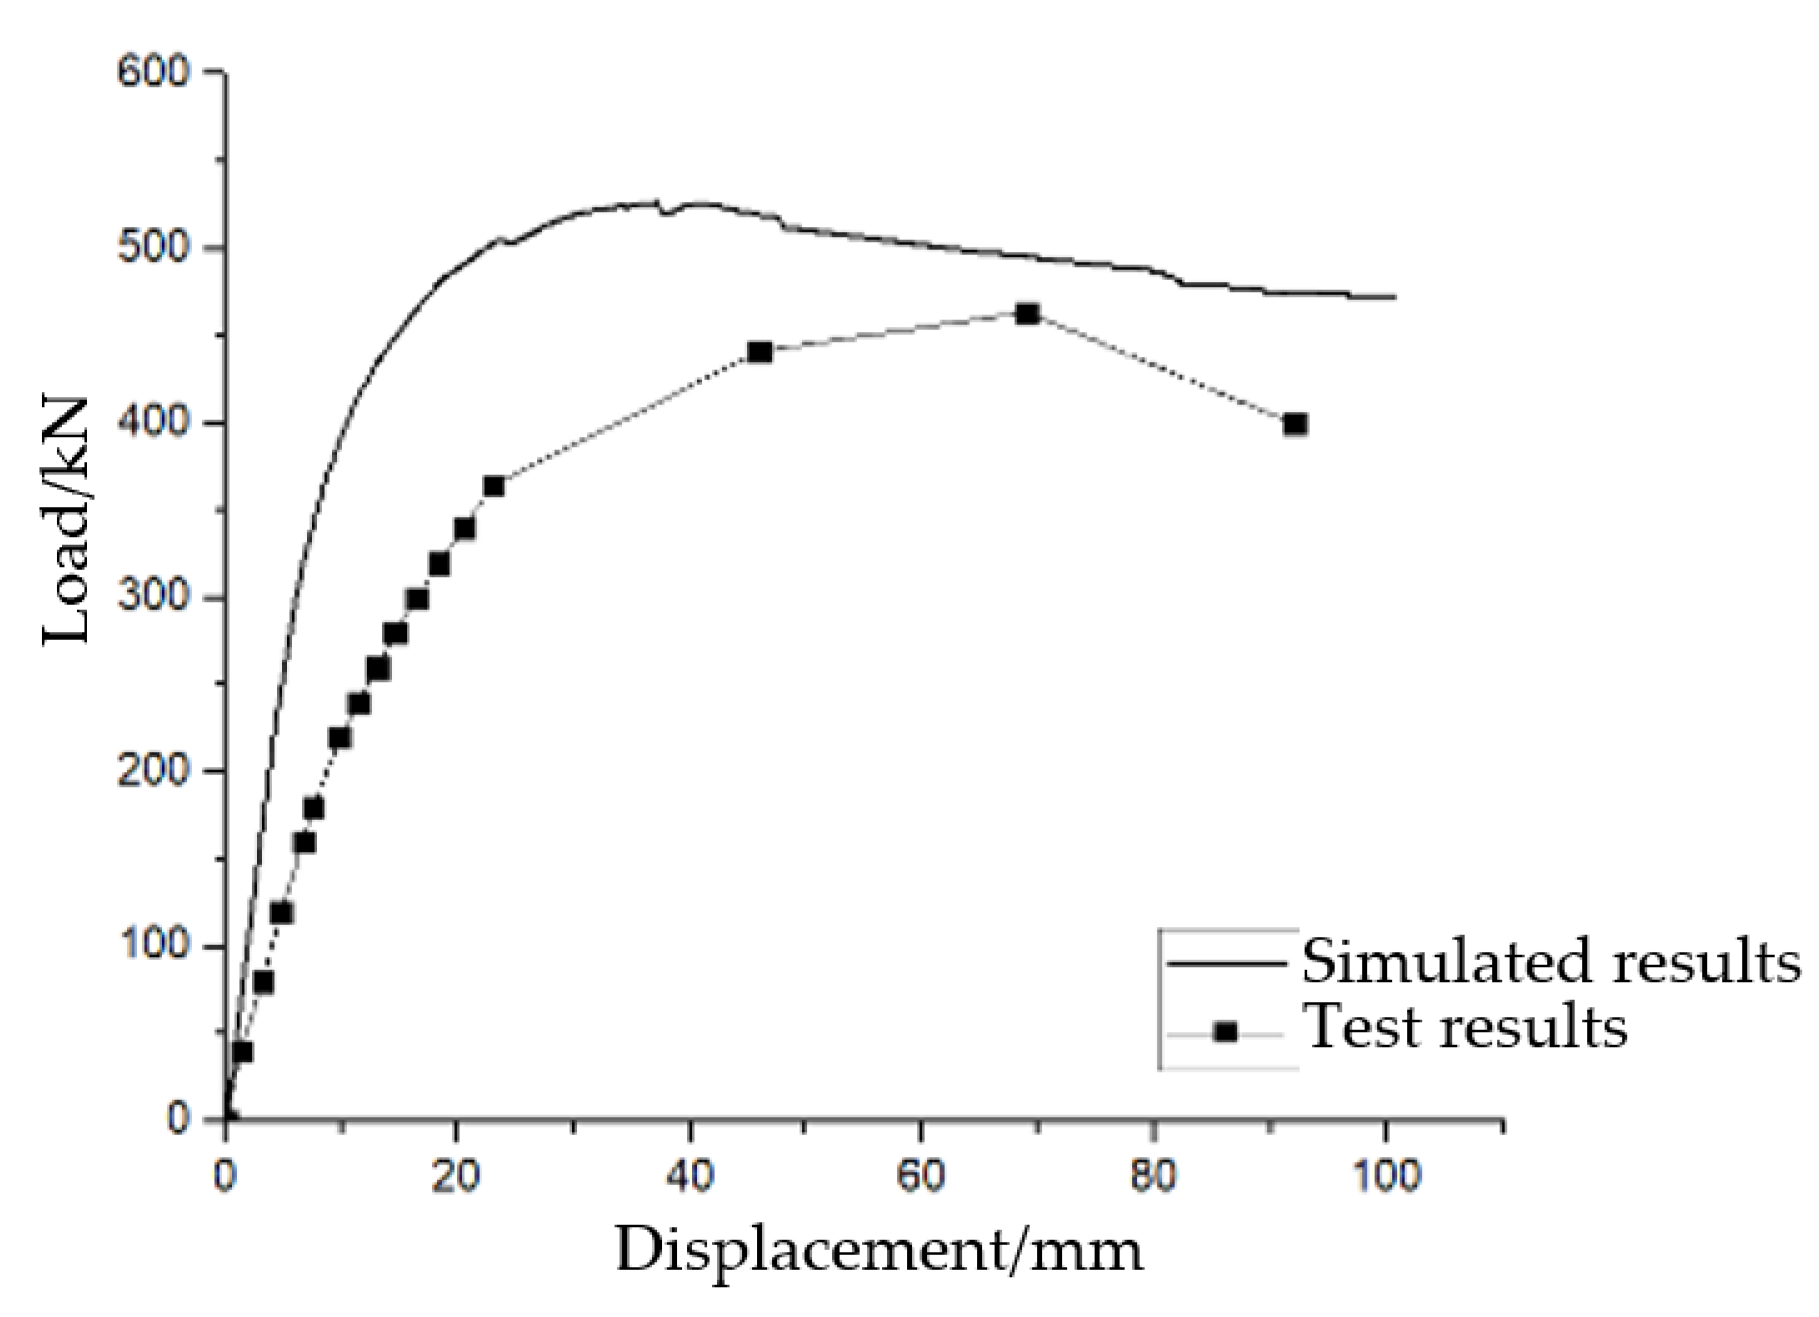
In Figure 7, we compare the load–displacement curves obtained from laboratory tests and finite element analyses for specimen YZ-1. The solid line denotes the finite element analysis results, while the dashed line represents the experimental data. The close alignment of these curves demonstrates the accuracy of our numerical model in capturing the structural behavior under unidirectional loading conditions. This validation is crucial for ensuring the reliability of our simulation results when applied to other scenarios.

Figure 7.
Comparison of the load–displacement curves for specimen YZ-1 under unidirectional loading conditions.
The development pattern of the load–displacement curve obtained from the finite element simulation was consistent with that from the laboratory test, and consists of a rising stage, a yielding stage, and a falling stage. The initial loading was in the elastic stage. After the specimen yielded, the load growth rate decreased. After reaching the peak load, it began to enter the declining stage. During the loading process, the finite element simulation values were consistently slightly larger than the experimental ones. This is because the bond slip between steel bars and concrete was ignored during the finite element simulation process. The yield displacement of the skeleton curve obtained from the test was larger than the finite element simulation results. For specimen YZ-1, the peak load difference between these two was 11.93%. For specimen YZ-2, the peak load difference between these two was 10.73%. This is consistent with that mentioned in the literature [24].
5. Finite Element Model Analysis under Different Axial Pressure Ratios
5.1. Comparison of Development of Cracks
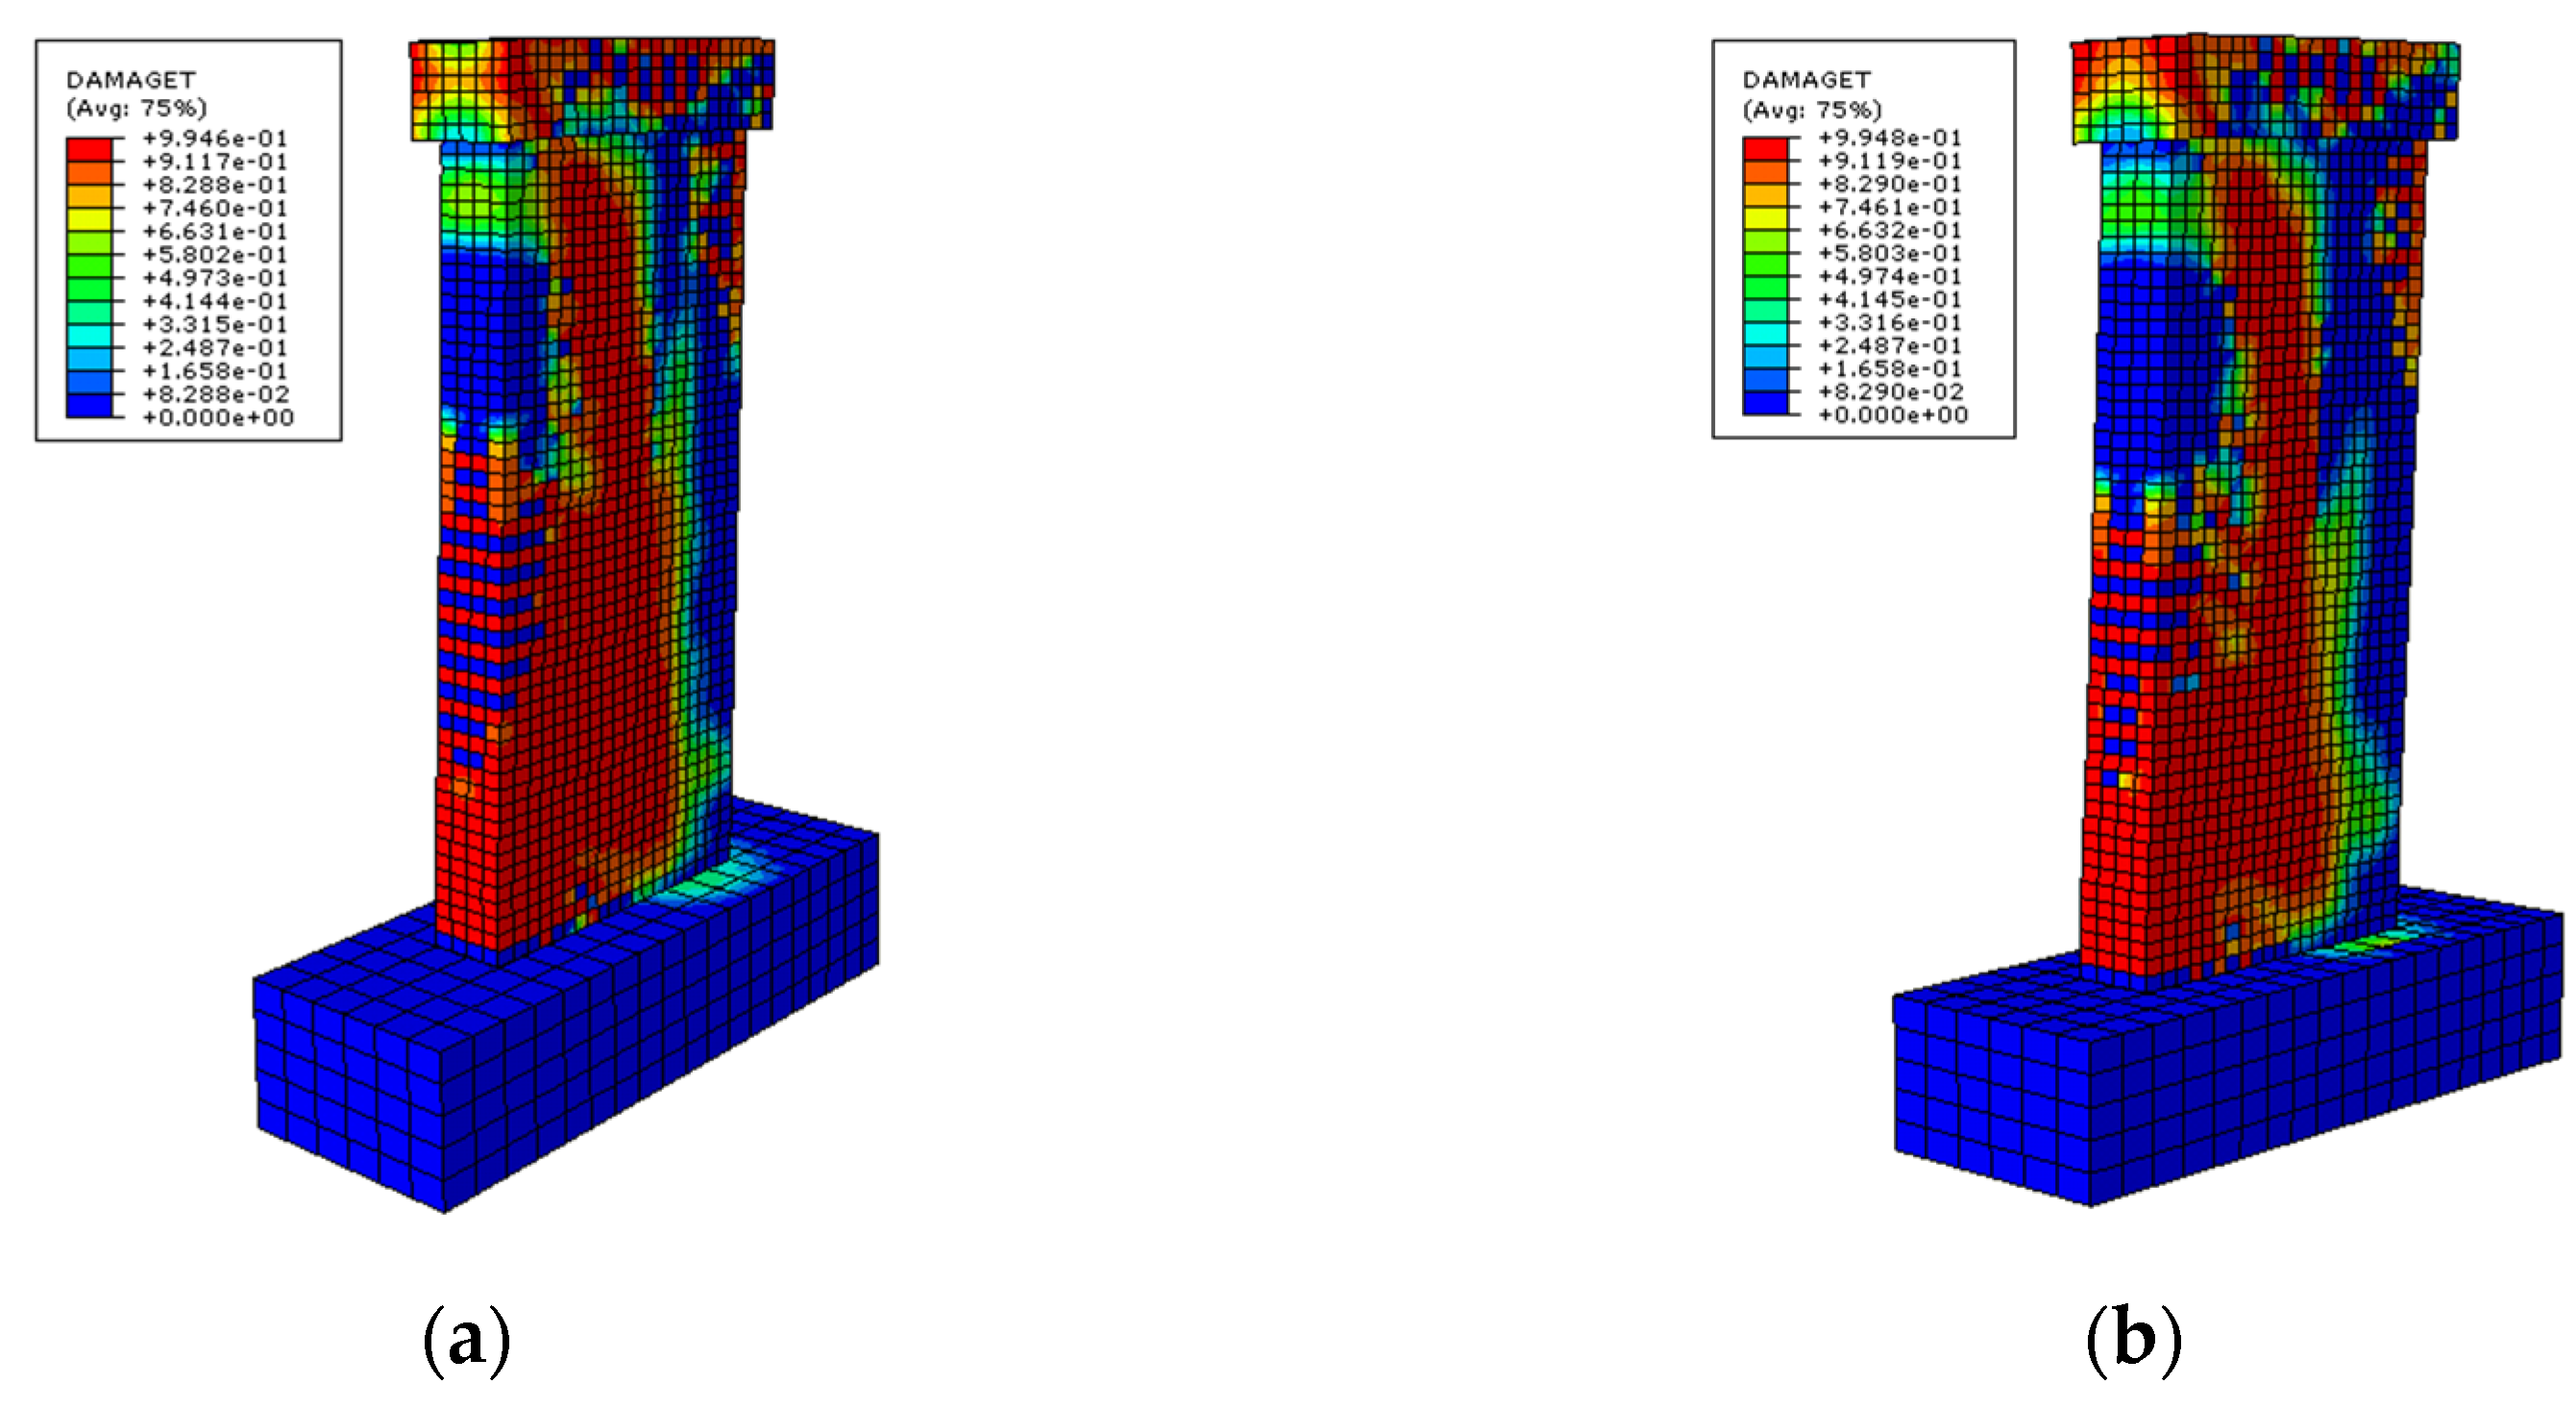
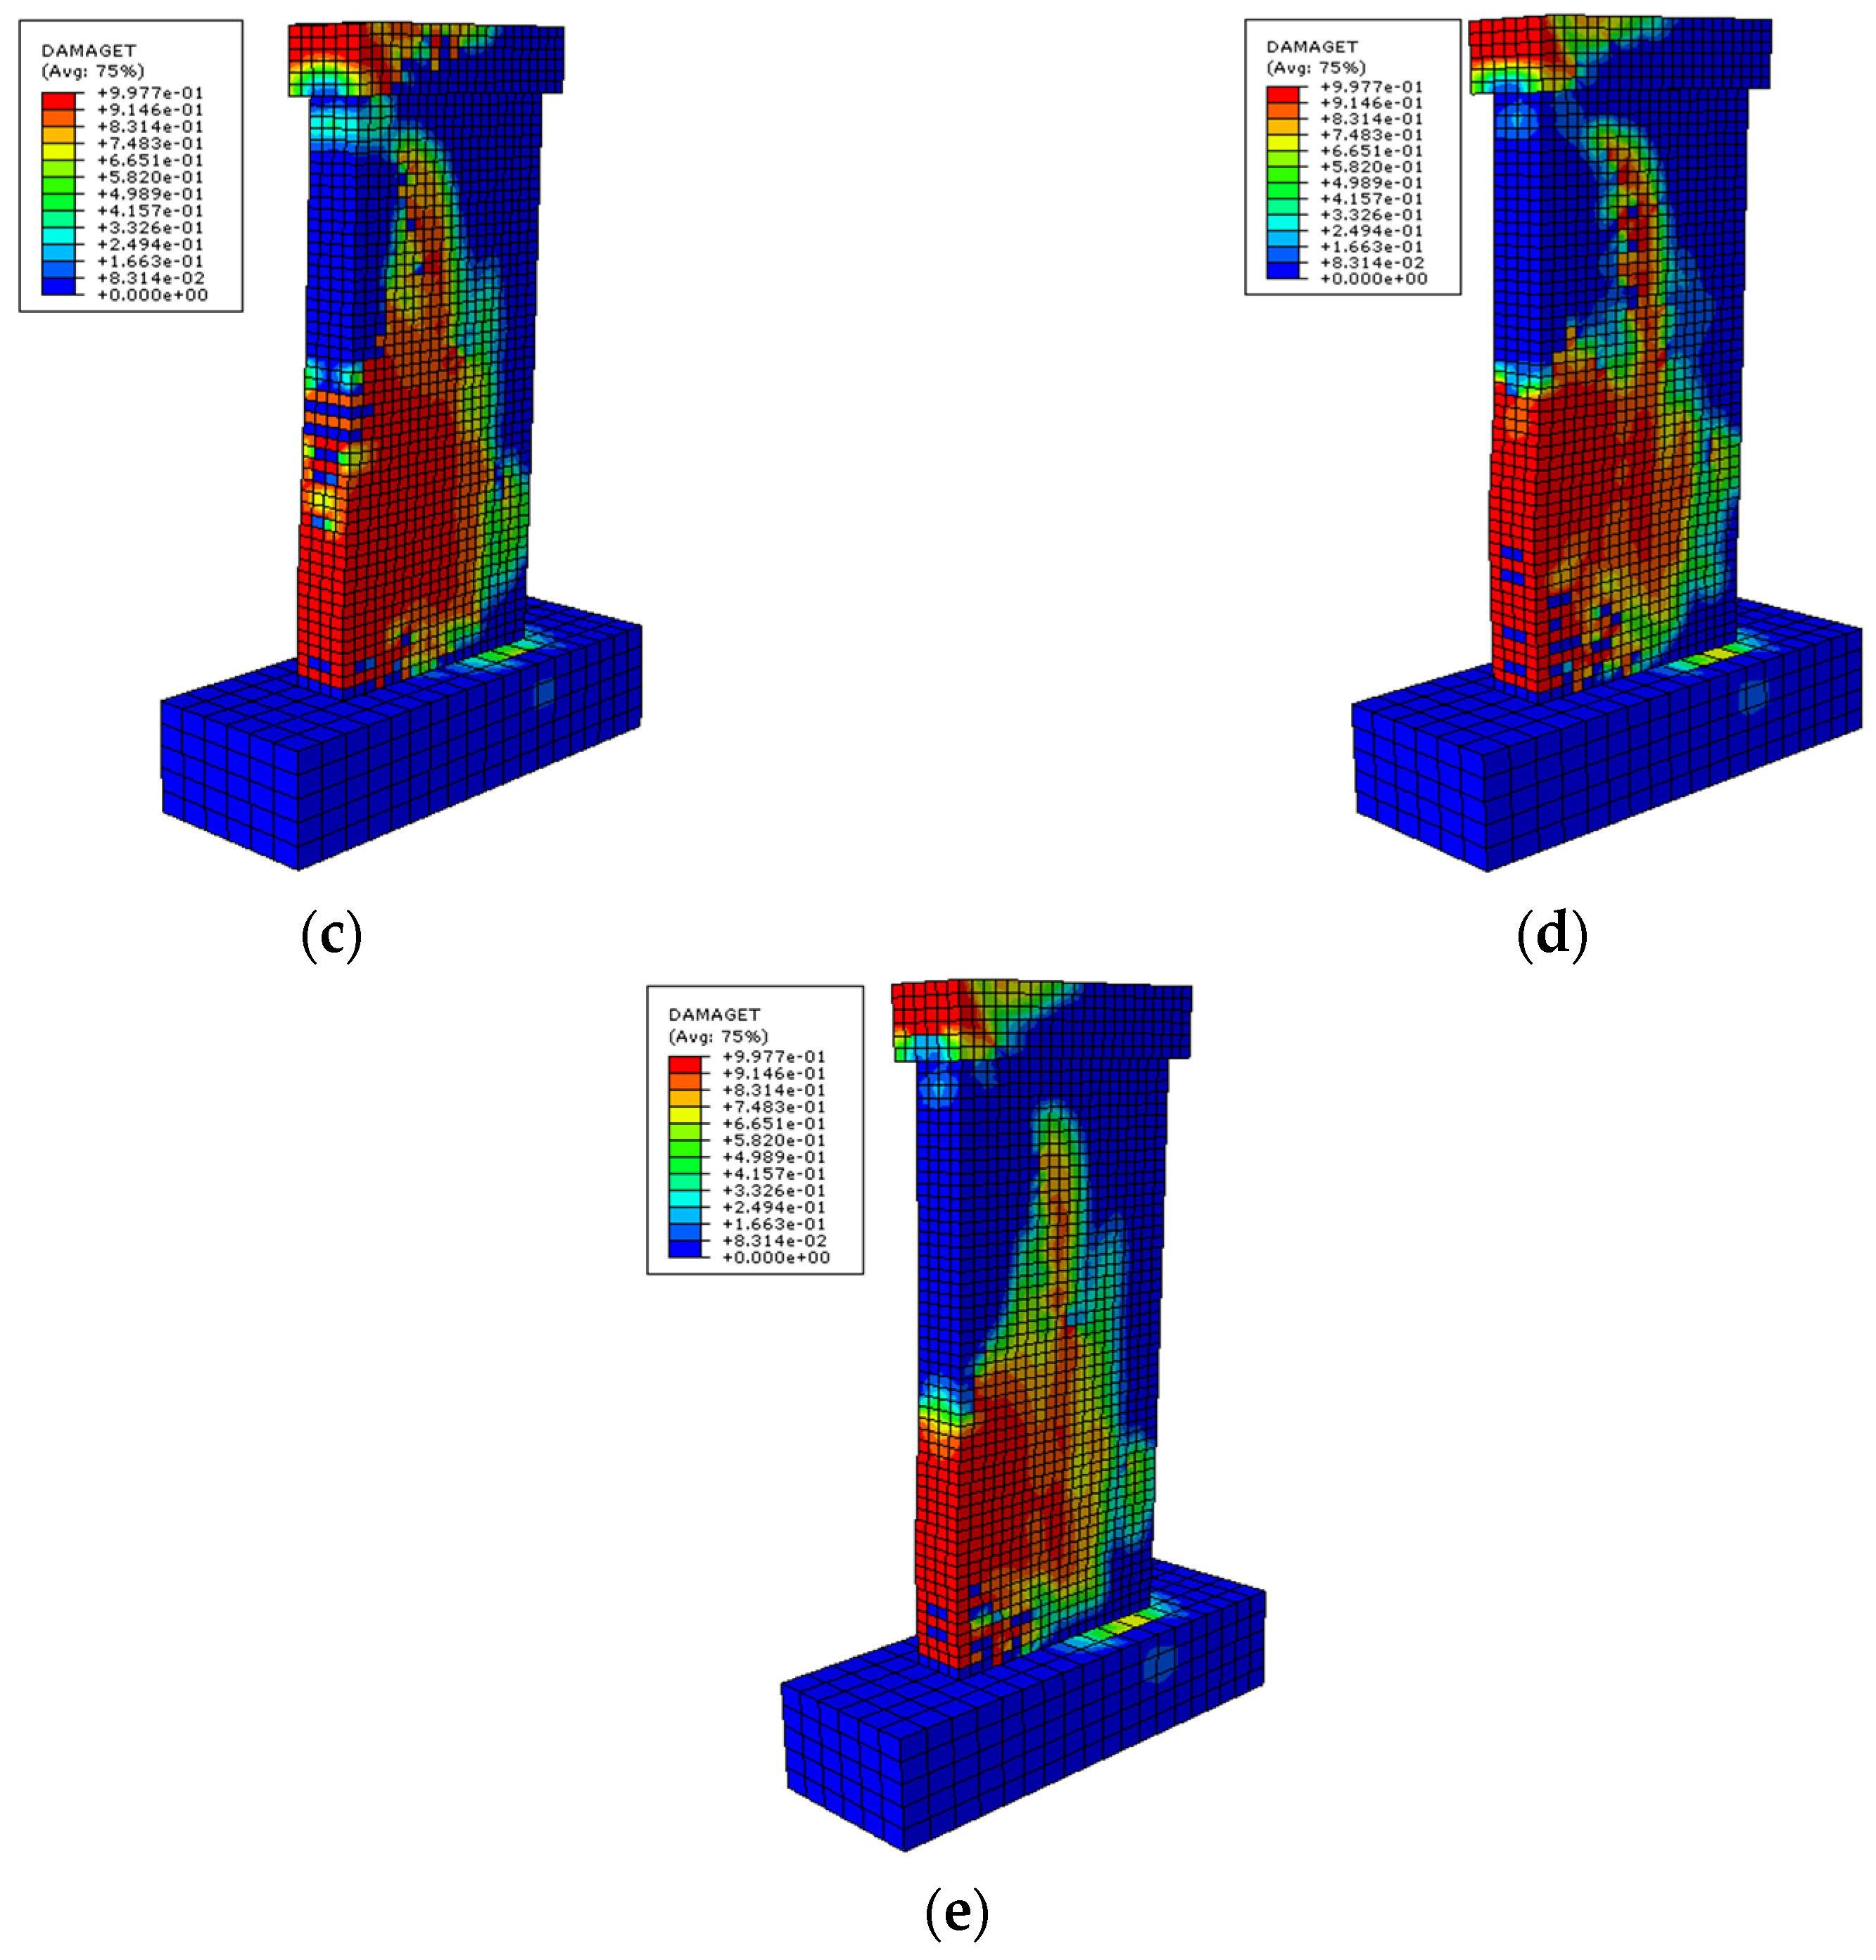
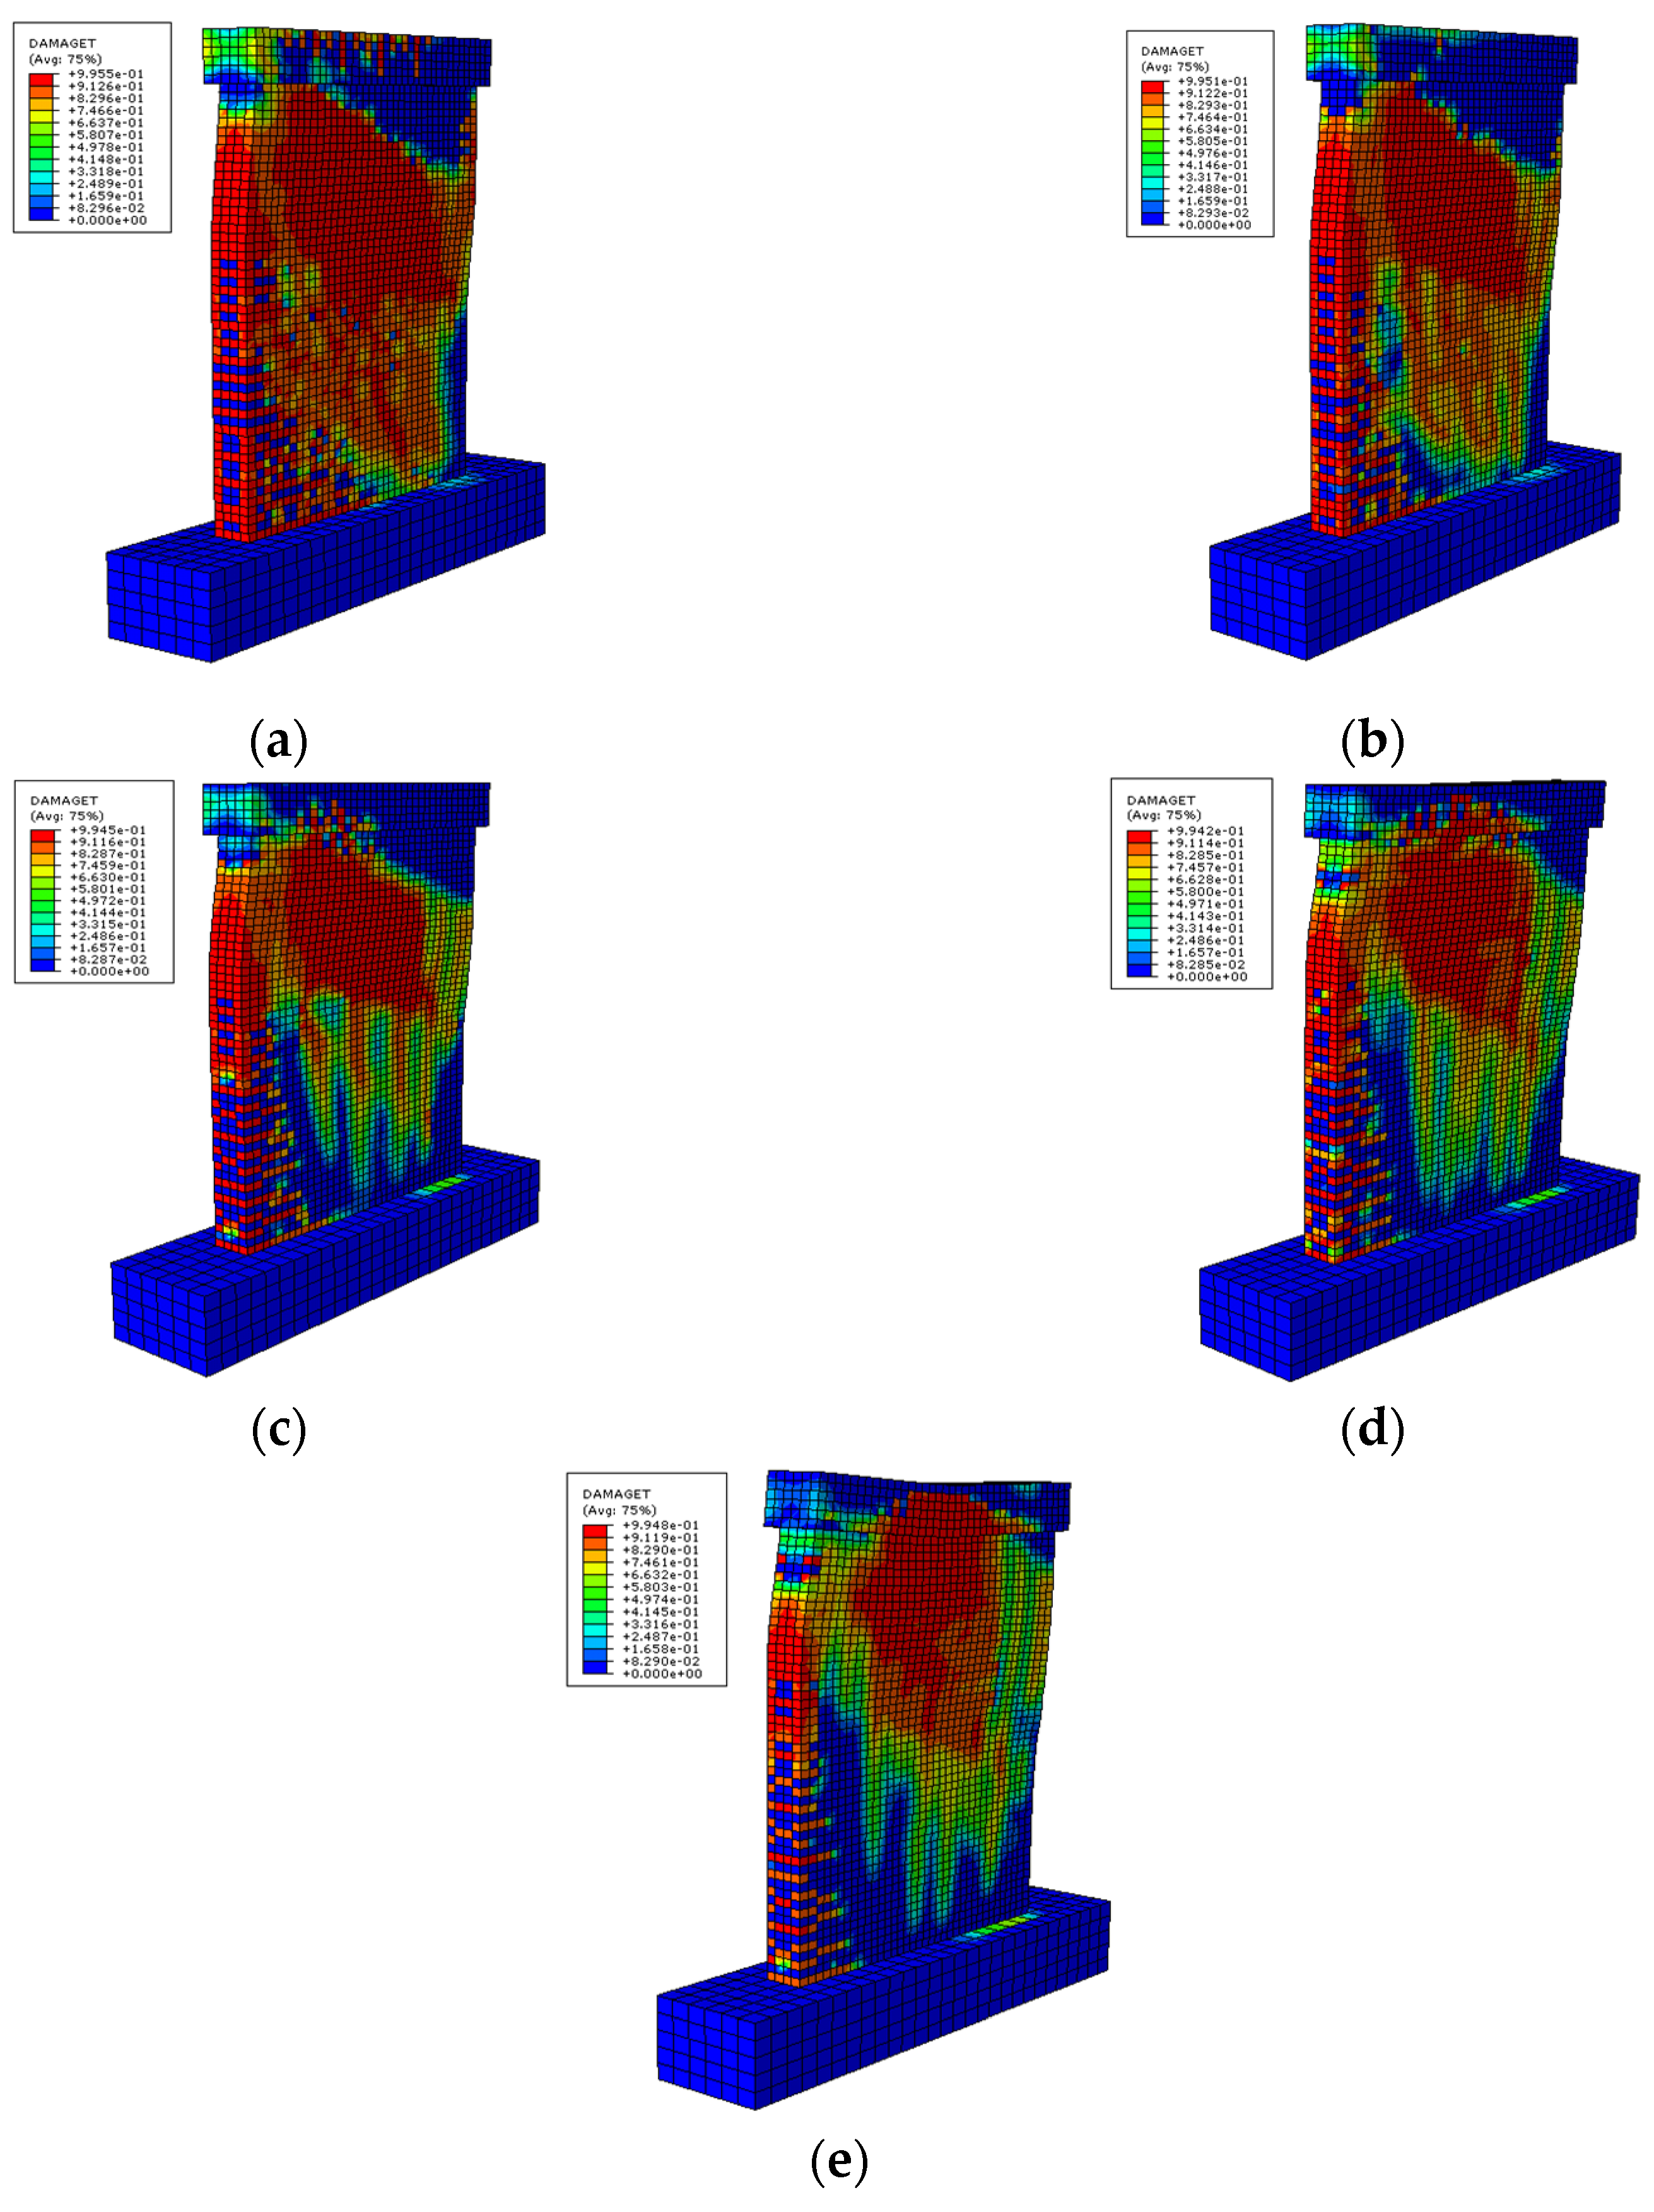
The tensile damage distributions of specimens YZ-1 and YZ-2 under different axial compression ratios are shown in Figure 8 and Figure 9, respectively. It was found that as the axial compression ratio increased, the tensile damage area of the concrete decreased. The crack development height of the concrete in the tension area in the left side of specimen YZ-1 decreased. The crack development range in the tension area in the left side of specimen YZ-2 also shrunk. This indicates that the increase in the axial compression ratio can effectively tame the spread of concrete cracks in the tension zone of precast ordinary shear wall YZ-2.


Figure 8.
The final tensile damage cloud diagram of specimen YZ-1 under different axial compression ratios. (a) n = 0.1; (b) n = 0.2; (c) n = 0.3; (d) n = 0.4; (e) n = 0.5.
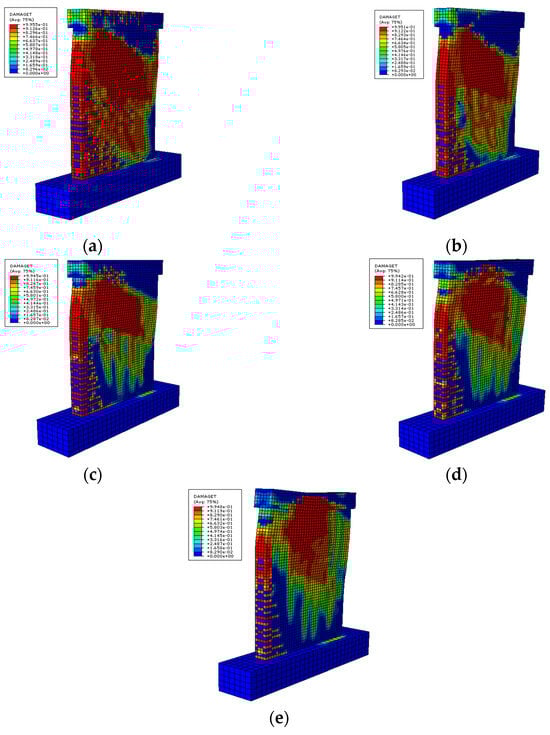
Figure 9.
The final tensile damage cloud diagram of specimen YZ-2 under different axial compression ratios. (a) n = 0.1; (b) n = 0.2; (c) n = 0.3; (d) n = 0.4; (e) n = 0.5.
5.2. Load–Displacement Curve
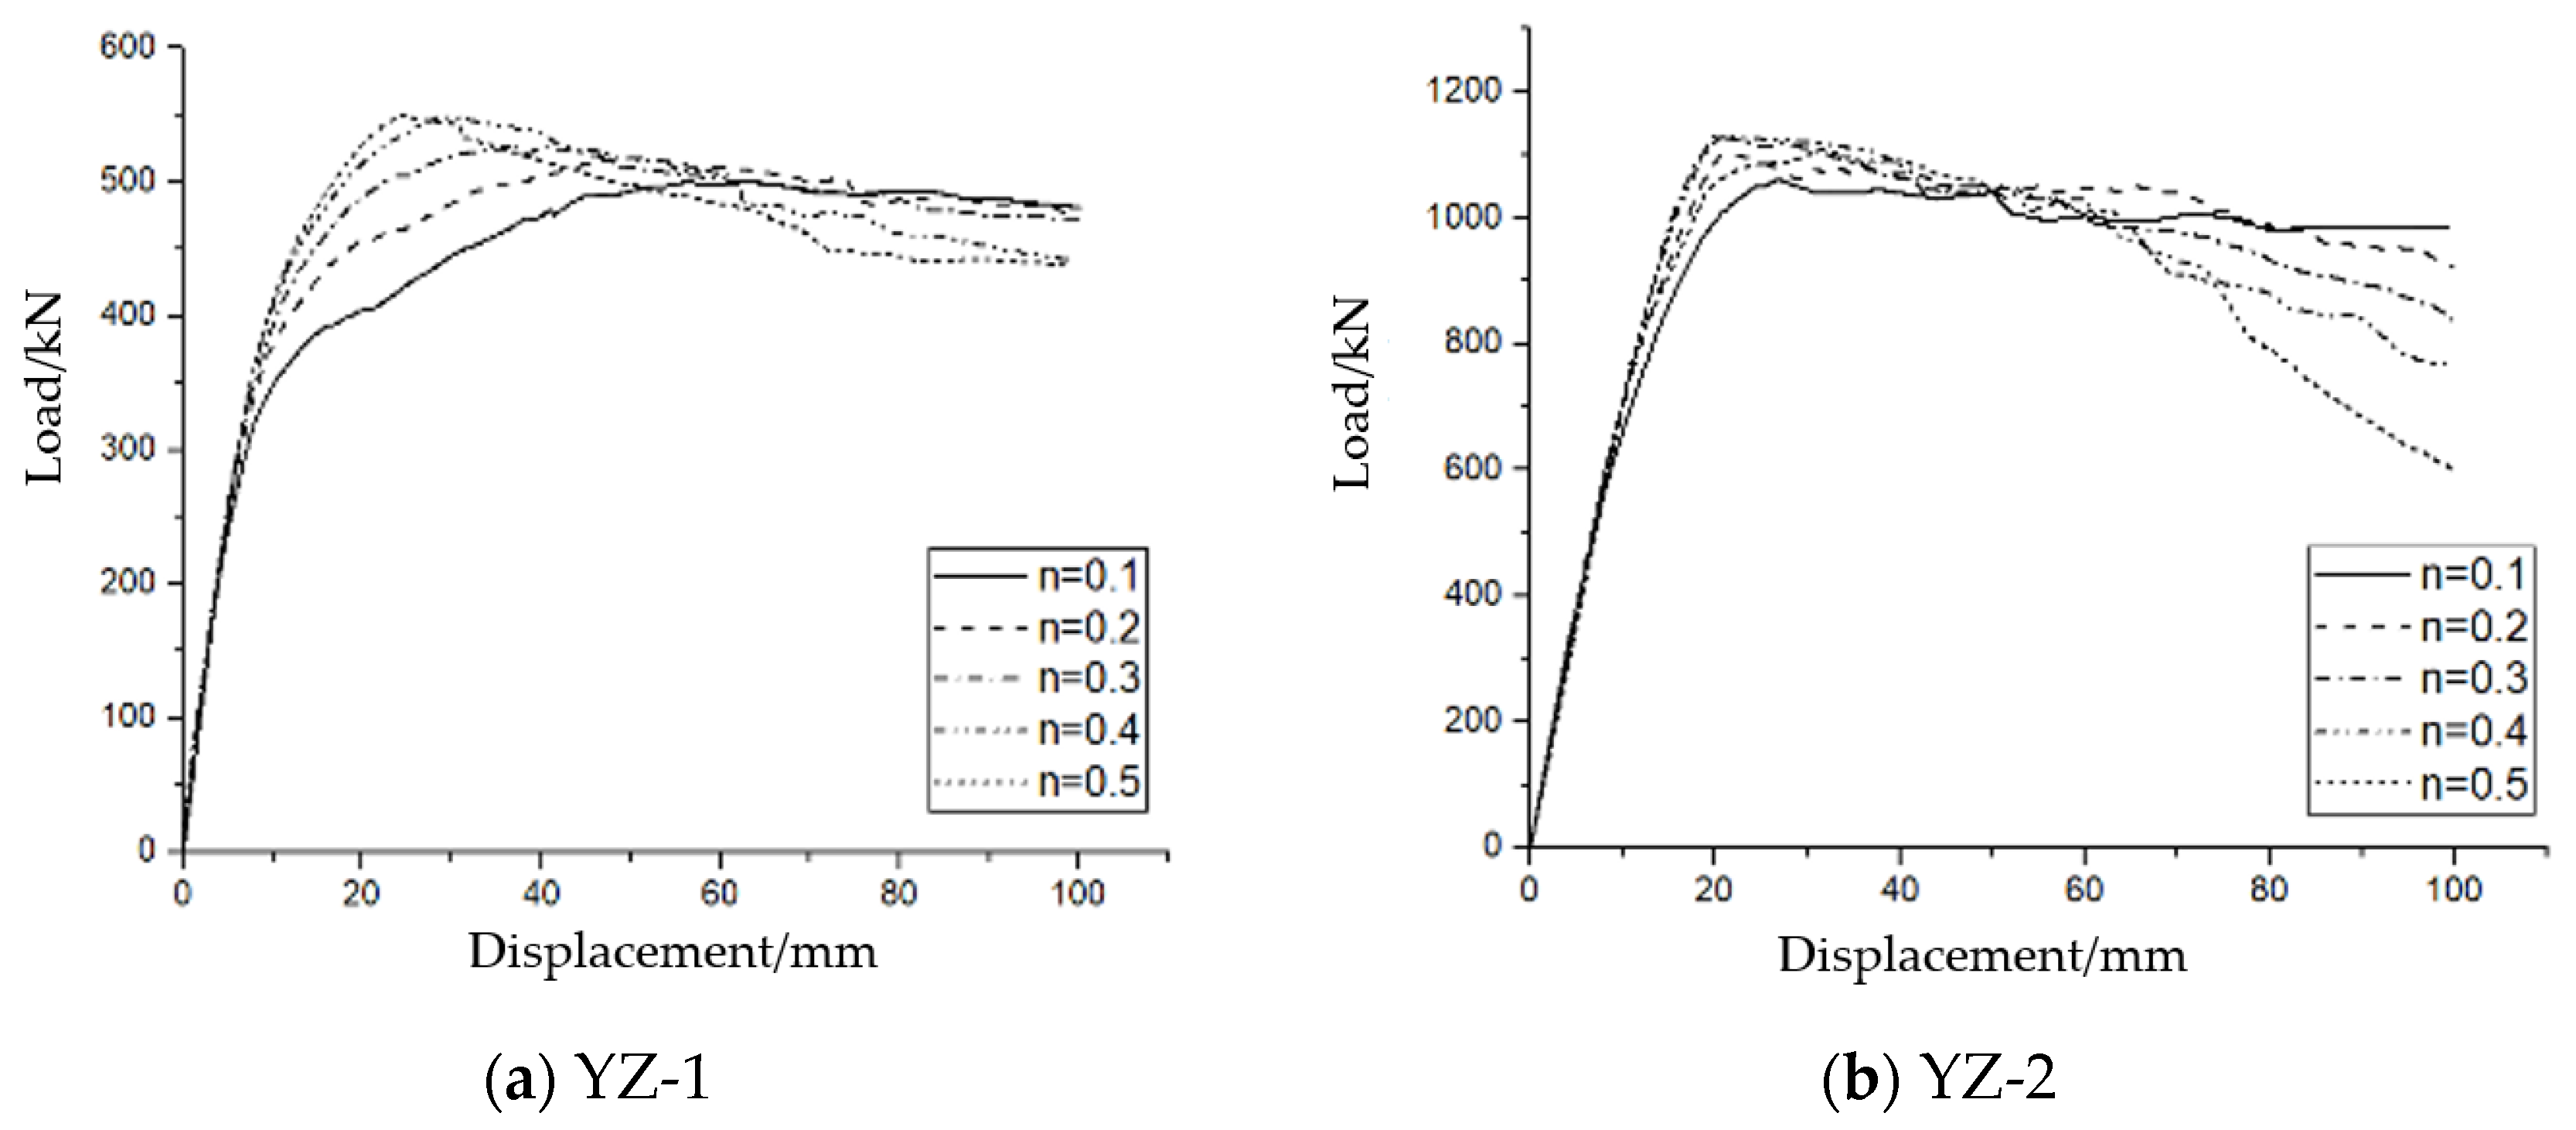
The load–displacement curves of precast short-limb shear wall YZ-1 and precast ordinary shear wall YZ-2 under different axial compression ratios are shown in Figure 10. As shown in this figure, the load–displacement curves of the specimens under different axial compression ratios include elastic sections, yielding sections, and declining sections. The peak load of specimen YZ-1 increased with the increased axial compression ratio. The ultimate load of the specimens decreased as the axial compression ratio grew. A larger axial compression ratio implies a faster decline in the bearing capacity of the specimen in the descending section and more significant stiffness degradation. With the increase in the axial compression ratio, the peak load of specimen YZ-2 first increased and then decreased, yet the ultimate load consistently decreased. In addition, the larger the axial compression ratio is, the faster the load-bearing capacity and stiffness of the specimen decreased in the descending section.
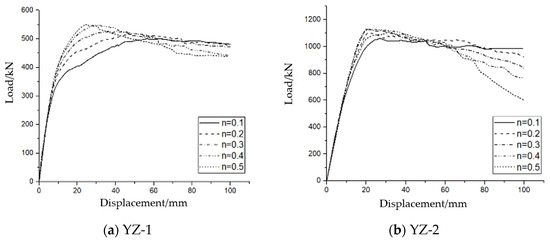
Figure 10.
Comparison of specimen test and finite element load–displacement curves. (a) YZ-1; (b) YZ-2.
The load characteristic values of finite element analyses under different axial compression ratios are shown in Table 3. As shown in this table, the yield load increased with the increase in the axial compression ratio. When the axial compression ratio reached 0.4, the peak load of the specimen tended to be stable. In addition, as the axial compression ratio grew, the difference between the peak load and the ultimate load became more significant, indicating that the strength degradation of the specimen was more serious. For specimen YZ-2, the yield load first increased and then decreased with the increase in the axial compression ratio. The peak load had a similar pattern but with a less obvious change in value.
Table 3.
Load characteristic values of finite element simulation.
6. Conclusions
This paper investigated the feasibility of using cluster connections to assemble an integral shear wall structure within the reinforced part at the bottom of the wall by changing the vertical steel cluster connection structure. The finite element software ABAQUS was employed to conduct numerical simulations of prefabricated components, and the following conclusions can be derived:
The development of cracks in the wall in the numerical analyses was in agreement with the results of experimental works in the laboratory, thereby verifying the numerical models; the comparative analysis of the displacement curve under unidirectional load and the cyclic test skeleton curve showed that the response of the finite element model was consistent with the results of the laboratory tests; for prefabricated short-limb shear walls, as the axial compression ratio increased, the peak load of the specimen increased and became stable when the axial compression ratio reached 0.4. The ultimate load, however, gradually decreased with the increase in the axial compression ratio. Additionally, the strength and stiffness degraded more significantly as the axial compression ratio grew; for precast ordinary shear walls, the yield load of the specimen first increased and then decreased with the increase in the axial compression ratio. The peak load showed a similar pattern. As the axial compression ratio increased, the peak load first increased and then dropped. The ultimate load, however, decreased with the increase in the axial compression ratio. Additionally, the strength and stiffness were undermined by the growth in the axial compression ratio.
While this study demonstrates promising results, some limitations should be acknowledged to provide a comprehensive understanding of the findings:
The numerical models assume the homogeneity and isotropy of the materials, which may not fully capture the real-world variability of the materials. Future studies could incorporate more detailed material properties to enhance model accuracy; the bond slip between steel reinforcement and concrete was not considered in the simulations, which may lead to an overestimation of load-bearing capacity and stiffness. Including bond-slip effects in future models would provide a more realistic representation; simplified boundary conditions and loading methods were used to replicate laboratory conditions. Real-world applications should consider additional factors such as construction imperfections and environmental effects. These limitations do not undermine the significance of the findings but rather suggest areas for further refinement and validation. This study provides a solid foundation for the application of improved cluster connection methods in prefabricated shear wall structures, highlighting their potential for enhanced seismic performance and construction efficiency. Future research should build upon these findings to further optimize and validate the models, ensuring broader applicability and robustness in practical scenarios.
Author Contributions
Conceptualization, S.L., J.C. and G.D.; Methodology, Z.H., H.Y., J.C., R.Z. and G.D.; Software, X.Z.; Validation, Z.H. and A.S.; Formal analysis, X.Z. and R.Z.; Investigation, H.Y.; Resources, S.L.; Data curation, Z.H.; Writing—original draft, Z.H., X.Z., H.Y., S.L., J.C., A.S., R.Z. and G.D.; Writing—review & editing, J.C., A.S. and G.D.; Supervision, G.D. All authors have read and agreed to the published version of the manuscript.
Funding
This research was funded by China Green Development Investment Group Co., Ltd., Research and Pilot Application Project of High Proportion Prefabricated Building Technology System, 529000210008.
Data Availability Statement
Data is contained within the article.
Conflicts of Interest
Authors Zirui He, Xiaohan Zhang and Shuai Li were employed by the company China Green Development Investment Group Co., Ltd. The remaining authors declare that the research was conducted in the absence of any commercial or financial relationships that could be construed as a potential conflict of interest.
References
- Zhu, F.; Yu, Y.; Wang, Z.; Shi, G.; Liu, H. Experimental Study on Seismic Behavior of Monolithic Precast Double-Skin Composite Shear Wall. J. Build. Struct. 2023, 44, 146. [Google Scholar]
- Xu, G.; Wang, Z.; Wu, B.; Bursi, O.S.; Tan, X.; Yang, Q.; Wen, L. Seismic performance of precast shear wall with sleeves connection based on experimental and numerical studies. Eng. Struct. 2017, 150, 346–358. [Google Scholar] [CrossRef]
- Lee, D.; Kang, S.M. Safe Seismic Design of Intermediate Precast Shear Wall System. J. Struct. Eng. 2024, 150, 04024101. [Google Scholar] [CrossRef]
- Sørensen, J.H.; Hoang, L.C.; Poulsen, P.N. Full-scale tests of two-story precast reinforced concrete shear walls: Investigation of strength and deformation capacity. Eng. Struct. 2024, 315, 118487. [Google Scholar] [CrossRef]
- Xiao, M.; Han, W.; Lü, W.; Wang, Z.; Li, W.; Li, L. Experimental study on seismic performance of multi-story prefabricated shear wall. J. Build. Struct. 2023, 44, 32–45. [Google Scholar]
- Liu, C.; Zhang, F.; Zhang, H. Comparative analysis of off-site precast concrete and cast-in-place concrete in low-carbon built environment. Fresenius Environ. Bull. 2020, 29, 1804–1812. [Google Scholar]
- Kulkarni, V.R. High performance concrete for high-rise buildings: Some crucial issues. Int. J. Res. Eng. Technol. 2016, 5, 26–33. [Google Scholar]
- Yang, B.; Liu, B.; Xiao, J.; Zhang, B.; Wang, Z.; Dong, M. A novel construction scheduling framework for a mixed construction process of precast components and cast-in-place parts in prefabricated buildings. J. Build. Eng. 2021, 43, 103181. [Google Scholar] [CrossRef]
- Ozkul, T.A.; Kurtbeyoglu, A.; Borekci, M.; Zengin, B.; Kocak, A. Effect of shear wall on seismic performance of RC frame buildings. Eng. Fail. Anal. 2019, 100, 60–75. [Google Scholar] [CrossRef]
- Surana, M.; Singh, Y.; Lang, D.H. Seismic performance of shear-wall and shear-wall core buildings designed for Indian codes. In Advances in Structural Engineering: Dynamics; Springer: New Delhi, India, 2015; Volume 2, pp. 1229–1241. [Google Scholar]
- Zhao, B.; Wu, D.; Zhu, H. New modular precast composite shear wall structural system and experimental study on its seismic performance. Eng. Struct. 2022, 264, 114381. [Google Scholar] [CrossRef]
- Singhal, S.; Chourasia, A.; Chellappa, S.; Parashar, J. Precast reinforced concrete shear walls: State of the art review. Struct. Concr. 2019, 20, 886–898. [Google Scholar] [CrossRef]
- Zhang, J.; Hou, H.; Dong, N.; Gong, J.; Guo, Z. Design and Application of Assembly Integral Shear Wall Residence with Prefabricated Reinforced Concrete. Constr. Technol. 2009, 38, 22–24. [Google Scholar]
- Chen, Y. Research on industrialized fully-prefabricated assembly integral shear wall structure system nodes. Archit. Technol. 2010, 41, 153–156. [Google Scholar]
- Zhang, J.Q. Experimental Research on Seismic Behavior of Full-Scale Precast Shear Wall Sub-Structure; Harbin Institute of Technology: Harbin, China, 2010. [Google Scholar]
- Liu, X.; Guo, Z.; Dong, N.; Zhang, J. Experimental Research on Behavior of Joints of Fully Precast Assembled Shear Wall Structure. Jiangsu Constr. 2010, 2, 21–24. [Google Scholar]
- Zhu, Z.; Guo, Z. Seismic Performance Research Wall-Slab Joints of New Precast Concrete Shear Wall Structure. Earthq. Eng. Eng. Vib. 2011, 31, 35–40. [Google Scholar]
- Pan, L.D.; Lu, L.; Liang, L.; Li, J.B. Test and Study on shearing strength of precast laminated wall. In Proceedings of the Eighteenth National Conference on Structural Engineering, Guangzhou, China, 28 November–1 December 2009; Volume 2, pp. 124–126. [Google Scholar]
- Jafari, A.; Beheshti, M.; Shahmansouri, A.A.; Bengar, H.A. Cyclic response and damage status of coupled and hybrid-coupled shear walls. Structures 2024, 61, 106010. [Google Scholar] [CrossRef]
- Feng, J.; Chen, Y.; Zhang, Z. A New Type of Prefabricated Integral Shear Wall. CN102943536B, 16 September 2015. [Google Scholar]
- Feng, J.; Liu, Y.F.; Jin, R.Y.; Chen, Y.; Pang, T.; Cai, J.G.; Liu, L.X. Prefabricated Shear Wall Vertical Steel Bar Concentrated Restraint Lap Connection. CN104929279B, 24 May 2017. [Google Scholar]
- Zhang, Z. Shear Mechanism Analysis of Prefabricated Concrete Shear Wall. Master’s Thesis, Southeast University, Nanjing, China, 2012. [Google Scholar]
- Liu, G. Experimental Study on Seismic Behavior of Bundle Connected Precast Concrete Shear Wall Structures. Master’s Thesis, Southeast University, Nanjing, China, 2018. [Google Scholar]
- Guo, Z.H. Principles of Reinforced Concrete, 3rd ed.; Tsinghua University Press: Beijing, China, 2012. [Google Scholar]
Disclaimer/Publisher’s Note: The statements, opinions and data contained in all publications are solely those of the individual author(s) and contributor(s) and not of MDPI and/or the editor(s). MDPI and/or the editor(s) disclaim responsibility for any injury to people or property resulting from any ideas, methods, instructions or products referred to in the content. |
© 2024 by the authors. Licensee MDPI, Basel, Switzerland. This article is an open access article distributed under the terms and conditions of the Creative Commons Attribution (CC BY) license (https://creativecommons.org/licenses/by/4.0/).