Article

FBG Sensing Data Motivated Dynamic Feature Assessment of the Complicated CFRP Antenna Beam under Various Vibration Modes

1
School of Civil Engineering and Mechanics, Lanzhou University, Lanzhou 730000, China
2
CRRC Zhuzhou Locomotive Co., Ltd., Zhuzhou 412001, China
3
Key Laboratory of Special Functional Materials and Structural Design, Ministry of Education, Lanzhou University, Lanzhou 730000, China
*
Author to whom correspondence should be addressed.
Buildings 2024, 14(7), 2249; https://doi.org/10.3390/buildings14072249
Submission received: 5 June 2024 / Revised: 9 July 2024 / Accepted: 13 July 2024 / Published: 22 July 2024
(This article belongs to the Special Issue Recent Developments in Structural Health Monitoring)

Abstract

:
Carbon fiber-reinforced polymer (CFRP) components were extensively used and current studies mainly refer to CFRP laminates. The dynamic performance of the complicated CFRP antenna beams is yet to be explored. Therefore, a sensor layout based on fiber Bragg gratings (FBGs) in series was designed to measure the dynamic response of the CFRP antenna beam, and various vibration tests (sweep frequency test, simulated long-life vibration test, shock vibration test, functional vibration test, and constant frequency vibration test) were conducted. The time and frequency domain analysis on FBG sensing signals was performed to check the vibration performance and assess the health condition of this novel CFRP structure. The results indicate that strain values reach a maximum of only 300 µε under different test conditions. The antenna beam exhibited clear vibration patterns, with the first four intrinsic frequencies identified at 44, 94.87, 107.1, and 193.45 Hz. It shows that strain distribution and vibration modes of the antenna beam can be characterized from the sensing data, and the dynamic feature can be much more accurately assessed. The FBG sensors attached on the surface of CFRP antenna beam can accurately and stably measure the dynamic response, which validates that the interfaces between optical fiber sensing elements and CFRP material have excellent interfacial bonding characteristics. The novel CFRP antenna beam exhibits the excellent dynamic performance and stability, offering the replacement of traditional steel antenna beams. The study can finally instruct the development of self-sensing CFRP antenna beams assembled with FBGs in series.

1. Introduction

With the development of high-speed and heavy-duty rail transit vehicles, research on vehicle light-weighting became an important issue that must be solved. Considering the advantages of designability and easy overall manufacturing of carbon fiber-reinforced polymer (CFRP) with excellent characteristics such as high strength, light weight, and corrosion resistance, this study explores the feasibility of replacing traditional metal antenna beam structures with a new lightweight and high-performance CFRP automatic traffic control (ATC) antenna beam structures. Compared to other synthetic fiber composites and traditional metal, CFRP offers higher tensile strength and stiffness, which are crucial for maintaining structural integrity under dynamic loading conditions [1,2]. In terms of cost, while CFRP composites are generally more expensive than traditional metal structures, the long-term benefits, including reduced maintenance, extended service life, and improved performance, often justify the initial investment. The overall cost-effectiveness of CFRP composites becomes apparent when considering the lifecycle costs and the performance advantages they offer. The antenna beam is installed on the front bogie of the high-speed train, and its two ends are fixed to the end of the bogie by bolts. There is an antenna support in the middle for fixing the antenna device of the on-board signal system of the high-speed train. The antenna beam includes cross beams and auxiliary mounting seats, and its structural stability and reliability directly affect the safe operation of the train. During track operation, affected by uneven lines and out-of-round wheels, the response displacement of the antenna beam structure is too large and fatigue fracture may occur, thus affecting the on-board signal system. Therefore, the structural response of the CFRP antenna beam structure during actual loading and trial operation and its impact on the operation of the bogie and vehicle require in situ monitoring technology to obtain relevant information. In order to test the static and dynamic characteristics of this new type of antenna beam and conduct feasibility research for its promotion and application in the lightweight development of rail transit equipment, it is planned to use fiber Bragg gratings (FBG) sensors to continuously monitor the state of the CFRP antenna beam structure in real time during foundation testing and vehicle operation [3,4,5]. This research aims to promote the development of intelligent online monitoring technology for self-sensing CFRP antenna beams based on optical fiber sensing technology, thereby serving for the intelligence and informatization of locomotive structures.
Extensive attention was paid to monitoring the dynamic characteristics and realizing the pattern recognition of CFRP structures under different loading conditions in the academic and engineering fields. Considerable effort was devoted to the topic with correlated research published [6,7,8,9,10,11]. The earliest study originated from the use of strain gauges to detect the strain of CFRP pipes and shells with the localized flexibility method to identify the inner damage in 2001 [3]. Melo and Radford [12] used dynamic mechanical analysis equipment to study the viscoelastic properties of CFRP specimens dependent of temperature and frequency. Tsuda [13] explored the damage location of CFRP laminates subjected to the impact load by using the FBG sensors for ultrasonic inspection. Fu et al. [14] gave a preliminary study on the sensing performance of optical fiber acoustic emission sensors embedded in CFRP laminates for detecting the elastic wave released from the structural damage. Luyckx et al. [15] explored the strain transfer effect of CFRP laminates embedded with FBGs with experimental tests, with some formulas given. Panopoulou et al. [16] used the long-gauge FBG to monitor the dynamic response of CFRP honeycomb panels and identified the damage state by using artificial neural network and wavelet transform. Wu et al. [17] explored the efficiency of phase-shifted FBG sensors for detecting acoustic emission from various damages in CFRPs. Lu et al. [18] identified the damage positions of CFRP laminates by using principal component analysis on the data measured by FBG sensors. Wang et al. [19,20] developed a monitoring method combined with and structural theory and strain transfer analysis to characterize the interfacial debonding of CFRP reinforced steel structures based on FBGs in series. Goossens et al. [21] conducted the impact damage detection of aerospace-grade CFRP laminates based on FBG sensors. Budadin et al. [22] investigated the strain and temperature reflection method of CFRP laminates integrated with FBG sensors for deformation assessment. Wang et al. [23] and Chen et al. [24] discussed the strain field configuration method for online quick recognition of large deformation and damage in CFRP laminates under static and dynamic loads based on FBG sensing signals. Additionally, a few studies on the dynamic analysis of CFRP structures were also performed based on other testing techniques. Alarifi [25] gave a detailed review on the conductivity research of CFRP materials under dynamic load and static load. Wei et al. [26] measured the dynamic performance of FRP footbridges and showed that FRP footbridges had a higher damping ratio. Barile [27] and Sikdar et al. [28,29] explored the mechanical properties and damage condition of CFRP components by acoustic emission techniques. It should be noted that both the optical fiber sensors and acoustic emission testing technique can realize the surface and inner damage detection of CFRP structures. However, refer to the structural health monitoring, which means the detection needs to last for a long time, and the optical fiber sensing technique are preferred.
One of the most extensively used optical fiber sensors is the FBG sensor, which attracted increasing attention for the strain and temperature measurement, due to its small size, absolute measurement, high sensitivity, easy operation, distributed sensor networks, and resistance to electromagnetic fields. FBG sensors are capable of detecting very small changes in strain with a resolution as high as 1 µε. FBG sensors can be multiplexed along a single optical fiber, allowing multiple sensors to be deployed over a large area with minimal cabling. This feature significantly enhances monitoring efficiency. To accurately measure the dynamic strains of CFRP structures by using the FBG sensors, advanced digital signal processing technology can be adopted to extract time-frequency information from the FBG sensing signals. The analysis given above also indicates that most of the studies are related to the detection of CFRP plates. For the complicated CFRP antenna beam structures, no published references discussed this topic, and the three-dimensional (3D) vibration performance of the CFRP antenna beam under different vibration modes is yet to be explored.
For this reason, this paper conducts the 3D vibration tests of a CFRP antenna beam under various working conditions (sweep frequency test, simulated long-life vibration test, shock vibration test, functional vibration test, and constant frequency vibration test) according to the design code of BS EN 61373:2010 [30]. The FBGs in series and point FBG sensors were attached on the four different surfaces of the antenna beam to obtain the response information under the longitudinal, transverse, and vertical loading directions. The time and frequency domain analysis on the FBG sensing signals was performed to check the dynamic performance and assess the health condition of the testing samples. Vibration response-motivated dynamic feature assessment was conducted. It is hoped that comprehensive vibration testing and time-frequency domain analysis will show that the dynamic performance and stability of CFRP antenna beams is superior to that of conventional steel beams, as well as pave the way for the development of self-sensing CFRP structures.

2. Experimental Investigation

The testing component is an antenna beam for locomotive bogies, which is made of CFRP material, and the correlated 3D model is displayed in Figure 1, in which the definition of the main directions is based on the design code of BS EN 61373:2010. To develop an intelligent online monitoring technology for self-sensing CFRP antenna beams, a series of tests under different working conditions such as the sweep frequency test, simulated long-life vibration test, shock vibration test, functional vibration test, and constant frequency vibration test are carried out on CFRP antenna beams to detect the dynamic performance. To much comprehensively grasp the vibration response information, three-directional vibration (i.e., vertical, transverse, and longitudinal, see Figure 1) loads were applied to this CFRP antenna beam, and the FBG sensing technology equipped with a high-frequency high-speed interrogator si255 produced by the MOI company was used to obtain the structural response of the CFRP antenna beam during the testing process. The main work contains the design of the FBG sensor layout, installation and networking methods, data acquisition and processing, and vibration feature evaluation.

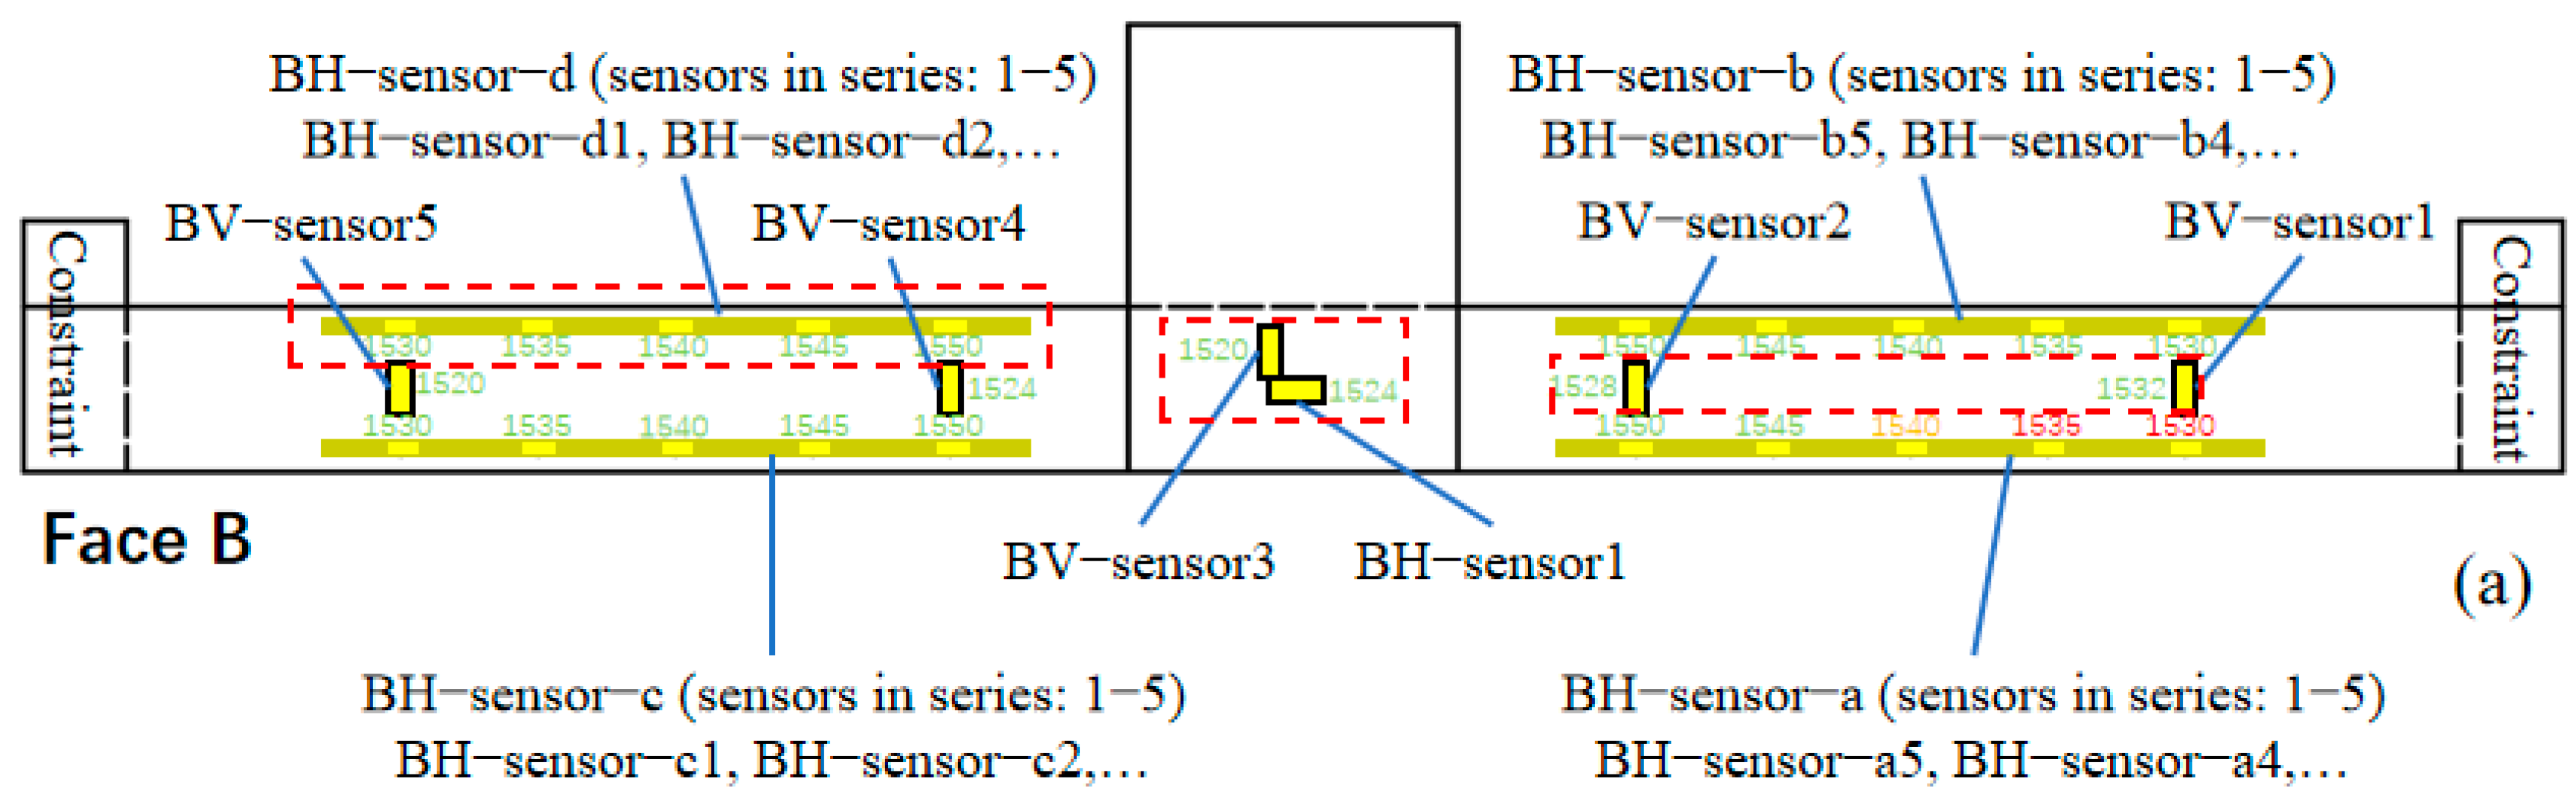
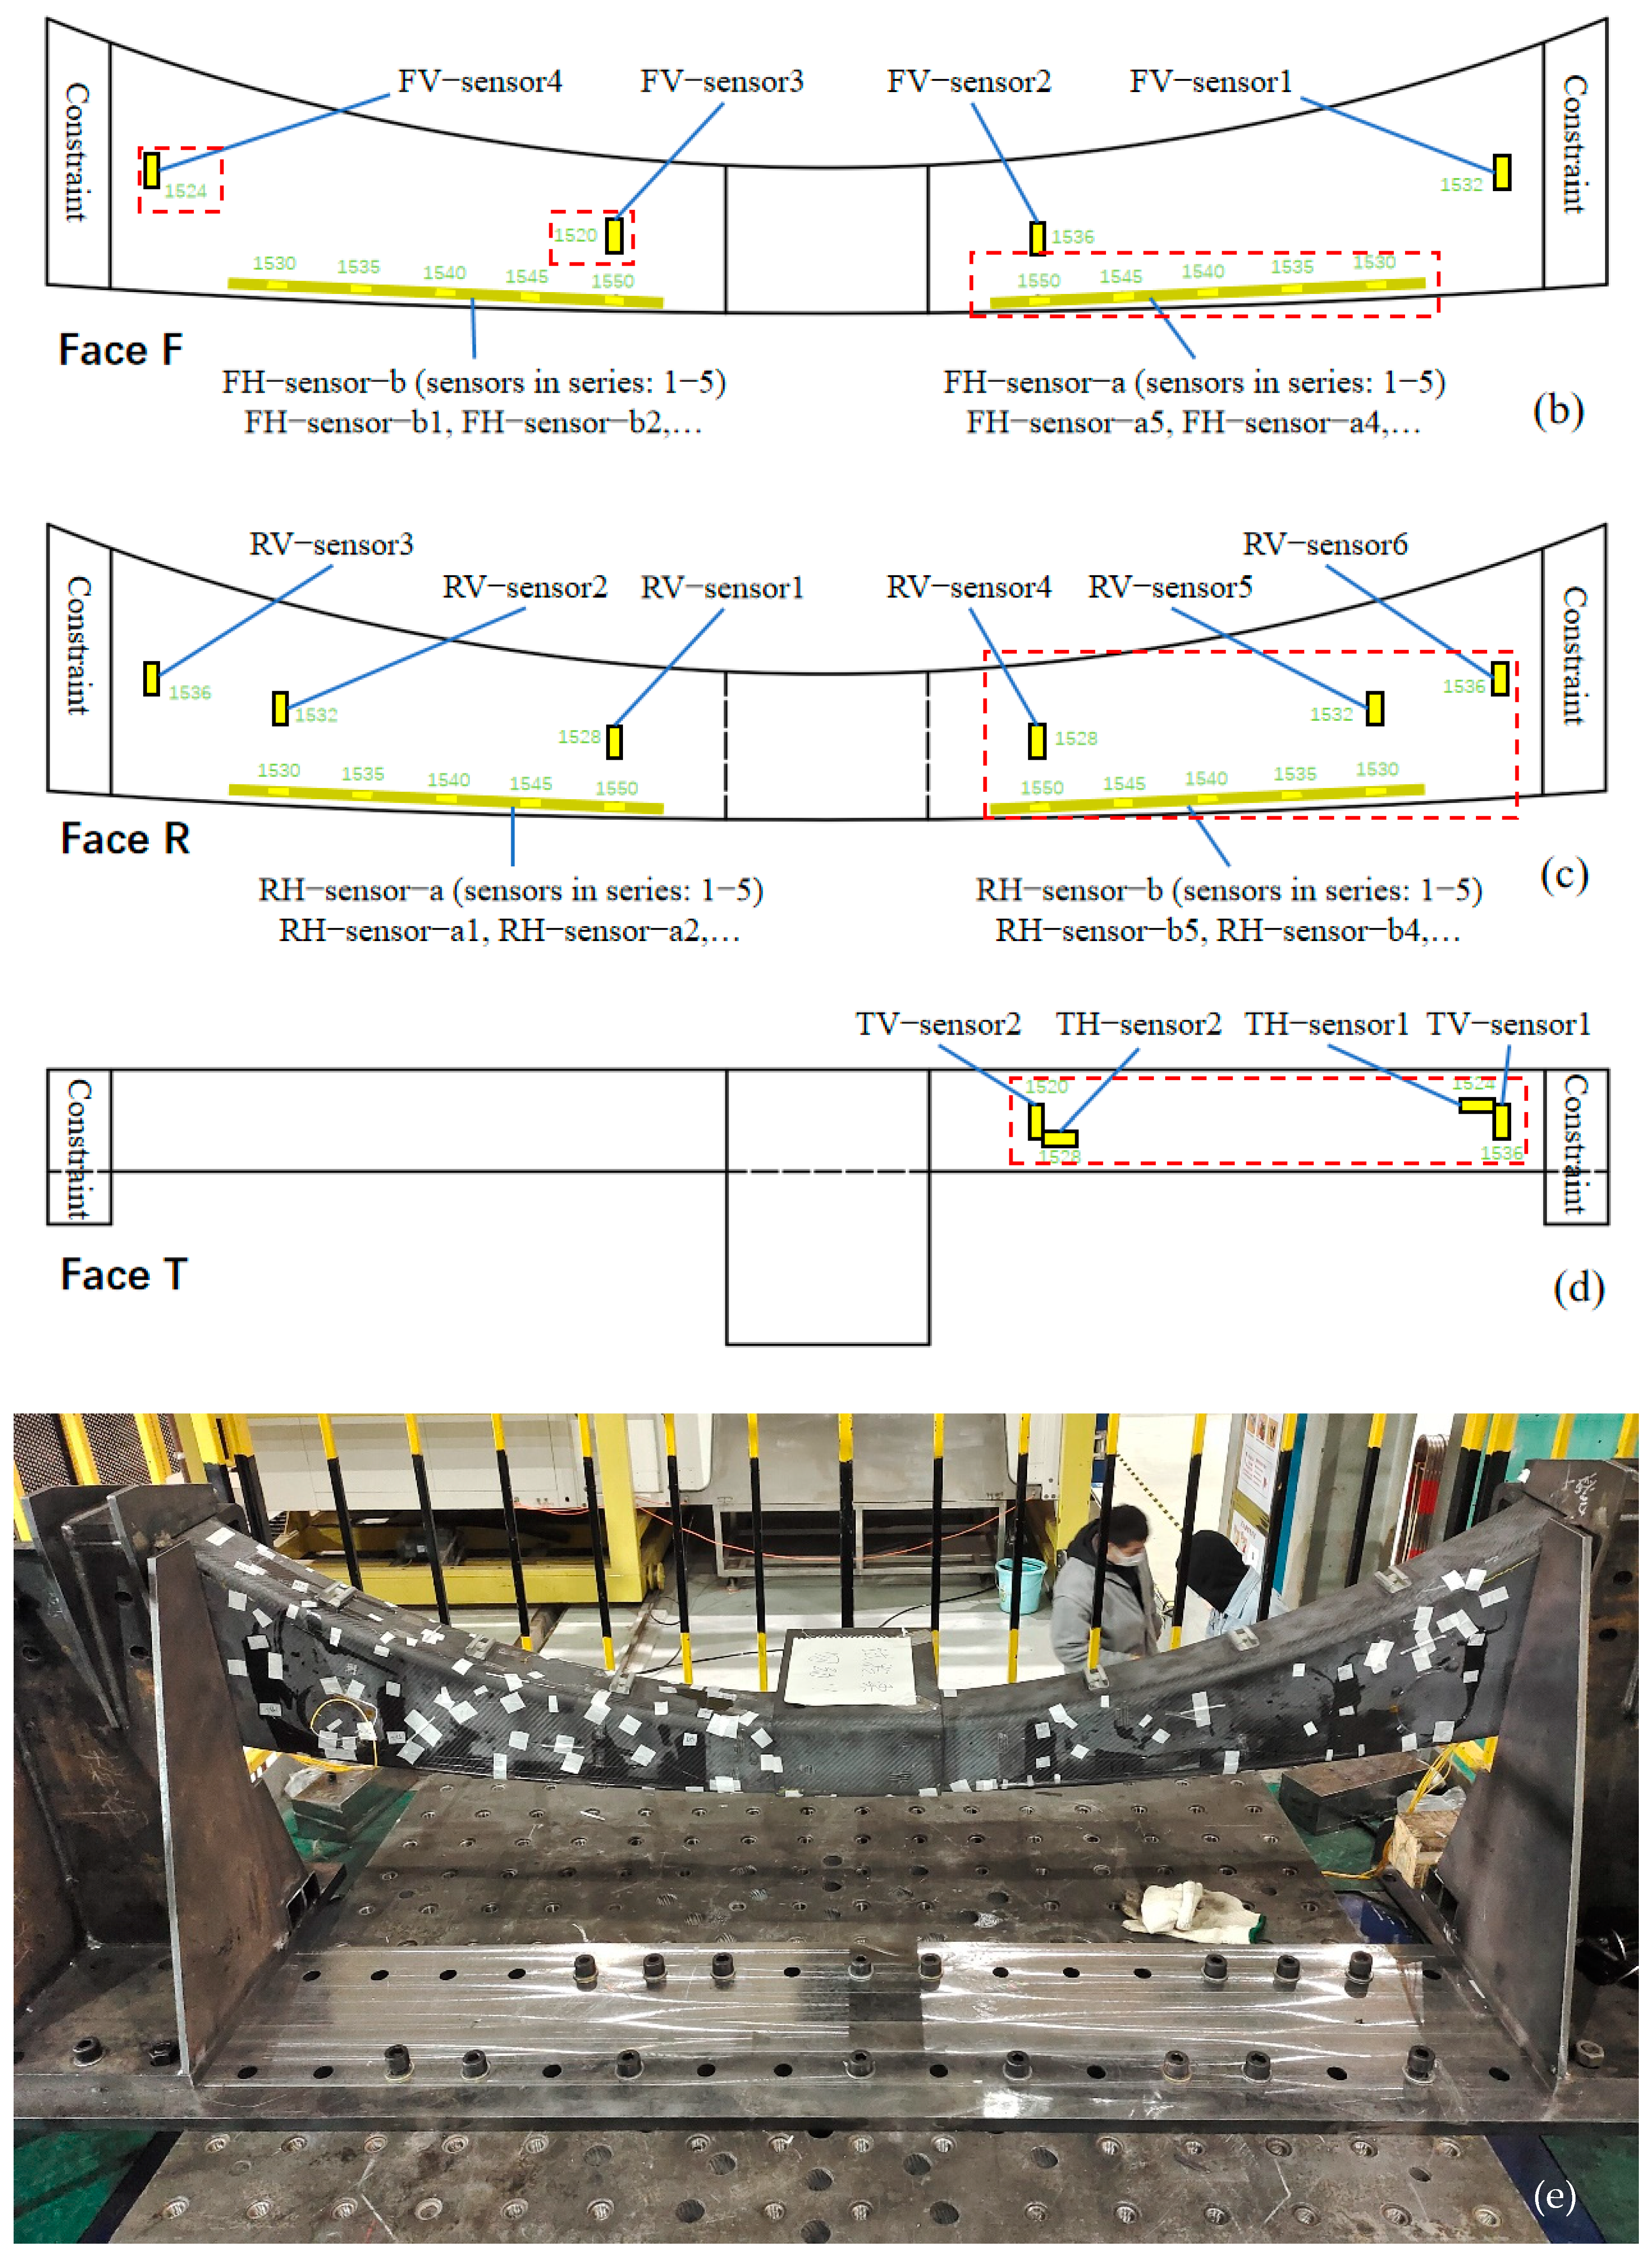
2.1. Sensor Layout and Installation

To comprehensively and accurately obtain the response of CFRP antenna beams under multiple dynamic loads, 60 FBG sensor measurement points (including single-measurement point FBGs and multiple-measurement point FBG strings) were affixed to their main structural surfaces and numbered separately, as shown in Figure 2. The sensor layout is carefully designed based on the structural characteristics of the CFRP antenna beam and the expected vibration modes to ensure the best measurement of the dynamic response of the CFRP antenna beam. That is, the sensors are strategically placed at different locations to cover the key points on the CFRP antenna beam. These points include the area near the fixed end where the maximum bending stress occurs and the mid-span area where the maximum bending stress is expected to occur. Due to the influence of human operation, there are two measurement points without signal during the deployment process. Therefore, there are 58 effective measurement points. These sensors were connected to the si255 fiber grating interrogator via optical fiber patch cables, and its sampling frequency was set to 5 kHz. The ends of the antenna beams are fixed to the shaking table by means of workpieces, and the load is transferred to the antenna beams by the shaking table. Figure 2 shows the arrangement scheme of the FBG sensors. The bottom surface of the antenna beam is named as B surface, the side with protrusion in the span is named as F surface, the surface without protrusion in the span is named as R surface, and the top surface is named as T surface, as shown in Figure 2a–d, respectively. Since some of the measurement points are in similar locations and have the same force pattern, the sensing signals measured by the FBG sensors circled in the red dashed box in Figure 2 were selected and used for the response data analysis of the subsequent vibration tests. Since the duration of the test for each vibration case is less than 3 h, and the durations of most of the vibration cases are less than half an hour, the temperature field is very stable, and the effect of ambient temperature changes on the FBG sensing test data can be ignored. In addition, during the installation process, the flexible structural adhesive made of quick-set epoxy was used to bond the FBG sensing elements directly on the surfaces of the CFRP antenna beam, thus, the strain transfer loss can be ignored [31,32]. The signals read from these FBG sensing elements can be directly used to reflect the practical dynamic response, without the consideration of error modification.

2.2. Testing Cases

Due to the different loading modes, the testing cases were completed on different days. The experimental study lasted for about 4 days. A frequency sweep test was conducted firstly in the vertical direction, with a frequency range from 5 Hz to 250 Hz and a load of 20 kg applied to one side of the CFRP antenna beam. The frequency range of 5–250 Hz encompasses the typical operational frequencies that the CFRP antenna beam would encounter in practical applications. A simulated long-life vibration test with a 5 h test period was also performed, and the root mean square (RMS) values of the acceleration are 30.6 m/s2 in the vertical direction, 26.5 m/s2 in the transverse direction, and 14.19 m/s2 in the longitudinal direction, respectively. A static strength test was also performed with a load of 5 kg and 20 kg applied to one side of the beam. A shock vibration test with a peak acceleration of 300 m/s2 in the vertical, transverse, and longitudinal directions was also conducted. A functional vibration test with a frequency range from 5 Hz to 250 Hz was performed, and the RMS values in the vertical, transverse, and longitudinal directions are 5.40 m/s2, 4.69 m/s2 and 2.51 m/s2, respectively. A vibration test with a constant frequency (44, 94.87, 107.1, and 193.45 Hz) in the vertical direction and a load of 5 kg applied to one side was also performed. It should be noted that except for the constant frequency vibration test with a fixed frequency band, which only applied vibration loads to the vertical direction of the CFRP antenna beam, all other working conditions applied loads to the CFRP antenna beam in the vertical, longitudinal, and transverse directions. The major experimental testing procedures are shown in Figure 3.

3. Strain Distribution of CFRP Antenna Beam under Different Loading Modes

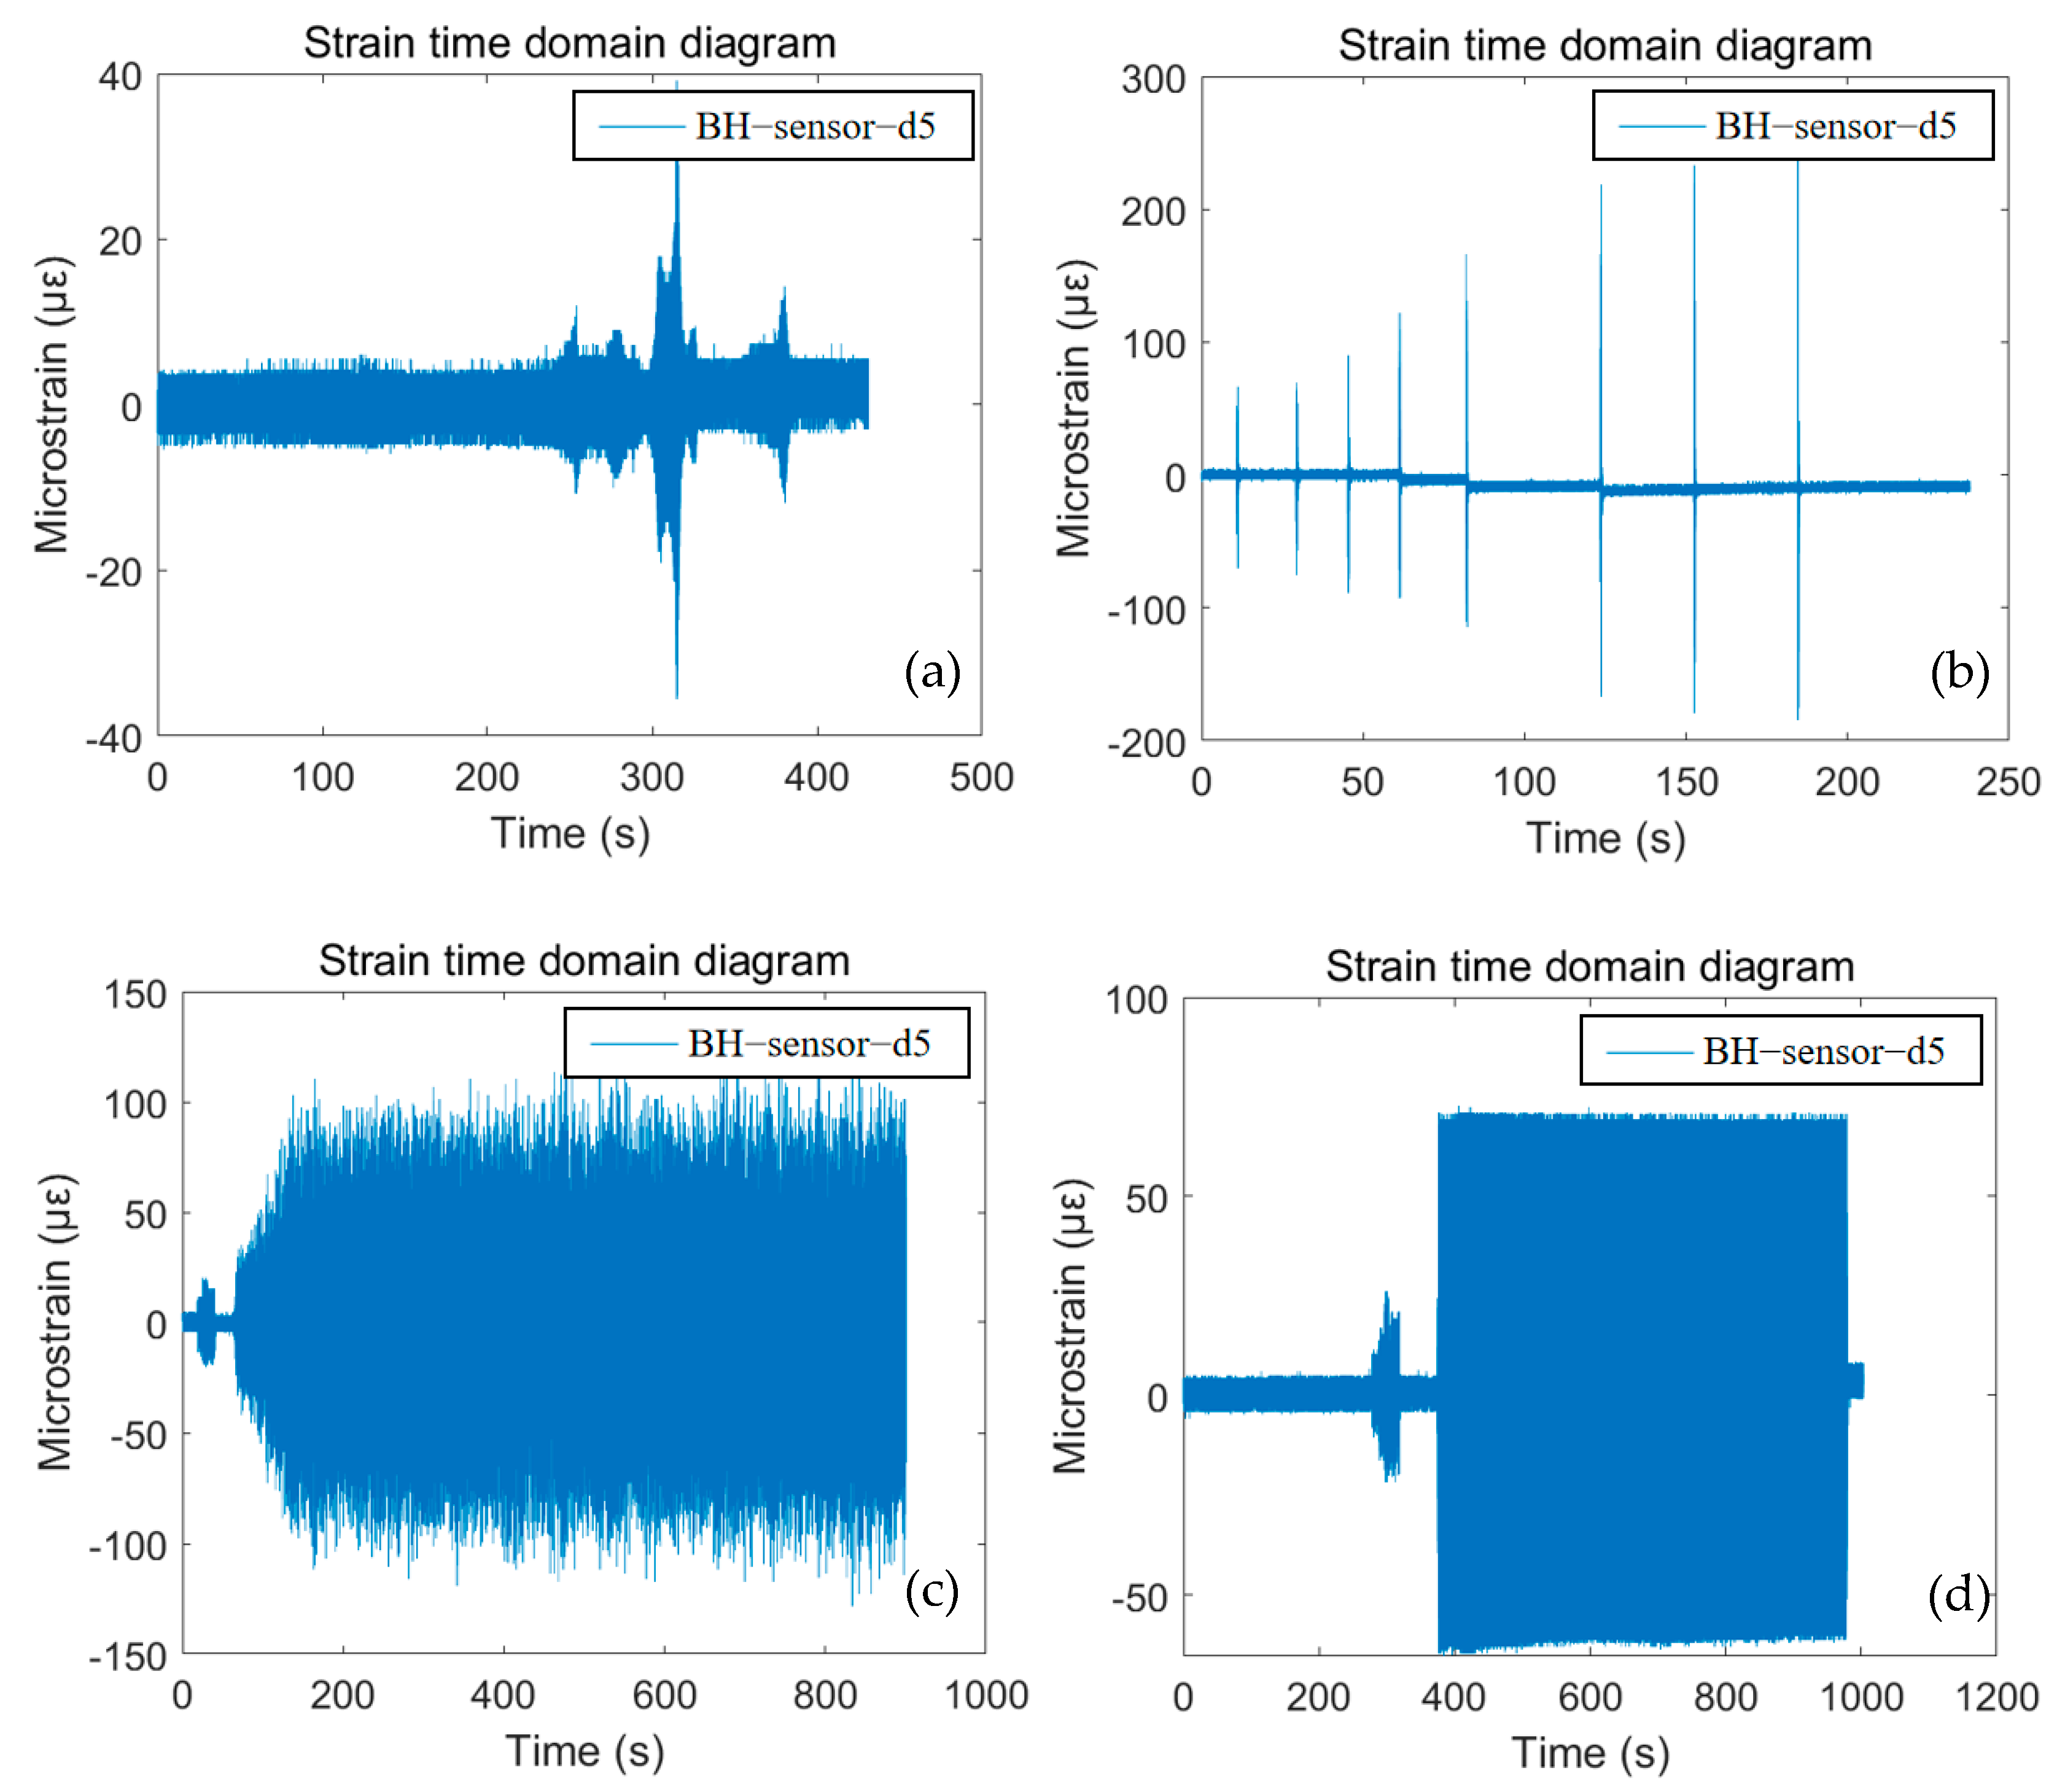
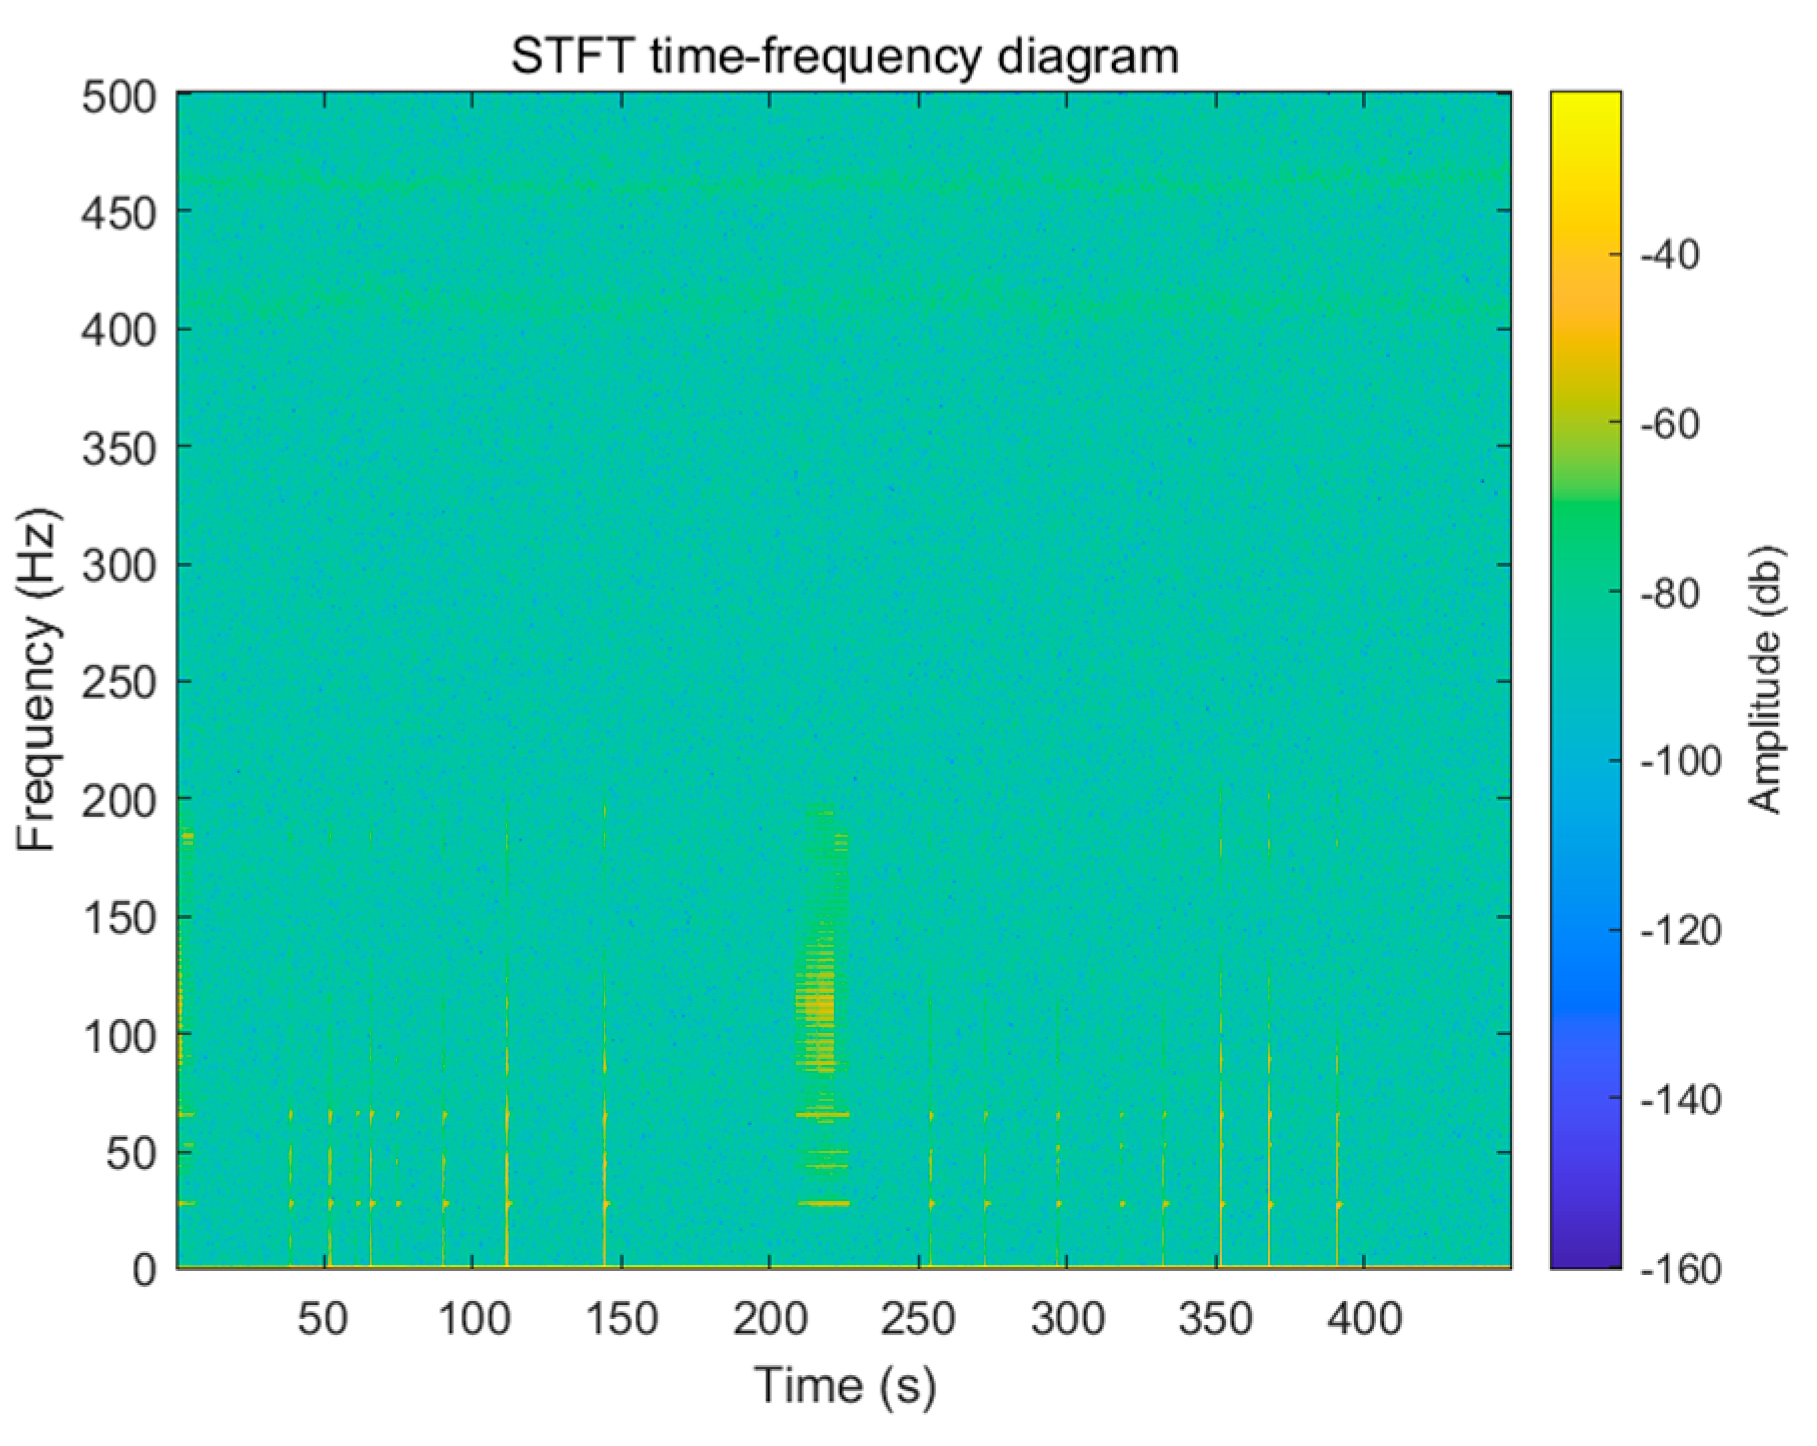
3.1. Discussion on the Time and Frequency Domain Data Measured by BH–Sensor–d5

To check the performance of the CFRP antenna beam under different loading modes, the data measured by one sensor (BH–sensor–d5) located on the beam bottom surface were processed. Figure 4 shows the strain response of the CFRP antenna beam under the sweep frequency test, shock test, simulated long-life vibration test, and constant frequency vibration test. It can be noted that the CFRP antenna beam undergoes reciprocating vibration during sweep frequency test, and significant oscillations may occur at individual time points. This oscillation is due to the loading frequency precisely reaching the natural frequency of the CFRP antenna beam, resulting in a resonance phenomenon. Under the shock test, when the CFRP antenna beam is impacted, it suddenly produces a large vibration and quickly becomes stable. As the acceleration of each impact increases, the amplitude of each vibration gradually increases. Under the simulated long-life vibration test, the CFRP antenna beam undergoes random vibration, which corresponds to the randomness of the applied load. Under the constant frequency vibration test, the CFRP antenna beam oscillates steadily back and forth, with the same amplitude. After stopping loading, it returns to its initial value. This shows that the FBG sensor can sensitively monitor the dynamic strain changes of the CFRP antenna beam.
Short-time Fourier transform (STFT) is a signal processing method used to analyze the frequency domain characteristics of non-stationary signals. Non-stationary signals refer to signals whose spectral characteristics vary over time. STFT divides the signal into multiple short-term windows and performs Fourier transform on the signal within each window to obtain local spectral information of the signal in terms of time and frequency. STFT can observe the local characteristics of signals in time and frequency, which is crucial for analyzing non-stationary signals. By applying Fourier transform at different time periods, the frequency variation of the signal over time can be captured.
The short-time Fourier transform can be regarded as a windowed Fourier transform, and its expression is as follows [33]:
S T F T x ( n , ω ) = m = x ( m ) w ( n m ) e j ω m
where x ( n ) is the reflected signal and n is the time variable. w ( n ) is a window function and this article uses Hann window due to its well-balanced properties in terms of spectral leakage and main lobe width. Its function is to intercept a section of signal near x ( n ) at time n and perform Fourier transform on it. When n changes, the window function will move accordingly, thus obtaining the change rule of signal spectrum with time n . At this point, the Fourier transform becomes a ( n , ω ) function in a two-dimensional domain.
Figure 5 shows the short-time Fourier transform time-frequency diagrams reflected from the data measured by BH–sensor–d5 under various vibration conditions. Figure 5a shows that during the implementation of the sweep frequency vibration load, the response frequency of the measuring points gradually increases from 5 Hz to 250 Hz, which is consistent with the actual loading situation. Figure 5b shows the STFT image of the shock test, from which it can be seen that the application of the shock load corresponds to the application time of the time history graph [34], indicating that the FBG sensing element can accurately characterize the dynamic response of the testing samples. Figure 5d shows the short-time Fourier transform image of the constant frequency vibration test, from which it can be seen that the response frequency of the measuring point remains around 94.87 Hz. Based on the results of Figure 4 and Figure 5, it can be concluded that the FBG sensing technology shows suitable measurement performance to accurately characterize the dynamic response of the monitored CFRP structures.

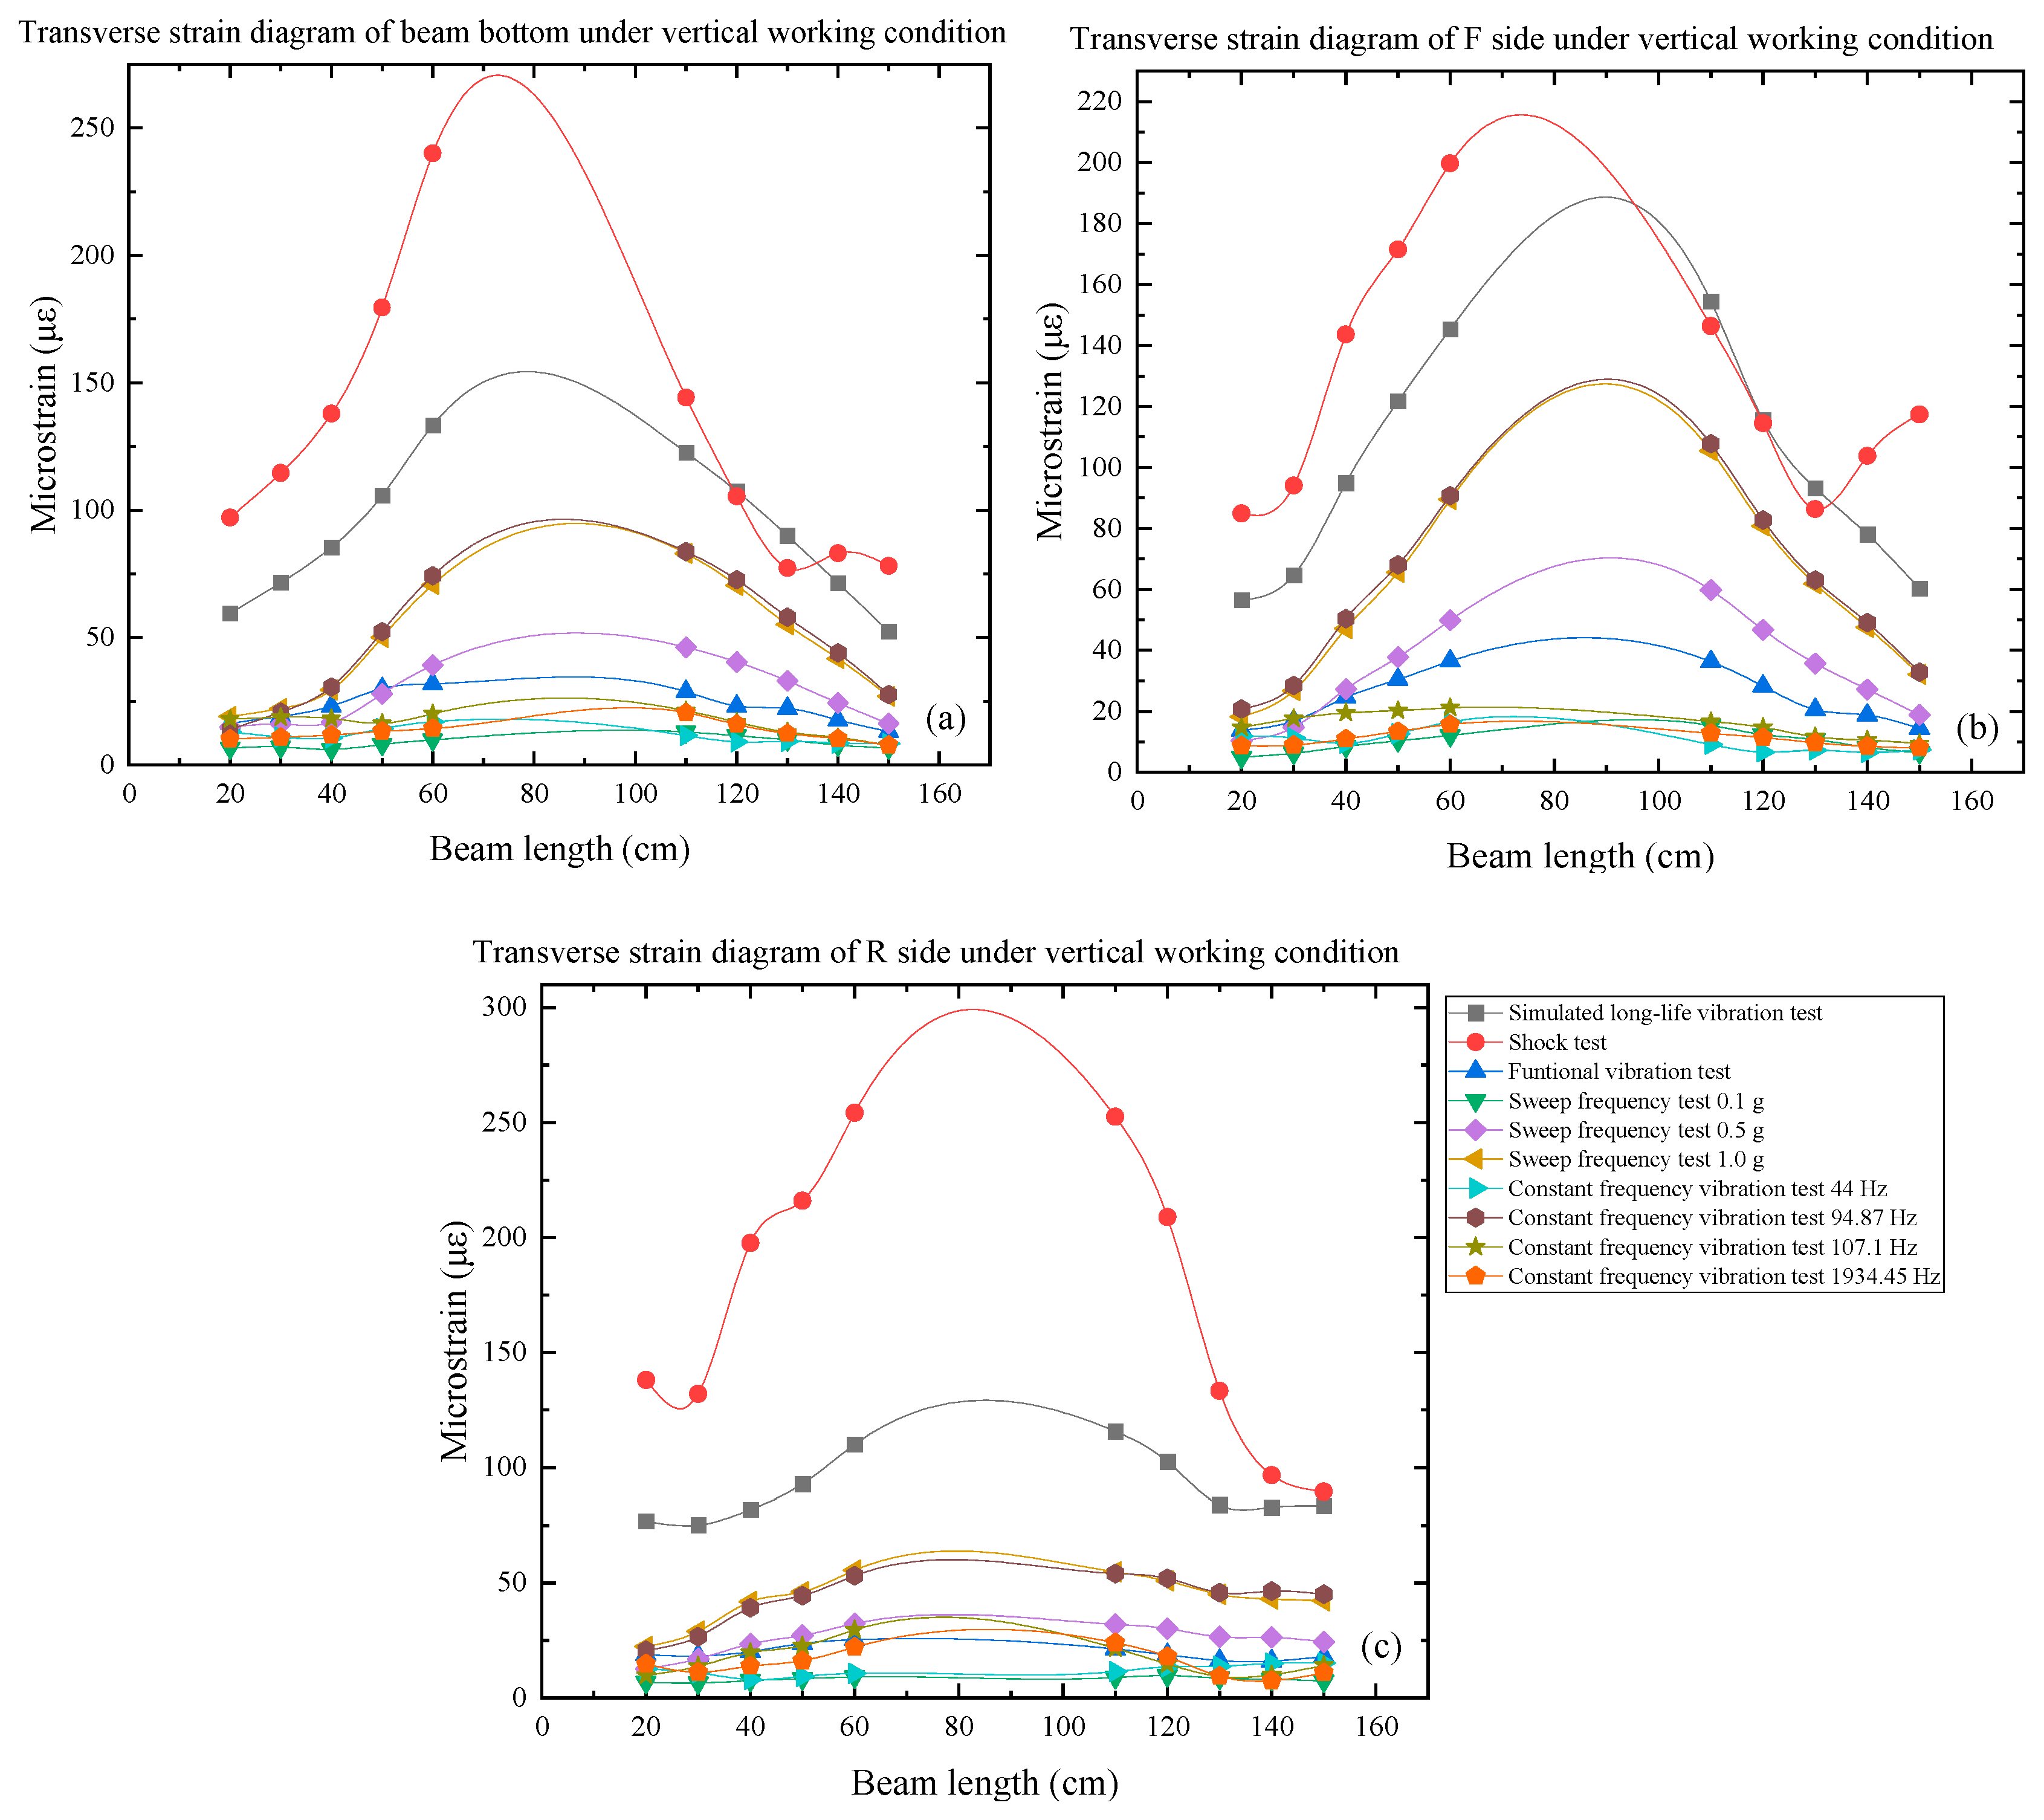
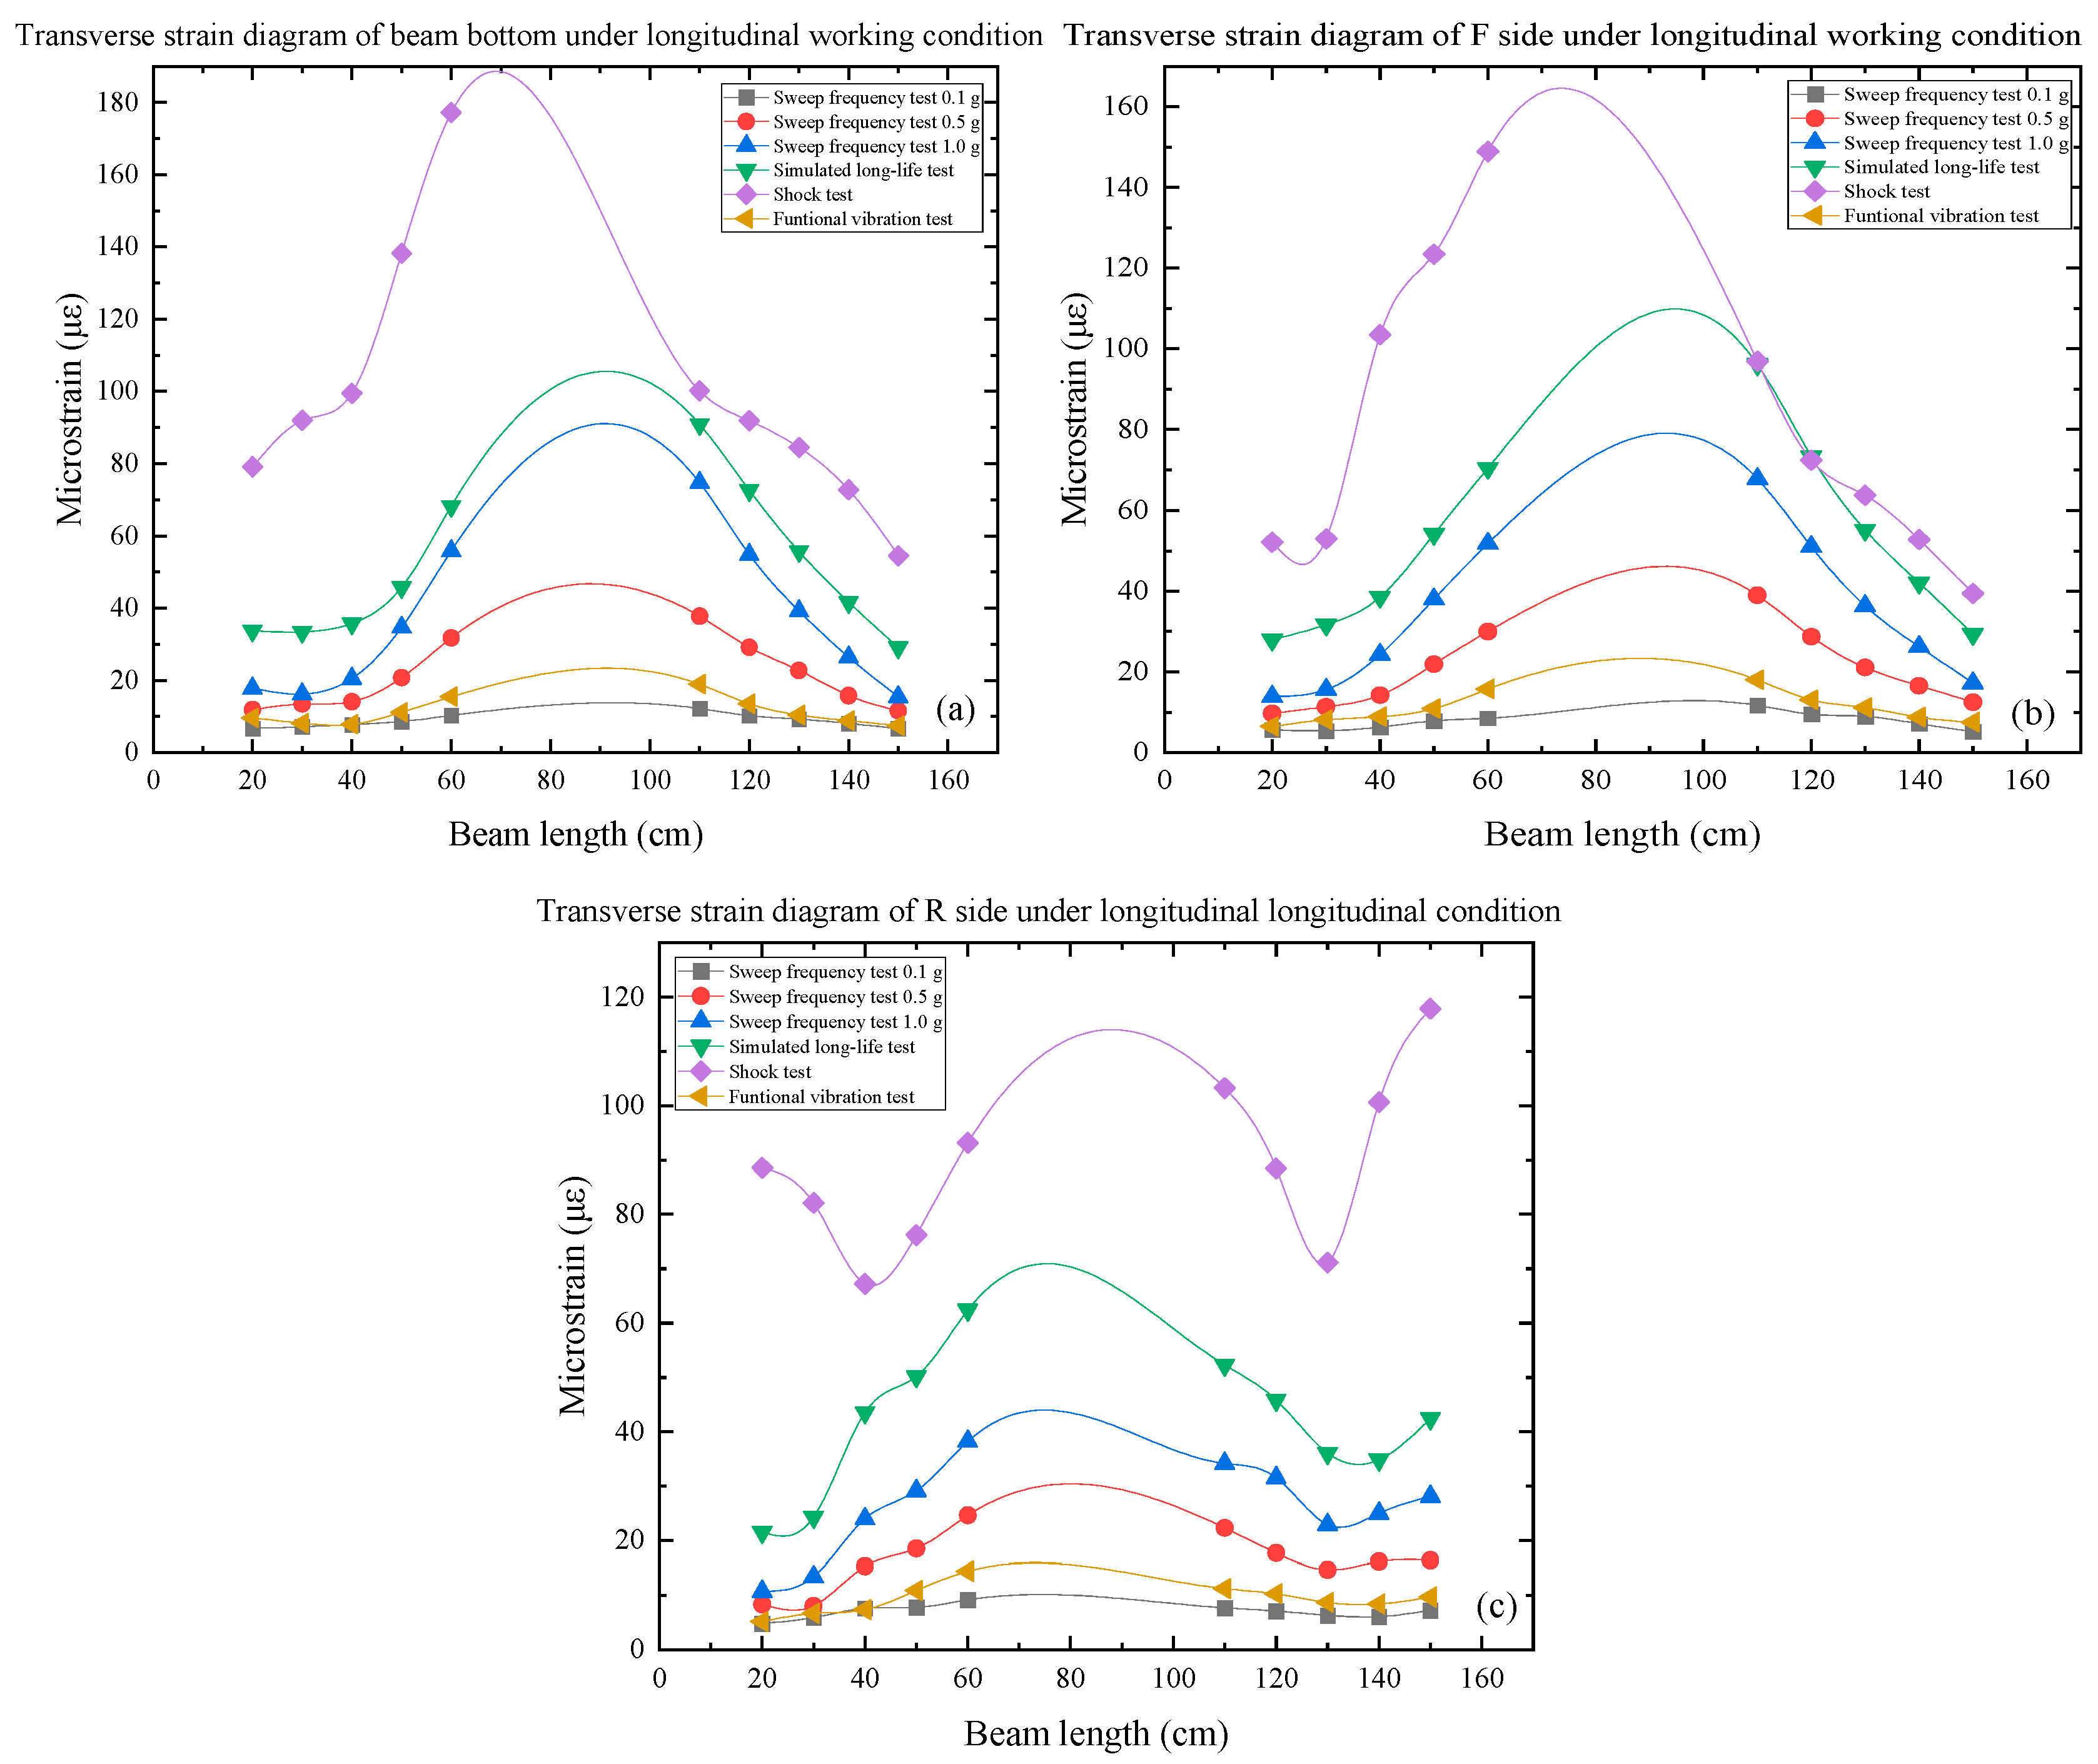
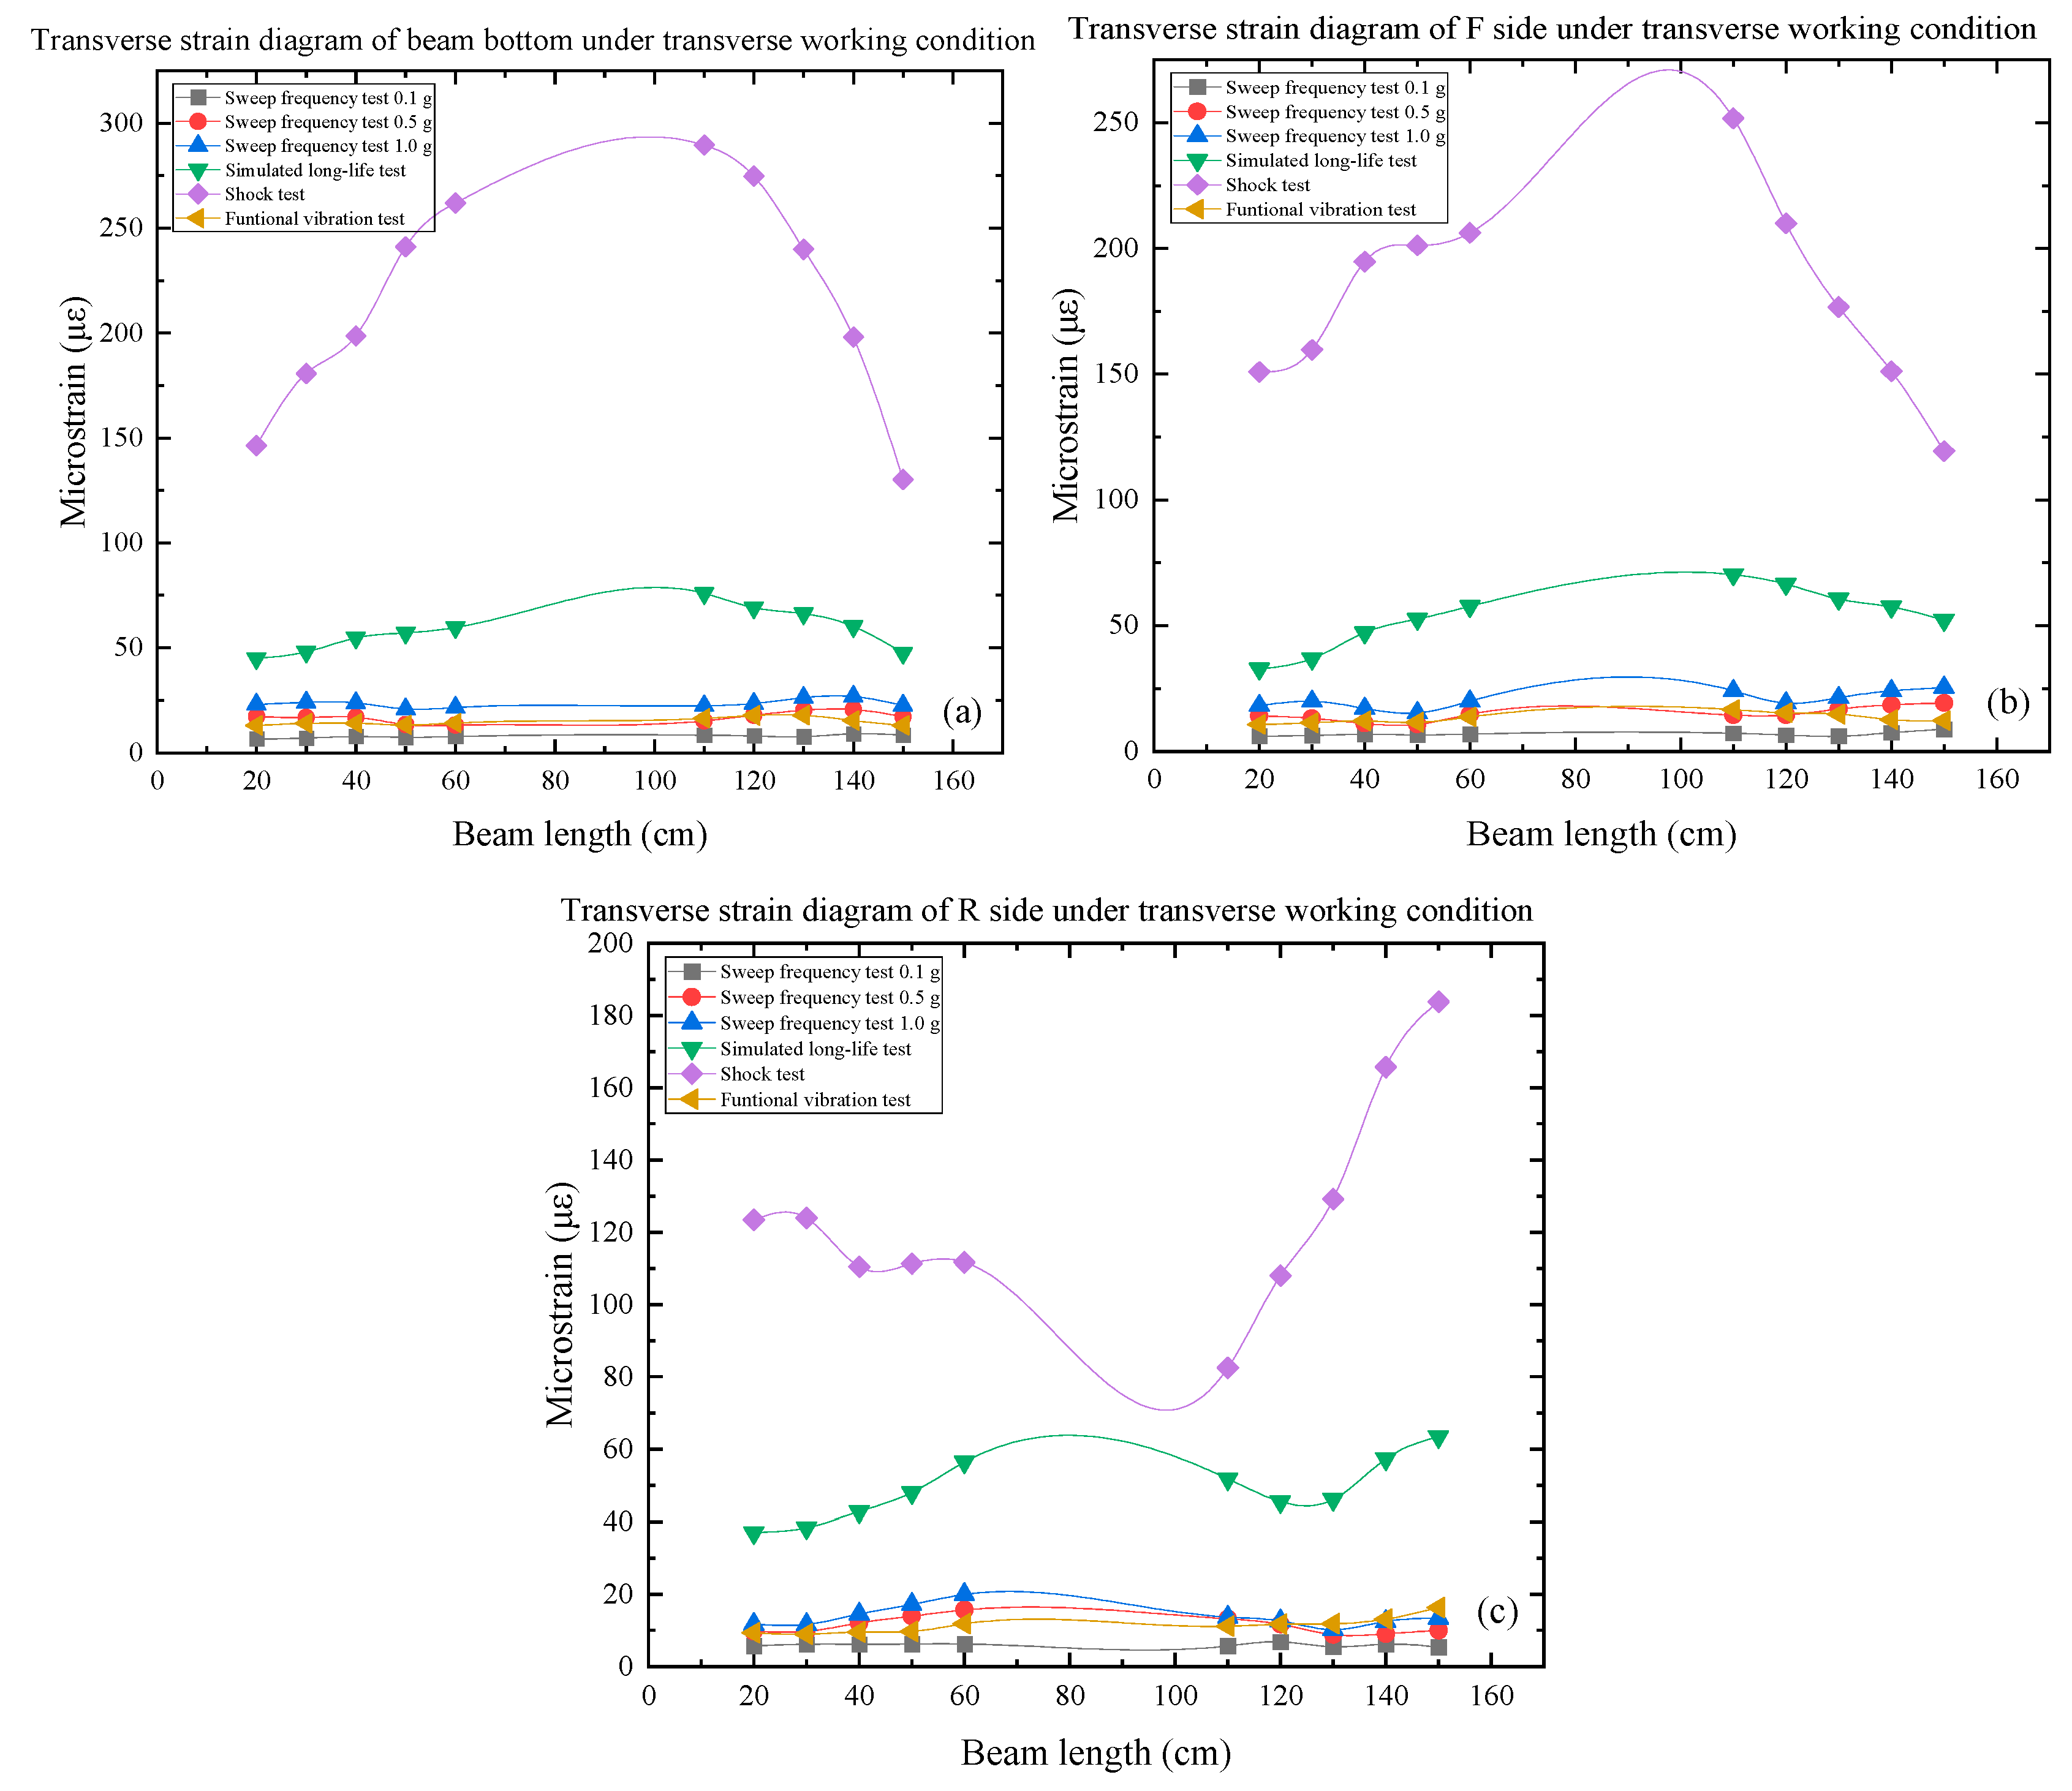
3.2. Strain Distribution along the Span of the Beam

To understand the strain distribution of the CFRP antenna beam, the maximum strain values measured by each sensor under each working condition were compared. Taking the Face B as an example, first find the maximum strain values of the ten measuring points of BH–sensor–d1–5 and BH–sensor–b1–5 under various working conditions. Then, mark the maximum strain value of each measuring point at the corresponding position of the antenna beam. Finally, draw a spline curve using the Origin 2021 software to obtain the strain distribution of the Face B. For the F side, it is a comparison between FH–sensor–b1–5 and FH–sensor–a1–5. For the R side, it is a comparison between RH–sensor–a1–5 and RH–sensor–b1–5. The strain distribution diagrams were drawn on the bottom surface and both sides of the CFRP antenna beam, as shown in Figure 6, Figure 7 and Figure 8.
It can be seen from Figure 6 that under different vertical vibration loads, the transverse strain characteristics of the B Face, F Face, and R Face of the CFRP antenna beam are all maximum at the mid-span, and gradually decrease from the mid-span to both ends, which is consistent with the laws of mechanics. At the same time, it can also be seen that the greater the magnitude of the applied load, the greater the strain of the CFRP antenna beam. Among them, the strain of the CFRP antenna beam is obviously the largest in the shock test. This is because the magnitude of the impact test is 30 g, which is significantly larger than the magnitude of other working conditions. It is also worth noting that the strain change diagrams of the frequency sweep test with a magnitude of 1.0 g and the 94.87 Hz constant frequency vibration test with a magnitude of 1.0 g are basically the same, and the strains of both are larger than those of constant frequency vibration tests of other frequencies. This shows that the strain of the CFRP antenna beam reaches the maximum when the frequency reaches 94.87 Hz in the sweep frequency test. A similar conclusion can be read from the data figures in Section 4.1, which validates the reliability of the testing.
It can be seen from Figure 7 that under different longitudinal vibration loads, the transverse strain characteristics of the B Face, F Face, and R Face of the CFRP antenna beam are all maximum at the mid-span, and gradually decrease from the mid-span to both ends, which is consistent with the laws of mechanics. At the same time, it can also be seen that the greater the magnitude of the applied load, the greater the strain of the CFRP antenna beam. Among them, the various working conditions are arranged from large to small according to the maximum strain produced on the CFRP antenna: shock vibration test, simulated long-life vibration test, 1.0 g sweep frequency test, 0.5 g sweep frequency test, functional vibration test, and 0.1 g sweep frequency test. The corresponding loading levels of these working conditions are 30 g, 1.4 g, 1.0 g, 0.5 g, 0.25 g, and 0.1 g, respectively, which are also gradually reduced. In addition, it can be seen from Figure 7c that in the shock test, due to the large loading magnitude, significant strain was also generated at both ends of the CFRP antenna beam, which is due to the constraint-limiting displacement and conforms to mechanical laws.
Figure 8 shows that the transverse strain characteristics of the B Face, F Face, and R Face of the antenna beam under various transverse working conditions are the same along the length of the beam. However, in the shock test and simulated long-life test, the transverse strain characteristics of the B and F Face show a larger value at the mid-span, gradually decreasing from the mid-span to the two ends. This is because when the transverse loading magnitude is small, the CFRP antenna beam exhibits stretching vibration, while when the transverse loading magnitude is large, the antenna beam exhibits bending vibration, which is consistent with the laws of mechanics. At the same time, it can also be seen that the greater the magnitude of the applied load, the greater the strain of the CFRP antenna beam. The various working conditions are arranged from large to small according to the maximum strain produced on the CFRP antenna beam: shock vibration test, simulated long-life vibration test, 1.0 g sweep frequency test, 0.5 g sweep frequency test, functional vibration test, and 0.1 g sweep frequency test. The corresponding loading levels for these working conditions are 30 g, 2.6 g, 1.0 g, 0.5 g, 0.46 g, and 0.1 g, which are also gradually reduced. In addition, it can be seen from Figure 8c that in the shock vibration test and simulated long-life vibration test, the transverse strain characteristics appear to be larger at the length ends. This is because the measuring points at both ends of the R surface are close to the constraints, resulting in a surge in strain.
In general, the following conclusions can be primarily given: The testing data also show that the transverse strains are generally larger than that of the strains in the longitudinal and vertical directions during the transverse loading process. The CFRP antenna beam exhibits bending vibration in vertical and longitudinal conditions. The overall strain amplitude distribution pattern is that the strain near the constraint end and mid-span is larger, and the strain away from the constraint end and mid-span gradually decreases. When the loading magnitude is small in the transverse working condition, the CFRP antenna beam exhibits stretching vibration, and the overall strain amplitude distribution pattern is the same everywhere. However, when the loading magnitude is large, the CFRP antenna beam exhibits bending vibration, and the overall strain amplitude distribution pattern is generally larger near the constraint end and mid-span, and gradually decreases away from the constraint end and mid-span. The dangerous cross-sections of CFRP antenna beams are distributed at the mid-span and fixture constraint ends. The FBG sensors arranged on the surface of the CFRP antenna beam can more accurately measure its strain response.
The extracted maximum strains for the CFRP antenna beam under different loading conditions (amplitude and forced frequency) for various directions (longitudinal, vertical, and transverse) provide a valuable dataset. This dataset can be effectively utilized to train machine learning algorithms to predict key structural performance metrics such as maximum strain, stress, and deflection. By leveraging suitable machine learning techniques, we can develop predictive models that offer significant advantages for the future design and analysis of CFRP antenna beams. Incorporating machine learning algorithms for predicting structural performance metrics significantly enhances the analysis and design process for CFRP antenna beams [35,36]. By leveraging advanced techniques such as surrogate models [37], state space models [38], and kernel-embedded learning [39], we can achieve accurate and reliable predictions, thereby improving the structural integrity and performance of CFRP antenna systems.

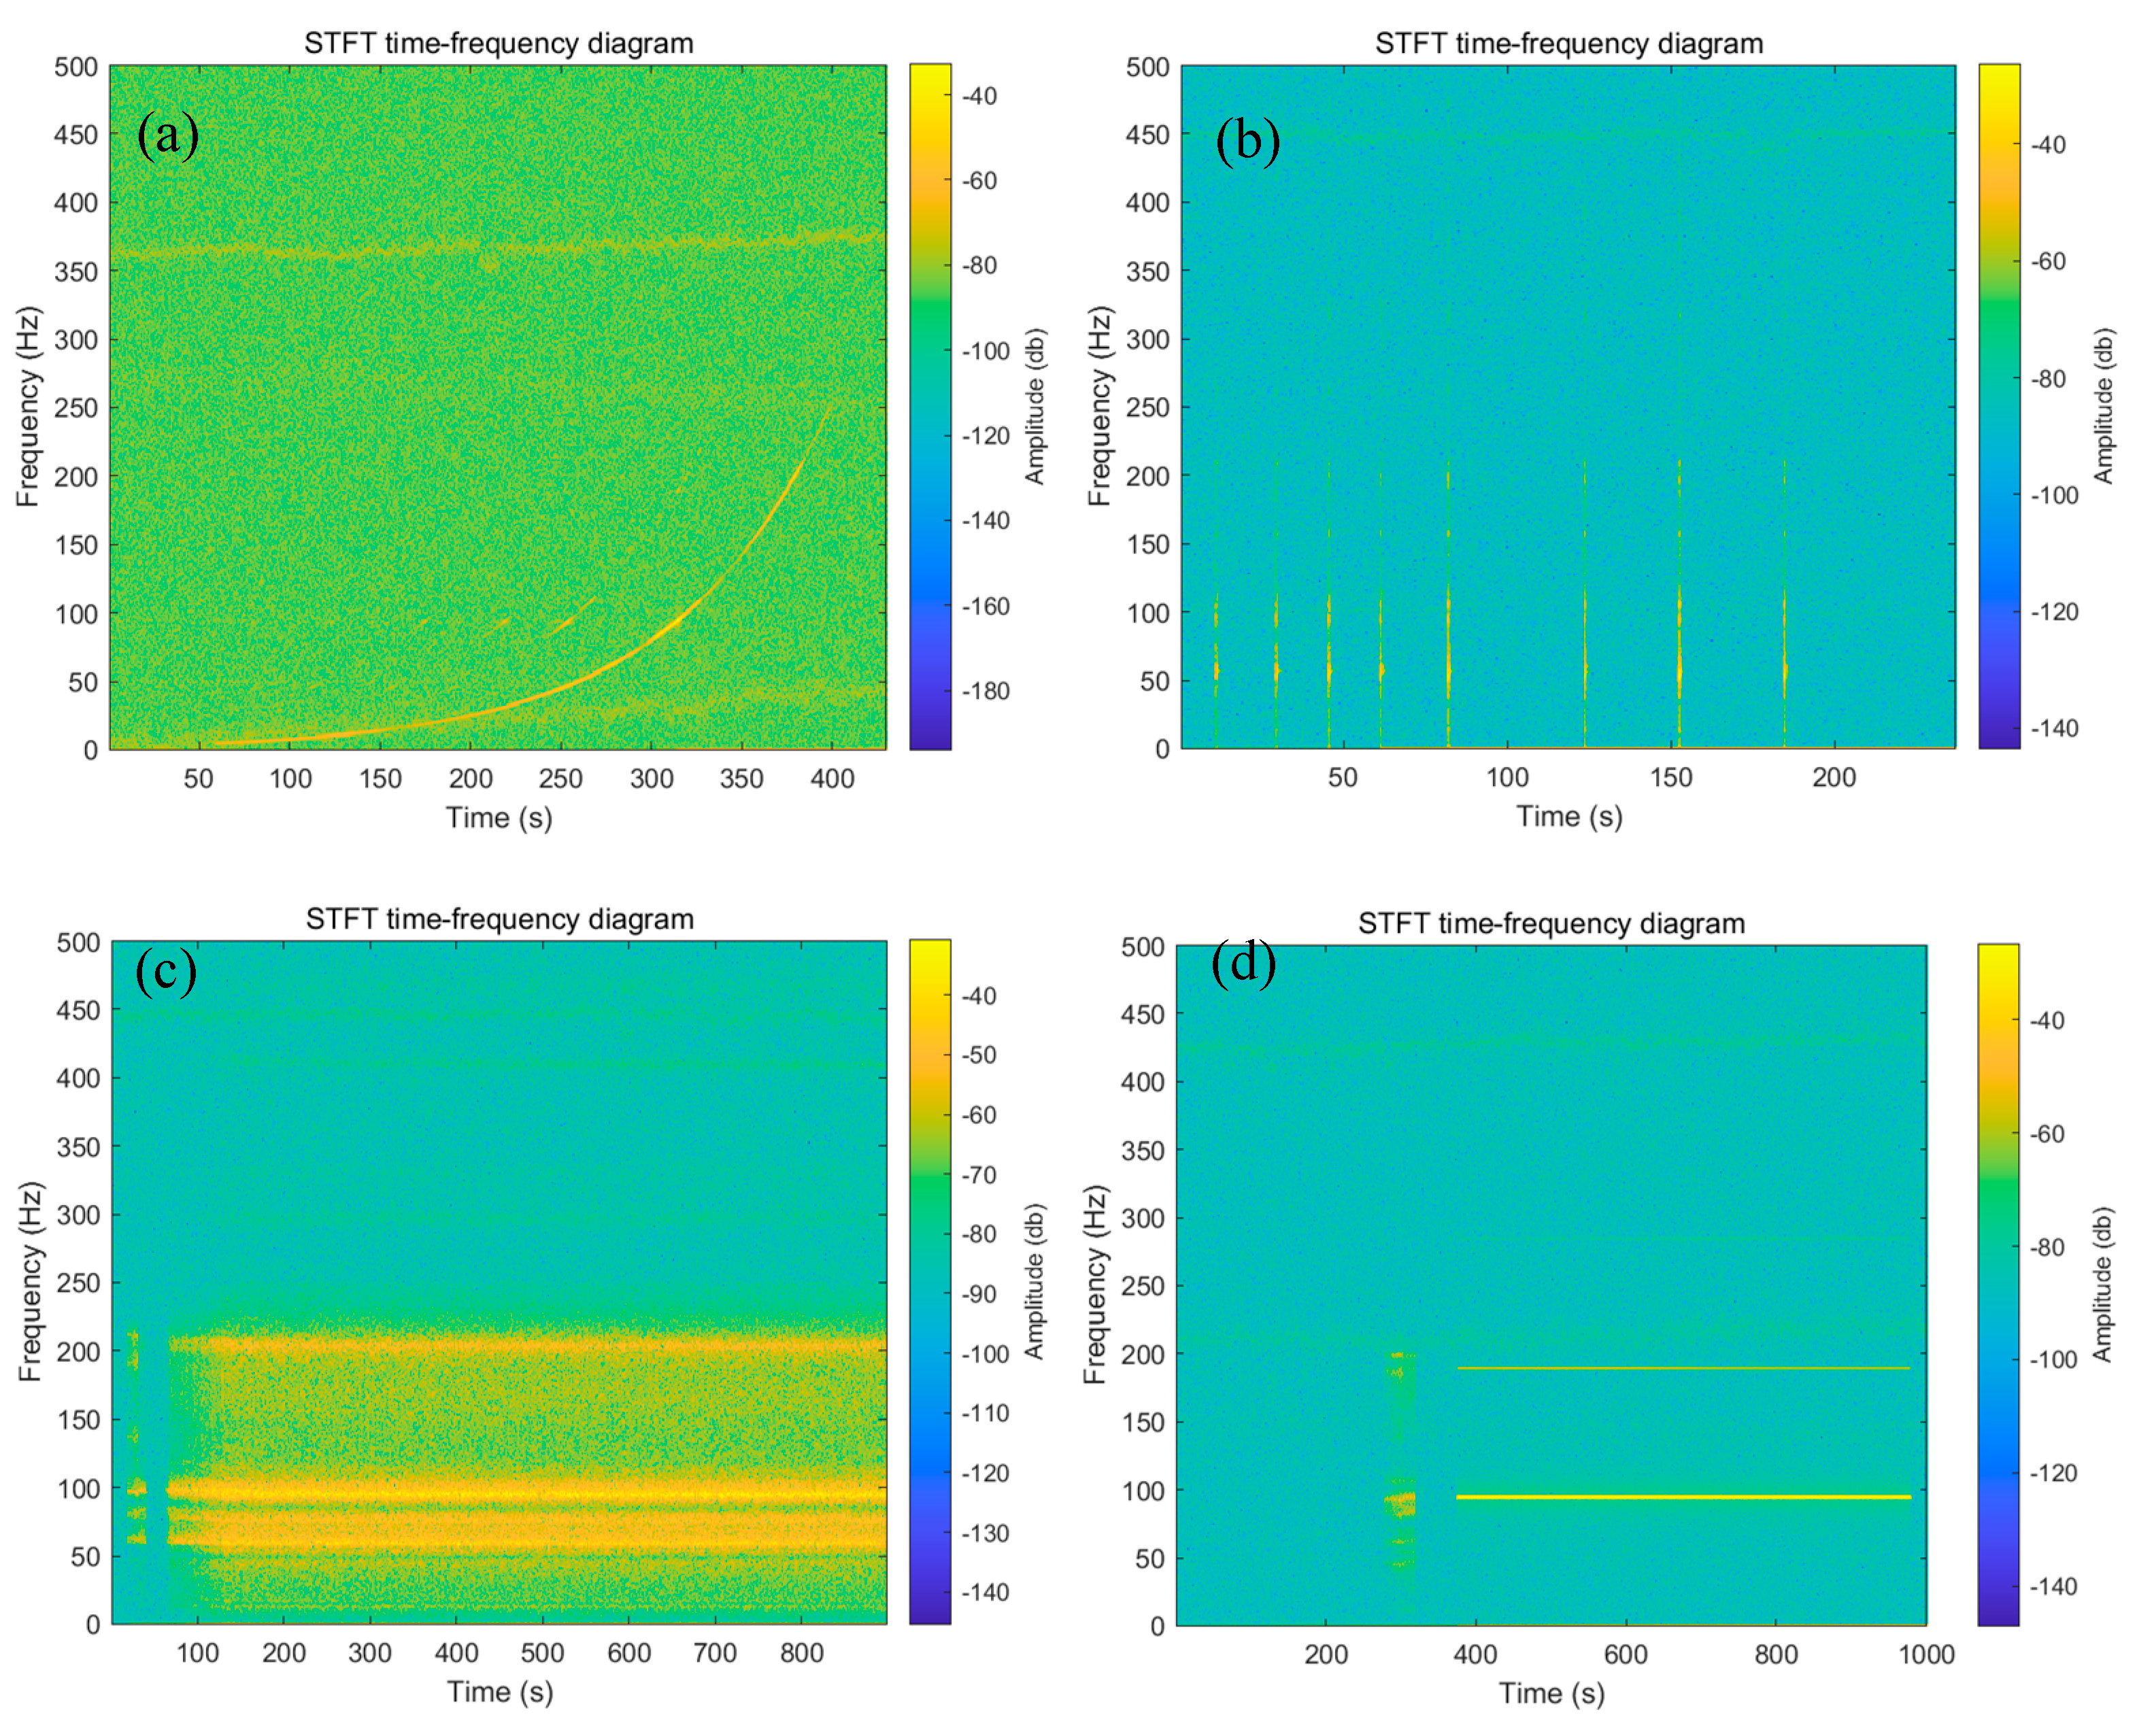
4. The time and Frequency Domain Analysis under Different Vibration Modes

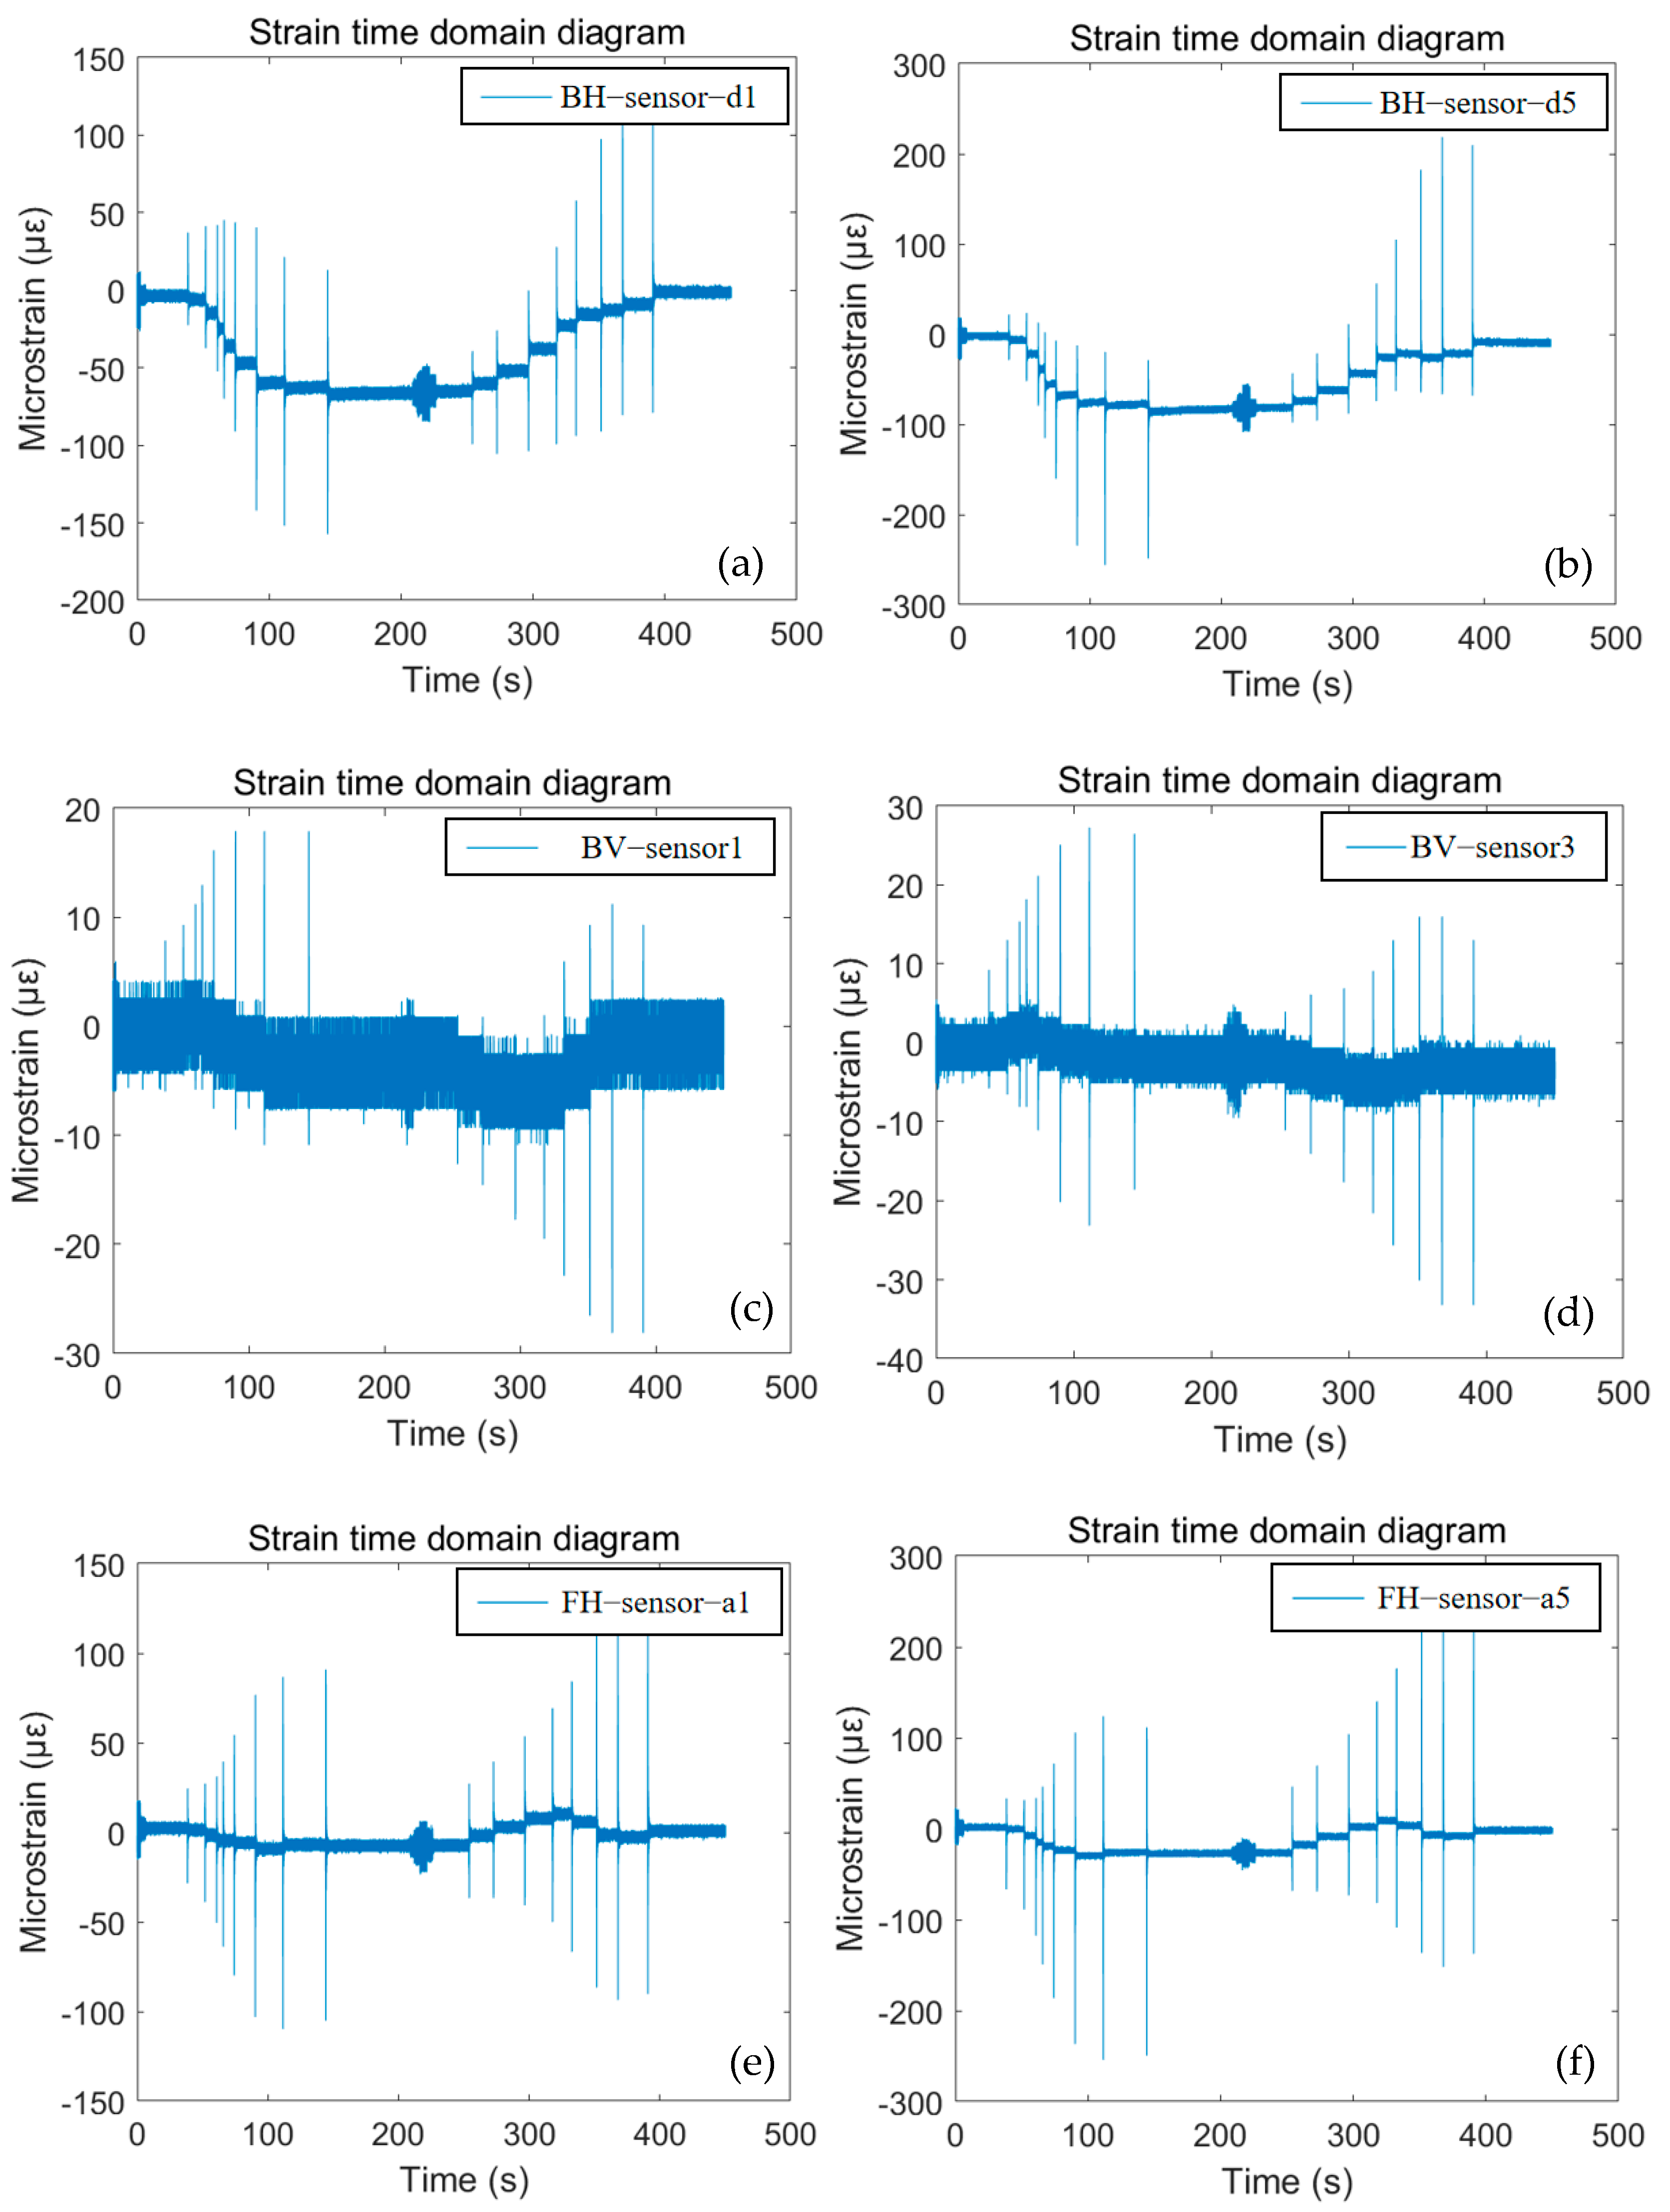
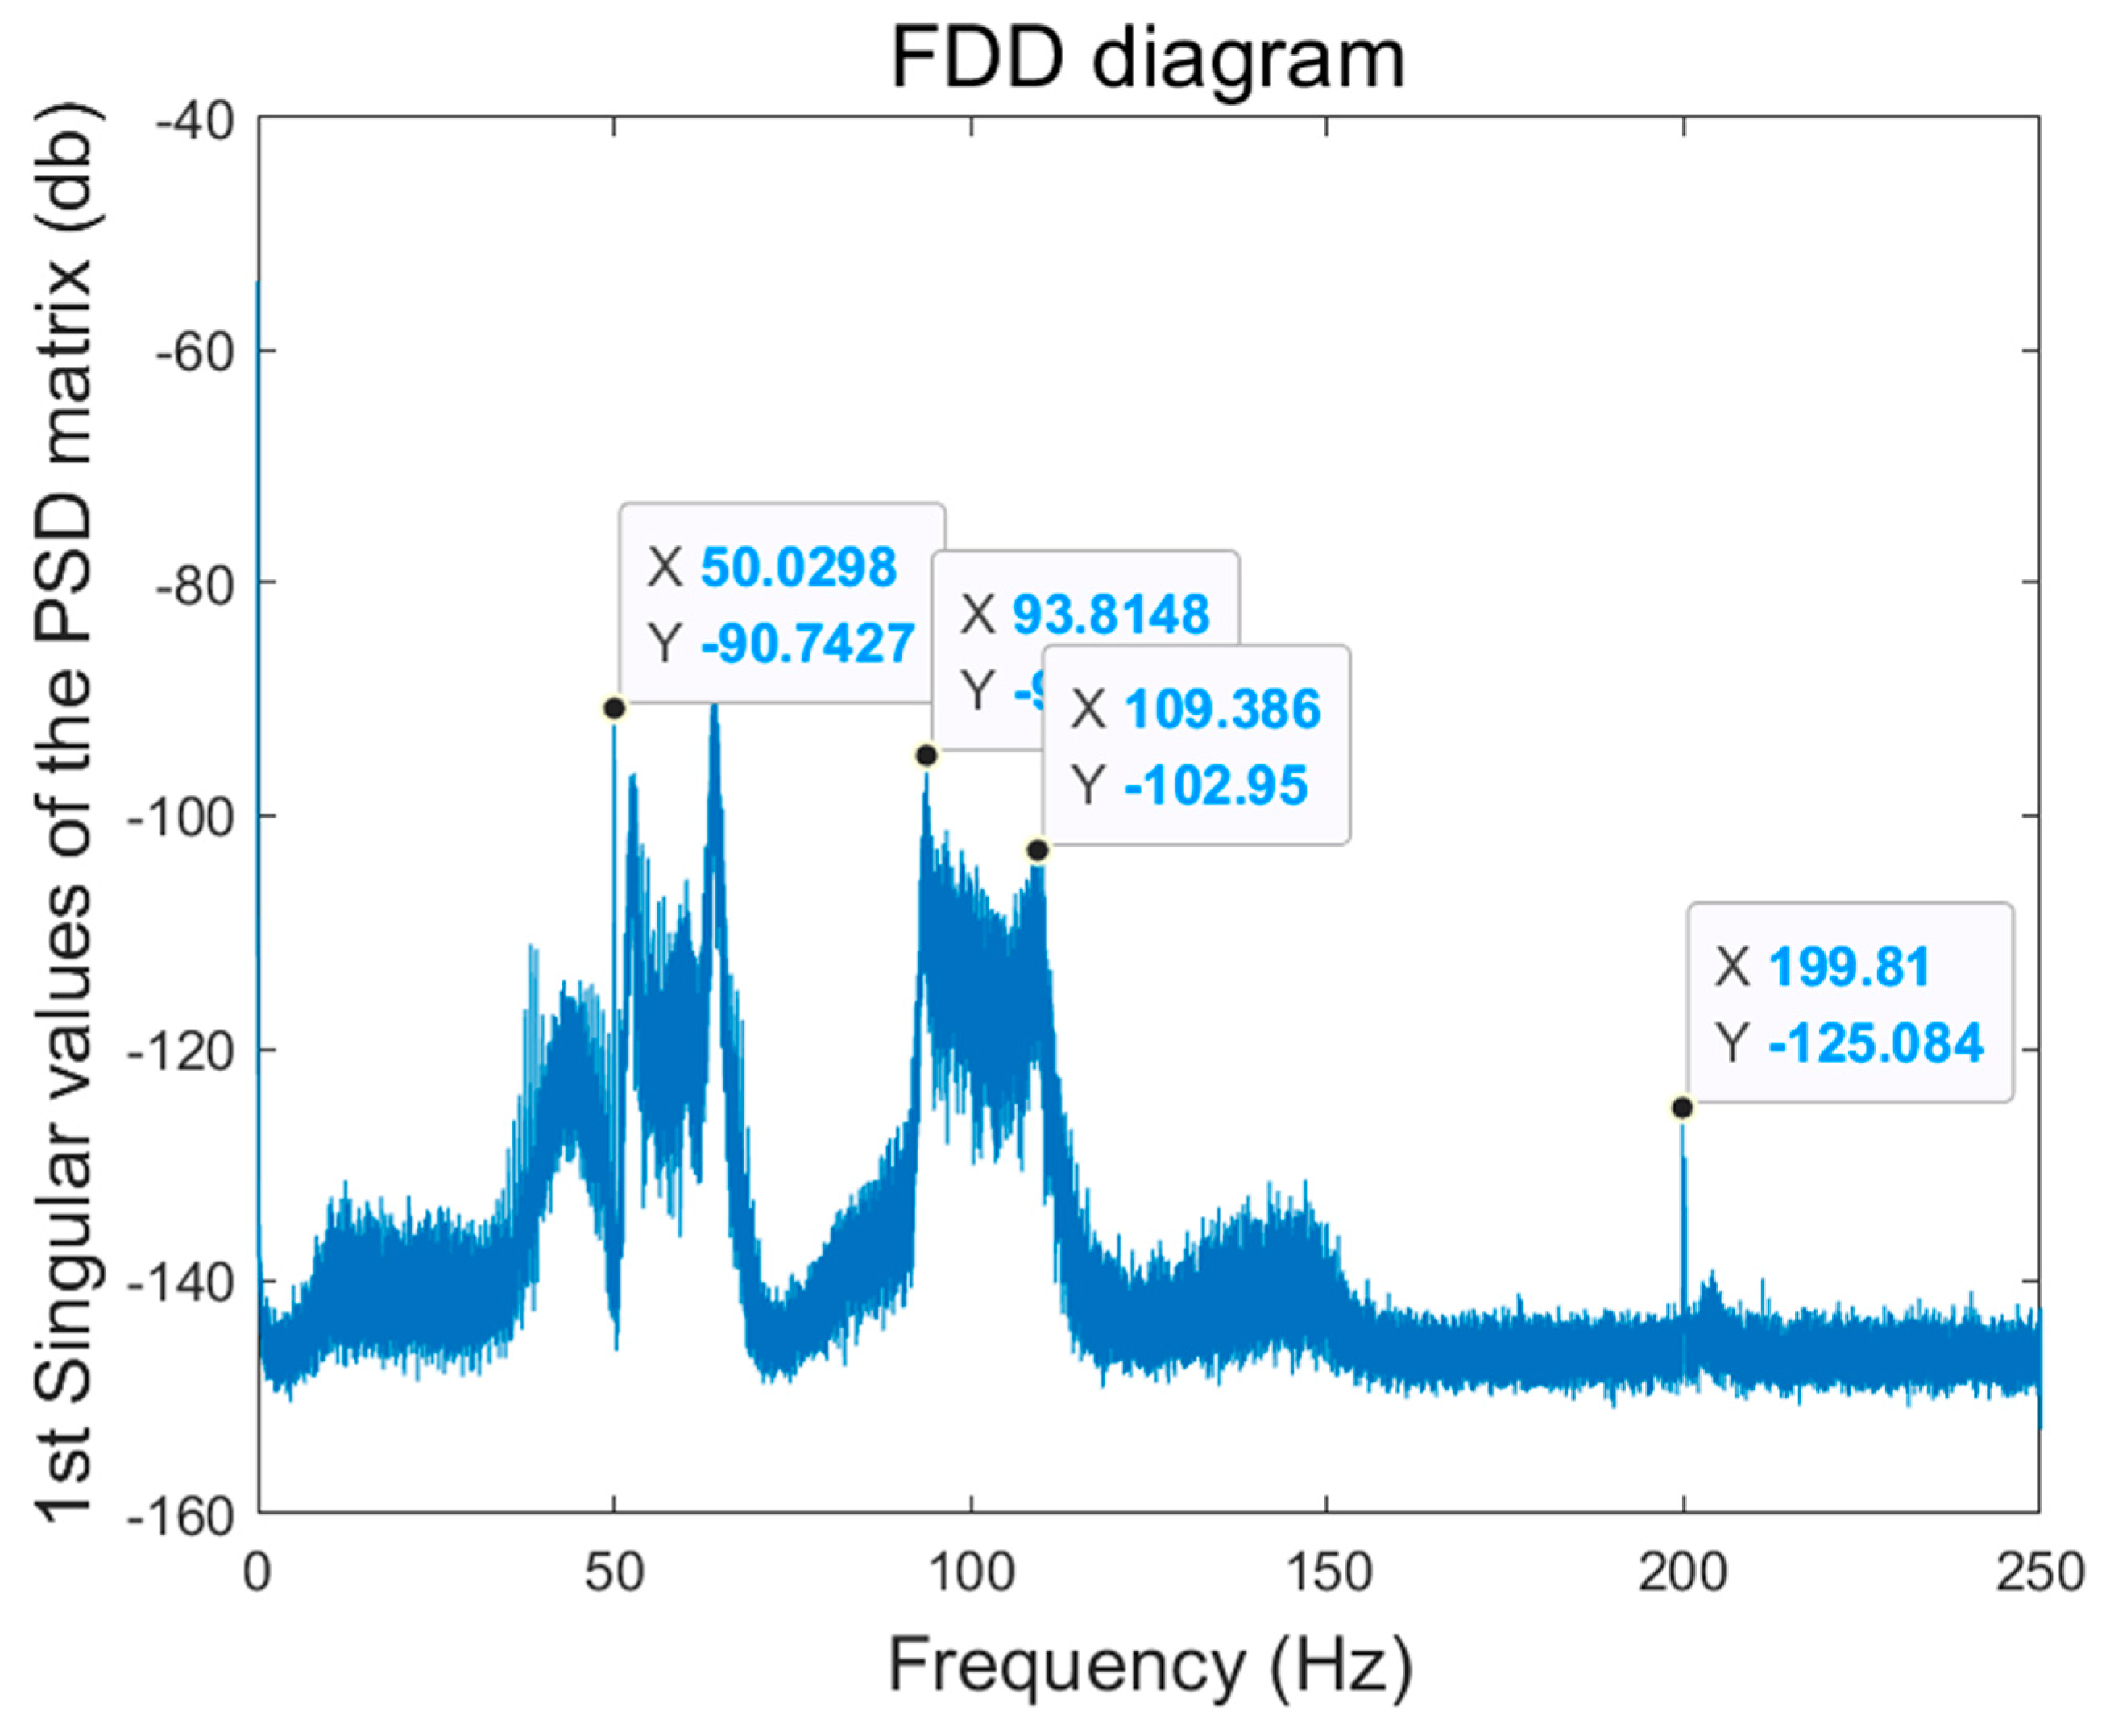
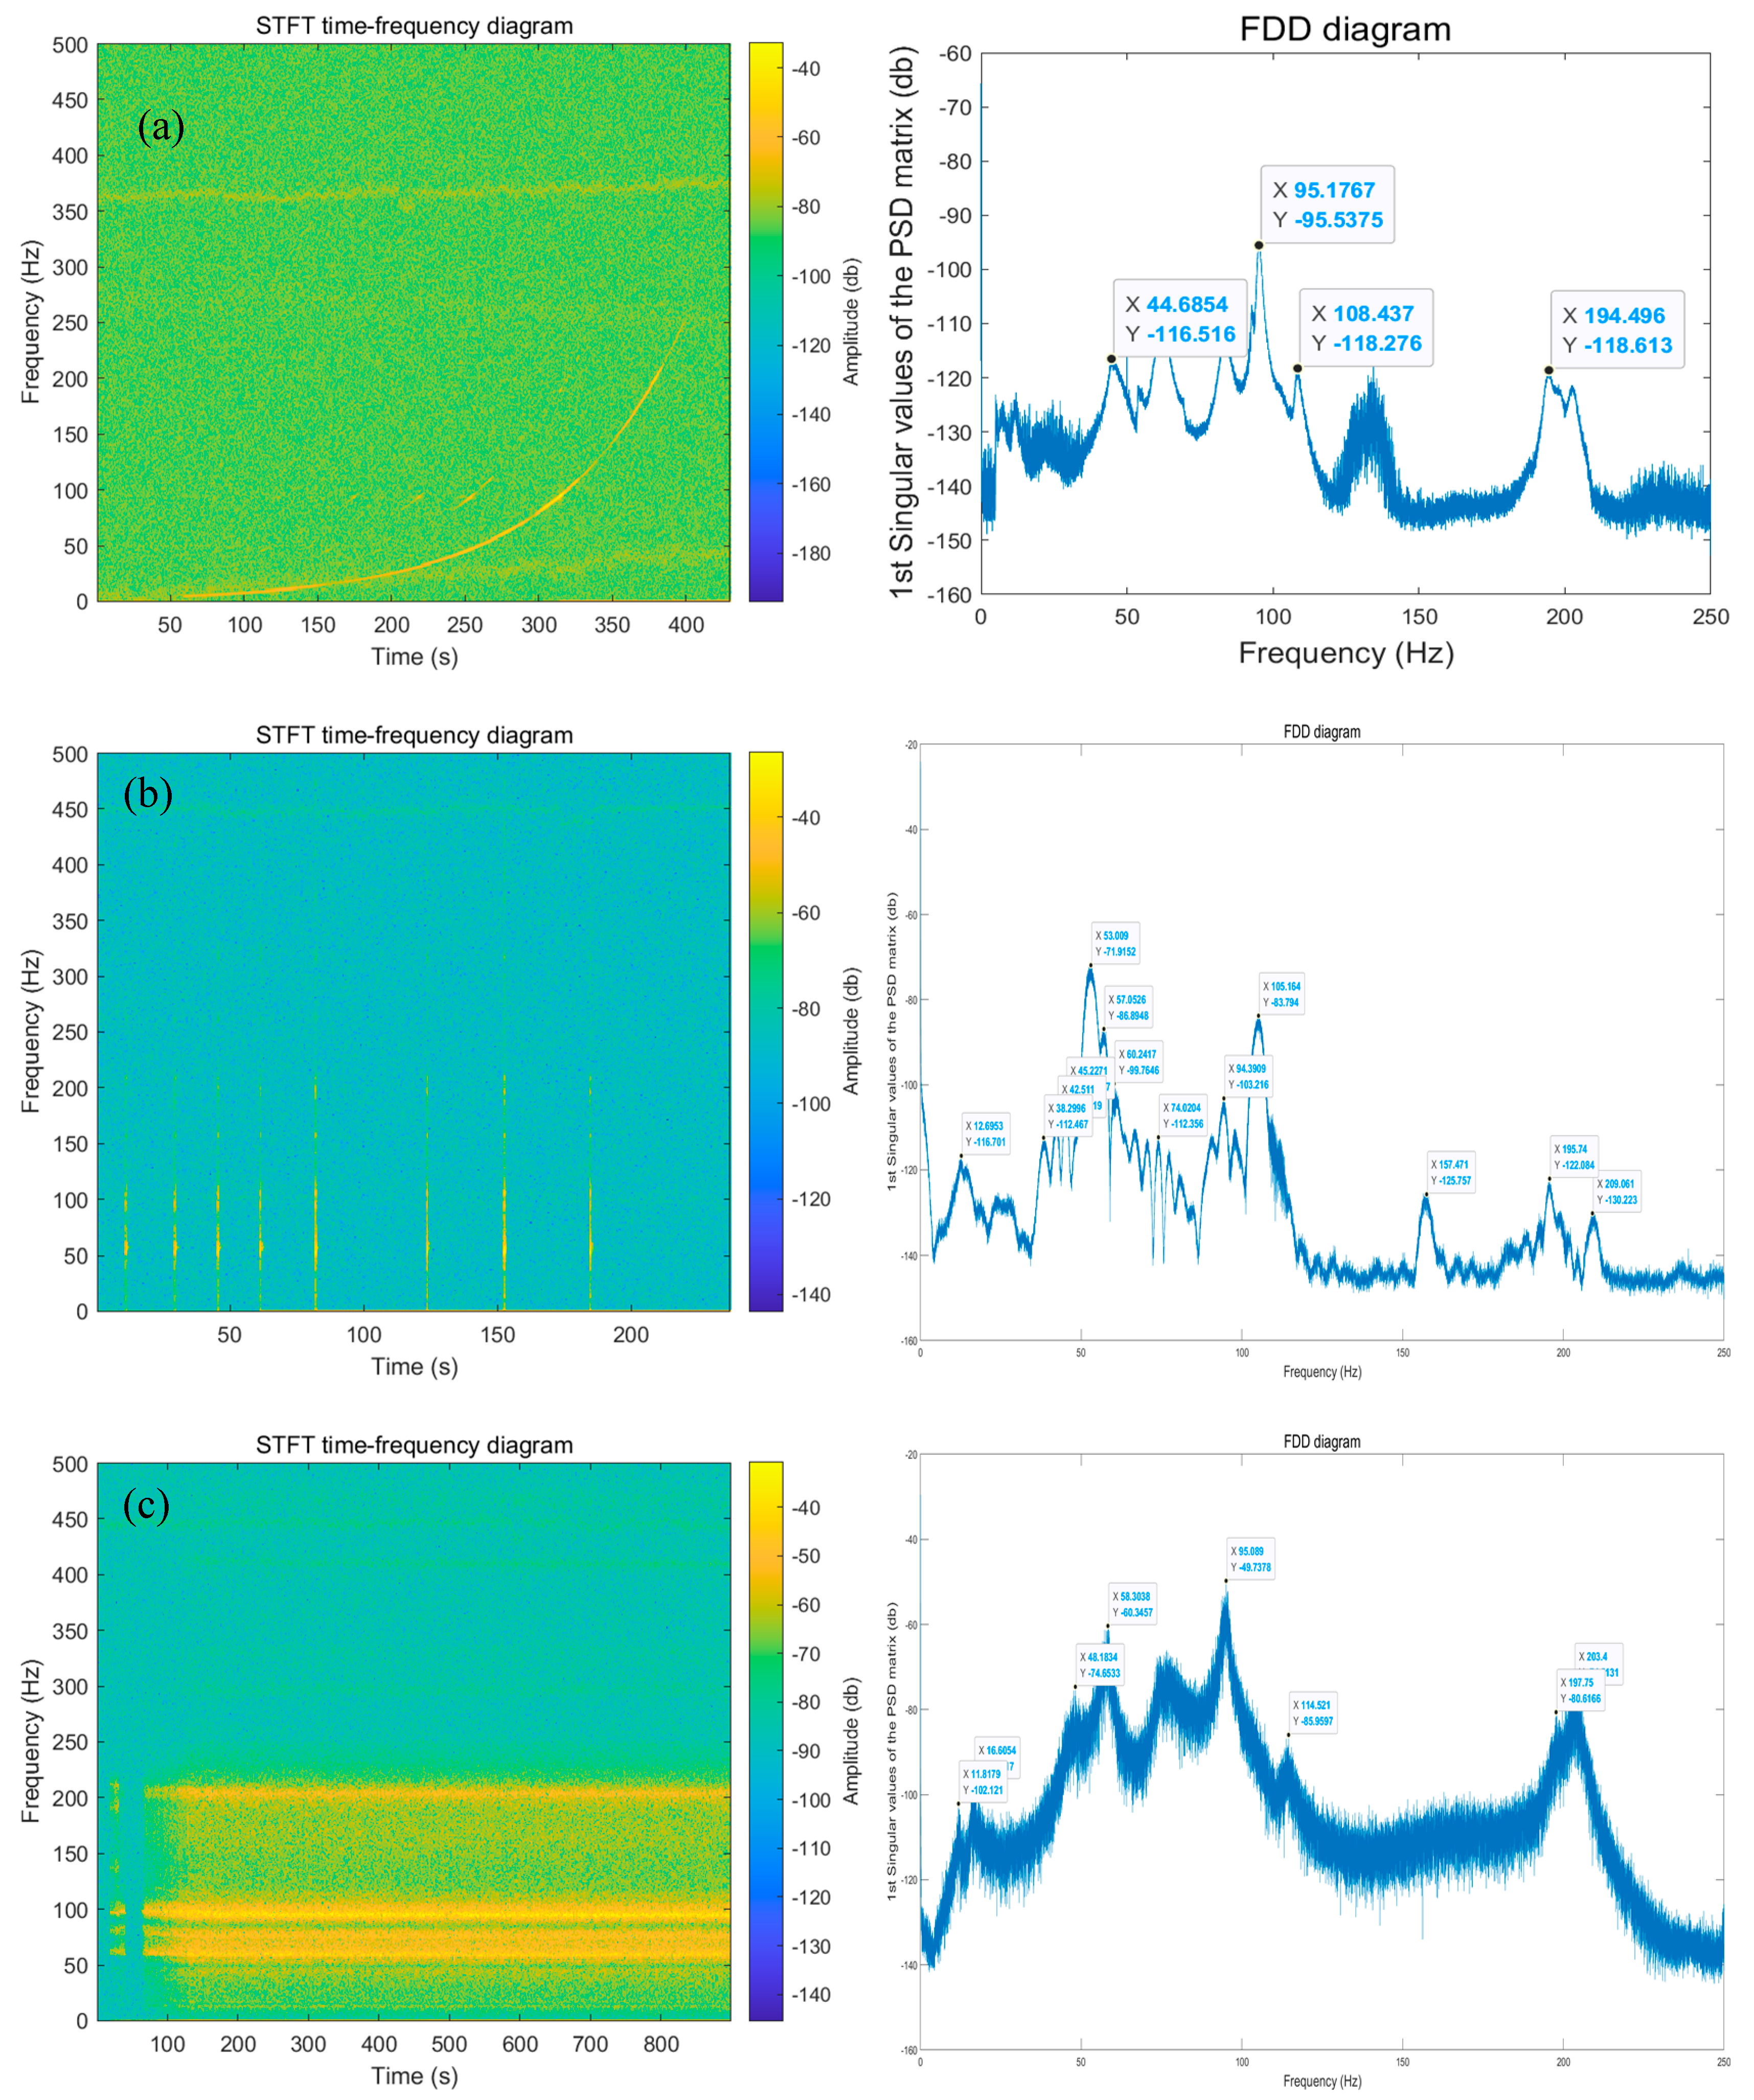
4.1. Sweep Frequency Test

The vertical condition with the largest loading magnitude was selected for analysis, i.e., the vertical sweep frequency test with a sweep frequency of 5–250 Hz and a magnitude of 1 g. In this case, the strain time domain diagrams reflected from the partial signals measured by the sensors attached on the four surfaces of the CFRP antenna beams (the part sensors in the red box in Figure 2) are shown in Figure 9, Figure 10, Figure 11 and Figure 12.
From Figure 9, it can be seen that the strains at each measurement point at the bottom B surface during the loading of the sweep frequency test show reciprocating vibrations and produce large amplitudes at several individual time points. It can be also seen that both transversely and longitudinally pasted measurement points have higher strains, and the values closer to the center of the span are much larger. The transverse strains in the span are generally greater than the longitudinal strains. It is illustrated that the CFRP antenna beam is reciprocating along the vertical direction during the loading process, and the large amplitude at individual time points is due to the fact that the frequency of loading just reaches the natural frequency of the CFRP antenna beam, and thus the resonance phenomenon occurs.
Figure 10 shows a similar pattern to Figure 9. The difference is that transverse measurement points closer to the mid-span have much larger strain, and the vertical measurement point closer to the end restraint has a relatively greater strain. The larger vertical strains near the end restraints are due to the restraint limiting displacements.
Figure 11 also shows a similar pattern to Figure 9. The difference is that the transverse strains closer to the middle of the span are much larger, whereas the vertical strains closer to the restraining end and the middle of the span are much larger, and the values in the portion away from the end and the middle of the span are much smaller. The larger strain at the measurement point near the constraint end can be attributed to the effect of the constraint-limiting displacements. In addition, comparing Figure 9, Figure 10 and Figure 11, it can be observed that the transverse strain in the F surface of the antenna beam is the largest, the transverse strain in the bottom B surface is larger, and the transverse strain in the R surface is smaller. This shows that the F surface of the antenna beam with the protruding surface is subjected to more loads during operation due to the influence of the protruding part of the CFRP antenna beam.
Figure 12 still shows a similar pattern to Figure 9. The difference is that the transverse measurement point closer to the mid-span has a larger strain, and the longitudinal measurement point closer to the constraint end has a relatively larger strain.
To perform a time and frequency domain analysis of the sensor data, a STFT time-frequency diagram was created based on the vibration signals of BH–sensor–d5, which has the largest strain amplitude and gives the most pronounced time-frequency plot, as shown in Figure 13. It can be seen that after the commissioning from 0 s to 250 s, the sweep frequency test completed in the time range of 250 s to 700 s, and the frequency gradually increased from 5 Hz to 250 Hz. It is consistent with the actual loading process of this working condition, which indicates that the FBG sensor can accurately and sensitively measure the micro change in the antenna beam.

4.2. Shock Vibration Test

For the transverse shock vibration test, forward and reverse shock loads were applied with an RMS magnitude of 300 m/s2, and partial of the strain time domain diagrams of the selected sensors are shown in Figure 14. It should be noted that the RMS value can be also calculated from the monitoring data. According to the code [30], the RMS value can be given by the following equation:
R M S = i = 2 n 1 [ ( A S D i + A S D i 1 ) ( f i f i 1 ) 2 ]
where A S D i means the A S D value ((m/s2)2/Hz) of the measured data number “ i ”, f i means the frequency value (Hz) of the measured data number “ i ”.
Because the sensor used in this test is an optical fiber strain sensor, power spectral density (PSD) is used instead of ASD in the above equation to calculate RMS. The data of the BH–sensor–d5 sensor under vertical shock conditions were selected for analysis, as shown in Figure 4b. It can be seen from this that the antenna beam was subjected to eight shocks within 250 s. This article intercepts a segment of 8 s of data for each shock (i.e., 3 s before the shock to 5 s after the shock), and then calculates the PSD and RMS for each segment of data. The RMS values obtained from each shock data are shown in Table 1.
From the table, it can be seen that the RMS values of each section of the shock data are increasing. This is because the shock energy of these eight shocks is gradually increasing, resulting in an increase in the PSD amplitude of each section of the shock data. Moreover, from the calculation formula of RMS, it can be seen that it is positively correlated with the area of the PSD image of the test data, and all RMS values also increase. The RMS value can be used to determine the magnitude of the impact on the antenna beam.
From Figure 14, it can be seen that the CFRP antenna beam was subjected to sixteen shock actions during the shock vibration test, including eight forward shock actions and eight reverse shock actions, and the time domain response data plots show reasonable consistence with the actual loading conditions. The CFRP antenna beam vibrates violently for a short time after each shock action and then stabilizes. The amplitude pattern of each sensor in the shock vibration test has the same shape as that in the sweep frequency test. It is also worth noting that the strains of some measurement points failed to recover with the termination of the shock action, which may be due to the accumulated strain inside the antenna beam located at the position of these correlated points. Figure 15 shows the STFT variation image based on the signals measured by BH–sensor–d5 in the shock vibration test, from which it can be seen that the implementation of shock load corresponded to the actual time of the time domain diagram.

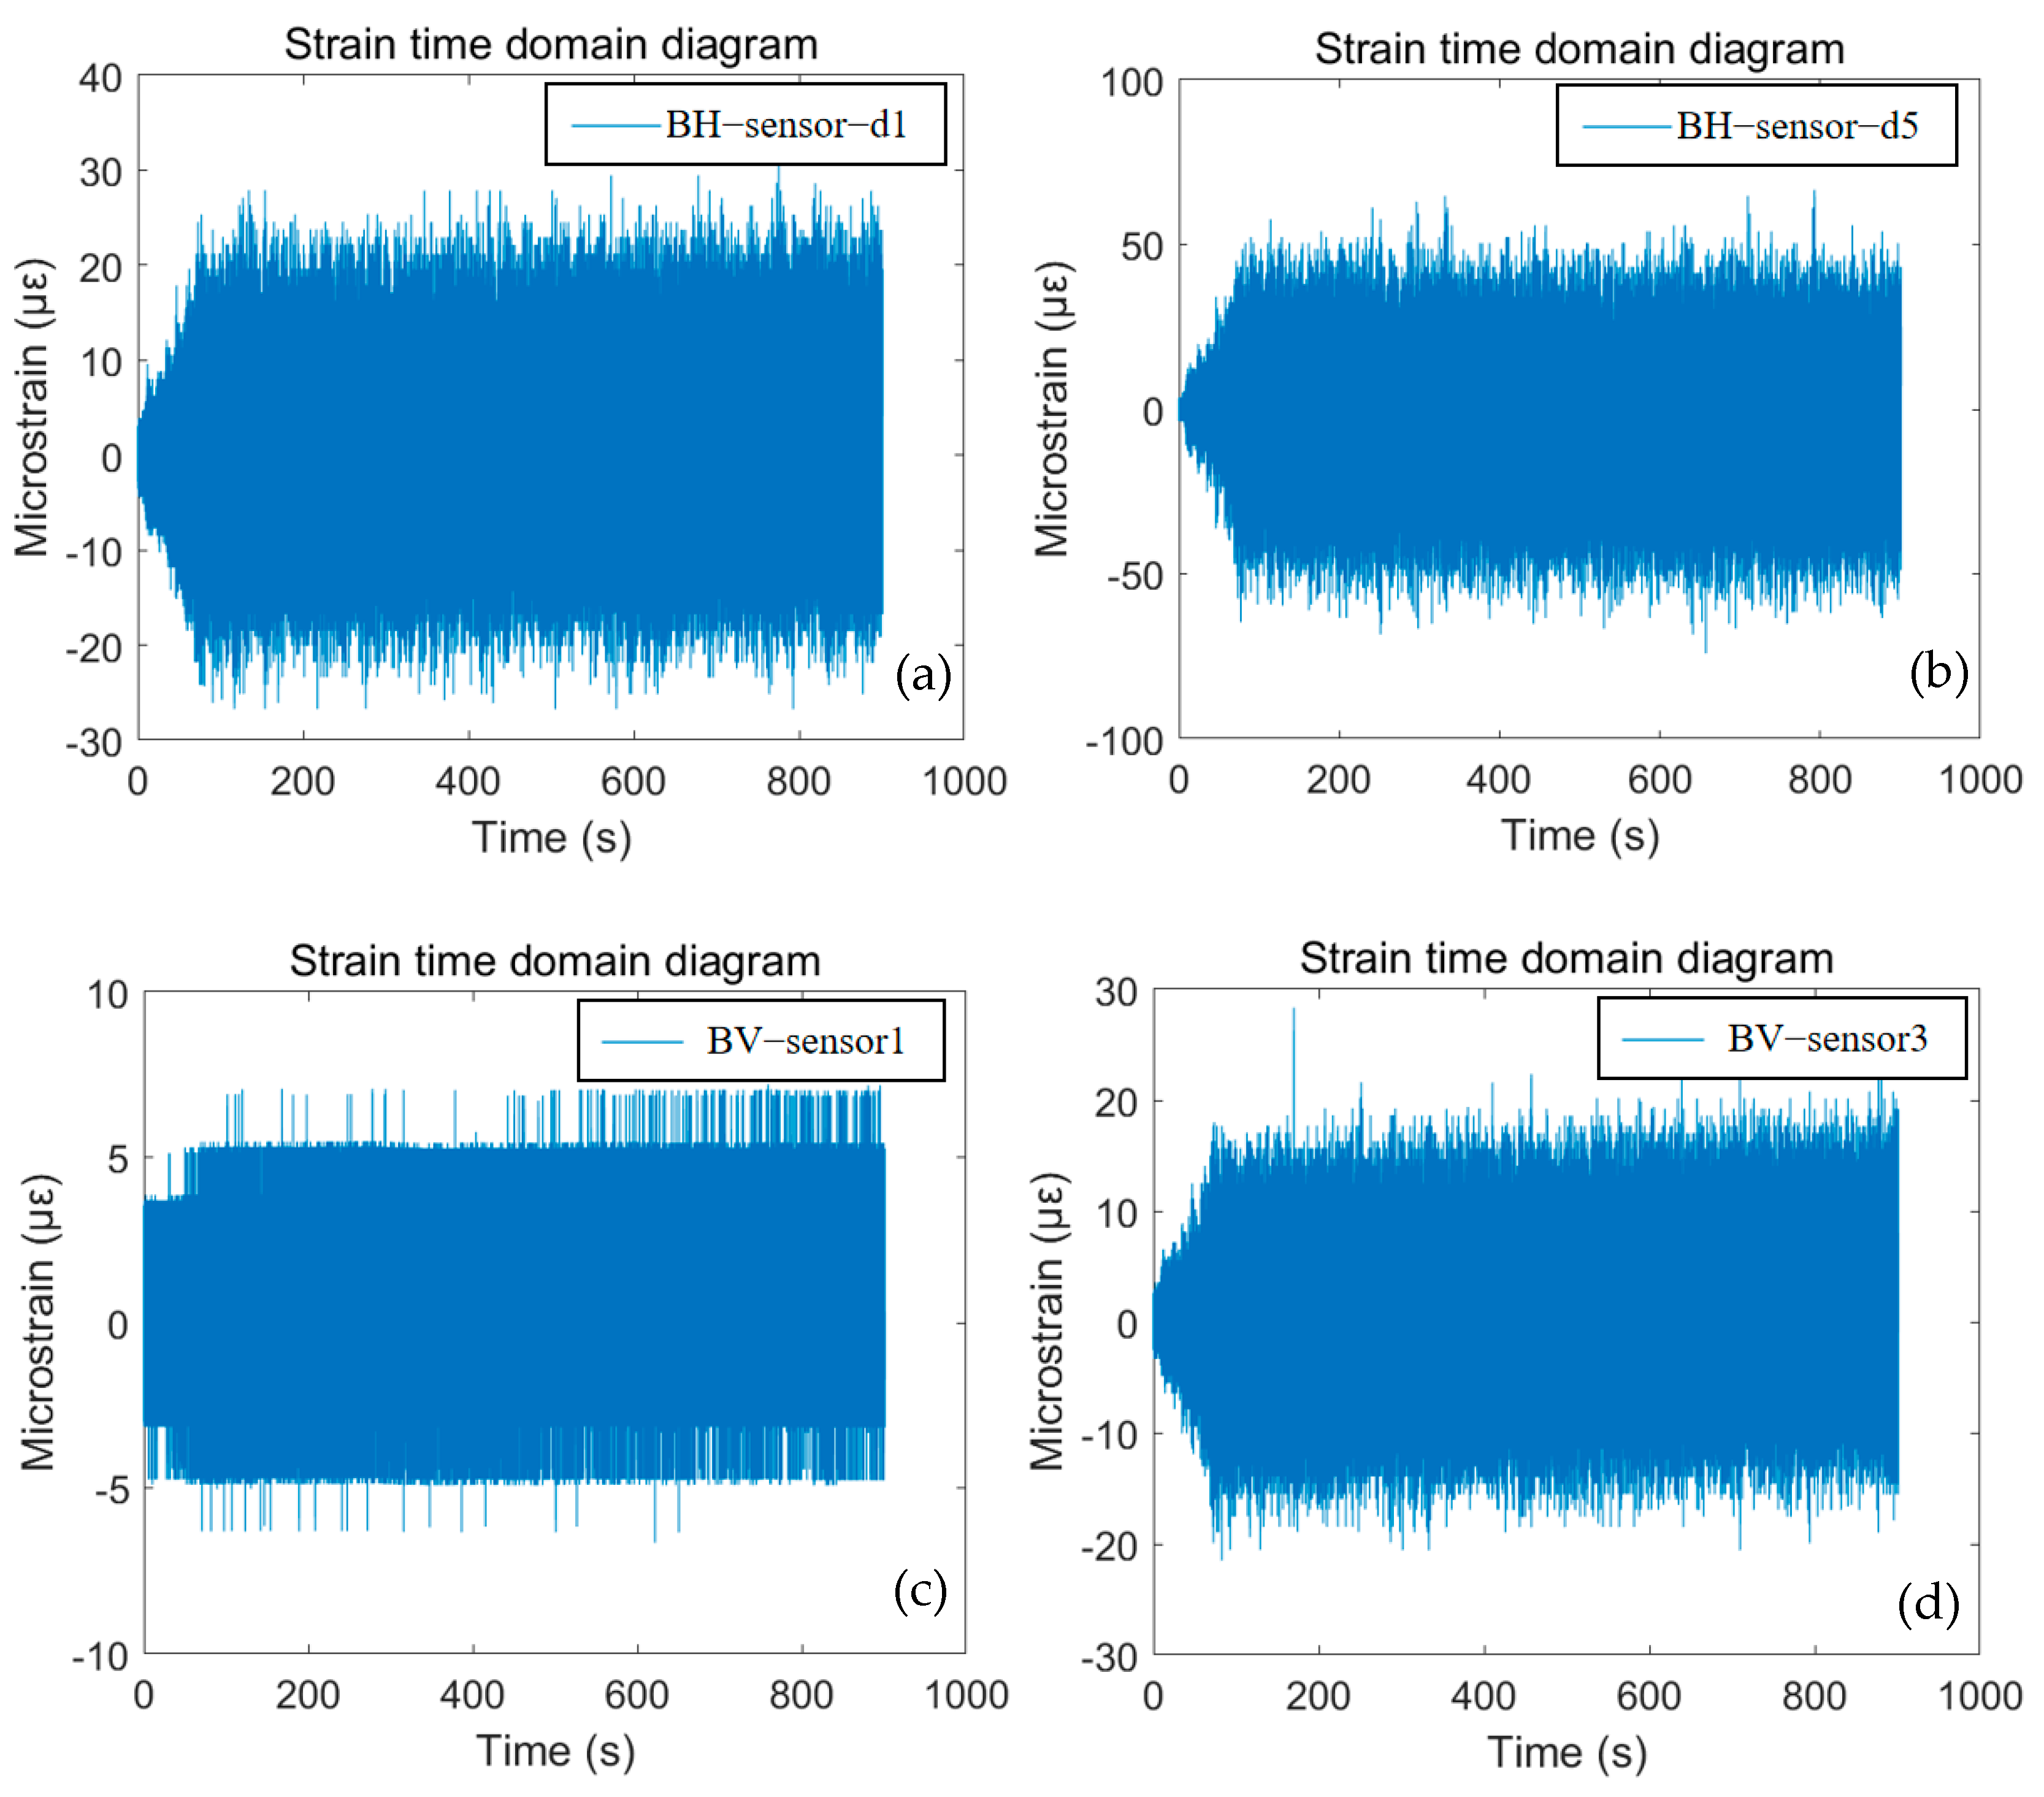
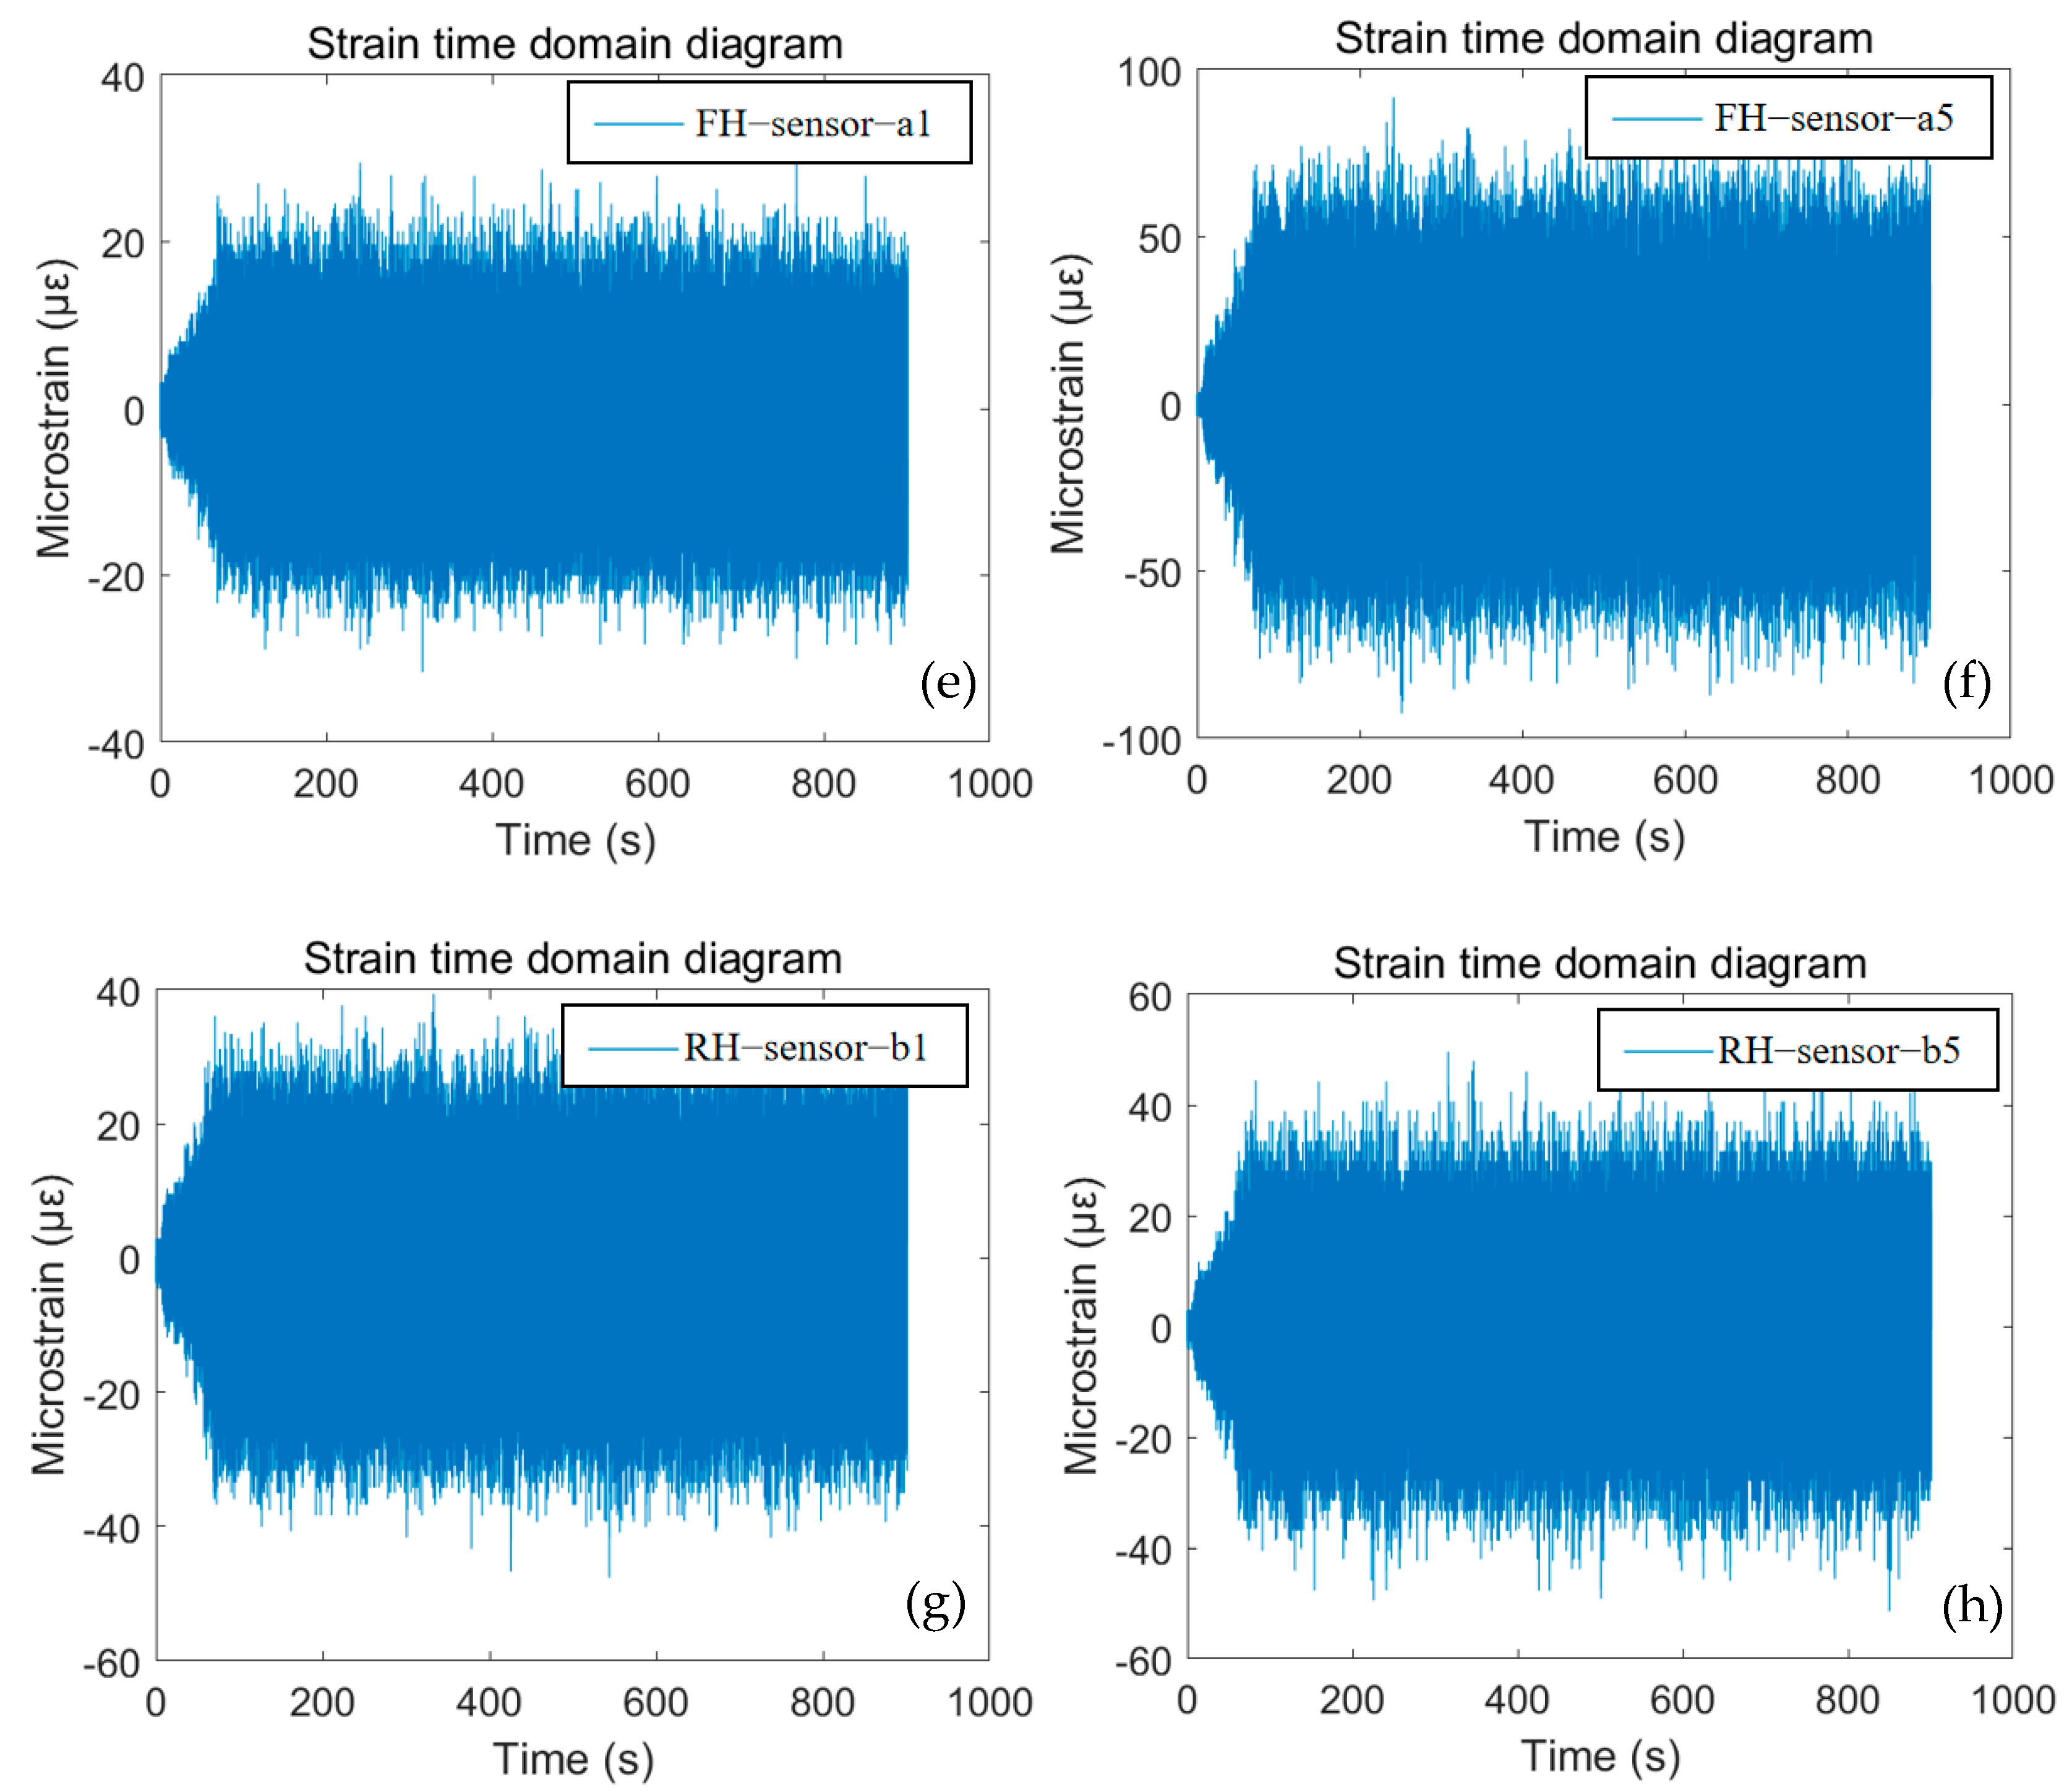
4.3. Simulated Long-Life Vibration Test

A simulated long-life vibration test in longitudinal direction with frequency from 5 Hz to 250 Hz was conducted, and the RMS magnitude is 14.19 m/s2. The strain time domain diagrams of the selected sensors are shown in Figure 16.
Figure 16 shows that the strains at each measurement point on the bottom B surface, F surface, and R surface of the CFRP antenna beam during the loading process vibrate back and forth, and produce large amplitudes at several individual time points. Meanwhile, it can also be seen that no matter whether the measuring points are transversely pasted or longitudinally pasted, the greater strain occurs in the position closer to the center of the span, and the transverse strain is greater than the longitudinal strain in the center of the span. This shows that the antenna beam is in reciprocal vibration during the longitudinal loading process [40], and the large amplitude at individual time points is due to the fact that the loading frequency just reaches the natural frequency of the antenna beam, which leads to the resonance phenomenon [11].
Figure 17 shows the short-time Fourier transform image of the simulated long-life vibration test. It can be seen that the response frequency of the measurement points during the loading process from 10 s to 900 s is concentrated in the range of 5 Hz to 200 Hz, which is in accordance with the actual loading condition.
To identify the natural frequencies of the antenna beams, the frequency domain decomposition (FDD) method was performed by combining the sensing information of all the measurement points.
The PSD function of the response output describes the relationship between the external stimulus input and the measured output response, which can be expressed as [41,42]:
S y y ( j w ) = H ( j w ) * S u u ( j w ) H ( j w ) T
where S u u ( j w ) is the PSD matrix of the input signal. S y y ( j w ) is the PSD matrix of the output response. H ( j w ) is the frequency response function. The superscript * and T represent the complex conjugate and transpose of the matrix, respectively. Under environmental excitation conditions, assuming that the input signal is a white noise signal, the singular value decomposition of S y y ( j w ) can be obtained:
S y y ( j w ) = U ( j w ) S ( j w ) U ( j w ) H
where U ( j w ) = [ u 1 , u 2 , , u m ] is a unitary matrix containing complex vectors of singular values. The superscript H represents the calculation of the conjugate transpose of the matrix. S ( j w ) is a diagonal matrix containing m scalar singular values, and each singular value corresponds to the power spectrum of a single-degree-of-freedom system; m is the number of output response measuring points. The scalar diagonal matrix S ( j w ) sequence peaks correspond to the natural frequencies of the structure.
The transformed results are shown in Figure 18. It illustrates the first-order singular value image of the PSD matrix in the longitudinal simulated long-life vibration test. It can be clearly seen that the first-order singular values show different trends with the change in frequency. Each frequency component is clear in the image and the peaks are obvious, and the natural frequencies of 43.8, 92.5, 105.9, and 195.7 HZ can be accurately identified. The adopted FDD method shows good results in natural frequency identification, and the CFRP antenna beam shows no obvious damage, indicating that the structure has good performance [43,44]. The optical fiber sensor is effective in monitoring the vibration signals.

4.4. Functional Vibration Test

The longitudinal functional vibration test with frequency from 5 Hz to 250 Hz and magnitude 2.51 m/s2 was conducted. Partial strain time domain diagrams of the selected sensors are shown in Figure 19.
From Figure 19, it can be seen that the strains at each measurement point on the bottom B surface, F surface, and R surface of the CFRP antenna beam during the loading process of the functional vibration test are in reciprocal vibration, and large amplitudes are generated at individual time points. Meanwhile, it can also be seen that the strain of the measurement point installed in transverse direction is larger than that closer to the center of the span. The strain of the measurement point installed in longitudinal direction is the largest near the constraint end, the strain in the center of the span is larger, and the strain in the position away from the end and the center of the span is smaller. The transverse strain is larger than the longitudinal strain in the center of the span. It is illustrated that the CFRP antenna beam is vibrating reciprocally along the longitudinal direction during the loading process, and the large amplitude at individual time points is due to the fact that the frequency of the loading just reaches the natural frequency of the antenna beam, which leads to the resonance phenomenon. In addition, Figure 19e–f show that the large vertical strains in the F surface near the constraint end are due to the restraint-limited displacements.
Figure 20 shows the STFT time-frequency diagram performed on the BH–sensor–d5 measurement point. It can be seen that after the commissioning from 0 s to 210 s, the functional vibration test is completed in the time range of 210 s to 800 s. The vibration frequency is distributed from 5 Hz to 150 Hz, which is consistent with the actual loading condition. This indicates the reliable measurement of the FBG sensor. To identify the natural frequencies of the antenna beam, the FDD method was performed by combining the signal information of all measurement points, and the results are shown in Figure 21.
Figure 21 illustrates the first-order singular value image of the PSD matrix in the longitudinal functional vibration test. By observing the image, it can be clearly seen that the first-order singular values show different trends with the frequency variation. Each frequency component is clear in the image and the peaks are obvious, enabling accurate identification of the natural frequencies of 50.0 Hz, 93.8 Hz, 109.3 Hz, and 199.8 Hz. The adopted FDD method shows good results in natural frequency identification, and the CFRP antenna beam shows no obvious damage, indicating that the structure has good performance.

4.5. Vibration Feature Analysis

To intuitively compare the response information of CFRP antenna beam under different vibration modes, the response data of FBG sensor under the sweep frequency test, shock vibration test, and simulated long-life vibration test under vertical loading conditions were extracted. The time-frequency plots obtained by STFT method and natural frequencies obtained by the FDD method are shown in Figure 22.
Preliminary conclusions can be drawn from Figure 22 based on the results of the test analysis: (1) According to the response information measured by the FBG sensor under different working conditions, similar natural frequencies with values approaching 44, 95, 107, and 194 Hz can be extracted, which indicates that the CFRP antenna beam has no obvious damage after the series of vibration tests, and exhibits excellent dynamic performance and stability. It has the potential and feasibility to replace the traditional steel antenna beam. (2) The FBG sensors laid on the surface of CFRP antenna beams can accurately and stably measure their dynamic response, and the installation of the sensing and monitoring system has no additional effect on the dynamic characteristics of CFRP antenna beams.
The antenna beam typically experiences bending vibration in both vertical and longitudinal working conditions. The strain amplitude distribution profiles generally indicate that the strain is higher near the constraint end and the middle span, and gradually decreases as we move away from these areas. While under the transverse loading condition with small load level, it shows stretching vibration, and the strain amplitude distribution profiles are nearly the same along the span. When the transverse loading level is large, it shows bending vibration, and the strain amplitude distribution profiles show that the strain is higher near the constraint end and the middle span, and decreases away from these areas.

5. Conclusions

To check the dynamic performance of the novel CFRP antenna beams under various vibration cases, an experimental investigation was conducted and the surface-attached FBG sensors were adopted to measure the dynamics responses. Based on the time and frequency domain analysis methods, the following conclusions can be drawn from the study:
(1) The CFRP antenna beam exhibits bending vibration in the vertical and longitudinal loading conditions, and the strain amplitude distribution profiles show that the strain near the constraint end and middle span is larger, and the strain away from the constraint end and middle span decreases gradually. In the transverse loading condition, the beam exhibits stretching vibration when the loading level is small.
(2) The CFRP antenna beam exhibited excellent dynamic performance, with strain values reaching a maximum of only 300 µε and natural frequencies observed at 44, 95, 107, and 194 Hz under various working conditions. The CFRP antenna beam has no significant damage after a series of vibration tests, showing excellent dynamic performance and stability, and possessing the potential, effectiveness, and reliability of replacing the traditional steel antenna beam.
(3) The FBG sensors attached on the surface of CFRP antenna beam can accurately and stably measure the dynamic response, and the installation of the sensing and monitoring system has no additional effect on the dynamic characteristics of CFRP antenna beam. This validates that the interfaces between optical fiber sensing elements and CFRP material have excellent interfacial bonding characteristics, which lays a reliable preliminary research basis for the informatization and intelligence development of self-sensing CFRP antenna beam structures.
The study can provide typical cases of the application effects of CFRP materials in the field of rail transit vehicle bogies and their ancillary components, which gives empirical support for research progress and operation development, and also instruct scientific formation of industry standards, CFRP structural strength assessment standards, and maintenance methods for CFRP antenna beam structures. Subsequently, advanced signal processing techniques and machine learning algorithms can be used to process vibration patterns, strain distributions, and frequency response changes to determine the location and severity of damage to the CFRP antenna beam. It also facilitates the development of robust self-sensing CFRP antenna structures.

Author Contributions

Conceptualization and methodology, H.-P.W.; software and writing, C.C.; investigation, C.Z.; data curation, J.M.; supervision, S.-Z.H., J.C.; project administration, L.S. All authors have read and agreed to the published version of the manuscript.

Funding

The work described in this paper was supported by the Innovation Foundation of Provincial Education Department of Gansu (2024B-005); Provincial Projects (22YF7GA182); the Fundamental Research Funds for the Central Universities (No. lzujbky-2022-kb01); Hunan Science Fund for Distinguished Young Scholars (2021JJ10061); Key R&D Program of Hunan Province (2020SK2060).

Data Availability Statement

The raw data supporting the conclusions of this article will be made available by the authors on request.

Acknowledgments

Special thanks are due to Jinping Ou and Zhi Zhou of Dalian University of Technology, and Youhe Zhou and Xingzhe Wang of Lanzhou University. The findings and opinions expressed in this article are only those of the authors and do not necessarily reflect the views of the sponsors.

Conflicts of Interest

Authors Shi-Zhong He, Jian Chen, Liang Sun are employed by the CRRC Zhuzhou Locomotive Co., Ltd. The remaining authors declare that the research was conducted in the absence of any commercial or financial relationships that could be construed as a potential conflict of interest.

References

  1. Xian, G.; Guo, R.; Li, C.; Wang, Y. Mechanical Performance Evolution and Life Prediction of Prestressed CFRP Plate Exposed to Hygrothermal and Freeze-Thaw Environments. Compos. Struct. 2022, 293, 115719. [Google Scholar] [CrossRef]
  2. Saad, K.; Lengyel, A. Strengthening Timber Structural Members with CFRP and GFRP: A State-of-the-Art Review. Polymers 2022, 14, 2381. [Google Scholar] [CrossRef] [PubMed]
  3. Aoki, Y.; Byon (Goichi Ben), O.-I. Damage Detection of CFRP Pipes and Shells by Using Localized Flexibility Method. Adv. Compos. Mater. 2001, 10, 189–198. [Google Scholar] [CrossRef]
  4. Yuan, K.; Liu, K.; Wang, Z.; Wei, K.; Yang, M. Dynamic Fracture in CFRP Laminates: Effect of Projectile Mass and Dimension. Eng. Fract. Mech. 2021, 251, 107764. [Google Scholar] [CrossRef]
  5. Wang, H.; Jiang, L.; Xiang, P. Priority Design Parameters of Industrialized Optical Fiber Sensors in Civil Engineering. Opt. Laser Technol. 2018, 100, 119–128. [Google Scholar] [CrossRef]
  6. Moreno-García, P.; Castro, E.; Romo-Melo, L.; Gallego, A.; Roldán, A. Vibration Tests in CFRP Plates for Damage Detection via Non-Parametric Signal Analysis. Shock Vib. 2012, 19, 385835. [Google Scholar] [CrossRef]
  7. Zhang, X.; Hao, H.; Shi, Y.; Cui, J.; Zhang, X. Static and Dynamic Material Properties of CFRP/Epoxy Laminates. Constr. Build. Mater. 2016, 114, 638–649. [Google Scholar] [CrossRef]
  8. Wang, H.; Xiang, P.; Jiang, L. Optical Fiber Sensor Based In-Field Structural Performance Monitoring of Multilayered Asphalt Pavement. J. Light. Technol. 2018, 36, 3624–3632. [Google Scholar] [CrossRef]
  9. Sikdar, S.; Liu, D.; Kundu, A. Acoustic Emission Data Based Deep Learning Approach for Classification and Detection of Damage-Sources in a Composite Panel. Compos. Part B Eng. 2022, 228, 109450. [Google Scholar] [CrossRef]
  10. Sikdar, S.; Mirgal, P.; Banerjee, S. Low-Velocity Impact Source Localization in a Composite Sandwich Structure Using a Broadband Piezoelectric Sensor Network. Compos. Struct. 2022, 291, 115619. [Google Scholar] [CrossRef]
  11. Lan, Z.; Saito, O.; Yu, F.; Okabe, Y. Impact Damage Detection in Woven CFRP Laminates Based on a Local Defect Resonance Technique with Laser Ultrasonics. Mech. Syst. Signal Process. 2024, 207, 110929. [Google Scholar] [CrossRef]
  12. Melo, J.D.D.; Radford, D.W. Time and Temperature Dependence of the Viscoelastic Properties of CFRP by Dynamic Mechanical Analysis. Compos. Struct. 2005, 70, 240–253. [Google Scholar] [CrossRef]
  13. Tsuda, H. Ultrasound and Damage Detection in CFRP Using Fiber Bragg Grating Sensors. Compos. Sci. Technol. 2006, 66, 676–683. [Google Scholar] [CrossRef]
  14. Fu, T.; Liu, Y.; Li, Q.; Leng, J. Fiber Optic Acoustic Emission Sensor and Its Applications in the Structural Health Monitoring of CFRP Materials. Opt. Lasers Eng. 2009, 47, 1056–1062. [Google Scholar] [CrossRef]
  15. Luyckx, G.; Voet, E.; Waele, W.D.; Degrieck, J. Multi-Axial Strain Transfer from Laminated CFRP Composites to Embedded Bragg Sensor: I. Parametric Study. Smart Mater. Struct. 2010, 19, 105017. [Google Scholar] [CrossRef]
  16. Panopoulou, A.; Loutas, T.; Roulias, D.; Fransen; Kostopoulos, V. Dynamic Fiber Bragg Gratings Based Health Monitoring System of Composite Aerospace Structures. Acta Astronaut. 2011, 69, 445–457. [Google Scholar] [CrossRef]
  17. Wu, Q.; Yu, F.; Okabe, Y.; Kobayashi, S. Application of a Novel Optical Fiber Sensor to Detection of Acoustic Emissions by Various Damages in CFRP Laminates. Smart Mater. Struct. 2014, 24, 015011. [Google Scholar] [CrossRef]
  18. Lu, S.; Jiang, M.; Sui, Q.; Sai, Y.; Jia, L. Damage Identification System of CFRP Using Fiber Bragg Grating Sensors. Compos. Struct. 2015, 125, 400–406. [Google Scholar] [CrossRef]
  19. Wang, H.-P.; Ni, Y.-Q.; Dai, J.-G.; Yuan, M.-D. Interfacial Debonding Detection of Strengthened Steel Structures by Using Smart CFRP-FBG Composites. Smart Mater. Struct. 2019, 28, 115001. [Google Scholar] [CrossRef]
  20. Wang, H.; Dai, J.-G. Strain Transfer Analysis of Fiber Bragg Grating Sensor Assembled Composite Structures Subjected to Thermal Loading. Compos. Part B Eng. 2019, 162, 303–313. [Google Scholar] [CrossRef]
  21. Goossens, S.; Berghmans, F.; Sharif Khodaei, Z.; Lambinet, F.; Karachalios, E.; Saenz-Castillo, D.; Geernaert, T. Practicalities of BVID Detection on Aerospace-Grade CFRP Materials with Optical Fibre Sensors. Compos. Struct. 2021, 259, 113243. [Google Scholar] [CrossRef]
  22. Budadin, O.; Vavilov, V.; Fedotov, M.; Vasiliev, S.; Gnusin, P.; Kozelskaya, S.; Kuimova, M. Theoretical and Experimental Studies of Structural Health Monitoring of Carbon Composites with Integrated Optical Fiber Sensors Based on Fiber Bragg Gratings. J Nondestruct. Eval 2021, 40, 89. [Google Scholar] [CrossRef]
  23. Wang, H.-P.; Chen, C.; Ni, Y.-Q.; Jayawickrema, M.; Epaarachchi, J. Computer-Aided Feature Recognition of CFRP Plates Based on Real-Time Strain Fields Reflected from FBG Measured Signals. Compos. Part B Eng. 2023, 263, 110866. [Google Scholar] [CrossRef]
  24. Chen, C.; Wang, H.-P.; Ma, J.; Wusiman, M. Dynamic Feature Identification of Carbon-Fiber-Reinforced Polymer Laminates Based on Fiber Bragg Grating Sensing Technology. Buildings 2023, 13, 2292. [Google Scholar] [CrossRef]
  25. Alarifi, I.M. Investigation the Conductivity of Carbon Fiber Composites Focusing on Measurement Techniques under Dynamic and Static Loads. J. Mater. Res. Technol. 2019, 8, 4863–4893. [Google Scholar] [CrossRef]
  26. Wei, X.; Russell, J.; Živanović, S.; Toby Mottram, J. Measured Dynamic Properties for FRP Footbridges and Their Critical Comparison against Structures Made of Conventional Construction Materials. Compos. Struct. 2019, 223, 110956. [Google Scholar] [CrossRef]
  27. Barile, C. Innovative Mechanical Characterization of CFRP by Using Acoustic Emission Technique. Eng. Fract. Mech. 2019, 210, 414–421. [Google Scholar] [CrossRef]
  28. Sikdar, S.; Mirgal, P.; Banerjee, S.; Ostachowicz, W. Damage-Induced Acoustic Emission Source Monitoring in a Honeycomb Sandwich Composite Structure. Compos. Part B Eng. 2019, 158, 179–188. [Google Scholar] [CrossRef]
  29. Sikdar, S.; Fiborek, P.; Kudela, P.; Banerjee, S.; Ostachowicz, W. Effects of Debonding on Lamb Wave Propagation in a Bonded Composite Structure under Variable Temperature Conditions. Smart Mater. Struct. 2018, 28, 015021. [Google Scholar] [CrossRef]
  30. IEC 61373; Railway Applications–Rolling Stock Equipment–Shock and Vibration Tests. GlobalSpec: Albany, NY, USA. Available online: https://standards.globalspec.com/std/1256084/IEC%2061373 (accessed on 23 June 2024).
  31. Wang, H.; Xiang, P.; Jiang, L. Strain Transfer Theory of Industrialized Optical Fiber-Based Sensors in Civil Engineering: A Review on Measurement Accuracy, Design and Calibration. Sens. Actuators A Phys. 2019, 285, 414–426. [Google Scholar] [CrossRef]
  32. Wang, H.; Jiang, L.; Xiang, P. Improving the Durability of the Optical Fiber Sensor Based on Strain Transfer Analysis. Opt. Fiber Technol. 2018, 42, 97–104. [Google Scholar] [CrossRef]
  33. Nawab, S.; Quatieri, T.; Lim, J. Signal Reconstruction from Short-Time Fourier Transform Magnitude. IEEE Trans. Acoust. Speech Signal Process. 1983, 31, 986–998. [Google Scholar] [CrossRef]
  34. Wang, H.-P.; Gong, X.-S.; Wang, X.-Z.; Feng, S.-Y.; Yang, T.-L.; Guo, Y.-X. Discrete Curvature-Based Shape Configuration of Composite Pipes for Local Buckling Detection Based on Fiber Bragg Grating Sensors. Measurement 2022, 188, 110603. [Google Scholar] [CrossRef]
  35. Wang, H.; Sun, W.; Sun, W.; Ren, Y.; Zhou, Y.; Qian, Q.; Kumar, A. A novel tool condition monitoring based on Gramian angular field and comparative learning. Int. J. Hydromechatronics 2023, 6, 93–107. [Google Scholar] [CrossRef]
  36. Wang, D.; Gao, L.; Qu, Y.; Sun, X.; Liao, W. Frequency-to-spectrum mapping GAN for semisupervised hyperspectral anomaly detection. CAAI Trans. Intell. Technol. 2023, 8, 1258–1273. [Google Scholar] [CrossRef]
  37. Liu, B.; Lu, W. Surrogate Models in Machine Learning for Computational Stochastic Multi-Scale Modelling in Composite Materials Design. Int. J. Hydromechatronics 2022, 5, 336–365. [Google Scholar] [CrossRef]
  38. Du, H.; Du, S.; Li, W. Probabilistic Time Series Forecasting with Deep Non-Linear State Space Models. CAAI Trans. Intell. Technol. 2023, 8, 3–13. [Google Scholar] [CrossRef]
  39. Luo, C. KELL: A kernel-embedded local learning for data-intensive modeling. Artif. Intell. Appl. 2024, 2, 38–44. [Google Scholar] [CrossRef]
  40. Panella, F.; Pirinu, A. Fatigue and Damage Analysis on Aeronautical CFRP Elements under Tension and Bending Loads: Two Cases of Study. Int. J. Fatigue 2021, 152, 106403. [Google Scholar] [CrossRef]
  41. Brincker, R.; Zhang, L.; Andersen, P. Modal Identification of Output-Only Systems Using Frequency Domain Decomposition. Smart Mater. Struct. 2001, 10, 441. [Google Scholar] [CrossRef]
  42. Amador, S.D.R.; Brincker, R. Robust Multi-Dataset Identification with Frequency Domain Decomposition. J. Sound Vib. 2021, 508, 116207. [Google Scholar] [CrossRef]
  43. Rahnamay Farnod, B.; Reinhart, W.F.; Napolitano, R.K. Displacement-Based Structural Identification Using Differentiable Physics. Eng. Struct. 2023, 293, 116632. [Google Scholar] [CrossRef]
  44. Guo, D.; Wang, H.-P.; Liu, Y.-L.; Gao, W.-Y.; Dai, J.-G. Structural Behavior of CFRP-Strengthened Steel Beams at Different Service Temperatures: Experimental Study and FE Modeling. Eng. Struct. 2023, 293, 116646. [Google Scholar] [CrossRef]
Figure 1. A 3D model of the CFRP antenna beam.
Buildings 14 02249 g001
Figure 2. The layout of FBG sensors attached on the surfaces of CFRP antenna beam: (a) bottom B surface; (b) F surface; (c) R surface; (d) T surface; and (e) physical photo of the CFRP antenna beam.
Buildings 14 02249 g002aBuildings 14 02249 g002b
Figure 3. The major testing procedures of CFRP antenna beam.
Buildings 14 02249 g003
Figure 4. The time domain response of BH–sensor–d5 sensor: (a) sweep frequency test; (b) shock vibration test; (c) simulated long-life vibration test; and (d) constant frequency vibration test.
Buildings 14 02249 g004
Figure 5. The STFT time-frequency diagram of BH–sensor–d5 sensor: (a) sweep frequency test; (b) shock vibration test; (c) simulated long-life vibration test; and (d) constant frequency vibration test.
Buildings 14 02249 g005
Figure 6. The maximum transverse strain distribution diagram under vertical working conditions: (a) bottom B surface; (b) F surface; and (c) R surface.
Buildings 14 02249 g006
Figure 7. The maximum transverse strain distribution diagram under longitudinal conditions: (a) bottom B surface; (b) F surface; and (c) R surface.
Buildings 14 02249 g007
Figure 8. The maximum transverse strain distribution diagram under transverse working condition: (a) bottom B surface; (b) F surface; and (c) R surface.
Buildings 14 02249 g008
Figure 9. The strain time domain diagrams of the partial sensors at the bottom B surface of the vertical sweep frequency test: (a) BH–sensor–d1; (b) BH–sensor–d5; (c) BV–sensor1; and (d) BV–sensor3.
Buildings 14 02249 g009
Figure 10. The strain time domain diagrams of the partial sensors at the F surface of the vertical sweep frequency test: (a) FH–sensor–a1; (b) FH–sensor–a5; (c) FV–sensor3; and (d) FV–sensor4.
Buildings 14 02249 g010aBuildings 14 02249 g010b
Figure 11. The strain time domain diagrams of the partial sensors at the R surface of the vertical sweep frequency test: (a) RH–sensor–b1; (b) RH–sensor–b5; (c) RV–sensor4; and (d) RV–sensor6.
Buildings 14 02249 g011aBuildings 14 02249 g011b
Figure 12. The strain time domain diagrams of the sensors at the T surface of the vertical sweep frequency test: (a) TH–sensor2; (b) TH–sensor1; (c) TV–sensor2; and (d) TV–sensor1.
Buildings 14 02249 g012
Figure 13. The STFT time-frequency diagram of BH–sensor–d5 in the vertical sweep frequency test.
Buildings 14 02249 g013
Figure 14. The strain time domain diagrams of the partial sensors in the transverse shock vibration test: (a) BH–sensor–d1; (b) BH–sensor–d5; (c) BV–sensor1; (d) BV–sensor3; (e) FH–sensor–a1; and (f) FH–sensor–a5.
Buildings 14 02249 g014
Figure 15. The STFT time-frequency diagram of BH–sensor–d5 in transverse shock vibration test.
Buildings 14 02249 g015
Figure 16. The strain time domain diagrams of the partial sensors in the longitudinal simulated long-life vibration test: (a) BH–sensor–d1; (b) BH–sensor–d5; (c) BV–sensor1; (d) BV–sensor3; (e) FH–sensor–a1; (f) FH–sensor–a5; (g) RH–sensor–b1; and (h) RH–sensor–b5.
Buildings 14 02249 g016aBuildings 14 02249 g016b
Figure 17. The STFT time-frequency diagram of BH–sensor–d5 in longitudinal simulated long-life vibration test.
Buildings 14 02249 g017
Figure 18. The FDD results of the longitudinal simulated long-life vibration test.
Buildings 14 02249 g018
Figure 19. The strain time domain diagrams of partial sensors in the longitudinal functional vibration test: (a) BH–sensor–d1; (b) BH–sensor–d5; (c) BV–sensor1; (d) BV–sensor3; (e) FH–sensor–a1; (f) FH–sensor–a5; (g) RH–sensor–b1; and (h) RH–sensor–b5.
Buildings 14 02249 g019aBuildings 14 02249 g019b
Figure 20. The STFT time-frequency diagram of BH–sensor–d5 in longitudinal functional vibration test.
Buildings 14 02249 g020
Figure 21. The FDD results of the longitudinal functional vibration test.
Buildings 14 02249 g021
Figure 22. The STFT and natural frequency extraction diagrams with load in vertical direction: (a) sweep frequency test; (b) shock vibration test; and (c) simulated long-life vibration test.
Buildings 14 02249 g022
Table 1. The RMS values of each shock under vertical shock condition.
Shock Num12345678
RMS0.00840.01090.01250.01480.01940.02610.02790.0282
Disclaimer/Publisher’s Note: The statements, opinions and data contained in all publications are solely those of the individual author(s) and contributor(s) and not of MDPI and/or the editor(s). MDPI and/or the editor(s) disclaim responsibility for any injury to people or property resulting from any ideas, methods, instructions or products referred to in the content.

