Article

Advanced Fatigue Assessment of Riveted Railway Bridges on Existing Masonry Abutments: An Italian Case Study

Department of Structures for Engineering and Architecture, Via Forno Vecchio 36, 80134 Naples, Italy
*
Author to whom correspondence should be addressed.
Buildings 2024, 14(8), 2271; https://doi.org/10.3390/buildings14082271
Submission received: 16 June 2024 / Revised: 19 July 2024 / Accepted: 20 July 2024 / Published: 23 July 2024

Abstract

:
Riveted railway bridges with already long structural lives can still be commonly found in service in Europe. In light of their peculiarities, they are often prone to fatigue damage; nevertheless, very few prescriptions regarding fatigue assessment of these structures can be found in current European provisions. Within this framework, the present paper illustrates the advanced fatigue assessment of an Italian riveted railway bridge selected as a case study. For this purpose, multi-scale finite element modelling of the bridge was developed, and the most critical details were assessed through application of the advanced strain energy density (SED) method. The obtained outcomes were compared both with other studies in the literature and prescriptions from the current and upcoming versions of EN1993-1-9.

1. Introduction

Riveted connections represent the most common structural detail implemented in steel bridges erected in the XIXth century and the first half of the XXth century [1,2,3]. Hot-driven rivets (HDRs) were usually adopted to either couple hot-rolled members into built-up sections—that is, by means of riveted battens—or to assemble truss nodes with a high density of rivets resisting to shear. These recurring practices had their roots in previous, empirical knowledge gained from timber structures [4,5,6].
In particular, riveted connections are commonly found in older railway bridges; notably, about 30% of them have already endured more than 100 years of service life [7,8]. This condition—in conjunction with (i) structural shortages deriving from the lack of adequate provisions at the time of erection, (ii) peculiar constructional imperfections deriving from the hot-driving process (HDP), and (iii) the diffuse increase of traffic loads in recent times—leaves riveted details exposed to severe fatigue damage. This further proves to be a critical issue if one considers the limited redundancy of truss bridge structures [9,10,11,12].
Nevertheless, in current European provisions (EN1993-1-9 [13]), very limited indications are given to designers for fatigue assessment of such details. Namely, while two detail classes (DCs) were proposed in the Eurocode 3 background document [14]—i.e., DC71 for one-sided riveted joints and DC90 for double-covered riveted joints—the current version of EN1993-1-9 does not include any DC related to riveted connections. Therefore, it should not be a surprise that the proper fatigue assessment of such details still represents an open field of research [5,7,15].
To this end, it is worth noting that some remarkable research efforts devoted to the fatigue performance of riveted connections can be found in the scientific literature.
Bertolesi et al. [7] investigated the fatigue performance of riveted details belonging to a 110-year-old, 170 m long truss bridge located in Spain. To this end, both numerical and experimental tests were performed, suggesting that a variable DC between 63 and 71 MPa should be selected for riveted details belonging to bridge crossbeams. The authors also reported that the fatigue life of full-scale assemblies had been almost reached prior to testing, i.e., highlighting the potential risk of fatigue failures in older riveted bridges still in service.
In the same fashion, Pedrosa et al. [2] investigated the fatigue response of single- and double-splice riveted shear connections assembled with rivets drawn from the well-known Luiz I bridge (Porto, Portugal). According to the authors, the fatigue resistance of single-splice details (DC = 55 MPa) was significantly lower than that of double-splice ones −49%) and not in line with reported recommendations [14]. Estimated slopes of S-N curves (m = 6 and 10, respectively) also appreciably differed from each other and from normative prescriptions.
Useful data regarding strain-life and crack propagation properties in old Portuguese riveted bridges can be also found in De Jesus et al. [1].
With reference to comprehensive fatigue assessment of existing riveted bridges, it is worth mentioning the contributions of Kuzawa et al. [11], Landolfo et al. [16], and De Jesus et al. [17], which assessed the remaining service life of still-operational old infrastructures (having endured service life in the range 65–120 years), accounting for accurate geometry of members and details, traffic load evolution up to the present time, and ongoing material degradation.
Within this framework, the present paper illustrates the advanced fatigue assessment of a case-study riveted railway bridge located in Italy. For this purpose, a multi-scale refined modelling of the structure was performed, and critical details were investigated through the advanced strain energy density (SED) method [18,19,20].
The derived results are hence compared with the literature recommendations [2,21] and normative prescriptions from the upcoming version of prEN1993-1-9:2023 [22], with the aim of providing some useful insights about key factors affecting the fatigue life of existing riveted infrastructures.
In light of the above, this work is mainly divided into four parts, as follows: (i) in the first section, main features of the selected case study are presented; (ii) modelling assumptions for multi-scale finite element models (FEMs) of the bridge are discussed in the second part, with a particular focus on the developed numerical application of the SED method; (iii) the third section illustrates relevant results from advanced fatigue analysis; (iv) finally, derived outcomes are compared with the literature and normative recommendations.

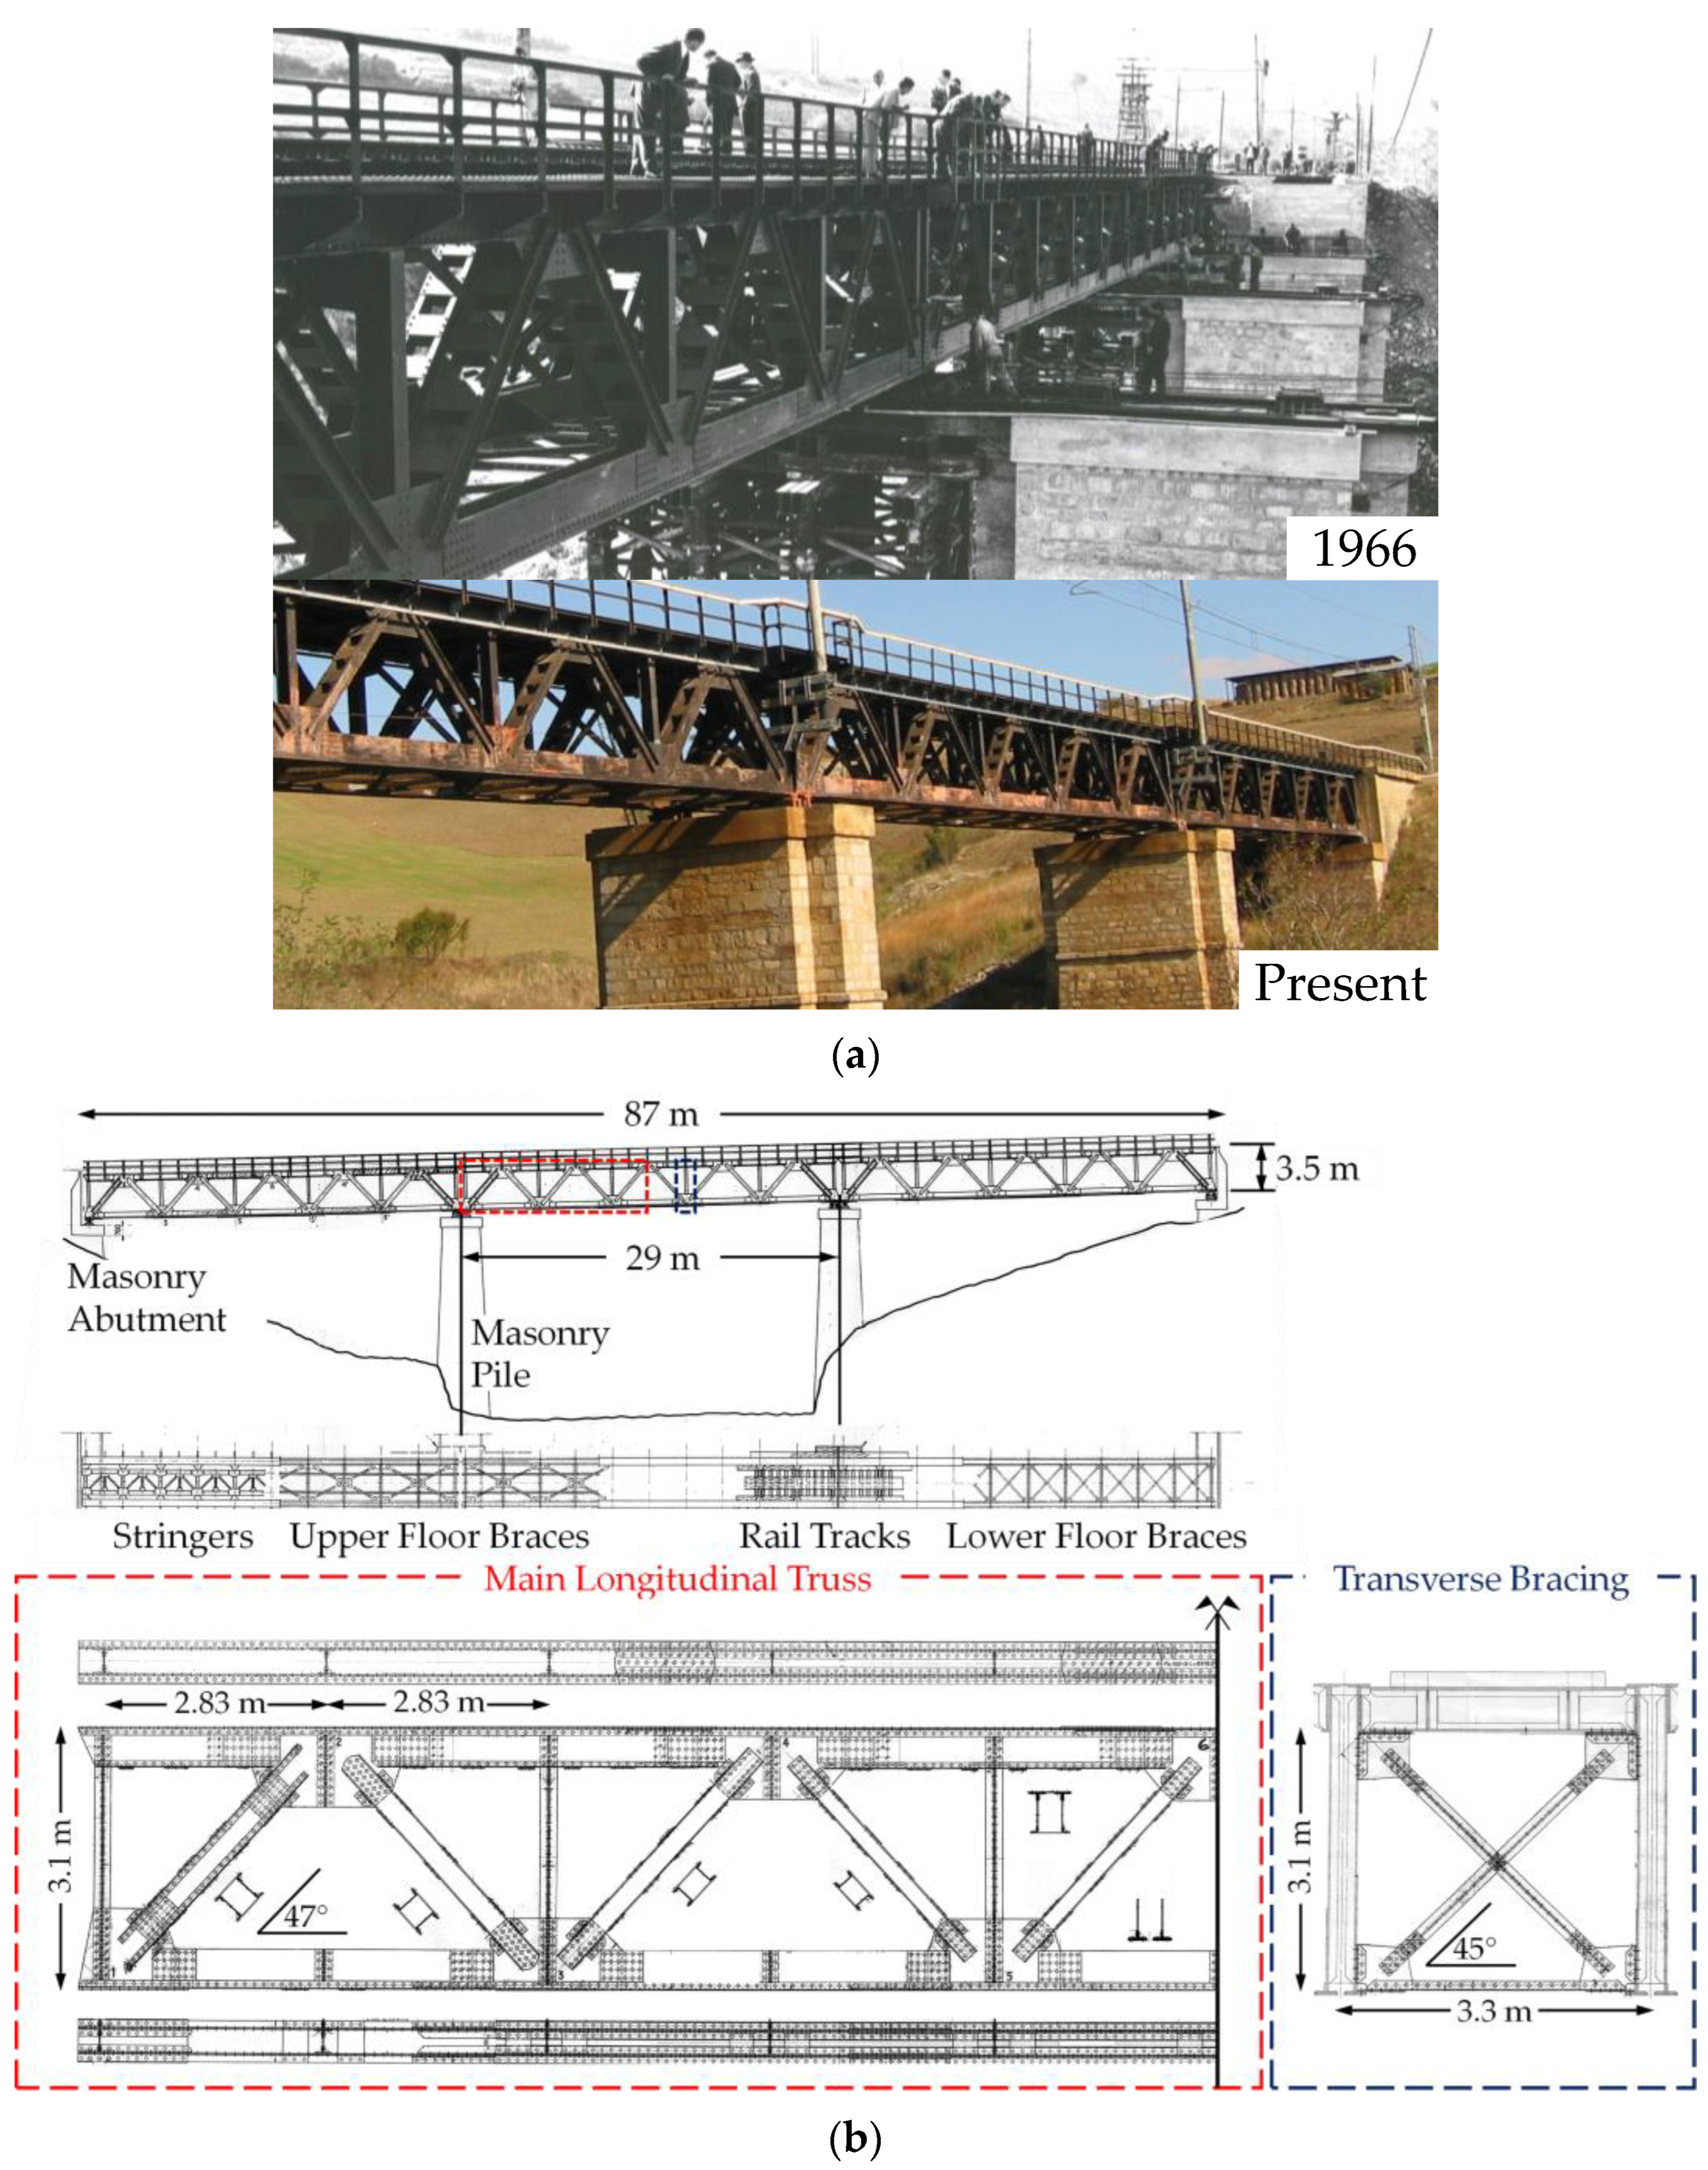
2. Main Features of the Selected Case Study

2.1. Generality

The selected case study (“Gesso Railway Bridge” in Montecalvo Irpino, Italy—see Figure 1a) was erected in 1963–1966 to replace a former five-span masonry bridge which was severely damaged by the 1962 Irpinia earthquake, as massive existing arches partially collapsed under the combined effect of self-weight and seismic loads (size effect [23]).
For this purpose, both original masonry abutments and the central masonry pier were preserved, while the new deck was realized via three identical, simply supported 3D Warren trusses (L = 29 m). Remarkably, a low degree of continuity among the spans was provided by maple sleepers and rail tracks (UIC 60 type, unit weight gr = 60 daN/m).
Sleepers were placed on built-up steel stringers (430 × 170 mm, spacing s = 1.5 m) made of a core plate and four angle profiles. Stringers were in turn connected to H-shaped upper transverse beams (480 × 200 mm), interrupting the longitudinal trusses’ continuity at ≈5.7 m intervals. Built-up X-bracings (2L 80 × 10 mm) and lower beams (2L 100 × 10 mm) complete the transverse stiffening system.
The main longitudinal trusses (spacing s = 3.3 m, see Figure 1b) have a Λ-shaped configuration with consecutive tensile and compressive diagonals being interspersed with built-up H-shaped vertical struts (120 × 100 mm). Diagonals have a ] [-shaped section connected by 10 mm riveted battens.
Remarkably, while the C-shaped parts of the outer (i.e., most stressed) diagonals were made via assembling plates and angles (484 × 380 mm), progressively smaller UPN profiles were used for the inner ones (UPN300—UPN260—UPN220, spacing s = 324 mm).
In order to prevent buckling phenomena due to high compressive forces, large built-up box profiles (550 × 520 mm, composed of two 12 mm webs, four 100 × 10 mm + two 80 × 10 mm Ls, and 10 mm backing plates on both sides) were adopted for the upper chords. On the other hand, lower chords feature an inverted Π section (532 × 510 mm) realized via two 12 mm webs, four 100 × 10 mm Ls, and two 10 mm backing plates on the lower side.
The 3D truss structure is completed by both lower and upper floor bracings, i.e., made of back-to-back built-up 80 × 10 mm Ls. Notably, the upper bracings have been placed at double spacing (5.66 m) compared with the lower ones. Nevertheless, the upper side of the truss is further stiffened by single 80 × 10 mm Ls connecting adjacent sleepers.
The connection between the steel structure and existing masonry piers and abutments uses casted-steel rollers and pinned bearings placed at each span ends.
Steel members and plates are all made of Fe 50.2 steel (yield strength fy = 340 N/mm2, ultimate tensile strength fu = 500 N/mm2), which is no longer produced in Europe, although it can be compared to modern S355 steel grade. “High-quality” Aq 34 mild steel (fyr = 185 N/mm2, fur = 340 N/mm2) was instead used for Ø22 hot-driven rivets.

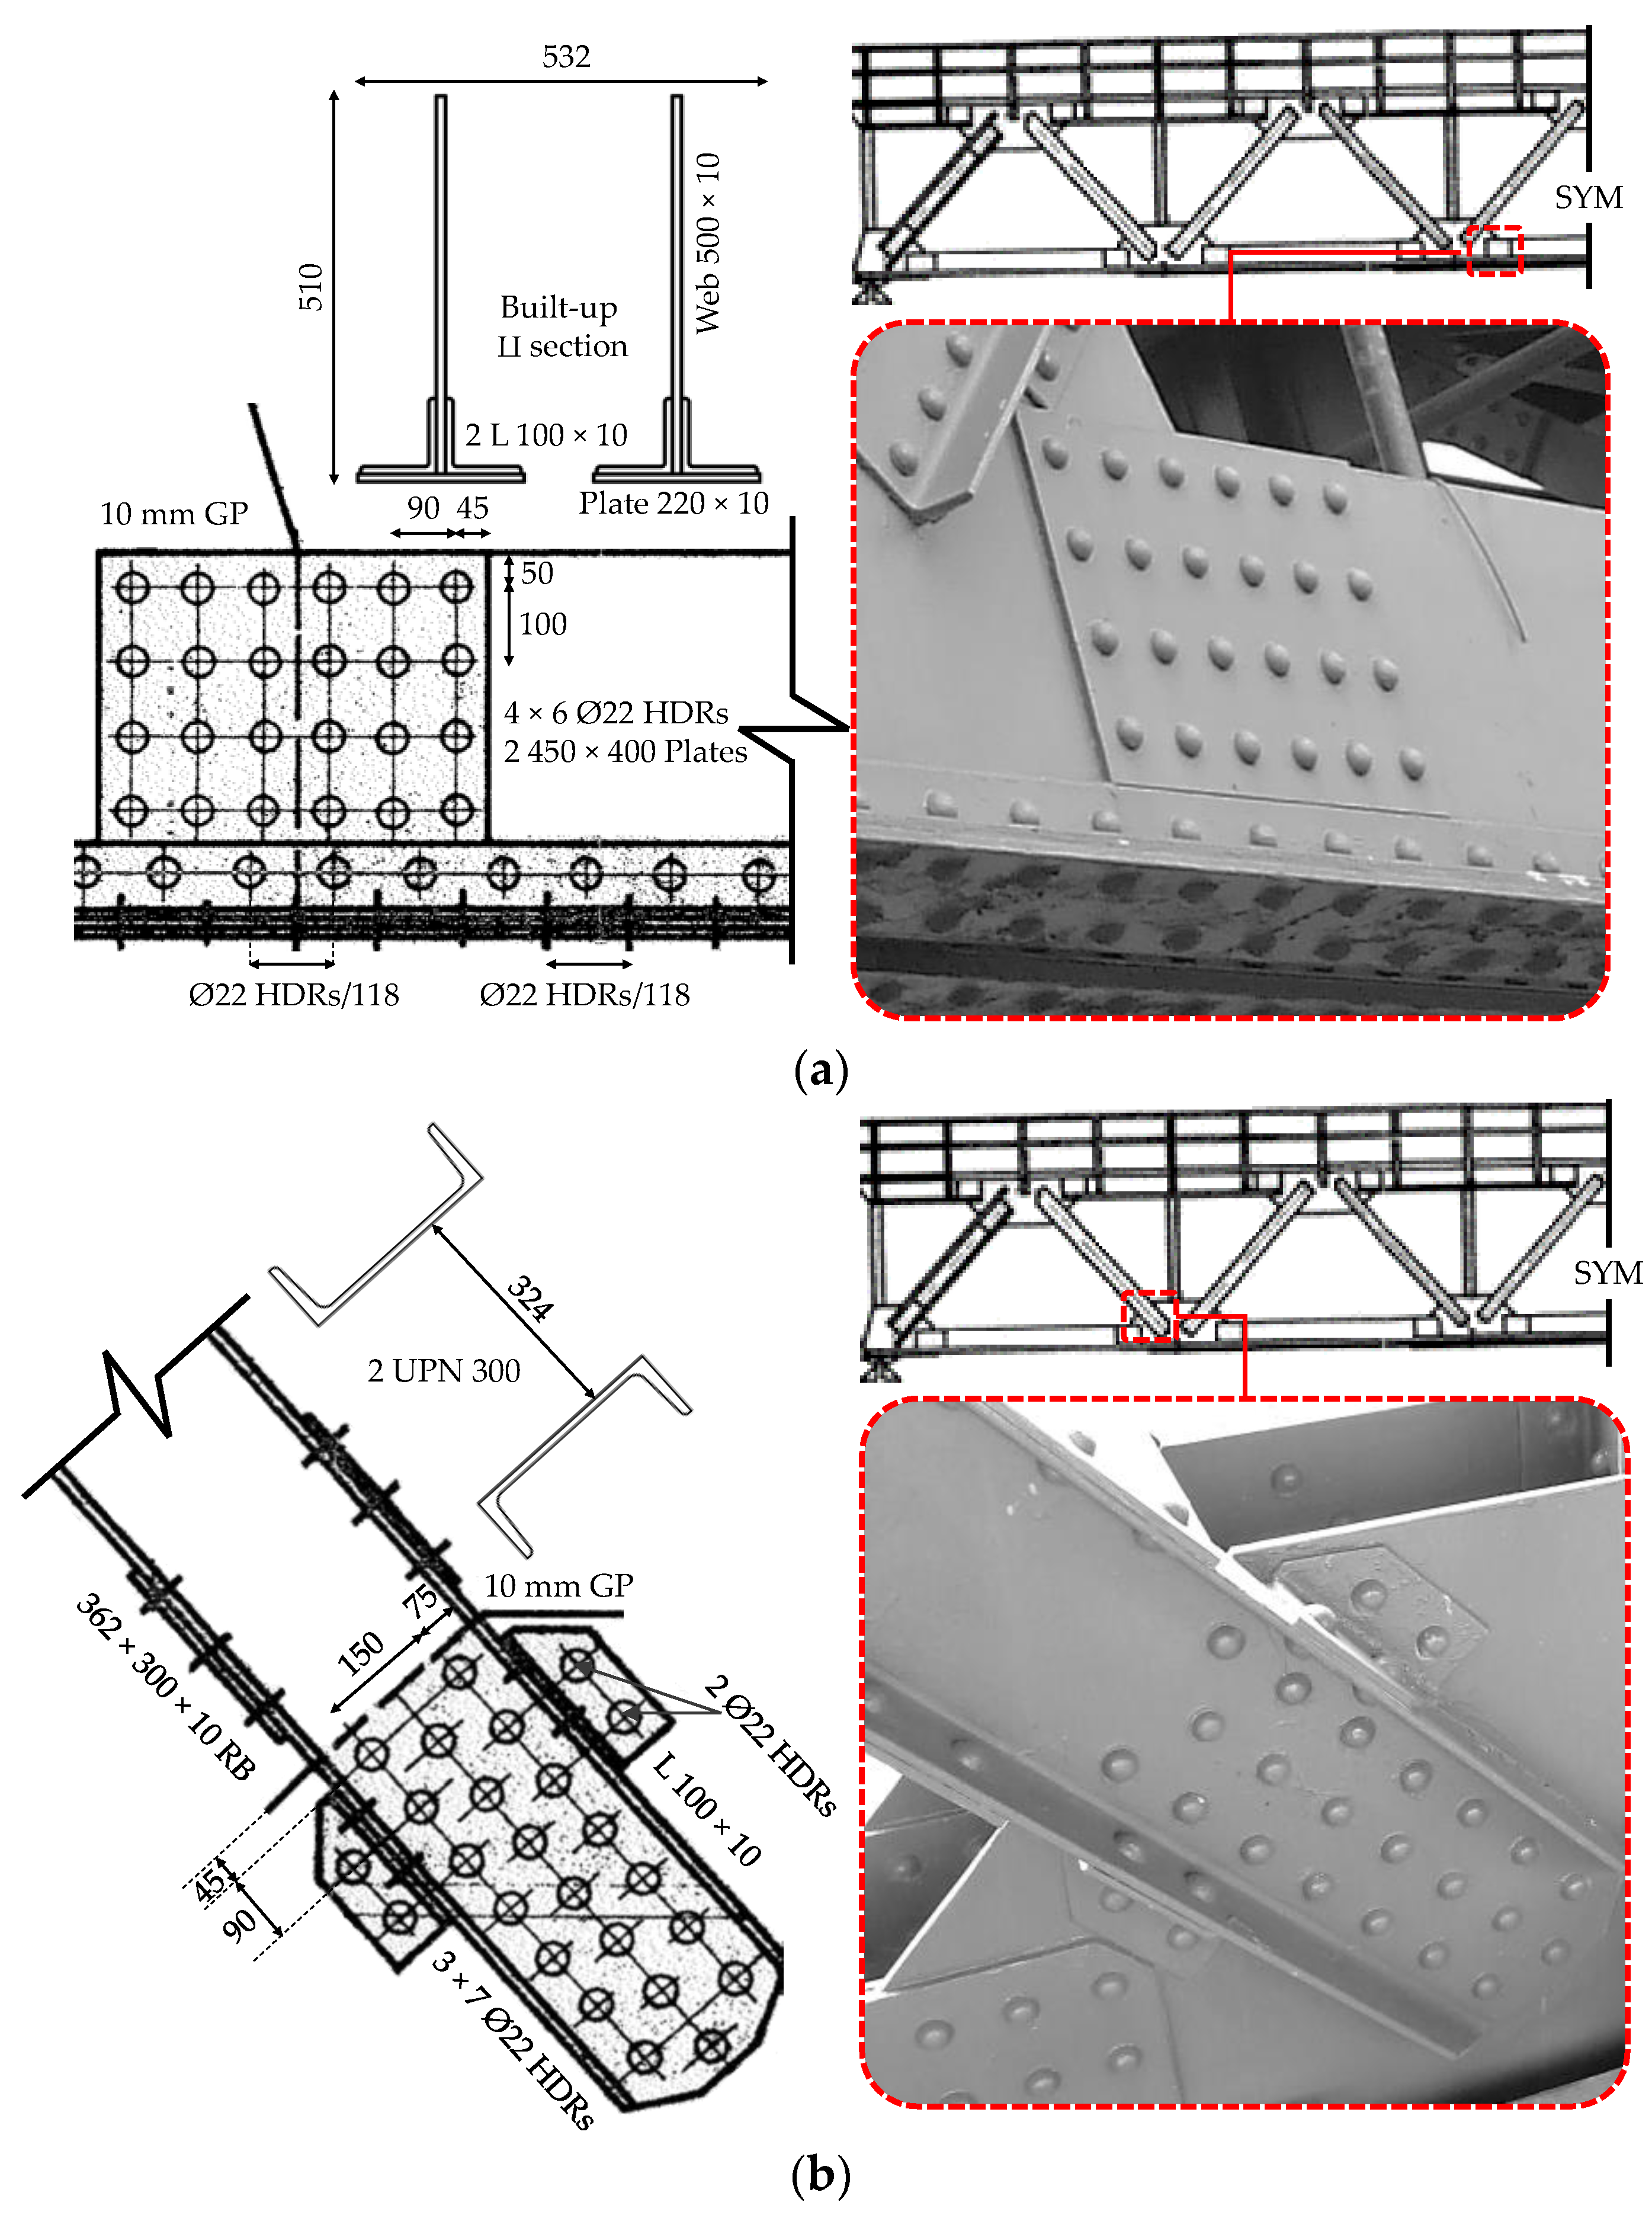
2.2. Description of Investigated Connections

As discerned from global-scale analyses, the most critical elements from a fatigue perspective are represented by the midspan segment of the lower chord (LC) and by the tensile diagonals (TDs) being closer to the end supports (see Section 3.1 for further details). Therefore, the geometrical features of the relevant connections were thoroughly investigated by comparing original design drawings and outcomes from on-site surveys.
Figure 2 summarizes the key features of these connections.
With reference to LC, each 5.6 m-long segment is interrupted in correspondence of a couple of 10 mm trapezoidal gusset plates (GPs) being the centrepiece of the KT joints. LC webs are juxtaposed to the GP ends and connected through a couple of riveted backing plates (450 × 400 mm) featuring 4 × 6 Ø22 HDRs (in-line configuration, see Figure 2a). Moreover, 100 × 10 mm Ls constituting the LC lower flanges are riveted to the GP as well (Ø22 HDRs, spacing s = 118 mm).
Conversely, UPN 300 profiles belonging to most stressed TDs are directly connected to the relevant GPs by means of 3 × 7 Ø22 HDRs (staggered configuration, see Figure 2b). In order to further accommodate the stress transmission, a couple of 100 × 10 mm angle profiles are connected to both UPN flanges and the GP via 2 + 2 Ø22 HDRs.

3. Modelling Assumptions
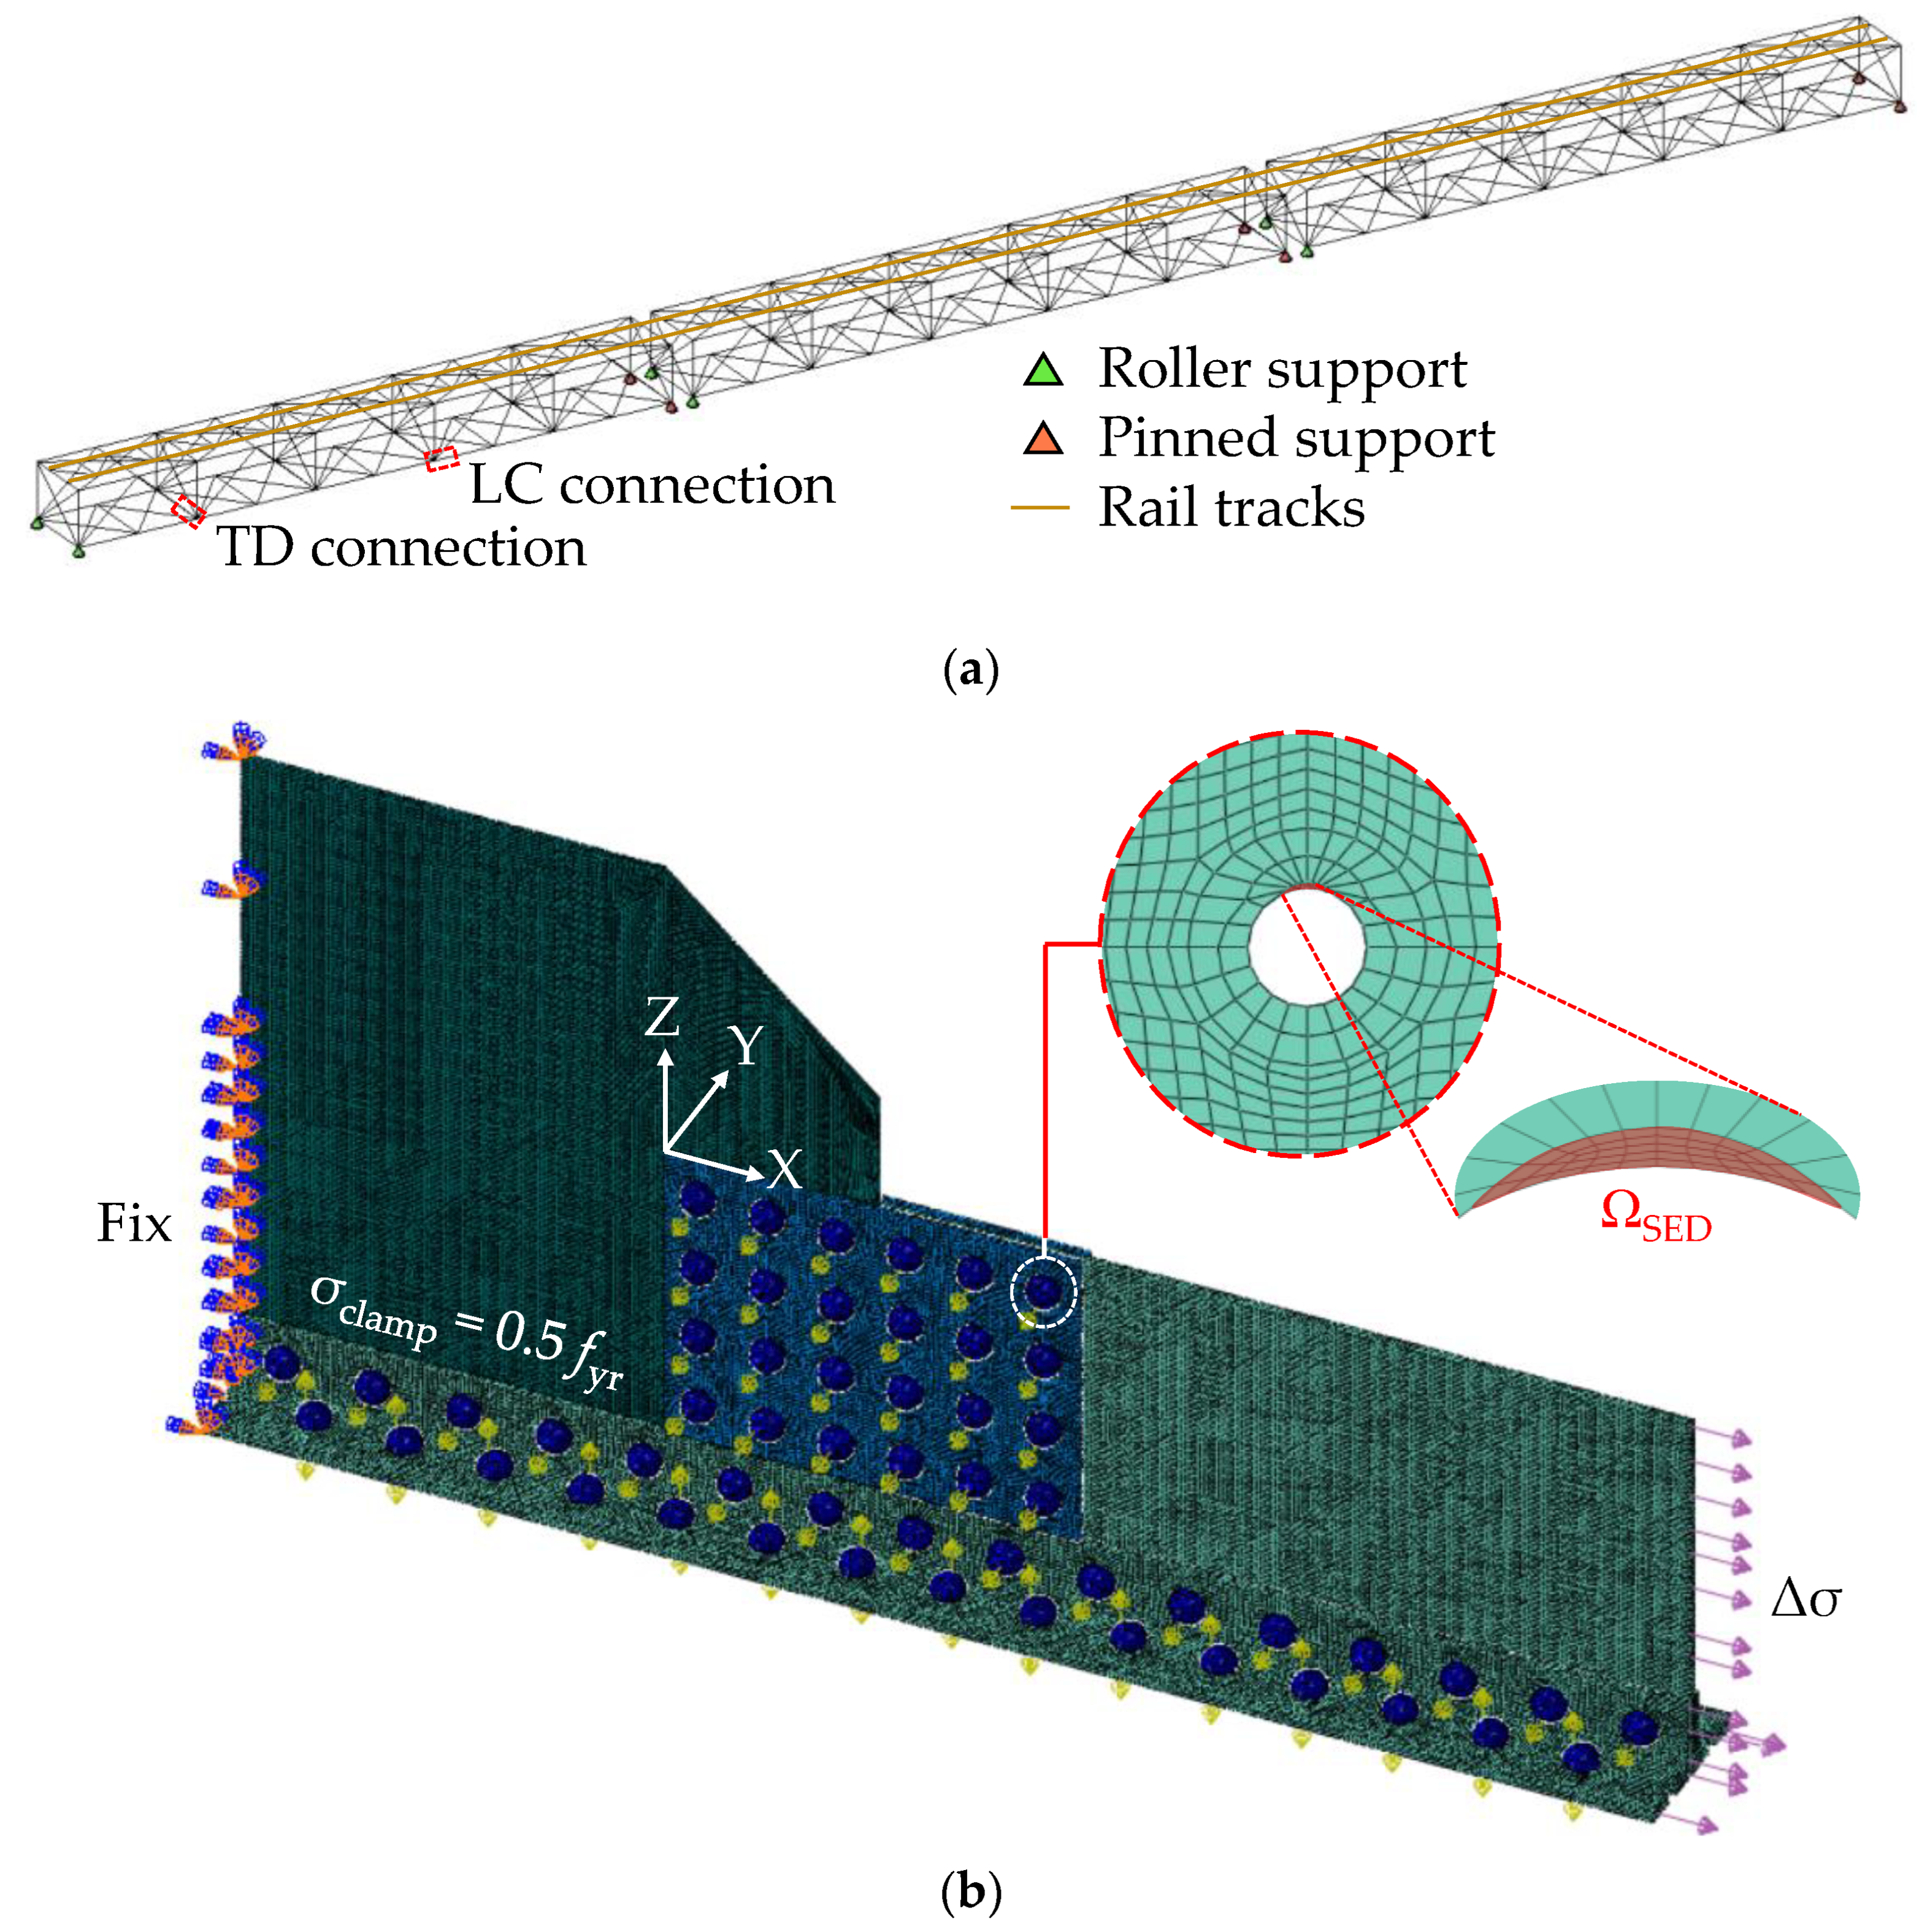
3.1. Global FEMs

Global FEMs were developed in SAP2000 v.23 (see Figure 3a) [24]. All steel members were modelled via one-dimensional frame elements. In order to capture the structural response of battened members without considerably increasing the computational effort, equivalent cross-sectional properties (i.e., derived with a fiber model) were introduced for built-up sections. The variation of shear stiffness due to intermittent battening was properly accounted for according to provisions in force in Italy [25,26].
The rather low degree of flexural restraint provided by the riveted connections was modelled via hinge releases located at member ends. Moreover, pinned and roller restraints were introduced at the spans’ ends to reproduce the intended structural scheme.
Stress histories for connections were estimated through moving load analysis, i.e., based on “real” train loads reported in Italian Railway Network (RFI) instructions (DTC INC PO SP IFS 003 A [27]). For this purpose, rail tracks were explicitly modelled to serve as load paths and to account for the small degree of continuity among consecutive spans.
Dynamic load amplification was considered depending on the train speed and the span length as suggested in [27], i.e., via the dynamic factor φ.
Load spectra were derived by (i) accounting for trains’ daily passages as declared by the infrastructure’s owner (see Table 1) and then (ii) processing oscillograms via the rainflow method. For this purpose, equivalent stress reversals (half-cycles n/2) were identified according to the following criteria [13,28]:
  • Ideal clockwise rotation of 90 degrees of the stress history;
  • Identification of “water sources” in correspondence with each peak of the stress history;
  • Counting the number of half-cycles by detecting flow terminations according to three stop criteria, i.e., (i) intersection with a flow started at an earlier peak, (ii) intersection with an opposite tensile peak of equal or greater magnitude, (iii) end of the stress history;
  • Repetition of previous steps for compressive valleys;
  • Definition of equivalent stress ranges for each half-cycle, i.e., equal to the stress difference between its start and termination.
Reversals sharing the same magnitude were then combined into full cycles n. The collaboration among global and local FEM was established by adopting the processed stress histories as inputs for the energy calculations (see Section 3.3 for more details).

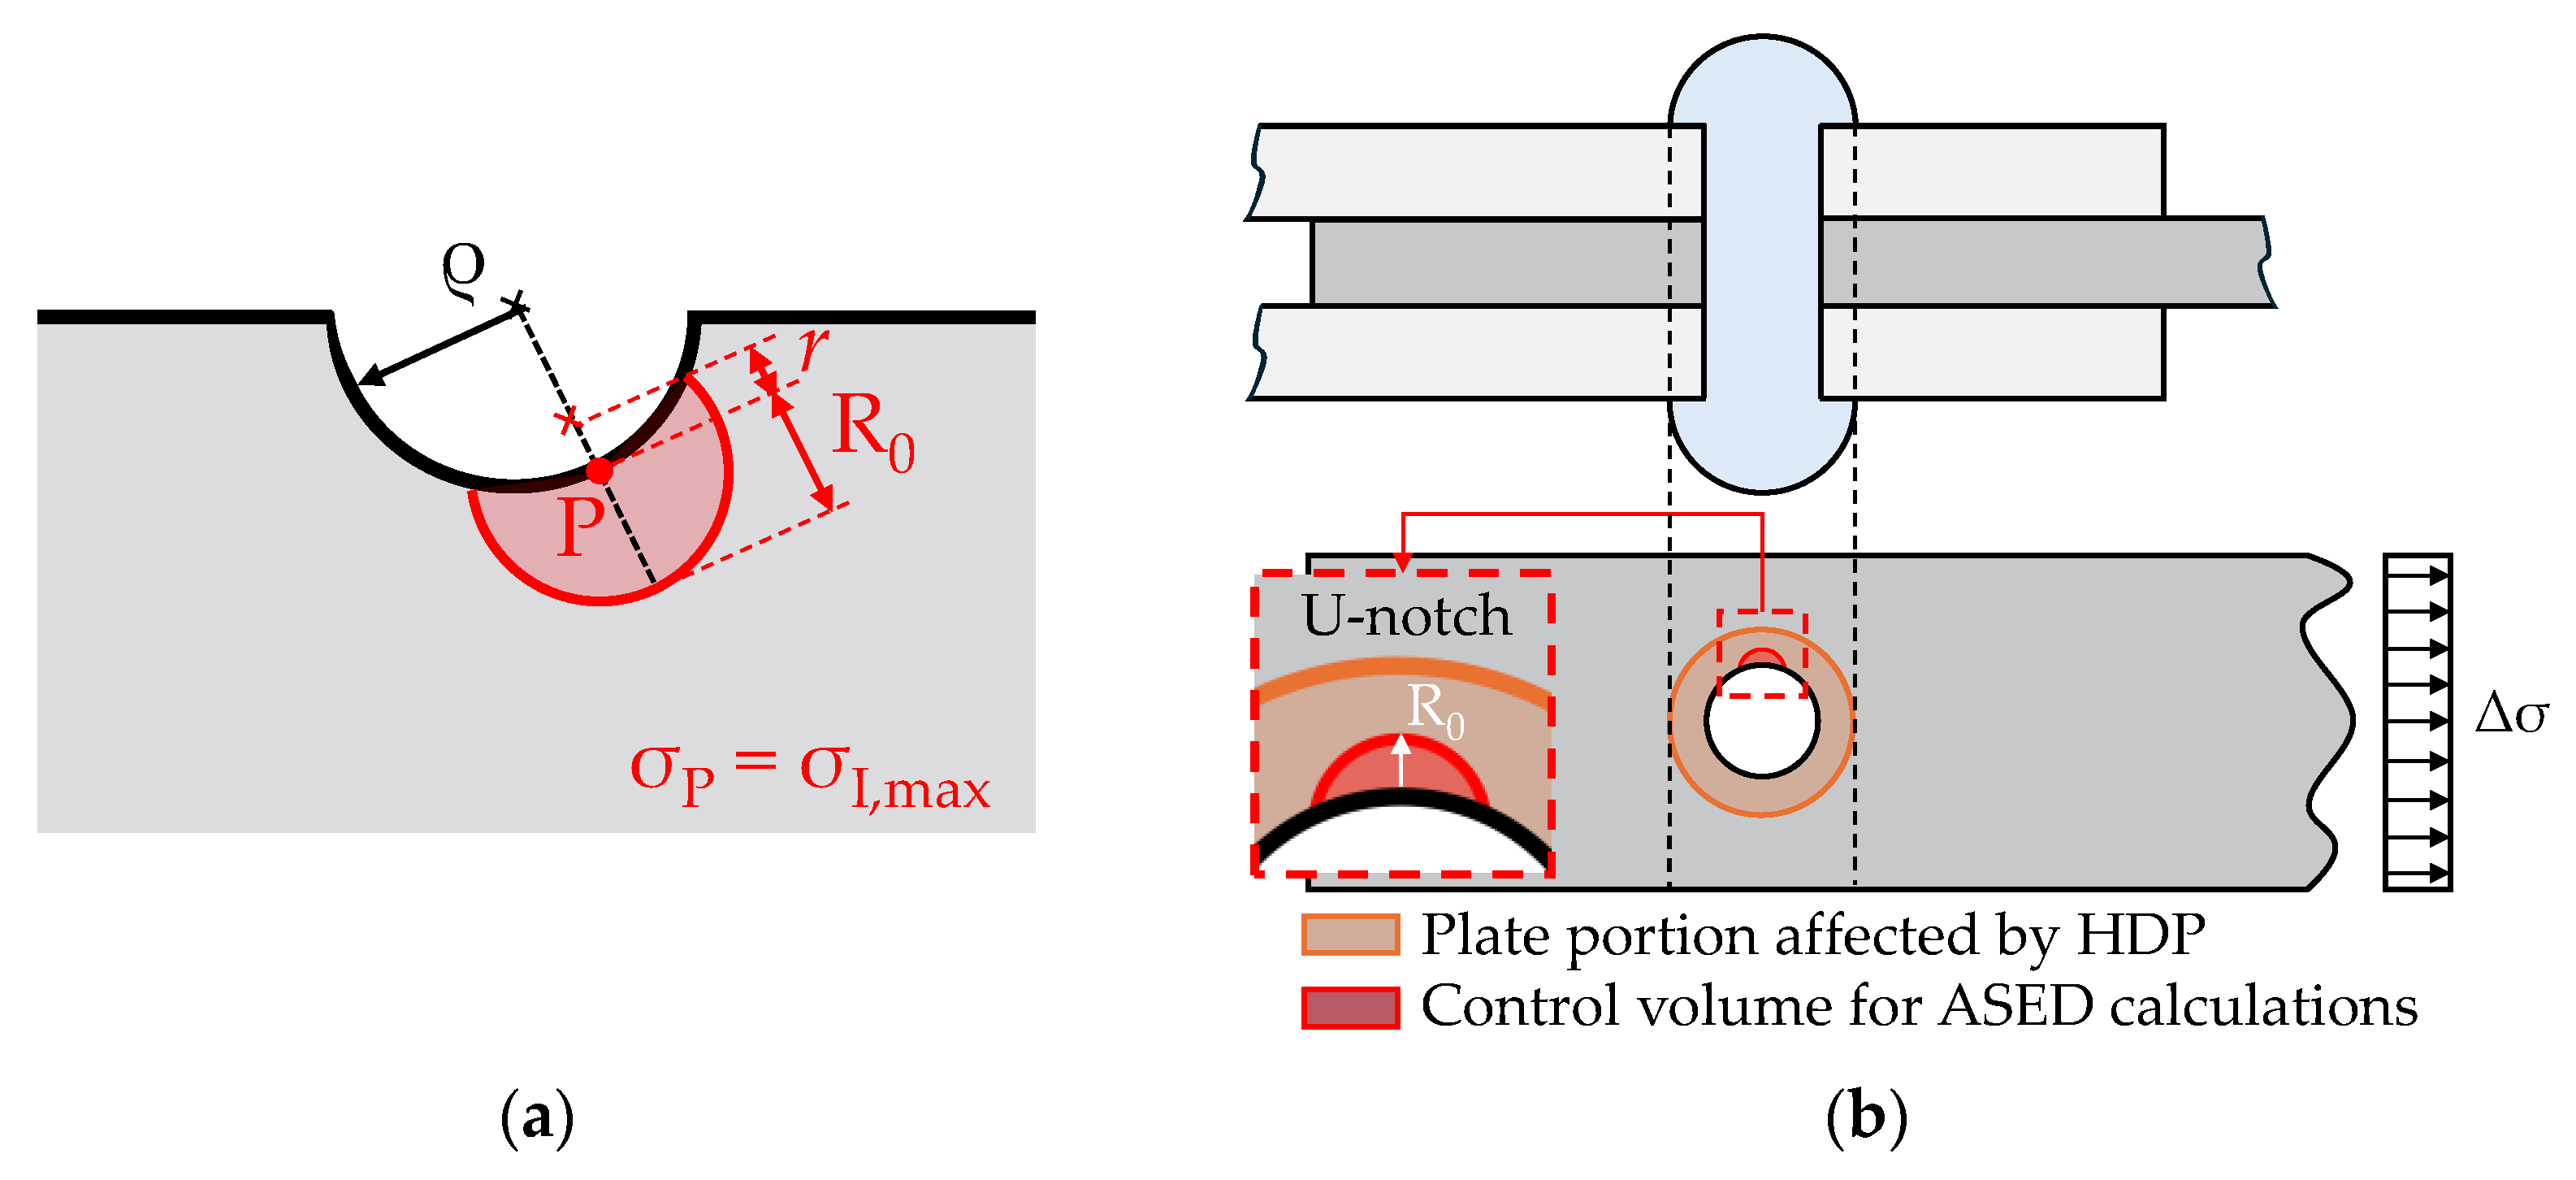
3.2. Principles of the Strain Energy Density Method

The strain energy density (SED) method was first introduced by Lazzarin and Zambardi [18] to assess the fatigue and fracture behavior of notched elements.
The authors noticed that applying stress-based approaches to such components would lead in many cases to the prediction of a higher fatigue strength compared with the value obtained by simply dividing the fatigue limit of a plain specimen by the theoretical value of the stress concentration factor Kt [29]. This suggested that fatigue failure of notched/drilled components was not governed by the notch (hot-spot) stress but rather by a mean stress averaged over a finite neighbourhood centred at the notch tip. This aspect was thus addressed by means of an energetic formulation.
Accordingly, an energetic and yet stress-related parameter was introduced to describe fatigue and fracture behaviour of notched components, i.e., the averaged strain energy density (ASED, also referred to as W ¯ ) over a control volume ΩSED centred at (or located near to) the notch tip (Equation (1)):
W ¯ = 1 Ω SED 0 ε ij σ ij d ε ij = 1 2 σ ij   ε ij Ω SED = 1 2 ( σ θ θ   ε θ θ + σ rr   ε rr + σ zz   ε zz + τ r θ   γ r θ ) Ω SED
where εij and σij are the notch strain and stress components in a cylindrical (r, θ, z) coordinate system, respectively.
The shape and size of the control volume ΩSED are determined based on theoretical considerations related to the stress distribution around the notch tip. Accordingly, a single material parameter (control volume radius R0) is required to address ASED calculations.
With reference to round (U-)notches, ΩSED is described by a moon-shaped curve revolving around the point where the maximum principal stress is attained (see Figure 4a [18,19,20]). As shown in a previous publication by the authors [5] this insight can be used to address the fatigue performance of riveted connections by regarding rivet holes as equivalent U-notches (see Figure 4b).
To this end, it is worth highlighting that the usual values of R0 for mild steels (10−1–100 mm [20]) often result in ΩSED being included in the HDP-affected zone of drilled plates. Therefore, the selected value of R0 should be properly reduced to account for localized material damage. According to [5], R0 = 0.9–1.0 mm can be used to account for the reduction of fracture toughness in Fe 50.2 steel due to drilling and hammering (−32% compared with pristine material).
Fatigue collapse can therefore be addressed by assuming the ASED range Δ W ¯ = W ¯ max W ¯ min as a fracture indicator [18,19,20]. To this end, the well-known Basquin’s formula [30] can be conveniently expressed in terms of Δ W ¯ as follows (Equation (2) [18,19,20]):
N = C   ( Δ W ¯ ) m
with N* being the expected number of cycles at failure and C and m being material parameters to be properly calibrated (intercept and slope of the fatigue curve, respectively).
When constant tensile stresses σm > 0 are superimposed onto fluctuating actions (i.e., typical conditions for bridge details due to permanent loads [31,32,33]), the mean stress effect can be explicitly accounted for by means of a non-dimensional prestress coefficient cw depending on the stress ratio R = σminmax as follows (Equations (3) and (4)):
Δ W ¯ ( R 0 ) = c w Δ W ¯ ( R = 0 )
c w = 1 sign R R 2 1 R 2
cw can be graphically regarded as the ratio among the areas underlying the σ–ε curves (that is, Δ W ¯ ), bounded by the same stress range Δσ but for R ≠ 0 and R = 0, respectively.
As shown in multiple contributions in the literature, the SED method has been proven to be highly effective in predicting the fatigue performance of structural components, e.g., through validation against 900+ experimental tests on welded joints [19,20] and 150+ experimental tests on notched specimens subjected to high stress ratios [32].
Nevertheless, it should be remarked that potential limitations of the method lie in (i) the requirement of dedicated Δ W ¯ -N curves (Equation (2)) for details of interest in order to assess the fatigue performance of real structures, and (ii) some issues in the definition of the control volume shape for rather complex geometries [20].
Also for the above reasons, the SED-based results reported in this work were compared against the established literature and normative formulations for fatigue analysis of riveted connections (see Section 5 for further details).

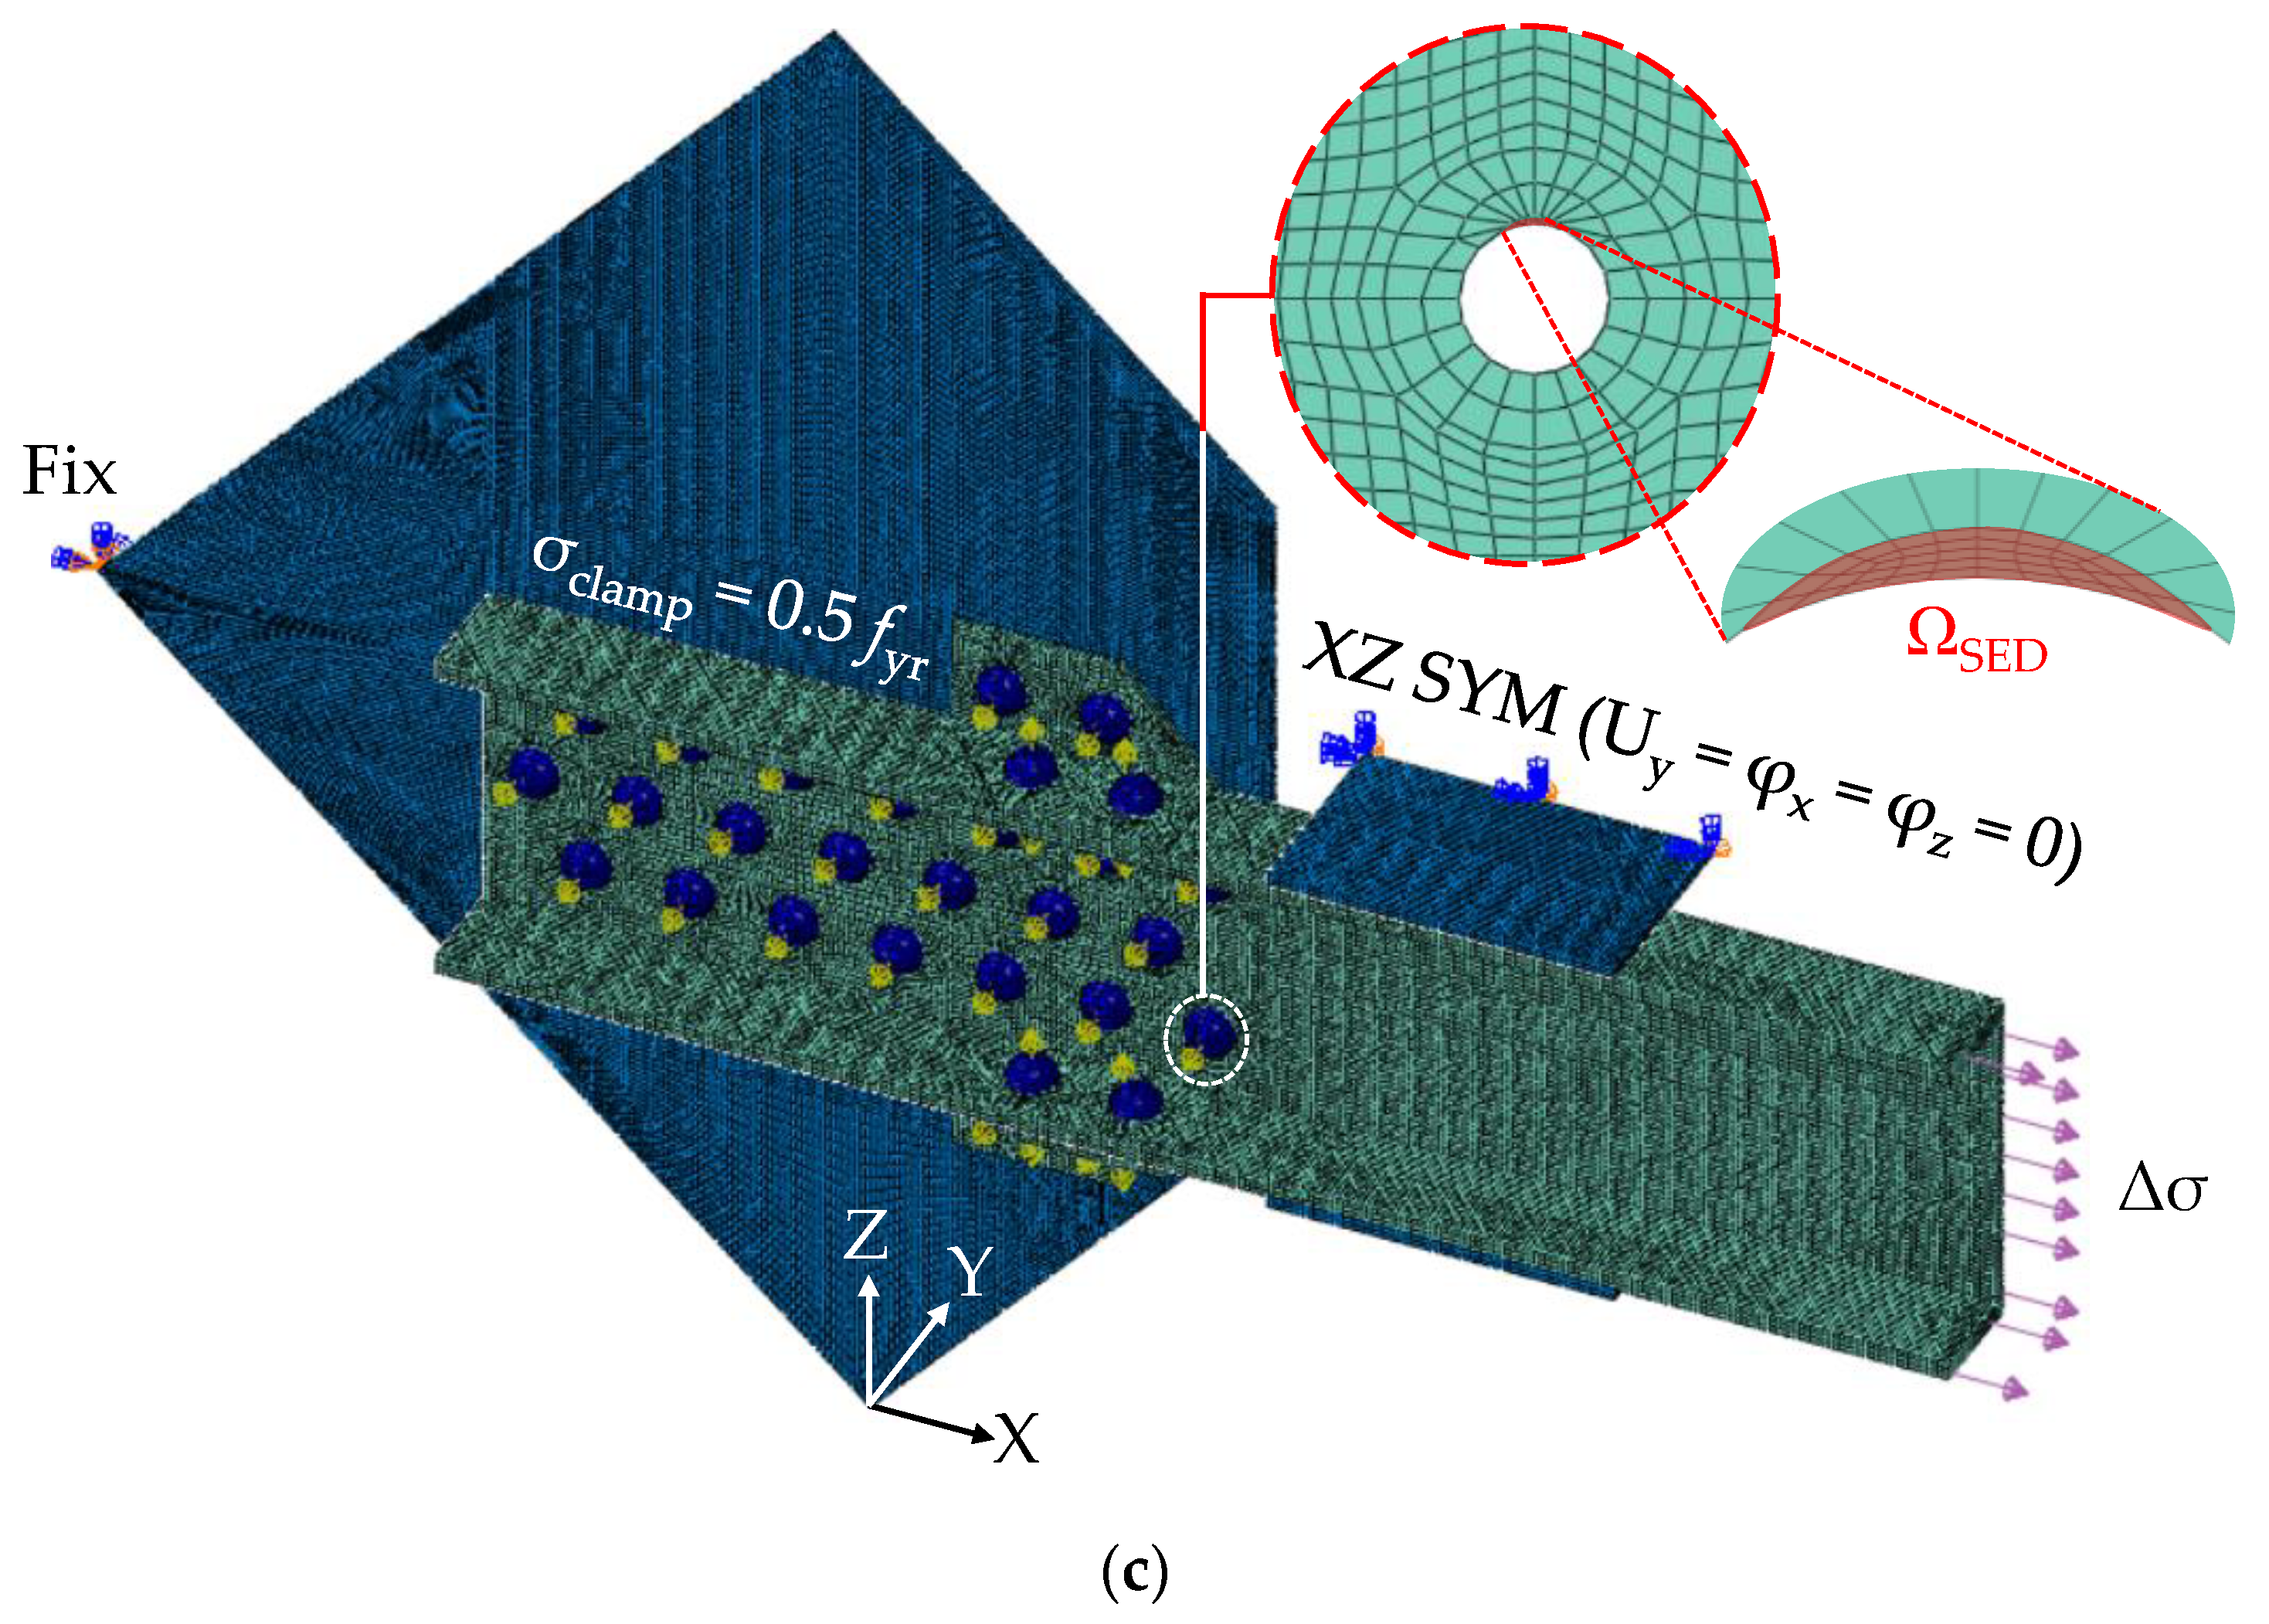
3.3. Local FEMs for SED Calculations

Local FEMs for SED calculations were developed in ABAQUS v6.14 [34] (see Figure 3b,c). As anticipated, LC and TD connections were selected owing to (i) non-negligible mean tensile stresses due to gravity loads and (ii) significant stress histories due to train loads. In order to enable SED calculations, all parts were discretized by means of C3D20R elements (20-node solid brick, reduced integration, quadratic geometry as suggested in [19,35,36]).
To ensure an accurate estimation of ASED range, a minimum mesh size equal to R0/4 was adopted in the neighborhood of the most stressed hole tip. A coarser mesh with average size of 1 mm was instead used for rivets, plates, and other portions of connected members. Indeed, as reported in [20,35,36,37], energetic calculations are rather insensitive to the overall mesh sizing of the model, provided that the control volume has been properly partitioned.
Based on preliminary stress analyses, the outermost holes were monitored in both cases, and control volumes were accordingly partitioned. In favor of safety, the minimum suggested value of R0 = 0.9 mm (i.e., resulting in the highest fatigue demand) was assumed for calculations, in compliance with outcomes from [5].
In order to balance computational effort and accuracy of analyses, geometrical and mechanical symmetry was explicitly accounted for by means of proper boundary conditions (BCs). The fatigue behavior of connections was investigated by applying surface pressures with magnitude Δσ at members’ ends. Equivalent fixed restraints were also introduced to model the structural continuity of KT joints.
According to [9,10,15], a rather low level of clamping stress σclamp was considered for existing rivets owing to peculiarities of HDP and due to the already long service life (σclamp = 0.5 fyr = 92 N/mm2). For this purpose, the “bolt-load” command was suitably used.
The von Mises criterion was adopted to model steel yielding.
Materials’ strength values were assumed in compliance with indications from the original design report (see Section 2.1, fy = 340 MPa and 185 MPa for plates and HDRs, respectively). Related stress–strain constitutive laws were modelled based on parameters reported in [9].
Contact among adjacent parts was modelled through “surface-to-surface” interactions. Namely, both normal and tangential behaviour were accounted for by means of “hard contact” and “penalty” formulations (with a friction coefficient μ = 0.3 being selected in the latter case, according to [9]).

4. Results and Discussion

Results related to stress and energetic assessment of the case study are summarized in the following sub-sections. To this end, it is worth to mentioning first that the computational cost for the numerical application of the SED method was effectively controlled.
This goal was indeed achieved thanks to (i) the collaboration between local and global FEM—with the latter requiring only a negligible amount of time to perform moving load analysis, (ii) the exploitation of structural symmetries in local models, and (iii) the introduction of variable mesh size in the proximity of control volumes for ASED calculations.

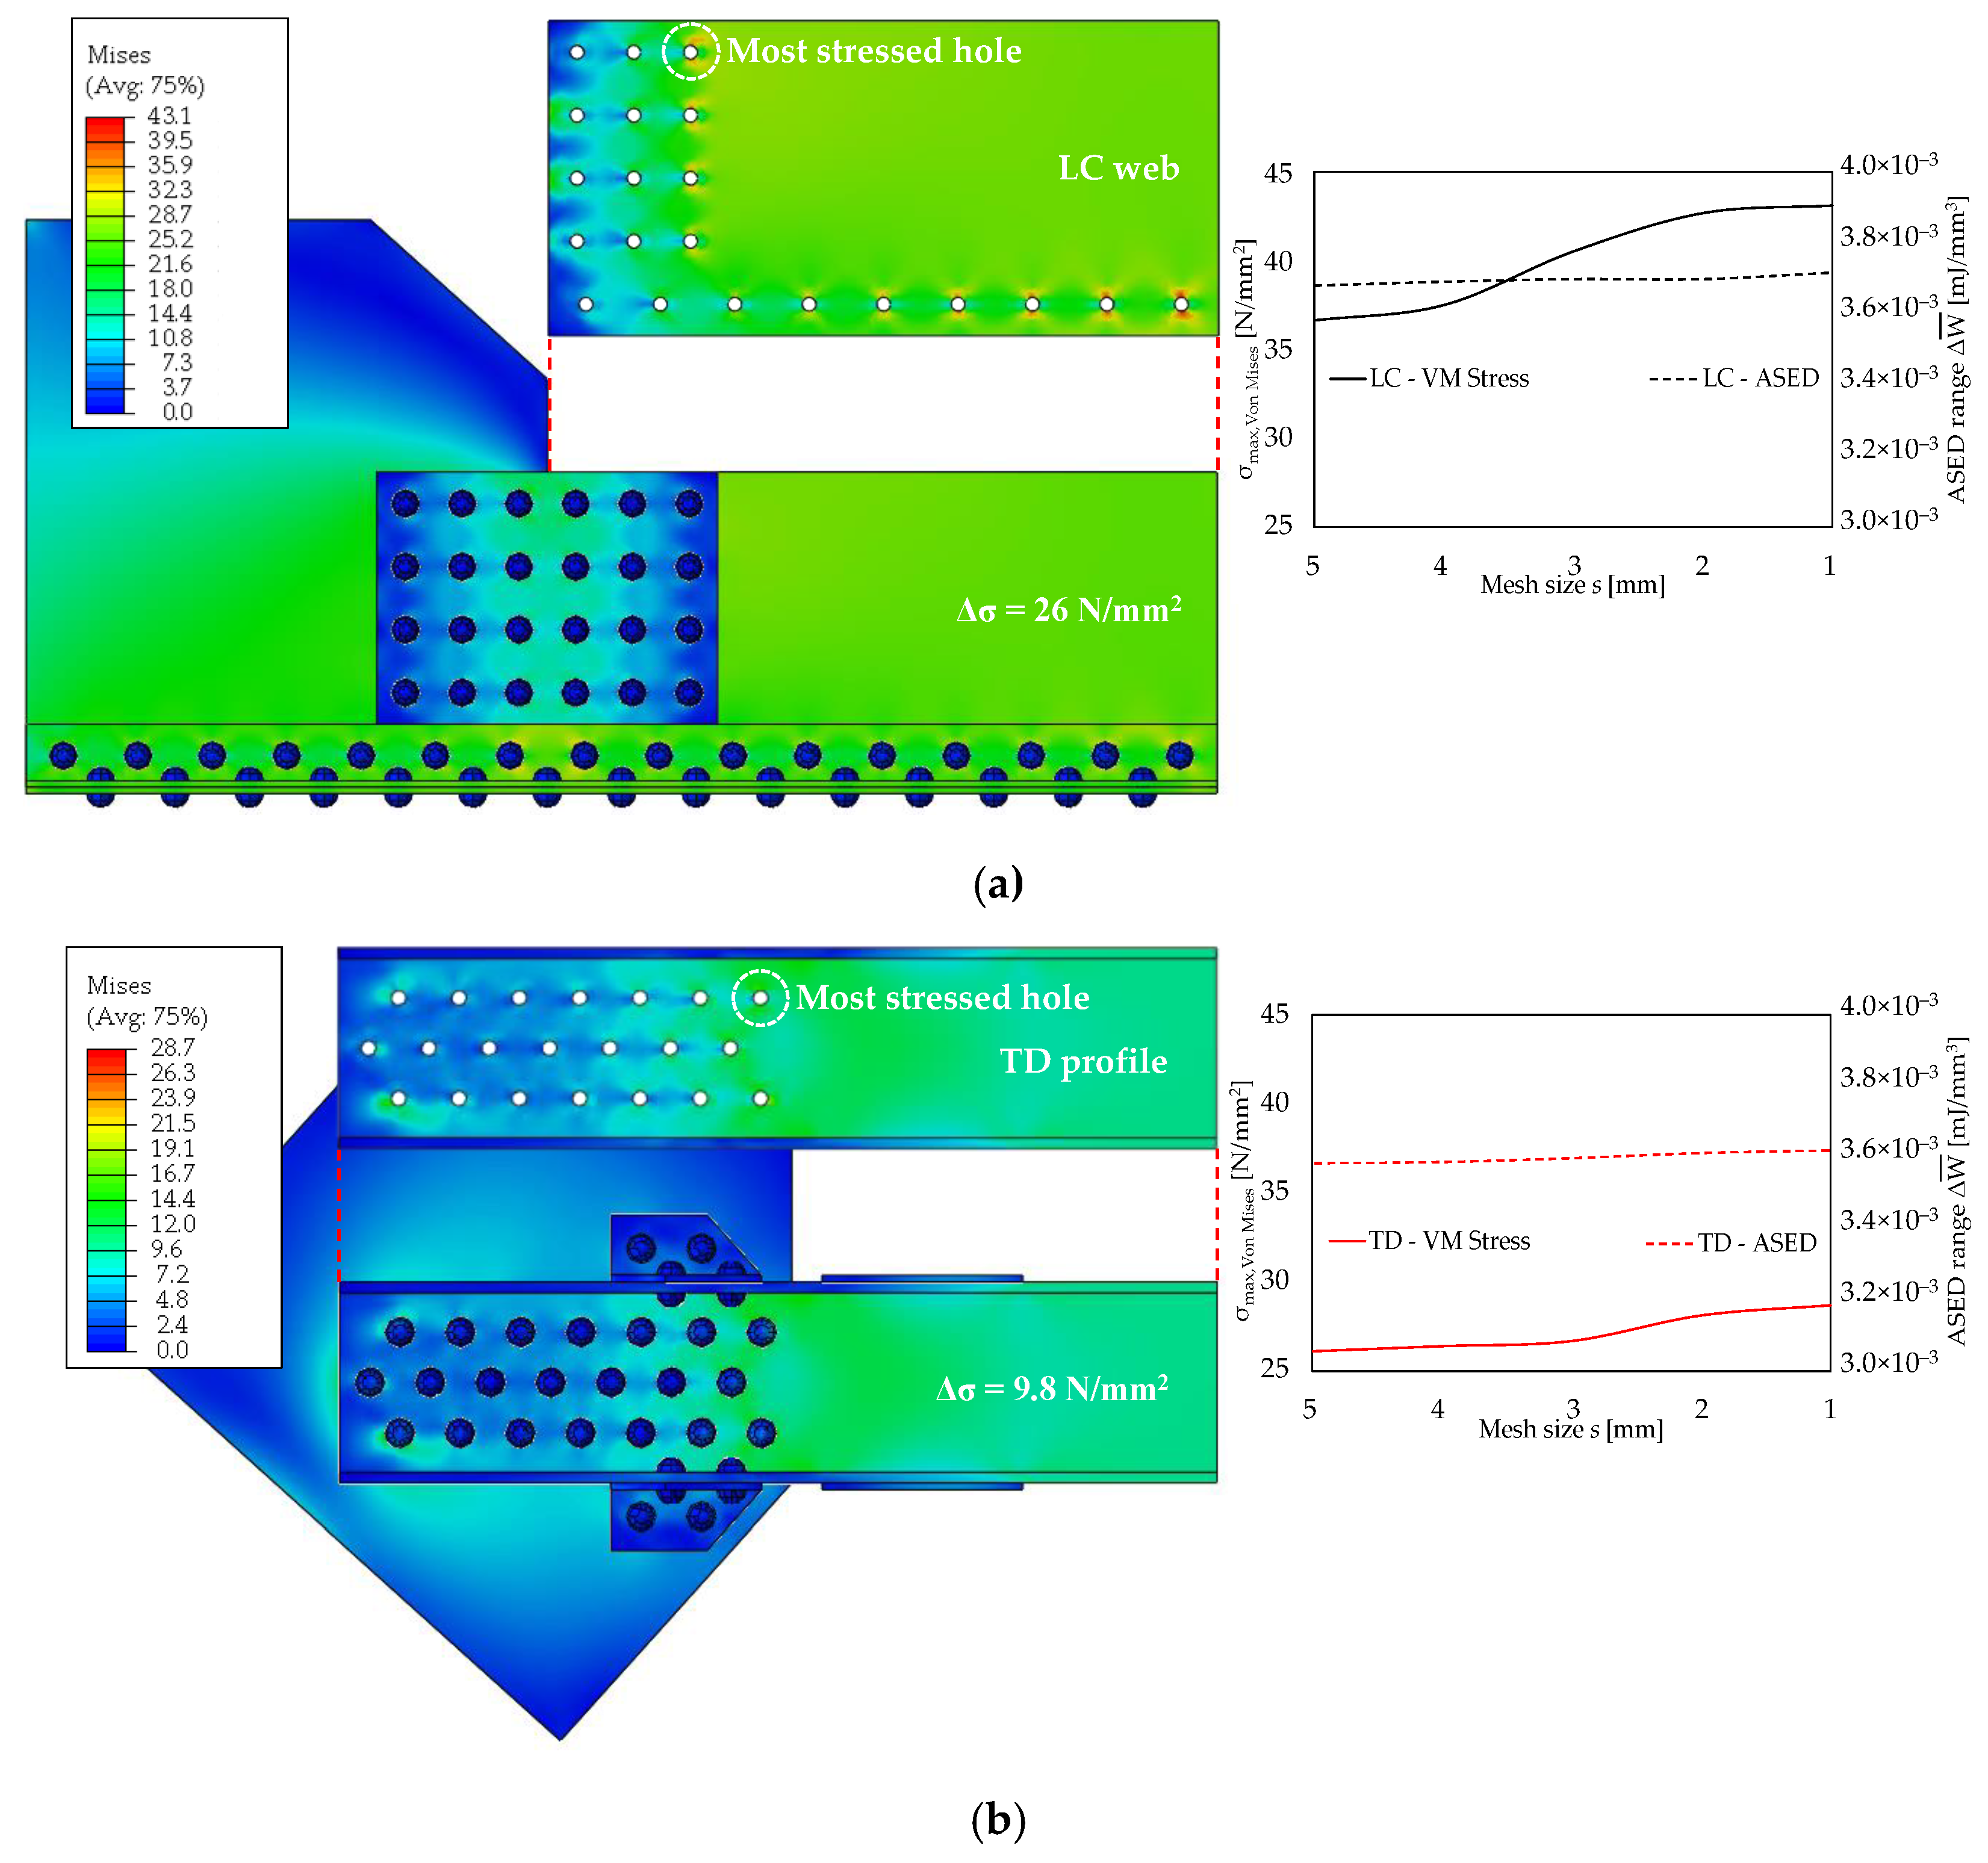
4.1. Global Scale FE Analyses

The results of global-scale FE analyses are summarized in Figure 5a,b and Table 2 in terms of (i) stress histories deriving from the passage of “real” train loads and (ii) outcomes from the application of the rainflow method. For the sake of brevity, only results related to the most critical details are depicted in Figure 5a (LC) and Figure 5b (TD).
In line with typical outcomes for railway bridges [30,31], higher equivalent stress ranges were in most cases associated with a smaller number of cycles, and vice versa. It was readily apparent that, in both cases, the highest stress variations were induced by Train 8 due to it having the highest total weight (Qtot = 10,350 kN). Nevertheless, the highest fatigue damage was expected to be associated with Train 3 due to it having the highest number of average daily passages (7/day).
This insight was confirmed by the results of the rainflow method. Indeed, while moderately lower equivalent stress ranges Δσeq were derived for both LC (Δσeq,LC,T3,max = 20.6 N/mm2 against Δσeq,LC,T8,max = 26.0 N/mm2, −21%) and TD (Δσeq,TD,T3,max = 5.5 N/mm2 against Δσeq,TD,T8,max = 9.8 N/mm2, −44%) in the case of Train 3, the number of cycles n endured was significantly higher (+326% and +167% for LC and TD, respectively).
With reference to mean stress effect, it is worth reporting that the highest superimposed tensile stresses were attained for LC (σm,LC = 10.1 N/mm2, +42% compared with σm,TD = 7.1 N/mm2), that is, as a clear consequence of the structural scheme of the adopted trusses.
Nevertheless, while equivalent mean stresses σm,eq—estimated by adding σm and the average stress σm,i associated with the i-th rainflow rehearsal—were higher in LC compared with TD, the highest values of stress ratio R are actually reached in the latter member (Rmax = 0.91, Train 8), due to the larger (relative) impact of mean stresses with respect to the endured stress ranges.
The derived values of Δσeq, i.e., superimposed with clamping stresses and equivalent mean stresses, were introduced into the local FEMs for ASED calculations. Further details are reported in the next section.

4.2. Local FE Analyses for ASED Calculations

Results of local-scale FE analyses on LC and TD connections are summarized in Figure 6a,b and Table 3, in terms of (i) von Mises stress distributions associated with the highest equivalent stress range Δσeq,max and (ii) ASED calculations for each equivalent stress range value Δσeq,i. Relevant mesh sensitivity analyses (average mesh size s = 1–5 mm) for such quantities are also reported.
As expected, reducing the mesh size s resulted in a moderate increase of predicted highest stresses (+15% and +9% when s ranged from 5 mm up to 1 mm for LC and TD, respectively).
It was also observed that the highest stresses were achieved at the tips of the outermost rivet holes in both cases (σMises,MAX,LC = 43.1 N/mm2 and σMises,MAX,TD = 28.7 N/mm2, ×1.66 and ×2.87 with respect to the applied stress ranges, respectively).
In light of this outcome, energy calculations were performed by monitoring the relevant control volumes as described in Section 3.1 and Section 3.2.
To this end, the substantial mesh-insensitivity of the ASED range can be observed in Figure 6a,b, in compliance with remarks from [35,36]. Table 3 also shows how significantly higher values of Δ W ¯ were attained in the LC connection compared with the TD. This outcome plausibly resulted from (i) the presence of larger mean stresses, (ii) the influence of secondary bending due to the moderate degree of flexural restraint provided by the riveted backing plates, and (iii) the larger reduction of net cross-rection due to rivet holes.
The derived energetic parameters were then used to perform a SED-based fatigue assessment of the critical details. Further insights are provided in the next section.

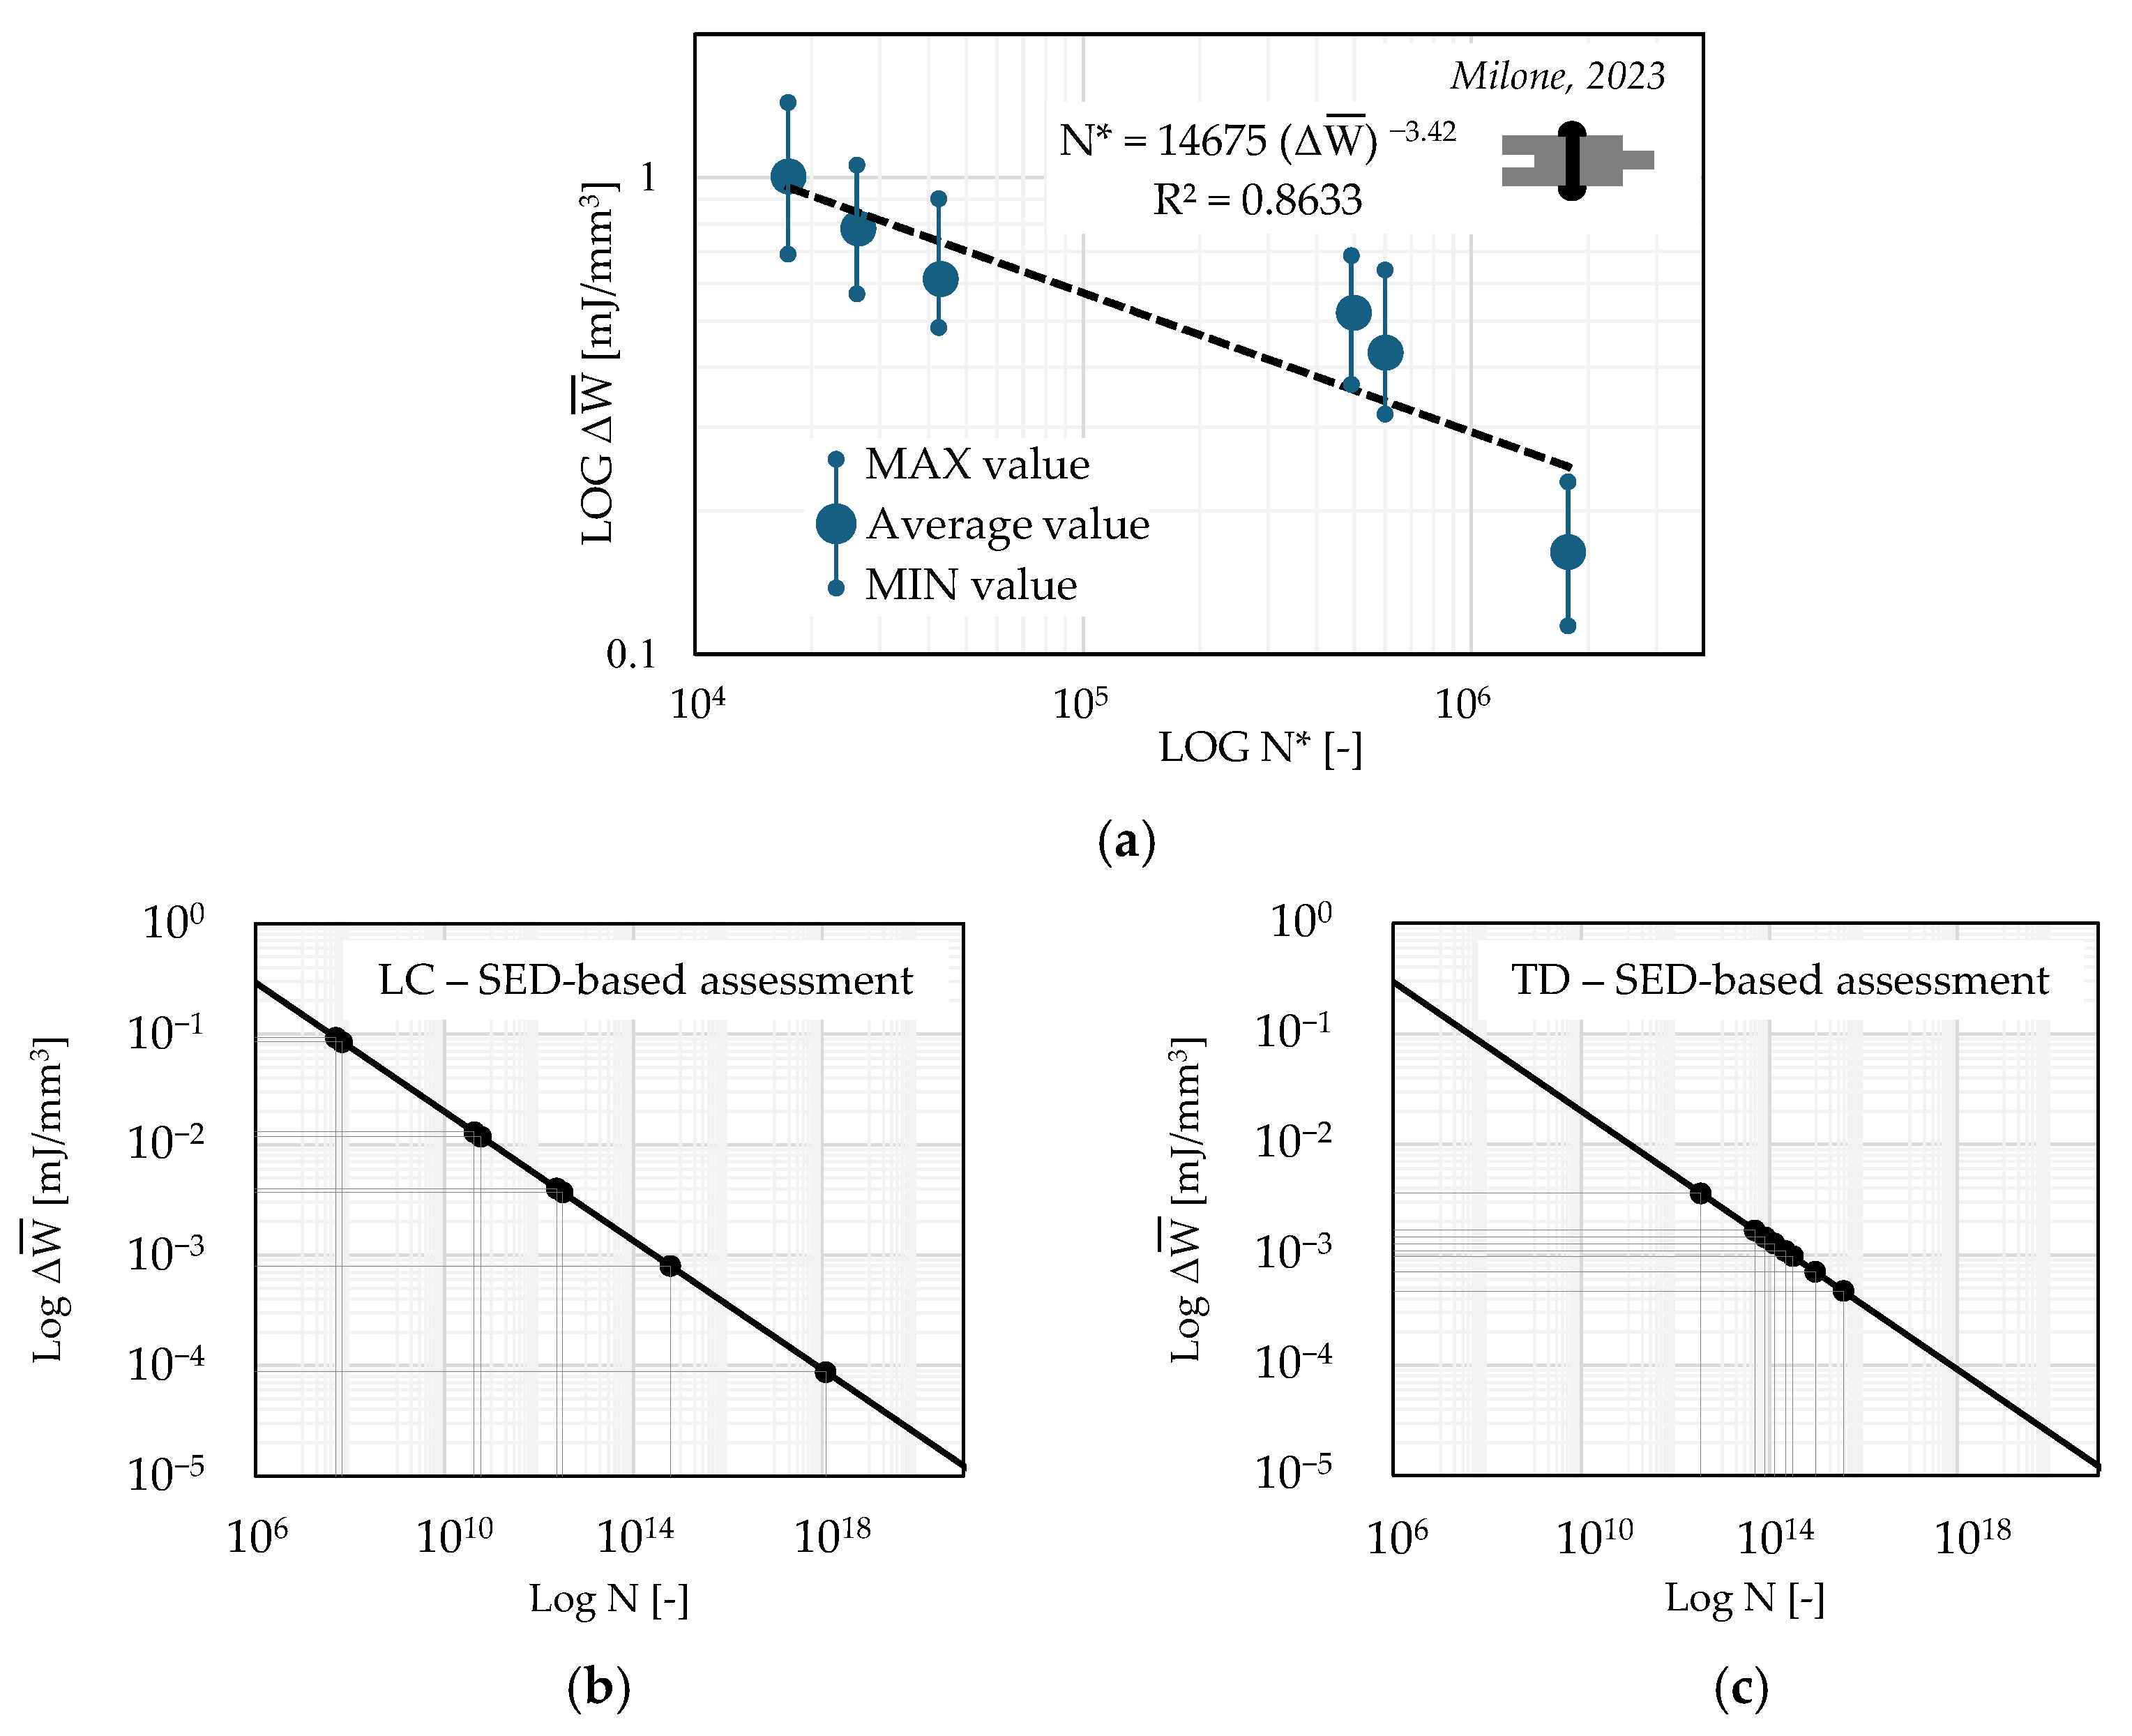
4.3. SED-Based Fatigue Assessment of Critical Details

Once the energetic demand parameters associated with equivalent stress ranges were estimated, SED-based fatigue assessment of critical details was carried out through cumulating fatigue damage via the well-known Miner’s rule (Equation (5) [38]):
D TOT = i d i = i n TOT , i N i *
where DTOT is the total fatigue damage composed of the sum of i-th elementary damage values di, nTOT,I is the total number of (equivalent) endured cycles for a given ASED range during the reference life, and Ni* is the associated value of endurable cycles for the same value of ASED range.
According to the above criterion, a given component is deemed safe against the relevant fatigue demand if DTOT ≤ 1.
For assessment purposes, the master ASED curve for riveted details reported in Milone [5] was considered (C = 14,675, m = 3.42, see Figure 7a).
A graphical representation of SED-based assessment is provided in Figure 7b,c, where the expected number of cycles at failure N* is derived for both LC and TD details with reference to each estimated ASED range.
As expected, more dispersed values of N* were attained for LC, with N* LC being in the range ≈ 107–1018. This outcome plausibly resulted from the peculiar connection configuration, in which secondary bending stresses significantly affected the stress (and thus, strain energy) distribution near the rivet holes, while further non-linearity was induced by friction.
Total fatigue damage was estimated assuming a reference life Lref = 100 years, in compliance with provisions in force for railway bridges in Italy [25,26]; the total number of endured cycles nTOT,i was estimated accordingly.
As a result, both LC and TD connections can be deemed safe with respect to fatigue issues, although with significantly different margins of safety (DTOT = 1.6 × 10⁻² and 4.5 × 10⁻⁶, respectively).
In order to assess the robustness of the described SED-based procedure, and for comparison purposes, in the next section, the fatigue performance of critical riveted details is reassessed with reference to both the literature [21] and normative prescriptions [13,14,22].

5. Comparison with the Literature and Normative Fatigue Assessment Techniques

As stated in the introduction, several researchers have investigated the fatigue performance of hot-driven riveted connections via nominal stress-life methods (see Table 4).
Taras et al. [21] proposed seven DCs for riveted details based on the configuration of global connections, i.e., including two- and one-sided joints, lattice members, cover plates, and built-up girders. For the relevant cases of double and single GP joints, DC 90 and DC 85 were proposed, respectively. Remarkably, (i) an invariant slope of S-N curves (m1 = m2 = 5, see Figure 8, red solid curves) was suggested as opposed to EN1993-1-9 recommendations, and (ii) the gross cross-section stress range Δσgross was indicated for the estimation of N*.
Maljaars and Euler [39] reassessed the fatigue performance of multiple configurations of bolted joints to serve as a background for the prEN1993-1-9:2023 draft [22]. To this end, although no results were reported by the authors with explicit reference to hot-driven riveted connections, indications for fitted, non-pre-tightened bolted joints can still be suitably used owing to strong structural similarities.
Indeed, as discussed [5,9,10], HDP results in a lateral shank expansion which nullifies the rivet-hole gap. Moreover, due to the large variety of thermomechanical parameters influencing shank contraction during cooling, the resulting rivet clamping is rather low and unreliable, with typical values being equal to σclamp ≈ 0.5 fyr ≈ 100 N/mm2 [9,10,15].
Therefore, according to [22,39], load transfer in joints’ plates occurs via both “pin loading” (i.e., bearing contact) at the outermost holes and “bypass loading” (i.e., net area diffusion) at subsequent holes. As a consequence, the relevant stress parameter for fatigue analysis Δσ* should be estimated as follows (Equation (6) [22,39]):
Δ σ = Δ σ net × a + b c d 0 w 3 = k Δ σ net
where Δσnet is the net cross-section stress range, d0 is the hole diameter, w is the plate width, k* is the net stress range modification factor, and a, b, c are empirical parameters depending on the number of rows of fasteners nf.
For the relevant case of nf > 3, a = 1.0, b = 1.1, c = 1.8 may be used.
For the sake of comparison, in the present section, the results of the SED-based assessment of LC and TD details are compared with the above formulations from the literature.
For thoroughness, removed DCs from EN1993-1-9 background document for HDRs (DC90/DC71 [13,14], see Table 4 and Figure 8) are also accounted for.
According to indications reported in [13,14,21,22,39], outcomes from the rainflow method (see Section 4.1) were used to estimate stress ranges referred to the gross cross-section Δσgross.
Hence, net (Δσnet) and modified (Δσ*) were derived based on the details’ geometrical features. For instance, the presence of rivet holes in LC and TD connections resulted in nominal increases of +19% and +8% in terms of stress ranges, respectively (see Table 5). In the same fashion, fairly similar modification factors kLC* = 2.06 and kTD* = 1.91 were obtained in both cases according to prEN1993-1-9:2023 prescriptions [22,39].
Fatigue assessment in terms of elementary and total damage di, DTOT is summarized in Table 5 for both LC and TD, based on all described methodologies.
With reference to the lower chord connection, it was apparent that the SED method and prEN1993-1-9:2023 [22,39] yielded the most severe predictions. This outcome plausibly descends from both methods being able—although to different extents—to capture local stress amplifications.
Conversely, indications from the EN1993-1-9 background document [13,14] proved to be moderately unconservative (DTOT,SED = 2.37 DTOT,EN1993-1-9-BD).
This condition was even more noticeable with reference to Taras et al.’s [21] formulation, where Δσgross was used (that is, stress amplification was not explicitly considered), with DC being the same as prEN1993-1-9:2023.
Interestingly, the opposite trend was obtained for the TD connection. For instance, the most severe result was obtained with reference to the EN1993-1-9 background document’s predictions. This outcome plausibly resulted from the relevant DC (71 N/mm2) being the lowest among all the formulations.
As expected, the SED method instead provided an intermediate prediction between the prEN1993-1-9:2023 [22,39] and Taras et al. [21] formulations. Indeed, the former model slightly overestimated the fatigue damage due to it being not calibrated for staggered joint configurations, in which the destructive interference among close rivet holes reduces the resulting stress amplification [29,40] and thus increases fatigue life. Conversely, in the same fashion as LC, Taras et al.’s [21] formulation resulted in the lowest fatigue damage due to Δσgross being used for calculations.
The observed differences in results were also dependent on the peculiar configuration of the diagonals. Indeed, due to presence of riveted battens, the out-of-plane bending moments that would arise for a one-sided connection are actually countered, as longitudinal symmetry would be violated instead. As a consequence, local stress amplifications on rivet holes were slightly smaller than the ones accounted for by nominal stress-life methods.
Conversely, the intrinsic local nature of the SED method ensured a more accurate consideration of such an effect, although at the price of requiring multi-scale modelling of the investigated case study.

6. Conclusions

In the present work, the advanced fatigue assessment of a riveted railway bridge located in Italy is illustrated. For this purpose, refined multi-scale modelling of the case study was developed, and fatigue analyses were carried out via the advanced strain energy density (SED) method. Derived results were thus compared against the literature and normative fatigue provisions for hot-driven riveted connections. Based on the derived outcomes, the following conclusive remarks can be pointed out:
  • Global-scale FE analyses of the 3D truss structure highlighted that most critical details from a fatigue perspective were represented by the lower chord (LC) midspan connection and by the most stressed tensile diagonal (TD) connection. This condition resulted from the adopted structural scheme and the presence of significant mean tensile stress;
  • Local-scale FEMs were developed to accurately represent the geometric details. Subsequently, SED-based fatigue demand was derived with reference to equivalent stress cycles to be endured during the reference service life Lref = 100 years;
  • According to the well-known Miner criterion, both connections were deemed safe with respect to fatigue issues, although with significantly different margins of safety (DTOT = 1.6 × 10⁻² and 4.5 × 10⁻⁶, respectively);
  • SED-based outcomes were compared against nominal stress-life approaches drawn from the literature and normative prescriptions. Accordingly, the SED method predicted higher fatigue damage in the LC compared with other methods, due to its ability to capture local stress amplification induced by secondary bending;
  • Conversely, lower damage was observed for TD with respect to EN1993-1-9 and prEN1993-1-9:2023, due to the peculiar profiles and connection configuration in which out-of-plane bending was inhibited by longitudinal symmetry;
  • Further studies will be carried out to assess the validity of SED-based fatigue assessment with reference to full-scale structures.

Author Contributions

Conceptualization, A.M. and M.D.; methodology, A.M.; software, A.M.; validation, A.M. and M.D.; formal analysis, A.M.; resources, R.L.; data curation, A.M.; writing—original draft preparation, A.M.; writing—review and editing, M.D. and R.L.; visualization, A.M.; supervision, M.D. and R.L.; project administration, R.L.; funding acquisition, R.L. All authors have read and agreed to the published version of the manuscript.

Funding

This research received no external funding.

Data Availability Statement

All relevant data are available within the body of the manuscript.

Acknowledgments

The authors would like to express their gratitude to Giuliano Cipolletta and Erika Sasso for their precious work during their Master’s theses. Their help is gratefully acknowledged.

Conflicts of Interest

The authors declare no conflicts of interest.

References

  1. de Jesus, A.M.P.; da Silva, A.L.L.; Figueiredo, M.V.; Correia, J.A.F.O.; Ribeiro, A.S.; Fernandes, A.A. Strain-life and crack propagation fatigue data from several Portuguese old metallic riveted bridges. Eng. Fail. Anal. 2011, 18, 148–163. [Google Scholar] [CrossRef]
  2. Pedrosa, B.; Correia, J.A.F.O.; Rebelo, C.; Lesiuk, G.; de Jesus, A.M.P.; Fernandes, A.A.; Duda, M.; Calcada, R.; Veljkovic, M. Fatigue resistance curves for single and double shear riveted joints from old Portuguese metallic bridges. Eng. Fail. Anal. 2019, 96, 255–273. [Google Scholar] [CrossRef]
  3. Sieber, L.; Urbanek, R.; Bar, J. Crack-Detection in old riveted steel bridge structures. Procedia Struct. Integr. 2019, 17, 339–346. [Google Scholar] [CrossRef]
  4. Marmo, R. Numerical and Experimental Investigation on Shear Behaviour of Riveted Connections. Ph.D. Thesis, University of Naples “Federico II”, Naples, Italy, 2015. [Google Scholar]
  5. Milone, A. On the Performance of Lap-Shear Hot-Driven Riveted Connections: Experimental and Numerical Study. Ph.D. Thesis, University of Naples “Federico II”, Naples, Italy, 2023. [Google Scholar]
  6. Collette, Q.; Sire, S.; Wouters, I. Lap shear tests on repaired wrought-iron riveted connections. Eng. Struct. 2015, 85, 170–181. [Google Scholar] [CrossRef]
  7. Bertolesi, E.; Buitrago, M.; Adam, J.M.; Calderon, P.A. Fatigue assessment of steel riveted railway bridges: Full-scale tests and analytical approach. J. Constr. Steel Res. 2021, 182, 106664. [Google Scholar] [CrossRef]
  8. Liu, Z.; Hebdon, M.H.; Correia, J.A.F.O.; Carvalho, H.; Vilela, P.M.L.; de Jesus, A.M.P.; Calcada, R.A.B. Fatigue Assessment of Critical Connections in a Historic Eyebar Suspension Bridge. J. Perform. Constr. Facil. 2019, 33, 04018091. [Google Scholar] [CrossRef]
  9. Milone, A.; D’Aniello, M.; Landolfo, R. Influence of camming imperfections on the resistance of lap shear riveted connections. J. Constr. Steel Res. 2023, 203, 107833. [Google Scholar] [CrossRef]
  10. D’Aniello, M.; Fiorino, L.; Portioli, F.; Landolfo, R. Experimental investigation on shear behaviour of riveted connections in steel structures. Eng. Struct. 2011, 33, 516–531. [Google Scholar] [CrossRef]
  11. Kuzawa, M.; Kaminski, T.; Bien, J. Fatigue assessment procedure for old riveted road bridges. Arch. Civ. Mech. Eng. 2018, 18, 1259–1274. [Google Scholar] [CrossRef]
  12. Marques, F.; Correia, J.A.; de Jesus, A.M.; Cunha, A.; Caetano, E.; Fernandes, A.A. Fatigue analysis of a railway bridge based on fracture mechanics and local modelling of riveted connections. Eng. Fail. Anal. 2018, 94, 121–144. [Google Scholar] [CrossRef]
  13. EN1993-1-9; Eurocode 3: Design of Steel Structures—Part 1–9: Fatigue. CEN: Brussels, Belgium, 2005.
  14. EN1993-1-9; Background Document for EN1993-1-9. CEN: Brussels, Belgium, 2005.
  15. Leonetti, D.; Maljaars, J.; Pasquarelli, G.; Brando, G. Rivet clamping force of as-built hot-riveted connections in steel bridges. J. Constr. Steel Res. 2020, 167, 105955. [Google Scholar] [CrossRef]
  16. Landolfo, R.; Cascini, L.; D’Aniello, M.; Portioli, F. Gli effetti del degrado da fatica e corrosione sui ponti ferroviari in carpenteria metallica: Un approccio integrato per la valutazione della vita residua. Riv. Ital. Della Saldatura 2011, 3, 367–377. (In Italian) [Google Scholar]
  17. De Jesus, A.M.P.; Figueiredo, M.A.V.; Ribeiro, A.S.; de Castro, P.M.S.T.; Fernandes, A.A. Residual Lifetime Assessment of an Ancient Riveted Steel Road Bridge. Strain 2011, 47, 402–415. [Google Scholar] [CrossRef]
  18. Lazzarin, P.; Zambardi, R. A finite-volume-energy based approach to predict the static and fatigue behavior of components with sharp V-shaped notches. Int. J. Fract. 2001, 112, 275–298. [Google Scholar] [CrossRef]
  19. Berto, F.; Lazzarin, P. Recent developments in brittle and quasi-brittle failure assessment of engineering materials by means of local approaches. Mater. Sci. Eng. R Rep. 2014, 75, 1–48. [Google Scholar] [CrossRef]
  20. Radaj, D.; Vormwald, M. Advanced Methods of Fatigue Assessment; Springer: New York, NY, USA, 2013. [Google Scholar]
  21. Taras, A.; Greiner, R. Development and Application of a Fatigue Class Catalogue for Riveted Bridge Components. Struct. Eng. Int. 2019, 20, 91–103. [Google Scholar] [CrossRef]
  22. prEN1993-1-9:2023; Eurocode 3: Design of Steel Structures—Part 1-9: Fatigue—2023 Draft. CEN: Brussels, Belgium, 2023.
  23. Mercuri, M.; Pathirage, M.; Gregori, A.; Cusatis, G. Influence of self-weight on size effect of quasi-brittle materials: Generalized analytical formulation and application to the failure of irregular masonry arches. Int. J. Fract. 2023, 246, 117–144. [Google Scholar] [CrossRef]
  24. Computer and Structures, Inc. (CSI). SAP200 v23 User’s Manual; CSI: Walnut Creek, CA, USA, 2021. [Google Scholar]
  25. D.M. 17/01/2018; Aggiornamento delle “Norme tecniche per le costruzioni”. MIT: Rome, Italy, 2018. (In Italian)
  26. Circolare 21/01/2019 n.7; Istruzioni per l’applicazione dell’«Aggiornamento delle “Norme Tecniche per le Costruzioni”. CSLLPP: Rome, Italy, 2019. (In Italian)
  27. RFI DTC INC PO SP IFS 003 A; Specifica per la Verifica a Fatica dei Ponti Ferroviari. RFI: Rome, Italy, 2011. (In Italian)
  28. Matsuishi, M.; Endo, T. Fatigue of metals subjected to varying stress. Jpn. Soc. Mech. Eng. 1968, 68, 37–40. [Google Scholar]
  29. Anderson, T.L. Fracture Mechanics: Fundamentals and Applications, 4th ed.; CRC Press: Boca Raton, FL, USA, 2017. [Google Scholar]
  30. European Convention for Constructional Steelwork (ECCS). Fatigue Design of Steel and Composite Structures, 2nd ed.; ECCS: Bruxelles, Belgium, 2018. [Google Scholar]
  31. Reis, A.J.; Oliveira Pedro, J.J. Bridge Design: Concepts and Analysis; John Wiley & Sons: Hoboken, NJ, USA, 2019. [Google Scholar]
  32. Milone, A.; Foti, P.; Filippi, S.; Landolfo, R.; Berto, F. Evaluation of the influence of mean stress on the fatigue behavior of notched and smooth medium carbon steel components through an energetic local approach. Fatigue Fract. Eng. Mater. Struct. 2024, 46, 4315–4332. [Google Scholar] [CrossRef]
  33. Milone, A.; Foti, P.; Viespoli, L.M.; Wan, D.; Mutignani, F.; Landolfo, R.; Berto, F. Influence of hot-dip galvanization on the fatigue performance of high-strength bolted connections. Eng. Struct. 2024, 299, 117136. [Google Scholar] [CrossRef]
  34. Simulia. ABAQUS v6.14 User’s Manual; Dassault Systemes Simulia Corp.: Providence, RI, USA, 2014. [Google Scholar]
  35. Lazzarin, P.; Berto, F.; Zappalorto, M. Rapid calculations of notch stress intensity factors based on averaged strain energy density from coarse meshes: Theoretical bases and applications. Int. J. Fatigue 2010, 32, 1559–1567. [Google Scholar] [CrossRef]
  36. Foti, P.; Berto, F. Strain Energy Density evaluation with free coarse mesh model. Mater. Des. Process. Commun. 2020, 2, e116. [Google Scholar] [CrossRef]
  37. Foti, P.; Razavi, N.; Ayatollahi, M.R.; Marsavina, L.; Berto, F. On the application of the volume free strain energy density method to blunt V-notches under mixed mode condition. Eng. Struct. 2021, 230, 111716. [Google Scholar] [CrossRef]
  38. Miner, M.A. Cumulative Damage in Fatigue. J. Appl. Mech. 1945, 3, 159–164. [Google Scholar] [CrossRef]
  39. Maljaars, J.; Euler, M. Fatigue S-N curves of bolts and bolted connections for application in civil engineering structures. Int. J. Fatigue 2021, 151, 106355. [Google Scholar] [CrossRef]
  40. Pilkey, D.F.; Pilkey, W.D.; Bi, Z. Peterson’s Stress Concentration Factors, 4th ed.; John Wiley & Sons: Hoboken, NJ, USA, 2020. [Google Scholar]
Figure 1. (a) View of the investigated riveted truss bridge at launch and present time; (b) main geometrical features as retrieved from the original design drawings.
Buildings 14 02271 g001
Figure 2. Key features of the most critical connections: (a) LC—midspan and (b) TD—most stressed.
Buildings 14 02271 g002
Figure 3. Main features of FE models: (a) global FEM of the bridge, (b,c) local FEMs of critical details.
Buildings 14 02271 g003aBuildings 14 02271 g003b
Figure 4. Applications of the SED method: (a) control volume for ASED calculations in U-notches; (b) extension to hot-driven riveted connections.
Buildings 14 02271 g004
Figure 5. Moving load analysis results for the most critical details: stress histories for (a) lower chord − midspan (LC); (b) tensile diagonal − support (TD).
Buildings 14 02271 g005
Figure 6. Von Mises stress distributions for the most critical details: (a) LC; (b) TD.
Buildings 14 02271 g006
Figure 7. SED-based fatigue assessment of critical riveted details: (a) master ASED fatigue curve [5]; (b) LC checks; (c) TD checks.
Buildings 14 02271 g007
Figure 8. Literature and normative fatigue curves for the assessment of riveted details [13,14,21,22,39].
Buildings 14 02271 g008
Table 1. Main features of “real” train loads and relevant daily passages according to RFI indications.
Train
Type
[-]
Total
Load
[kN]
Total Length
[m]
Number
of Axes
[-]
Nominal Speed
[m/s]
Dynamic Factor φ
[-]
Average Daily Passages
[1/d]
39400385.560701.317
45100237.630701.316
810,350212.546281.181
92960134.824331.161
Table 2. Application of the rainflow method to derive stress histories for critical details.
Lower Chord—Midspan (LC)
Train
Type
[-]
Daily Passages
[1/d]
Rainflow Method
n
[-]
Δσeq
[N/mm2]
σm,eq
[N/mm2]
R
[-]
377 × 120.620.40.33
7 × 133.023.80.88
466 × 121.020.60.32
6 × 126.321.20.74
811 × 126.028.10.37
1 × 224.035.20.89
911 × 115.017.60.40
1 × 67.421.40.71
Tensile Diagonal—Support (TD)
Train
Type
[-]
Daily Passages
[1/d]
Rainflow Method
n
[-]
Δσeq
[N/mm2]
σm,eq
[N/mm2]
R
[-]
377 × 15.510.00.57
7 × 123.211.20.75
466 × 14.99.70.60
6 × 113.010.70.75
811 × 29.812.20.43
1 × 321.114.10.93
911 × 14.49.50.62
1 × 62.210.60.81
Table 3. SED-based fatigue demand on investigated critical details.
Lower Chord—Midspan (LC)Tensile Diagonal—Support (TD)
Train Type
[-]
SED MethodTrain Type
[-]
SED Method
n
[-]
c w   Δ W ¯
[mJ/mm3]
n
[-]
c w   Δ W ¯
[mJ/mm3]
378.7 × 10–5371.7 × 10–3
914.0 × 10–3841.1 × 10–3
468.0 × 10–4461.4 × 10–3
721.3 × 10–2669.7 × 10–4
813.7 × 10–3823.6 × 10–3
228.5 × 10–2324.7 × 10–4
911.2 × 10–2911.3 × 10–3
69.3 × 10–267.0 × 10⁻⁴
Table 4. Relevant parameters for stress-life analysis of riveted details according to [13,14,21,22,39].
ReferenceDetailDC
[N/mm2]
Slope m1
[-]
Slope m2
[-]
Stress
Parameter
EN1993-1-9 B.D. [13,14]Two-sided joint9035Δσnet
One-sided joint7135Δσnet
prEN1993-1-9:2023 [22]; Maljaars and Euler [39]Two-sided joint9055Δσ* (Equation (6))
One-sided joint9055Δσ* (Equation (6))
Taras et al. [21]Two-sided joint9055Δσgross
One-sided joint8555Δσgross
Table 5. Fatigue assessment of critical details according to described formulations [13,14,21,22,39].
Lower Chord (LC)
nTOT,iki [-]1.192.06di = nTOT,i/N*i
ΔσΔσnetΔσ*SED[13,14][22,39][21]
[-][N/mm2][-]
2.6 × 10520.624.550.62.2 × 10–132.6 × 10–37.2 × 10–38.0 × 10⁻⁵
3.3 × 1063.03.67.41.4 × 10–61.0 × 10–46.1 × 10–66.8 × 10⁻⁸
2.2 × 10521.025.051.63.7 × 10–102.3 × 10–36.7 × 10–37.6 × 10⁻⁵
2.6 × 1066.37.515.56.2 × 10–57.6 × 10–42.0 × 10–42.2 × 10⁻⁶
3.7 × 10426.031.063.91.2 × 10–87.4 × 10–43.3 × 10–33.7 × 10⁻⁵
8.0 × 1054.04.89.81.2 × 10–25.9 × 10–56.2 × 10–67.0 × 10⁻⁸
3.7 × 10415.017.936.96.6 × 10–71.4 × 10–42.1 × 10–42.3 × 10⁻⁶
2.2 × 1057.48.818.24.4 × 10–31.0 × 10–43.7 × 10–54.1 × 10⁻⁷
DTOT [-]1.6 × 10–26.8 × 10–31.7 × 10–22.0 × 10–4
Variation [-]-×2.37×0.97>>
Tensile Diagonal (TD)
nTOT,iki [-]1.081.91di = nTOT,i/N*i
ΔσΔσnetΔσ*SED[13,14][22,39][21]
[-][N/mm2][-]
2.6 × 1055.55.911.35.7 × 10–77.5 × 10–54.1 × 10–61.4 × 10⁻⁷
3.3 × 1063.23.56.61.7 × 10–61.9 × 10–43.5 × 10–61.3 × 10⁻⁷
2.2 × 1054.95.310.12.5 × 10–74.5 × 10–51.9 × 10–67.0 × 10⁻⁸
2.6 × 1063.03.26.28.6 × 10–71.3 × 10–42.0 × 10–67.2 × 10⁻⁸
3.7 × 1049.810.620.21.1 × 10–66.1 × 10–51.0 × 10–53.7 × 10⁻⁷
8.0 × 1051.11.22.32.2 × 10–81.9 × 10–64.1 × 10–91.5 × 10⁻¹⁰
3.7 × 1044.44.89.13.3 × 10–85.5 × 10–61.9 × 10–76.8 × 10⁻⁹
2.2 × 1052.22.44.52.3 × 10–84.1 × 10–63.6 × 10–81.3 × 10⁻⁹
DTOT [-]4.5 × 10–65.1 × 10–42.2 × 10–57.9 × 10–7
Variation [-]-<< ×0.20×5.70
Disclaimer/Publisher’s Note: The statements, opinions and data contained in all publications are solely those of the individual author(s) and contributor(s) and not of MDPI and/or the editor(s). MDPI and/or the editor(s) disclaim responsibility for any injury to people or property resulting from any ideas, methods, instructions or products referred to in the content.

