
Energy Performance Indicators for Air-Conditioned Museums in Tropical Climates

1
Dipartimento di Ingegneria Civile e Architettura (DICAr), University of Pavia, Via Ferrata 3, 27100 Pavia, Italy
2
Department of Architecture, Built Environment and Construction Engineering (DABC), Politecnico di Milano, 20133 Milano, Italy
Buildings 2024, 14(8), 2301; https://doi.org/10.3390/buildings14082301
Submission received: 17 June 2024
/
Revised: 19 July 2024
/
Accepted: 22 July 2024
/
Published: 25 July 2024
(This article belongs to the Section Building Energy, Physics, Environment, and Systems)
Abstract
:The energy design of museums in developing countries is a subject that has been poorly studied, despite its significant implications for heritage preservation, human comfort, energy efficiency, and environmental sustainability. This study introduces a comprehensive framework of Energy Performance Indicators tailored to air-conditioned museums in tropical regions, which represent the most prevalent museum type. These indicators are particularly important as international standards may not be applicable in these contexts. A comprehensive review of the factors and their design implications is provided at the building, system, and component levels. Efficient integration of lighting and air conditioning systems can optimize energy use while maintaining appropriate conditions for both artefact preservation and visitor comfort. Parameters such as average illuminance, uniformity of lighting, lighting power density and lighting energy use intensity are critical in balancing visual quality and energy efficiency. Recommended values and strategies, such as the use of LED lighting and daylight harvesting, help to minimize energy consumption. In addition, parameters such as power density and energy use intensity of air conditioning systems are essential for assessing their efficiency. Techniques such as the integration of solar-assisted, optimized performance indices can effectively reduce energy consumption. Synthetic indicators for assessing lighting quality and overall energy performance are (i) Average Illuminance Ratio, which assesses the adequacy of lighting in a space by comparing the average measured illuminance with the recommended illuminance levels for that space, and (ii) Energy Use Intensity, which represents the total annual energy consumption per unit area of conditioned space. By adopting these indicators, tropical museums can advance energy efficiency and broader sustainability objectives, taking a significant step towards a more energy-conscious and sustainable future.
1. Introduction
The global community is facing a unique and multifaceted energy crisis of unprecedented proportions. It is the result of a complex interplay of economic, social, and environmental factors [1]. First, the increasing of global population and the subsequent rise in consumption levels are exerting mounting pressure on available energy resources [1]. The increasing living standards have underscored the escalating relevance of energy concerns, a trend that raises apprehensions about an impending energy shortage [2]. This phenomenon is consistent with the findings of the World Energy Outlook, which projects an annual 1.6% rise in energy demand between 2006 and 2030 [1]. Furthermore, geopolitical instabilities in some energy-producing regions have caused disruptions in the supply chain of oil and gas, increasing uncertainty and adding to energy price volatility. The most visible outcome of the crisis manifested has been a sharp escalation in energy prices [1]. The intensive use of fossil fuels has also contributed to the accumulation of greenhouse gas (GHG) emissions in the atmosphere, triggering severe climatic issues [3]. A paradigm shift in energy security is imperative to ensure the continuity of reliability and affordability in conjunction with emissions reduction [1]. This urgency is even more pronounced in developing countries, where the impact of these issues is acutely felt and where innovative solutions are most needed not only to address the challenges of energy access but also to alleviate the problems of energy poverty [4]. Additionally, these countries often bear the brunt of climate change impacts, including more frequent and severe extreme weather events that have significant repercussions on energy, agriculture, and food security [3]. The lack of infrastructure and financial capacity to invest in climate adaptation and mitigation further compounds these challenges. The rapid growth of their populations can also exacerbate the demand for energy and the associated environmental emissions. Therefore, the adoption of sustainable development practices is important for matching the energy needs of their populations while simultaneously reducing GHG emissions. A key area of concern is the significant progress observed in these countries across residential, commercial, industrial, and transportation sectors, which require critical attention [4].
Numerous strategies have been developed to reduce GHG emissions and address global warming. At the global level, the United Nations introduced the Sustainable Development Goals (SDGs) to encourage balanced sustainable development that includes social, economic, and environmental considerations [5]. Among them, SDG 7 focuses on enhancing energy efficiency and renewable energy sources (RES) with affordable and clean energy, SDG 11 aims to improve urban living with secure and cost-effective housing, efficient public transport, green public spaces, and fresh business prospects, and SDG 13 strives to decrease global temperatures and manage disaster risk and natural resources. Within this framework, the International Panel on Climate Change (IPCC) underscores the central role of construction in favoring climate change mitigation, resilience, and adaptation [3]. As a result, strategies such as energy retrofitting and reuse of existing buildings are recommended as essential steps towards decarbonization and energy transition.
Indeed, this situation is equally relevant and applicable to developing countries. Building retrofit helps to achieve significant energy savings without the high initial investment associated with new constructions. Furthermore, these strategies contribute to the reduction of GHG emissions associated with air-conditioned buildings, which constitute the majority of the building stock in many developing countries. One underexplored area refers to museum buildings. Museums’ requirements are very different from other functions. First, offices and commercial buildings require strict control of comfort conditions for occupants due to the continuous activities of their occupants throughout the day. Unlike other building types, the preservation of museum’s collections and buildings require a stringent control of climatic conditions (e.g., light, air temperature, relative humidity, and pollutant concentration) [6,7] to safeguard artifacts while ensuring visitor comfort [8]. Second, these buildings have different occupation schedules. Offices are consistently occupied by workers during office hours, and commercial buildings are crowded with customers during opening hours. Otherwise, museums have a fluctuating number of visitors throughout the day due to the inconsistency of the visit [6]. However, their building systems need to be functional and fully operational throughout the day, even during the event of minimum occupancy [7]. Third, free access and complex activities (e.g., restoration and photographic laboratories, offices, libraries, educational centers, entertainment spaces, bookshops, conference rooms, shops, cafeterias, restaurants, and so on) generate microclimatic instability [9,10,11,12]. This complex scenario frequently demands the implementation of various infrastructures, such as lighting systems, heating mechanisms, ventilation setups, and advanced air conditioning (HVAC) systems [13]. The requirement for effective lighting in museum spaces to enhance visibility and display exhibits can generate high electric consumptions. Similarly, the control of the indoor environment often requires sophisticated HVAC systems to maintain specific air temperature and humidity levels [14]. Their use may be advantageous for sensitive collections (e.g., watercolor, gouache, pencil, charcoal, and pastel, especially on paper and textile; or historical books) and human comfort. Additionally, many objects can also be preserved with unheated microclimatic conditions or with hygrothermal fluctuations without causing significative damage [14]. Besides, the use of high-capacity HVAC systems adds more stress to the management of the museums and human comfort [15,16]. Indeed, the National Museum Benin City in Edo State (Nigeria, hot-humid tropical climate) has installed an HVAC system to control the temperature regardless of the outside weather conditions. Nevertheless, artefacts are mainly displayed in glass cases to balance their needs with human comfort. Energy consumption also increases significantly. To reduce energy consumption and dust on artefacts, the National Museum of Unity Enugu in Enugu State (Nigeria), for example, uses fans and air conditioners that control the indoor climate but are turned off when there are no visitors. There are also covered walkways around the building to protect the gallery walls from direct sunlight. Thus, proper design could therefore also contribute to energy reduction. This means that the collections are not at risk while energy consumption is reduced [14]. Besides, reducing energy consumption is considered to be the best solution to tackle climate change [17,18]. Nonetheless, maintaining preservation conditions without excessive energy reliance remains a challenge, particularly in tropical climates where high air temperatures (Ta) and relative humidity (RHa) as well as high fluctuations during day and night are not compatible with heritage conservation and human comfort [19,20]. Therefore, it is crucial to identify the Energy Performance Indicators that affect museum buildings in tropical climates, especially for developing countries, considering air-conditioning and lighting systems as well as other electrical appliances.
The multi-functional nature of museum buildings necessitates a focus on energy efficiency, environmental sustainability, climate change adaptation, and emissions reduction [17,18]. While extensive literature exists on preventive conservation in developed countries, particularly Europe, Canada, and the United States [6], there is a lack of studies in developing countries, which have diverse cultural heritage policies and economic capabilities [6]. This gap results in methodologies that primary focus on temperate or cold climates, rather than tropical ones. To overcome these limitations, this study proposes a comprehensive framework that balances artifact preservation, human comfort, and energy efficiency in tropical museums, considering the unique challenges posed by these climates and their conservation policies and practices. Drawing insights from international studies, the research identifies key Energy Performance Indicators to optimize energy usage in air-conditioned museums while maintaining the integrity of collections and enhancing visitor well-being. These indicators include the role of light, humidity, temperature, and other climatic factors in energy use, heritage preservation, and human comfort.
This research primarily focuses on Malaysia, where the only studies on environmental and energy quality in museums are concentrated. This investigation provides recommendations transferable to other tropical climates and museums that experience the summer season and use air-conditioning for cooling. The study covers both historical and heritage museums, as well as new constructions and refurbished museums. The novelty of this study refers to the following aspects:
- The tropical climate context poses unique challenges for energy efficiency, especially with the widespread use of air-conditioning systems to maintain environmental conditions correct both for human comfort and heritage preservation.
- Emphasis on museum buildings that have distinct requirements from the most studied building typologies (e.g., office, academic, and residential buildings).
- Balancing heritage preservation and energy efficiency, recognizing the essential role of energy reduction for addressing climate change without jeopardizing the integrity of valuable artifacts.
- Definition of Energy Performance Indicators tailored for assessing energy efficiency in tropical air-conditioned museums.
- Applicability and replicability in similar climatic conditions, particularly on air-conditioning museums during the summer season.
- Comprehensive approach tailored for various museum settings.
The development of such a methodology has the potential to revolutionize the way museum buildings are designed, operated, and maintained in regions characterized by tropical climates, enhancing both the preservation of cultural heritage and environmental sustainability.
2. Materials and Methods
The study is structured in three phases:
- Phase 1: Framework on energy performances of museums in tropical climates (Section 3).
- Phase 2: Definition of Energy Performances Indicators for tropical museums (Section 4).
- Phase 3: Discussion and definition of synthetical indexes for balancing energy efficiency, heritage preservation, and human comfort in air-conditioned museums in tropical climates (Section 5).
In the initial phase (Section 3), a comprehensive literature review was conducted to identify the scientific studies published in the Scopus bibliometric database on indoor environmental quality (IEQ) and energy performance in museum buildings in tropical climates (Phase 1). This phase includes several key steps: (i) a systematic literature review of existing research and scientific studies related to the topic in tropical countries; (ii) a deeper investigation of the literature in Malaysia to identify research gaps and relevant findings specific to this context; and (iii) a synthesis of the collected data to provide a comprehensive overview of the state of knowledge in this field. The literature review was conducted on publications, books, and scientific papers. It was realized using the Scopus database, chosen for its extensive range of publications, which offers approximately 20% more coverage than Web of Science [21]. Google Scholar and ResearchGate were excluded due to the presence of overlapped manuscripts, which could compromise the uniqueness of the data collected [21]. To obtain a comprehensive understanding of the subject, the inquiries encompass “titles, abstracts, and keywords” (referred to as TITLE-ABS-KEY). This method ensures a thorough search, capturing significant papers that might be missed if only “keywords” (KEY) were used. The literature review was conducted in two steps to encompass both museum and climate keywords. In step (i), search terms included museum keywords, such as “museum*”, “museum building*”, “preventive conservation”, “energy efficiency”, “tropical”, “tropical country*”, and “tropical climate*”. In step (ii), additional keywords “Malaysia” and “Malaysian country” were used to focus on local studies and findings. This bibliometric analysis allowed the comparison of the following: (a) studies on the effect of indoor climate on energy performance in tropical museums; (b) studies on indoor environment quality in Malaysian museum; (c) typical life expectancy for mechanical and electrical components. Finally, the synthesis serves for understanding challenges and opportunities related to IEQ and energy efficiency in tropical museums.
The second phase (Section 4) outlines the methodology that will guide the assessment of energy efficiency in Malaysian museums. Starting from the tropical and Malaysian framework (Section 3), specific energy performance metrics were defined. These metrics include parameters such as temperature regulation, lighting systems, energy consumption, HVAC system efficiency, and more. Additionally, the study proposes a series of measures to reduce energy consumption, guaranteeing a trade-off between these aspects.
The third phase (Section 5) involves the development of synthetic indexes to provide a holistic assessment of energy performance in Malaysian museums. These indexes aggregate various metrics into comprehensive indicators, facilitating easier interpretation and decision-making for non-technical stakeholders. The methodology for developing synthetic indexes is divided into the following key steps: (i) identification of key metrics (e.g., Average Illuminance Ratio, Lighting Energy Use Intensity, HVAC Power Density, Energy Use Intensity, etc.); (ii) calculation of individual metrics based on the data collected during the assessment phase; and (iii) aggregation into synthetic indexes to provide an overall picture of energy performance. This involves normalizing the metrics to a common scale and combining them using weighted averages or other statistical methods.
3. Framework on Energy Performances of Museums in Tropical Climates
In tropical climates, since 2009, there has been various research on energy performance in buildings, and only a few have been related to IEQ. Most of studies on energy performance are conducted for office, academic, and residential buildings, and fewer studies have focused on other types of buildings like healthcare, historical, industrial, commercial, and high-rise buildings (Table 1).
Summarizing, IEQ’s studies concern mainly visual comfort [23,25,32], and indoor air quality [27]. Otherwise, the research on energy performances deals with energy design [26,30], improvement of the building envelope [22,23,28,29,31], facility services [24], and energy usage [33]. It is also worth noting that none of the research focused specifically on museums.
Diving deeper into the museum context, there is still a limited number of comprehensive evaluations of museums. These studies focus on Malaysia [34] and consider only air-conditioned museums. This situation is mandatory, especially for tropical climates that are characterized by high air temperatures (Ta) and relative humidity (RHa) as well as high fluctuations during day and night throughout the year. For example, in Malaysia, the average Ta is 30–33 °C during the day and 23–27 °C during the night, while RHa ranges from 70% to 90%. These conditions are similar in other tropical countries, such as Indonesia, Thailand, India, and the Philippines. These conditions are not compatible with both heritage conservation and human comfort. Hence, museums need to maintain the conditions for preservation while not being extremely dependent on energy consumption. Nevertheless, the energy consumption needed to accommodate the restricted and controlled environment of museums is still a concern. Despite this, the studies focus only on IEQ without addressing the energy performance in buildings (Table 2).
Studies have focused on the potential risks for artefacts associated with unstable or inadequate indoor conditions [19,35,36,37,39]. The main aspects considered are indoor lighting and the concentration of pollutants [19,37,40] and dust [36,39]. Another topic refers to human comfort for visitors, considering both visual [37,38] and thermal [38,41] aspects. Only Sulaiman [35] has discussed the interaction among different IEQ factors in air-conditioned Malaysian museums, showing the retrofit design project of few buildings. Originally, refurbished museums in Malaysia were not a purpose-built museum if the original function of the buildings was no longer being performed [35]. Due to their high heritage value, these buildings (i.e., old palaces, castles, towers, and so on) have been renovated and repurposed to house heritage collections. Frequently, this involves retaining the original or existing building systems within these structures for their new purpose, with minimal improvements, to encourage the active use and preservation of these historic buildings. Their conversion into exhibition spaces and the refurbishment of the original exhibits involve additional microclimatic and energy risks [10]. Also, the development of new building services is difficult due to structural, heritage, and technical constraints [42]. Most of these adaptively reused and refurbished museum buildings are historic buildings with a minimum age of approximately 50 years or more. Therefore, the building systems in these buildings can be expected to have existed for 15 to 30 years back. According to [43,44], the typical life expectancy for mechanical and electrical components is between three and thirty years (Table 3).
Hence, these refurbished museums are likely to consume more energy due to inevitable obsolescence and deterioration of mechanical and electrical components, eventually affecting the indoor environment of the museums. Especially in energy-efficient museums, but also in old palaces and churches, the use of HVAC is not justified in terms of environmental impact [14]. Besides, Sulaiman [34] showed that the air velocities in four selected air-conditioned museums in Malaysia are far below the recommended benchmark for an air-conditioned building, which are supposed to be 0.15 m/s–0.50 m/s [45] for comfort cooling. The actual values are respectively in the range of 0.004–0.0051 m/s at the National Museum and 0.01–0.04 at the Perak Museum Gallery. This situation is caused by the poor distribution of airflow in the galleries due to the obstacles and the inefficiency of air conditioning systems due to the poor maintenance work routine. This inefficient use of air-conditioning could increase the energy consumption of the museums The research shows that even with the use of air conditioning, the air velocity is still well below the recommended values, indicating a waste of energy. It is important that the air velocity criterion is met as the air velocity affects the performance of ventilation, especially when cross ventilation cannot occur in an enclosed space.
At the 2018 Asian Cooling Summit, panelists agreed that Southeast Asians are still unaware of the dangers of inadequate cooling technologies, which could lead to a growing cooling crisis for the environment [46]. For example, in Malaysia, energy consumption in existing buildings could be reduced by more than 40% through the implementation of energy efficiency approaches [47]. It was also demonstrated that approximately 75% of the Malaysian population depends on air-conditioning to cool off [48], and this is in line with some studies that have discovered air-conditioning as one of the major energy users in buildings [48,49,50,51,52,53]. For this reason, the Malaysian government has highlighted that energy efficiency is one of the key elements to improving environmental quality and reducing energy demand [54]. One of the main concerns for its energy efficiency initiatives is energy performance in commercial buildings [55]. To promote energy efficiency, Malaysia has also constructed several green office and commercial buildings without jeopardizing on occupants’ comfort, as well as the operating costs and energy consumption [6]. Besides, according to a white paper written by Hill [56], cooling technologies could account for 40% of electricity demand in Southeast Asia by 2040 if left unchecked. So, it is crucial to investigate how IEQ parameters, especially the thermal environment, affect the energy performance of Malaysian museums. Summarizing, in tropical climates, there are (i) few studies on the impact of IEQ parameters on the energy performance of buildings; (ii) few studies on the museum environment, although they have different needs compared to other buildings [19,20]; (iii) an absence of studies on the energy performance of museums, although they have lower reduction in energy consumption compared to commercial buildings [19,20]; and (iv) difficulties in transposing the literature on preventive conservation and energy efficiency of museum buildings in cold and temperate climates. There are significant gaps in the existing literature on museum buildings in tropical climates that highlight the critical need for further research and development. These gaps can be summarized as follows:
- Lack of comprehensive studies that explores the integration of various IEQ parameters and energy efficiency in museums.
- Absence of methodology for assessing both the risk to the preservation of artworks and the comfort of museum visitors.
- Limited focus on equipment performance (e.g., lighting or HVAC systems) as present approaches for measuring energy performance mainly focused on the overall building (e.g., electricity consumption) or component level (e.g., coefficient of performance).
The first two gaps hinder efforts to strike a balance between preserving valuable artefacts and providing an enjoyable experience for visitors. The last one means that critical energy-consuming components often remain underexplored. Consequently, it becomes evident that there is an urgent need for the development of a comprehensive methodology that considers the complex interplay between various climatic and energy-related factors. This need is especially relevant for air-conditioned museums, which represent the predominant museum type in tropical regions. For example, this methodology should consider factors such as the lighting levels required for optimal viewing of artworks and the associated energy consumption attributed to artificial lighting systems. Moreover, it should establish clear Energy Performance Indicators capable of assessing the dual objectives of conserving valuable artworks and promoting energy efficiency within air-conditioned museum settings. Filling these critical gaps in the literature will not only advance our understanding the dynamics of museum buildings in tropical climates but also provide guidance to stakeholders in the field, including architects, conservators, and museum managers.
4. Definition of Energy Performances Indicators for Tropical Museums
The objective of this phase is to identify the energy performance indicators essential for assessing the energy and environmental quality of museums in tropical climates. This definition was developed based on the findings of studies on preventive conservation, energy efficiency, and environmental quality in tropical museums. To achieve this, an extensive literature review was conducted on the Scopus database, focusing on the themes of “preventive conservation” AND “museum*” OR “museum building*”. Each indicator is systematically examined to verify its applicability and relevance within the context of air-conditioned museums located in tropical climates, with a particular emphasis on the Malaysian setting. Then, solutions to improve the energy efficiency of these museums balancing heritage conservation and human comfort are proposed.
The Energy Performances Indicators are structured in three categories [57]:
- Building level, which encompasses the entirety of the building, considering both the building envelope (the physical structure and exterior components) and the building systems (mechanical, electrical, and other systems). It considers all aspects related to the construction and functioning of the building as a whole.
- System level, which refers specifically to the energy systems within a building, such as HVAC, lighting, and other energy-related systems. It focuses on the efficiency, performance, and optimization of these systems to enhance overall energy efficiency within the building.
- Component level, which pertains to the individual building components or elements, such as windows, insulation, roofing, and other discrete architectural or construction features. At this level of analysis, the focus is on assessing the performance and characteristics of these specific components to understand their impact on energy efficiency and human comfort.
4.1. Building Level
In the literature, the building level determines the overall building energy performance through benchmarking and tracking at a high level. However, it will be challenging to have a deeper understanding of why a particular building performs at a certain level. To overcome this, system-level and component-level evaluations are essential. Three energy performance indicators are used in the literature:
- Electricity consumption (Section 4.1.1).
- Building Energy Index (Section 4.1.2).
- Building energy performance (Section 4.1.3).
The first two indicators are normally used in the Malaysian policies for other kind of buildings, while the last was found in the literature of other countries (mainly in Europe).
4.1.1. Electricity Consumption
A study of the building energy performance is essential to monitor and optimize energy consumption. An effective approach is to analyze the monthly electricity bills of the building. This analysis helps auditors to evaluate the energy performance of the building and compare it to a benchmark of similar buildings [58]. The goal of calculating electricity consumption is to understand the building’s energy use trend. This involves examining monthly consumption data throughout the whole year and identifying the factors that influence the electricity use. Besides, energy consumption forecasting, incorporating factors such as weather conditions, economic variables, and day–night cycles, has indeed been explored extensively using deep learning models. Promising studies have been developed but have not referred to models of museum environments, where additional considerations arise due to the unique operational characteristics of museums, such as visitors’ patterns and strict conservation requirements.
Malaysia has one of the highest electricity consumption rates among emerging markets. Rapid economic growth, especially in the residential and commercial sectors, accounts for nearly half of the total electricity generated. Many existing old buildings, especially historical museums, were constructed using conventional designs, which contribute to wasteful energy consumption and have a negative impact on overall energy performance throughout the operational phase [59]. The escalating energy demand is primarily driven by the growing use of air conditioning in existing buildings to improve human comfort. This scenario highlights the poor energy performance of these buildings and the resulting energy waste. It is evident that there is still a lack of awareness among Malaysians of the need to reduce electricity consumption, as electricity usage does not demonstrate any correlation with occupancy rates. For example, Abdullah and Mohamad [57] conducted a comparative study on the electricity consumption during peak and off-peak hours of an academic building in Johor whereby the consumption during these two circumstances showed a consistent distribution, except in September 2016 due to maintenance activities during the off-peak hour. A study on the Chancellery building of the Universiti Utara Malaysia (UUM) by Jamaludin et al. [60] found that there was no significant difference in the trend of electricity consumption during normal teaching hours and semester breaks, although the occupancy rate was very different during these two periods. Apart from that, the electricity consumption can be used to study the effect of building characteristics and design on electricity use that will reflect on how much electricity is needed to run the building. Another study by Jamaludin et al. [26] studied the passive design of residential colleges in the University of Malaya. They found that residential colleges that have an internal courtyard and balconies only use electricity in the range of 24 ÷ 34 kWh/m2 per year. Moreover, researchers can also recommend potential energy-saving strategies to improve building energy performance. On the other hand, Sadeghifam et al. [61] found that the most effective way to reduce energy consumption in tropical residential buildings was by changing the ceilings and ceiling materials rather than replacing other building elements like the wall, floor, window, roof, and ceiling. This was then followed with another study by Sadeghifam et al. [27] that established a ranking to show which part of the building envelope has the most significant influence on energy efficiency, and it was demonstrated that the ceiling was at the top on the list, followed by the window, wall, roof, and floor components. By conducting the energy performance study at the building level, the amount of electricity that can be saved through various method can be compared with average values obtained in other kind of buildings, for example:
- Notably, 71.1% of energy could be saved through green buildings like the Green Energy Office [62].
- An electricity saving of 53,000 kWh could be achieved in two months by overcoming the issue of energy waste within the Universiti Malaysia Perlis (UNIMAP) campus [63].
- Additionally, 3.82% of electricity could be saved in a year by following the recommended energy conservation measures in a hospital [64].
- A 41% saving in electricity could be achieved by using solar PV panels in Malaysia [65].
- Furthermore, 30% of electricity consumption could be reduced in office buildings by implementing indoor environment and energy management [24].
- A 34% reduction in energy consumption could be achieved if using a radiant slab cooling system as air-conditioning [66].
- A 10.6% energy saving could be achieved by installing a thermally enhanced sustainable hybrid (TESH) wall system in low-cost housing [22].
- A 77,569 MWh energy saving could be achieved if the building management applies advance glazing, compact fluorescent lamps, and insulation, as well as raising the thermostat set point temperature of the air-conditioners [33].
Besides, conducting training sessions for staff on energy-saving practices could improve energy practices (e.g., turning off lights and equipment when not in use, informing visitors about the museum’s sustainability efforts, promoting simple behaviors such as closing doors and windows when the HVAC system is running, and using energy-efficient equipment).
4.1.2. Building Energy Index (BEI)
BEI, also known as Energy Use Intensity (EUI), is a simple metric that is commonly used to measure the total energy consumption per year over the area of a given building [67]. However, this indicator is not comprehensive as it only looks at energy performance, without taking into account the significant variation due to other factors such as occupancy and construction characteristics. According to the MS 1525 standard [68], an energy-efficient building should achieve a BEI of 136 kWh/m2/year. However, as reported by Lim [69], office buildings in Malaysia have an average BEI of 250 kWh/m2/year, which is well above the standard. This was further proven when Abdullah and Mohamad [57] found that the BEI for one of the academic buildings in the Universiti Tun Hussein Onn Malaysia (UTHM) is 254.24 kWh/m2/year. Similarly, the Chancellery building at another university (Universiti Utara Malaysia) also has a high BEI value, with an average of 194.94 kWh/m2/year [26,67], as does an office building in Putrajaya, with an average BEI of 238.53 kWh/m2/year [70]. In contrast, Jamaludin et al. [60] found that the BEI at residential colleges of the University of Malaya (UM) was below the standard set by the Malaysian Standard 1525 [45], ranging from 24 to 120 kWh/m2/year. The study also found the colleges with appropriate practice of bioclimatic design strategies, particularly internal courtyards and balconies, to be the most energy-efficient and environmentally friendly. Likewise, the main campus at UTHM, which has nine zones, also achieved the recommend BEI value, which is 116 kWh/m2/year [71]. A comparative study by Zaid et al. [72] of green and conventional offices found that a conventional office that is not Green Building Index (GBI)-certified was performing better than the GBI-rated office building over time at 69 kWh/m2/year.
4.1.3. Building Energy Performance
In other countries, the calculation of energy efficiency is linked to the assessment of energy performance of buildings. This assessment considers the energy consumptions of a building to provide human comfort and support the building’s operations. Typically, this evaluation is supported by specific calculation procedures that are either mandated by legislation or based on the energy balance of a building. It also enables the identification of energy inefficiencies and provides efficient solutions to reduce operating costs and GHG emissions. No such examples of this kind have been found in museums or heritage buildings for tropical climates. It is therefore not useful to provide benchmarks or calculation methods that are not easily applicable in these contexts. On the contrary, it would be beneficial to develop specific building energy certification systems for this purpose in these countries. Apart from that, another way that could contribute to energy savings is to adjust the indoor temperature through simulation to find the optimum indoor temperature that could save a significant amount of energy [73,74]. This idea can be implemented in Malaysian historical buildings by varying the air-conditioner temperatures and investigating which temperature will result in the greatest energy or electricity reduction. Finally, it is essential for the researcher to have a thorough and in-depth knowledge of the hygrothermal response of the building and to conduct a risk-based analysis using simulation before renovating or retrofitting the historic building to improve its energy performance [75].
4.2. System Level
Although historically challenging, evaluating energy performance at the system level has recently shown greater potential for energy savings. At this level, it is possible to assess how all the components work together to deliver a specific building system, rather than just looking at the performance of specific component [75]. The literature on museum buildings in tropical countries considers the following indicators:
- Average Illuminance (Section 4.2.1).
- Uniformity of Lighting (Section 4.2.2).
- Light Power Density (Section 4.2.3).
- Lighting Energy Use Intensity (Section 4.2.4).
- HVAC Power Density (Section 4.2.5).
- HVAC Energy Use Intensity (Section 4.2.6).
A discussion of each indicator is provided in the following sessions.
4.2.1. Average Illuminance (Eav)
The interior and physical characteristics of a building can be considered a significant factor in lighting consumption, as the indoor environment has a strong influence on the distribution of light inside the building [76]. Therefore, museums should be optimally lit for the visual comfort of and perception of exhibits by visitors, as well as for spatial orientation [6,77]. Average illuminance (Eav), also called average light level, measures the average light intensity or luminous flux density on a surface. It represents the total amount of light received by a surface divided by its area. It is measured in lux (lx) or foot-candles (fc), depending on the unit system used. The formula for calculating average illuminance is as follows:
where
- Φtot represents the total luminous flux (lumens);
- A represents the total area (m2).
This equation calculates the average illuminance by dividing the total luminous flux by the total area. Different tasks or activities require different Eav for optimal visibility and visual comfort. In museum buildings, this value must enable the accurate viewing of various types of artifacts while simultaneously ensuring their long-term preservation. To address this, international regulatory standards have been established by Commission Internationale de l’Éclairage) (CIE) [78] that suggest restricting illumination and exposure based on artefact material sensitivity (Table 4). Besides, standards on human comfort require different Eav according to the human activity. In general, for each museum’s activity (e.g., admiring artworks, taking photographs, reading labels, and interactive displays, touching screens, relaxing in rest areas, exploring gift shops, watching videos), the correct light level is >300 lx. These standards have also been adopted in Malaysia where, according to MS1525 2014 [45], the Eav for museum buildings should not exceed 300 lux for conservative purposes.
The lighting levels required to simultaneously ensure the preservation of artworks and human comfort are in clear contrast with each other. To balance these opposing needs, international literature suggests a series of design strategies, which include the following measures:
- Artworks’ placement based on light sensitivity.
- Rotation of museum objects.
- Use of on/off lighting control devices.
- Luminance contrasts between background and objects.
Cultural heritage should be classified into the following categories: (i) non-sensitive artworks, (ii) artworks with low sensitivity, and (iii) artworks with medium to high sensitivity. Taking into account museological aspects related to chronology or thematic exhibition, artworks should be positioned considering similar light sensitivity. This allows the placement of less sensitive works (e.g., stone or marble sculptures, coins) in environments with natural lighting or high light intensity, while the visibility of moderately sensitive works can be valorized by medium lighting levels (200–300 lux). Thus, maximizing the use of natural light by installing skylights or daylighting systems where possible can reduce reliance on artificial lighting during daylight hours. Finally, highly sensitive works (e.g., watercolors, drawings on paper, tempera paintings on canvas, books, fabrics, postage stamps, painted wood) can be placed in light-controlled display cases, dark rooms with specific luminance contrasts, or accessible storage areas upon request. In addition, regular rotation of works of art on display can help to spread the effects of light more evenly, reducing the risk of damage to fragile pieces. This strategy has an impact on the Annual Energy Consumption (AEC), which is calculated as follows:
where
- Eav represents the average illuminance (lx);
- hy represents the annual hours of lighting (h).
This measure assesses the annual energy efficiency related to lighting. It considers both the average illuminance provided and the operational hours, helping to balance lighting quality and energy use. In this way, while maintaining higher light levels to guarantee comfort requirements (200–300 lux), the preservation of artworks is ensured by reducing the annual hours of illumination (h). A similar methodology involves the installation of on/off lighting devices that activate and deactivate artificial lighting based on the actual presence of people. While this approach effectively manages AEC, it may pose potential conservation challenges for artworks highly sensitive to light and temperature (e.g., paintings on canvas and wood or polychrome wood). Thus, installing motion sensors or timers in less frequently used areas such as storage rooms and restrooms is a good strategy to ensure lights are only on when needed. Repeated cycles of turning the lights on and off can rapidly fluctuate the surface temperature of these artifacts. This could result in variations in the linear expansion between the surface layer (e.g., the painted layer) and the support material (canvas or wood), potentially causing warping and detachment. Therefore, this strategy should be employed only with artifacts that are not vulnerable to thermal degradation. Finally, creating luminance contrasts between the background and the artwork can capture viewers’ attention and enhance the visual impact of the pieces (Section 4.2.2). Preserving artworks also promotes energy efficiency, as lower lighting levels generally correspond to reduced energy consumption. Roslizar et al. [52] measured the average illuminance inside the classrooms to investigate whether the energy conservation measures applied to the school lighting system brought a significant impact on electricity consumption. By reconstructing the setup and changing the operating hours of the lighting system alone, they managed to cut the energy usage and cost by half.
4.2.2. Uniformity of Lighting (UO)
It is not advisable to just use Eavg in measuring lighting performance because it may result in lower illuminance in certain areas and eventually risk the safety of the occupants. Thus, uniformity of lighting (UO) is defined as the ratio of minimum illuminance (Emin) to average illuminance (Eavg) of the area. This parameter assesses the distribution of the illumination across a given area:
where
- Emin is the minimum illuminance (lx);
- Eav is the average illuminance (lx).
This ratio measures the uniformity of illuminance across a space. A higher value indicates more uniform lighting, which is essential for visual comfort and reducing eye strain. In museums, achieving the right balance of UO is crucial, but the specific requirements may vary depending on the type of museum, the nature of the exhibits, and the curatorial preferences. According to guidelines provided by Department of Occupational Safety and Health (DOSH) [79] of Malaysia on occupational safety and health for lighting at the workplace, the UO value should be (i) not less than 0.5 for general lighting and (ii) not less than 0.7 for a task or activity. Good lighting uniformity is essential for enhancing two-dimensional artworks, such as paintings and flat objects, while minimizing shadowed areas and reflections on highly reflective surfaces (e.g., oil paintings, mirrors, or glass cases) (Figure 1).
Conversely, various strategies can be employed to emphasize the three-dimensionality or the colors of the artwork, such as the following:
- Luminance contrasts between background and objects.
- Color contrast between background and objects.
- Reflectance contrasts.
Light contrasts are employed to enhance highly photosensitive artworks (e.g., watercolors or graphite paintings) that require uniform light conditions in the exhibition area and lower light levels in the surrounding environment (Section 4.2.1). This light contrast allows viewers to see the artworks despite low light levels. In these cases, lighting uniformity also promotes preservation, as areas with higher light intensity can be susceptible to discoloration and chromatic changes. On the contrary, sculptures and three-dimensional objects require variations in light contrast to enhance the perception of their three-dimensionality, the presence of lights and shadows, and the specific surface textures (Figure 2).
Similarly, color contrasts can also enhance the visibility of artworks. Light backgrounds (e.g., white or yellow) enhance darker objects by creating a strong tonal contrast that improves the visibility of foreground elements (Figure 3).
Conversely, dark backgrounds (e.g., blue, green, brown) enhance artworks with lighter colors by directing the viewer’s focus to the foreground element (Figure 4).
Polychromatic artworks require the selection of background colors incorporated within the artwork itself. This helps prevent an excessive contrast between the artwork and its background, which could flatten the visual perception. Backgrounds should always be uniform to allow a clear view of the object (Figure 5).
Indeed, contrasts in reflectance can capture the visitor’s attention. Reflective artworks (e.g., mirrors, framed paintings with glass, oil paintings, coins, jewelry) are enhanced by matte backgrounds, such as velvet or satin finishes. The choice of colors should evoke the preciousness of the artworks themselves. For instance, for coins and jewelry, ruby red or royal blue tones are often selected. On the other hand, matte artworks (e.g., books, postage stamps, watercolors on paper) are enhanced by reflective and light backgrounds.
4.2.3. Lighting Power Density (LPD)
LPD is usually being utilized to identify energy-saving opportunities in a particular space or building. LPD, in the unit of W/m2, is defined as the ratio of total wattage of the lighting system to the serving floor area [80]:
where
- Wl(tot) is the total energy consumption of the lighting system (W);
- A is the serving floor area (m2).
LPD is an essential measure of the energy efficiency of a lighting system. Lower LPD values indicate more efficient lighting designs, reducing energy consumption while providing adequate illumination. According to MS1525:2014 [44], the maximum LPD allowed for museum and gallery is 11 W/m2. Various findings have been found relating to lighting saving potential through LPD, and most of them are simulation-based. However, it can still be calculated using the simple method using Equation (4). Gene-Harn et al. [25] were able to save 78% of lighting energy through the addition of task lights for office spaces because the task lights only contributed to 0.60 W/m2 of LPD. In the research, it was also found that 39.2% of lighting energy in an office building could be saved with the provision of a daylight trough, and the LPD was well within the MS1525 2014 [45].
LPD depends on the type of lamps used. Replacement of incandescent or fluorescent bulbs with Light Emitting Diodes (LEDs) and fiber optic lighting is a good strategy to improve energy efficiency and lifespan, reducing both energy consumption and maintenance costs. In both cases, a crucial element is related to the color of light, which can influence the visual perception of an object. The color appearance of light is expressed by the Correlated Color Temperature (CCT) of light. Generally, objects with cool colors are enhanced by bluish lights (CCT > 5000 K), while warm colors are complemented by yellow lights (CCT in the range 2700–3500 K, similar to candlelight or incandescent bulbs). Middle-range TCC (3500–5000 K) is neutral, resembling natural daylight. It is used for sculptures and tridimensional objects. The use of replaceable and rechargeable batteries is a flexible lighting solution has led thanks to greater flexibility in exhibit design and placement. Battery-powered lights can also serve as an emergency backup during power outages, ensuring the exhibits remain lit. Rechargeable batteries, particularly those powered by solar energy, offer a more sustainable option compared to traditional grid electricity. The main challenges refer to costs, light quality and intensity, as battery-powered lights may not always match the performance of wired lighting systems.
4.2.4. Lighting Energy Use Intensity (EUIlighting)
EUIlighting expresses the ratio of annual lighting energy consumption to building floor area and is used to evaluate how effective the lighting system is in providing the service. It is typically expressed in terms of energy consumption per square foot or square meter of floor area per year and is measured in in the unit of kWh/m2/year, according to the following calculation:
where
- Eligh, annual represents the annual energy consumption for lighting (kWh);
- Ab denotes the total building area (m2).
This metric provides a standardized measure of how much energy is consumed annually for lighting per unit area of the building. It helps in assessing and comparing the energy efficiency of lighting systems across different buildings. Lower EUI lighting values indicate greater energy efficiency, meaning that the lighting system is using less energy to provide the necessary illumination. In museums, this data is also related to the amount of artificial light radiation that impacts an artwork. Therefore, for photosensitive works, it is closely linked to their preservation. In the most thorough literature reviews conducted, no specific Malaysian, tropical, or international benchmarks were found to encourage the adoption of energy-efficient lighting technologies and practices in these buildings. Strategies to reduce this indicator involve the following actions (Section 4.2.1):
- Rotation of museum objects.
- Use of on/off lighting control devices.
4.2.5. HVAC Power Density (HvacPD)
The HvacPD, in the unit of W/m2, is the ratio of power input over the area for an HVAC system, which consists of Cooling Power Density (CPD) and Heating Input Density (HID). For the air-conditioned museum case in Malaysia, only CPD will be included in HvacPD by dividing the cooling load (Qc) per unit area (A) with air-conditioning energy efficiency ratio (EER) [81]:
where
- Qc represents the total cooling load (W);
- Acool represents the cooling area (m2).
This equation calculates the cooling power density by normalizing the cooling load to the area and adjusting for the energy efficiency ratio. Also, performing routine maintenance on HVAC systems is a good strategy to ensure they are operating efficiently, such as cleaning filters, checking for leaks, and calibrating controls.
4.2.6. HVAC Energy Use Intensity (EUIHVAC)
The most-used energy performance indicator for the air-conditioned environment is EUIHVAC, in the unit of kWh/m2, which is the ratio of HVAC annual energy use to the conditioned area [81]:
where
- EHVAC represents the annual energy consumption of the HVAC system (W);
- Acond represents the conditioned area (m2).
This equation measures the energy efficiency of the HVAC system by normalizing its annual energy consumption to the size of the conditioned space. A detailed energy audit by Kamaruzzaman et al. [50] used the specific energy use intensity indicator to study the performance of the electricity end-uses in historic buildings like offices, hotels, and churches and found that air-conditioning systems were the most extensive electricity end-use, ranging from 45 kWh/m2 to 57 kWh/m2. This indicator is not affected by the climate or any hygrothermal conditions, so it is the most suitable for use in comparing how each end-use performs in any type of building. Thus, adjusting temperature settings to balance comfort with energy savings is a good strategy (e.g., set heating or cooling to slightly higher or lower temperatures during non-visitor hours). Also, smart thermostats can optimize HVAC settings based on occupancy and outside temperature, leading to more efficient energy use.
4.3. Component Level
Components within the context of building systems refer to the individual equipment, devices, or elements that collectively make up a system designed to perform specific functions within a building. The components analyzed consider the following:
- Heating, Ventilation, and Air Conditioning (HVAC) system, composed of boilers, air handlers, heat pumps, air conditioning units, fans, filters, thermostats, ductwork, vents, and grilles.
- Electrical system, composed of circuit breakers, electrical panels, outlets, switches, wires, lighting fixtures, transformers, generators, and control systems.
The aspects analyzed are related to the following:
- Cooling Load (Section 4.3.1).
- Coefficient of Performance (COP) of air-conditioning (Section 4.3.2).
- Energy Efficiency Ratio (EER) of air-conditioner (Section 4.3.3).
- Luminous efficacy (Section 4.3.4).
4.3.1. Cooling Load
Heat gain generated inside the museum will affect the performance of air-conditioning, which depends on many factors, such as occupancy and electrical appliances [82]. Therefore, numerous methods have been created over the years to estimate the building cooling load by considering several heat sources. The most widely known and accepted standards for the determination of cooling load was established by the American Society of Heating, Refrigerating and Air-Conditioning Engineers (ASHRAE) as follows:
- Differential/Time-Averaging Method (TETD/TA) to calculate daily building thermal loads using temperature difference to calculate the amount of heat that needs to be removed or added to the building to maintain the desired indoor temperature considering outdoor daily fluctuations. This method is based on a time-averaged temperature difference (TA).
- Transfer Function Method (TFM), which relies on differential equations that describe the thermal behavior of buildings. It uses transfer functions to model the thermal response of buildings respond to variations of the external temperature conditions. Thus, it is used to assess the dynamic responses of buildings.
- Cooling Load Temperature Differential (CLTD)/Solar Cooling Load (SCL)/Cooling Load Factor (CLF) Method, which calculates building thermal loads, especially for air conditioning applications. The SCL method accounts for the thermal load due to solar radiation while the CLF is used to include internal thermal loads. These factors are used to calculate the total thermal loads of the building under specific conditions.
The choice of method often depends on the specific project conditions and HVAC system design objectives. The last method is the simplest for buildings with air conditioning [83]. Also, it can be manually calculated. Thus, it is also useful for providing museum conservators with a general idea of cooling loads. Cooling loads can also be calculated by conducting thermal analysis using simulation tools, which is more accurate. For example, Nazi et al. [70] used the cooling load indicator to improve the energy performance in office buildings by retrofitting the building with a few strategies that could reduce the cooling load. This is because less energy is being consumed with a lower cooling load, as it was found that almost half of the total energy consumption in the office buildings could be reduced if the cooling load were reduced by 40%. Likewise, Al-Tamil and Fadzil [30] also used a cooling load method to analyze the effect of building envelope designs for a residential building and found that the highest reduction in cooling load came from exterior wall thermal insulation, which is 10.2%. They concluded that for a high-rise apartment in Malaysia, passive concepts have a high potential for reducing the cooling load, particularly at the design stage of a project. However, this concept is not considered suitable for a heritage building because the practice of building conservation should, as far as possible, preserve the original structure and fabric of the building, maintaining the aesthetic and authentic values of the national heritage. Hassan and Al-Ashwal [28] also conducted a study using the cooling load method to determine the energy performance of high-rise apartments in Kuala Lumpur. They found that external wall thermal insulation, mainly double low-e glass, could reduce the cooling load by 29%. In the case of a hot-dry climate, Ayçam et al. [84] argued that among other parameters, cooling loads are the most critical parameter in minimizing cooling costs for traditional houses in the Historical Diyarbakir Surici-Old Town and Silbe Mass Housing Areas. They investigated the shadow effect on the energy performance of the houses by building different courtyard models available in the area and found that the shadow effect has a significant impact on cooling loads for a hot and dry climate like Turkey.
4.3.2. Coefficient of Performance (COP) of Air-Conditioning
Energy efficiency studies show that the strict indoor climate of museums results in excessive energy consumption, especially if the museum is housed in a historic structure [16]. The performance of air-conditioning can be measured by calculating the Coefficient of Performance (COP), an efficiency ratio of the amount of heat removed from air-conditioned space to the electrical energy consumed by the system. It is said that the system is more efficient as the COP increases. The amount of heat removed can be determined either from (i) heat rejection from the chiller, (ii) heat gain by the condenser, or (iii) heat rejection from the Air Handling Unit (AHU) [85].
where
- Qremoved represents the total heat removed (W);
- Winput represents the total electrical load (W).
This relationship shows how efficiently the system operates by comparing the useful heat removed to the electrical energy consumed [86].
Based on Carnot’s Theorem, the maximum theoretical COP (COPmax) for air-conditioning can be expressed by the following:
where TC is the cold temperature and TH is the hot temperature [87].
The COP can also be calculated by converting the EER value to COP, and the typical COP for air-conditioning is around 2 to 4 [85].
Akintunde and Erinle [88] studied the effect of Ta and RH on COP of air-conditioning and established the relationship between the parameters to give optimal performance. It is found that when Ta increases and RH decreases, COPoptimal will increase, and vice versa.
This method is useful to compare the performance level between the different types of air-conditioners as the higher the COP of an air-conditioner, the less electricity it will consume and the better the performance, hence promoting the efficient use of electricity. According to Munaaim et al. [87], a solar-assisted air-conditioner has a better performance compared to the standard and inverter types of air-conditioners because the COP ranged from 3.00 to 4.45, meaning it is more energy-efficient [89].
4.3.3. Energy Efficiency Ratio (EER) of Air-Conditioner
Based on MS2597 [45], the EER, in the unit of Btu/h/W, can be calculated for non-inverter air-conditioners and inverter air-conditioners, whereby the cooling capacity is at 100% load capacity.
4.3.4. Luminous Efficacy
Luminous efficacy, in the unit of lm/W, is the ratio of luminous flux to electric power consumed by the source.
where
- Φ is the luminous flux emitted by the light source (lm);
- P is the electric power consumed by the light source (W).
Luminous efficacy quantifies how efficiently a light source produces visible light from electrical power. The higher the luminous efficacy, the more efficient the lighting is, hence reducing the lighting energy consumption.
5. Discussion
Museum buildings are multifaceted environments where factors such as energy efficiency, environmental sustainability, visitor comfort, and artefact preservation must coexist harmoniously. Assessing energy performance at a systems level has emerged as a key way to achieve significant energy savings in museum buildings [90]. This approach considers the interaction of building components rather than focusing on individual elements. By efficiently integrating lighting and HVAC systems, museums can optimize energy use while maintaining environmental conditions suitable for both the conservation of works of art and visitor comfort [91]. The most important parameters in this context are as follows:
- Average illuminance (Eav) influences both visual aesthetics and artifact preservation. The balance between adequate illuminance (>300 lux) for visitor experience and controlled exposure (<300 lux) for artifact conservation can be supported by artwork rotation and use of light-sensitive materials in display cases to mitigate potential damage from prolonged light exposure.
- Uniformity of Lighting (UO) ensures consistent visual quality across exhibition spaces while minimizing shadows and glare. Guidelines in tropical climates recommend a UO value not less than 0.5 for general lighting and 0.7 for task-specific areas. Strategies like adjusting light contrasts and color temperatures enhance the presentation of artworks while maintaining lighting uniformity critical for artifact preservation.
- Lighting Power Density (LPD) and Lighting Energy Use Intensity (EUIlighting) assess the efficiency of lighting systems in museums. In tropical climates, compliance with standards like MS1525:2014 (max LPD of 11 W/m2) ensures that lighting designs minimize energy consumption without compromising visual quality or artifact preservation. Strategies such as employing LED lighting and integrating daylighting further reduce LPD, contributing to overall energy savings.
- HVAC Power Density (HvacPD) and HVAC Energy Use Intensity (EUIHVAC) highlight the energy efficiency of air conditioning systems. Techniques such as integrating solar-assisted air conditioners and optimizing COP enhance HVAC performance while reducing energy consumption.
From the analysis of the previous equations, it is possible to define indicators that provide essential metrics for assessing both lighting quality and overall energy performance in museum environments. Synthetic indicators thus aggregate data from different metrics into a single measure, providing a comprehensive view of overall performance. In addition, they simplify the complexity of their operation into manageable indices, helping staff to make decisions and formulate policies for day-to-day management. These benchmarking results help museum administrators track progress, identify areas for improvement and demonstrate success to stakeholders.
The synthetic parameter for the lighting assessment could be the Average Illuminance Ratio (AIR), which represents the average level of illumination measured across the space:
where
- Eav represents the average value of illuminance measured across the space (lx);
- Erec represents the standard or guideline value pf illuminance suggested as appropriate for the specific use of the space and for the specific objects (lx).
AIR > 1 indicates that the average illuminance meets or exceeds the recommended level, suggesting adequate lighting conditions. Conversely, AIR < 1 suggests that the average illuminance falls below the recommended level, indicating potential inadequacy in lighting provision.
The synthetic parameter for the energy assessment could be the Energy Use Intensity (EUI), which represents the total amount of energy consumed annually for all building operations, including HVAC, lighting, and other electrical systems:
where
- ECy represents the total annual energy consumption (W);
- Acond represents the area of the building or space that is actively controlled and conditioned (m2).
Low EUI values indicate more efficient energy use per unit of conditioned area, while high EUI values suggest higher energy consumption relative to the conditioned area, highlighting potential inefficiencies that may require attention.
Synthetic parameters can help to simplify issues for non-technical staff. However, they have several limitations related to the reduction of multi-dimensional data into single metrics that could potentially obscure critical details and lead to incomplete assessments of indoor environmental quality and energy efficiency. In addition, they may not fully capture the dynamic nature of museum environments, where conditions can change rapidly due to visitor activities, external climate variations, and maintenance activities. Their use should be complemented by comprehensive, context-specific analyses that consider the full range of environmental variables and their dynamic interactions over time. This approach ensures more accurate assessments that support informed decision-making and sustainable management practices in museum environments.
6. Conclusions
This study aims to develop a comprehensive set of Energy Performance Indicators (EPIs) tailored to assess energy efficiency, human comfort, and heritage preservation in museum buildings located in tropical climates. The research is structured into two main phases: (i) definition of an energy performances framework of museums in tropical climates; and (ii) definition of Energy Performances Indicators for tropical museums. The first phase highlights a research gap in this specific area, despite the prevalence of high energy consumption associated with air conditioning and suboptimal environmental comfort. The study of museums is only focused on Malaysia. Thus, its practical and legislative contexts are analyzed deeper to develop results that can be extrapolated to other countries experiencing tropical climates. Drawing from an extensive literature review, the research identifies the need for Energy Performance Indicators at three distinct levels: (i) the entire museum building, (ii) individual systems within the building, and (iii) specific building components. For each level, a comprehensive set of indicators is outlined, complete with recommended optimal value ranges aimed at enhancing energy efficiency. In addition, the study provides valuable insights into appropriate design strategies to reduce energy consumption while balancing heritage conservation and visitor comfort. The energy performance indicators allow the following:
- Measurement of the electricity consumption.
- Comparison with a reference building or any standards and regulations.
- Determination of whether the buildings need to undergo a retrofitting or refurbishment.
- Investigation of which passive or active designs are the best according to the building and climate.
- Understanding of whether the building has improved in terms of energy performance after it is being refurbished.
- Analysis of the performance of a component or a system.
The study serves as a baseline for energy performance assessments in Malaysia and tropical climates. Its impact may be more significant when combined with broader regional studies or policy initiatives to address energy efficiency in historical buildings. To maximize the study’s practicality, future work should focus on translating its findings into actionable recommendations and guidelines for building owners, managers, and policymakers. The next steps will be to adapt the indicators to feedback from different types of museums and geographical locations to ensure that they meet the specific needs of different contexts, to conduct longitudinal studies to track the performance of museums using the proposed indicators over time, and to produce comprehensive guidelines and toolkits that museum practitioners can use to apply the indicators effectively. These steps can facilitate the implementation of energy-efficient practices in these museum buildings.
Funding
This research received no external funding.
Acknowledgments
The research has been developed inside the Research Project “Multidisciplinary Assessment Method for Indoor Environmental and Energy Quality in Malaysian Museum Building: Artefact Protection and Human Comfort”. The author would like to thank all the researchers involved for collecting and sharing the material on Malaysian contexts.
Conflicts of Interest
The author declares no conflicts of interest.
References
- The World Energy Outlook. Available online: https://www.iea.org/reports/world-energy-outlook-2022 (accessed on 6 July 2024).
- United Nations. The Sustainable Development Goals Report 2022; United Nations: New York, NY, USA, 2022. [Google Scholar]
- IPCC, Climate Change 2022: Mitigation of Climate Change. Contribution of Working Group III to the Sixth Assessment Report of the Intergovernmental Panel on Climate Change. Available online: https://www.ipcc.ch/report/ar6/wg3 (accessed on 6 July 2024).
- Roodman, D.; Peterson, J.A.; Lenssen, N. A Building Revolution: How Ecology and Health Concerns Are Transforming Construction; Worldwatch Institute: Washington, DC, USA, 1995. [Google Scholar]
- United Nations, The 17 Goals. Available online: https://sdgs.un.org/goals (accessed on 6 July 2024).
- Lucchi, E. Review of Preventive Conservation in Museum Buildings. J. Cult. Herit. 2018, 29, 180–193. [Google Scholar] [CrossRef]
- Lucchi, E. Simplified Assessment Method for Environmental and Energy Quality in Museum Buildings. Energy Build. 2016, 117, 216–229. [Google Scholar] [CrossRef]
- Lucchi, E. Multidisciplinary Risk-Based Analysis for Supporting the Decision Making Process on Conservation, Energy Efficiency, and Human Comfort in Museum Buildings. J. Cult. Herit. 2016, 22, 1079–1089. [Google Scholar] [CrossRef]
- Avrami, E. The Conservation Assessment: A Proposed Model for Evaluating Museum Environmental Management Needs; The Getty Conservation Institute: Los Angeles, CA, USA, 1999. [Google Scholar]
- Camuffo, D. Microclimate for Cultural Heritage; Elsevier: Amsterdam, The Netherlands, 2019. [Google Scholar]
- ICCROM (International Centre for the Study of Preservation and Restoration of Cultural Property). Teamwork for Preventive Conservation; ICCROM: Roma, Italy, 2004. [Google Scholar]
- National Park Service (NPS). Museum Handbook; NPS: Washington, DC, USA, 1999. [Google Scholar]
- Elhariri, E.; Taie, S.A. An Energy Efficient System for Artifacts Preservation and Occupant Comfort. In Proceedings of the 2018 International Conference on Computer and Applications (ICCA), Beirut, Lebanon, 25–26 August 2018. [Google Scholar]
- Standard EN 15757; European Committee for Standardization (CEN). Conservation of Cultural Property. Specifications for Temperature and Relative Humidity to Limit Climate-Induced Mechanical Damage in Organic Hygroscopic Materials. CEN: Brussels, Belgium, 2010.
- Luciani, A. Historical Climates and Conservation Environments. Historical Perspectives on Climate Control Strategies within Museum and Heritage Buildings. Doctoral Dissertation, Politecnico di Milano, Milano, Italy, 2013. [Google Scholar]
- Kramer, R.; Schellen, L.; Schellen, H. Adaptive Temperature Limits for Air-Conditioned Museums in Temperate Climates. Build. Res. Inf. 2018, 46, 686–697. [Google Scholar] [CrossRef]
- Ankersmit, B.; Stappers, M.H.L. Managing Indoor Climate Risks in Museums; Springer: Basel, Switzerland, 2016. [Google Scholar]
- Vranikas, N.; Kosmopoulos, P.; Papadopoulos, A.M. Management of Museums’ Indoor Environment: An Interdisciplinary Challenge. Adv. Build. Energy Res. 2011, 5, 43–51. [Google Scholar] [CrossRef]
- Abdul Karim, N.; Talib, A.; Sujak, I. Environmental Standard Readings for Sustainable Museum Artifacts in Display Case: Case Study of Malaysian Museums. Built Environ. 2012, 9, 29–38. [Google Scholar]
- Sharif-Askari, H.; Abu-Hijleh, B. Review of Museums’ Indoor Environment Conditions Studies and Guidelines and Their Impact on the Museums’ Artifacts and Energy Consumption. Build. Environ. 2018, 143, 186–195. [Google Scholar] [CrossRef]
- Falagas, M.E.; Pitsouni, E.I.; Malietzis, G.A.; Pappas, G. Comparison of PubMed, Scopus, Web of Science, and Google Scholar: Strengths and Weaknesses. FASEB J. 2008, 22, 338–342. [Google Scholar] [CrossRef] [PubMed]
- Raut, A.N.; Gomez, C.P. Assessment of Thermal and Energy Performance of Thermally Efficient Sustainable Wall System for Malaysian Low Cost Housing. Appl. Therm. Eng. 2018, 136, 309–318. [Google Scholar] [CrossRef]
- Ab Wahab, N.; Sahril, N.A.; Amiruddin, A.; Yasin, Z.M.; Salim, N.A.; Rahmat, N.A.; Aziz, N.F.A. Performance of Environmental and Energy Audit for Manufacturing Industrial Buildings. Indones. J. Electr. Eng. Comput. Sci. 2018, 12, 534–541. [Google Scholar] [CrossRef]
- Ibrahim, S.H.; Julaihi, F.; Baharun, A.; Koesmeri, D.R.; Nawi, M.N.M. Investigating the Performance of Indoor Environment and Energy Management Implementation System in Office Building. Ekoloji 2018, 27, 87–94. [Google Scholar]
- Gene-Harn, L.; Keumala, N.; Ab Ghafar, N. Energy Saving Potential and Visual Comfort of Task Light Usage for Offices in Malaysia. Energy Build. 2017, 147, 166–175. [Google Scholar]
- Jamaludin, A.A.; Mahmood, N.Z.; Ilham, Z. Performance of Electricity Usage at Residential College Buildings in the University of Malaya Campus. Energy Sustain. Dev. 2017, 40, 85–102. [Google Scholar] [CrossRef]
- Sadeghifam, A.N.; Meynagh, M.M.; Tabatabaee, S.; Mahdiyar, A.; Memari, A.; Ismail, S. Assessment of the Building Components in the Energy Efficient Design of Tropical Residential Buildings: An Application of BIM and Statistical Taguchi Method. Energy 2019, 188, 116080. [Google Scholar] [CrossRef]
- Hassan, A.S.; Al-Ashwal, N.T. Impact of Building Envelope Modification on Energy Performance of High-Rise Apartments in Kuala Lumpur, Malaysia. Int. Trans. J. Eng. Manag. Appl. Sci. Technol. 2015, 6, 91–105. [Google Scholar]
- Moghimi, S.; Bakhtyar, B.; Azizpour, F.; Sopian, K.; Lim, C.H.; Mat, S.; Salleh, E. Maximization of Energy Saving and Minimization of Insulation Cost in a Tropical Hospital: A Case Study in Malaysia. WSEAS Trans. Environ. Dev. 2013, 9, 105–115. [Google Scholar]
- Al-Tamimi, N.; Fadzil, S.F.S. Energy-Efficient Envelope Design for High-Rise Residential Buildings in Malaysia. Archit. Sci. Rev. 2012, 55, 119–127. [Google Scholar] [CrossRef]
- Nikpour, M.; Kandar, M.Z.; Ghomeshi, M.; Moeinzadeh, N.; Ghasemi, M. Investigating the Effectiveness of Self-Shading Strategy on Overall Thermal Transfer Value and Window Size in High Rise Buildings. World Acad. Sci. Eng. Technol. 2011, 50, 161–166. [Google Scholar]
- Kwong, Q.J.; Adam, N.M. Energy Efficiency Potential in Tropical Buildings—Perspective of an Enclosed Transitional Zone. Int. Energy J. 2010, 11, 111–122. [Google Scholar]
- Saidur, R. Energy Consumption, Energy Savings, and Emission Analysis in Malaysian Office Buildings. Energy Policy 2009, 37, 4104–4113. [Google Scholar] [CrossRef]
- Sulaiman, R. Indoor Environmental Quality Strategies in Air-Conditioned Museum Galleries: A Holistic Framework for Visitor Satisfaction and Artefact Protection. Ph.D. Thesis, University of Malaya, Kuala Lumpur, Malaysia, 2019. [Google Scholar]
- Dzulkifli, S.N.M.; Abdullah, A.H.; Yong, L.Y.; Mohd Shamsuri, M.S.; Daud, Z. Classification of Potential Risk Factors through HIRARC Method in Assessing Indoor Environment of Museums. Int. J. Integr. Eng. 2018, 10, 43–55. [Google Scholar] [CrossRef]
- Mohd Din, S.A.; Mat Husin, N.B.; Othman, R. Inhalable and Respirable Dust Concentration of Soiled Stone, Metal and Ceramic Artefact Inside National Museum Malaysia. J. Malays. Inst. Plann. 2018, 16, 293–303. [Google Scholar]
- Ahmad, S.; Ahmad, N.; Talib, A. Ceiling Geometry and Daylighting Performance of Side Lit Historical Museum Galleries under Tropical Overcast Sky Condition. Pertanika 2017, 25, 287–298. [Google Scholar]
- Shuang, G.W.; Kamaruzzaman, S.N.; Zulkifli, N. Occupant’s Perception on Indoor Performance of Historical Museum: A Case Study of National Museum and Perak Museum, Malaysia. In Proceedings of the 2nd International Conference on Research in Science, Engineering and Technology, Dubai, United Arab Emirates, 21–22 March 2014. [Google Scholar]
- Hanapi, N.; Din, S.A.M. A Study on the Airborne Particulates Matter in Selected Museums of Peninsular Malaysia. Procedia Soc. Behav. Sci. 2012, 50, 602–613. [Google Scholar] [CrossRef]
- Ahmad, N.; Ahmad, S.S.; Talib, A. Illuminance Distributions, Visual Response and Limits for Conservation of Exhibits in Admiral Cheng Ho Gallery, Malaysia. In Proceedings of the IEEE Symposium on Computers & Informatics, Corfu, Greece, 28 June–1 July 2011. [Google Scholar]
- Yau, Y.H.; Chew, B.T.; Saifullah, A.Z.A. A Field Study on Thermal Comfort of Occupants and Acceptable Neutral Temperature at the National Museum in Malaysia. Indoor Built Environ. 2011, 22, 433–444. [Google Scholar] [CrossRef]
- Hui, S.C.M.; Leung, A.H.M.L. Sustainable building services systems for historic buildings. In Proceedings of the Joint Symposium 2004: Servicing Dense Built Environments, Hong Kong, China, 16 November 2004. [Google Scholar]
- Mohammadpourkarbasi, H.; Marsh, D.; Pitman, A. Life cycle of Mechanical and Electrical services. In Proceedings of the CIBSE Technical Symposium, Edinburgh, UK, 14–15 April 2016. [Google Scholar]
- Schoen, L.J. Appendix 7: Building Systems Useful Life. In Preventive Maintenance Guidebook: Best Practices to Maintain Efficient and Sustainable Buildings, 3rd ed.; Building Owners and Managers Association (BOMA) International: Washington, DC, USA, 2010; pp. 76–80. [Google Scholar]
- MS 1525:2014; Energy Efficiency and Use of Renewable Energy for Non-Residential Buildings—Code of Practice. Standards Malaysia: Cyberjaya, Malaysia, 2014.
- Koh, H. Inefficient Use of Air-Conditioning Leaves Asean Freezing in the Tropics. 2018. Available online: https://www.eco-business.com/press-releases/inefficient-use-of-air-conditioning-leaves-asean-freezing-in-the-tropics (accessed on 6 July 2024).
- Zain-Ahmed, A. Renewable energy, buildings and the fuel crisis. In Proceedings of the International Conference on Construction and Building Technology, Kuala Lumpur, Malaysia, 16–20 June 2008. [Google Scholar]
- Al Yacouby, A.M.; Khamidi, M.F.; Nuruddin, M.F.; Farhan, S.A.; Razali, A.E. Study on roof tile’s colors in Malaysia for development of new anti-warming roof tiles with higher Solar Reflectance Index (SRI). In Proceedings of the National Postgraduate Conference, Kuala Lumpur, Malaysia, 19–20 September 2011. [Google Scholar]
- Al-Obaidi, K.M.; Ismail, M.; Rahman, A.M.A. Design and Performance of a Novel Innovative Roofing System for Tropical Landed Houses. Energy Convers. Manag. 2014, 85, 488–504. [Google Scholar] [CrossRef]
- Kamaruzzaman, S.N.; Edwards, R.E.; Zawawi, E.M.A. Energy Consumption of Electricity End Uses in Malaysian Historic Buildings. Energy Environ. 2007, 18, 393–402. [Google Scholar] [CrossRef]
- Ranjbar, N.; Zaki, S.A.; Yusoff, M.N.; Hagishima, A. Time Series Data Analysis of Household Electricity Usage During El-Nino in Malaysia. Chem. Eng. Trans. 2017, 56, 379–384. [Google Scholar]
- Roslizar, A.; Alghoul, M.A.; Bakhtyar, B.; Asim, N.; Sopian, K. Annual Energy Usage Reduction and Cost Savings of a School: End-Use Energy Analysis. Sci. World J. 2014, 2014, 310539. [Google Scholar] [CrossRef] [PubMed]
- Saidur, R. Energy, Economics and Environmental Analysis for Chillers in Office Buildings. Energy Educ. Sci. Technol. Part A Energy Sci. Res. 2010, 25, 1–16. [Google Scholar]
- Yıldız, Y.; Arsan, Z.D. Identification of the Building Parameters That Influence Heating and Cooling Energy Loads for Apartment Buildings in Hot-Humid Climates. Energy 2011, 36, 4287–4296. [Google Scholar] [CrossRef]
- Aliagha, G.U.; Cin, N.Y. Perceptions of Malaysian Office Workers on the Adoption of the Japanese Cool Biz Concept of Energy Conservation. J. Asian Afr. Stud. 2013, 48, 427–446. [Google Scholar] [CrossRef]
- Hill, T. Freezing in the Tropics: Asean’s Air-Con Conundrum. Available online: https://www.bbc.com/news/business-46040863 (accessed on 6 July 2024).
- Li, H.; Hong, T.; Lee, S.H.; Sofos, M. System-Level Key Performance Indicators for Building Performance Evaluation. Energy Build. 2020, 209, 109703. [Google Scholar] [CrossRef]
- Abdullah, M.K.; Mohamad, M.H. Building Energy Performance: A Case Study at G2 Building UTHM. J. Adv. Res. Fluid Mech. Therm. Sci. 2018, 50, 161–169. [Google Scholar]
- Choong, W.W.; Chong, Y.F.; Low, S.T.; Mohammed, A.H. Implementation of Energy Management Key Practices in Malaysian Universities. Int. J. Emerg. Sci. 2012, 2, 455–477. [Google Scholar]
- Jamaludin, R.; Nawi, M.N.M.; Bahaudin, A.Y.; Mohtar, S.; Tahir, M.Z. Energy Efficiency of Chancellery Building at Universiti Utara Malaysia. J. Adv. Res. Fluid Mech. Therm. Sci. 2019, 58, 144–152. [Google Scholar]
- Sadeghifam, A.N.; Zahraee, S.M.; Meynagh, M.M.; Kiani, I. Combined Use of Design of Experiment and Dynamic Building Simulation in Assessment of Energy Efficiency in Tropical Residential Buildings. Energy Build. 2015, 86, 525–533. [Google Scholar] [CrossRef]
- Dwaikat, L.N.; Ali, K.N. The Economic Benefits of a Green Building—Evidence from Malaysia. J. Build. Eng. 2018, 18, 448–453. [Google Scholar] [CrossRef]
- Lmuradov, D.B.; Mat Zali, S.; Hanafi, N.H.; Mohd Zain, Z.; Za’aba, S.K.; Jusoh, M.S. Energy Efficiency in a New University Campus: Preliminary Findings. J. Sustain. Dev. 2015, 8, 184–193. [Google Scholar]
- Ludin, N.A.; Junedi, M.M.; Affandi, N.A.A.; Ibrahim, M.A.; Sopian, K.; Teridi, M.A.M.; Haw, L.C. Energy Efficiency Action Plan for a Public Hospital in Malaysia. Alam Cipta 2019, 12, 73–79. [Google Scholar]
- Nimlyat, P.S.; Kandar, M.Z.; Zango, M.S. Green Building and Environment Sustainability: A Retrofit of Chemical Engineering Pilot Plant Building Universiti Teknologi Malaysia [UTM]. Indian J. Sci. Technol. 2016, 9, 1–12. [Google Scholar] [CrossRef]
- Kwong, Q.J.; Kho, S.J.; Abdullah, J.; Raghavan, V.R. Evaluation of Energy Conservation Potential and Complete Cost-Benefit Analysis of the Slab-Integrated Radiant Cooling System: A Malaysian Case Study. Energy Build. 2017, 138, 165–174. [Google Scholar] [CrossRef]
- Tahir, M.Z.; Jamaludin, R.; Nawi, M.N.M.; Baluch, N.H.; Mohtar, S. Building Energy Index (BEI): A Study of Government Office Building in Malaysian Public University. J. Eng. Sci. Technol. 2017, 12, 192–201. [Google Scholar]
- MS 2597:2014; Minimum Energy Performance Standards (MEPS) for Air-Conditioner. Standards Malaysia: Cyberjaya, Malaysia, 2014.
- Lim, J. Building Energy Index and Green Building Index Malaysia. Available online: http://blog.japhethlim.com/index.php/2012/05/22/building-energy-index-in-malaysia (accessed on 6 July 2024).
- Nazi, W.; Royapoor, M.; Wang, Y.D.; Roskilly, A.P. Office Building Cooling Load Reduction Using Thermal Analysis Method—A Case Study. Appl. Energy 2017, 185, 1574–1584. [Google Scholar] [CrossRef]
- Noranai, Z.; Md Yusof, M.Z. Study of Energy Efficiency Opportunities in UTHM. World Acad. Sci. Eng. Technol. 2011, 77, 745–751. [Google Scholar]
- Zaid, S.M.; Kiani Rad, A.; Zainon, N. Are Green Offices Better than Conventional?: Measuring Operational Energy Consumption and Carbon Impact of Green Office in Malaysia. Facilities 2017, 35, 622–637. [Google Scholar] [CrossRef]
- Ascione, F.; Bianco, N.; De Masi, R.F.; De’ Rossi, F.; Vanoli, G.P. Energy Retrofit of an Educational Building in the Ancient Center of Benevento: Feasibility Study of Energy Savings and Respect of the Historical Value. Energy Build. 2015, 95, 172–183. [Google Scholar] [CrossRef]
- Ascione, F.; De Rossi, F.; Vanoli, G.P. Energy Retrofit of Historical Buildings: Theoretical and Experimental Investigations for the Modelling of Reliable Performance Scenarios. Energy Build. 2011, 43, 1925–1936. [Google Scholar] [CrossRef]
- Muñoz-González, C.M.; León-Rodríguez, A.L.; Navarro-Casas, J. Air Conditioning and Passive Environmental Techniques in Historic Churches in Mediterranean Climate: A Proposed Method to Assess Damage Risk and Thermal Comfort Pre-Intervention, Simulation-Based. Energy Build. 2016, 130, 567–577. [Google Scholar] [CrossRef]
- Makaremi, N.; Schiavon, S.; Pisello, A.L.; Asdrubali, F.; Cotana, F. Quantifying the Effects of Interior Surface Reflectance on Indoor Lighting. Procedia Eng. 2017, 134, 306–316. [Google Scholar] [CrossRef]
- De Graaf, T.; Dessouky, M.; Müller, H.F.O. Sustainable Lighting of Museum Buildings. Renew. Energy 2014, 67, 30–34. [Google Scholar] [CrossRef]
- Commission International de l’Éclairage (CIE). Control of Damage to Museum Objects by Optical Radiation; CIE: Brussels, Belgium, 2004. [Google Scholar]
- Department of Occupational Safety and Health. Guidelines on Occupational Safety and Health for Lighting at Workplace; Department of Occupational Safety and Health: Putrajaya, Malaysia, 2018.
- Linhart, F.; Scartezzini, J.L. Minimizing Lighting Power Density in Office Rooms Equipped with Anidolic Daylighting Systems. Solar Energy 2010, 84, 587–595. [Google Scholar] [CrossRef]
- Wang, L. Measuring Whole-Building HVAC System Energy Efficiency. Master’s Thesis, Texas A&M University, College Station, TX, USA, 2015. [Google Scholar]
- Pérez-Lombard, L.; Ortiz, J.; Maestre, I.R.; Coronel, J.F. Constructing HVAC Energy Efficiency Indicators. Energy Build. 2012, 47, 619–629. [Google Scholar] [CrossRef]
- Suziyana, M.D.; Nina, S.N.; Yusof, T.M.; Basirul, A.A.S. Analysis of Heat Gain in Computer Laboratory and Excellent Centre by Using CLTD/CLF/SCL Method. Procedia Eng. 2013, 53, 655–664. [Google Scholar] [CrossRef]
- Ayçam, İ.; Akalp, S.; Görgülü, L.S. The Application of Courtyard and Settlement Layouts of the Traditional Diyarbakır Houses to Contemporary Houses: A Case Study on the Analysis of Energy Performance. Energies 2020, 13, 587. [Google Scholar] [CrossRef]
- Othman, M.F.; Abdullah, H.; Sulaiman, N.A.; Hassan, M.Y. Performance Evaluation of an Actual Building Air-Conditioning System. In Proceedings of the 2nd International Conference on Mechanical Engineering Research (IC-MER2013), Pahang, Malaysia, 1–4 July 2013. [Google Scholar]
- Farreny, R.; Oliver-Solà, J.; Escuder-Bonilla, S.; Roca-Martí, M.; Sevigné, E.; Gabarrell, X.; Zieradevall, J. The Metabolism of Cultural Services: Energy and Water Flows in Museums. Energy Build. 2012, 47, 98–106. [Google Scholar] [CrossRef]
- Munaaim, C.; Al-Obaidi, A.; Azizul Abd Rahim, M. Performance Comparison of Solar Assisted and Inverter Air Conditioning Systems in Malaysia. J. Des. Built Environ. 2017, 17, 53–61. [Google Scholar] [CrossRef]
- Akintunde, M.A.; Erinle, T.J. Effects of Temperature and Humidity on Coefficient of Performance of Air-Conditioning System. AU J. Technol. 2015, 18, 145–155. [Google Scholar]
- Lau, L.C.; Tan, K.T.; Lee, K.T.; Mohamed, A.R. A Comparative Study on the Energy Policies in Japan and Malaysia in Fulfilling Their Nations’ Obligations towards the Kyoto Protocol. Energy Policy 2009, 37, 4771–4778. [Google Scholar] [CrossRef]
- Litti, G.; Audenaert, A.; Braet, J.; Fabbri, K. Thermal comfort and energy performance in museums. Developing assessment criteria and sustainability strategies. Sustainability 2018, 10, 1195. [Google Scholar]
- Lucchi, E.; Turati, F.; Colombo, B.; Schito, E. Climate-responsive design practices: A transdisciplinary methodology for achieving sustainable development goals in cultural and natural heritage. J. Clean. Prod. 2024, 457, 142431. [Google Scholar] [CrossRef]
Figure 1.
Natural light improves energy efficiency and enhance the visibility of specific objects. (a) Real Casino de Murcia (Spain): Zenithal lighting, also known as sky-lighting or top lighting, is indicated for large-scale installations, textiles, costumes, furniture, and space distribution; Museo Tattile Statale Omero in Ancona (Italy): (b) Lateral lighting, or side lighting, is indicated for paintings, flat artworks, interactive exhibits, models, and showcases; (c) The interaction between natural and artificial lighting can effectively accentuate the textures, contours, and details of sculptures and three-dimensional objects (Source: Author).

Figure 2.
Examples of luminance contrasts between background and objects. (a,b) Musée Fesch in Ajaccio (France): high light contrast enhances the perception of shadows, three-dimensionality, and dark colors, while also preserving light-sensitive manufacts; (c) Triennale Design Museum in Milano (Italy): light contrasts enable the visibility of images and captions (Source: Author).
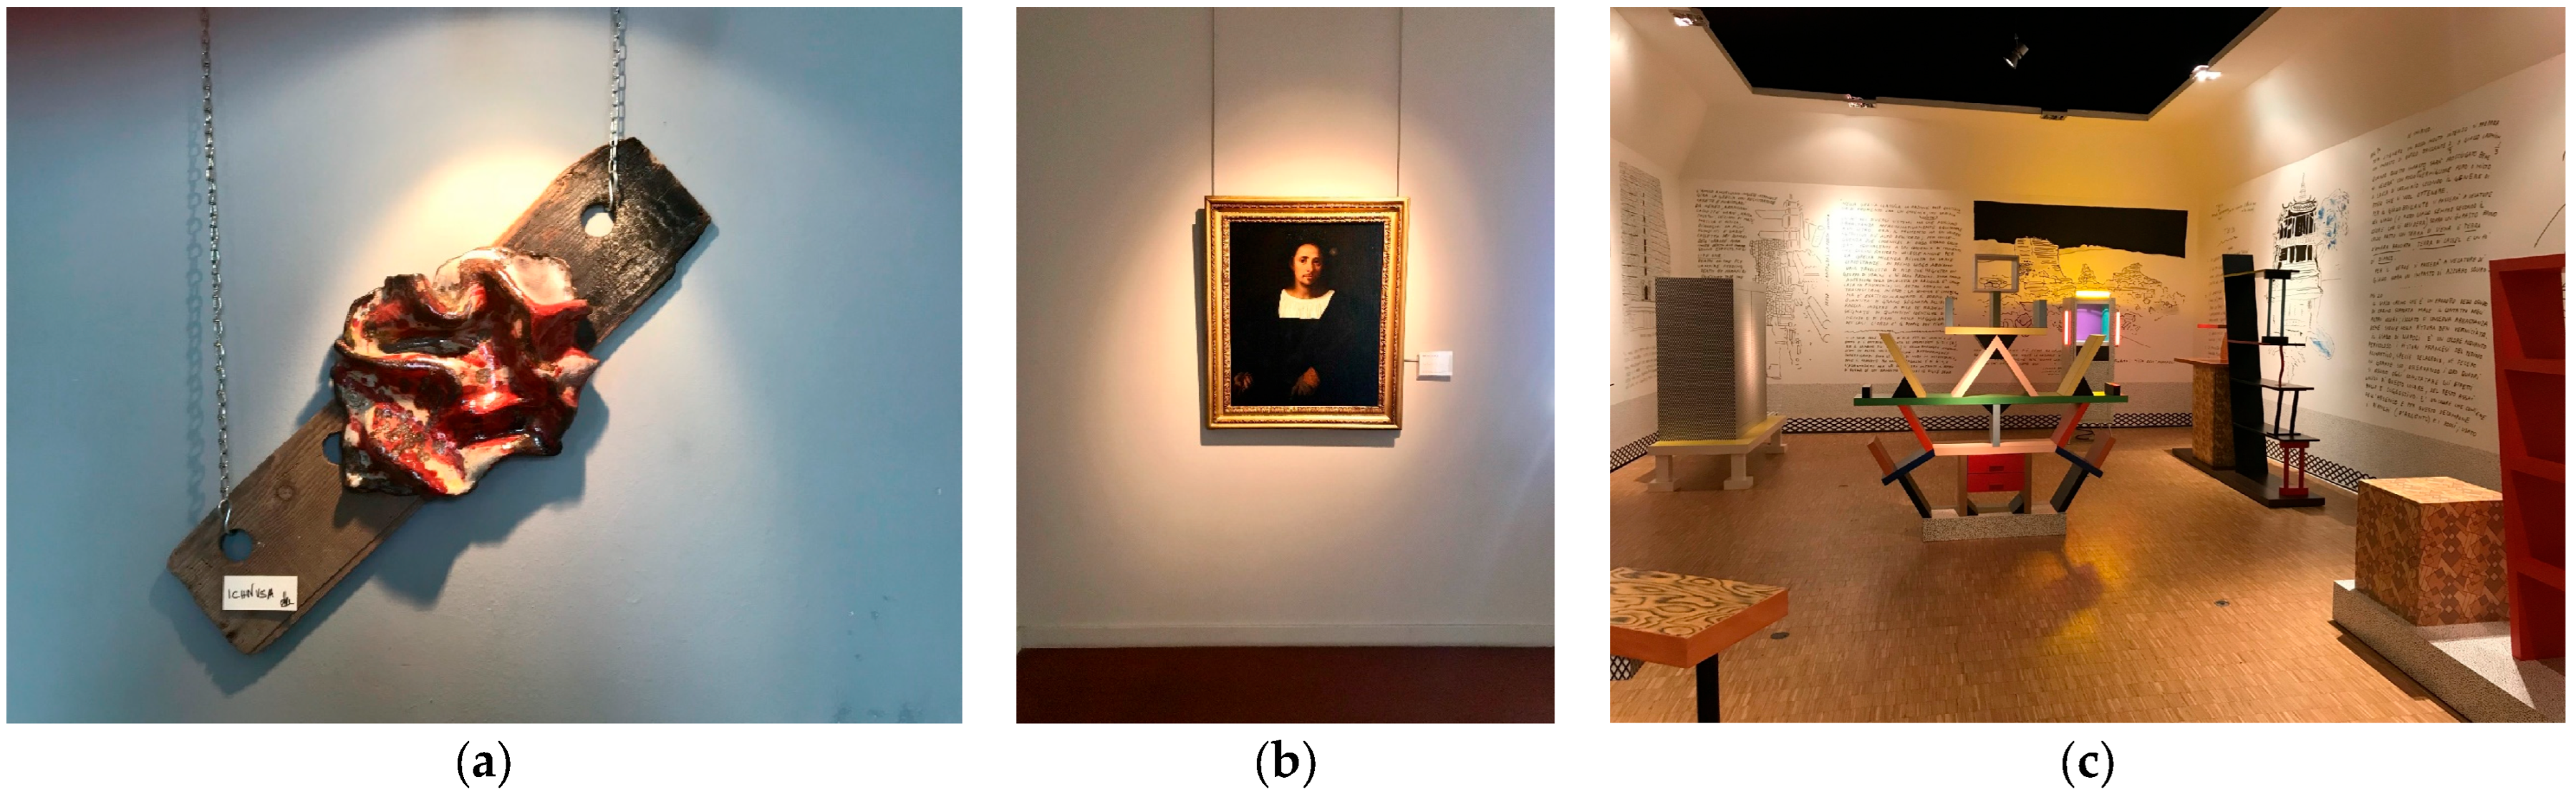
Figure 3.
Examples of color contrasts between background and objects. (a,b) Rural object and photographic temporary exhibitions in Milan and Ancona (Italy): light backgrounds enhance darker objects by creating a strong tonal contrast that improves the visibility of foreground elements; (c) Villa Reale di Monza (Italy): dark-colored frames focus the visibility of light paintings that are also on light backgrounds (Source: Author).

Figure 4.
Examples of color contrasts between background and objects. (a) Thessaloniki Museum of Modern Art (Greece): dark backgrounds enhance artworks with lighter colors by directing the viewer’s focus to the foreground element; (b) Temporary exhibition of Fortunato Depero (Italy): light-colored frames or backings focus the visibility of dark paintings that are also on dark backgrounds; (c) Musée Fesch in Ajaccio (France): dark backgrounds on dark objects flatten the visibility of objects (Source: Author).

Figure 5.
Examples of color and light contrasts between background and objects. Archaeological Museum of Aigai (Greece): (a) Uniform dark backgrounds allow a clear view of the clear object; (b) Light contrast ratio less than 10:1 between the object being viewed and its immediate surroundings avoids visual glare (Source: Author).


Table 1.
Studies on the effect of IEQ on energy performance in buildings (Source: Authors’ elaboration).
Table 1.
Studies on the effect of IEQ on energy performance in buildings (Source: Authors’ elaboration).
| Authors | Type of Building | Focus |
|---|---|---|
| Raut and Gomez (2018) [22] | Residential | Indoor thermal levels enhancement |
| Ab Wahab et al. (2018) [23] | Industrial | Energy performance, visual comfort, and thermal improvements |
| Ibrahim et al. (2018) [24] | Office | Indoor environment performances and implementation of energy management systems |
| Gene-Harn et al. (2017) [25] | Office | Energy-saving potential and user behavior towards task lights |
| Jamaludin et al. (2017) [26] | Academic | Design of residential college buildings and performance of the electricity usage |
| Sadeghifam et al. (2015) [27] | Residential | Energy saving and optimization in building elements, air quality factors towards energy-efficient design |
| Hassan and Al-Ashwal (2015) [28] | Residential | Energy performance and effect of thermal insulation and glazing types on energy-saving potential |
| Moghimi et al. (2013) [29] | Healthcare | Energy performance, optimum insulation thickness, and thermal performance of buildings |
| Al-Tamimi and Fadzil (2012) [30] | Residential | Building envelope design for energy cooling loads |
| Nikpour et al. (2011) [31] | High rise | Energy performance of the building envelope |
| Kwong and Adam (2010) [32] | Academic | Energy efficiency potential of the enclosed lift lobby |
| Saidur (2009) [33] | Office | Energy usage breakdown, energy intensity, and energy savings in buildings |
Table 2.
Studies on indoor environment quality in Malaysian museums (Source: Authors’ elaboration from [34]).
Table 2.
Studies on indoor environment quality in Malaysian museums (Source: Authors’ elaboration from [34]).
| Authors | Museum (City) | Focus of the studies |
|---|---|---|
| Sulaiman (2019) [34] | Few museums in Peninsular Malaysia | IEQ in air-conditioned museums |
| Dzulkifli et al. (2018) [35] | Around Bandar Hilir (Melaka) | Potential risks for heritage conservation based on indoor environmental conditions |
| Mohd Din et al. (2018) [36] | National Museum (Kuala Lampur) | Inhalable and respirable dust concentration from artifacts |
| Ahmad et al. (2017) [37] | Admiral Cheng Ho Gallery (Melaka); The Kuala Kedah Old Fort Museum (Kedah); The Kota Ngah Ibrahim Historical Complex (Perak); The War Memorial (Kelantan) | Daylighting control and design |
| Shuang et al. (2014) [38] | National Museum (Kuala Lampur); Perak Museum (Perak) | Occupants’ satisfaction with indoor environment performance |
| Abdul Karim et al. (2012) [19] | National Museum (Kuala Lampur); Terengganu State Museum, and Islamic Art Museum Malaysia (Terengganu) | Artifacts’ preservation in display cases |
| Hanapi and Din (2012) [39] | National Museum (Kuala Lampur); Pasir Salak Historical Complex and Beruas Archaeological Museum (Perak) | Indoor airborne particulates fluctuation and damage |
| Ahmad et al. (2011) [40] | Admiral Cheng Ho Gallery (Melaka) | Illuminance limits for exhibits’ conservation |
| Yau et al. (2011) [41] | National Museum (Kuala Lampur) | Thermal environment and occupants’ comfort |
Table 3.
Typical life expectancy for mechanical and electrical components (Authors’ elaboration from [43,44]).
| Type of Component | Component | Typical Life Expectancy (Years) |
|---|---|---|
| Electrical | Pipe | 25 |
| Fluorescent lamp | 3 | |
| Luminaire | 11 | |
| Cable tray | 30 | |
| Wiring | 30 | |
| Lighting device | 20–25 | |
| Mechanical | Air-conditioning unit | 10–20 |
| Air terminal | 10–30 | |
| Duct | 10–30 | |
| Air Handling Unit | 20–30 | |
| Damper | 20–30 | |
| Fan | 15–25 | |
| Coil | 12–20 | |
| Package chiller | 15–30 | |
| Condenser | 15–20 | |
| Pump | 10–25 |
Table 4.
Limiting illuminance and limiting exposure based on material classification. (Source: Author’s elaboration from CIE 157:2004 [77], and MS1525 2014 [44]).
| Light Sensibility | Limiting Illuminance (lx) | International Human Comfort Level (lx) | International Limiting Exposure (lx h/y) | |
|---|---|---|---|---|
| International | Malaysia | |||
| Irresponsive | No limit | No limit | >300 | No limit |
| Low | 200 | <300 | 600,000 | |
| Medium | 50 | 150,000 | ||
| High | 50 | 15,000 | ||
Disclaimer/Publisher’s Note: The statements, opinions and data contained in all publications are solely those of the individual author(s) and contributor(s) and not of MDPI and/or the editor(s). MDPI and/or the editor(s) disclaim responsibility for any injury to people or property resulting from any ideas, methods, instructions or products referred to in the content. |
© 2024 by the author. Licensee MDPI, Basel, Switzerland. This article is an open access article distributed under the terms and conditions of the Creative Commons Attribution (CC BY) license (https://creativecommons.org/licenses/by/4.0/).
Share and Cite
MDPI and ACS Style
Lucchi, E. Energy Performance Indicators for Air-Conditioned Museums in Tropical Climates. Buildings 2024, 14, 2301. https://doi.org/10.3390/buildings14082301
AMA Style
Lucchi E. Energy Performance Indicators for Air-Conditioned Museums in Tropical Climates. Buildings. 2024; 14(8):2301. https://doi.org/10.3390/buildings14082301
Chicago/Turabian StyleLucchi, Elena. 2024. "Energy Performance Indicators for Air-Conditioned Museums in Tropical Climates" Buildings 14, no. 8: 2301. https://doi.org/10.3390/buildings14082301
Note that from the first issue of 2016, this journal uses article numbers instead of page numbers. See further details here.