Article

The Optimum Interval Time of Layered Cement Composites with the Incorporation of Edge-Oxidized Graphene Oxide

Department of Civil Engineering, College of Engineering, King Saud University, P.O. Box 800, Riyadh 11421, Saudi Arabia
*
Author to whom correspondence should be addressed.
Buildings 2024, 14(8), 2307; https://doi.org/10.3390/buildings14082307
Submission received: 18 June 2024 / Revised: 19 July 2024 / Accepted: 23 July 2024 / Published: 25 July 2024
(This article belongs to the Section Building Materials, and Repair & Renovation)

Abstract

:
The current research focuses on the effect of incorporating edge-oxidized graphene oxide (EOGO) on the performance of layered cement composites cast at different times. The feature of producing flower-shaped hydrated cement products is exploited to enhance the contact surface of two different cement composites. In the current study, the interval time of casting cement composites is the crucial parameter investigated. Consequently, a layer of cement paste with EOGO is cast above a layer of cement mortar where the amount of EOGO of 0.10% by the cement weight is fixed for all mixtures. Also, four different interval times based on cement setting time are considered, namely immediately, 6 h, 12 h, and 1 day. Similar mixtures are prepared but without adding EOGO for comparison purposes. The results show that EOGO is capable of enhancing the contact surface of layered cement composites by strengthening the split strength of two different layers (between 12 and 29%). Moreover, casting the paste layer containing EOGO after 6 h of mortar layer seems to be the optimum interval time among others by improving compressive strength (by 29%) and residual strength (by 34%) and not affecting flexural strength and porosity percentage.

1. Introduction

In concrete construction, the presence of joints is a common phenomenon whether the joint is intentionally constructed, as in expansion joints, or the circumstances of the construction force form the joint, as in construction joints [1]. While expansion joints could be controlled by designers, as illustrated in ACI 224.3R-95 [2], construction joints are mostly not controlled due to the lack of concrete supply, especially during pouring concrete for massive elements [3,4]. So, construction joints can be defined as adjacent layers of concrete that are cast at different times with the old layer hardened before casting the new one [5]. Moreover, there are different cases where the joint between structural elements might be classified as construction joints such as the interface of precast concrete elements and in situ concrete elements [6] and the interface of different precast concrete elements [7]. It is necessary to deal with construction joints since they cause a lack in the performance of concrete members due to the insufficiencies of mechanical and durability properties [1,4]. Because of the discontinuity of transferring stresses through construction joints, the area resisting the applied loads would be minimized [2,3,4,5,7]. In addition, concrete members are exposed to deterioration due to the penetration of chemicals through macrocracks formed by construction joints [8].
Extensive research has been conducted to study the effect of construction joints on the behavior of concrete elements. A study shows that the significance of construction joints is related to the concrete’s compressive strength, and the bending moment capacity of beams decreases with an increase in the concrete’s compressive strength if there is a construction joint [3,9]. Another study claims that the vertical construction joint in the middle of a concrete beam reduces the beam’s modulus of rupture by above 50% compared with a normal beam [5]. Furthermore, the presence of a construction joint minimizes the splitting tensile strength of the concrete by more than half [10]. Serviceability requirements of a beam might not be attained because of construction joints due to higher deflections observed compared with beams that do not contain joints [4]. The location and orientation of joints play a crucial role in the failure mode of concrete beams [3].
Edge-oxidized graphene oxide (EOGO) is a carbon-based nanomaterial composed mainly of carbon atoms that are chemically like graphene oxide (GO) but with functionalized oxygen groups only on carbon sheets’ edges [11,12,13,14]. Previous studies show that the microstructure of cement hydration products is changed if GO is incorporated with cement material [15,16,17]. The cement hydration products take the form of a flowered shape, which assists in the interlocking of different hydration parts [18,19,20]. The reason for changing the internal structure is that the nucleation site’s role of GO contributes to motivating and accelerating the hydration process of cement [21,22]. Therefore, the features of incorporating GO into cement help enhance the mechanical properties of GO–cement composites [15,20,22,23,24].
The current study exploits the advantage of incorporating EOGO with cement paste in improving its joint with cement mortar to investigate the optimum time interval between casting the two different cement composites [25]. As previously reported [25], samples consisting of a cement paste layer above the cement mortar layer are constructed with different interval times between casting different layers. Even though there is a study that investigated the optimal delay time between casting two layers of cement mortar [26], there are still limited studies dealing with the optimum interval time between casting different cement composite layers. Different interval times in this study are chosen based on the initial and final setting time of the cement as well as the necessary time for cement hardening. Thus, there are four different interval times, which include before the initial setting time, after the initial setting time but before the final setting time, after the final setting time but before hardening, and after hardening. For EOGO, we decided to mix it with cement paste, not cement mortar, due to fewer uncertainties in the paste compared with the mortar medium. A previous study claims that cement mortar rheology is affected by the interaction between the cement paste and sand particles [27]. By performing this study, the effect of adding EOGO to the cement composite would be obvious. Characterizations of layered cement composites are measured by mechanical properties tests, including compressive and flexural strength tests, and by internal structure investigations, including a porosity test and scanning electron microscopy (SEM) analysis.

2. Experimental Design

2.1. Materials

In the current study, Ordinary Portland Cement Type I was used for both cement paste and cement mortar mixtures. This cement satisfies the chemical and physical requirements of ASTM C150 [28]. The sand used for cement mortar mixtures was natural river sand obtained from a local area in Riyadh, Saudi Arabia. Sand has an absorption percentage of 0.3%, and its specific gravity is 2.65. To control the water quantity of cement mortar mixtures, sand was used in oven-dried conditions, which compensated for the water quantity absorbed by the sand.
The additive nanomaterial used in the current study was edge-oxidized graphene oxide (EOGO). It has a flake shape and is primarily composed of multiple carbon sheets with functionalized oxygen groups on their edges. Unlike traditional graphene oxide [16,19,20,23], EOGO was produced using a mechanochemical method employed by Asbury Carbons Inc. (Orlando, FL, USA) [29,30]. The EOGO sheets had a nominal particle size of 500 nm and a surface area of 200–300 m2/g. These sheets mainly contained carbon (90–95%) and the remaining oxygen components [29,30]. A sample of EOGO was investigated by using energy-dispersive X-ray spectroscopy (EDS) and scanning electron microscopy (SEM) techniques. It was shown that EOGO was composed of 94% carbon and 6% oxygen. Figure 1 shows the SEM of EOGO used in the current study.

2.2. Mixture Design and Casting

Specimens of two layers of different cement composites were designed, where the first layer was composed of cement mortar, and the second layer was composed of cement paste. The cement mortar proportions were 1:2.1:5.7 (water–cement–sand), and the water–cement ratio of cement paste was 0.49. The amount of added EOGO was 0.10% by the cement weight, which was reported as the optimum amount concerning enhancing the strength [25].
To investigate the effect of the time interval between two layers, the initial and final setting times, as well as the time needed for cement hardening, were the basis of mixing different groups of layered cement composite mixtures. Therefore, four groups were prepared with two sets of mixtures, normal and with EOGO, for each group. These mixtures are labeled as immediately, 6 h, 12 h, and 1 day. In the case with the immediate casting, the two layers were cast directly without waiting for an initial set of the first layer, while 6 h represents the time interval between the first and second layers, where the first layer reached its initial setting time but not the final set. For the 12 h interval time, the second layer was cast after the first layer reached its final set. Regarding the time intervals after the hardening of the first layer, a 1-day mixture group was designed for this purpose. For comparison purposes, three sets of monolithic samples, namely paste, mortar, and paste with the addition of 0.10% EOGO, were also prepared. To simplify mixture names, the mixture of paste with EOGO is labeled as EOGO paste.
For each mixture, 12 cubes of dimensions 50 mm side and 6 prisms of dimensions 40 × 40 × 160 mm were cast to perform compression and flexural tests, as well as a porosity test. The quantity of materials used in this study is shown in Table 1. The two layers of cement composite materials were cast equally in height. To ensure the layer’s contact, the hardening of the first layer was accomplished with a waved rough tool with a width of 1 mm and a depth of 4 mm after casting the first layer and before casting the second layer. The mixing and casting processes of cement paste and cement mortar followed ASTM C305 standards [31].
For EOGO mixtures, the whole amount of dry EOGO was added to cement before adding water, and the mixture of cement and EOGO was mixed until a visually homogeneous mixture was obtained. The mixture of EOGO paste was then used instead of cement for mixture groups containing EOGO. A previous study recommended using a multilayer graphene oxide to facilitate its dispersion in cement paste [32], whereas another study showed the feasibility of mixing EOGO in a dry condition without the need for sonication and dispersant, which are required in wet mixing [33].

3. Tests

3.1. Setting Time

Setting time tests for cement paste and EOGO–cement paste were performed in this study to investigate the effect of adding EOGO on the hydration rate of C3A and C3S [34]. It was reported that one of the factors affecting the cement setting time is added admixtures [35]. Two samples of cement paste and EOGO–cement paste were simultaneously prepared following ASTM C 187 [36] with the same water-cement ratio (0.49), so both samples were exposed to similar environmental conditions. The setting time test was performed by using the Vicat apparatus, as illustrated by ASTM C191 [37], and the test readings were taken and recorded every 15 min.

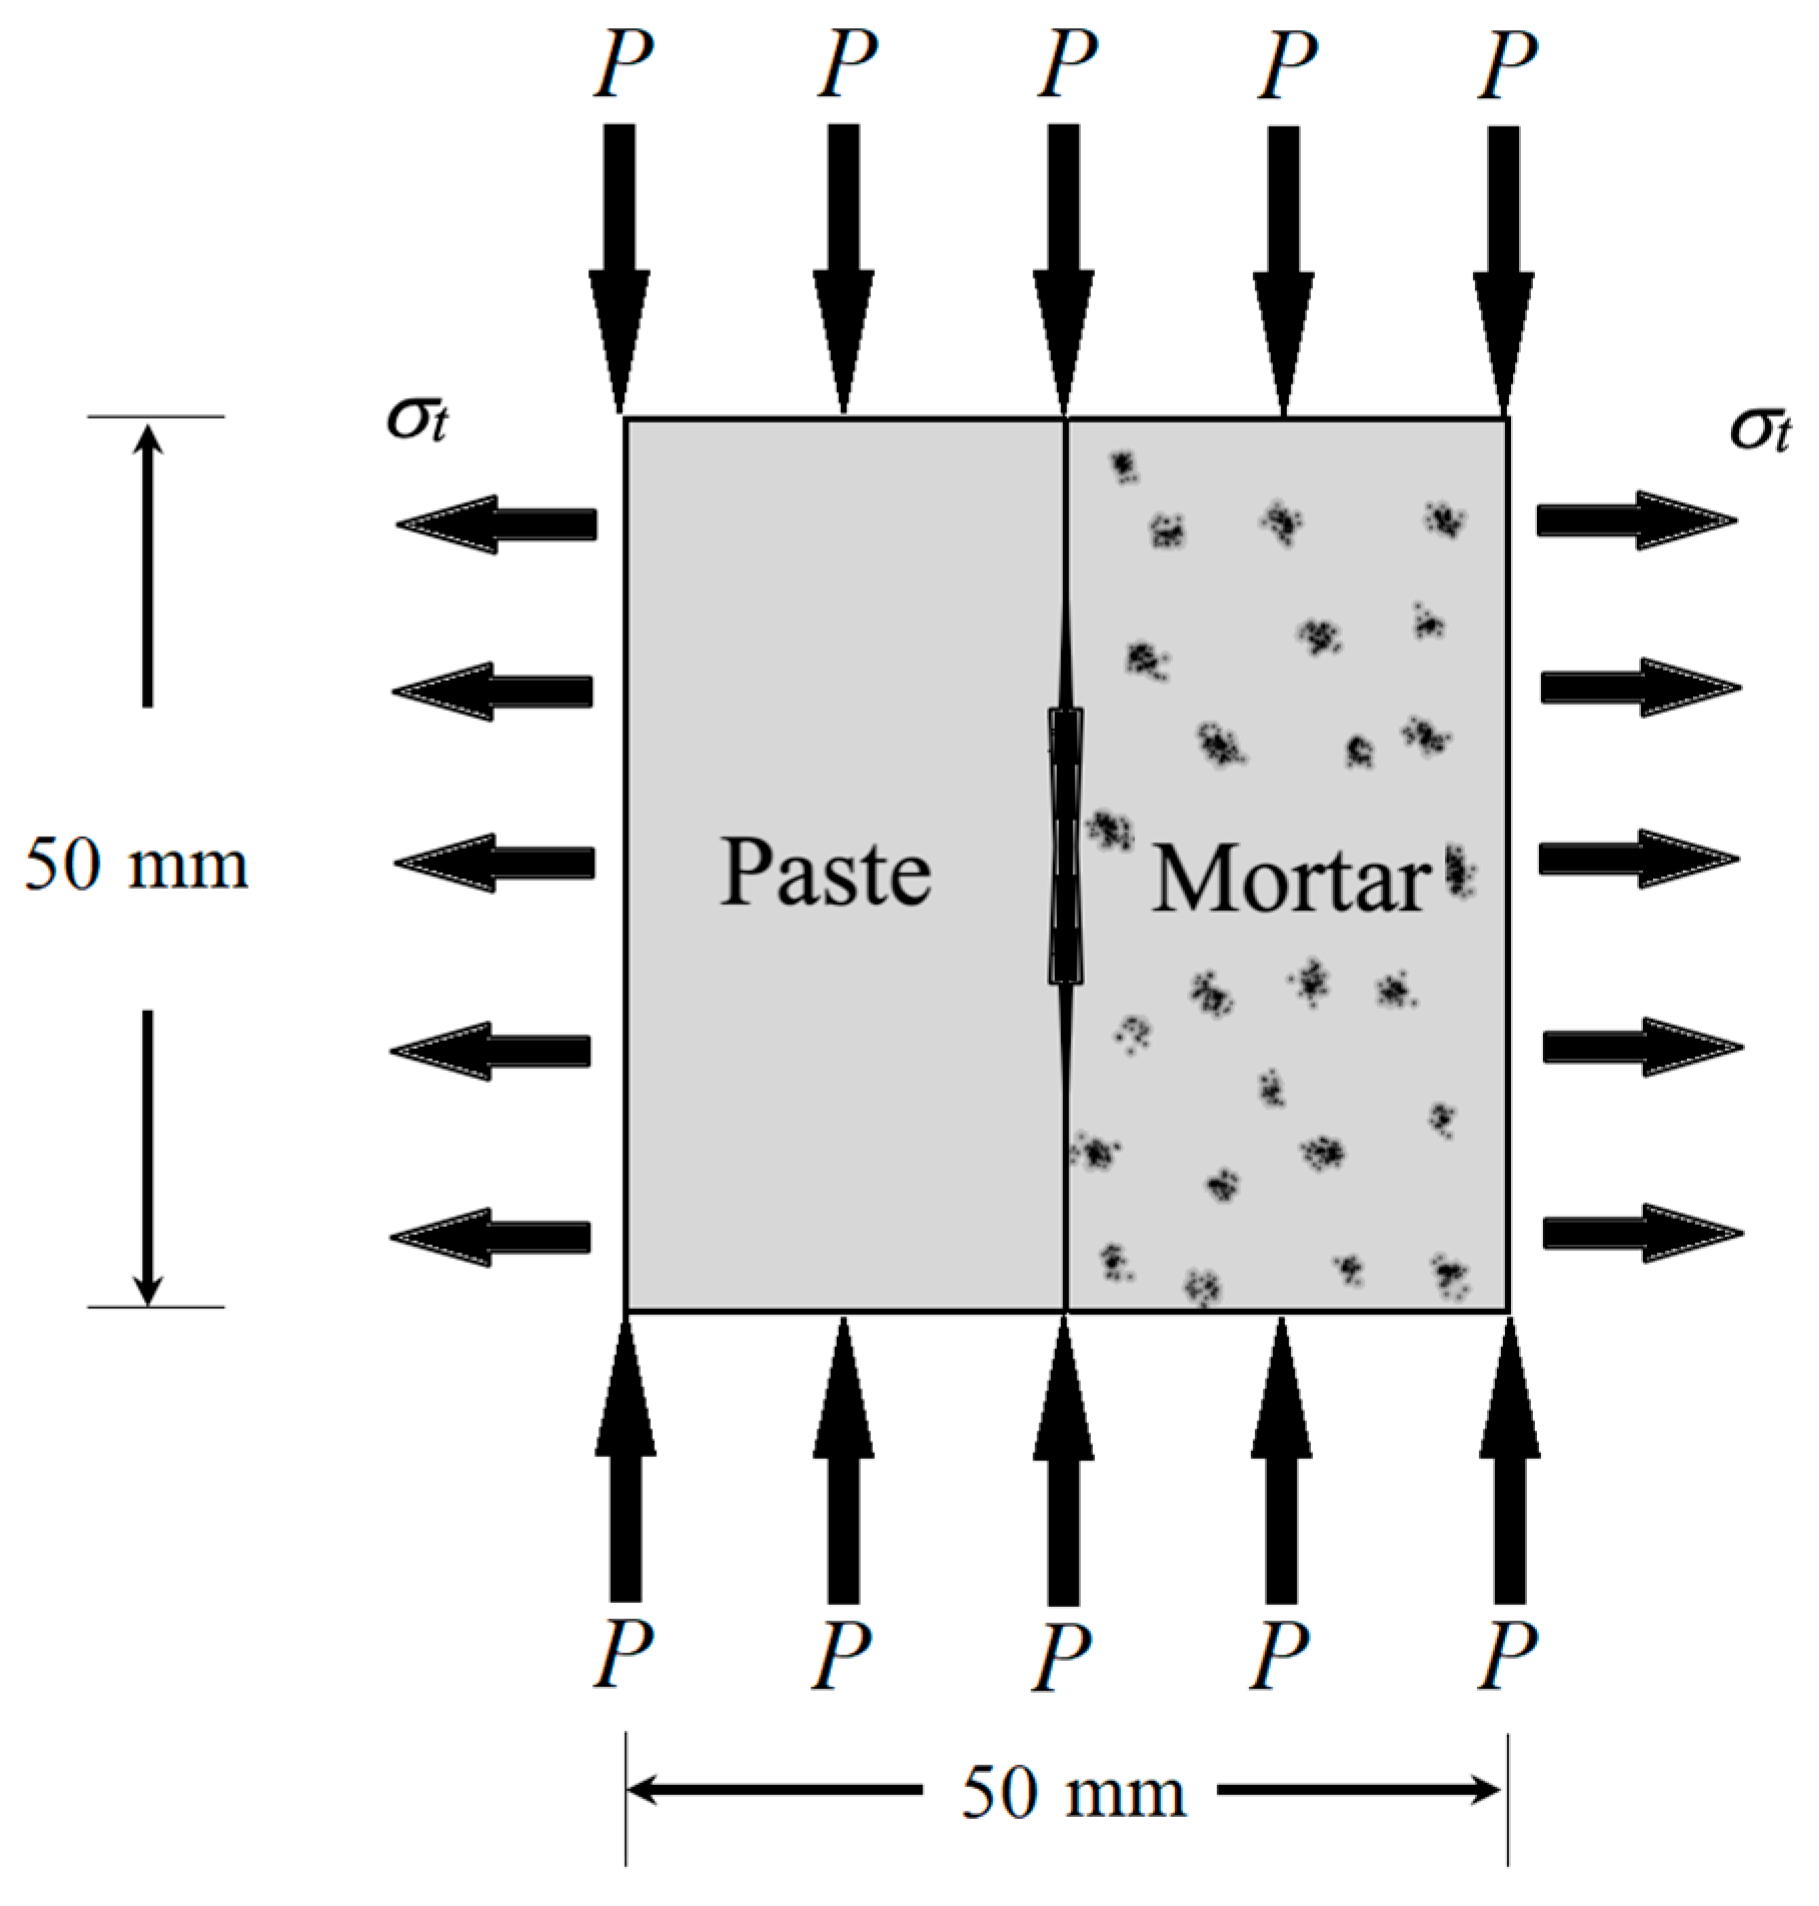
3.2. Mechanical Properties

In this study, mechanical properties were analyzed by conducting compressive and flexural tests following ASTM C109 and ASTM C348 standards [38,39], respectively, to investigate the adequacy of layered cement composites. To perform these tests, a universal testing machine, Toni Technik, was used.
For the compression test, the load was applied on the cube sample parallel to the contact surface of two different materials, as shown in Figure 2. This orientation ensured that the specimen would fail at the contact surface due to the effect of tensile stresses. In other words, this situation would allow us to measure the splitting tensile strength of two different cement composites. However, if a specimen failed at a location other than the contact surface, the compressive strength of that sample was considered, and the contact surface would be stronger than the failed material. The pattern of load application in the compression test was controlled load with a rate of 1.5 kN/s, and the load was applied until the specimen failed at either the contact surface or any other spot. For repetition, each compression test was performed using three samples.
Regarding the flexural test, the prism specimens were tested in a three-point bending test with a controlled load pattern, where the load rate was 0.05 MPa/s. As in the compression test, the prism samples were oriented in such a way that the load application would cause tensile stresses in both materials simultaneously. Figure 3 shows the setup of the flexural test. This orientation allowed us to better investigate the effect of EOGO on the contact surface of layered cement composites. At the point of failure, the flexural strength can be computed by applying Equation (1). For repetition, each flexural test was performed with three samples.
f = 3 2 P L b h 2
where
  • f = flexural strength (Mpa);
  • P = the maximum applied load (N);
  • L = the sample length (mm);
  • b = the sample height (mm);
  • h = the sample width (mm).
Figure 3. Flexural test setup: (a) prism elevation; (b) side view (dark areas in the joint represent the grooving locations).
Buildings 14 02307 g003

3.3. Microstructural Tests

Two methods of microstructural investigations of cement composites were conducted in the current study, namely a porosity test and the scanning electron microscopy (SEM) technique. Microstructural tests were performed at the 28-day curing age. Cube samples of 50 mm in side length, which were similar to the samples used for the compression test, were employed for the porosity test, and pieces of fractured samples at the contact surfaces were used for SEM observations.
A porosity test was performed following ASTM C830 [40], for which the samples were immersed in water and weighed. This weight is denoted as (S). After that, the specimens were removed from the water, and all specimens’ surfaces were dried with a dry cloth and weighed. This status of samples is the saturated surface dry condition, and the weight is denoted as (W). Then, the samples were put in an oven with a temperature of 100 ± 10 °C and kept for 24 h to ensure fully dried samples. The weight of samples was taken at this status and denoted as (D). To evaluate the percentage of porosity, Equation (2) is used as follows:
P o r o s i t y ,   % = W D W S × 100
The porosity test results contribute to exploring the internal pores of hydrated cement structures. Comparing the porosity percentages of different cement mixtures helps to interpret the effect of added materials in restructuring hydrated cement products.
Samples of fractured specimens were taken directly after mechanical tests for microstructural investigation by using the scanning electron microscopy (SEM) technique. Samples were coated with a platinum substance. This step helped stop activation processes and assisted in taking clear images for samples. A JSM-6010PLUS device was employed for SEM imaging. After coating the samples, they were placed in a vibration-free sample chamber and vacuumed using a vacuum pump to avoid disturbance. After that, a beam of high-energy electrons with a very short wavelength was focused on the sample to investigate the surface texture and the chemical composition of the tested sample.

4. Results and Discussion

4.1. Setting Time

The effect of adding EOGO with an amount of 0.10% by the cement weight on the setting time of cement is shown in Figure 4. Cement setting started after 4 h and 45 min of mixing either with or without EOGO. However, the effect of EOGO was in delaying the time of cement setting. All penetration readings of EOGO–cement paste starting from 5 h were different from the penetration readings of the control cement paste until the final setting of both mixes. Therefore, the initial setting time of cement was delayed more than 15 min when 0.10% of EOGO was added. Similarly, the final setting time of cement was delayed 15 min when the last readings of penetrations were 3 mm or less, as shown in Figure 4. Since C3A and C3S are responsible for cement setting, and C2S and C3S are the main sources of cement strength [34], it can be claimed that the presence of EOGO delays the hydration of the cement component C3A. In other words, functionalized oxygen groups in EOGO retard the hydration of the C3A component. This conclusion was obtained based on the delay of the setting time and the improvement in strength (presented in the following section) when adding EOGO to the cement paste mixture. The quantity of EOGO played a crucial role in the retarding time, so conducting setting time tests for different amounts of EOGO allowed us to investigate the correlation between the amount of EOGO and the delay in cement setting.

4.2. Mechanical Properties

The mechanical strength of all mixes was evaluated by compression and flexural tests for 7 and 28 curing days. Each mixture with EOGO was compared to the control one with a similar interval time to investigate the effect of EOGO and the time interval between casting two different cement composites. For comparison purposes, the mechanical strength results of referenced samples (cement paste, cement mortar, and EOGO paste) are also presented.

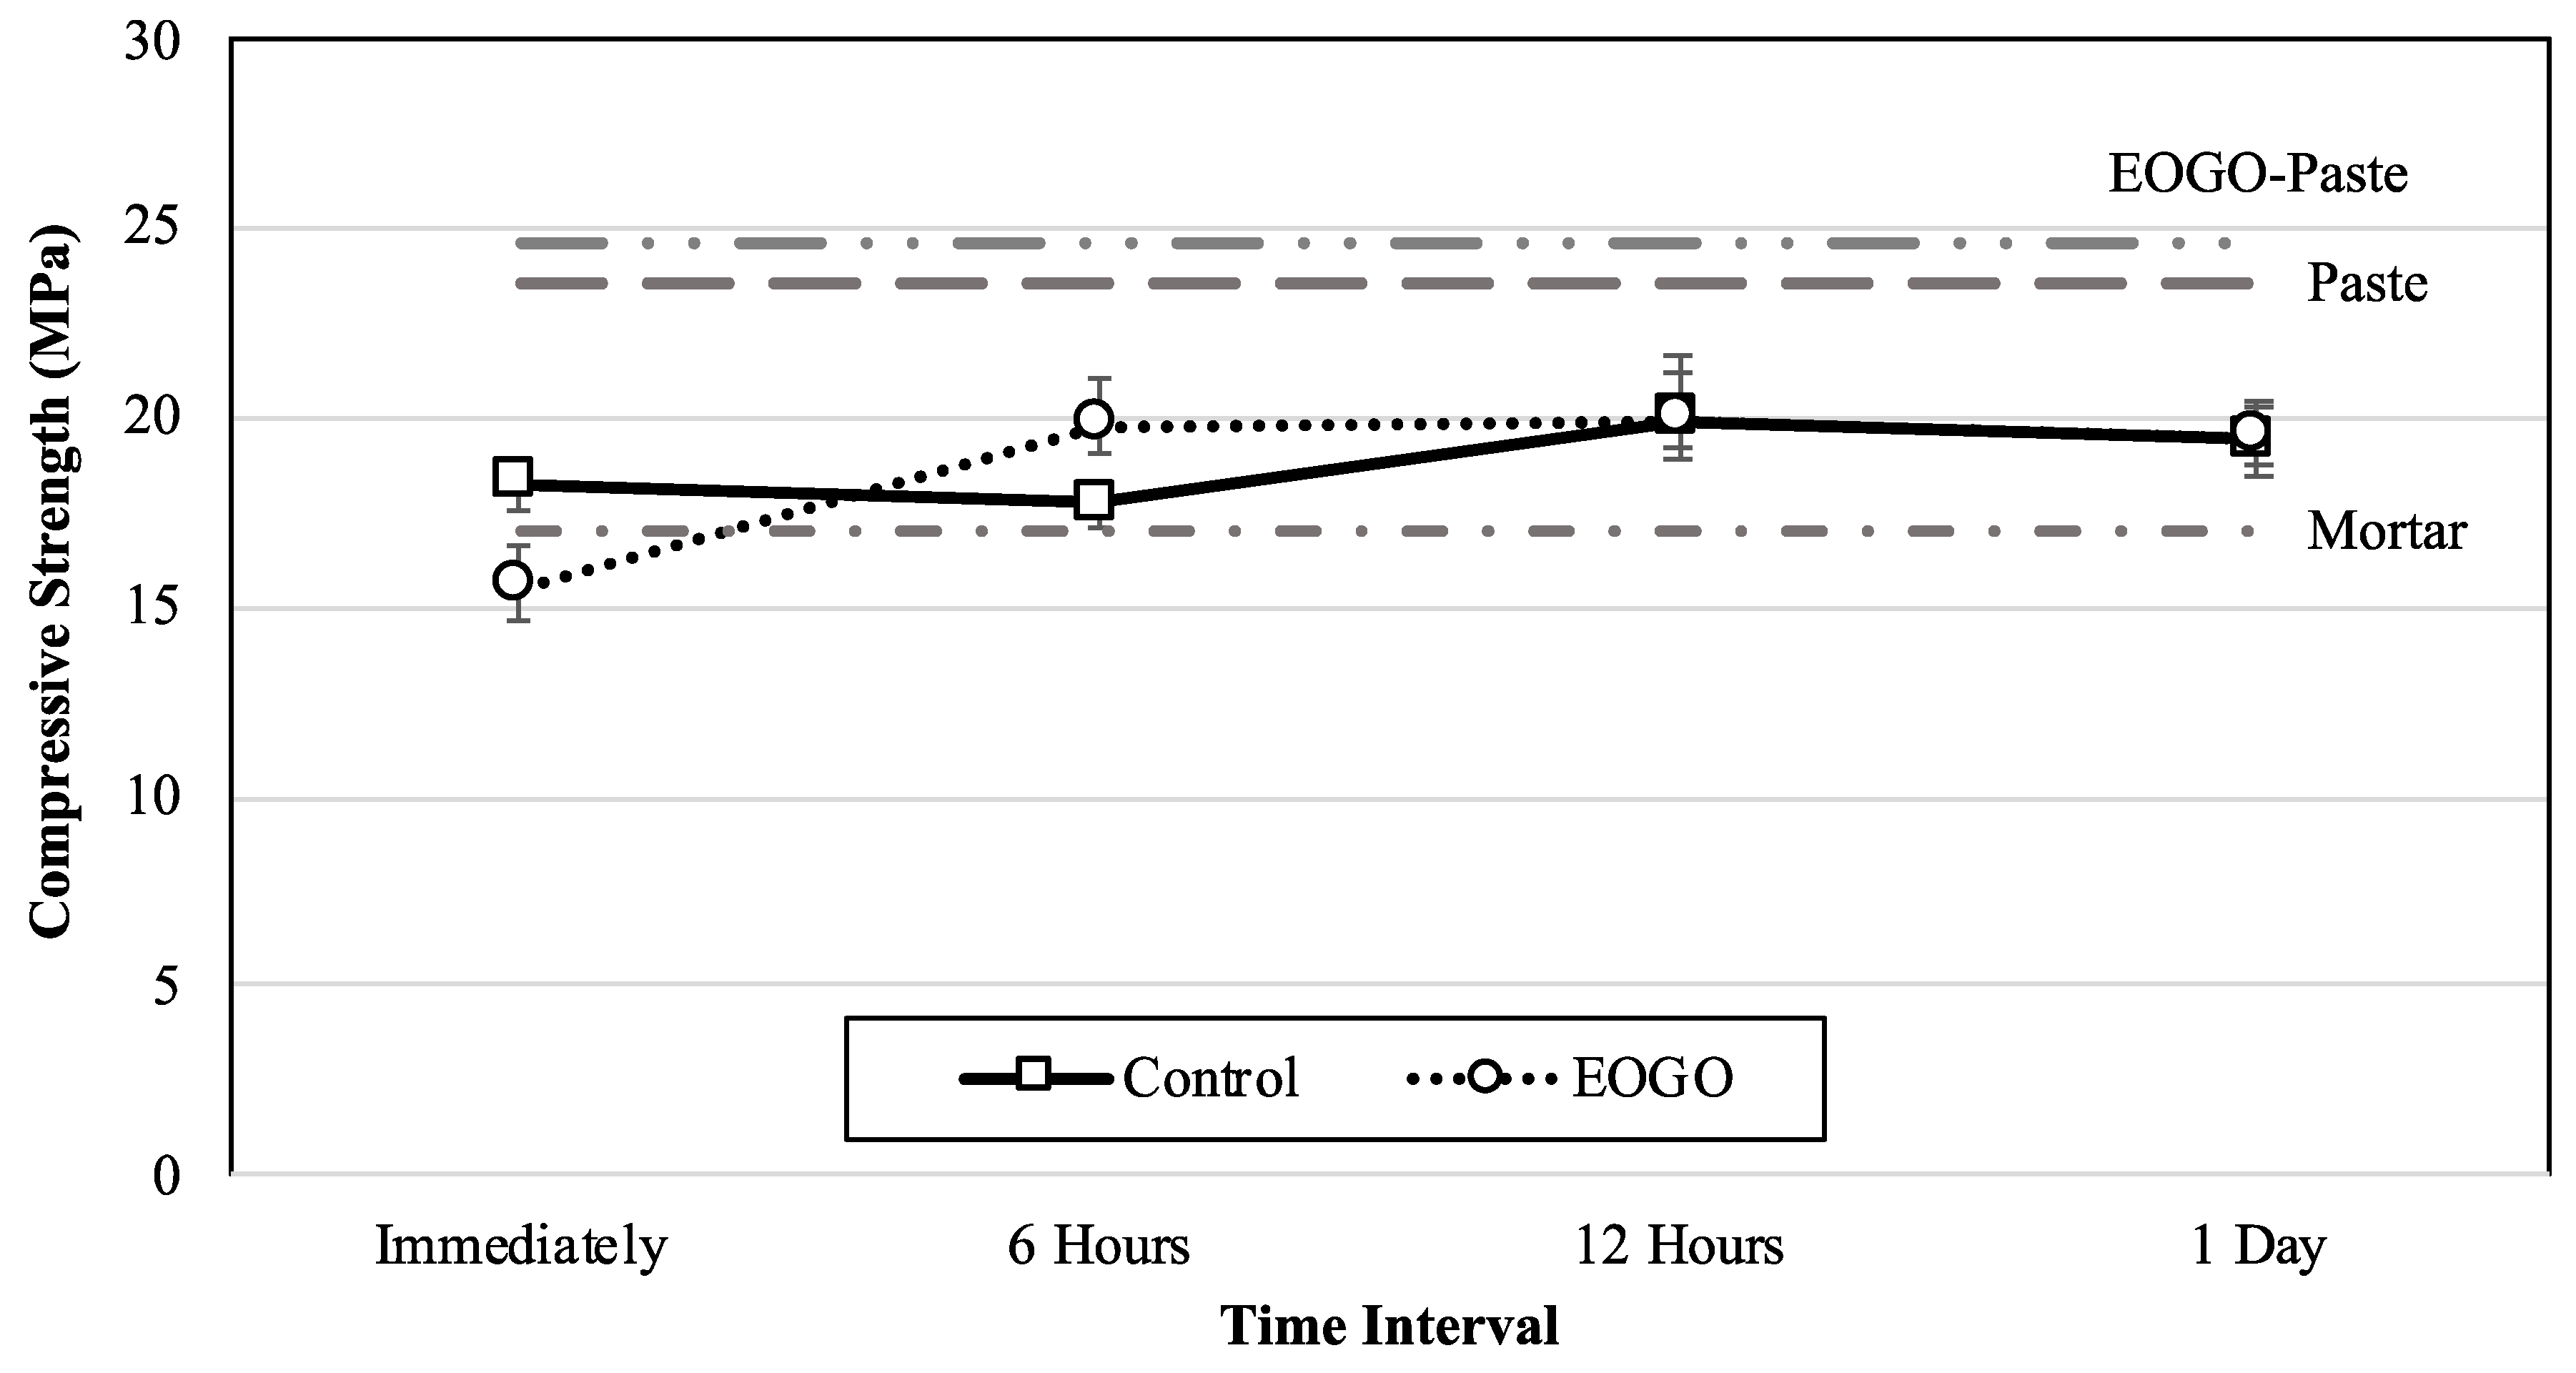
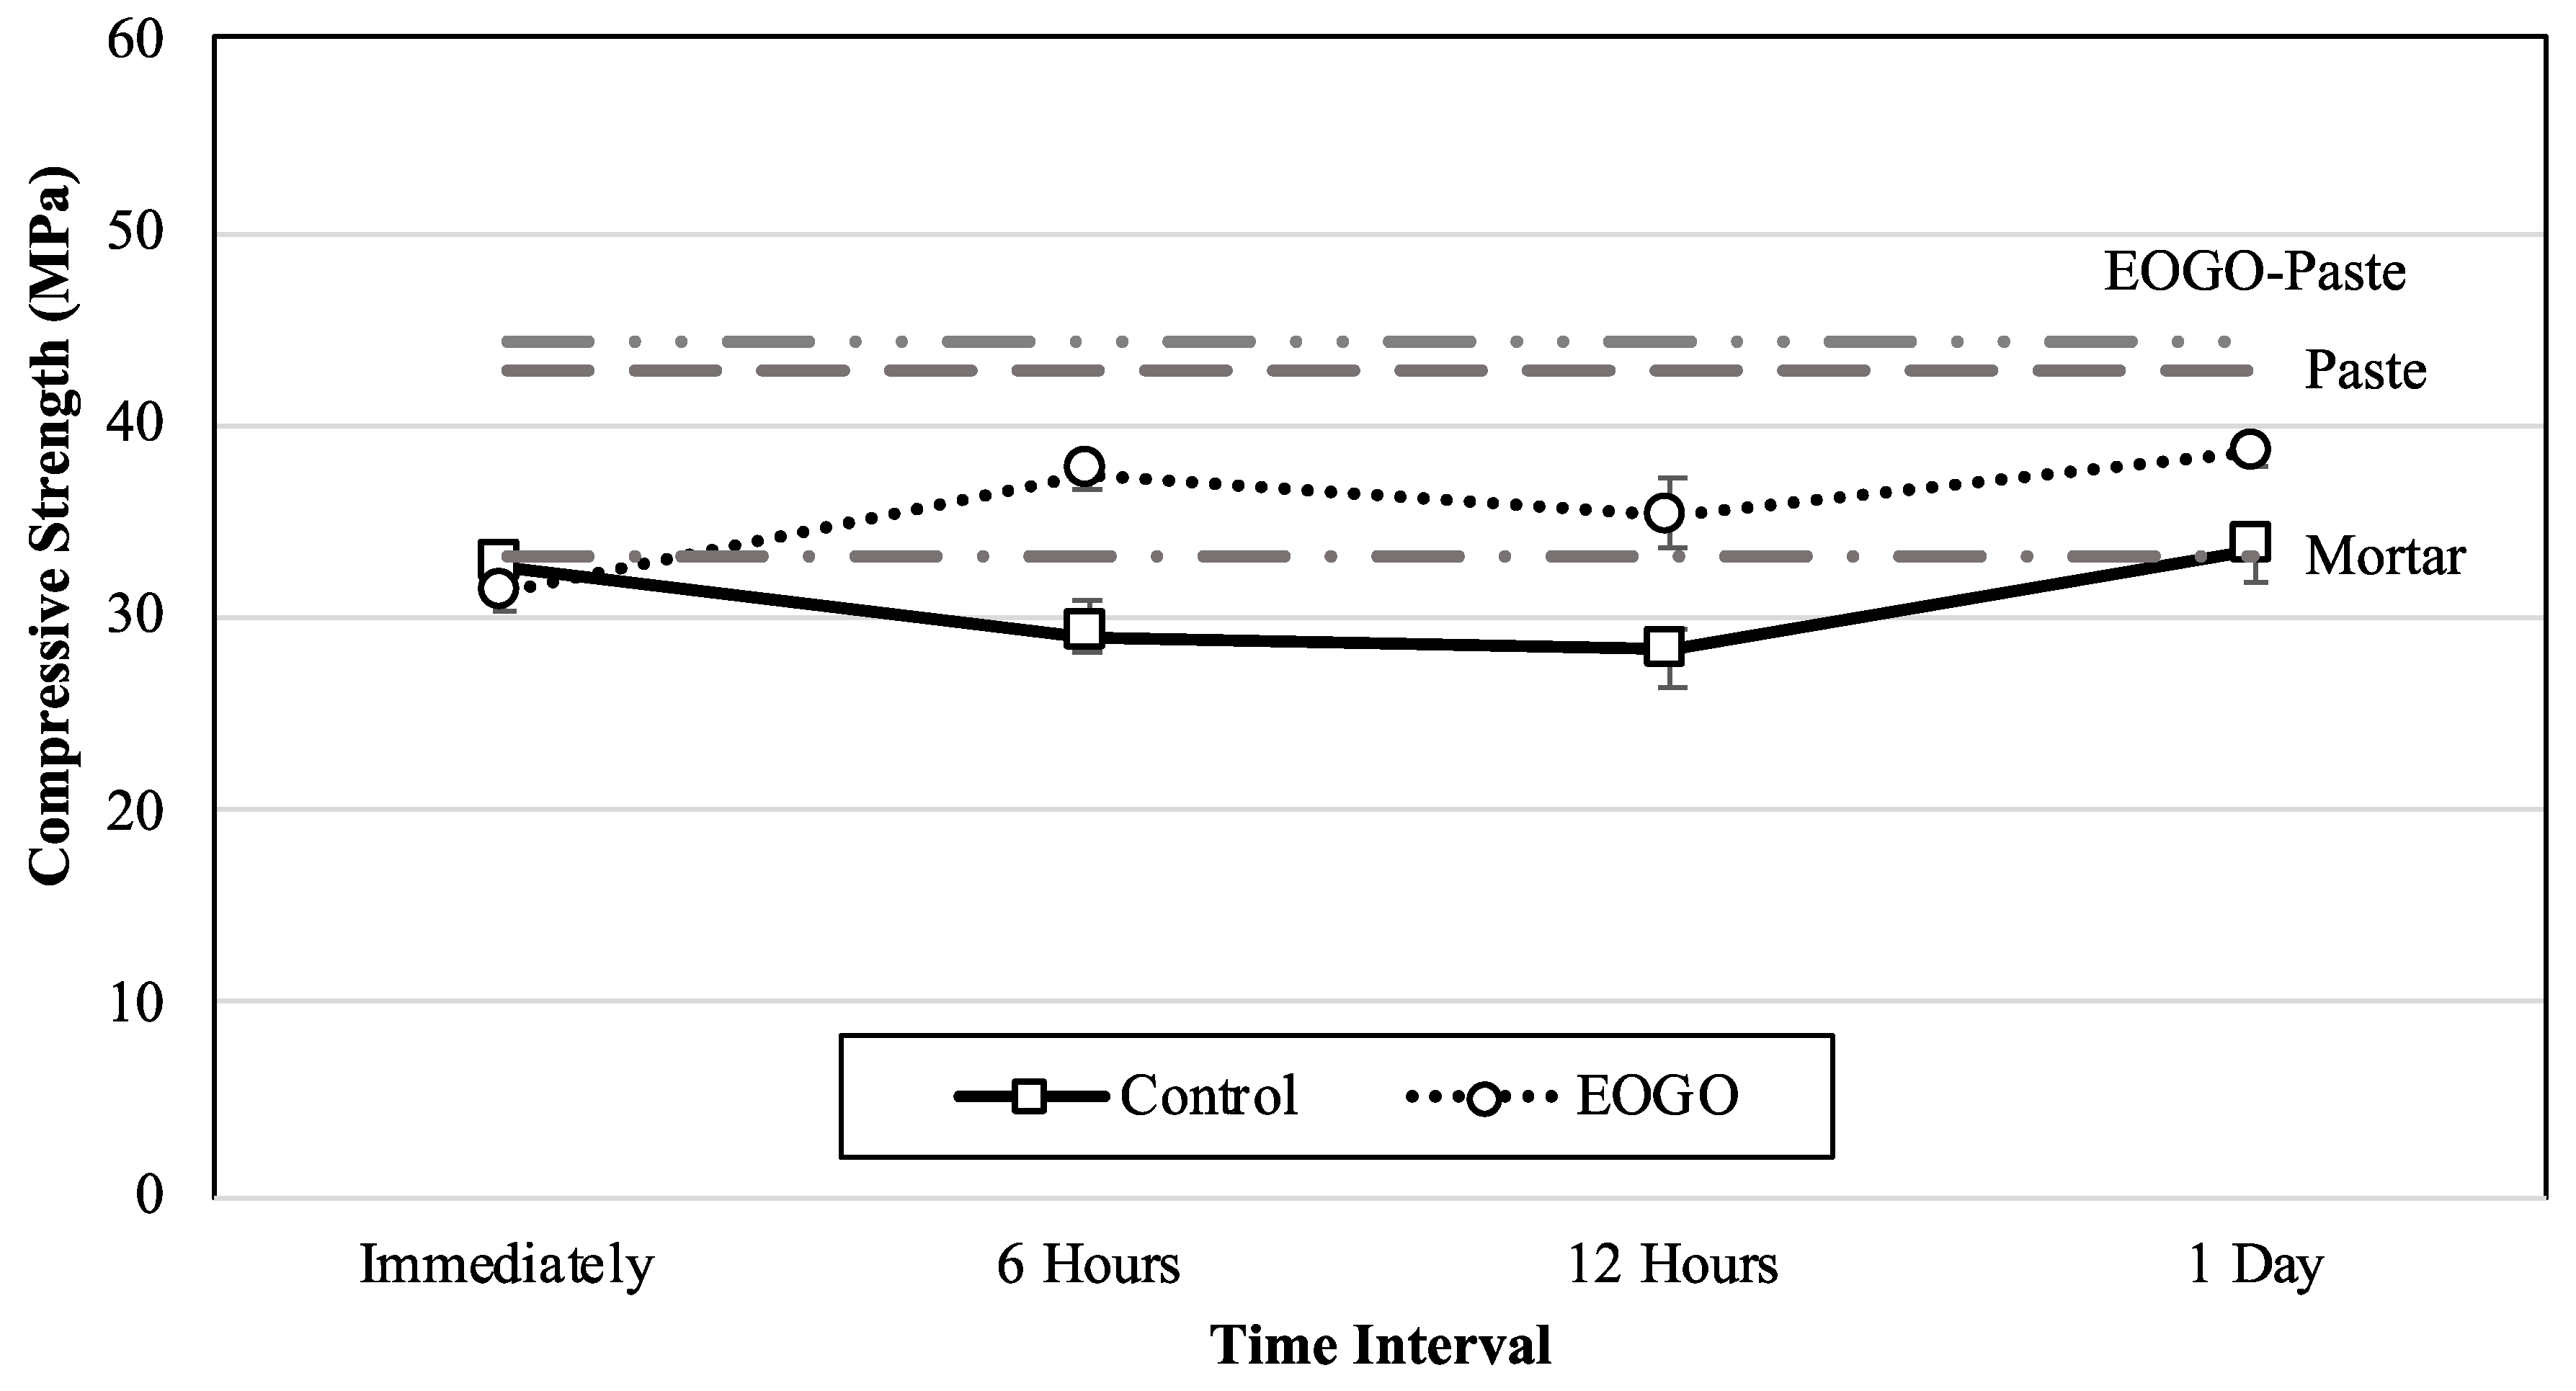
4.2.1. Compressive Strength

The results of the compression tests for all mixtures are shown in Figure 5 and Figure 6. For control mixtures, an interval time of 6 h seemed to be the worst case among other interval times for the 7-day compressive strength of control samples, with the lowest strength of 17.73 MPa, while the interval time of 12 h was the worst case for 28-day compressive strength, with 28.24 MPa. In contrast, the 12 h interval time provided the best performance when adding EOGO for the 7-day compressive strength, which was 19.93 MPa. However, for the 28-day compressive strength of the specimens, EOGO had the highest strength with the 1-day interval time compared to other interval times.
By comparing the performance of samples with EOGO with those without EOGO, regarding the 7-day compressive strength, it was found that EOGO enhanced the contact surfaces of cement paste and cement mortar composites at an interval time of 6 h with a percentage of 12%. On the other hand, EOGO seemed to not improve the joint of cement paste and cement mortar composites when they were cast immediately. This could be because of the delay in the setting time that occurred when EOGO was added to the cement paste. Regarding the 28-day compressive strength, a similar manner was observed for immediately casting the two layers with lower variance than the 7-day curing period. For other interval times, adding EOGO improved the surface contact of the two layers for all the selected interval times, with percentages of 29%, 25%, and 15% for 6 h, 12 h, and 1 day, respectively.
The mechanism of different cases can be illustrated as follows:
When the two layers were cast immediately, the control sample behaved as a monolithic sample since both layers were hydrated at the same time at a similar rate except that the first layer had sand in the mixture. In the case in which EOGO was added, the hydration process was different, which led to the setting and hardening of the control layer before the layer containing EOGO. As a result, the microsized space between layers will increase for the samples to have EOGO. This space between layers is increased with time due to the hydrated cement products. This is noticed when comparing the compressive strength results either for the 7-day or 28-day curing period for the immediate mixtures.
For the time interval of 6 h, the first layer reached the initial time and the rate of hydration increased to the second peak [41]. At that time, the second layer started the hydration process at the first peak, which was rapidly followed by a decrease in the rate of hydration [41]. These two opposite rates of hydration caused weak joints between the two layers, especially in the short term. Incorporating EOGO in this case allows more C3S to react since EOGO delays the reaction of C3A, as discussed in the previous section. Since C3S is responsible for the improvement of strength, the EOGO mixture with the 6 h interval time exhibited enhancement in strength compared with the control mixture.
After the final setting of the first layer (12 h interval time), the first layer’s strength properties were improved when the second layer started the hydration process. At the same time, both layers had a decreasing rate of hydration, and the samples showed stronger strength than the 6 h interval time specimens in the short term. However, considering the long-term strength, the opposite phenomenon was noticed. The presence of EOGO improved the resistance of the layered cement composites for both 6 h and 12 h in the long term in a similar manner. This can be attributed to the state when the hydration of the second layer occurred while the improvement in the first layer’s strength was at its early stage. At the same time, the second layer could not disturb the processes that occurred in the first layer as in the immediately cast sample.
In the last case, when the first layer was hardened, the hydration process of the second layer was different from that of the first layer by 24 h. The benefit of this case over the immediately cast sample is that each layer was hydrated separately until reaching the hardening level without interconnections between each other. As a result, the case of 1 day showed higher strength compared with the immediately cast sample. Also, when EOGO was added, the second layer had a higher likelihood of forming denser hydrated products with flower-like shapes [18,19,20,21,22] at areas in contact with the first layer compared to other cases. This effect of EOGO helped improve the compressive strength of the layered cement composites.

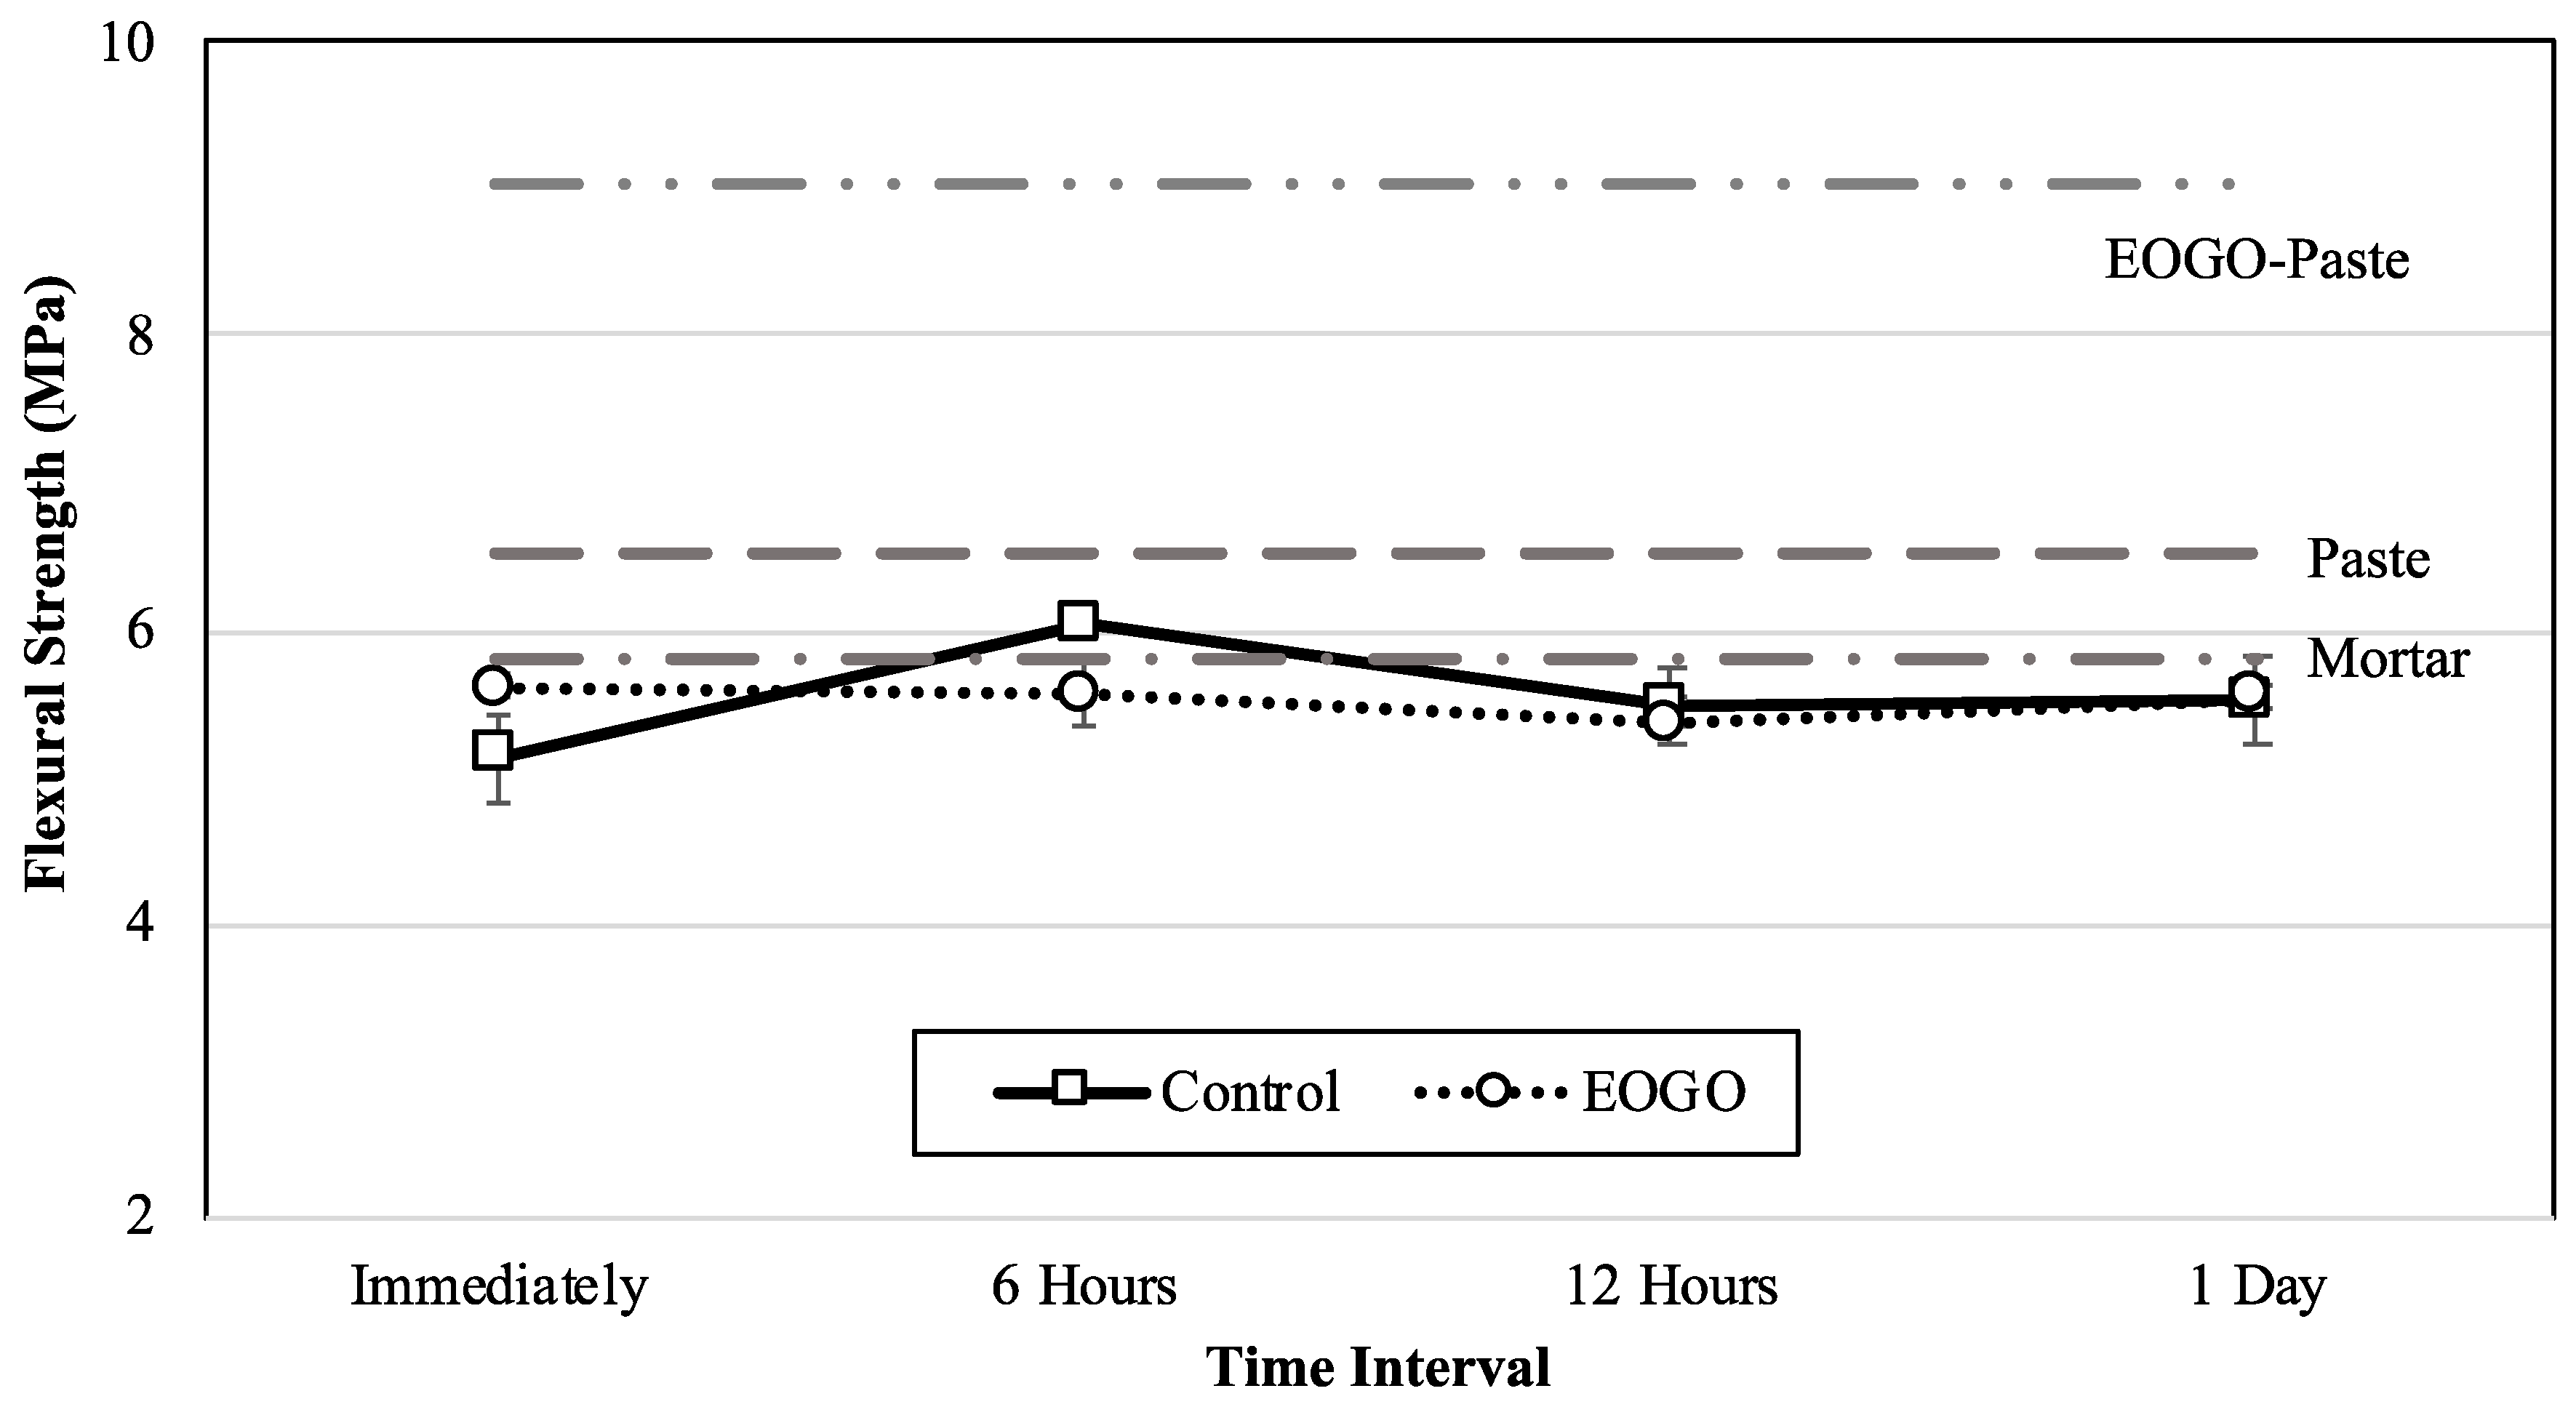
4.2.2. Flexural Strength

Flexural test results for all mixes are shown in Figure 7 and Figure 8. The best-observed performance of a mixture containing EOGO against flexural load was the immediately cast mixture for the 28-day curing age. In contrast, the 28-day curing age for the mixture with the 6 h interval time showed the worst behavior against the flexural load among all other mixtures. For mixtures of 12 h and 1 day, the behavior of samples with EOGO showed almost similar behavior to samples without EOGO. For single-layer samples, the beneficial effect of adding EOGO on the flexural strength of cement paste for both curing ages was clearly observed.
The reason for the lack of improvement in the flexural strength when EOGO was added could be the low tensile strength of cement mortar compared to the tensile strength of the cement paste. In the case of two-layer cement composites, cement mortar’s strength controls the failure of the specimens. Accordingly, it can be observed from Figure 7 and Figure 8 that the flexural strength of cement mortar surpasses the flexural strength of the composites, with a value close to the average strength of two-layered composites.

4.2.3. Statistical Analysis

Laboratory-based experiment results were analyzed to compare the mechanical properties of the mixtures, including compressive and flexural strengths, with and without EOGO. The analysis involved comparing reference mixes (without EOGO) to the mixtures with EOGO at different times before casting the second layer over the first layer. A t-test was employed to determine if the group of mixes containing EOGO significantly differed from the reference mixes without EOGO. A 95% confidence interval was chosen to assess data variability and the accuracy of estimated statistics. The comparison focused on laboratory test results from the reference mix groups that did not contain EOGO (Control—immediately, Control—6 h, Control—12 h, and Control—1 day), labeled in tables with “Group #1”, and mixes that contained EOGO (immediately, 6 h, 12 h, and 1 day), labeled in the tables with “Group #2”.
Table 2, Table 3, Table 4 and Table 5 present statistical information on the mixes without EOGO and their comparison with the mixes containing EOGO at different time intervals before casting the second layer over the first layer. The p-values indicate the significance of the improvement in the mixes containing EOGO compared to the reference mixes without EOGO. With a selected 95% confidence level for evaluating the test accuracy, p-values less than 0.05 indicate significant improvements in EOGO mixes’ performance compared to the reference mixes.
Examining the p-values in Table 3 reveals that mixes containing EOGO exhibit significant increases in compressive strength for both 7-day and 28-day curing ages compared to the reference mixes. These results are consistent with the findings of the current study, suggesting that, among all the time intervals between the casting layers, casting the first layer and then allowing for a 6 h interval before casting the second layer yields the best mixture performance when compared to the reference mixes. However, it is noteworthy that the examination of the p-values in Table 3 also reveals notable decreases in flexural strength for both 7-day and 28-day curing ages in mixes containing EOGO compared to the reference mixes. This observation is also consistent with the conclusions drawn from the flexural strength test results discussed in the current study.
The p-values displayed in Table 2, Table 3, Table 4 and Table 5 corroborate the laboratory test findings, particularly concerning compressive strength. An intriguing observation arises regarding the timing of casting the second layer in the mix. For mixes where the second layer was cast immediately after the first layer, a significant decrease in compressive strength was observed after 7 days of curing time. Conversely, for mixes where the second layer was cast 12 and 24 h after the first layer, a significant increase in compressive strength was noted after 28 days of curing time. This observation coincides with the findings of compressive strength tests discussed earlier.
In addition, an interesting finding emerges concerning the timing of casting the second layer in the mix concerning flexural strength based on the p-value results. When the second layer was cast six hours after the first layer, a significant decrease in flexural strength was observed after both 7 and 28 days of curing. However, mixes in which the second layer was cast 12 h after the first layer did not show a significant deficiency in flexural strength after the same curing periods.
Statistically, it was concluded that the mixes with a 6 h interval time between casting the two layers exhibited the best behavior in resisting compression loadings compared to the reference mixes without EOGO, with a confidence level of 95%.

4.3. Microstructure Analysis

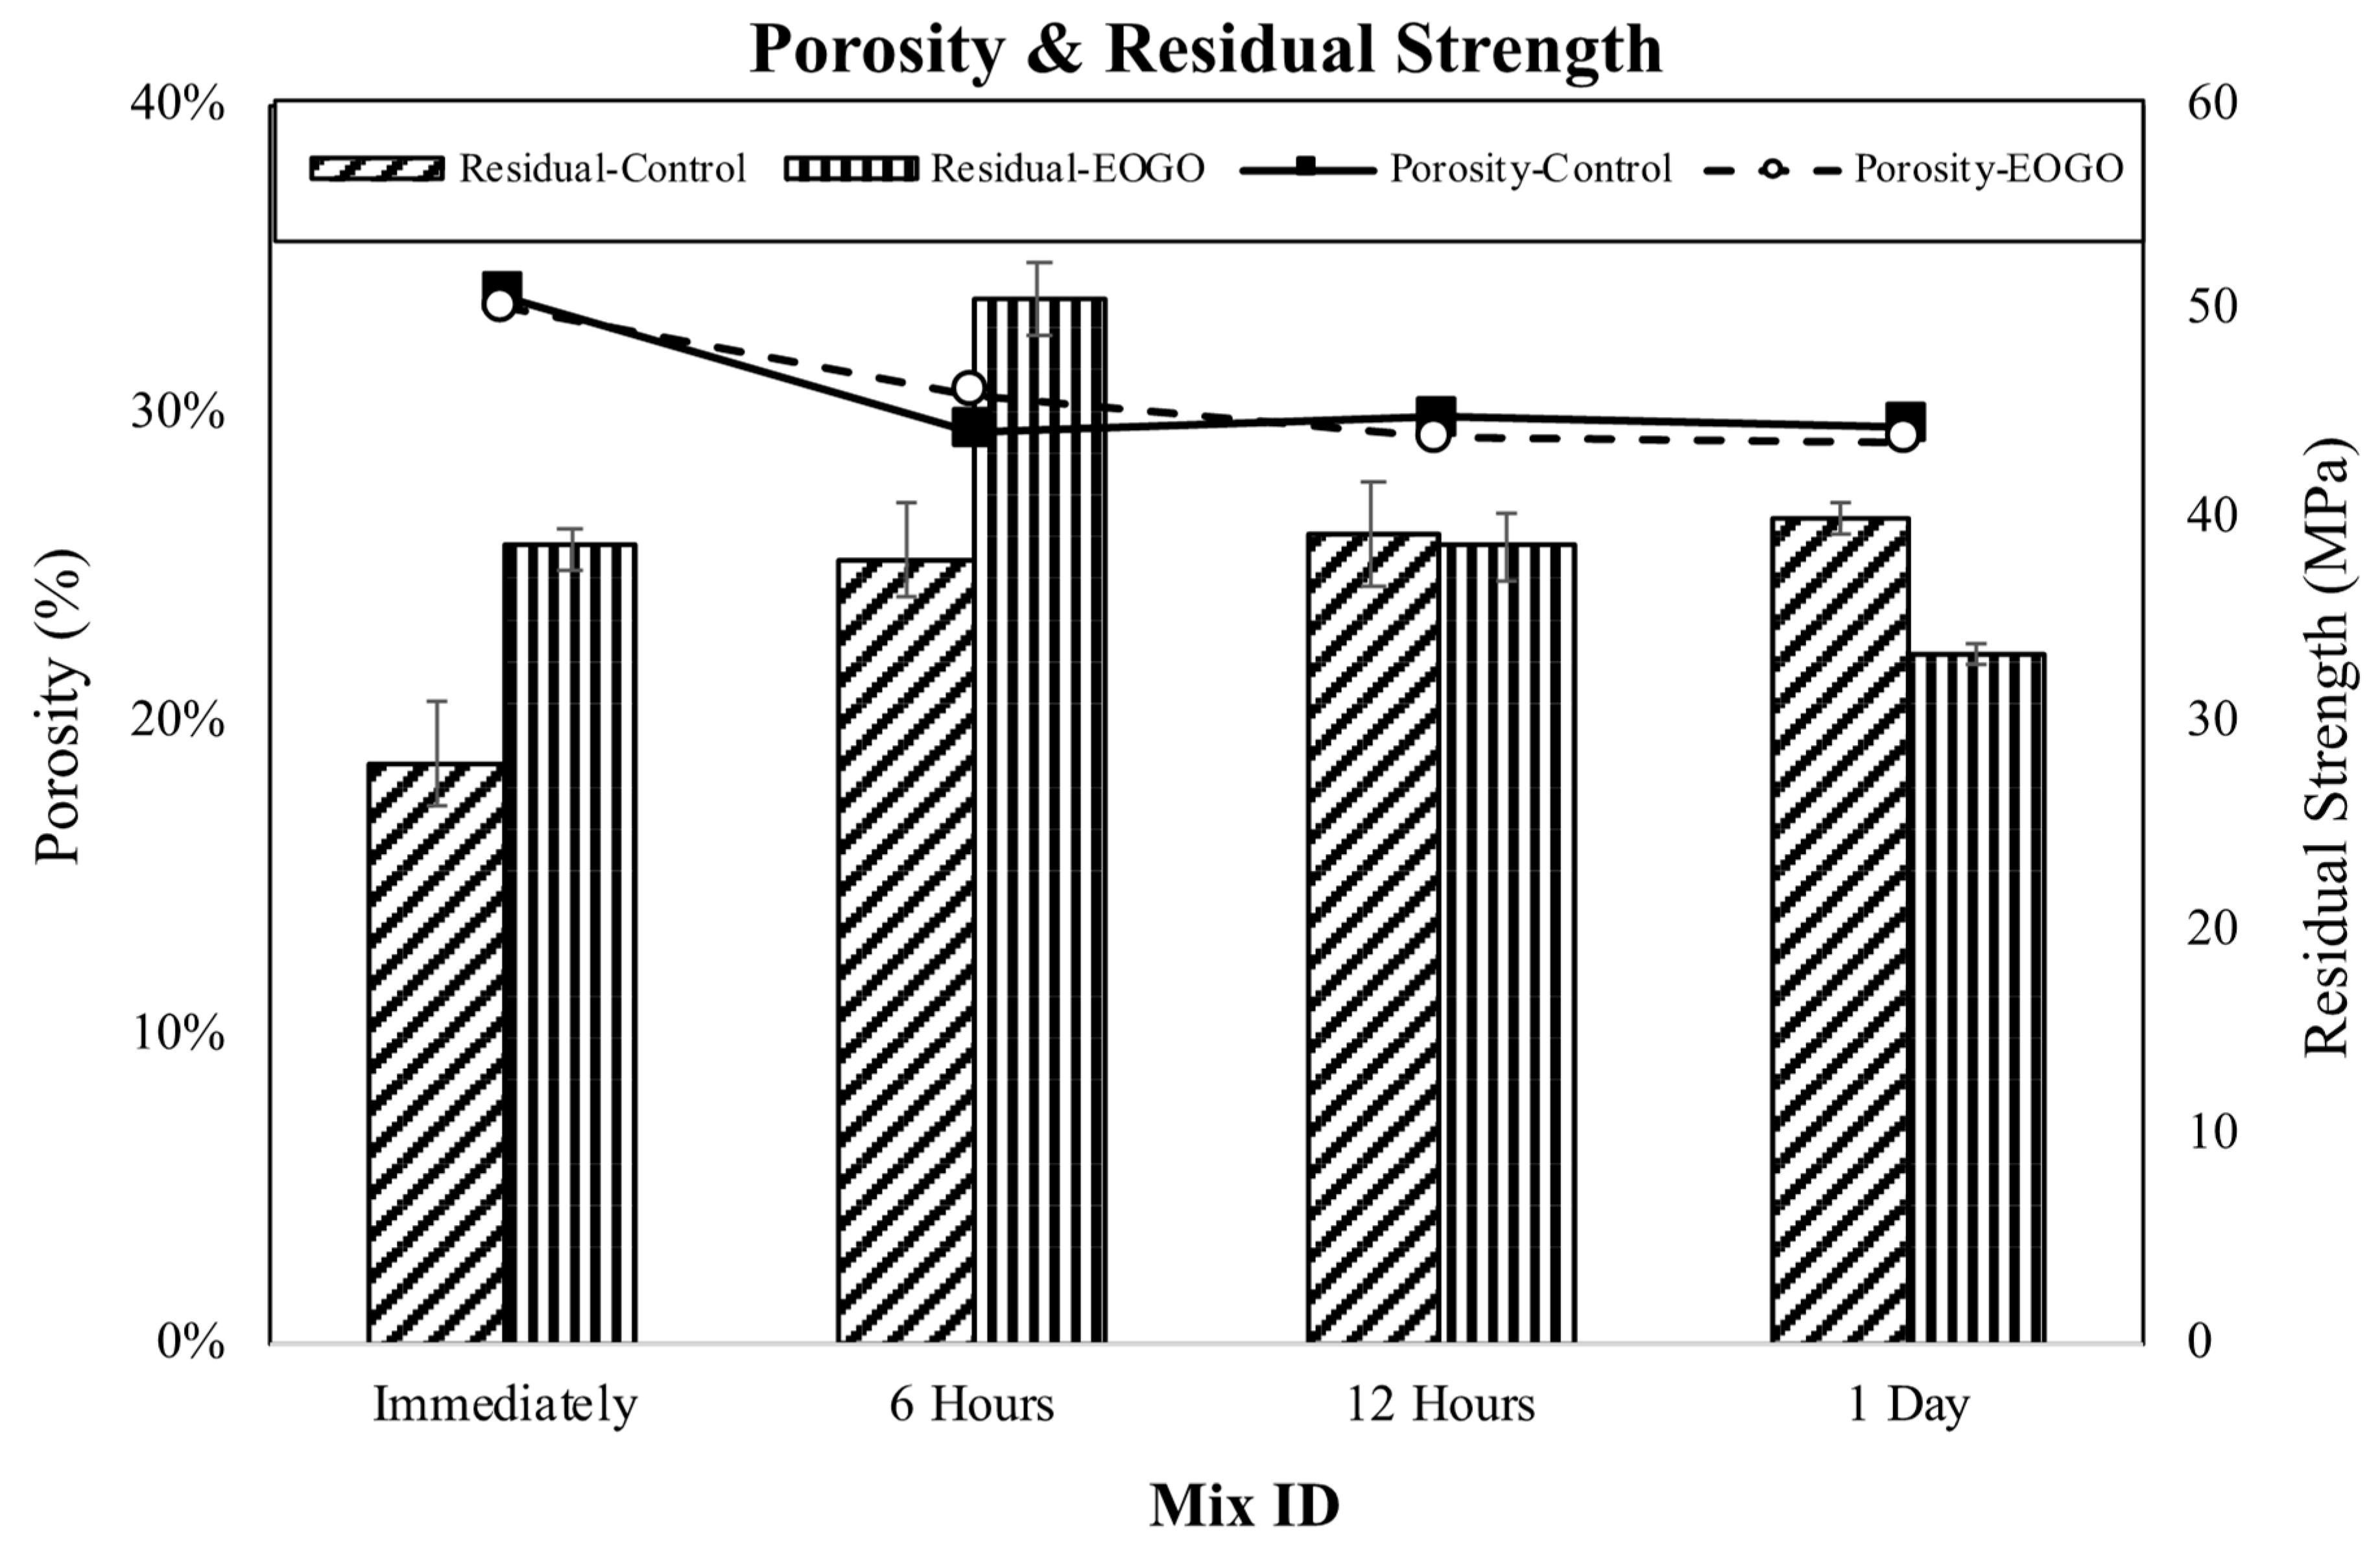
4.3.1. Porosity and Residual Strength

A porosity test was employed to investigate the effect of EOGO on the microstructure characteristics of cement composites. After measuring all the readings needed for porosity, the cube samples were tested with a similar configuration of compression test to evaluate the residual compressive strength. The results of the porosity test as well as the 28-day residual compressive strength are shown in Figure 9. The porosity of the composites containing EOGO was close to those without EOGO for different cases of time intervals. This could be attributed to the small size of the specimens that were divided into two layers, and only one layer had EOGO. So, comparing the weight differences would not reveal the exact effect of adding EOGO on the porosity of the cement composite.
The 28-day residual compressive strength results show that casting the two layers of cement composites after the initial setting of the first layer helped in increasing the compressive strength of the control samples. This could be attributed to the lower pores in those samples compared with the immediately cast sample, as revealed by the porosity test. Nevertheless, the presence of EOGO increased the resistance, i.e., the residual compressive strength, of the immediately cast sample and the samples with the 6 h interval time, but not for those cast with the 12 h and 1 day interval time between casting the two layers. The reason might be that EOGO facilitates the reaction of more C3S in cases of immediate and 6 h interval times, which led to the production of more C-S-H in the second layer and between layers when the first layer had not yet reached the final setting time. This situation allows the molecules of the second layer to form and interlock with the first layer. As a result, high temperature is not capable of breaking down the structure of C-S-H and CH plates.

4.3.2. Scanning Electron Microscopy (SEM)

For samples tested at the 28-day curing age, pieces of fractured samples for cement paste, cement mortar, and EOGO–cement paste materials were collected for SEM investigation. Figure 10 shows the SEM images of the different cement composites. For the cement paste material (Figure 10a), microsized voids at different spots can be seen amid the major cement hydration product, which is calcium silicate hydrate (C-S-H) gel. Moreover, the formation of ettringite is observed. Regarding the cement mortar material (Figure 10b), the formation of C-S-H as well as calcium hydroxide (CH) plates can be observed. However, there are microsized cracks in between cement hydration products. These cracks lead to a decrease in the strength of cement mortar compared to cement paste.
Figure 10c displays how EOGO affects the cement matrix by making the products of C-S-H gel and CH plates denser. Also, there are numerous spots where EOGO works as a site for promoting the hydration process. Nevertheless, the formation of ettringite occurs to a lesser extent in EOGO–cement paste than in cement paste due to the denser formation of C-S-H gel and CH plates in the presence of EOGO. By comparing plain cement paste with EOGO–cement paste, it can be inferred that EOGO helps strengthen the cement matrix and makes more cement hydration products that penetrate through the grooves of the cement mortar matrix. As a result, the contact surface of different cement composites becomes stronger when EOGO is incorporated. The results obtained from SEM images coincide with previous studies [18,19,20,24]. SEM observations support the findings of mechanical strength for the 28-day curing age obtained in the current study.

5. Conclusions

The current research investigated the effect of adding EOGO on the interval time between two different cement composite materials. An EOGO quantity of 0.10% by the cement weight was used in the cement paste layer, which was cast on the cement mortar layer at four different intervals times. The interval times chosen in the current study were based on the setting time of cement, namely immediately (before the initial setting time), 6 h (after the initial setting time and before the final setting time), 12 h (after the final setting time), and 1 day (after cement hardening). The major findings of this study can be concluded as follows:
-
A 0.10% concentration of EOGO delayed the setting time of cement by 15 min.
-
The effect of EOGO seemed to be more on splitting strength than on flexural strength;
-
The benefit of incorporating EOGO on the contact surfaces of the two different cement composites increased with the increase in the curing time.
-
EOGO did not show significant improvement in flexural strength because both cement composites were simultaneously exposed to tensile strength at the bottom fiber, so the weakest material (cement mortar in the current study) governed the strength behavior.
-
Considering the 28-day residual compressive strength, the samples with EOGO exhibited better behavior under the condition in which the first layer did not reach its final set.
-
The time interval of 6 h (or after the final setting and before hardening) resulted in the best performance in the compressive strength, porosity, and residual strength compared to other interval times of casting two different cement composites.
-
Utilizing cement composite containing EOGO at regions exposed to tensile stresses would be beneficial to resisting high loads.
The results of this study can be used as a reference for further research in the concrete construction field. More research is needed to investigate the bond efficiency of layered cement composites when EOGO is incorporated, especially for concrete material. EOGO seems to be a competitive nanomaterial that might be used at construction joints for concrete construction buildings. However, other types of testing covering different aspects, such as twisting, direct shear, repeated loads, and durability, must be performed to fully understand the effect of adding EOGO into cement composites. Also, more studies are needed to study the effect of EOGO on the hydration of cement components C3S, C2S, C3A, and C4AF in more detail.

Author Contributions

M.K. and M.A.: conceptualization, visualization, methodology, material preparation, supervision, writing—original draft preparation, investigation, and writing—reviewing and editing. All authors have read and agreed to the published version of the manuscript.

Funding

This research was funded by King Saud University, Researchers Supporting Project number (RSPD2024R528).

Data Availability Statement

Some or all data, models, or codes that support the findings of this study are available from the corresponding author upon reasonable request.

Acknowledgments

The authors extend their appreciation to Researchers Supporting Project number (RSPD2024R528), King Saud University, Riyadh, Saudi Arabia.

Conflicts of Interest

The authors declare that they have no known competing financial interests or personal relationships that could have appeared to influence the work reported in this paper.

References

  1. Görtz, J.; Zafar, A.; Wieprecht, S.; Terheiden, K. Aperture and permeability of aged concrete joints. Constr. Build. Mater. 2021, 307, 124783. [Google Scholar] [CrossRef]
  2. ACI Committee. 224 Joints in Concrete Construction; American Concrete Institute: Columbia, MD, USA, 2001. [Google Scholar]
  3. Kadhum, S.; Al-Zaidee, S. A review of previous studies on the construction joints in reinforced concrete beams. Des. Eng. 2021, 8, 16464–16472. [Google Scholar]
  4. Al-Rifaie, A.; Al-Hassani, H.; Shubbar, A.A. Flexural behaviour of reinforced concrete beams with horizontal construction joints. IOP Conf. Series: Mater. Sci. Eng. 2021, 1090, 012003. [Google Scholar] [CrossRef]
  5. Issa, C.A.; Gerges, N.N.; Fawaz, S. The effect of concrete vertical construction joints on the modulus of rupture. Case Stud. Constr. Mater. 2014, 1, 25–32. [Google Scholar] [CrossRef]
  6. Jiang, H.; Shao, T.; Fang, Z.; Xiao, J.; Hu, Z. Shear-friction behavior of grooved construction joints between a precast UHPC girder and a cast-in-place concrete slab. Eng. Struct. 2020, 228, 111610. [Google Scholar] [CrossRef]
  7. Tullini, N.; Minghini, F. Grouted sleeve connections used in precast reinforced concrete construction—Experimental investigation of a column-to-column joint. Eng. Struct. 2016, 127, 784–803. [Google Scholar] [CrossRef]
  8. Wang, X.; Sadati, S.; Taylor, P.; Li, C.; Wang, X.; Sha, A. Material characterization to assess effectiveness of surface treatment to prevent joint deterioration from oxychloride formation mechanism. Cem. Concr. Compos. 2019, 104, 103394. [Google Scholar] [CrossRef]
  9. Gerges, N.N.; Issa, C.A.; Fawaz, S. The effect of construction joints on the flexural bending capacity of singly reinforced beams. Case Stud. Constr. Mater. 2016, 5, 112–123. [Google Scholar] [CrossRef]
  10. Gerges, N.N.; Issa, C.A.; Fawaz, S. Effect of construction joints on the splitting tensile strength of concrete. Case Stud. Constr. Mater. 2015, 3, 83–91. [Google Scholar] [CrossRef]
  11. Lin, C.; Wei, W.; Hu, Y.H. Catalytic behavior of graphene oxide for cement hydration process. J. Phys. Chem. Solids 2016, 89, 128–133. [Google Scholar] [CrossRef]
  12. Warner, J.; Schäffel, F.; Bachmatiuk, A.; Rümmeli, M. Graphene Fundamentals and Emergent Applications; Elsevier: Gainesville, FL, USA, 2013. [Google Scholar]
  13. Khawaji, M.; Cho, B.H.; Nam, B.H.; Alharbi, R.; An, J. Edge-oxidized graphene oxide as additive in fiber-reinforced concrete: Effects on fresh and hardened properties. J. Mater. Civ. Eng. 2020, 32, 04020028. [Google Scholar] [CrossRef]
  14. An, J.; Nam, B.H.; Alharbi, Y.; Cho, B.H.; Khawaji, M. Edge-oxidized graphene oxide (EOGO) in cement composites: Cement hydration and microstructure. Compos. B Eng. 2019, 173, 106795. [Google Scholar] [CrossRef]
  15. Gong, K.; Pan, Z.; Korayem, A.H.; Qiu, L.; Li, D.; Collins, F.; Wang, C.M.; Duan, W.H. Reinforcing effects of graphene oxide on portland cement paste. J. Mater. Civ. Eng. 2015, 27, 0001125. [Google Scholar] [CrossRef]
  16. Zhao, L.; Guo, X.; Liu, Y.; Ge, C.; Guo, L.; Shu, X.; Liu, J. Synergistic effects of silica nanoparticles/polycarboxylate superplasticizer modified graphene oxide on mechanical behavior and hydration process of cement composites. RSC Adv. 2017, 7, 16688–16702. [Google Scholar] [CrossRef]
  17. Li, X.; Lu, Z.; Chuah, S.; Li, W.; Liu, Y.; Duan, W.H.; Li, Z. Effects of graphene oxide aggregates on hydration degree, sorptivity, and tensile splitting strength of cement paste. Compos. Part A Appl. Sci. Manuf. 2017, 100, 1–8. [Google Scholar] [CrossRef]
  18. Wang, Q.; Wang, J.; Lu, C.X.; Liu, B.W.; Zhang, K.; Li, C.Z. Influence of graphene oxide additions on the microstructure and mechanical strength of cement. New Carbon Mater. 2015, 30, 349–356. [Google Scholar] [CrossRef]
  19. Lv, S.; Ma, Y.; Qiu, C.; Sun, T.; Liu, J.; Zhou, Q. Effect of graphene oxide nanosheets of microstructure and mechanical properties of cement composites. Constr. Build. Mater. 2013, 49, 121–127. [Google Scholar] [CrossRef]
  20. Lv, S.; Liu, J.; Sun, T.; Ma, Y.; Zhou, Q. Effect of GO nanosheets on shapes of cement hydration crystals and their formation process. Constr. Build. Mater. 2014, 64, 231–239. [Google Scholar] [CrossRef]
  21. Yang, H.; Monasterio, M.; Cui, H.; Han, N. Experimental study of the effects of graphene oxide on microstructure and properties of cement paste composite. Compos. Part A Appl. Sci. Manuf. 2017, 102, 263–272. [Google Scholar] [CrossRef]
  22. Li, W.; Li, X.; Chen, S.J.; Liu, Y.M.; Duan, W.H.; Shah, S.P. Effects of graphene oxide on early-age hydration and electrical resistivity of Portland cement paste. Constr. Build. Mater. 2017, 136, 506–514. [Google Scholar] [CrossRef]
  23. Chuah, S.; Li, W.; Chen, S.J.; Sanjayan, J.G.; Duan, W.H. Investigation on dispersion of graphene oxide in cement composite using different surfactant treatments. Constr. Build. Mater. 2018, 161, 519–527. [Google Scholar] [CrossRef]
  24. Pan, Z.; He, L.; Qiu, L.; Korayem, A.H.; Li, G.; Zhu, J.W.; Collins, F.; Li, D.; Duan, W.H.; Wang, M.C. Mechanical properties and microstructure of a graphene oxide-cement composite. Cem. Concr. Compos. 2015, 58, 140–147. [Google Scholar] [CrossRef]
  25. Khawaji, M.; Alamri, M. Potential of enhancing the joint of adjacent cement composites by incorporating edge-oxidized graphene oxide. Case Stud. Constr. Mater. 2024, 21, e03540. [Google Scholar] [CrossRef]
  26. Liu, S.; Lu, F.; Chen, Y.; Dong, B.; Du, H.; Li, X. Efficient use of graphene oxide in layered cement mortar. Materials 2022, 15, 2181. [Google Scholar] [CrossRef] [PubMed]
  27. Li, X.; Li, C.; Liu, Y.; Chen, S.J.; Wang, C.M.; Sanjayan, J.G.; Duan, W.H. Improvement of mechanical properties by incorporating graphene oxide into cement mortar. Mech. Adv. Mater. Struct. 2016, 25, 1313–1322. [Google Scholar] [CrossRef]
  28. ASTM C 150/C150M; Standard Specification for Portland Cement. ASTM: West Conshohocken, PA, USA, 2017.
  29. Asbury Carbons. Available online: https://asbury.com (accessed on 26 April 2022).
  30. Garmor. Available online: http://www.garmortech.com/technology.htm (accessed on 26 April 2022).
  31. ASTM C305-14; Standard Practice for Mechanical Mixing of Hydraulic Cement Pastes and Mortars of Plastic Consistency. ASTM: West Conshohocken, PA, USA, 2020. [CrossRef]
  32. Li, X.; Wang, L.; Liu, Y.; Li, W.; Dong, B.; Duan, W.H. Dispersion of graphene oxide agglomerates in cement paste and its effects on electrical resistivity and flexural strength. Cem. Concr. Compos. 2018, 92, 145–154. [Google Scholar] [CrossRef]
  33. Alharbi, Y.; An, J.; Cho, B.H.; Khawaji, M.; Chung, W.; Nam, B.H. Mechanical and sorptivity characteristics of edge-oxidized graphene oxide (EOGO)-cement composites: Dry-and wet-mix design methods. Nanomaterials 2018, 8, 718. [Google Scholar] [CrossRef]
  34. Neville, A.M.; Brooks, J.J. Concrete Technology; Pearson Education Limited: London, UK, 2001. [Google Scholar]
  35. Kosmatka, S.H.; Panarese, W.C. Design and Control of Concrete Mixtures; Portland Cement Association: Portland, OR, USA, 1994. [Google Scholar]
  36. ASTM C 187-04; Standard Test Method for Normal Consistency of Hydraulic Cement. ASTM: West Conshohocken, PA, USA, 2023. Available online: https://www.astm.org/standards/c187 (accessed on 2 July 2023).
  37. ASTM C191.12214; Standard Test Methods for Time of Setting of Hydraulic Cement by Vicat Needle. ASTM: West Conshohocken, PA, USA, 2021.
  38. ASTM C109/C109M-16a; Standard Test Method for Compressive Strength of Hydraulic Cement Mortars (Using 2-in. or [50-mm] Cube Specimens). ASTM: West Conshohocken, PA, USA, 2020. [CrossRef]
  39. ASTM C348-14; Standard Test Method for Flexural Strength of Hydraulic-Cement Mortars. ASTM: West Conshohocken, PA, USA, 2018. [CrossRef]
  40. ASTM C830-00; Standard Test Methods for Apparent Porosity, Liquid Absorption, Apparent Specific Gravity, and Bulk Density of Refractory Shapes by Vacuum Pressure. ASTM: West Conshohocken, PA, USA, 2023. [CrossRef]
  41. Neville, A.M. Properties of Concrete, 4th ed.; Wiley: Hoboken, NJ, USA, 1996. [Google Scholar]
Figure 1. Scanning electron microscopy (SEM) image of the EOGO sample.
Buildings 14 02307 g001
Figure 2. Sample orientation for compression test (the dark area in the joint represents the grooving location).
Buildings 14 02307 g002
Figure 4. Effect of adding EOGO on cement setting time.
Buildings 14 02307 g004
Figure 5. The 7-day compressive strength.
Buildings 14 02307 g005
Figure 6. The 28-day compressive strength.
Buildings 14 02307 g006
Figure 7. The 7-day flexural strength.
Buildings 14 02307 g007
Figure 8. The 28-day flexural strength.
Buildings 14 02307 g008
Figure 9. Porosity and 28-day residual compressive strength of different mixtures.
Buildings 14 02307 g009
Figure 10. SEM images for different cement composites: (a) cement paste; (b) cement mortar; (c) EOGO–cement paste.
Buildings 14 02307 g010aBuildings 14 02307 g010b
Table 1. Proportions of different group mixtures.
Mix IDLayer No.Water, gCement, gSand, gEOGO, g
PasteOne Layer19674055--
MortarOne Layer90118074969-
EOGO-PasteOne Layer19674055-4.05
All Control Samples14519032484-
29832028--
All EOGO Samples14519032484-
29832028-2.02
Table 2. Statistical analysis for Control—immediately mix group versus the immediately mix group.
Group #1 (Control—Immediately)Group #2 (Immediately)p-ValueSignificance
Value
(Mean)
Standard DeviationVarianceValue
(Mean)
Standard DeviationVariance
Compressive (7 days)18.290.710.5115.491.041.090.0092Yes
Compressive (28 days)32.591.251.5631.311.442.060.1543No
Flexural
(7 days)
3.000.450.202.790.140.020.2406No
Flexural
(28 days)
5.130.300.095.600.080.010.0292Yes
Table 3. Statistical analysis for Control—6 h mix group versus the 6 h mix group.
Group #1 (Control—6 h)Group #2 (6 h)p-ValueSignificance
Value
(Mean)
Standard DeviationVarianceValue
(Mean)
Standard DeviationVariance
Compressive (7 days)17.730.660.4419.801.051.090.0223Yes
Compressive (28 days)29.001.592.5437.390.670.440.0005Yes
Flexural
(7 days)
3.780.160.033.540.080.010.0416Yes
Flexural
(28 days)
6.040.080.015.560.230.050.0127Yes
Table 4. Statistical analysis for Control—12 h mix group versus the 12 h mix group.
Group #1 (Control—12 h)Group #2 (12 h)p-ValueSignificance
Value
(Mean)
Standard DeviationVarianceValue
(Mean)
Standard DeviationVariance
Compressive (7 days)19.991.452.0919.931.101.210.4809No
Compressive (28 days)28.241.532.3335.211.793.220.0034Yes
Flexural
(7 days)
3.660.320.103.590.260.070.3984No
Flexural
(28 days)
5.480.230.055.360.180.030.2690No
Table 5. Statistical analysis for Control—1-day mix group versus the 1-day mix group.
Group #1 (Control—1 Day)Group #2 (1 Day)p-ValueSignificance
Value
(Mean)
Standard DeviationVarianceValue
(Mean)
Standard DeviationVariance
Compressive (7 days)20.972.898.3519.510.890.800.2241No
Compressive (28 days)35.851.652.7326.130.240.060.0003Yes
Flexural
(7 days)
3.400.300.093.380.210.050.4766No
Flexural
(28 days)
5.520.300.095.540.080.010.4661No
Disclaimer/Publisher’s Note: The statements, opinions and data contained in all publications are solely those of the individual author(s) and contributor(s) and not of MDPI and/or the editor(s). MDPI and/or the editor(s) disclaim responsibility for any injury to people or property resulting from any ideas, methods, instructions or products referred to in the content.

