Article

Horizontal Hysteretic Behavior of Circular Concrete-Filled Steel Tubular Columns with Ultra-Large Diameter-to-Thickness Ratios

1
School of Civil Engineering, Suzhou University of Science and Technology, Suzhou 215000, China
2
School of Civil Engineering and Architecture, Xi’an University of Technology, Xi’an 710048, China
3
Jiangsu Grand Canyon Architectural Design Co., Ltd., Suzhou 215000, China
*
Authors to whom correspondence should be addressed.
Buildings 2024, 14(8), 2313; https://doi.org/10.3390/buildings14082313
Submission received: 21 June 2024 / Revised: 15 July 2024 / Accepted: 23 July 2024 / Published: 26 July 2024

Abstract

:
Thin-walled concrete-filled steel tubes are efficient and economical with promising applications in civil and light industrial buildings. However, their local buckling resistance and deformation capacity are low, which adversely affects the seismic safety of structures. There are relatively few studies on thin-walled concrete-filled steel tubular columns with ultra-large diameter-to-thickness ratios, and there is also a lack of relevant experimental research on them. In this study, horizontal hysteresis tests were conducted on concrete columns with a large diameter-to-thickness ratio. The seismic performances of regular and straight-ribbed specimens were analyzed and compared, including the analyses of load-displacement hysteresis curves, strain distribution, skeleton curves, ductility, and energy dissipation capacity. Using these results, a restoring force model for concrete columns with a large diameter-to-thickness ratio was established. The findings indicate that under horizontal loading, the ductility of concrete columns with a regular thin-walled steel tube is 3.9, with an equivalent viscous damping coefficient of 1.65. Meanwhile, the ultimate bearing capacity is 201 kN. After adding stiffening ribs, the ultimate bearing capacity reaches 266 kN and the ductility coefficient reaches 4.4, resulting in the stiffeners increasing the ultimate bearing capacity and ductility by >30% and 12.8%, respectively. However, they have a less pronounced effect on deformation and energy dissipation. Building on these research outcomes, we propose a dimensionless three-line skeleton curve model and a restoring force model. The calculation results from these models align well with the test results, offering valuable insights for the seismic safety analysis of real-world engineering structures.

1. Introduction

Concrete-filled steel tubes, renowned for their high bearing capacity and ease of construction, have found extensive application in high-rise, super-high-rise, heavy-duty, and long-span buildings. However, despite their exceptional performance, factors such as cost-efficiency have limited their adoption in middle- and low-rise structures. To resolve these challenges, thin-walled concrete-filled steel tubes were developed. This innovation involves significantly reducing the steel pipe’s wall thickness, leading to improved economic viability. In addition, the steel tubing becomes more malleable during construction. Nevertheless, reducing the thickness of the steel pipe has some disadvantages. It results in a notable reduction in the local stability performance, so effectively constraining the internal concrete becomes a challenge. Consequently, the component stiffness decreases rapidly, and deformation capacity decreases. This issue becomes particularly critical in seismic conditions, where the structure’s poor ductility poses a significant risk to overall structural safety. Therefore, we should continue to deepen research on the optimization of thin-walled steel tube concrete structures.
Numerous researchers, both domestic and international, have conducted extensive research on concrete-filled thin-walled steel tube structures and measures to enhance their resistance to local buckling. Yuan et al. [1] conducted experiments to study the seismic performance of thin-walled ribbed square-section steel bridge piers. Their findings revealed that increasing the height of the concrete filling at the bottom resulted in improved stiffness, strength, and ductility of the bridge piers. Yang et al. [2] analyzed the seismic performance of steel-reinforced concrete-filled steel-tube columns with T-shaped cross sections, the mechanisms of steel stiffening ribs, and the restraining effect of steel tubes on concrete. Gao et al. [3] proposed the use of thin-walled corrugated steel-tube concrete columns to address the poor seismic performance observed in both circular and square thin-walled concrete-filled steel-tube columns after they experience local buckling. The results showed that the seismic performance of thin-walled corrugated steel-tube concrete columns was either equivalent to or slightly better than that of thin-walled steel-tube concrete columns with circular or square cross-sections. Ji et al. [4] conducted research on the seismic performance of steel-tube-reinforced concrete composite columns. All specimens failed due to bending moments, and the hysteresis curves were full. Brown et al. [5] conducted horizontal hysteresis tests on 12 steel-tube-reinforced concrete columns with different diameter-to-thickness ratios and analyzed the influence of this ratio on the mechanical properties of the components. Liao [6] conducted relevant research on the seismic performance of restrained tie-bar steel-tube concrete columns. The results indicated that a limited number of restrained tie rods could actually reduce the seismic bearing capacity of the component. However, a larger number of restrained tie rods could improve the bearing capacity to some extent. Long et al. [7] examined the seismic performance of short concrete-filled steel-tube columns with rectangular cross sections restrained by tie rods. Their findings demonstrated that reducing the spacing between restraining tie rods significantly improved the seismic performance of the columns. Luo [8], primarily through theoretical analysis, explored the seismic performance of thin-walled corrugated steel pipes subjected to reciprocating loads within concrete-filled steel tube structures. Denavit and Hajjar [9] conducted a numerical analysis of the hysteretic performance of concrete-filled steel tubes by considering three-dimensional distributed plastic beam elements and accounting for the effects of the confinement of concrete and the local buckling of steel tubes. Goto et al. [10] performed finite element analysis of the hysteretic performance of thin-walled reinforced rectangular concrete-filled steel-tube columns by considering the influence of local buckling under cyclic loading. Patel et al. [11] utilized a universal concrete model to analyze the hysteretic properties of circular, elliptical, and octagonal steel tube concrete, with the calculated results showing good agreement with experimental values. Bai et al. [12] simulated the degradation behavior of rectangular and circular concrete-filled steel tubes under axial and horizontal cyclic loading using a discrete numerical model of fiber elements. Wei et al. [13] studied the seismic performance of ultra-high-performance concrete (UHPC) panels and concrete-filled steel tube (CFST) composite columns using a 1:8 scale model, and they found that seismic motion significantly impacts specimen responses. The performance of specimens improved after using ultra-high-performance concrete. In an effort to improve the seismic performance of precast structures, Huang et al. [14] proposed a novel precast beam featuring replaceable artificial controllable plastic hinges (ACPHs) that resist bending and shear separation at column nodes. Their test results showed that ACPHs significantly changed the failure mode of nodes and had excellent hysteresis performance, sufficient ductility, and superior energy dissipation capabilities. Despite these advancements, most of the above studies have focused on large building connection nodes, bridge piers, and other large-scale structures. However, there remains a scarcity of research on thin-walled concrete-filled steel tubular columns with ultra-large diameter-to-thickness ratios in medium and low-rise civil and light industrial buildings, and the research into thin-walled concrete-filled steel tubular columns with ultra-large diameter-to-thickness ratios is further warranted.
The use of steel In thin-walled circular concrete-filled steel tubular columns is significantly reduced, amounting to only about 40% of the amount of steel required for conventional concrete-filled steel tubular columns. This reduction in steel usage brings about evident economic advantages. Australia and other countries have successfully employed this approach in low-rise buildings, yielding favorable outcomes. This thin-walled steel pipe concrete column is particularly well-suited for low- and medium-rise structures with lower vertical load-bearing requirements. Its application extends to small towns, rural areas, and light industrial buildings (i.e., low- and mid-rise structures with low vertical load-bearing requirements) in China, offering a promising niche. However, the reduction in the thickness of the steel pipe does lead to a notable reduction in local buckling resistance and a rapid stiffness degradation after the peak load is reached. At present, research on the seismic performance of thin-walled concrete-filled steel tubular columns remains relatively limited, lacking experimental validation. Aspects such as the ultimate bearing capacity, stiffness degradation, ductility, energy dissipation, and design methods under horizontal earthquakes are yet to be fully elucidated. At the same time, there is a need to study methods for improving the bearing capacity, deformation capacity, and ductility of thin-walled concrete-filled steel tubular columns with ultra-large diameter-to-thickness ratios. This paper aims to bridge this knowledge gap by conducting horizontal hysteresis tests on both ordinary and straight-ribbed circular concrete-filled steel-tube columns with a super large ratio of diameter to thickness. These tests will reveal their failure processes, modes, and seismic performance, providing valuable experimental insights for their engineering applications.

2. Test Survey

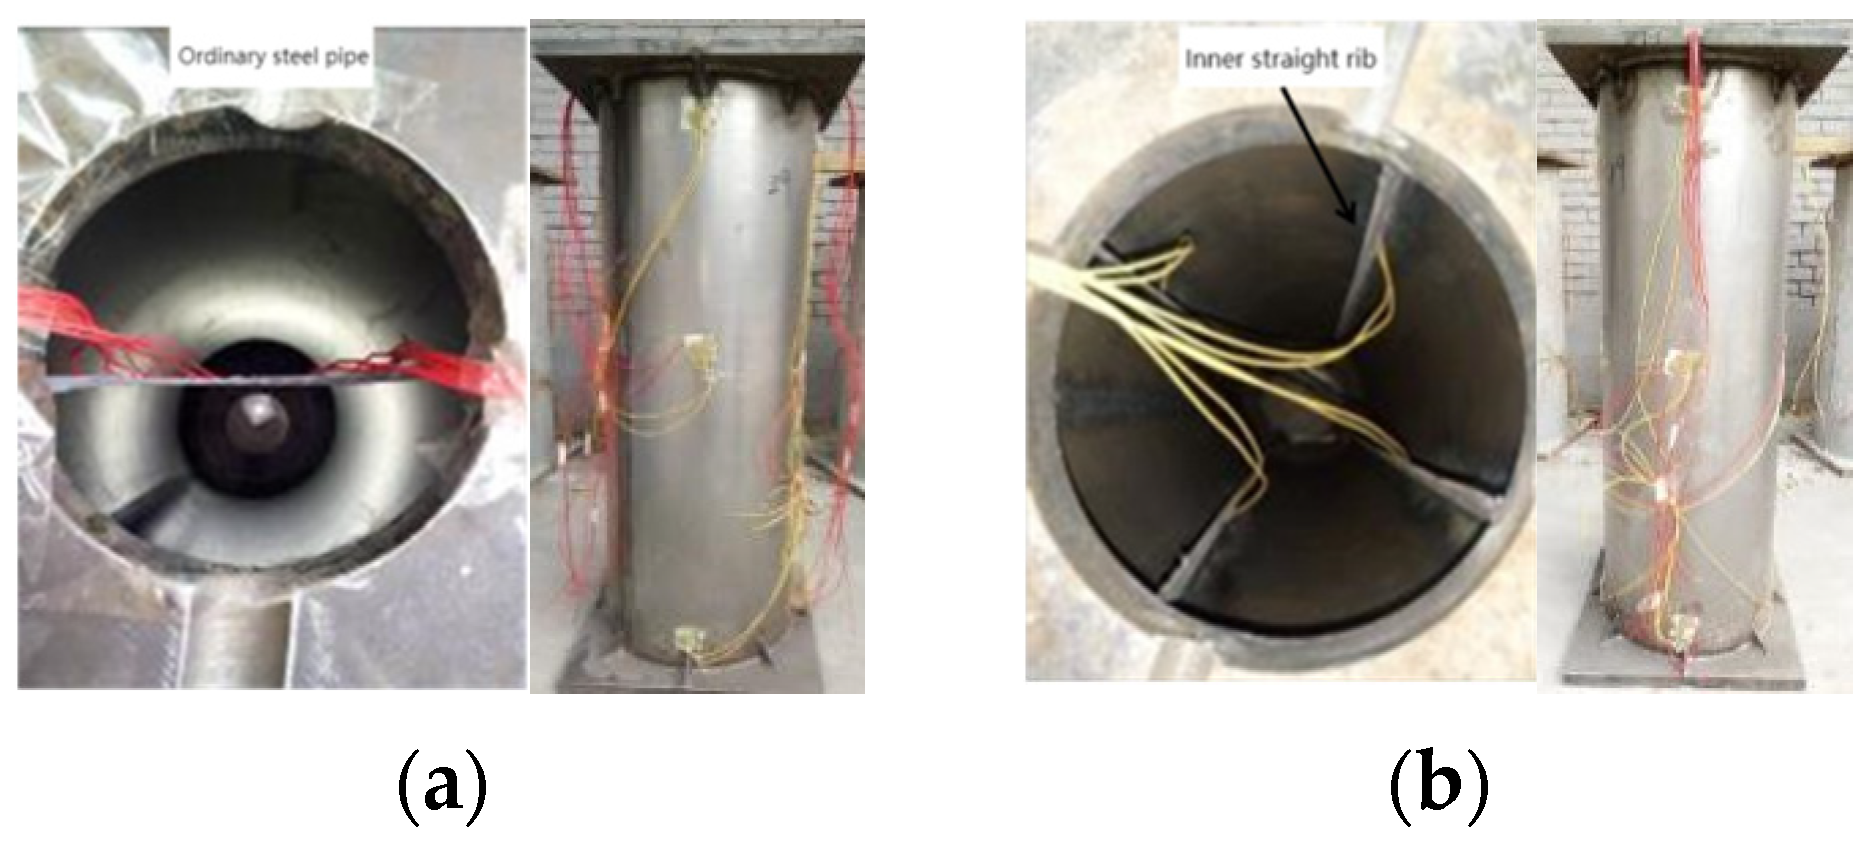
2.1. Specimen Design and Production

A horizontal hysteresis test was conducted on ordinary and straight-ribbed concrete-filled steel-tube columns with an ultra-large diameter-to-thickness ratio. According to the relevant specifications for concrete-filled steel tubes, the limit value for the diameter-to-thickness ratio (D/t) of circular-cross-section concrete-filled steel tubes is set at 100 235 / f y . However, the test specimen measured 1050 × 340 mm and had a diameter-to-thickness ratio of 227, which exceeds typical specification limits. The outer area of the specimen used 1.5 mm thick steel pipes to greatly reduce steel usage, while the interior was filled with C30 concrete. The specific configuration is depicted in Figure 1, and the specimen’s design parameters are listed in Table 1. To ensure that the steel pipe and concrete worked harmoniously during the loading process while also serving to secure the specimen, an end plate was welded at both ends of the component. The upper-end plate measured 502 × 502 × 30 mm, and the lower-end plate measured 732 × 436 × 30 mm. To facilitate concrete pouring, a center hole with a diameter of 160 mm was provided in the lower part of the end plate, along with a 10 mm wide and 8 mm deep lead groove. The steel pipe was filled with C30 self-compacting concrete with 32.5-grade silicate cement, continuously graded gravel as the coarse aggregate with particle sizes ranging from 5 to 10 mm, medium-fine sand as the fine aggregate, tap water as the mixing water, and a polycarboxylate-acid high-performance superplasticizer as the admixture. The mix ratio is detailed in Table 2, and the concrete material properties are outlined in Table 3. The steel material employed is of Q235B grade, and its material properties are listed in Table 4.

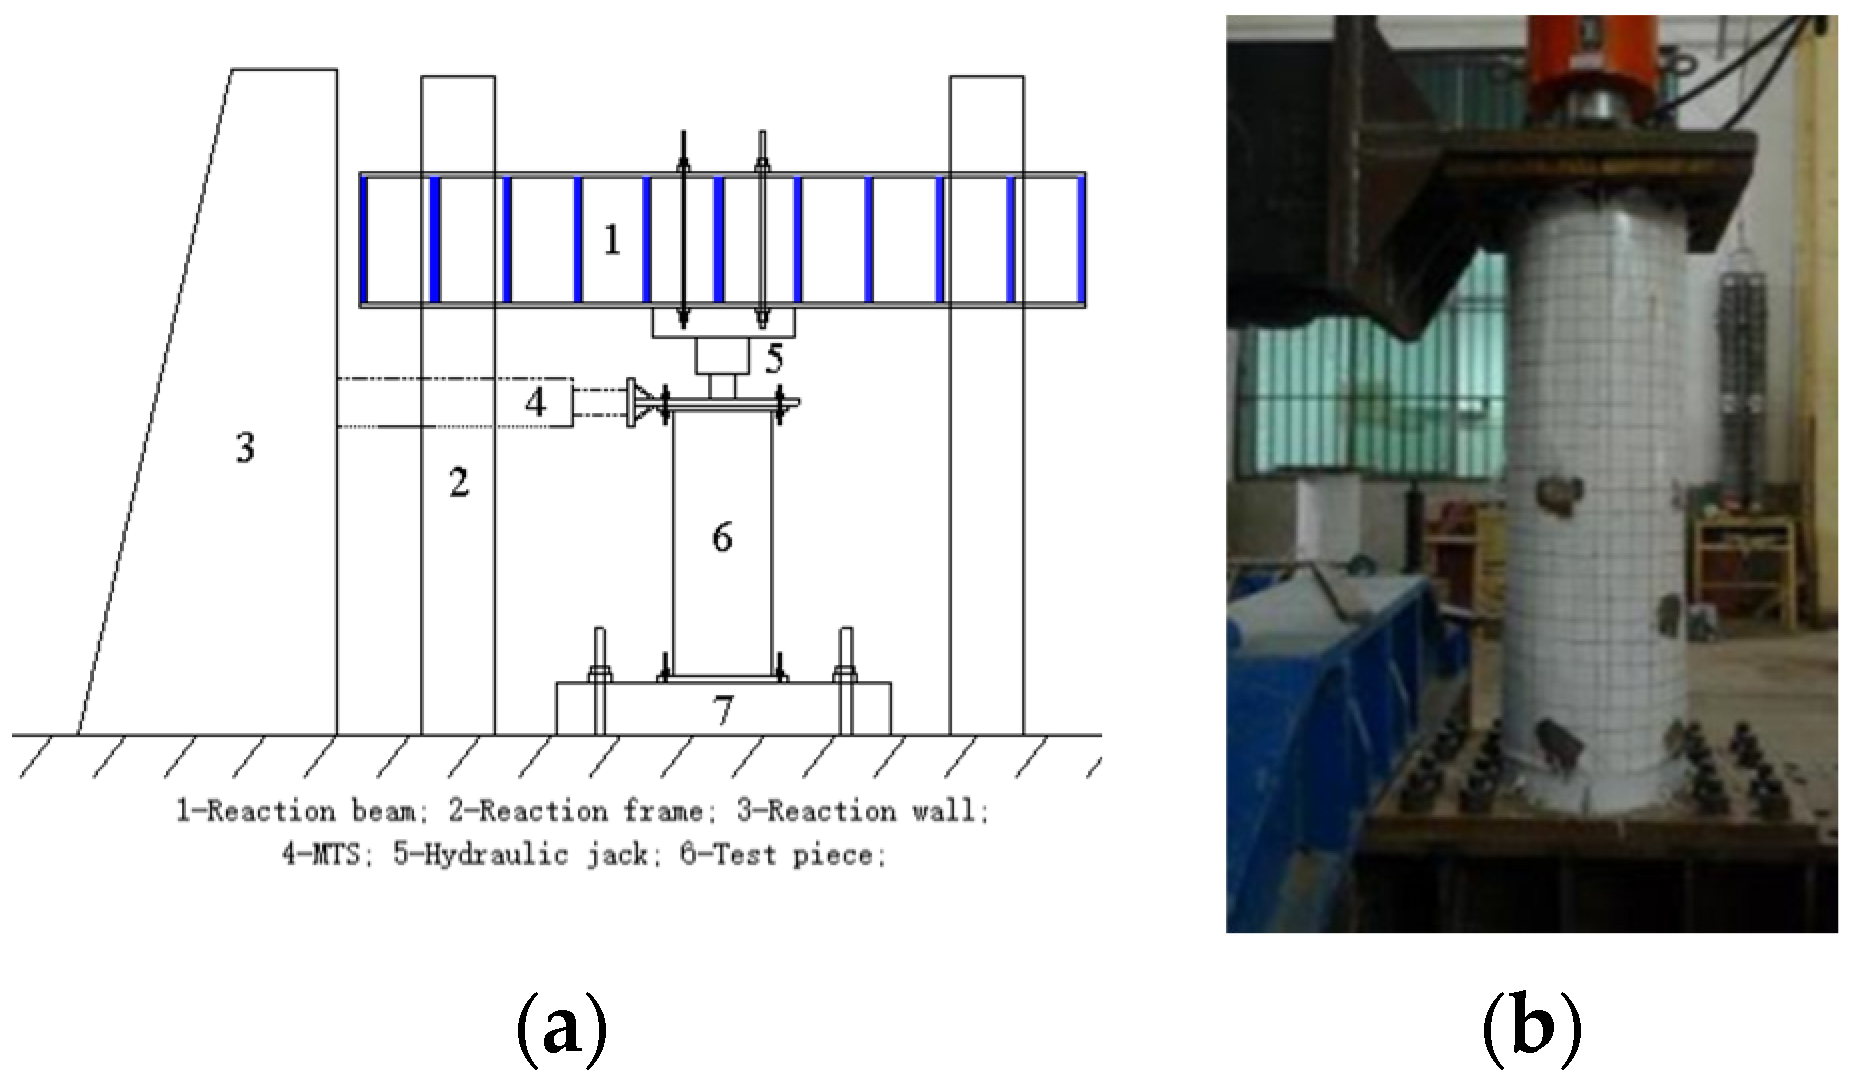
2.2. Test and Loading Scheme

The horizontal hysteresis test was conducted using the MTS reaction force system. Initially, a vertical load of 1200 kN was applied to the top of the specimen, resulting in an axial compression ratio of approximately 0.4. The vertical load remained unchanged during the test; then, a horizontal load was applied to the end side using the MTS reaction force system. The horizontal load was force-controlled in the elastic stage. Each force loading cycle occurred only once in each stage. When the load reaches the yield point of the specimen, the horizontal load control transitions from force control to displacement control. During this phase, the displacement loading cycle was repeated three times in each stage. The test concluded when the bearing capacity of the specimen dropped to 85% of its ultimate bearing capacity. Detailed illustrations of the specific loading system can be found in Figure 2, while the loading device is depicted in Figure 3. Simultaneously, in order to facilitate observation of the test specimens during on-site testing, white paint was applied to the outer surface of the specimens in the form of uniform straight lines.
During the test, a total of four displacement gauges were installed to measure the horizontal displacement of the specimen: one positioned at the top, one in the middle, and two at the bottom of the specimen. Moreover, a total of 24 strain gauges were installed, and they were arranged within a 100–300 mm range from the bottom of the specimen, to measure the strain in the steel pipe.

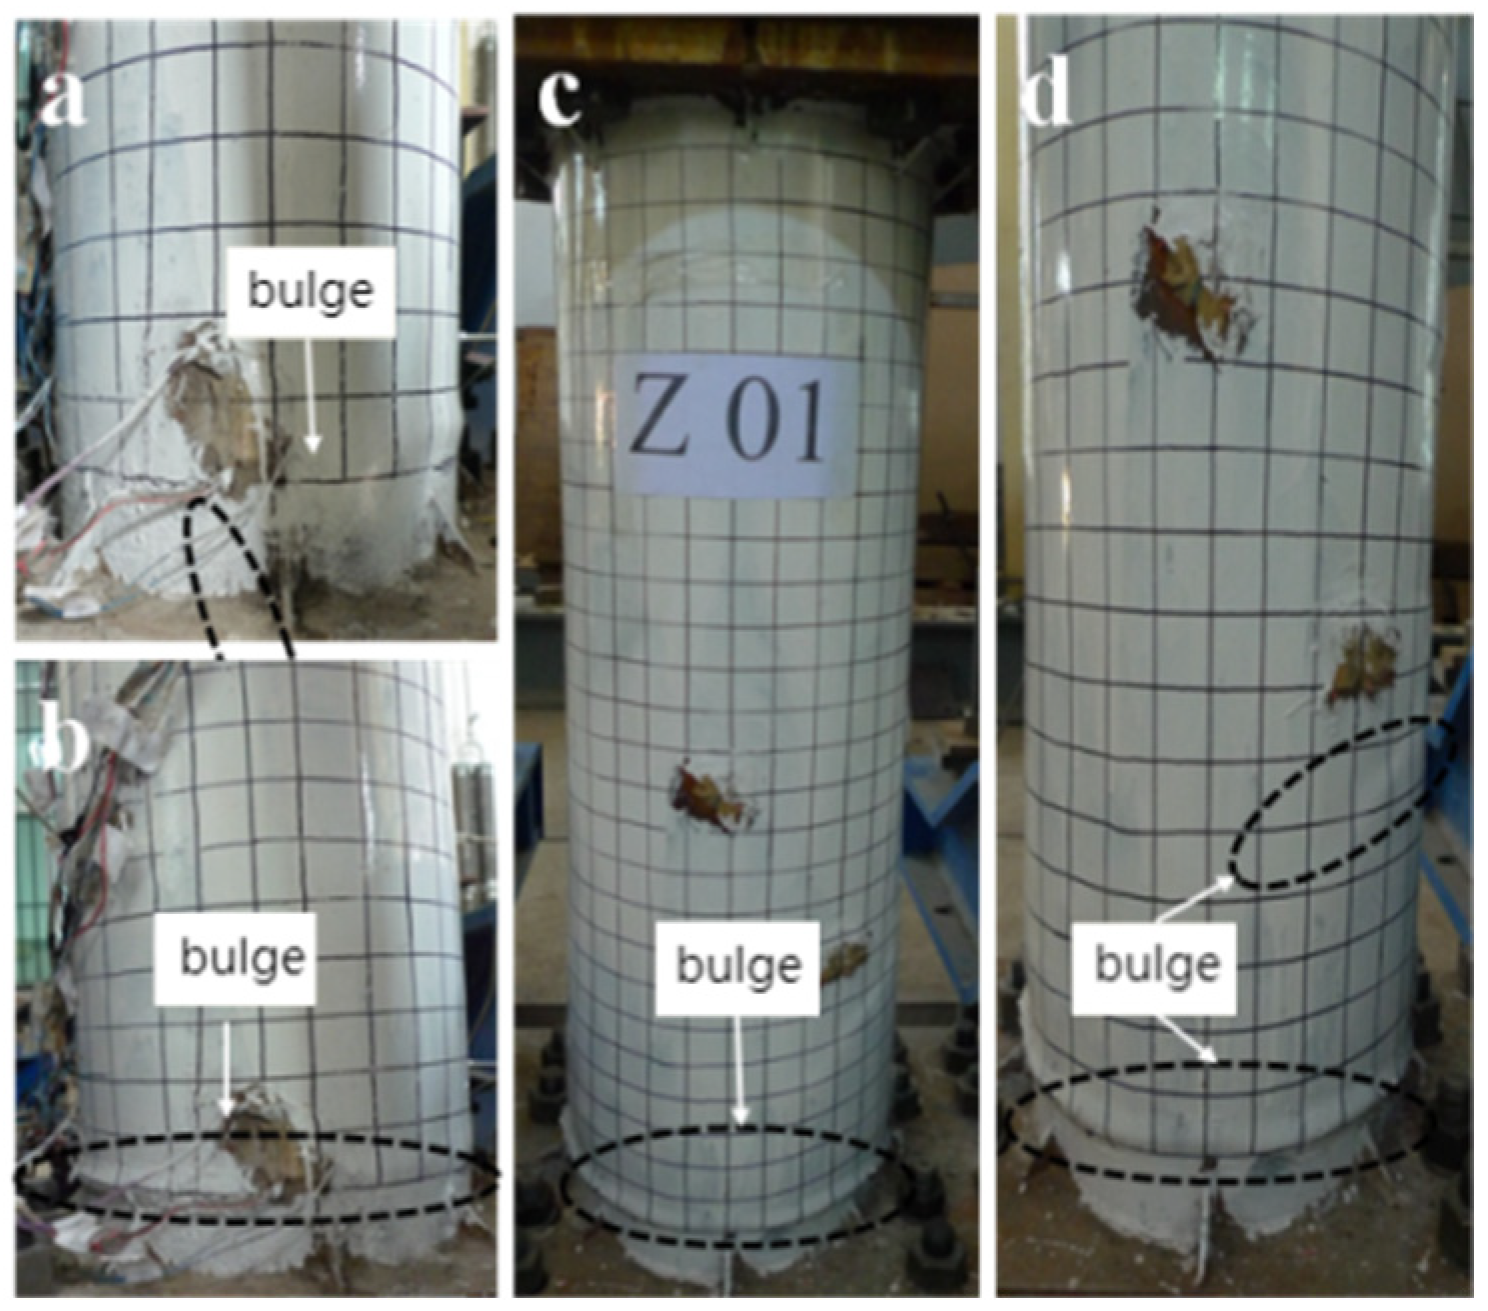
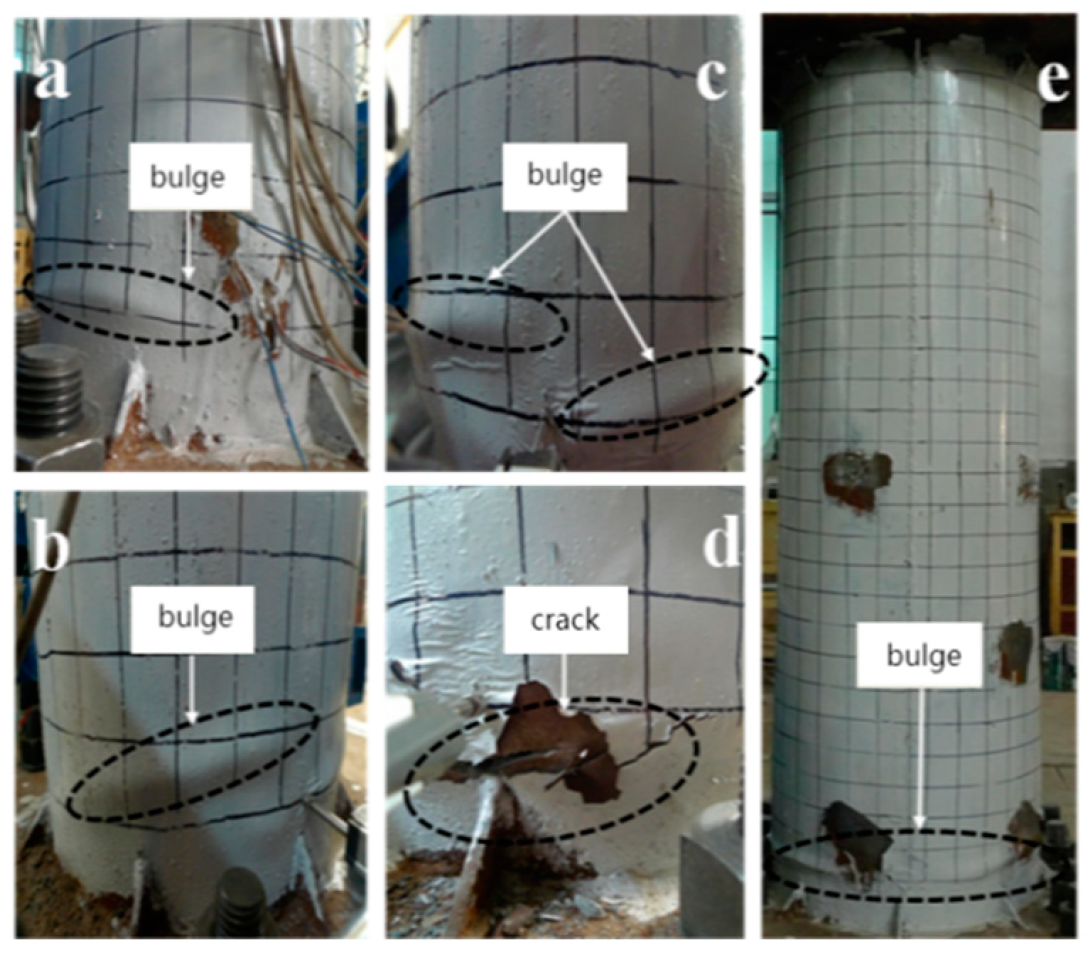
3. Analysis of Test Process and Failure Mode

In the initial stage of loading the ordinary concrete-filled steel-tube column, no obvious phenomena indicative of poor performance were observed. However, as the horizontal force reached 140 kN, a localized, slight bulging occurred 5 cm above the bottom of the column in the direction of the horizontal force, as depicted in Figure 4a. With the continued increase in the load, both the size and extent of the bulging increased, and a tendency for circumferential bulging at the 5 cm mark from the bottom of the column was observed. As the load reached 150 kN, the bulging at the bottom became more pronounced and extended to the surrounding area, as shown in Figure 4b. Afterward, the specimen yielded, and the horizontal loading was controlled by displacement. At a displacement of 24 mm, the deformation resembled a closed ring, becoming more evident and located 5 mm above the bottom of the column, as illustrated in Figure 4c. Loading ceased when the displacement reached 27 mm. Throughout this process, the bottom of the column underwent significant changes: substantial bulging was evident across the entire bottom section. Notably, there was a noticeable deformation bulge at 200 mm above the bottom of the column, while the middle and upper sections remained relatively unaffected, as illustrated in Figure 4d. In summary, under the influence of horizontal loading on the ordinary thin-walled steel-tube concrete column, localized horizontal buckling initially manifests along the bottom section of the column. As the load increases, this buckling progresses circumferentially, ultimately leading to full-section buckling. Simultaneously, as the steel tube bulges outward, the internal concrete gradually undergoes crushing. The initial bend occurs primarily at the edge of the bottom of the column, indicating bending damage based on the damage location.
In the early stage of loading, the straight-ribbed thin-walled concrete-filled steel-tube column showed no significant phenomena indicative of poor performance. However, when the load reached 160 kN, a slight bulge emerged 10 mm from the bottom of the column, as depicted in Figure 5a,b. Afterward, the specimen yielded, and the horizontal loading was controlled by displacement. At a displacement of 17 mm, during the initial displacement cycle, the previous bulge (which formed when loaded to 160 kN) extended to both the right and left, and this extension was accompanied by the sound of the white paint on the test sample’s surface cracking, as shown in Figure 5c. As the displacement continued to increase, the bulging at the bottom became more pronounced, extending to the left and right of the column outward. When the displacement reached 26 mm, transverse cracks appeared on both the left and right sides of the steel pipe, as illustrated in Figure 5d. With the continuous increase in the horizontal displacement, the multiple bulges around the bottom of the column developed into a single connected bulge that enveloped the entire circumference of the steel pipe, as seen in Figure 5e. In summary, under the horizontal loading of thin-walled concrete-filled steel tubes with straight ribs, initial localized horizontal and diagonal buckling primarily occurred along the bottom of the column. As the load increased, this buckling gradually extended circumferentially. When it reached the vicinity of the stiffeners, the buckling was constrained by the stiffeners, eventually forming discontinuous circumferential buckling bands. The location and direction of the initial bulging indicated a certain shear failure component, but the primary mode of failure was bending.

4. Test Results and Discussion

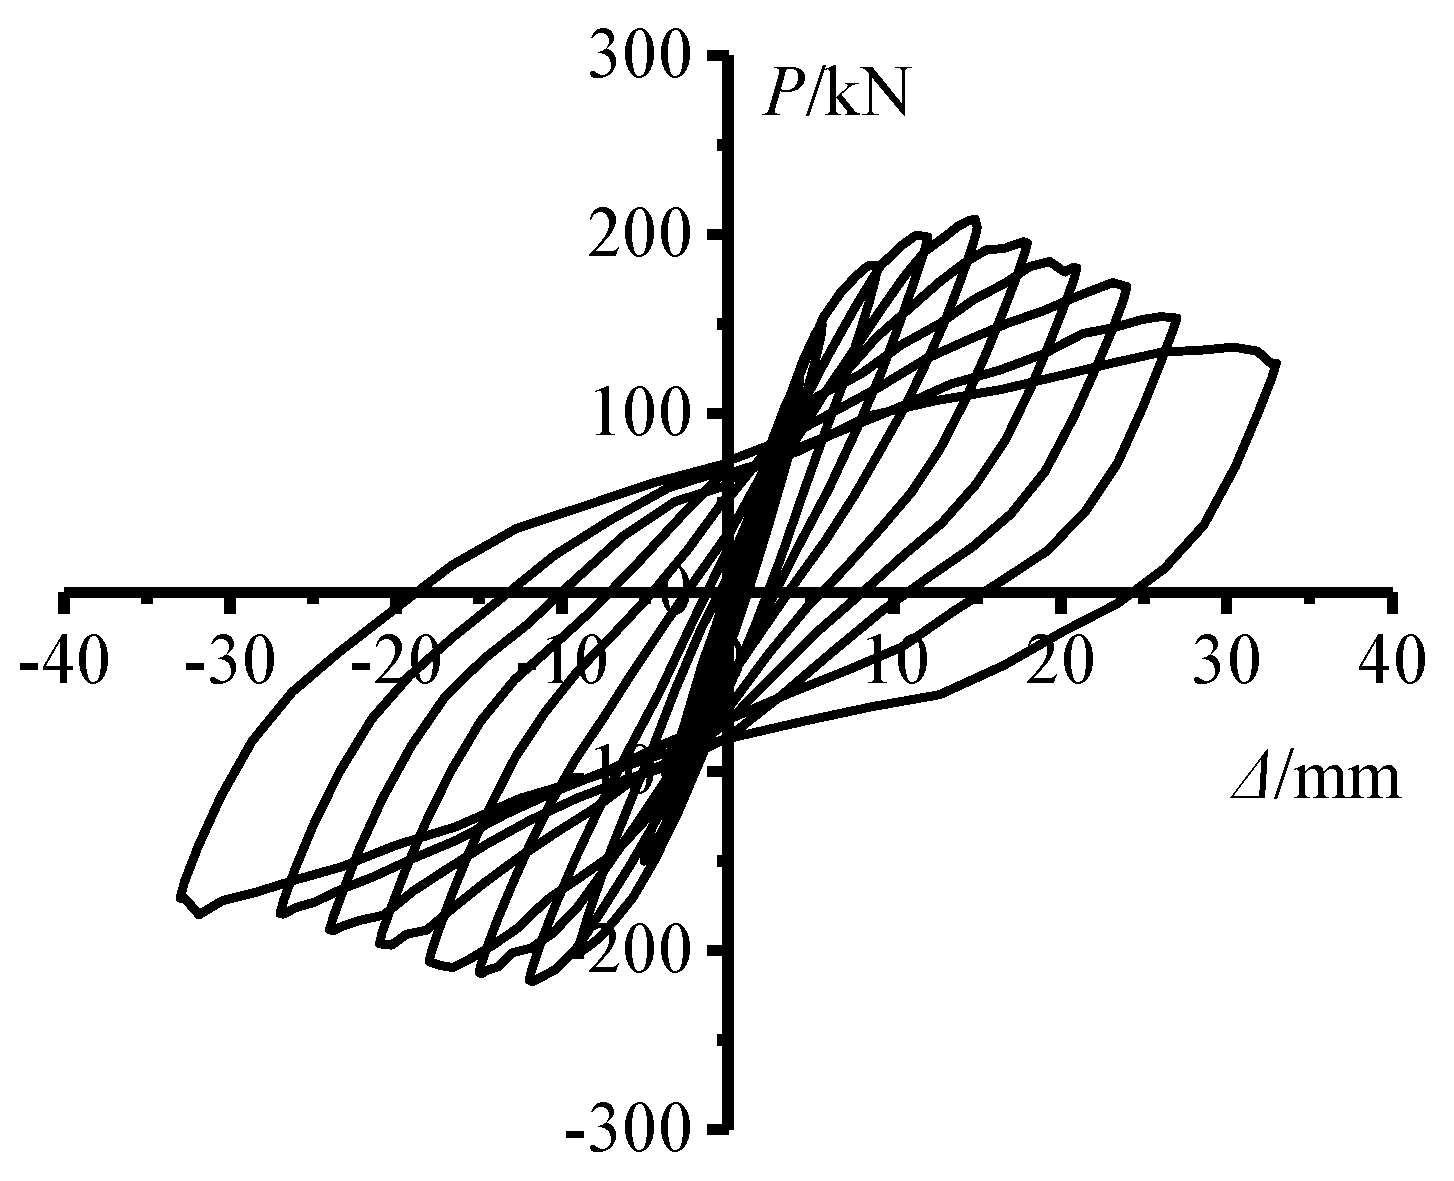
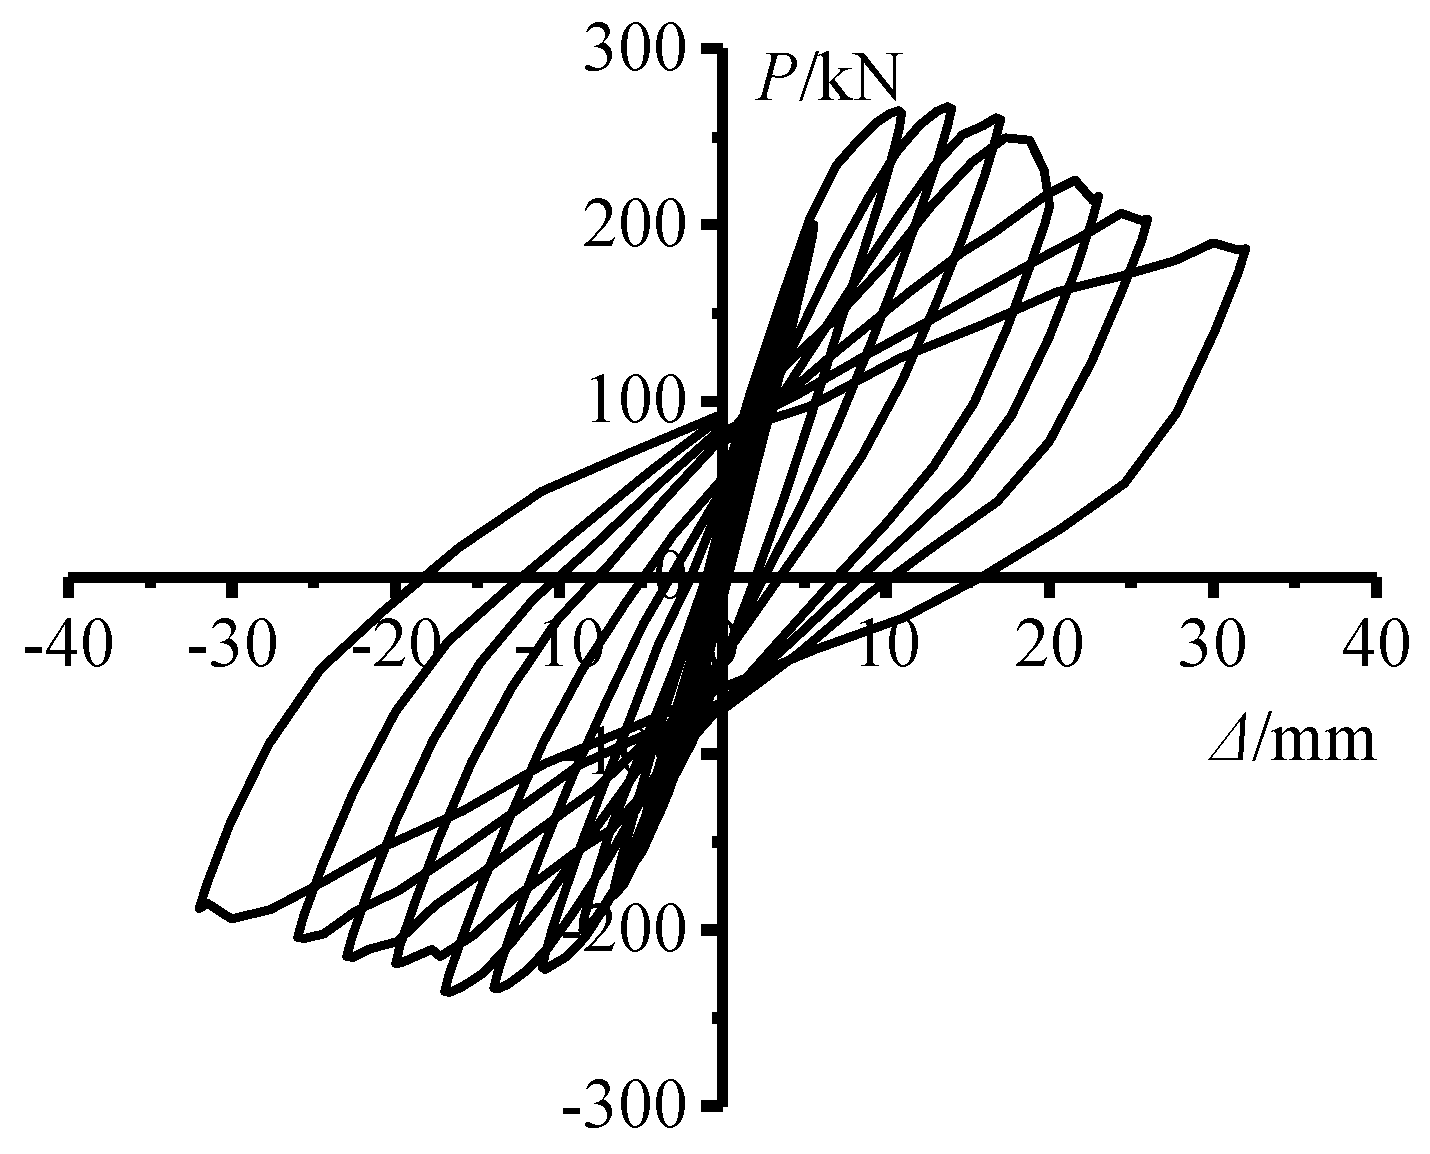
4.1. Load-Displacement Hysteresis Curves

By analyzing the hysteresis curve, we can understand the energy dissipation capacity and deformation capacity of the structure under earthquake action and thus evaluate its seismic performance. The hysteretic curves of ordinary thin-walled concrete-filled steel-tube columns and straight-ribbed thin-walled concrete-filled steel-tube columns are illustrated in Figure 6 and Figure 7. Both specimens exhibit long and narrow hysteresis curves in the elastic phase, which closely resemble straight lines. With the transition into the elastic–plastic phase, the hysteresis loops gradually open up. A comparison of the hysteresis curves of the two specimens shows that the curves are essentially spindle-shaped with a decrease in the stiffness occurring gradually. Moreover, they exhibit a certain degree of energy dissipation capability. When the peak load is applied, the hysteresis curve of the ordinary thin-walled concrete-filled steel-tube columns decreases relatively gently, whereas that of the straight-ribbed concrete-filled steel-tube columns initially exhibits a very rapid decrease, followed by a notably more gradual decrease. In summary, the hysteretic curve of ordinary thin-walled concrete-filled steel-tube columns appears slightly fuller than that of the straight-ribbed column, but their patterns of change are relatively similar.

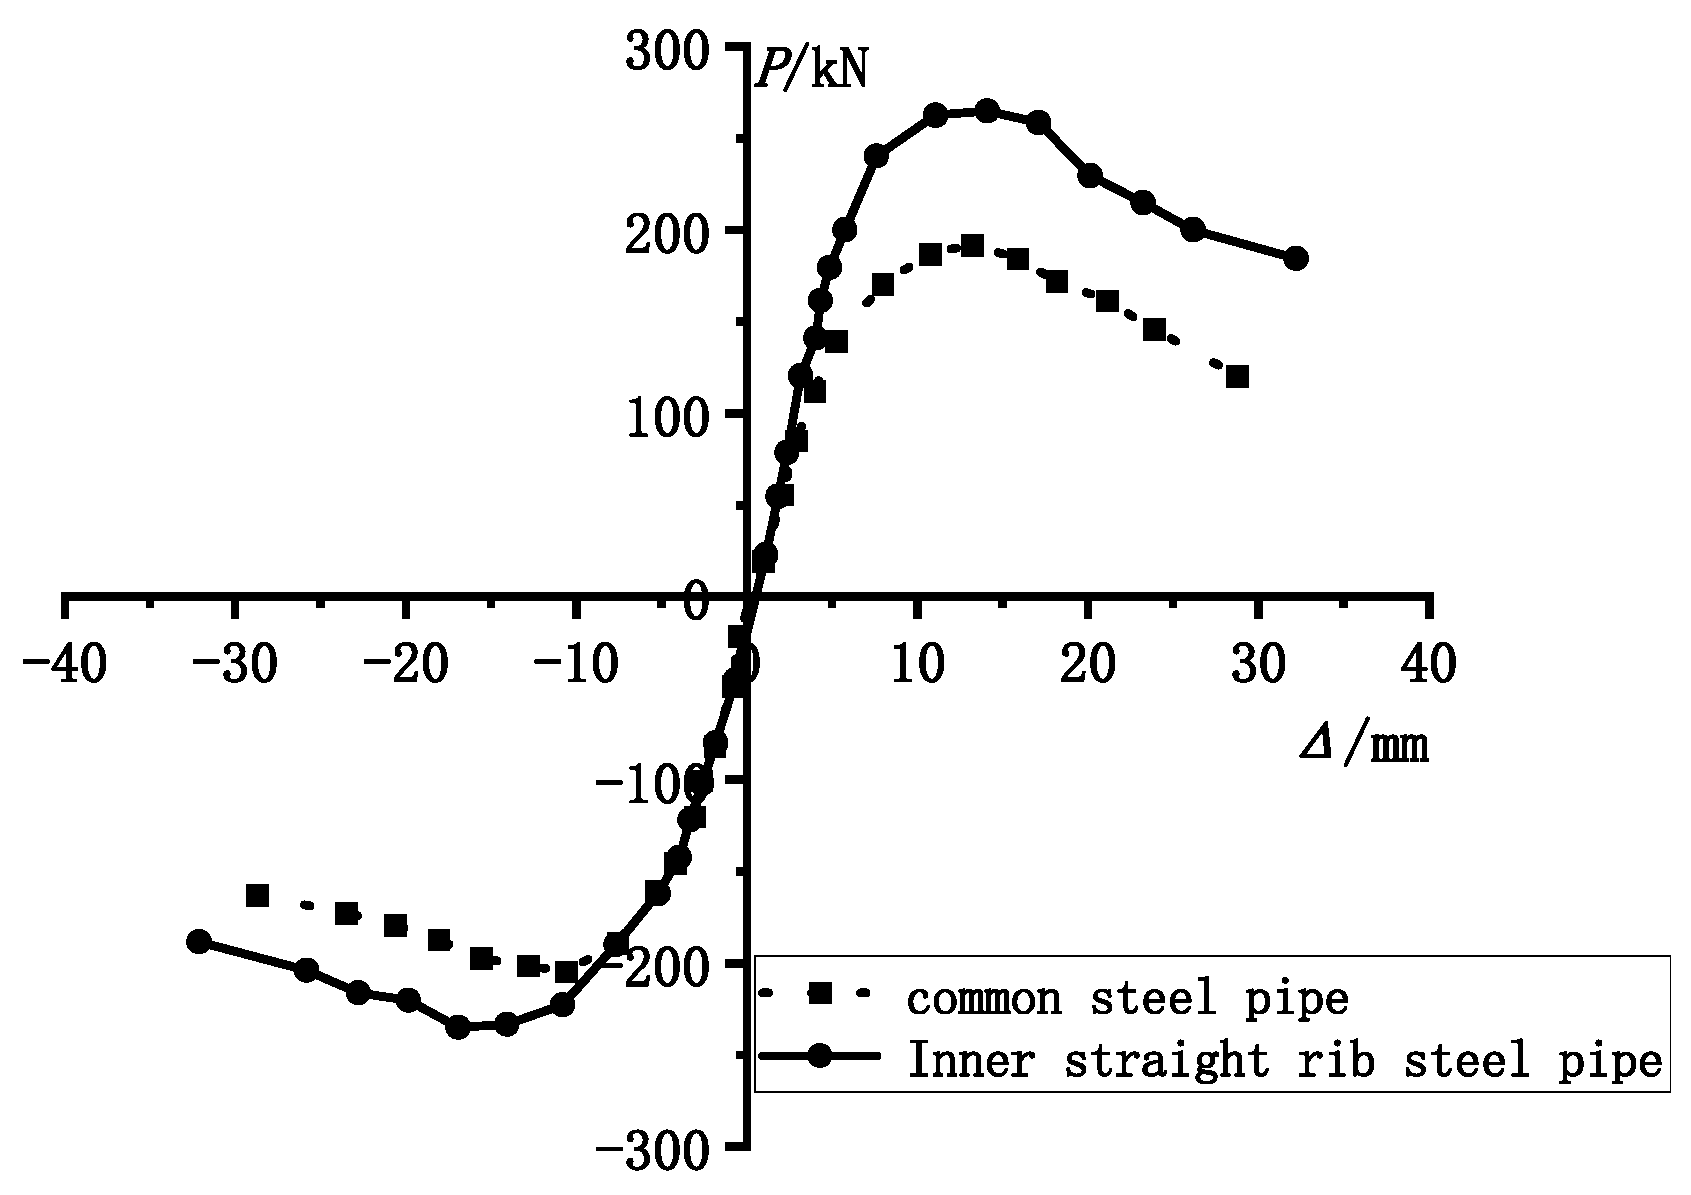
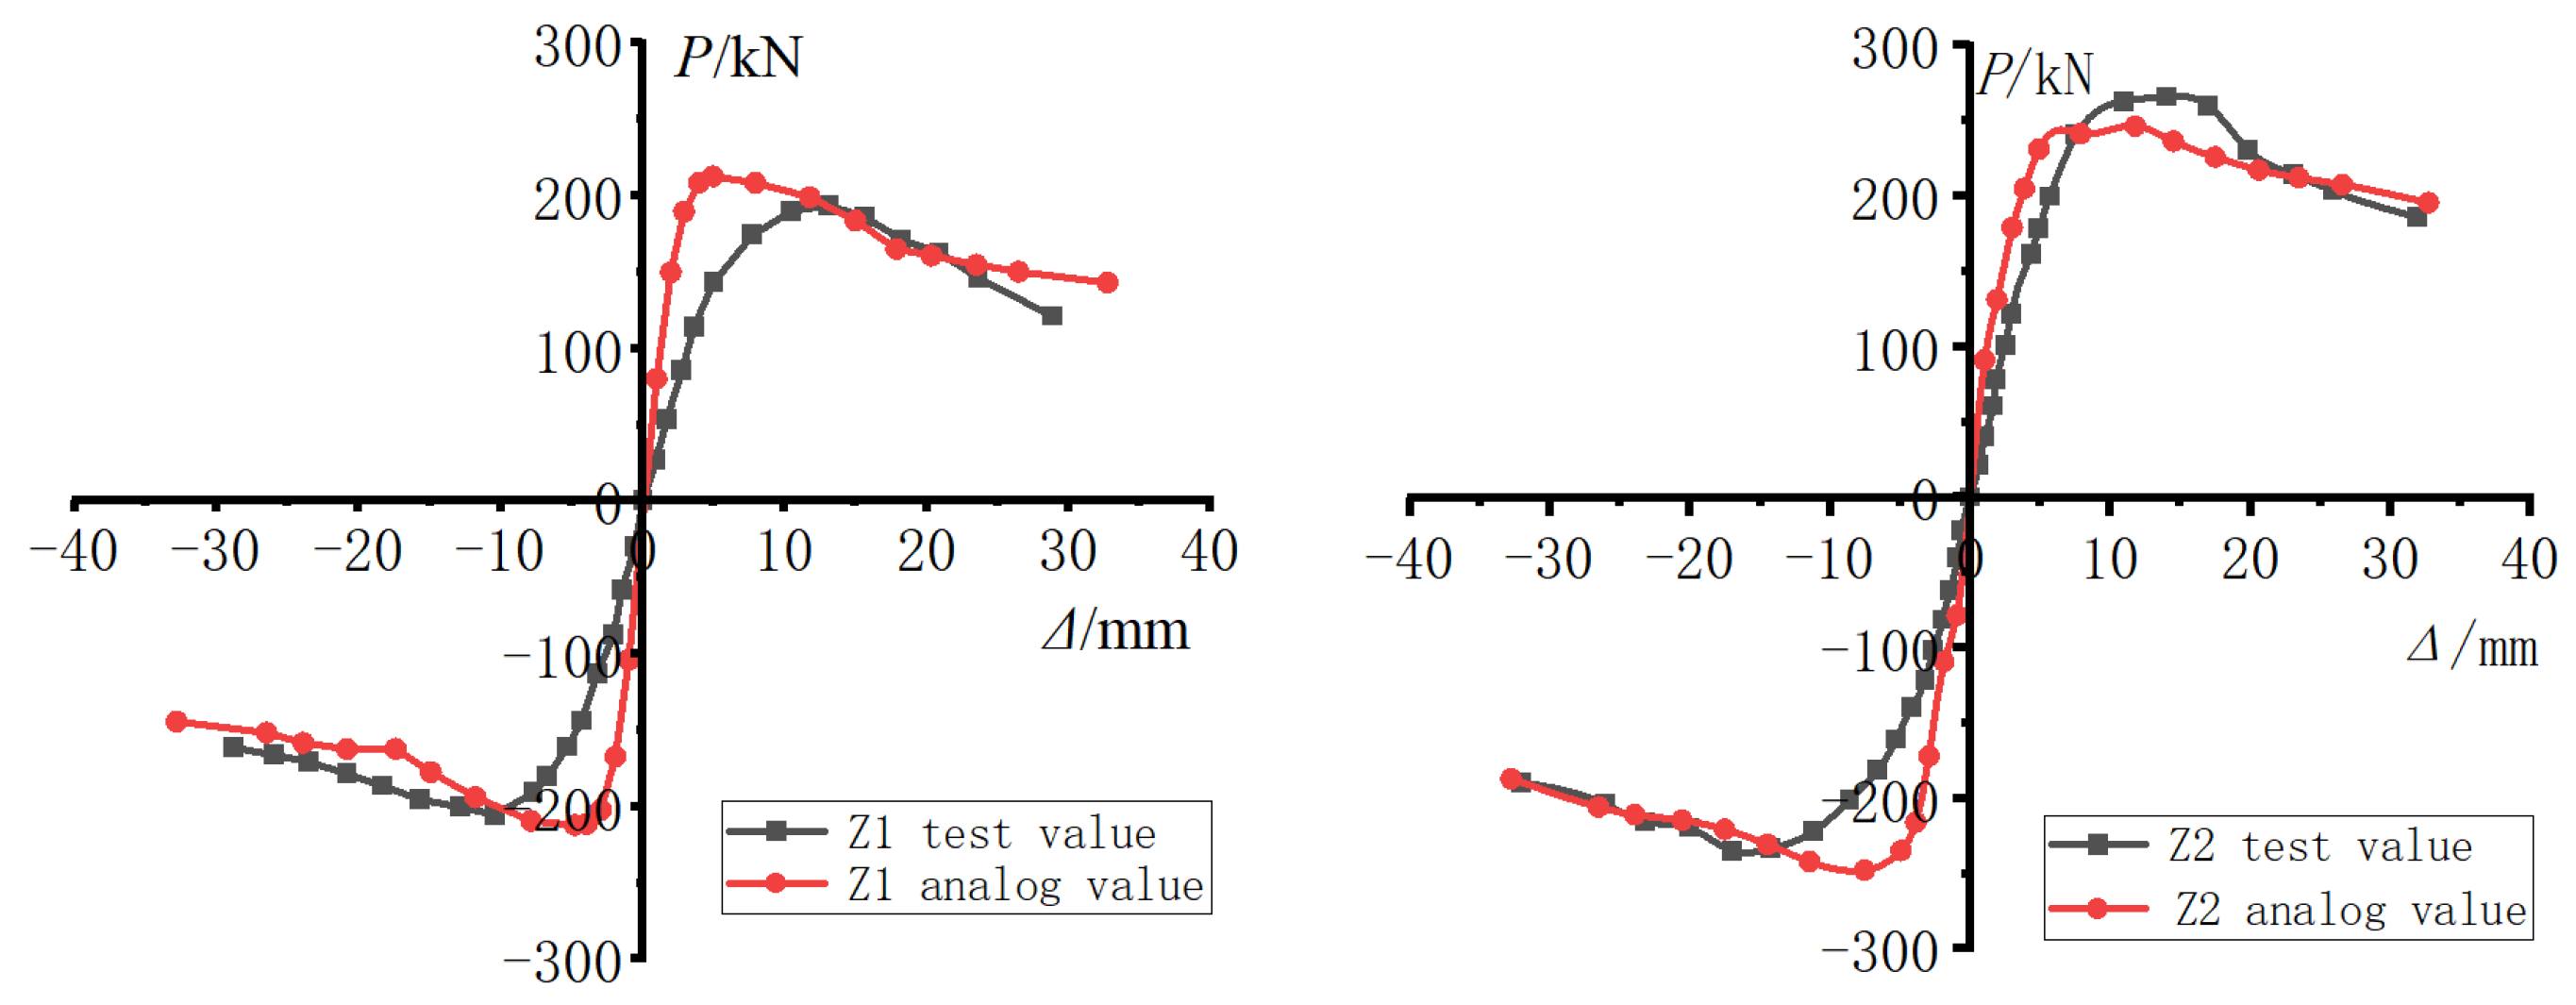
4.2. Skeleton Curves

The skeleton curve can help evaluate the overall performance of a structure under extreme loads, such as those caused by earthquakes. This curve is formed by connecting the peak points of the hysteresis curve and reflects the elastic and plastic characteristics of the structure. The skeleton curves of the ordinary and straight-ribbed thin-walled concrete-filled steel-tube columns are shown in Figure 8. In the elastic stage, the curve exhibits a nearly linear rise, with the straight-ribbed thin-walled specimen displaying slightly higher stiffness. With the transition into the elastic–plastic stage, the stiffness of the straight-ribbed thin-walled concrete-filled steel-tube column decreases rapidly. When the peak load is reached, the force in the ordinary thin-walled concrete-filled steel-tube columns starts to decrease at a low rate, while the straight-ribbed thin-walled concrete-filled steel-tube columns initially experience a high rate of decrease, followed by a lower rate of decrease. Compared to ordinary specimens, the yield load of straight-ribbed specimens is higher by 14.3%, and the ultimate load is 31.7% higher, indicating substantially higher bearing capacity. The bearing capacity’s safety margin (i.e., the additional capacity the structure can carry beyond what it is designed for) and the safety reserve of the two components (i.e., the portion of the structure’s capacity that is intended to help the structure handle unforeseen circumstances) are roughly the same. Overall, the straight-ribbed columns exhibit notably higher ultimate bearing capacity and marginally higher specimen stiffness. However, due to the limited restraint range of the stiffeners, the stiffeners primarily prevent the buckling of the surrounding steel tubes and do not substantially contribute to the overall specimen strength. Further, their impact is not particularly significant on the deformation capacity.

4.3. Ductility Analysis

Ductility is the ability of a structure or material to undergo significant deformation before failure occurs, and it serves as a key measure of a structure’s ability to deform under loads such as those caused by earthquakes. Quantitative indicators of ductility typically include the displacement ductility ratio and the curvature ductility ratio. In this study, the ductility of the structural component was quantified on the basis of the displacement ductility ratio, which was calculated as follows:
μ = Δ u Δ y .
Here, Δy represents the displacement at yield, and Δu denotes the displacement at failure.
The ductility coefficient for straight-ribbed thin-walled concrete-filled steel-tube columns is found to be 4.4, while the ductility coefficient for ordinary thin-walled concrete-filled steel-tube columns is 3.9. This indicates that the ductility of the straight-ribbed specimens has increased by 12.8%. This suggests that the presence of stiffening ribs inside the steel tubes does have an impact on the deformation capacity of the entire specimens. While improvement is indeed observed, it is not deemed as substantial.

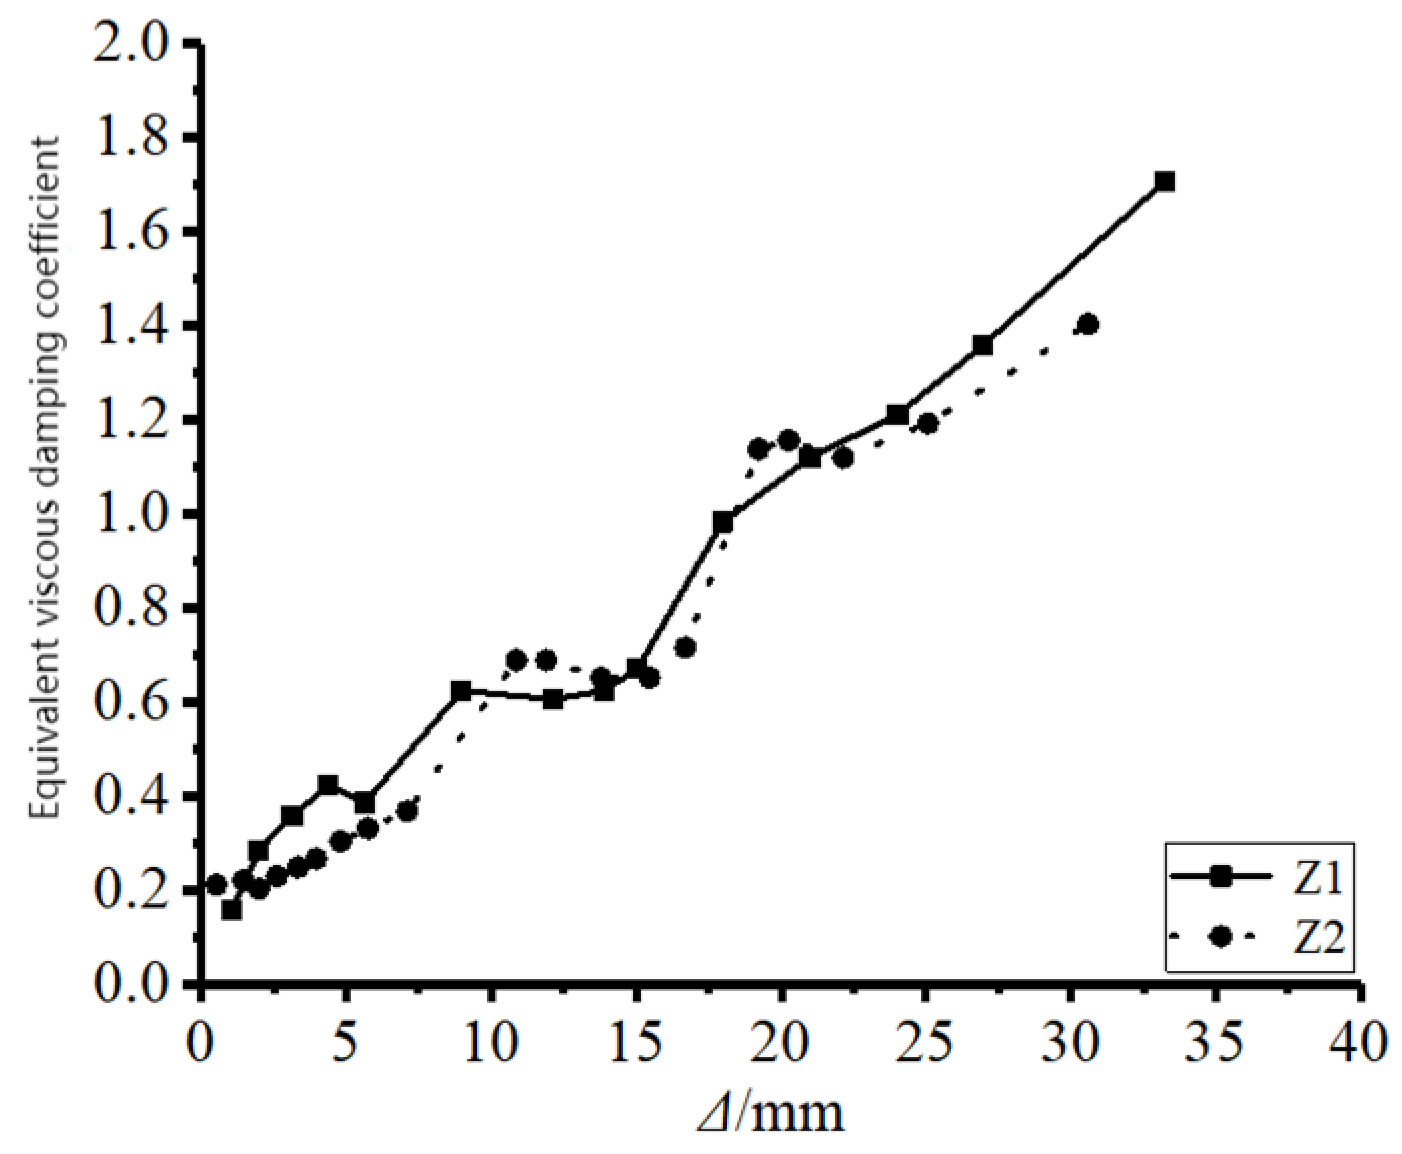
4.4. Energy Consumption Analysis

Energy analysis aims to evaluate the energy absorption and dissipation capacity of a structure under earthquakes or other dynamic loads. The energy dissipation capacity of the specimen can be represented by the equivalent viscous damping coefficient, as depicted in Figure 9. The energy dissipation capacities of the two specimens are quite similar. The ordinary thin-walled concrete-filled steel-tube column exhibits a slightly higher value—approximately 1.65—whereas the coefficient of the straight-ribbed specimen is about 1.38.

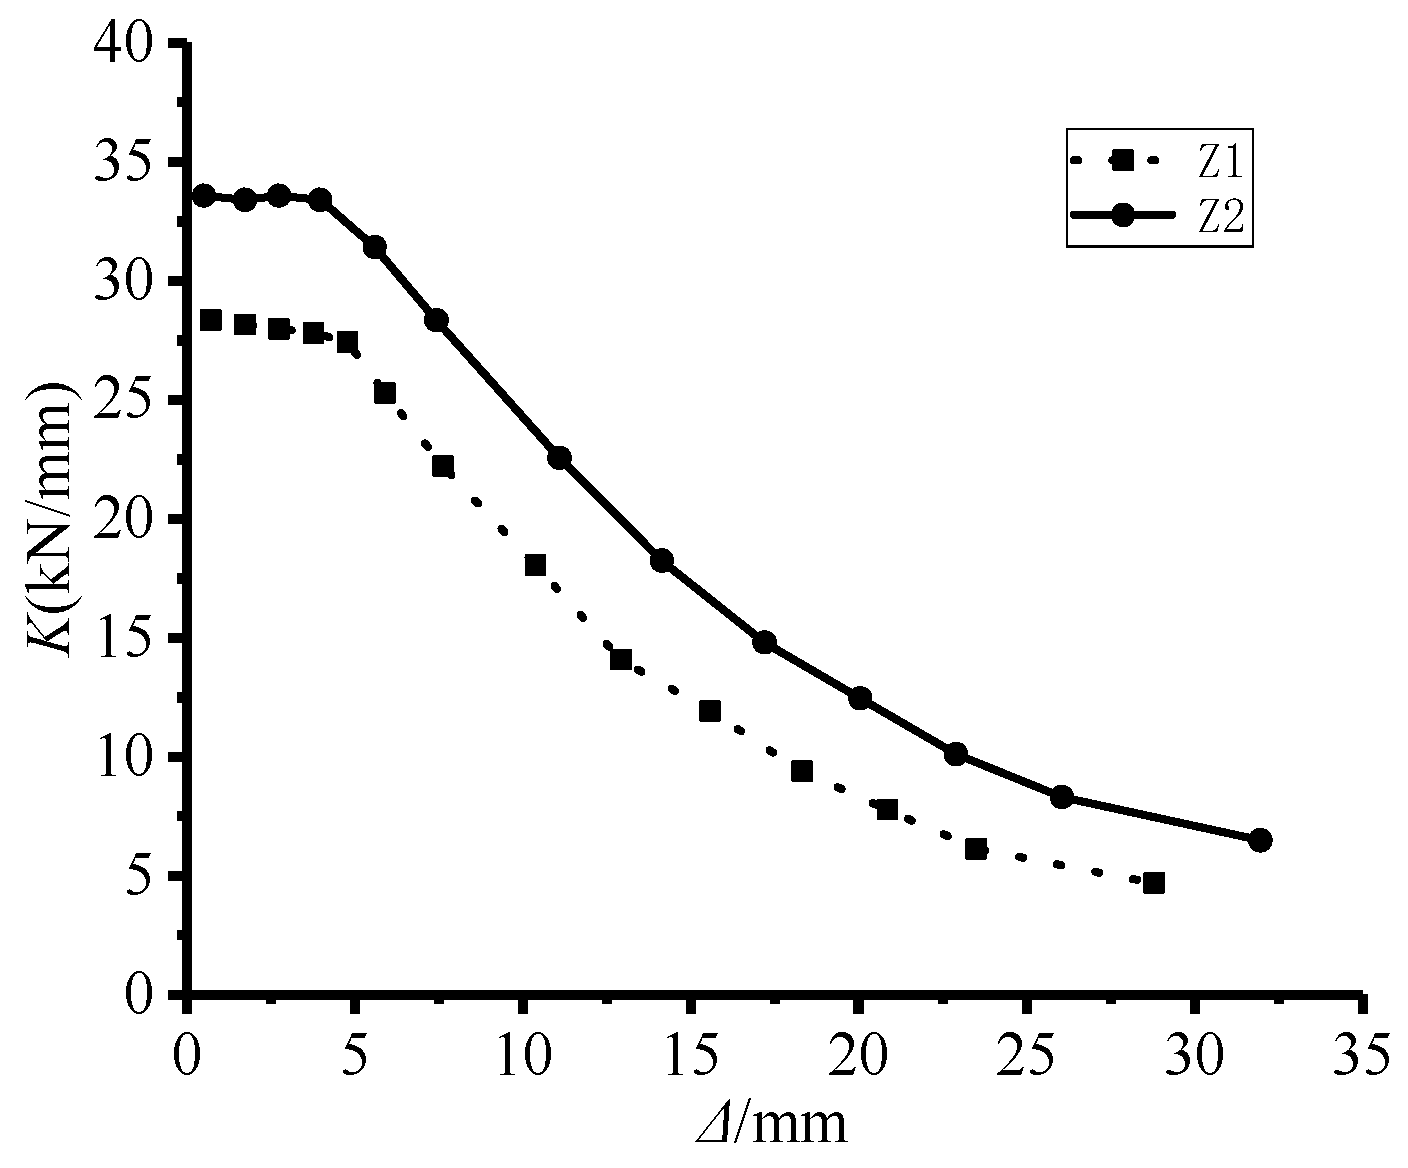
4.5. Rigidity Deterioration

Stiffness degradation is a common behavior of structures under earthquakes, wind loads, or other dynamic loads. Understanding and analyzing stiffness degradation is essential for evaluating the durability and seismic performance of structures. This paper uses the secant stiffness method for analysis, which approximates the actual stiffness of the structure under large deformations or nonlinear conditions. The secant stiffness simplifies the stiffness variation law during nonlinear analysis processes, as shown in Figure 10. The stiffness-reduction patterns for the two specimens are very similar. The initial stiffness of the straight-ribbed specimen is notably higher—approximately 20% higher—than that of the ordinary specimen.

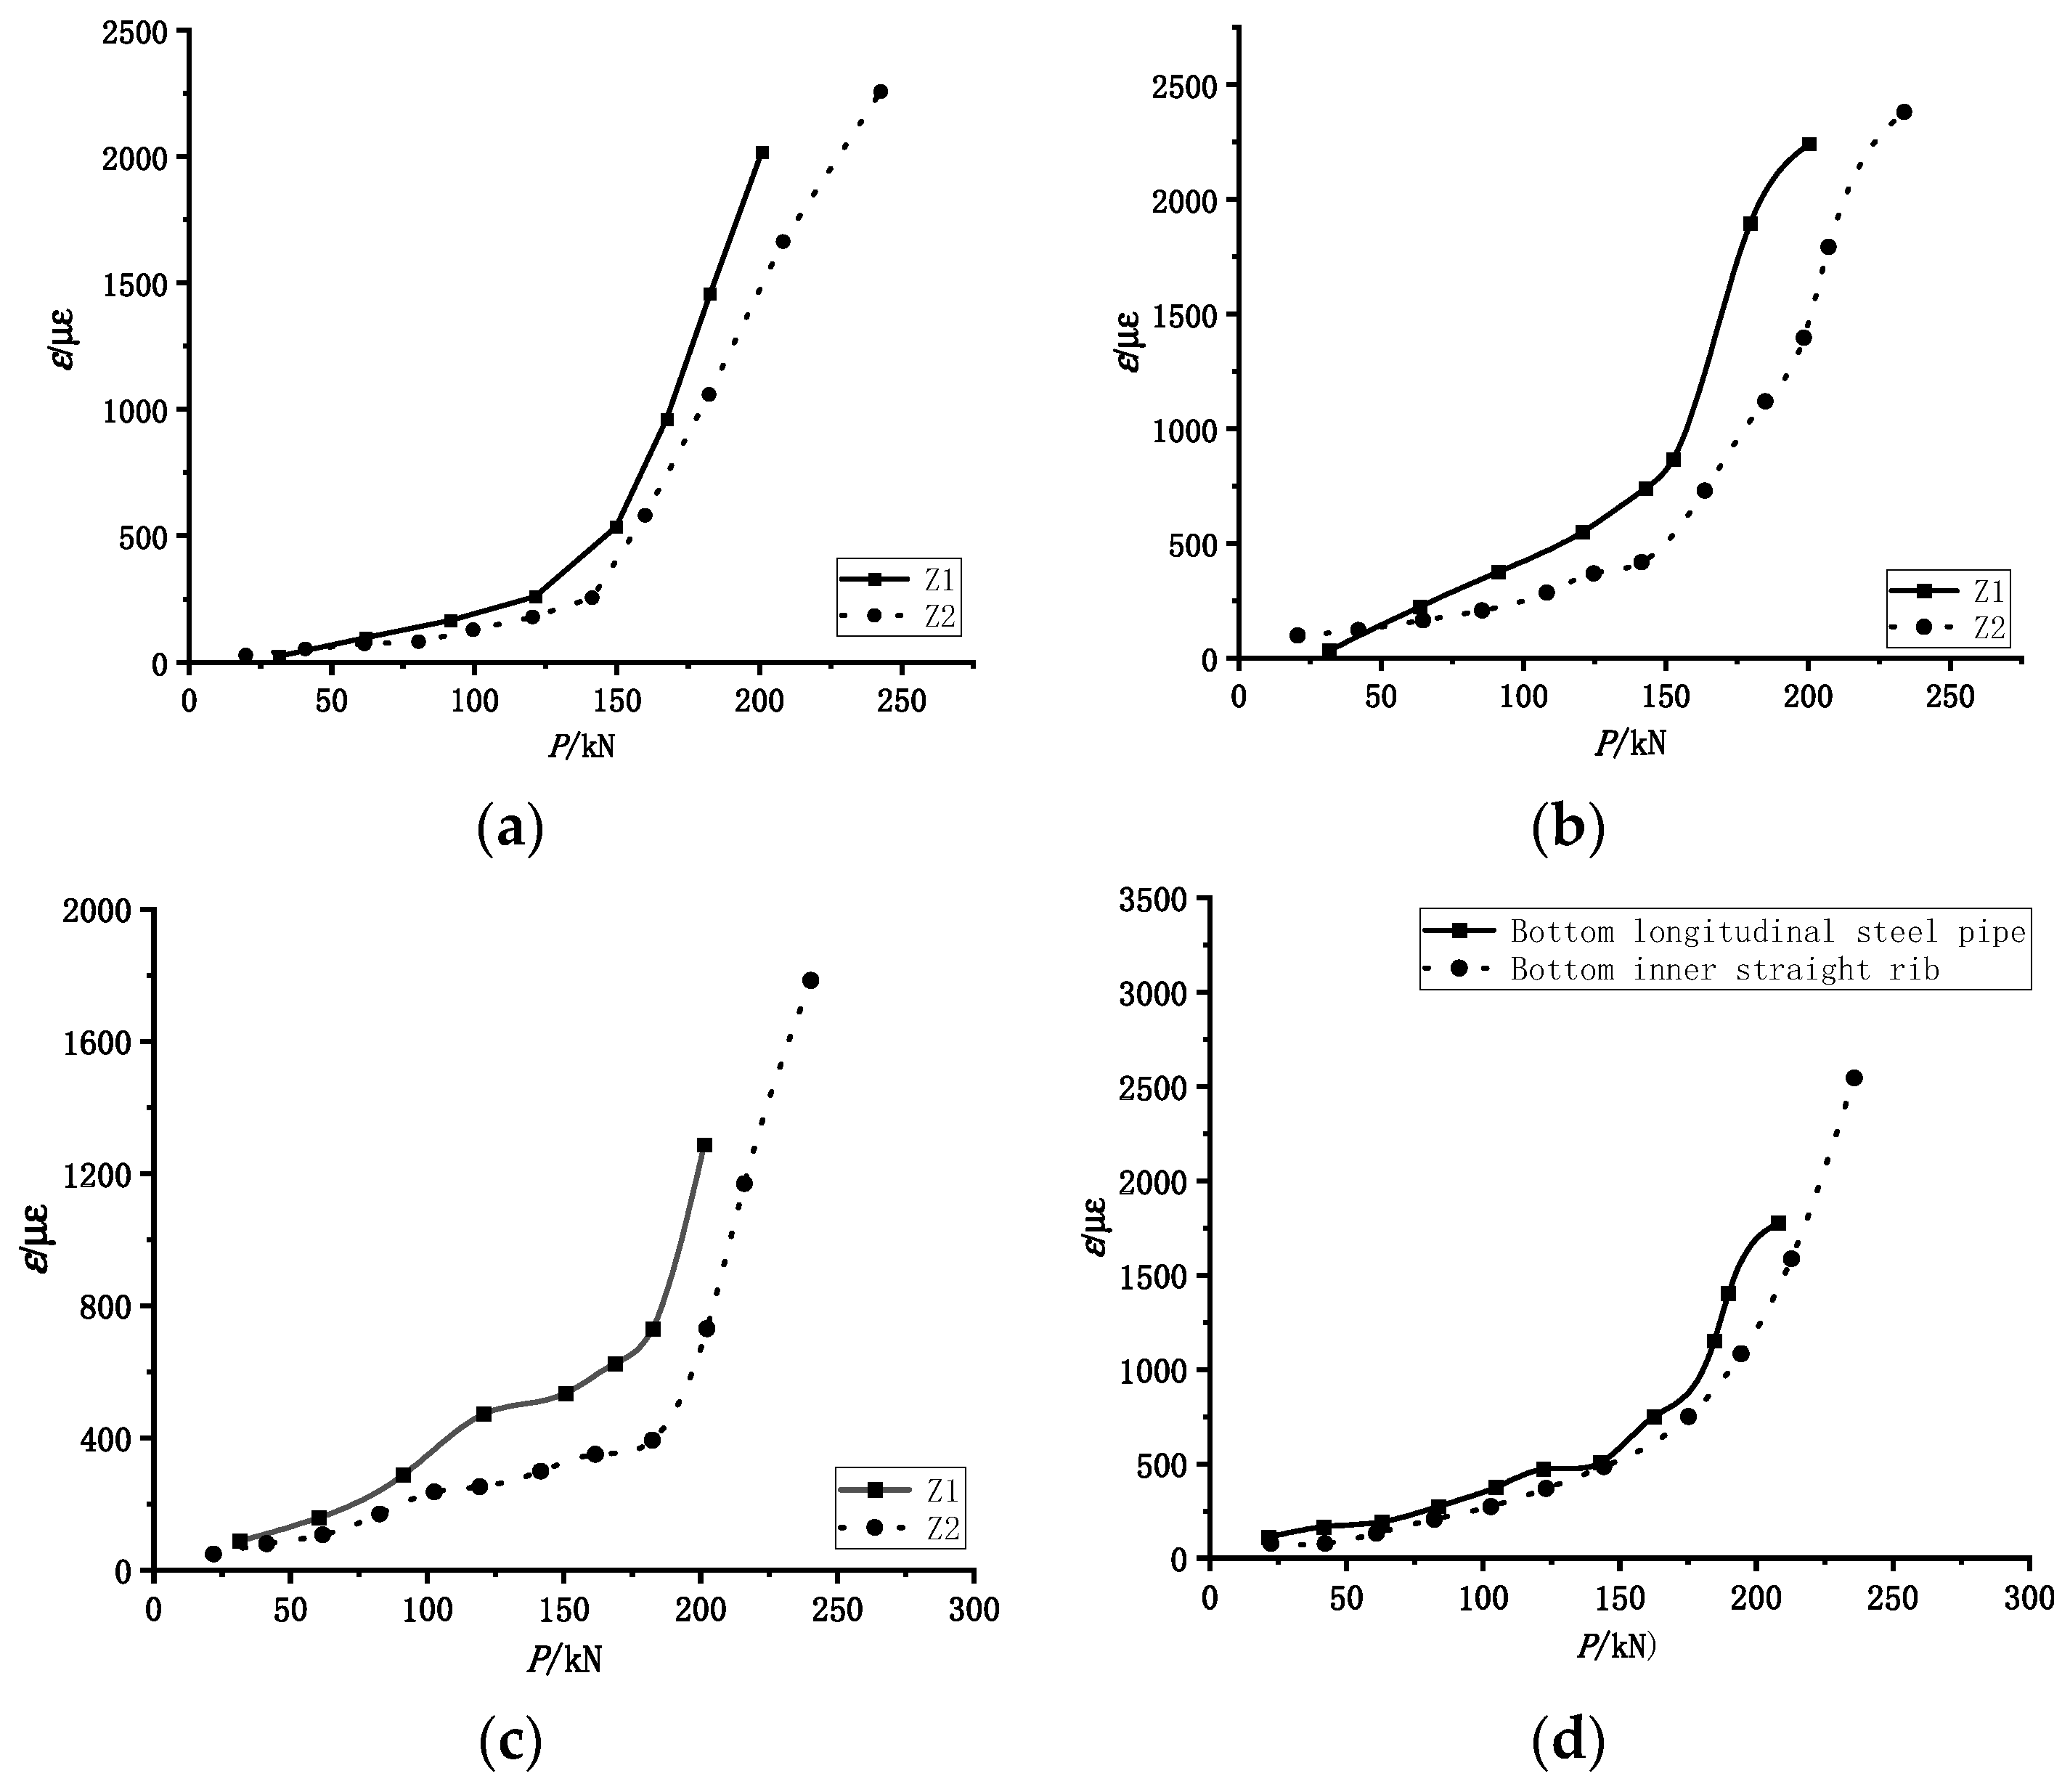
4.6. Strain Analysis

The variations in the load–strain curves for each component in Figure 11 show that before the yield load is reached, the strain exhibits an almost linear behavior. In the elastic–plastic stage, the strain growth rate increases, and the deviation in the strain for the straight-ribbed specimen remains minimal. Further, in this stage, the strains observed in the steel pipe and the stiffener indicate that these two components are essentially synchronized, indicating their excellent ability to work together.

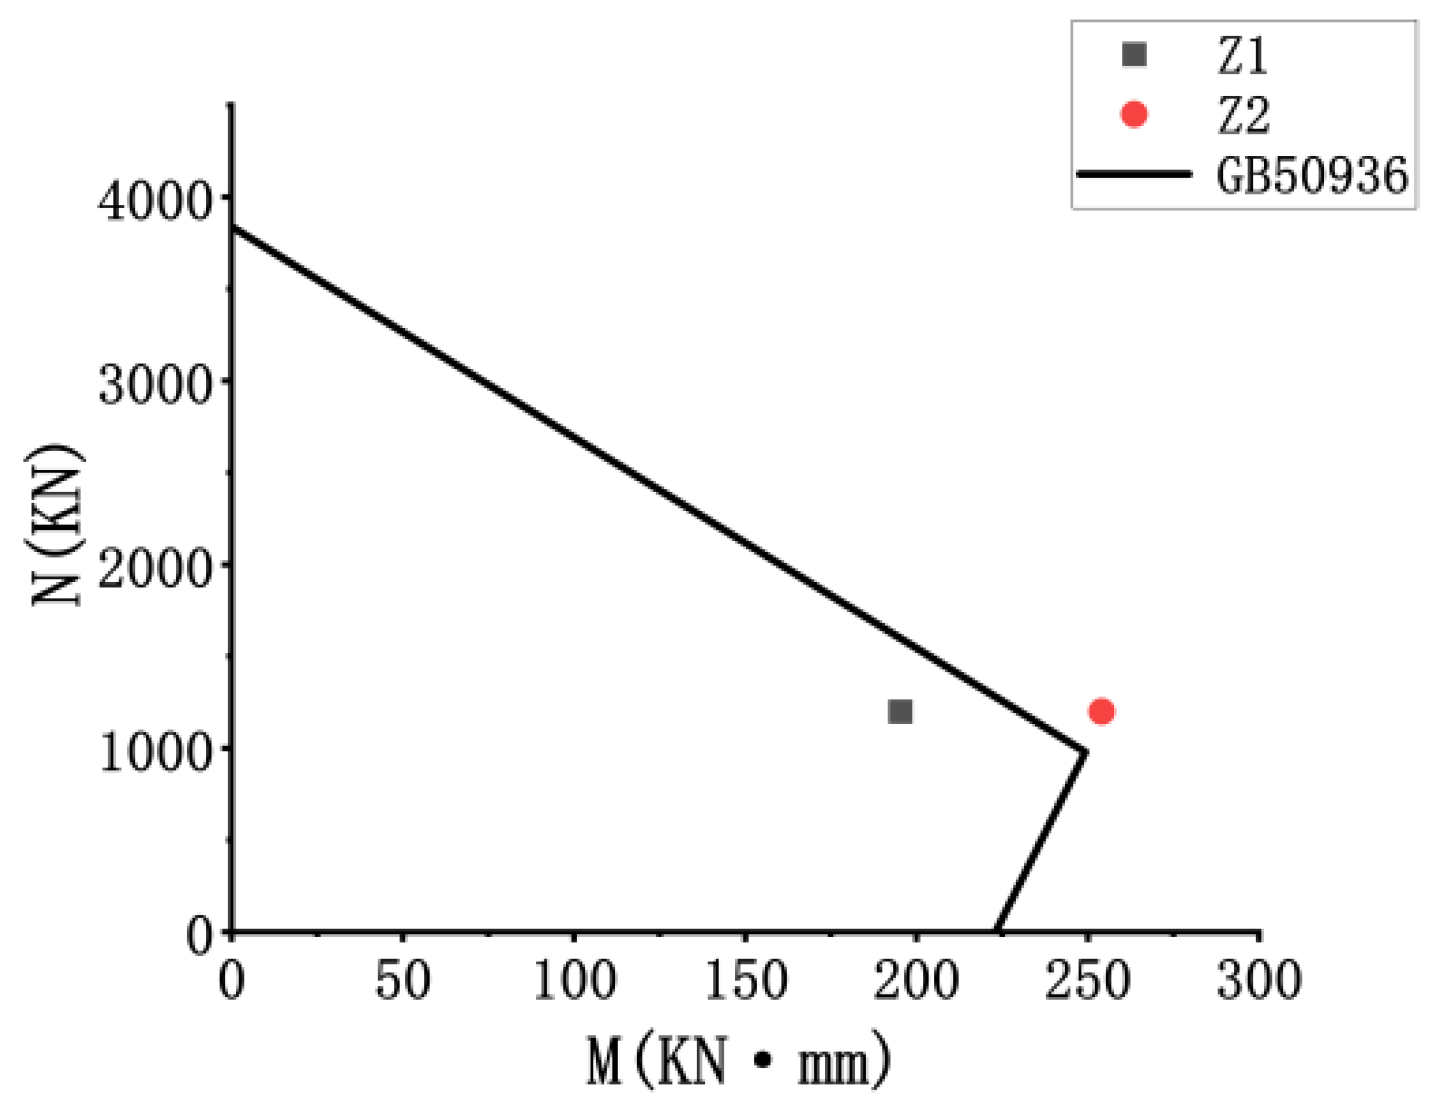
4.7. Analysis of Seismic Bearing Capacity and Performance

In China, research on straight-ribbed circular concrete-filled steel-tube columns with ultra-large diameter-to-thickness has been limited. Given that their mechanical properties closely resemble those of ordinary concrete-filled steel-tube columns, the primary references for calculating the load-bearing capacity of concrete-filled steel tubes as per China’s current technical standards are GB50936-2014 [15] (titled “Technical Code for Concrete Filled Steel Tubular Structures”) and DBJ/T 13-51-2010 [16] (titled “Technical Specifications for Concrete-Filled Steel Tube Structures”).
GB50936-2014 is based on Shan-tong Zhong’s unified theory of concrete-filled steel tubes. Concrete-filled steel tubes represent composite stress-bearing materials. With circular cross sections as the benchmark for components, a unified design standard for the bearing capacity is introduced. This standard is applicable when concrete-filled steel tube components are subjected to the combined influences of pressure, bending, and shear. The following equations are used for the calculations:
When:
N N u 0.255 1 V V u 2 ,
N N u + β m M 1.5 M u 1 0.4 N / N E + V V u 2 1 .
When:
N N u < 0.255 1 V V u 2 ,
N 2.17 N u + β m M M u 1 0.4 N / N E + V V u 2 1 ,
N E = π 2 E s c A s c 1.1 λ 2 .
Here, N, M, and V represent the actual axial force, bending moment, and horizontal shear force applied to the specimen, respectively, and Nu, Mu, and Vu denote the design values of axial pressure, bending capacity, and shear capacity of the steel pipe, respectively. Further, k signifies the equivalent bending moment coefficient, while Esc and Asc represent the elastic modulus and cross-sectional area of the concrete-filled steel tube member, respectively. All of these parameters are computed following the guidelines specified in GB-50936-2014.
The P- effect observed during the actual loading process of the concrete components becomes more pronounced with increased axial force and displacement (see Table 5). Therefore, the actual horizontal bearing capacity is calculated as follows:
P = M N H .
We calculated the horizontal bearing capacity values, as presented in Table 6. The table clearly shows that the results from the specification’s calculations tend to be slightly large, particularly for concrete column members with an ultra-large diameter-to-thickness ratio because the calculated values are excessively high. Furthermore, when assessing the compression bending capacity of the components using the NM correlation curve, the results are depicted in Figure 12. Under the same axial pressure, the flexural bearing capacity of typical specimens is lower than the values calculated as per the relevant standard (GB50936-2014). This observation suggests that the calculations based on this standard for the bending bearing capacity of circular steel-tube concrete columns with extremely large diameter-to-thickness ratios are inherently somewhat large. Thus, the effect of the thin walls of such components must be considered. We recommend that when performing standard calculations, the obtained results be multiplied by a reduction factor of 0.8. The outcomes of this adjustment are presented in Table 7. The ratios between the specimen test results and the calculation results are 1.232 and 1.630, respectively. This approach exhibits excellent applicability and ensures that the calculation results are reliable.

4.8. Establishment of Restoring Force Model

The restoring force model comprises skeleton curves and hysteresis rules, offering a simplified and convenient means of representing the restoring force characteristics of real components. The strength, stiffness, and other mechanical properties under reciprocating loads are integral elements in the elastic–plastic analysis of structures.

4.8.1. Skeleton Curve

As depicted in Figure 13, the three-fold line model, based on test results, provides a more accurate and simplified representation of the skeleton curve obtained in this experiment. This model consists of three segments: the elastic section (OA, OA′), the elastic–plastic section (AB, A′B′), and the descending section (BC, B′C′), as illustrated in the Figure 14. For ease of calculation, the experimental data were subjected to dimensionless processing, with the ordinate represented as P/Pm and the abscissa represented as / m , where Pm and m signify the peak load and the corresponding peak displacement, respectively. Regression analysis was conducted on the data points from all specimens at each stage, yielding equations for each segment of the three-fold line model. These equations are as follows:
O A :   P P m = 1.7913 m ,
A B :   P P m = 0.5504 m + 0.4496 ,
B C :   P P m = 0.2986 m + 1.2986 ,
O A : P P m = 1.8025 m ,
A B : P P m = 0.5018 m 0.4982 ,
B C : P P m = 0.3012 m 1.3012 .
Using the above formulas, we conducted a comparison between the experimental values obtained from the cyclic loading of the specimens and the calculated values derived from the simplified model, as illustrated in Figure 13. The figure shows that within the permissible range of theoretical calculation errors, the calculated values agree strongly with the experimental values. This observation validates the applicability of the dimensionless three-line skeleton curve model proposed in this study for calculating the skeleton curve of straight-ribbed circular steel-tube concrete columns with ultra-large diameter-to-thickness ratios.

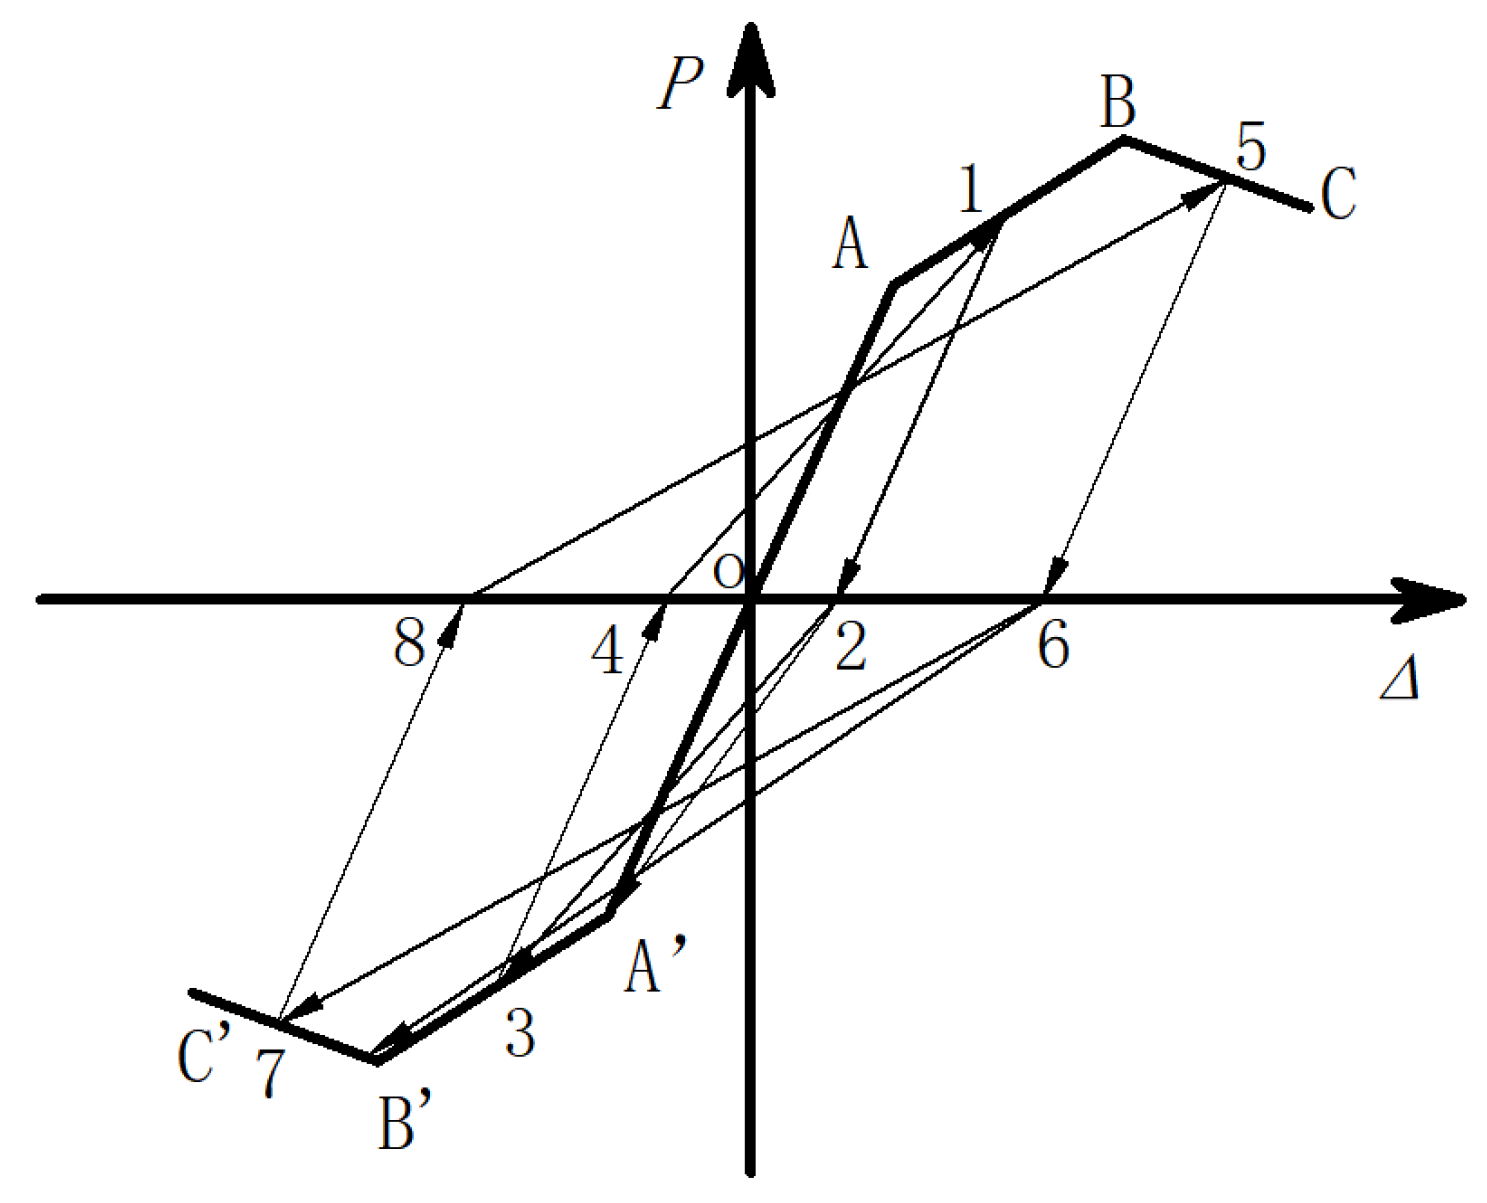
4.8.2. Hysteresis Rules

The restoring force model of the circular steel-tube concrete column with the ultra-large diameter-to-thickness ratio is illustrated in Figure 14, where the OA, AB, and BC segments represent the forward elastic segment, yielding segment, and failure segment. Similarly, OA′, A′B′, and B′C′ signify the reverse elastic segment, yielding segment, and destructive segment. The hysteresis rules are as follows:
(1) When the specimen is in an elastic state during the loading process, loading and unloading follow the straight line OA, OA′.
(2) When the specimen is loaded between the yield load (Point A, A′) and the peak load (Point B, B′) and when loading in the positive direction, loading is conducted along the AB path, while loading is conducted along the A′B′ path when performed in the negative (or reverse) direction. During the unloading process between points A and B, for example, starting from point 1, unloading first occurs in the positive direction along the path from point 1 to point 2, but after reaching point 2, loading begins in the reverse direction, i.e., loading occurs in the opposite direction. If the specimen does not yield in the negative direction, then the loading path is along segment 2–A′. However, if the specimen does yield in the negative direction, the loading path transitions to the upper-level loading point 3, and the loading path becomes segment 2–3. During the unloading in the negative direction in section A′B′, the path is segment 3–4. When loading resumes in the positive direction, it follows the path segment 4–1, resulting in a typical hysteresis loop of 4–1–2–3–4.
(3) After the peak load is reached, the specimen undergoes loading in the positive and negative directions of the coordinate axis, denoted as BC and B′C′, respectively. For loading to point 5 and unloading, the unloading path is along segments 5–6. Similarly, during reverse loading at point 6, if the peak load is not reached, the loading path is segment 6–B′. However, if the peak load is reached, it transitions to the upper loading point 7, and the loading path becomes segment 6–7. When unloading and forward loading follow, the path is 7–8–5, resulting in a typical hysteresis loop of 8–5–6–7–8.

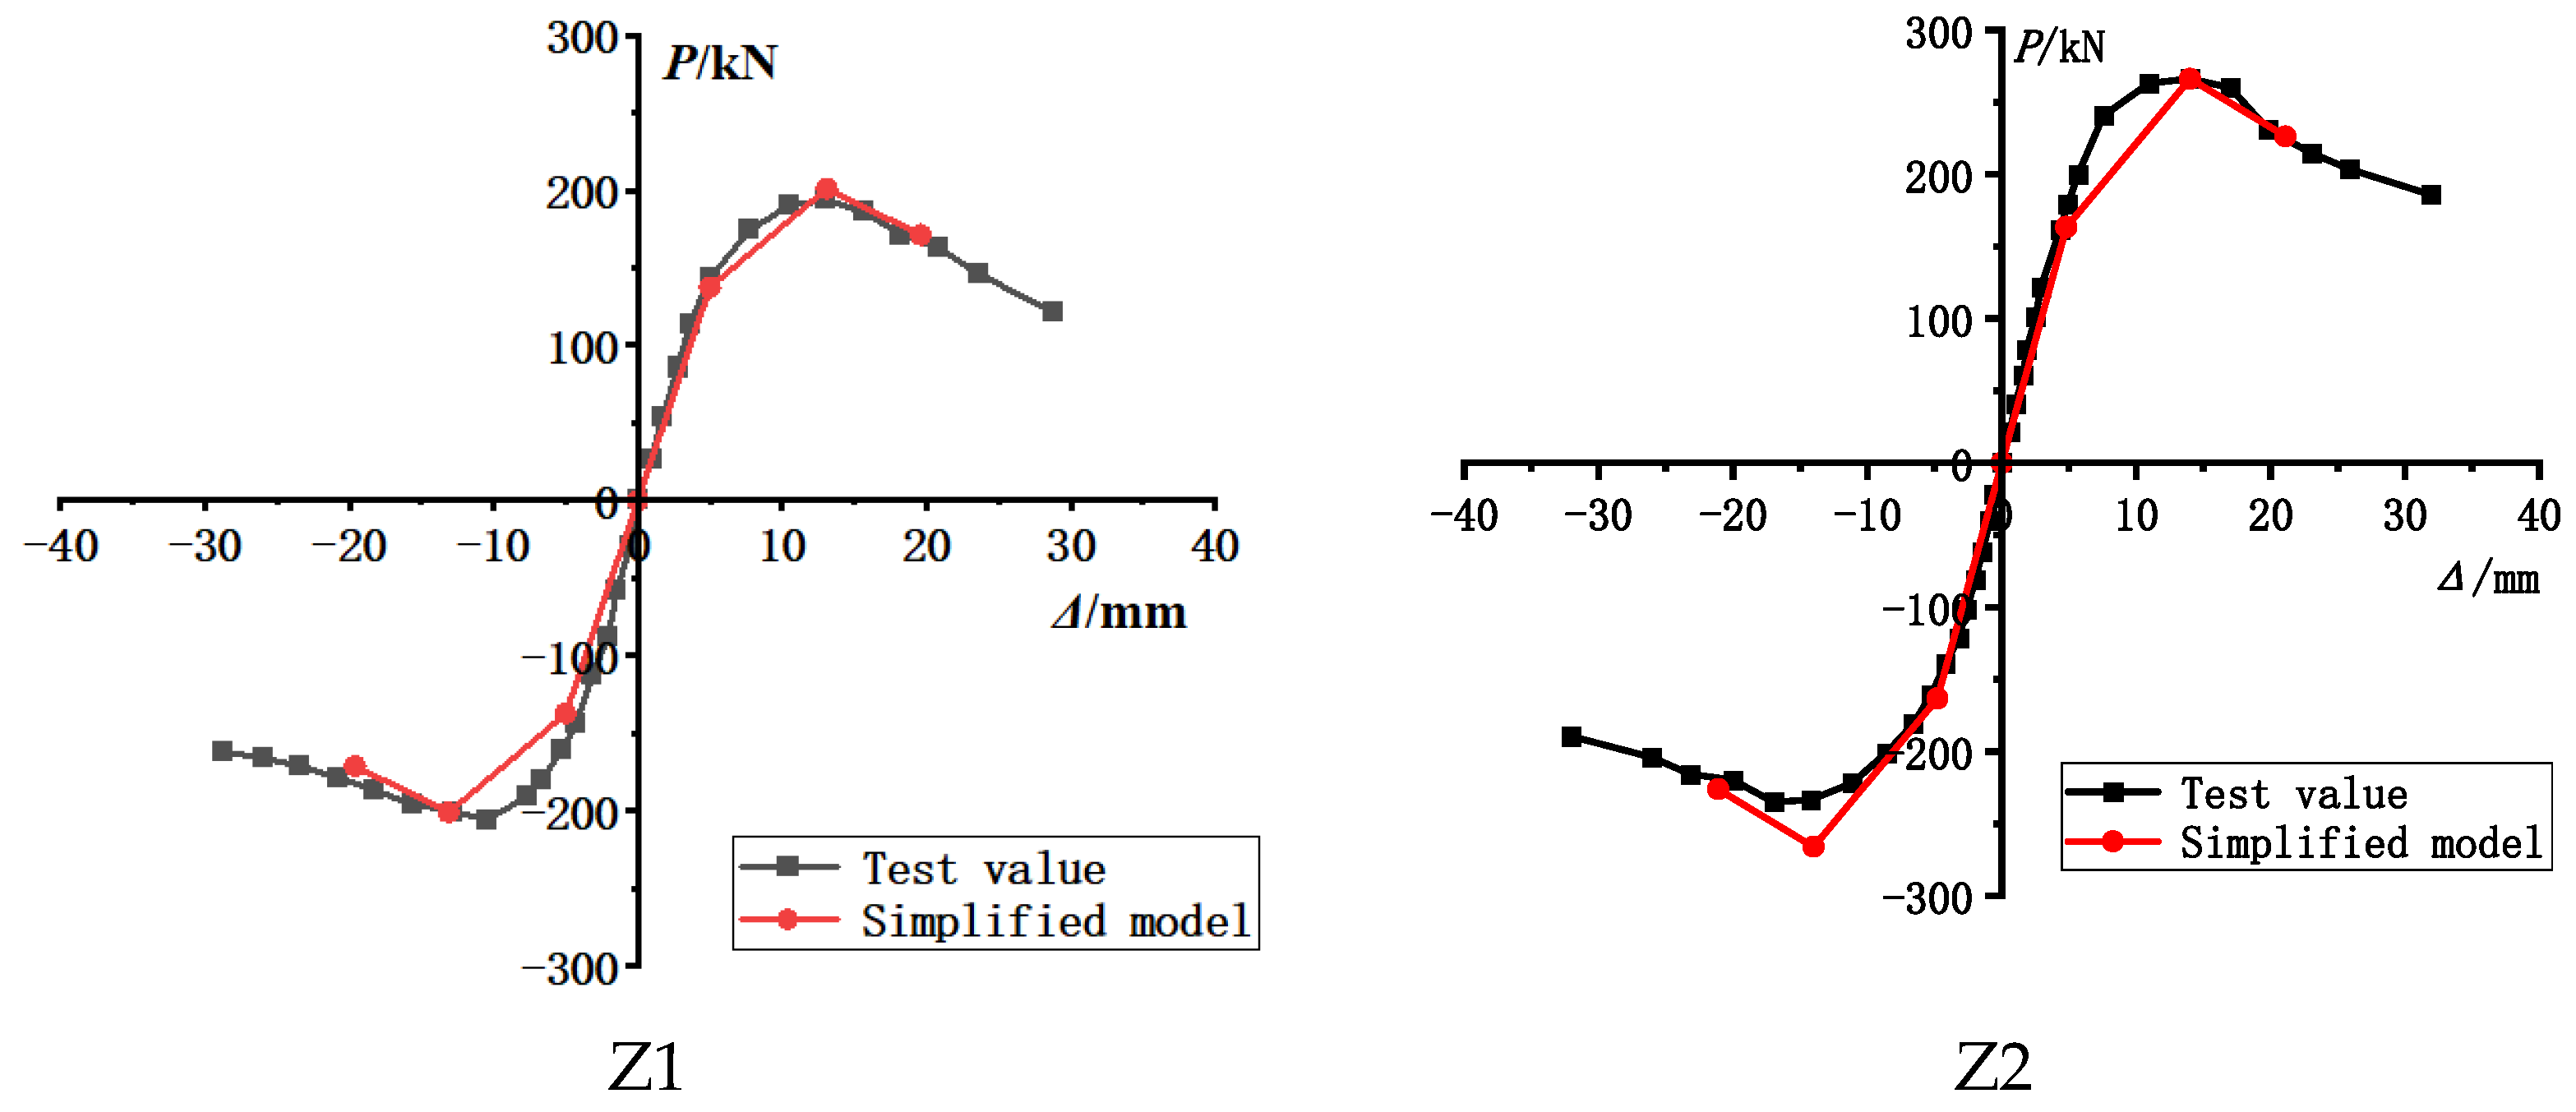
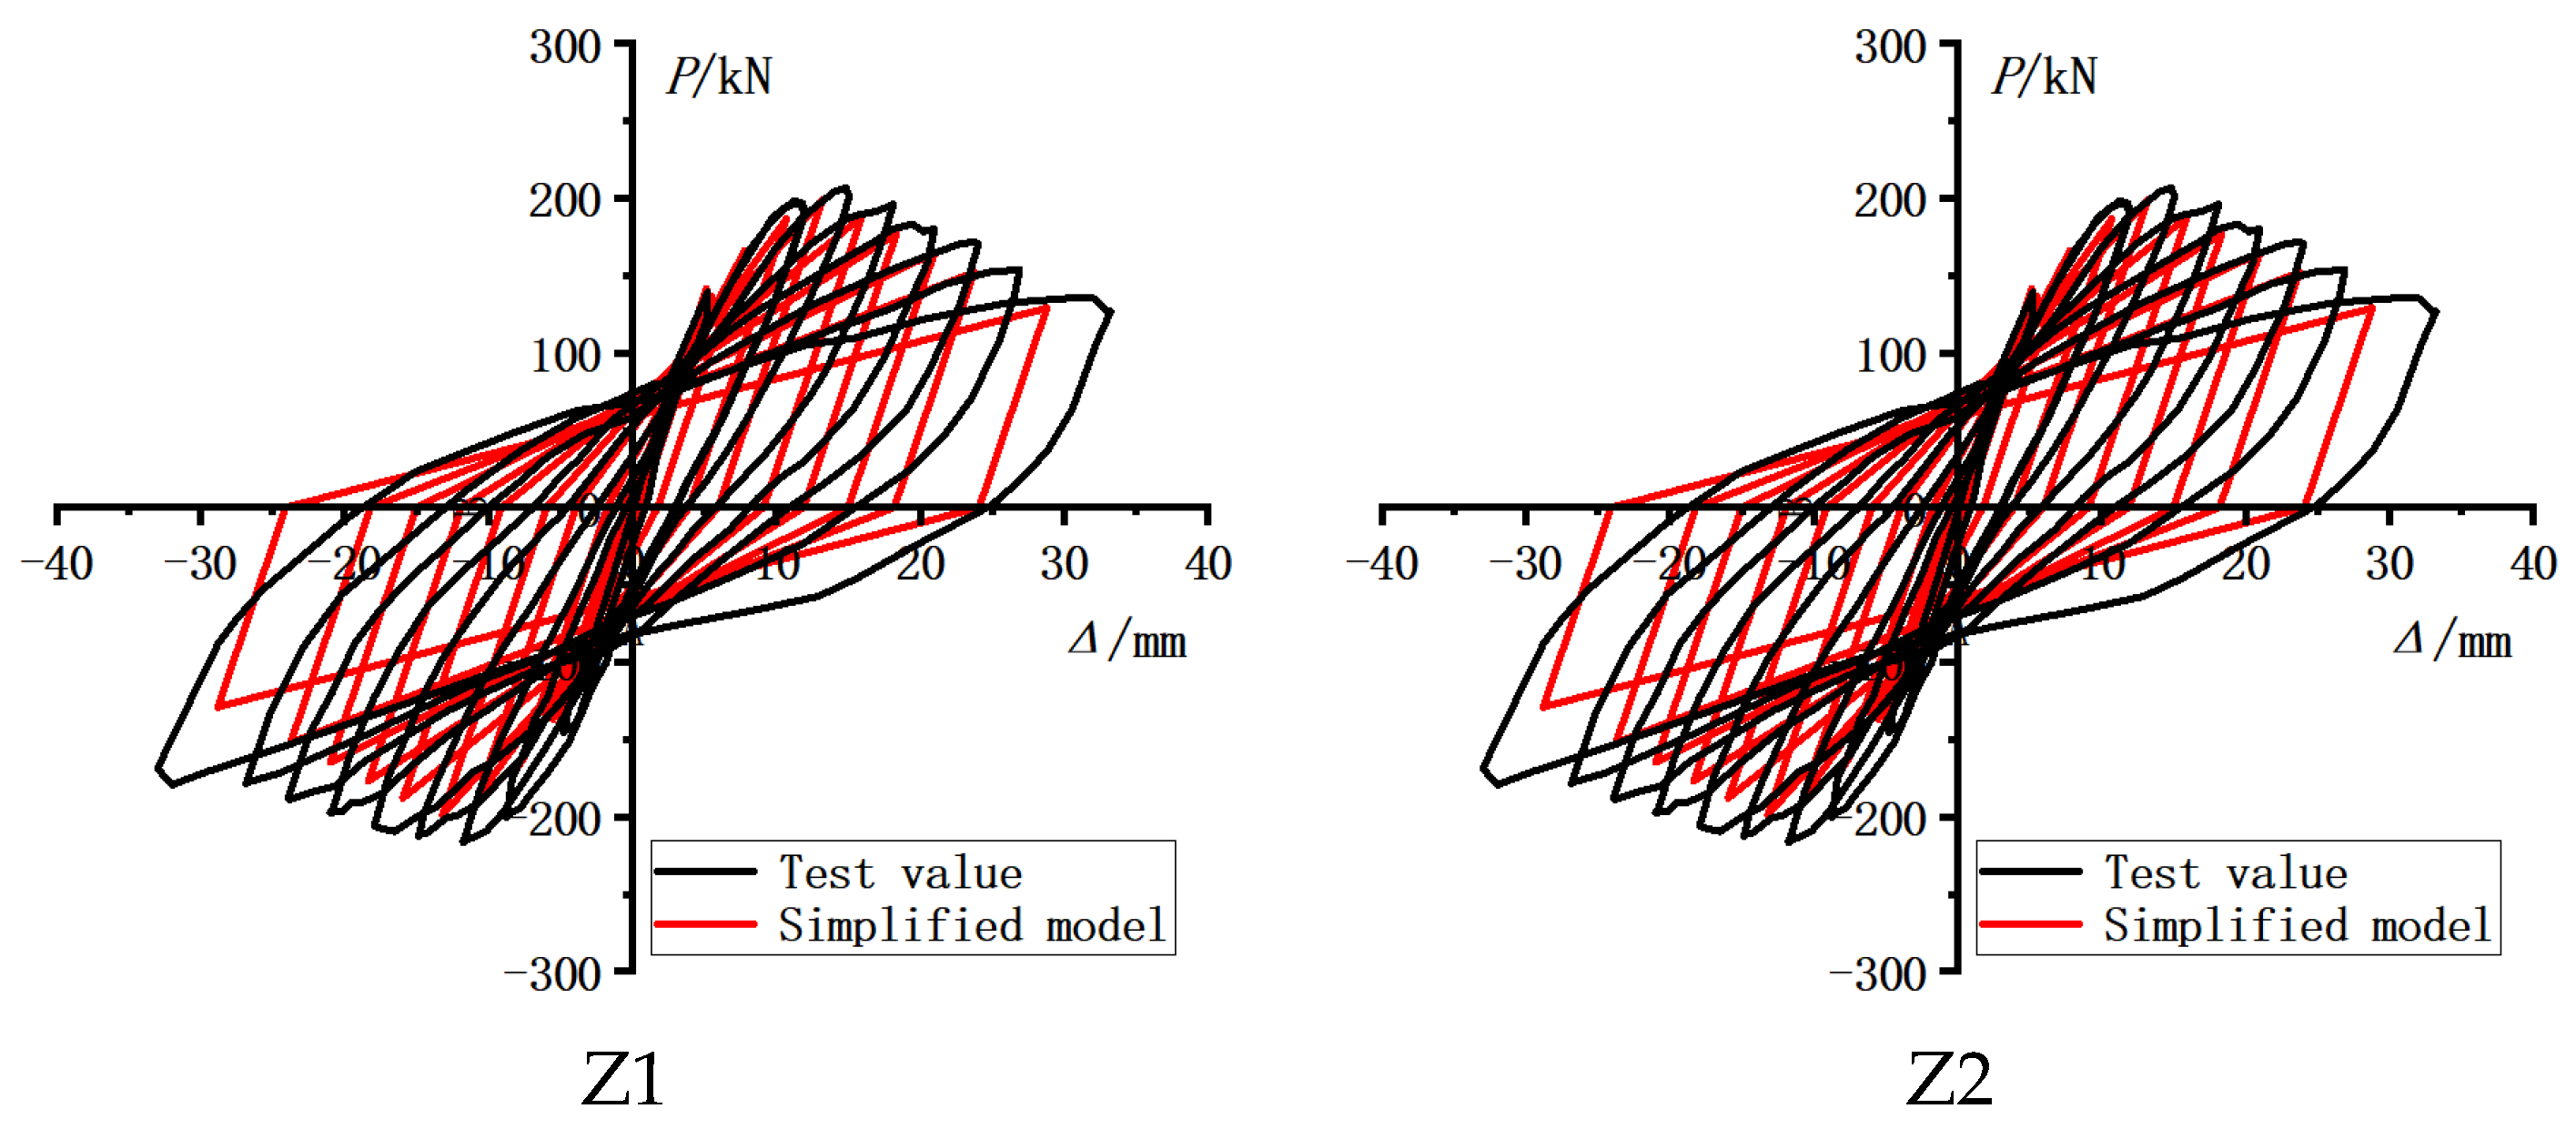
4.8.3. Comparison of Calculation Results with Test Results

Based on the hysteresis rules outlined above, we calculated the hysteresis curves of components Z1 and Z2 and compared these with the test results. As shown in Figure 15, the calculated values closely align with the test results. However, factors such as steel bar slippage and concrete damage can create some discrepancies between the calculation-results curve and the test-results curve. Nonetheless, in general, the results presented in this paper demonstrate that the restoring force model established herein enables the efficient prediction of the seismic performance of circular steel-tube concrete columns with ultra-large diameter-to-thickness ratios.

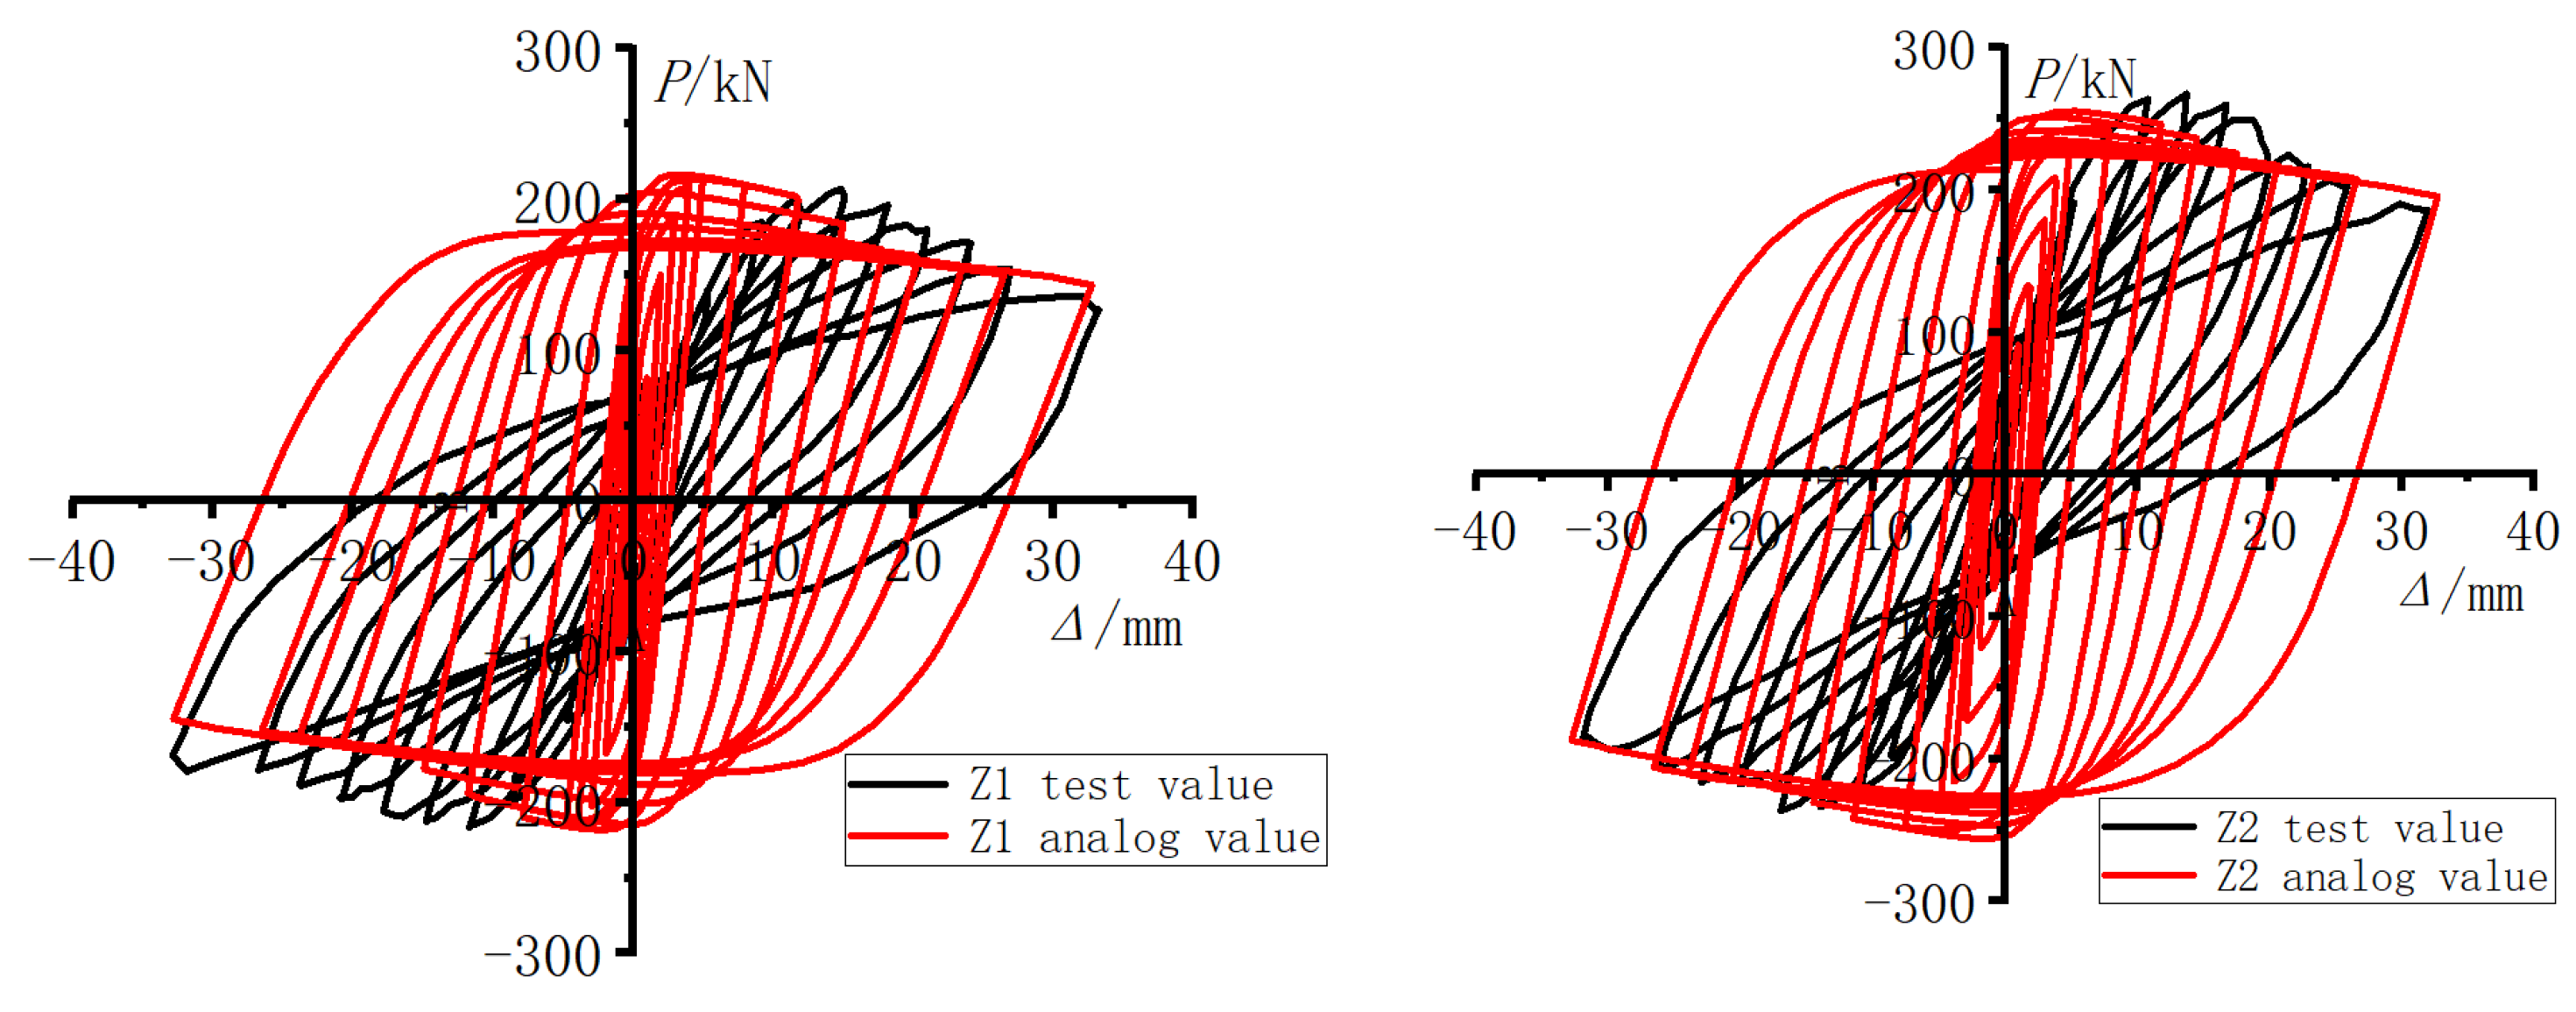
4.9. Finite Element Simulation Analysis

In order to conduct a comprehensive analysis of the seismic performance of such structural components, numerical simulations were performed using the ABAQUS 2022 software to confirm the reliability of the findings. Concrete was modeled by employing a plastic damage model [17], with the constitutive relationship adhering to the stress–strain relationship under compression, as depicted in Figure 16. Further, steel components were characterized using the three-line skeleton curve model proposed by Han [18], wherein the stress–strain curve comprised an elastic segment (oa) and a strengthening segment (ab), as depicted in Figure 17. In the model, the stiffness of the elastic segment was assigned the initial elastic modulus value of E = 2.01 × 10⁵ MPa, while the stiffness of the strengthening segment was set to 0.01 E, with a Poisson’s ratio of μ = 0.3. Notably, if the steel is unloaded before it enters the strengthening phase AB, the Bauschinger effect is not considered.
The numerical model established is illustrated as shown in Figure 18. In this model, the central concrete core is modeled using solid elements (C3D8R), while the steel tubes and stiffening ribs use the shell unit S4R, which considers large deformations, and the direction of the shell thickness employs Simpson integration with nine integration points. The interaction between the steel tubes and concrete involves both normal contact and tangential bond-slip. Normal contact is modeled as rigid, while a friction coefficient of 0.3 is applied to the tangential direction between the interfaces. The connection between the steel tubes and concrete involves surface-to-surface contact, with the stiffer concrete surface designated as the master surface and the lower-stiffness steel tube surface designated as the slave surface. Tied constraints are applied to the steel tubes and stiffening ribs, while the constraints between the end plate and stiffening ribs, as well as those between the end plate and steel tubes, are defined as shell-solid coupling constraints. The connection between the end plate and concrete is established as a tied connection, while the connection method used between the stiffening ribs and concrete is the built-in area connection method. The boundary conditions and loading regime of the model are meticulously defined to replicate the experimental loading conditions of the specimen.
The comparison between numerical simulation and experimental results is presented in Figure 19. The research findings indicate that the finite element simulation results of the concrete columns with straight ribs and steel tubes with an ultra-large diameter-to-thickness ratio generally agree with the experimental results, demonstrating good seismic energy dissipation. Moreover, the hysteresis loops show that the numerical-simulation hysteresis loop is fuller. This is mainly attributed to the idealized nature of the finite element model, which fails to fully consider practical factors such as slip and stress concentration at weld seams. In addition, due to concrete cracking during the experimental process, it is challenging to effectively simulate concrete cracking in the numerical calculations. The comparison of the skeleton curves is depicted in Figure 20, indicating that the numerical-simulation skeleton curves of specimens Z1 and Z2 exhibit good agreement with the experimental skeleton curves, with the basic shapes of the curves being consistent.
The characteristics of the skeleton curves loading indicate that the positive bearing capacity is higher, and during the initial loading stages, the specimen exhibits greater stiffness. This is primarily because during the initial loading stages, both the steel and concrete undergo elastic–plastic deformation, resulting in certain material damage. Consequently, when subjected to reverse loading, the load-bearing capacity decreases. Further, during the cyclic loading process, damage accumulates continuously, leading to a decrease in the load-bearing capacity under reverse loading. Overall, the finite element analysis results show a good agreement with the experimental results in terms of the bearing capacity, stiffness, and deformation characteristics of this novel composite component.

5. Conclusions

Based on the experimental study on the hysteric performance of both ordinary and straight-ribbed concrete-filled steel-tube columns with ultra-large diameter-to-thickness ratios, the following key conclusions can be drawn:
(1)
Destruction mode: When subjected to horizontal loads, ordinary and straight-ribbed thin-walled concrete-filled steel-tube columns exhibit similar failure modes, characterized by annular bulging along the bottom of the column. However, the stiffening ribs interrupt the bulging in the latter case. The main failure mode for both is bending failure.
(2)
Bearing capacity: The yield load of ordinary circular concrete-filled steel tubular columns with ultra-large diameter-to-thickness ratios is 140 kN, and the ultimate bearing capacity is 201 kN. After adding stiffening ribs, the yield load of thin-walled concrete-filled steel tube concrete columns increases to 160 kN, showing an increase of 14%. The ultimate bearing capacity is 266 kN, showing an increase of 31.7%, and this effect is notably significant.
(3)
Seismic performance: The ductility coefficient of circular concrete-filled steel tubular columns with ultra-large diameter-to-thickness ratios is 3.9. After adding stiffening ribs, the ductility coefficient of steel tube concrete columns reaches 4.4, showing an increase of 12.8%. In addition, the initial stiffness of the components increases by 20%. The bearing capacity safety margin and safety reserve of both components are roughly the same. However, the energy consumption capacity of the ribbed components exhibits a slight reduction. Overall, the addition of stiffening ribs helps to improve the seismic performance of these specimens.
(4)
Research recommendations: In the elastic–plastic stage, local buckling of the steel pipe occurs earlier. Therefore, seismic design should account for local buckling as the limit state for the bearing capacity, as at this point the pipe no longer meets its performance requirements. This approach aligns with the design concept of prioritizing resistance as the primary factor to be considered and energy dissipation as the secondary factor.
(5)
Resilience model: Through experimentation, relational expressions for each stage of the dimensionless three-fold line model were calculated. Consequently, a restoring force model suitable for circular steel-tube concrete columns with an ultra-large diameter-to-thickness ratio was established. The calculated results demonstrated good agreement with experimental values. In addition, for straight-ribbed circular steel tube concrete columns with a large diameter-to-thickness ratio, the thin-wall effect of such components needs to be considered. Applying a reduction factor of 0.8 to the calculated results is recommended when using theoretical specifications.

Author Contributions

Conceptualization, writing, and methodology, J.W. and B.H.; Review and editing, J.W. and Z.W.; Visualization and investigation, H.M.; Software and validation, B.H. All authors have read and agreed to the published version of the manuscript.

Funding

This research received no external funding.

Data Availability Statement

All publicly available datasets used for this study have been cited in the article. If there are undisclosed or restricted data, we will share them with researchers subject to relevant data protection and privacy regulations.

Conflicts of Interest

Author Hao Meng was employed by the company Jiangsu Grand Canyon Architectural Design Co., Ltd. The remaining authors declare that the research was conducted in the absence of any commercial or financial relationships that could be construed as a potential conflict of interest.

References

  1. Yuan, H.; Tang, Y.; Wu, Q. Quasi-static test research on seismic performance of steel bridge piers with thin-wall ribbed square cross section. J. Fuzhou Univ. Nat. Sci. Ed. 2016, 44, 459–464. [Google Scholar] [CrossRef]
  2. Yang, Y.; Wang, Y.; Zhang, S. Experimental research on seismic behavior of T-shaped concrete-filled steel tube columns with reinforcement stiffeners. J. Build. Struct. 2012, 33, 104–112. [Google Scholar]
  3. Gao, J.; Wu, Y.; Huo, J. Experimental study on the hysteretic behaviors of thin-walled corrugated concrete-filled steel tube column. World Earthq. Eng. 2012, 28, 34–42. [Google Scholar] [CrossRef]
  4. Ji, X.; Kang, H.; Chen, X.; Qian, J. Seismic behavior and strength capacity of steel tube-reinforced concrete composite columns. Earthq. Eng. Struct. Dyn. 2014, 43, 487–505. [Google Scholar] [CrossRef]
  5. Brown, N.K.; Kowalsky, M.J.; Nau, J.M. Impact of D/t on seismic behavior of reinforced concrete filled steel tubes. J. Constr. Steel Res. 2015, 107, 111–123. [Google Scholar] [CrossRef]
  6. Liao, X. Research on Seismic Behavior of Square CFST Columns with Binding Bars. Master’s Thesis, South China University of Technology, Guangzhou, China, 2015. [Google Scholar]
  7. Long, Y.; Cai, J.; Wang, Y.; Yang, C.; Chen, Q.; Zuo, Z. Experimental study on seismic behavior of rectangular concrete-filled steel tubular stub columns with binding bars. J. Build. Struct. 2016, 37, 133–141. [Google Scholar] [CrossRef]
  8. Luo, M. Study on the Buckling of Thin-walled Corrugated Concrete-Filled Tube Column. Master’s Thesis, East China Jiaotong University, Nanchang, China, 2013. [Google Scholar]
  9. Denavit, M.D.; Hajjar, J.F. Nonlinear seismic analysis of circular concrete-filled steel tube members and frames. J. Struct. Eng. 2012, 138, 1089–1098. [Google Scholar] [CrossRef]
  10. Goto, Y.; Mizuno, K.; Prosenjit Kumar, G. Nonlinear finite element analysis for cyclic behavior of thin-walled stiffened rectangular steel columns with in-filled concrete. J. Struct. Eng. 2012, 138, 571–584. [Google Scholar] [CrossRef]
  11. Patel, V.I.; Uy, B.; Prajwal, K.A.; Aslani, F. Confined concrete model of circular, elliptical and octagonal CFST short columns. Steel Compos. Struct. 2016, 22, 497–520. [Google Scholar] [CrossRef]
  12. Bai, Y.; Lin, X.; Mou, B. Numerical modeling on post-local buckling behavior of circular and square concrete-filled steel tubular beam columns. Int. J. Steel Struct. 2016, 16, 531–546. [Google Scholar] [CrossRef]
  13. Wei, J.; Ying, H.; Yang, Y.; Zhang, W.; Yuan, H.; Zhou, J. Seismic performance of concrete-filled steel tubular composite columns with ultra high performance concrete plates. J. Eng. Struct. 2023, 278, 115500. [Google Scholar] [CrossRef]
  14. Huang, H.; Yuan, Y.; Zhang, W.; Li, M. Seismic behavior of a replaceable artificial controllable plastic hinge for precast concrete beam-column joint. J. Eng. Struct. 2021, 245, 112848. [Google Scholar] [CrossRef]
  15. GB50936-2014; Technical Code for Concrete Filled Steel Tubular Structures. Ministry of Housing and Urban-Rural Development: Beijing, China, 2014.
  16. DBJ/T 13-51-2010; Technical Specifications for Concrete-Filled Steel Tube Structures. The Department of Housing and Urban-Rural Development of Fujian Province: Fuzhou, China, 2010.
  17. Liu, W. Research on Mechanism of Concrete-Filled Steel Tubes Subjected to Local Compression. Ph.D. Thesis, Fuzhou University, Fuzhou, China, 2006. [Google Scholar]
  18. Han, L. Concrete-Filled Steel Tubular Structures—Theory and Practice; Science Press: Beijing, China, 2007. [Google Scholar]
Figure 1. Different specimens. (a) Ordinary thin-walled steel-tube concrete column; (b) Straight-ribbed thin-walled steel-tube concrete column.
Buildings 14 02313 g001
Figure 2. Map of loading system.
Buildings 14 02313 g002
Figure 3. Loading device and site. (a) Load device; (b) Test site.
Buildings 14 02313 g003
Figure 4. Failure mode of Z1.
Buildings 14 02313 g004
Figure 5. Failure mode of Z2.
Buildings 14 02313 g005
Figure 6. General concrete−filled steel−tube columns.
Buildings 14 02313 g006
Figure 7. Straight-ribbed concrete−filled steel−tube columns.
Buildings 14 02313 g007
Figure 8. Skeleton curve comparison.
Buildings 14 02313 g008
Figure 9. Change in equivalent viscous damping coefficient. Z1 represents a common steel pipe and Z2 represents an inner straight rib steel pipe.
Buildings 14 02313 g009
Figure 10. Stiffness degradation curves. Z1 represents a common steel pipe and Z2 represents an inner straight rib steel pipe.
Buildings 14 02313 g010
Figure 11. Strain of each specimen. (a) Transverse strain at bottom of steel tube; (b) Longitudinal strain at bottom of steel tube; (c) Oblique strain at bottom of steel tube; (d) Steel tube and straight rib strain. Z1 represents a common steel pipe and Z2 represents an inner straight rib steel pipe.
Buildings 14 02313 g011
Figure 12. N–M correlation curve and experimental results.
Buildings 14 02313 g012
Figure 13. Calculated value of skeleton curve simplified model and experimental value.
Buildings 14 02313 g013
Figure 14. Hysteresis rules of restoring force model.
Buildings 14 02313 g014
Figure 15. Comparison of restoring force model and experimental hysteresis curves.
Buildings 14 02313 g015
Figure 16. Concrete constitutive model.
Buildings 14 02313 g016
Figure 17. Steel constitutive model.
Buildings 14 02313 g017
Figure 18. Finite element model.
Buildings 14 02313 g018
Figure 19. Hysteresis-curve comparison.
Buildings 14 02313 g019
Figure 20. Skeleton-curve comparison.
Buildings 14 02313 g020
Table 1. Parameter design for samples.
Test noStiffening FormSize
H × D (mm)
Stiffening
B × t/(mm)
Pipe Diameter
t/(mm)
Wall ThicknessD/t Ratio
Z1None1050 × 340None3401.5227
Z2straight rib1050 × 34050 × 33401.5227
Table 2. Concrete mix proportion (kg/m3).
Water-Cement RatioCementFly Ash
C300.38391.2123.9
SandStoneWaterWater reducer
7679871805.03
Table 3. Concrete material properties.
Strength Gradefcu,k/MPafck/MPafc/MPaEc (×104)/MPa
C3036.224.217.292.54
Note: fcu,k is the axial compressive strength of concrete cube.; fck is the standard value of axial compressive strength of concrete.; fc is the design value of compressive strength.; Ec is the elastic modulus of concrete.
Table 4. Mechanical properties of steel.
Typefy/MPafu/MPaE (×106)/MPaElongation
1.5 mm241.94361.852.0134.06
3.0 mm266.43404.352.0626.54
Note: E is elastic modulus; fy is yield strength; fu is tensile strength.
Table 5. Load and displacement eigenvalues.
SpecimenYield Load
Py/kN
Yield
Displacement
Δy/mm
Ultimate
Load
Pmax/kN
Ultimate
Displacement
Δmax/mm
Failure Load
Pu/kN
Failure
Displacement
Δu/mm
Carrying Capacity Margin
Pmax/Py
Safety
Reserve
Δu/Δmax
Z11405.020113.117119.61.441.50
Z21604.826614.022621.11.661.51
Table 6. Calculated and experimental results.
SpecimenDiameter
D/mm
Experimental Value
P/kN
Calculated Value
P/kN
Ratio
Z13402012040.958
Z23402662041.304
Table 7. Calculated results and experimental values.
SpecimenDiameter
D/mm
Experimental Value
P/kN
Calculated Value
P/kN
Ratio
Z1340201163.21.232
Z2340266163.21.630
Disclaimer/Publisher’s Note: The statements, opinions and data contained in all publications are solely those of the individual author(s) and contributor(s) and not of MDPI and/or the editor(s). MDPI and/or the editor(s) disclaim responsibility for any injury to people or property resulting from any ideas, methods, instructions or products referred to in the content.

