Article

Mitigating Making-Do Practices Using the Last Planner System and BIM: A System Dynamic Analysis

by
Mahmoud Karaz
1,*,
José Manuel Cardoso Teixeira
1 and
Tatiana Gondim do Amaral
2
1
The Centre for Territory, Environment and Construction (CTAC), Department of Civil Engineering, School of Engineering, University of Minho, 4800-058 Guimarães, Portugal
2
Environmental and Civil Engineering Department, Federal University of Goiás, Goiânia 74605-220, Brazil
*
Author to whom correspondence should be addressed.
Buildings 2024, 14(8), 2314; https://doi.org/10.3390/buildings14082314
Submission received: 20 May 2024 / Revised: 15 July 2024 / Accepted: 23 July 2024 / Published: 26 July 2024
(This article belongs to the Special Issue Construction Scheduling, Quality and Risk Management)

Abstract

:
Effective waste elimination is critical for the success of construction projects. Although several studies have focused on various aspects of construction waste, limited efforts have yet to investigate the dynamic effect of Making-Do (MD) practices on productivity, rework, defects, and material waste. From a lean construction perspective, this study aims to address MD waste using the Last Planner System (LPS) and BIM. First, the causal structure that can cause MD in construction projects was expressed in a causal loop diagram (CLD), and thematic analysis uncovered the strategies of LPS-BIM to eliminate MD identified by reviewing the literature. Secondly, twenty-five strategies from the LPS and BIM strategies to address MD using structural equation modeling (SEM) were assessed. Subsequently, a system dynamics model (SDM) for investigating LPS-BIM strategies on MD decisions in a construction project was formulated based on the underlying causal loop diagrams and the mathematical relations among the variables. Finally, the model was applied to three projects, and simulations for four LPS-BIM scenarios were carried out. The findings show that dynamic interactions among diverse production planning and control factors are critical in evaluating MD impacts on a construction project. The results demonstrate that the LPS-BIM approach resulted in an average 43.8% reduction in the tasks performed with MD, 45.3% of constraints, 66.5% of construction waste, an increasing 13.7% completion rate, and a 29.3% cost reduction, demonstrating that LPS-BIM is a more efficient solution for MD mitigation and construction planning. This study aims to guide construction planners and policymakers to better manage their production constraints by eliminating negative MD practices from their plans.

1. Introduction

The construction industry is a significant global waste generator that concerns many academic, regulatory, and professional agencies and policymakers worldwide. Construction waste is a high-level concept behind poor productivity and low innovation levels in the industry, and it is considered challenging to measure systematically [1]. Also, most developed policies are based on classic traditional management, rooted in economic theories that ignore how waste is internally produced and abstract the unit of time from the formula for modeling its generation [2]. Established methodologies and policies in planning and control functions primarily influence the push-production mindset in decision-making and reactive problem-solving. This approach often leads to a significant portion of non-value-added activities (NVAs). According to the meta-analysis of Horman and Kenley [3], NVAs constitute 49.6% of construction operations. Other evidence confirms that non-value-adding activities account for more than half of all activities in a construction project [4,5]. The literature has widely investigated different types of NVA according to the classification offered by Taichii Ohno [6], including rework [7], product defects [8], waiting [9], transportation [10], intuitional waste [11], and the relation between production waste and environmental waste [12,13,14]. This disparity in measuring and defining waste measures increases the difficulty of formulating holistic frameworks for waste elimination and hinders efforts to provide general guidelines for root cause analysis [15]. Additionally, many reported types of waste are measured empirically at an operational level or through professional experience, which challenges a comprehensive judgment on the nature of generated wastes, and their relationships with other types of waste remain context-specific and lack generalization.
Incorporating the best construction management theories and practices reduces construction waste [16]. Lean construction (LC) philosophy embraces waste as the central concept in its principles, methods, techniques, and tools; LC establishes a modern understanding of the construction processes, breaking them down into transformation, flow, and value, where the flow term is central in this philosophy and it expresses the construction processes through NVAs and value-added activities (VAs) [17]. A general definition of NVAs is any activity that absorbs resources (e.g., time, location, material, energy) without adding value to internal and external customers [18]. Based on the waste analysis by Taichii Ohno [6], a waste list can be used throughout organizations as a communication and guidance tool to categorize waste into overproduction, overprocessing, inventory, transportation, movement, waiting, and defects. This list has been widely studied and adapted within the construction industry [19]. In addition to this list, Lauri Koskela revealed the eighth type of waste in construction, “Making-Do”, in 2004. Making-Do (MD) waste is a core production waste resulting from initiating processes, operations, tasks, or assignments without acquiring a standard input of resources or proceeding with task execution [20,21]. MD is widespread across the construction supply chain (CSC) but is still not widely recognized in the literature [22]. Despite the inefficiency caused by MD within the construction industry, other sectors undervalue its importance [23], and few incentives aim to counteract the prevalent MD culture.
The previous research findings explored MD root causes to articulate mitigation strategies to limit negative impacts. The published research investigated MD identification, categorization, and quantification [21,24,25,26,27], production planning and control measures [16,20,28,29,30], quality management and control measures [23,31,32], information communication technologies [33,34], and social factor empowerment [35]. Despite the numerous benefits of these approaches to targeting MD, several challenges hinder their effectiveness and widespread adoption in the market. One significant factor contributing to this limitation is the lack of advanced production planning and control methods that enable various project stakeholders to plan and manage production efficiently [36]. In particular, inadequate coordination between construction site reality and planning directives has been identified as a significant obstacle, resulting in improper recognition and analysis of production constraints. The Last Planner System (LPS) aims to shield the downstream from upstream variability by utilizing socio-technical factors to plan the construction flow, enable pull production, and resolve constraints in formalized matters using the language of promises to communicate commitment actions [37]. Accounting for variability and uncertainties in cycle times, the LPS functions provide a methodological approach to limit the number of informal work packages and the number of improvisation actions without consensus among different teams in the project. Information communication technologies are recommended to manage production information and mitigate MD effectively. Building Information Modeling (BIM) can achieve this objective by enhancing information management for digitally built assets, improving visual controls for the production process and product data, and enabling feedback from various project teams [38]. Traditional project planning does not appropriately control construction processes. Mathematical models optimize construction plans without explicitly modeling dynamic phenomena and resource dependencies; heuristic methods targeting construction processes are less suitable for capturing time-dependent interactions between different project components.
Therefore, this study aims to predict the outcomes of construction planning and control processes from an MD perspective by better understanding the dynamic structure of MD practices within three construction projects with different planning skills and MD knowledge. The paper seeks to identify how different variations in the LPS and BIM parameters related to collaboration level and planners’ awareness and knowledge of MD practices can influence the MD outcome. The objectives of this study are (1) to identify the relationship between parameters of the LPS and BIM and evaluate the influence of their variations on MD mitigation in construction projects; (2) to assess the project teams’ awareness and knowledge of MD identification and mitigation during production planning and control; and (3) to provide recommendations for improving LPS-BIM practices to mitigate MD. A system dynamic model is developed to achieve these objectives, which portrays MD practices within a construction project. It depicts parameters relating to the level of collaboration, coordination, organization, and adaptation towards applying the LPS and BIM, BIM functionalities, and project type.
Moreover, the model identifies how different variations in LPS-BIM parameters influence emergent MD impacts. The developed model’s inputs were validated through data from two large construction projects and one rehabilitation project. Additionally, simulation experiments developed structural equation models and regression models that predict the results of MD practices. The main contribution of this study lies in guiding construction planners and policymakers to better manage their production constraints by eliminating negative MD practices from their plans.

2. Literature Review

2.1. Theoretical Understanding of Making-Do Waste

In addition to the seven production waste classifications of Taiichi Ohno [6], Lauri Koskela revealed the eighth type of waste, “Making-Do,” in construction in 2004. MD waste is defined as initiating processes, operations, tasks, or assignments without acquiring a standard input of resources or proceeding with task execution, although the availability of one of the optimal inputs has ceased [20,21]. MD is a widespread waste across the construction supply chain (CSC). However, MD is still not a widely recognized waste in the literature [22]. Fireman et al. recognized that the inefficiency caused by MD is brought about within the construction industry, and other sectors undervalue its importance [23]. However, few incentives aim to counteract the prevalent MD culture.
The foundation of the MD concept informed Koskela’s exploration through three pivotal works: (1) the complete kit concept [39], (2) the notion of task soundness [40], and (3) negative inputs for construction tasks [17]. According to Ronen’s concept of a complete kit, a complete kit refers to materials, components, engineering designs, documents, and information required to accomplish a given task, operation, or process [39].
However, Ronen’s principle is insufficient to reflect the complex construction workflow upstream [21]. This limitation arising from an oversimplified decision categorization is what Koskela (2004) believed to overlook binary choices that are not clearly expressed as dual options [20]. The breadth of input reaches beyond the traditional 4M (Management, Material, Method, Manpower) principles and fuses a multitude of factors. However, Koskela’s definition of MD is input-centered and does not include output dimensions, thereby not accounting for situations where tasks are intentionally left uncompleted based on preferring the best outcome [22]. Moreover, the behavioral aspects are not aligned with Koskela’s model. Pursuing “Good Enough” standards interfaces with production fluctuations, contributing to process irregularities.
While progress in a chain of waste studies is gaining momentum, most research remains entirely theoretical [41]. At the time of writing, no study has yet given a model of the actual chain of waste caused by MD. This gap impeded the study’s operational significance in practical applications. There are yet no direct assessments of MD practices, and their importance is mainly underestimated in different modeling methods, as these methods cannot reasonably capture all the key constituents and features of the MD’s complexity [20]. Nevertheless, the indirect evidence reveals its existence with the possible assumption that the source of the problem will often be held responsible differently as the upstream process management activities are neglected [21].
MD decisions reflect the underlying theoretical models of the conventional view of construction production, which comprises three models: (1) Managing as a Planning and Push Type of Production: This model posits that managing solely through planning tends to generate a push behavior, wherein tasks are pushed forward regardless of readiness or the availability of requisite resources. (2) Thermostat Model: According to this model, MD is employed as a strategy to prevent performance slippage, where the gap between standard and actual performance is minimized; it serves as an adjustment mechanism to maintain alignment. (3) Classical Communication: This model involves one-way communication during execution, where notifications to initiate a task occur without consideration for the resources at hand and without involving the knowledge of downstream players in the decision-making process.

2.2. Technical Understanding of Making-Do Waste

A failure to meet the minimum requirements for completing a task, operation, or process can lead to increased work in progress (WIP), lead time (LT), quality variation, defects, rework, process variability, a decline in productivity, additional production costs, material waste, excess movement and transportation, a decline in safety performance, and a decline in people’s motivation [21,23,26,31,39]. MD could be considered a core production waste that hinders productivity, distorts planning reliability and quality, causes poor quality and project delays, and incurs additional costs. MD is mainly generated through incorrect screening and analysis of project constraints and prerequisites for processes and operations. Crew leaders often make MD decisions even after the crew has committed to the weekly work plan, asking themselves if they must “wait” for input or “go” without input [29], influenced by uncertainties in economic, managerial, technical, and social factors, as shown in Figure 1. MD can have little innovative impact, leading to faster project progress, but most of this practice can lead to negative impacts that can hinder the overall project performance [20].

2.3. LPS-BIM Mitigation Strategies for MD Practices

It is essential to recognize that no project operates within an ideal environment. Even lean projects encounter unmet prerequisites [29]. MD is dispersed across the supply chain among clients, procurement, designers, prefabrication, and site [20]. It depends on its specific occurrence within a localized context [26] and constitutes a prominent form of waste that can and should be eradicated from cultural norms, operational processes, and current practices [28]. The published research investigated MD identification, categorization, and quantification, production planning and control measures, quality management and control measures, information communication technologies, and social empowerment.
The focus of planning and control requires methods such as the LPS to identify the minimum or essential conditions for execution and elaborate them among the project teams. Notably, the lookahead planning stage of the LPS has a central focus on collaborative constraints analysis, and the make-ready stage provides critical operational-level decisions made by the last planners, “crew leaders,” who are involved with work in progress and have direct contact with MD practices. A common understanding through informal dialogues (e.g., using action/language concepts [42]) and visual management functions is crucial to communicating MD practices throughout the project [28,43]. Embedded quality control within process planning and execution is a critical strategy to ensure the minimum risk of MD occurrence as a proactive and standardized approach [31]. MD analysis and mitigation strategies can generate enormous amounts of information, requiring dynamic spreadsheets integrated with other construction information systems [34]. The literature emphasizes the importance of a digital footprint to manage MD by utilizing an integrated LPS and BIM [44], which combines production processes and products collaboratively by harnessing BIM functionalities (e.g., 4D planning, visualization, parametric modeling, clash detection, and documentation) and embedding the LPS functions and principles.
The significance of the LPS and BIM is widely acknowledged in addressing the shortcomings of conventional methods for production planning and control [31,33,45]; however, the current policies lack validation. Accordingly, this paper assesses the stakeholders’ expectations about the LPS and BIM for MD mitigation strategies through a literature review, thematic analysis, and a qualitative data analysis technique (as listed in Figure 2).
The literature survey revealed eight principal groups of elimination strategies: “BIM-based collaboration for constraint analysis”, “medium-term and short-term MD analysis”, “enterprise learning and adaptation”, “improved documentation for MD cases”, and “dynamic reports for MD and constraint analytics”. Proper understanding and consideration of these factors are significant in addressing the stakeholders’ expectations regarding applying the LPS. Along with the expectations of relevant industry practitioners, an LPS-BIM framework for an MD mitigation policy was developed, including the technological and industrial needs for planning and control of production and MD mitigation.

2.4. System Dynamics Modeling

System Dynamic Modeling (SDM) is a strategic simulation methodology utilized to understand complex systems over time based on the concepts of system feedback loops and system thinking theory, coined by Forrester in the 1950s. Systems thinking is a holistic approach that aims to better understand complex systems by shifting the focus from addressing the symptoms of system problems to the internal system structure [46]. Systems consist of interacting events and their causes within system boundaries (forms, structures, or organizations), forming an interdependent element group that creates a unified pattern to function as a whole [47]. System modeling involves formulating assumptions and abstractions to depict real-world problems within a system, aiming to resolve them [48]. System modelers can operationalize theoretical constructs and apply dynamic hypotheses to pose “what-if” inquiries, assess potential benefits and risks, discern patterns, and scrutinize feasibility [49]. The simulation model is an executable model that develops a trajectory of the system’s state changes that are produced and observed as the dynamic model runs. Various forms comprise the simulation methods, including differential equations in SDM, state charts in agent-based modeling (ABM), and process flow charts and schedules in Discrete Event Simulation (DES) [50].

2.5. System Dynamics Applications in Lean Construction Research

SDM in the field of construction management research has diverse applications, including decision-making, policy analysis, performance assessment, rework and change management, scheduling and planning, risk and contingency planning, resource management, productivity enhancement, project control, cost estimation, bidding and procurement strategies, and health and safety considerations [51]. Furthermore, SDM has been widely used in research to investigate LC methodologies and techniques in the construction industry. For instance, SDM is used to investigate the intricate LC-BIM relationships among people during quantity surveying [52]. Nguyen and Sharmak used SDM to evaluate environmental performance, demonstrating how lean methods and techniques like the Last Planner System (LPS) and Poka-Yoke reduce processing time and CO2 emissions [53]. Meshref et al. proposed a decision-making framework based on SDM for managing construction material waste throughout the life cycles of industrial projects, integrating BIM and lean design into the design phase [54]. On the other hand, Omotayo et al. diagnosed kaizen costing and budgeting practices at early design stages for construction projects in Nigeria using SDM alongside the Analytical Hierarchy Process (AHP) [55].
Similarly, lean design processes in formwork workflows were validated by SDM, aiming to enhance formwork design efficiency through lean principles and BIM [56]. Regarding production planning and control, Cano and Rubiano developed a dynamic model to assess improvements in understanding non-value-adding waste within construction processes to enhance economic performance and behavioral aspects [57]. System dynamic modelers have also applied SDM to improve construction safety. Chinda (2009) evaluated effective lean policies for fostering safety-oriented cultures within construction projects using SDM to explore diverse scenarios involving manipulating personnel, leadership dynamics, partnerships, and resource allocation variables [58]. Collectively, these studies underscore the versatility and efficacy of SDM in investigating and enhancing various facets of lean construction practices within the construction industry.
This study adopts SDM to analyze and simulate MD practices within construction projects to describe the structural behavior of the production system when individuals use MD practices. It also examines how different strategies from the LPS and BIM can improve production system performance by mitigating MD and its negative impacts.

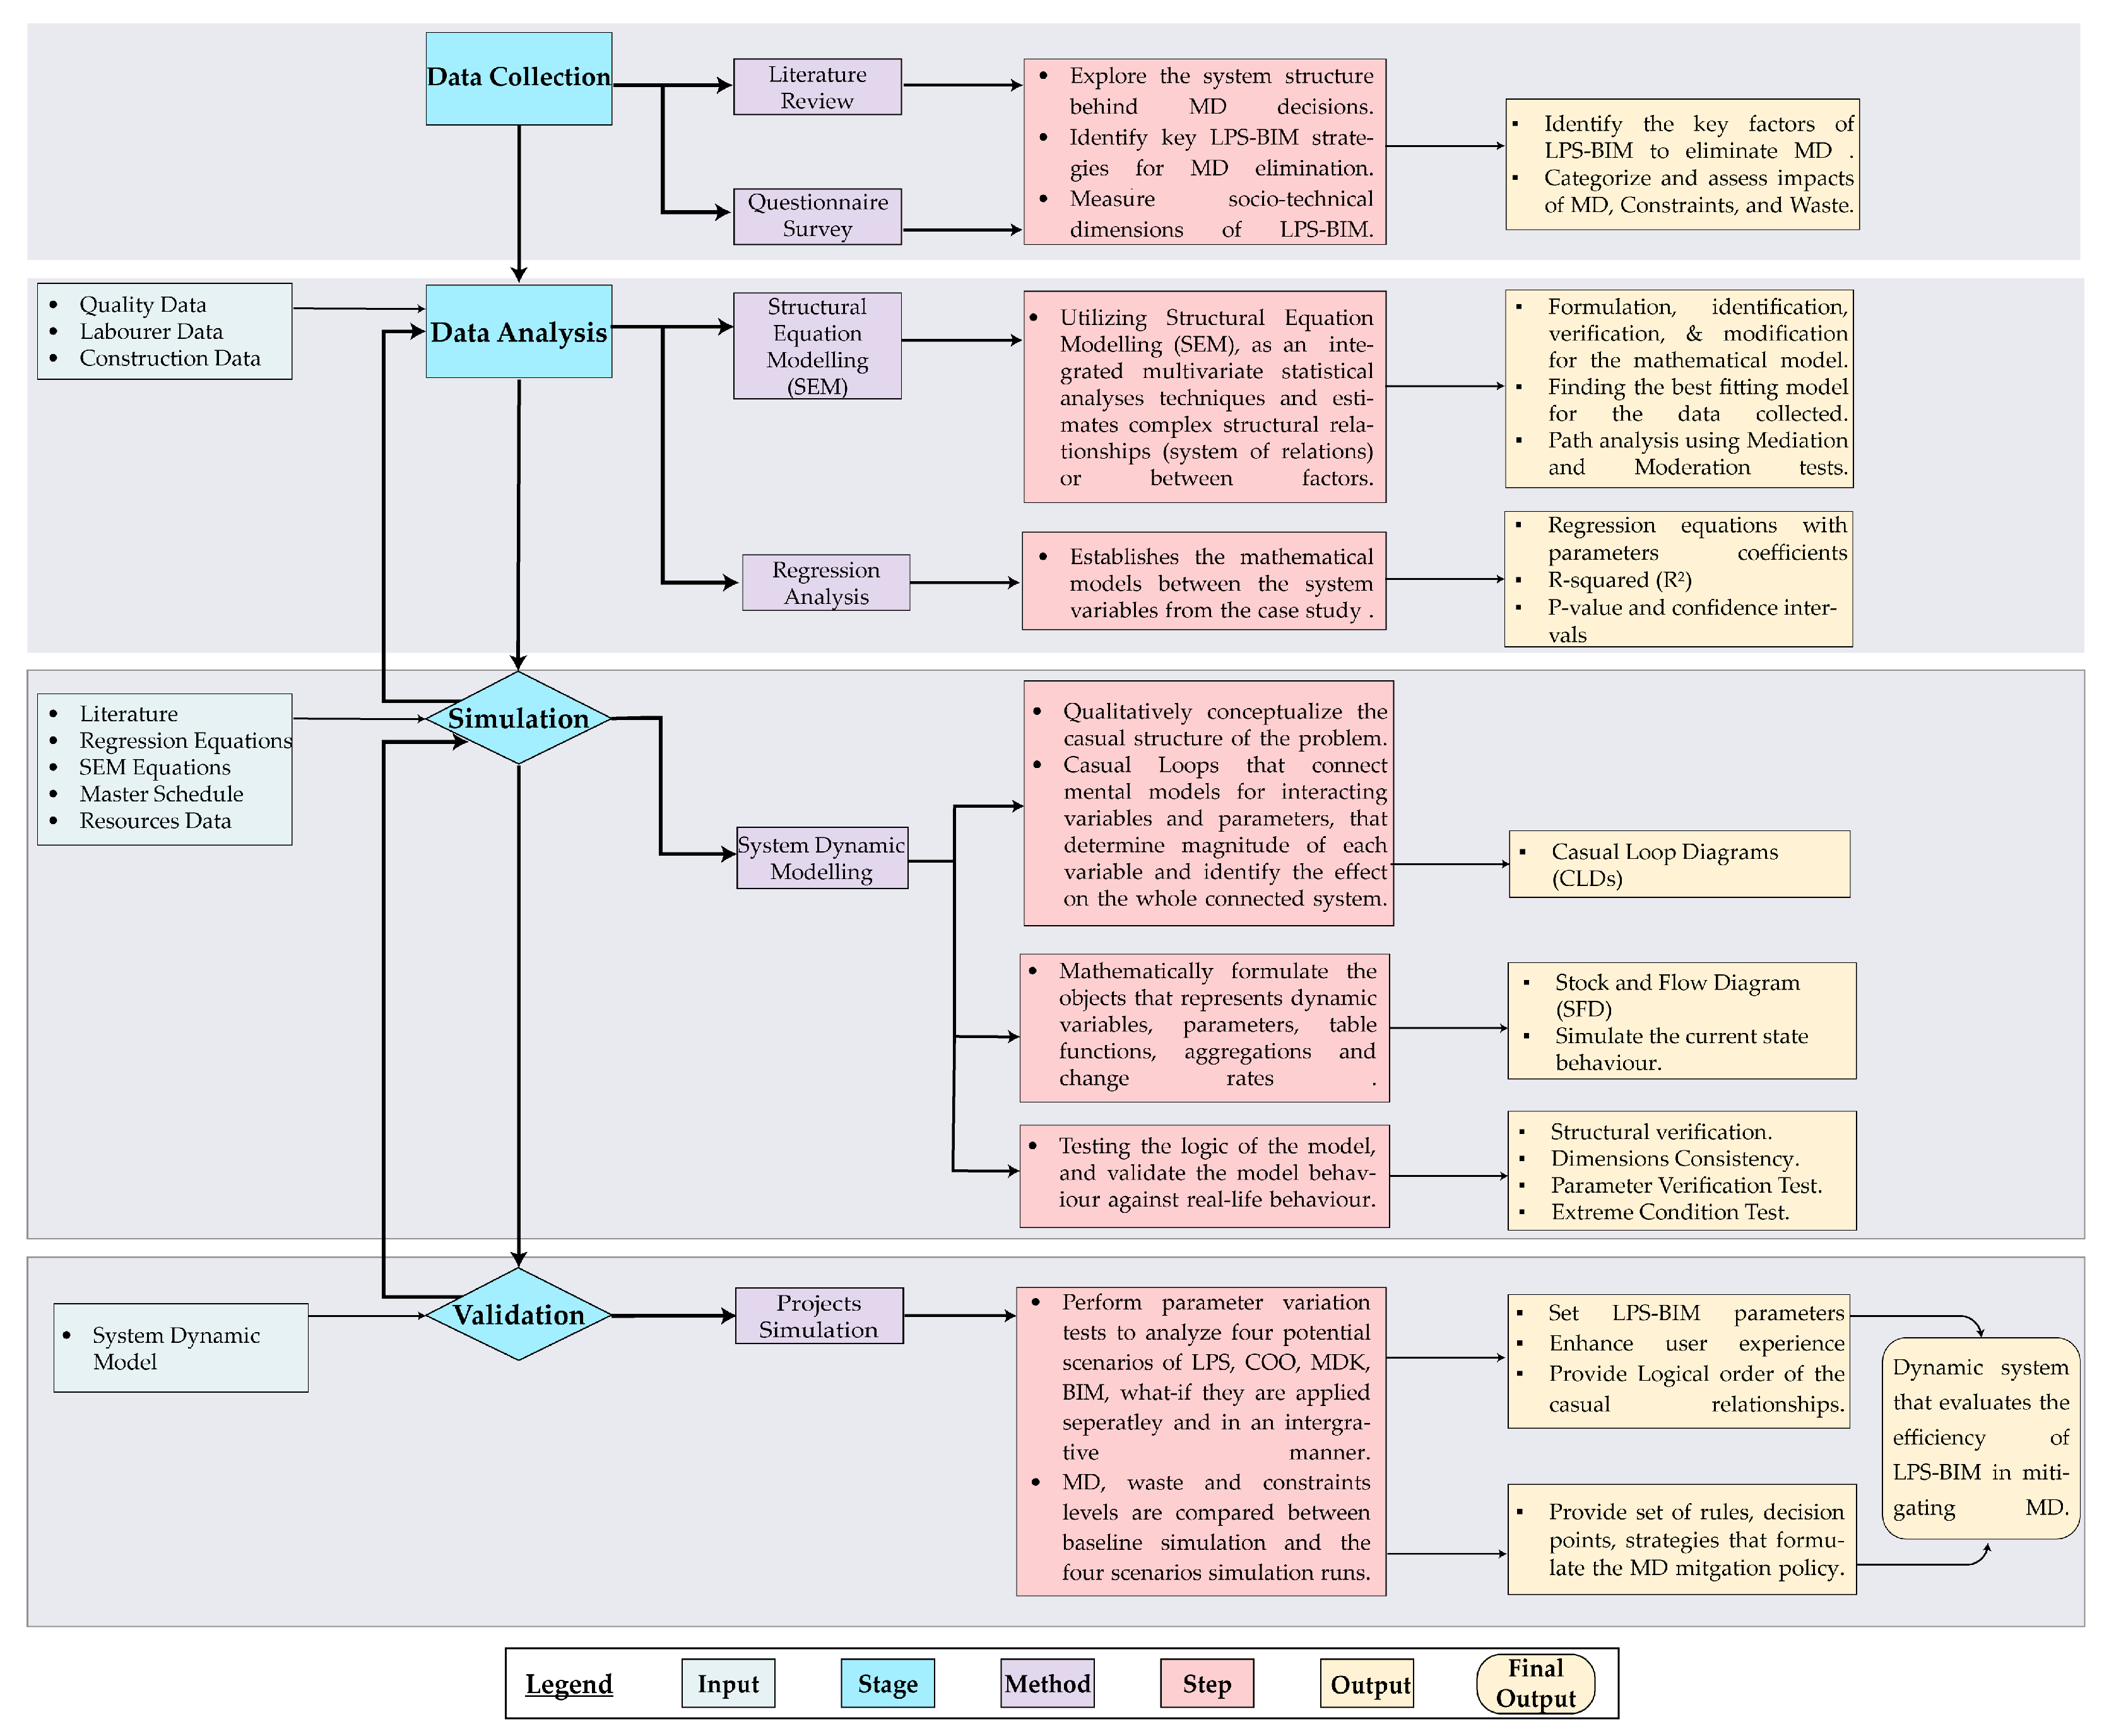
3. Materials and Methods

The methodology applied in this research is highlighted in Figure 3; this study implemented a rigorous research methodology purposely designed to provide a detailed analysis of the impact of the LPS in combination with BIM on the MD issues of the construction management domain. The methodology comprised four critical stages: (1) data collection, (2) data analysis, (3) simulation (testing the virtual environment), and (4) validation. The data collection stage is a combination of reviewing the literature and distributing the questionnaire survey to discover the systems of rules and the essential inclusion of LPS-BIM strategies for the elimination of MD. The data analysis stage sequentially utilizes advanced statistical techniques like AMOS’s structural equation modeling (SEM) and multiple regression analysis via SPSS to test internal consistency and generate mathematical models and relations between variables. After this stage, the SDM uses Anylogic to describe qualitatively causal structures and to formalize the behavior of dynamic variables and parameters mathematically.
The validation stage occurred via three project simulations. Various conditions were tested to illustrate scenarios that may cover the LPS, COO, MDK, and BIM and their impacts on completion rate, additional cost, number of infected tasks with unresolved constraints, MD categories, and waste caused by MD. Figure 3 visualizes the core processes, methods, tasks, and outputs included in this holistic methodological research approach, thus providing a setting for implementing the given study and the analysis being performed.

3.1. Data Collection for LPS-BIM (Questionnaire Survey)

After a review of the extant literature, an objective methodology is needed, such as a questionnaire survey, for developing a framework that realizes system dynamic analysis [44]. The questionnaire survey commenced with a pilot study employing a preliminary questionnaire containing a compiled list of twenty-five LPS and BIM strategies for MD mitigation. This initial phase assessed the questionnaire’s relevance, length, complexity, and layout. Participants in the pilot study were selected from two Portuguese universities and comprised PhD students specializing in construction management and BIM research. Feedback from the pilot study participants was instrumental in refining the final questionnaire. The final questionnaire survey had five sections: purpose of study, MD definition in Section 1, demographic information in Section 2, BIM and lean construction training in Section 3, MD terminology knowledge in Section 4, and LPS and BIM strategies for MD mitigation in Section 5, rated on a Likert scale ranging from 1 (not important) to 5 (most important).
The questionnaire was then developed into a web-based form (Google Forms) to encourage completion and reduce potential errors to aid data analysis [59]. After searching for construction management practitioners in the LinkedIn database [60], 336 respondents were randomly selected for the survey. Table 1 shows the demographic distribution of the respondents. The survey’s response rate was 35.12%, indicating that only one hundred and eighteen (118) completed questionnaires were fully submitted. As part of the data inspection process, returned questionnaires deemed invalid were eliminated: two of the submitted questionnaires were incomplete, those with identical or regular answers, and those that did not adhere to the rules of the questionnaire. Thus, only 116 usable responses were found for analyses (34.52%). Rigorous screening and verification of the questionnaire’s quality ensured the questionnaire was effective and possessed high reference and analytical value. The survey questions were structured using three answering methods: singular and multiple selective methods and rating scales. The imputation technique, which can be used to resolve 20–30% of missing data, was used to remedy missing data with the software package estimate [61]. The missing values were replaced with the series mean of the indicator. Table 1 describes the respondents’ profiles. The distribution of respondents’ years of professional experience exhibits a relatively uniform pattern.

3.2. Structural Equation Modeling

Structural Equation Modeling (SEM) is a statistical tool that examines complex variable interconnections by confirming hypotheses. SEM incorporates theories like psychometrics and regression theory to estimate unobserved factors through maximum likelihood estimation [62]. It distinguishes itself from traditional analysis by including error estimation. Two key models, measurement and structural, are developed in SEM [61]. The measurement model tests factor correlations, while the structural model explores causal paths through latent variables [63]. SEM offers flexible assessments of measurement errors and simultaneous relationship testing. This paper examines relationships among latent constructs: LPS functions, collaboration, Making-Do knowledge, and BIM functionalities to understand their impact on Making-Do practices using SEM.

3.3. System Dynamic Modeling (SDM)

The SDM simulation method includes system feedback loops and system thinking theory to study system change. SDM aims to manage the system’s internal structure instead of acting on the symptoms. SDM is the process of making assumptions and providing abstracts on the actual problem situations to estimate possibilities to gain some profit or suffer some loss. The process of SDM consists of four phases: dynamic hypothesis conceptualization, model construction, model validation and verification, and application [64]. The first phase is problem formulation and system conceptualization. This qualitative phase produces a causal loop diagram (CLD). The second phase, “the model construction”, uses a stock and flow diagram (SFD), a mathematical model that defines the boundary conditions and rules that constitute dynamic behavior. SFD simulations produce visual representations of accumulations and change rates over time. In the third phase, “model validation and verification”, model validation is critical in comparing the model against reality and similar models performed for the same problem under investigation. Validation should end with accepting or refusing the formulated hypothesis at the first step of SDM. The final stage concerns the application of SDM, which introduces new policies, strategies, rules, and critical decision points to the real-world system. Three tests are applied in this paper: model stability [65], model unit consistency [66], and parameter variation tests [67].
Anylogic© is used in this research as a simulation software package because it is a reasonably flexible simulation tool that provides options that are not available in other similar tools, including automatic checking of errors, Java code integration, and cloud services. Other ones are general, interactive, sensitivity, optimization, and Monte Carlo prediction numeric solvers. Most importantly, Anylogic allows the multimethod simulation to upscale to strategic, tactical, and operational analysis levels of planning [54].

4. Results

4.1. Data Analysis

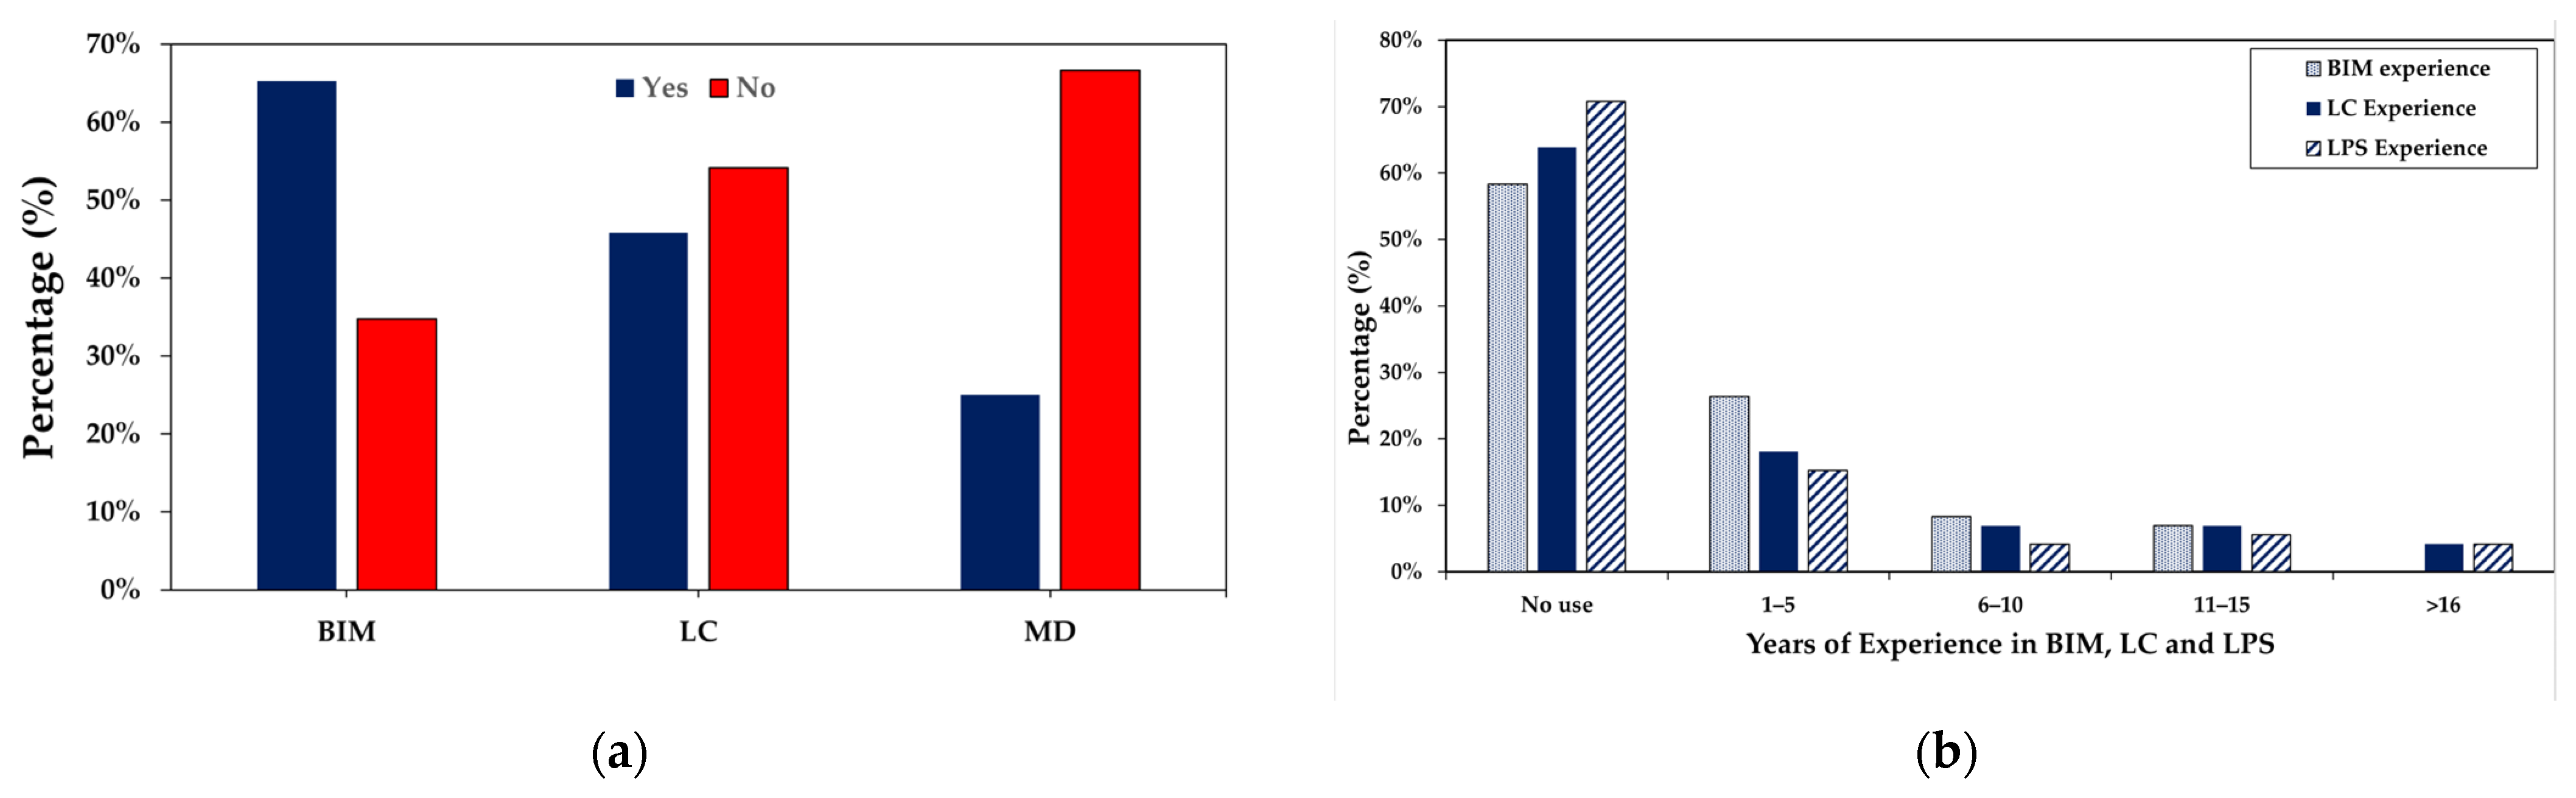
4.1.1. Descriptive Analysis for Questionnaire Data

Figure 4a illustrates the distribution of educational qualifications among survey respondents. Most respondents, 59.72%, hold master’s degrees, followed by 25.00% with bachelor’s degrees, and those with doctoral degrees make up 8.33%, and the remaining 6.94% have a high school diploma or equivalent, some college but no degree, or an associate degree. Figure 4b depicts the distribution of job titles among the respondents. Field engineers and project managers represent the most prominent groups at 15.28% and 13.89%, respectively. Similarly, designers and BIM specialists represent a significant presence, constituting 11.11% of the respondents. Superintendents comprise 6.9%. They were followed by researchers, schedulers, quality control managers, safety coordinators, and others, respectively (as shown in Figure 4b).
The data in Figure 5 reflect the respondents’ background in LC, the LPS, and BIM by asking if they ever attended courses, training, workshops, or reading. Most respondents lack formal education in LC, with 54.17% indicating no such education; the case is not the same with BIM education, which forms 65.25% of the respondents who have received some formal education or training. Figure 5a assesses the extent of knowledge regarding MD waste among the respondents. Despite the term’s inception in 2004, 67.9% of respondents demonstrated a lack of familiarity with or utilization of this terminology or analogous terms in their professional capacities. Nevertheless, 14.3% of respondents indicated some level of awareness, while an additional 17.8% incorporated related concepts such as task requirements, delivery checklists, lists of work security, quality checklists, and constraints checklists into their understanding.
As shown in Figure 5b, the application of LC and the LPS varies, with a significant percentage indicating no use (63.89% and 70.83%, respectively). Meanwhile, 18.06% of the participants experienced the LC philosophy in their workflows for 1–5 years, making up 15.28% of the participants who used the LPS for production planning and control in their enterprises for the same period. However, BIM education and application exhibit higher involvement, with 41.67% having BIM education and 26.39% applying BIM for 1–5 years.
Figure 6a presents an estimation that respondents were asked to fill out, which reflects the percentage of MD expected in the construction workflows: 18.06% of the respondents estimated that their workflows are free of MD practices; 23.61% estimated that MD constitutes 25% of their production; 34.72% projected that MD practices negatively impact half of their workflows; and 22.22% confirmed that MD is present in more than 75% of their production. This estimation is a rough quantification of MD and might lack clarity or formal measurement, but it reflects that once the MD concept was introduced to the participants, they perceived that MD waste is an integral part of their decisions across the construction lifecycle. Figure 6b reveals the respondents’ perspectives regarding the primary stakeholders involved in MD within their workflows. The findings indicate that specialty trades and project managers are considered the most significant contributors to MD decisions, accounting for 27% and 17%, respectively. Designers follow closely with 66.2%, clients at 63.5%, project managers at 62.2%, regulators at 48.6%, and consultants at 44.6%.

4.1.2. Exploratory Factor Analysis (EFA)

A reliability analysis assessed the internal consistency of the variables related to using BIM and the LPS to mitigate MD practices in construction projects. A total of 25 variables were tested for their importance in MD mitigation according to the participant’s perspective, and the Likert scale consistently reflects the construct of the study set out to measure. Accordingly, Cronbach’s alpha coefficient of reliability (α) was calculated for the variables using Equation (1).
α = N N 1 1 i = 1 n σ 2 σ T 2
In this context, N represents the total number of questions. Each question has a score variance denoted by σ, where i ranges from 1 to n. The overall test score’s total variance, not in percentage form, is represented by σT. Cronbach’s alpha (α) has a value from 0 to 1, and the higher the value of α, the greater the internal consistency of the data [68]. It is generally believed that a value of α = 0.7 is acceptable, and α > 0.8 depicts good internal consistency. The calculated α for this study is 0.9475, demonstrating excellent internal consistency. The 25 variables were then ranked using the descriptive statistical mean as the ratio of importance. The results of the reliability analysis and ranking of the variables are shown in Table 2.
The EFA method identifies “underlying” structures associated with the variables revealed in the literature, employing the reductionist method to substitute them with fewer uncorrelated principal components. Evaluations retain the original data, while procedures remove unnecessary variables. The current study analyzes 25 research variables and employs principal component analysis (PCA) with varimax rotation using IBM SPSS 27 software. The Kaiser–Meyer–Olkin (KMO) measure for sampling adequacy was a value of 0.873, which is higher than the recommended threshold of 0.5, while Bartlett’s Test of Sphericity resulted in a p-value of 2.45 × 10⁻⁴ (less than 0.5), suggesting substantial evidence against the null hypothesis of an identity matrix.
The demonstration elucidated the suitability of the data set for factor analysis. The PCA study classified the following variables into four factors that accounted for 57.876% of the variance. When applied in a study, reliability is the extent to which the same measure will yield a similar result on repeated usage. Thus, a reliable construct must have a Cronbach’s alpha of over 0.70 [61]. Therefore, it can be concluded that both collaboration and Making-Do knowledge scale coefficients are reasonable, totaling 0.815 and 0.811 for a coefficient alpha. The LPS functions and BIM functionalities scales also demonstrated a significant inter-consistency coefficient (α = 0.873 and 0.843, respectively).
Accordingly, the groups were deduced and categorized based on the assigned variables. For further information, please refer to Supplementary Table S2, which provides detailed component labels and their corresponding criteria from the exploratory factor analysis. The groups include Group A (VA1 to VA4), denoted by COO, which describes collaborative commitment during planning and control towards MD mitigation and adaptation for an LPS and MD-free culture. Group B (VA5 to VA9), denoted by MDK, describes the active learning of people inside an organization for MD incident resolution. Group C (VA10 to VA21), denoted by LPS, describes how the Last Planner System functions within short-, medium-, and long-term planning. Group D (VA22 to VA25), denoted by BIM, describes integrated production and product information parameters using BIM functionalities.

4.1.3. Confirmatory Factor Analysis (CFA)

Confirmatory Factor Analysis (CFA) implemented in AMOS 26 software served to verify the validity of the measurement model. This factor analysis investigation involved looking at factor loadings for every item. It was found that three items, i.e., VA4, VA10, and VAR21, had low factor loadings (VA4 = 0.46, VA10 = 0.45, and VA21 = 0.48), which are all less than the accepted threshold of 0.5. Therefore, they were taken out of the study. As a composite of CMIN/df, Comparative Fit Index (CFI), Tucker–Lewis Index (TLI), Root Mean Square Residual (RMSEA), and Standardized Root Mean Square Residual (SRMR), these model-fit indices were used for the overall evaluation of the model. Significantly, the means of all calculated statistics were within the established standard values, as defined in previous research [69,70,71,72]. The four-factor model, as visualized in Figure 7, comprising COO, MDK, LPS, and BIM, demonstrated a satisfactory fit to the data, as indicated by the following fit indices: CMIN/df = 1.490, CFI = 0.932, TLI = 0.911, SRMR = 0.08, and RMSEA = 0.065 (Supplementary Table S3 includes model-fit indices).
Construct reliability was evaluated using Cronbach’s alpha and composite reliability (CR). The Cronbach’s alpha coefficients for each construct in the study exceeded the recommended threshold of 0.70 [73]. CR values also ranged from 0.813 to 0.839, surpassing the 0.70 benchmark [61]. Therefore, CR was established for each construct in the study, as documented in Table S5. The convergent validity of the scale items was assessed using average variance extracted (AVE) [61]. The AVE values for BIM functionalities and the LPS technical measures exceeded the threshold value of 0.5 [61]. However, collaboration, MD knowledge, LPS functions, and BIM functionalities exhibited AVE scores below 0.5. Nonetheless, given that the CR values exceeded the required threshold, it can be inferred that these constructs maintain adequate convergent validity for the present study, as summarized in Table S5.
The research evaluated discriminant validity using the Fornell–Larcker criterion and the heterotrait–monotrait (HTMT) ratio. While the Fornell–Larcker criterion requires AVE to exceed the correlation with other constructs, it has faced criticism; scholars recommend the HTMT ratio as an alternative [74]. The Fornell–Larcker criterion did not confirm discriminant validity in this study, but all HTMT ratios were below the recommended threshold. Supplementary Table S3 shows the detailed results of the discriminant validity analysis.

4.1.4. Structural Equation Model Assessment

The research hypothesis was tested using a structural equation model through AMOS, with the fitness indices CMIN/df = 1.418, TLI = 0.932, CFI = 0.946, SRMR = 0.0597, and RMSEA = 0.060 indicating excellent fit. The variance for MDK was 62%, resulting from LPS functions, COO, and BIM functionalities. Thus, according to LPS functions and BIM functionalities, 44% of the collaboration variance was considered. As for the second hypothesis, H2 indicated that the LPS had a positive and significant causal effect with MDK. BIM had a negative and insignificant influence on MDK, experiencing no support from H1. Thus, this research did not support the H1 hypothesis, as the COO showed a positive and insignificant impact on the MDK. Therefore, based on the analysis of hypothesis H2, it can be stated that the LPS had a positive and significant effect on the level of COO. It was revealed that the effect of BIM on COO was insignificant and in a negative direction, thus disproving H1. Model fit indices and hypothesis results are presented in Table S6. A mediation analysis was carried out to investigate the mediation effect of the LPS and BIM on the association between COO and MDK (as shown in Figure 8). The mediation effect was significant for LPS functions; evidence favoring hypothesis H2 was established. So, the LPS can partially be seen as a channel between collaboration and MDK. The result of the mediation analysis is shown in Table S7.

4.2. Causal Loop Diagram (CLD)

The first step of SDM is a CLD, a qualitative conceptual model that determines the system parameters and causalities. Considering the production system simulation, Figure 9 graphically illustrates the dynamic relationships between production planning and control systems, which was then used for analyzing MD and planning performance indicators in stock and flow diagram (SFD) modeling. Firstly, a CLD was drawn under the conceptual model developed by Lyneis et al. [75] for strategic project management. The critical model structures in construction project management consist of work progress, errors and reworks, project planning and scheduling, and management strategies and policies and their consequences on project performance. Three causal loops were provided in the established CLD, namely, work progress, schedule pressure, and productivity. For work progress, the adopted logic is that the required work finishes with a completion rate that depends on the productivity and number of resources. Productivity is the work completed for a unit of time per resource in this research [76]. The resources variable represents the number of people who accomplish a specific task (i.e., electricians, glazers, engineers, masons, painters, plasterers, plumbers, procurement team, helpers, and tile setters).
When completed work falls behind the planned schedule, project managers use two famous strategies: allocating more resources and/or increasing work time by employing overtime. The overtime strategy often leads to excess labor hours and consequent fatigue and lack of motivation, and allocating more resources to overcome schedule pressure leads to a shortage of the required resources in other locations. In addition, both strategies cause additional production costs, as shown in the balancing loops B2 and B3 in Figure 9.
MD is located in the heart of the CLD, as shown in Figure 9, and has a critical impact on driving the B1 loop; MD depends on the number of constraints encountered and removed in the system [45]. The qualitative model was expanded to accommodate the changes in MD, constraints, and waste caused by MD initiated by schedule pressure. Economic, operational, and contractual pressures were excluded from the scope of this study.
Considering the uncontrolled environment of construction sites and the strategic goal of decreasing MD, removing constraints and eliminating waste were added as system parameters and connected with strategic project management parameters. Some of the benefits reported by the previous research findings include the impact of the LPS and BIM on productivity [77], improving constraints analysis [33], managing locations [78], improving resource allocation [79], and reducing construction waste [80].
Consequently, the mentioned system parameters and causalities were developed using a literature review. The impact of strategies from LPS functions and BIM functionalities parameters on mitigating MD [24,31,33,45] is hypothesized in the CLD by affecting constraints discovery rate, reducing schedule pressure, and improving resource allocation and utilization. Although the strategies and causalities may differ based on the project and company contexts, this paper aims to demonstrate the influence of SDM on optimizing production planning and control by reducing the number of tasks infected with MD practices through LPS and BIM. Hence, SDM was proposed as the generic method that can be developed in practice to test the impacts of LPS-BIM on MD. Based on the CLD, each subsystem was drawn in an Anylogic 8.7.11 software package and transferred into stock and flow diagrams, as explained in detail in the following section.

4.3. Stock and Flow Diagrams

The CLD was translated into SFD in Anylogic to test and simulate the system; in other words, the development of SFD quantifies and operationalizes the CLD, which requires two steps [66]. The first step is to set boundary conditions and provide the model assumptions to stabilize the system’s behavior to prevent unpredicted responses and force the system to behave in a way that is like reality. Secondly, the dynamic model can be dismantled into subsystems that shape the overall behavior. The model comprises six subsystems, which include exogenous (external) and endogenous (internal) factors: (1) work progress; (2) productivity factors; (3) resources; (4) Making-Do; (5) MD impacts; and (6) LPS social and technical functions and BIM functionalities, as shown in the generic Figure 10. These subsystems are described thoroughly in the following subsections. Accordingly, the internal factors are formed by parameters like initial values, including project definition, planned duration, and allocated resources. For the second group, the actual completion time of processes and the total project duration were considered. Thirdly, the productivity factors include the number of resources used in each task, the number of functions being processed or waiting to be processed, the project cost, the number of MDs for each category, and the related constraints and waste.
The formulation of parameters that form the socio-technical LPS and BIM functionalities was added to the model to reflect the 5-point Likert scale ratings and was formulated using SEM. For instance, the change in the LPS technical factors was calculated according to the rating for parameters (VA10 to VA20). The technical aspects of the LPS refer to functions that provide the production schedule according to the LPS hierarchy of planning and scheduling, which includes the master schedule, phase schedule, lookahead schedule, and short-term schedule [37]. Note that the Additional Materials section of this article contains the equations used in the model (Table S9—Dynamic Equations) and the table functions or lookup tables (Table S10—Table Functions).

4.3.1. Work Progress

A customary initiation point for a planning system involves defining project goals, typically input by the user as a constant to provide an initial estimate for the quantities or number of tasks allocated to each stage. This input serves as the baseline value for the stages allotted throughout the project phases, while milestones dictate the progression from one stage to another and often serve as benchmarks for gauging the project’s strategic-level performance. As depicted in Figure 11, the primary determinant of change within the “stages” stock is the rate at which tasks are transitioned by the planning team from master planning to the “ToBeProcessed” state for execution or advancement in planning. This rate of change is conceptualized as a flow entity denoted as “BackLogRate”, measured in tasks per month.
The magnitude of the “BackLogRate” is contingent upon the task counts within both the “stages” and “WIP” stocks. Specifically, when the number of tasks in “ToBeProcessed” equals or surpasses the number of functions in the “stages” stock, the BackLogRate diminishes to zero. Conversely, if the task count in “WIP” falls below half of the tasks in the “stages” stock, the BackLogRate escalates to its maximum level, determined by user-defined constants.
Acknowledging that the “WIP” stock facilitates arrays that categorize the five phases from the “stages” stock into 11 work packages is imperative, and the arrays used in this research are explained in Table S11. This functionality aligns with the principles of the Last Planner System, advocating for the breakdown of projects into manageable, measurable, and controllable work segments. However, it is noteworthy that the SDM method does not accommodate the granular breakdown of work into operations and tasks due to the inherent abstraction level in SDM.
The constraints analysis is of the utmost importance in minimizing the resultant effects of MD practices based on the distribution of tasks and the overall production strategy. A push strategy disregards constraints in the project and pushes out tasks without assessing constraints, while the pull strategy advises executing tasks without constraints. Constraints analysis influences MD incidents and waste generation as constraint removal necessitates timely reevaluation and adjustment of plans by a collective effort. The number of constraints in each stage influences the planning time when unresolved. For planning reliability to be heightened, constraints analysis must be incorporated into each stage stock.
The classifications are adopted for task prerequisites, MD categories, and their impacts on the literature [21,25,43], as shown in Table 3; this paper discusses and evaluates the relationship between these variables.

4.3.2. Productivity

Finished “works” stock is one of the objective metrics for evaluating the change rate based on the number of MD practices, which is calculated based on the resource productivity rate in processing tasks from WIP stock. The rate influences how individuals complete tasks, which depends on resource allocation by the resource subsystem and productivity ratio [75]. Productivity (annotated as prod in Figure 12) is the ratio of total output to the sum of inputs, including items, for example, labor, material, equipment, energy, and capital, as in Equation (2). This equation sums the productivity levels in each workflow to determine the total project productivity; such a definition should also govern the impact of space, as indicated in LBMS, which considers that operations should be seen as the movement of labor and equipment across locations [81,82]. This research ignored the output value of equipment and energy outputs due to insufficient data collected; however, their contribution to the total production was considered and subtracted.
Prod[SUBSTAGES] = effFatigueProductivity[SUBSTAGES] * overtime[SUBSTAGES] * normalProductivity
* impactOfWorkSpaceLimitation[SUBSTAGES] * impactOfBIMonProductivity * impactofLPSonProductivity
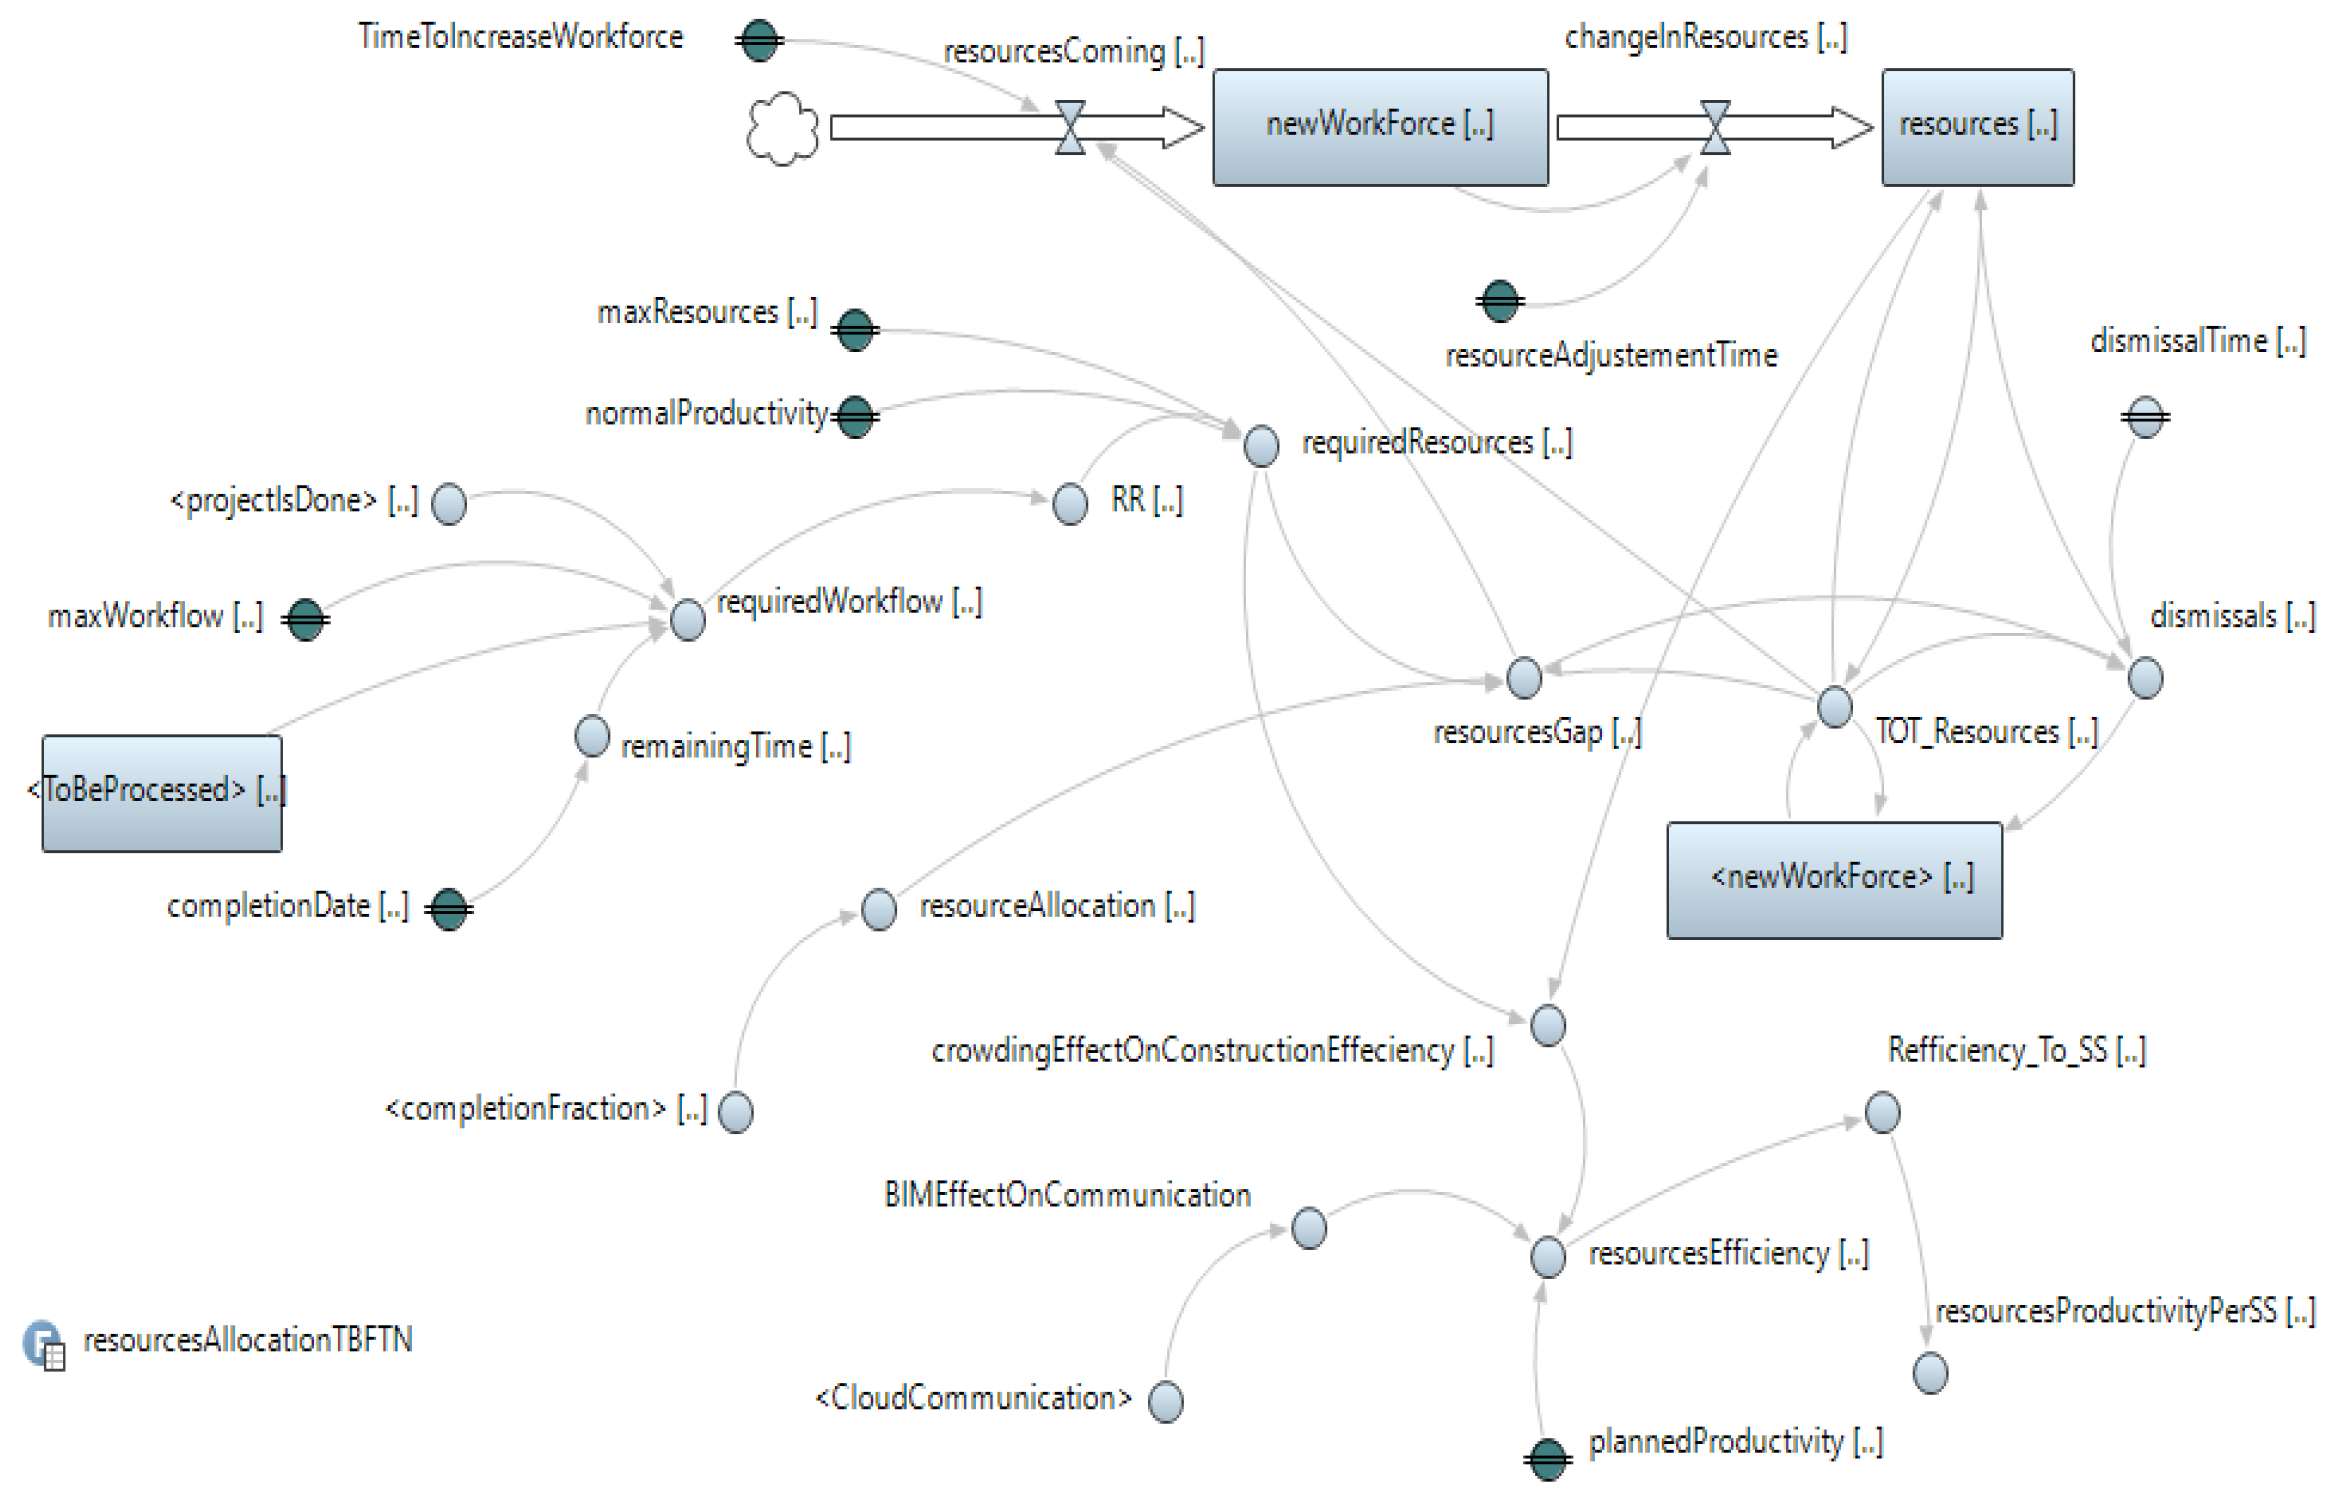
4.3.3. Resources

A trade analysis approach is employed, leveraging observed resources from case studies to estimate the number of tradespeople and engineers required to complete construction tasks as modeled in the dynamic subsystem in Figure 13. Subsequently, the current cost per labor hour can be calculated, providing insight into the workforce’s productivity, expressed as the hours required for monthly output. The workflow needed in Equation (2) is contingent upon conditional logic (IF and THEN), which diagnoses whether the project is completed and if any work-in-progress (WIP) remains. In such cases, the maxflow is assigned the value of the required flow, with the maximum workflow “maxWorkflow” values set from SS1 to SS11 denominated in the “Tasks” unit. If the diagnosed condition is not met, the “requiredWorkflow” takes the maximum value of “ToBeProcessed” divided by “remainingTime”. The xidz function is employed to avoid division by zero, returning the maxWorkflow value if division by zero occurs to prevent a not-a-number (NaN) value.
The dynamic variable resourceGap regulates the required resources over time if the condition is satisfied. Additionally, this dynamic function determines the number of trades to be dismissed after passing “half month”, as assumed in the model. The dynamic variable Tot_Resources aggregates the values between the new workforce hired and the resources working on assigned tasks in the project. The change resources divide the value of newWorkForce by the user-input value of resourceAdjustmentTime, which is assumed to be “2 months”.

4.3.4. Cost and Location Subsystems

The additional cost associated with MD practices and their impacts is taken into account in the project cost subsystem as indicated in Figure 14a; this system assumes that additional costs are caused by delays to rectify production problems, wastes that emerged across the system, and overtime due to schedule pressure. The location subsystem in Figure 14b adopts the principles of location-based management to calculate the number of resources moving across the locations; it is assumed that the location change (locationUtlizationRate) is determined by multiplying available locations by the division of the number of remaining tasks and resources. The workspace available is an essential variable for productivity variable calculation.

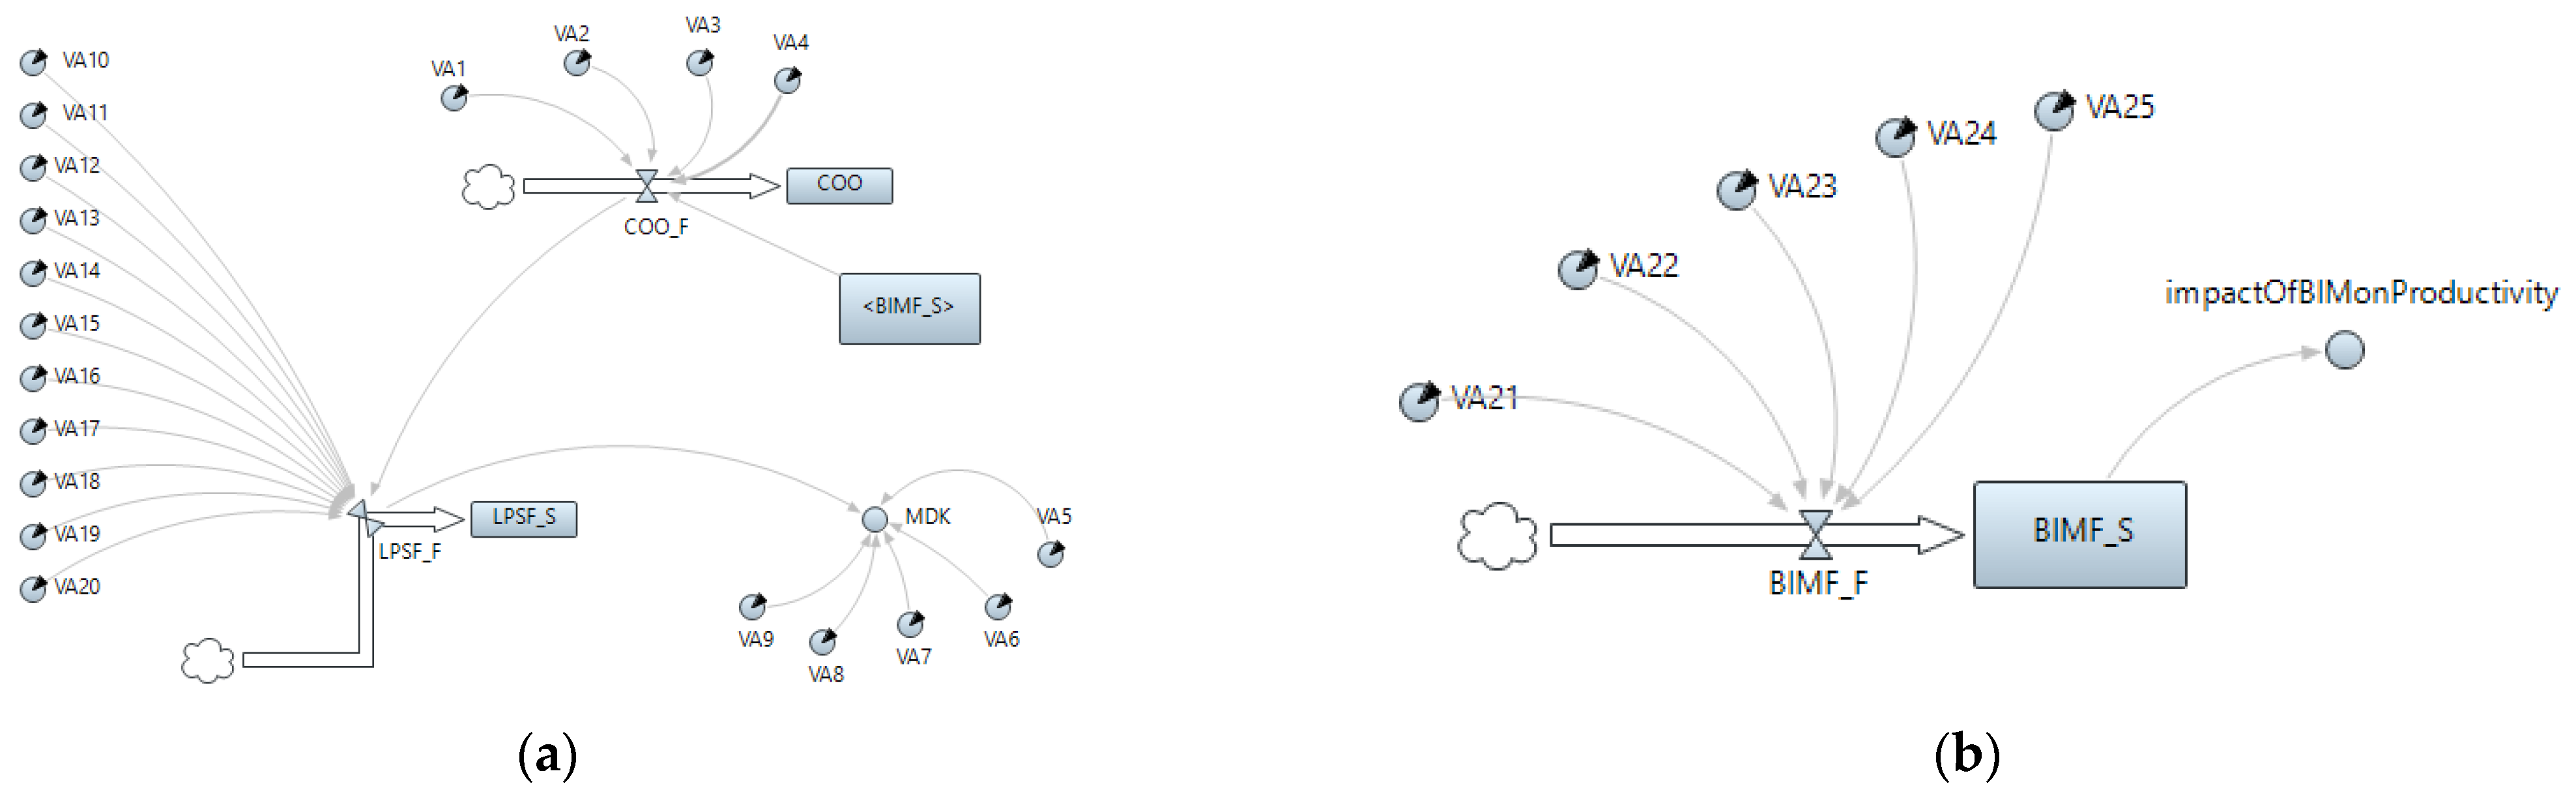
4.3.5. The Dynamic Interaction with LPS Functions and BIM Functionalities

This subsystem represents the LPS, COO, and MDK levels. The change in these variables across time is determined according to structural equation modeling. Figure 15 displays how the different parameters interact in the dynamic model. Note that the relationship from the COO affects LPS_S by CCO_F, as shown in Figure 15a, and the impact of BIM is determined by BIMF_F, as shown in Figure 15b.

4.4. Simulations

4.4.1. Validation Projects

Qualitative data collection methods using a case study approach involve establishing a database for recorded MD categories and analyzing the related constraints and impacts within the project processes and tasks using the protocol developed by Ref. [34]. The data originate from the QuizQuality tool implemented in the cases under investigation. This tool actively contributed to large-scale construction projects by monitoring work quality and generating checklists for quality inspections. Additionally, it generated reports detailing the causes of suboptimal production. Subsequently, management and engineers received these findings, empowering them to make informed decisions and address issues, ultimately improving production outcomes. A total of 6421 MD incidents were collected and analyzed to investigate the relationships between project phases, task prerequisites, incident categories, and negative impacts on production systems.
Table 4 summarizes and compares case studies of the collected data that showcase three multi-storey condominium projects. Case A is a Brazilian project constructed by company (M) between March 2016 and March 2021; it involved 20-story towers with 480 units total on 9445 square meters of land. Case B is another Brazilian project constructed by company (N), between March 2020 and September 2023; it involved the construction of two 15-story towers with 45 units each, using 2860 square meters of land. Case C took place in France and was constructed by company (K), between February 2019 and March 2021, with the primary objective being the renovation of a single seven-story building with 140 units on 1223 square meters of land. Case A shows large-scale, high-density construction; Case B indicates a potentially phased or specialized approach, given the longer timeline; and Case C demonstrates a rehabilitation project in a different country.

4.4.2. Model Assumptions

The simulation process encompassed the establishment of assumptions to set the boundary conditions for the model, as outlined in Table S5. These assumptions guided the inputs for baseline simulation in Projects A, B, and C. Random numbers were systematically generated for resource productivity timing employing the uniform_discr function to simulate real-world variability, creating a discrete distribution between 20 and 40. Throughout the iterative model development phase, actual project data served as the foundation for these values, ensuring the reliability of the simulated results. Upon validation against the baseline scenario, the final stock and flow diagrams (SFDs) were calibrated for subsequent scenario testing. A comparison between the baseline simulation results and empirically collected data is presented in Table 5, providing validation of the model’s predictive accuracy and real-world applicability.

4.4.3. Testing for Model Unit Consistency

As one of the critical validation steps for computerized modeling, a dimensional consistency test was conducted on Anylogic’s unit checker. Initially, when transferring conceptual models to stock flows, it was noted that the model had over 150 warnings, which were promptly rectified to achieve coherence.

4.4.4. Model Stability Testing

The stability test is conducted to securitize the evolution trend of the curve in different subsystems and the stability of the fitting under different time-step settings. The subsystems’ work progress, locations, cost, productivity, and resources are tested. The test examined the stability of crucial systems by employing three distinct step sizes—1/100, 1/50, and 1 month. The MD, constraints, and waste stocks at different steps are highly consistent, indicating that the system is stable and reliable.

4.4.5. Parameter Variation Testing

The parameter variation test investigates the influence of the dynamic behavior in the long run, which determines the optimal parameter values for the studied system; it is also used to simulate external behavior dynamics and the dependence structure analyzed in plots for studied variables [67]. This test, delineated in Table 6, shows the assumptions used for parameter variation tests, comprising four testing scenarios. This parameter variation testing verifies (1) the impact of the LPS technical factor at the maximum value in Scenario I (e.g., the first application of the LPS usually involves training and employing technical measures without focusing on collaborative factors); (2) the impact of collaboration is associated with the LPS technical factors by enabling VA6, VA7, VA8, and VA9; (3) LPS socio-technical factors with the association of MDK (by adding MDK parameters, it is expected to enhance the LPS functions by focusing on increasing people’s awareness of MD); and (4) in all parameters of the study—LPSF, BIMF, COO, and MDK—Scenario IV imposes full utilization of BIM-specific factors (VA22 to VA25). This testing procedure validated the model’s efficacy in simulating real-world dynamics and elucidating complex system behavior.

5. Discussion

Analysis of results from Section 4.1 of the survey showed that Making-Do knowledge (MDK) is affected the most by production planning and control, and most lack awareness, and MD decisions are taken to complete tasks through MD. This assertion can mean planners with high knowledge and experience of the LPS functions and the association of using BIM functionalities can only improve the accumulated knowledge of the organization in MD and then learn from the function constraints analysis within the LPS. Conversely, practitioners learn the most from the tasks they plan and operate collaboratively. BIM functionalities have low significance for a direct impact on MD, but do impact MD through LPS.
The proposed model has three theoretical implications, agreeing with Ref. [83]: (1) Managing as an Organization and Pull Type of Production: This model posits that managing integrates pull and push production through planning methods, wherein tasks are pulled from a workable backlog according to task readiness or the availability of requisite resources. (2) Scientific Experimentation Model: Integrating quality management principles with production planning and control is critical for successful MD reduction [31]. This model centers on discovering the root causes of MD and deviations in the production system to prevent performance slippage, formalizing production actions by adding standardized procedures to handle constraints, and potential improvisational actions taken by people in the system. It serves as a learning mechanism to maintain production stability. (3) Language/action Perspective: This model involves two-way communication during execution, where promises as a language of commitments trigger actions, and notifications to initiate a task occur considering the resources and the actual capabilities of production and involving downstream players’ knowledge in decision-making.
When considering practical implications, as noted, the model’s input was validated by considering four scenarios of three projects: baseline scenario with zero LPS and BIM; Scenario I fully utilizing the LPS technical factors; Scenario II adding COO factors into the LPS functions; Scenario III providing the full scale of factors of MDK in addition to COO and LPS; and Scenario IV testing the full potential of LPS, BIM, COO, and MDK. In each project, MD incidents, project constraints, and MD impacts (waste) were categorized based on their nature and attributed to substages.
After running a simulation experiment for each project, several outcomes are reported. Table 7 and Figure 16, Figure 17 and Figure 18 show the results of simulations for Project A and four scenarios. Table 7 compares baseline, I, II, III, and IV scenarios in terms of MD categories, constraints, and MD impacts measured by the number of tasks, the percentage of completion rates, and additional cost in US dollars. As depicted in this table, the number of tasks with MD incidents has been reduced slightly from the baseline scenario, has earlier project completion, and has reduced additional costs related to the early discovery of MD waste and other related waste. The complete comparison between Projects A, B, and C is in Table S12, Figures S1–S9.
Project A lasts for 52 months; MD Categories CAT1 to CAT5, as shown in Figure 17, demonstrate varying trends, with the Access and Movement category of MD experiencing a decline from 23.754 in the baseline to 11.284 in Scenario IV, indicating potential improvements in MD-related issues. Component Adjustment, on the other hand, fluctuates across scenarios, peaking at 99.032 in the baseline before decreasing gradually. Equipment/Tools, Sequencing, and Workspace also display fluctuations, reflecting project constraints and priorities changes. Concerning constraints (P1 to P6) as depicted in Figure 16, reductions are observed across scenarios, with Scenario IV consistently showing lower values than the baseline, suggesting effective constraint management strategies using the full potential of the LPS-BIM. MD impacts (I1 to I5) exhibit waste reductions across scenarios, as illustrated in Figure 18, with Scenario IV displaying the most significant decrease in waste severity, ranging between 61.41% and 69.07% waste reductions. Completion rates fluctuate across scenarios, with Scenario IV recording the highest rate at 98.962%, indicating enhanced productivity of resources, hence increasing project efficiency. Lastly, additional cost reduction highlights potential cost-saving opportunities, with Scenario IV displaying the lowest cost at $60,893.31, emphasizing the importance of the LPS and BIM to eliminate MD practices and optimize project outcomes.
Project B lasts 42 months; the simulations illustrate critical variables’ dynamic interplay. For instance, the Access and Movement MD category experiences a decrease from 16.990 in the baseline to 9.525 in Scenario III, suggesting an improvement in MD-related decisions. Conversely, Component Adjustment shows mitigations, peaking at 96.621 in Scenario II before declining to 63.459 in Scenario IV. The Equipment/Tools and Sequencing categories follow similar patterns of variation across scenarios, indicating shifts in project constraints and priorities. Constraints P1 to P6 also demonstrate changes, with Scenario IV consistently showing lower values than the baseline, implying effective LPS-BIM strategies for enhancing constraints analysis. In I1 to I5, MD impacts showcase reductions across scenarios, with Scenario I exhibiting an average 31.57% reduction and Scenario IV with 43.20%. Moreover, completion rates fluctuate across scenarios, with Scenario IV recording the highest rate at 98.303%, signifying enhanced project efficiency. Finally, cost fluctuations reveal potential cost-saving opportunities, with Scenario IV displaying the lowest cost at $19,912.27.
Project C lasts 24 months, and the simulation results reveal behavior similar to Project A’s across different scenarios. MD Categories CAT1 to CAT5 exhibit varying trends, with Access and Movement representing a decline from 13.816 in the baseline to 8.075 in Scenario IV, suggesting improvements in MD mitigation as the LPS and BIM factors are applied. Conversely, Component Adjustment sees a reduction across scenarios, peaking at 93.780 in Scenario I before decreasing to 63.115 infected tasks in Scenario IV. The MD categories Equipment/Tools and Sequencing also demonstrate variations, indicating project constraints and priority changes. Regarding constraints (P1 to P6), reductions are observed across scenarios, with Scenario IV consistently revealing lower values than the baseline. MD impacts (I1 to I5) show reductions across scenarios, with Scenario IV exhibiting the most significant decrease in impact severity. Completion rates fluctuate across scenarios, with Scenario IV recording the highest rate at 95.005%, indicating improved project efficiency. Lastly, cost fluctuations reveal potential cost-saving opportunities, with Scenario IV displaying the lowest additional cost percentage at $7171.63, highlighting the importance of LPS-BIM adoption to optimize project outcomes.
Scenario IV is superior to Projects A, B, and C owing to its noteworthy advantages across multiple vital factors. Firstly, Scenario IV exhibits substantial mitigation rates in MD categories, with an average 43.34%, 43.64%, and 44.42% reduction in total MD categories in Projects A, B, and C, respectively. The Equipment and Tools category is the most influenced by Scenario IV mitigation strategies, indicating effective mitigation of MD-related issues with a 60.64% reduction rate in Project A, 60.04% in Project B, and 56.13% in Project C. Secondly, Scenario IV demonstrates efficient constraint management, consistently maintaining lower values for constraints P1 to P6, facilitating smoother project execution and resource utilization. Moreover, Scenario IV showcases the most significant reductions in MD impacts, highlighting its efficacy in mitigating the severity of MD-related challenges and enhancing project resilience.
Furthermore, Scenario IV consistently yields higher completion rates, reflecting improved project efficiency and timeliness. Lastly, favorable cost outcomes are observed in Scenario IV, with the lowest cost percentages recorded across all projects, underscoring its potential for cost-saving opportunities through efficient resource allocation and management. Overall, the results of the simulations emphasize the importance of strategic planning and adaptation to LPS and BIM strategies to mitigate MD and optimize project outcomes.
LPS-BIM, empowered with improved collaboration and MD knowledge, becomes the best option among Scenarios I, II, and III when the three projects are compared because LPS-BIM has highly competitive advantages in almost all criteria of importance. Initially, Scenario IV drastically reduced all MD categories and specifically improved Access and Movement categories by effectively alleviating MD-based problems. Similarly, Scenario IV reduced constraints discovered late in the projects, increased productivity levels, accelerated project delivery with fewer additional costs, and reduced related waste in tasks such as material waste, rework, and unfinished works, ensuring high levels of the project’s resilience. Overall, the simulation’s results reinforce lean policies and strategies based on the LPS and BIM to avoid and minimize MD, resulting in optimal outcomes.

6. Conclusions

Mitigating Making-Do (MD) in construction projects is a critical goal to increase productivity and reduce costs and delivery time. The research has revealed that enhancing production planning and control plays a significant role in reducing MD practices. In this regard, the main research focus is on the countermeasures for MD during production planning and control in construction projects. This paper presents a strategic approach based on system dynamics modeling (SDM) to mitigate MD waste and the impacts of the LPS and BIM on eliminating it during production planning and control, analyzing the dynamic interrelationships of variables throughout the construction project time. A causal loop diagram modeled these relationships to highlight the causal structure of MD, following the LPS functions and BIM functionalities. These factors were mathematically modeled in stock and flow diagrams (SFDs) based on system thinking theory, production theory, and multivariate analysis methods, including linear regression and structural equation modeling (SEM). At the strategic level, the developed system dynamic model was used to confirm the application and development of the system structure of MD and its viability based on mitigation strategies of LPS-BIM parameters in construction projects. After the stability test of the constructed system dynamics model, units’ consistency tests, and extreme values tests, the developed model was tested on three residential building projects: two new Brazilian construction projects and a French rehabilitation project. The following concluding remarks summarize the study’s findings:
  • Social-technical factors directly influence MD in construction management systems. MD is a form of improvisation that masquerades in the short run as innovation, which reduces delivery time and related costs, but in the long run, several wastes could emerge and even snowball across the project delivery time; more than 80% of MDs are NVAs or a source of NVAs. This percentage can be prevented when proper production planning and control are employed, such as the LPS.
  • This study investigates the impact of the integrated form of the LPS and BIM on Making-Do mitigation, using the system dynamics modeling method to strategically assist project stakeholders in assessing lean–BIM policy in tackling this waste and its impacts.
  • The study found that MD is not widely known among professionals, and even some lean practitioners have not heard about it; similarly, construction management research has shown little interest in investigating MD, except for a few attempts from academics working in LC research.
  • This research presents a novel MD model based on system thinking theory, which simulates the feedback mechanisms in construction management and measures the accumulation levels of construction constraints, Making-Do incidents, and emerging wastes.
  • The accuracy of the simulation results of variables (MD, constraints, waste, cost, and completion rate) for the baseline scenario is considered acceptable compared to data collected from Projects A, B, and C. The average percentage of collected data divided by estimated data is MD 98.24%, constraints 99.52%, waste 98.80%, completion rate 95.99%, and additional costs 97.34%.
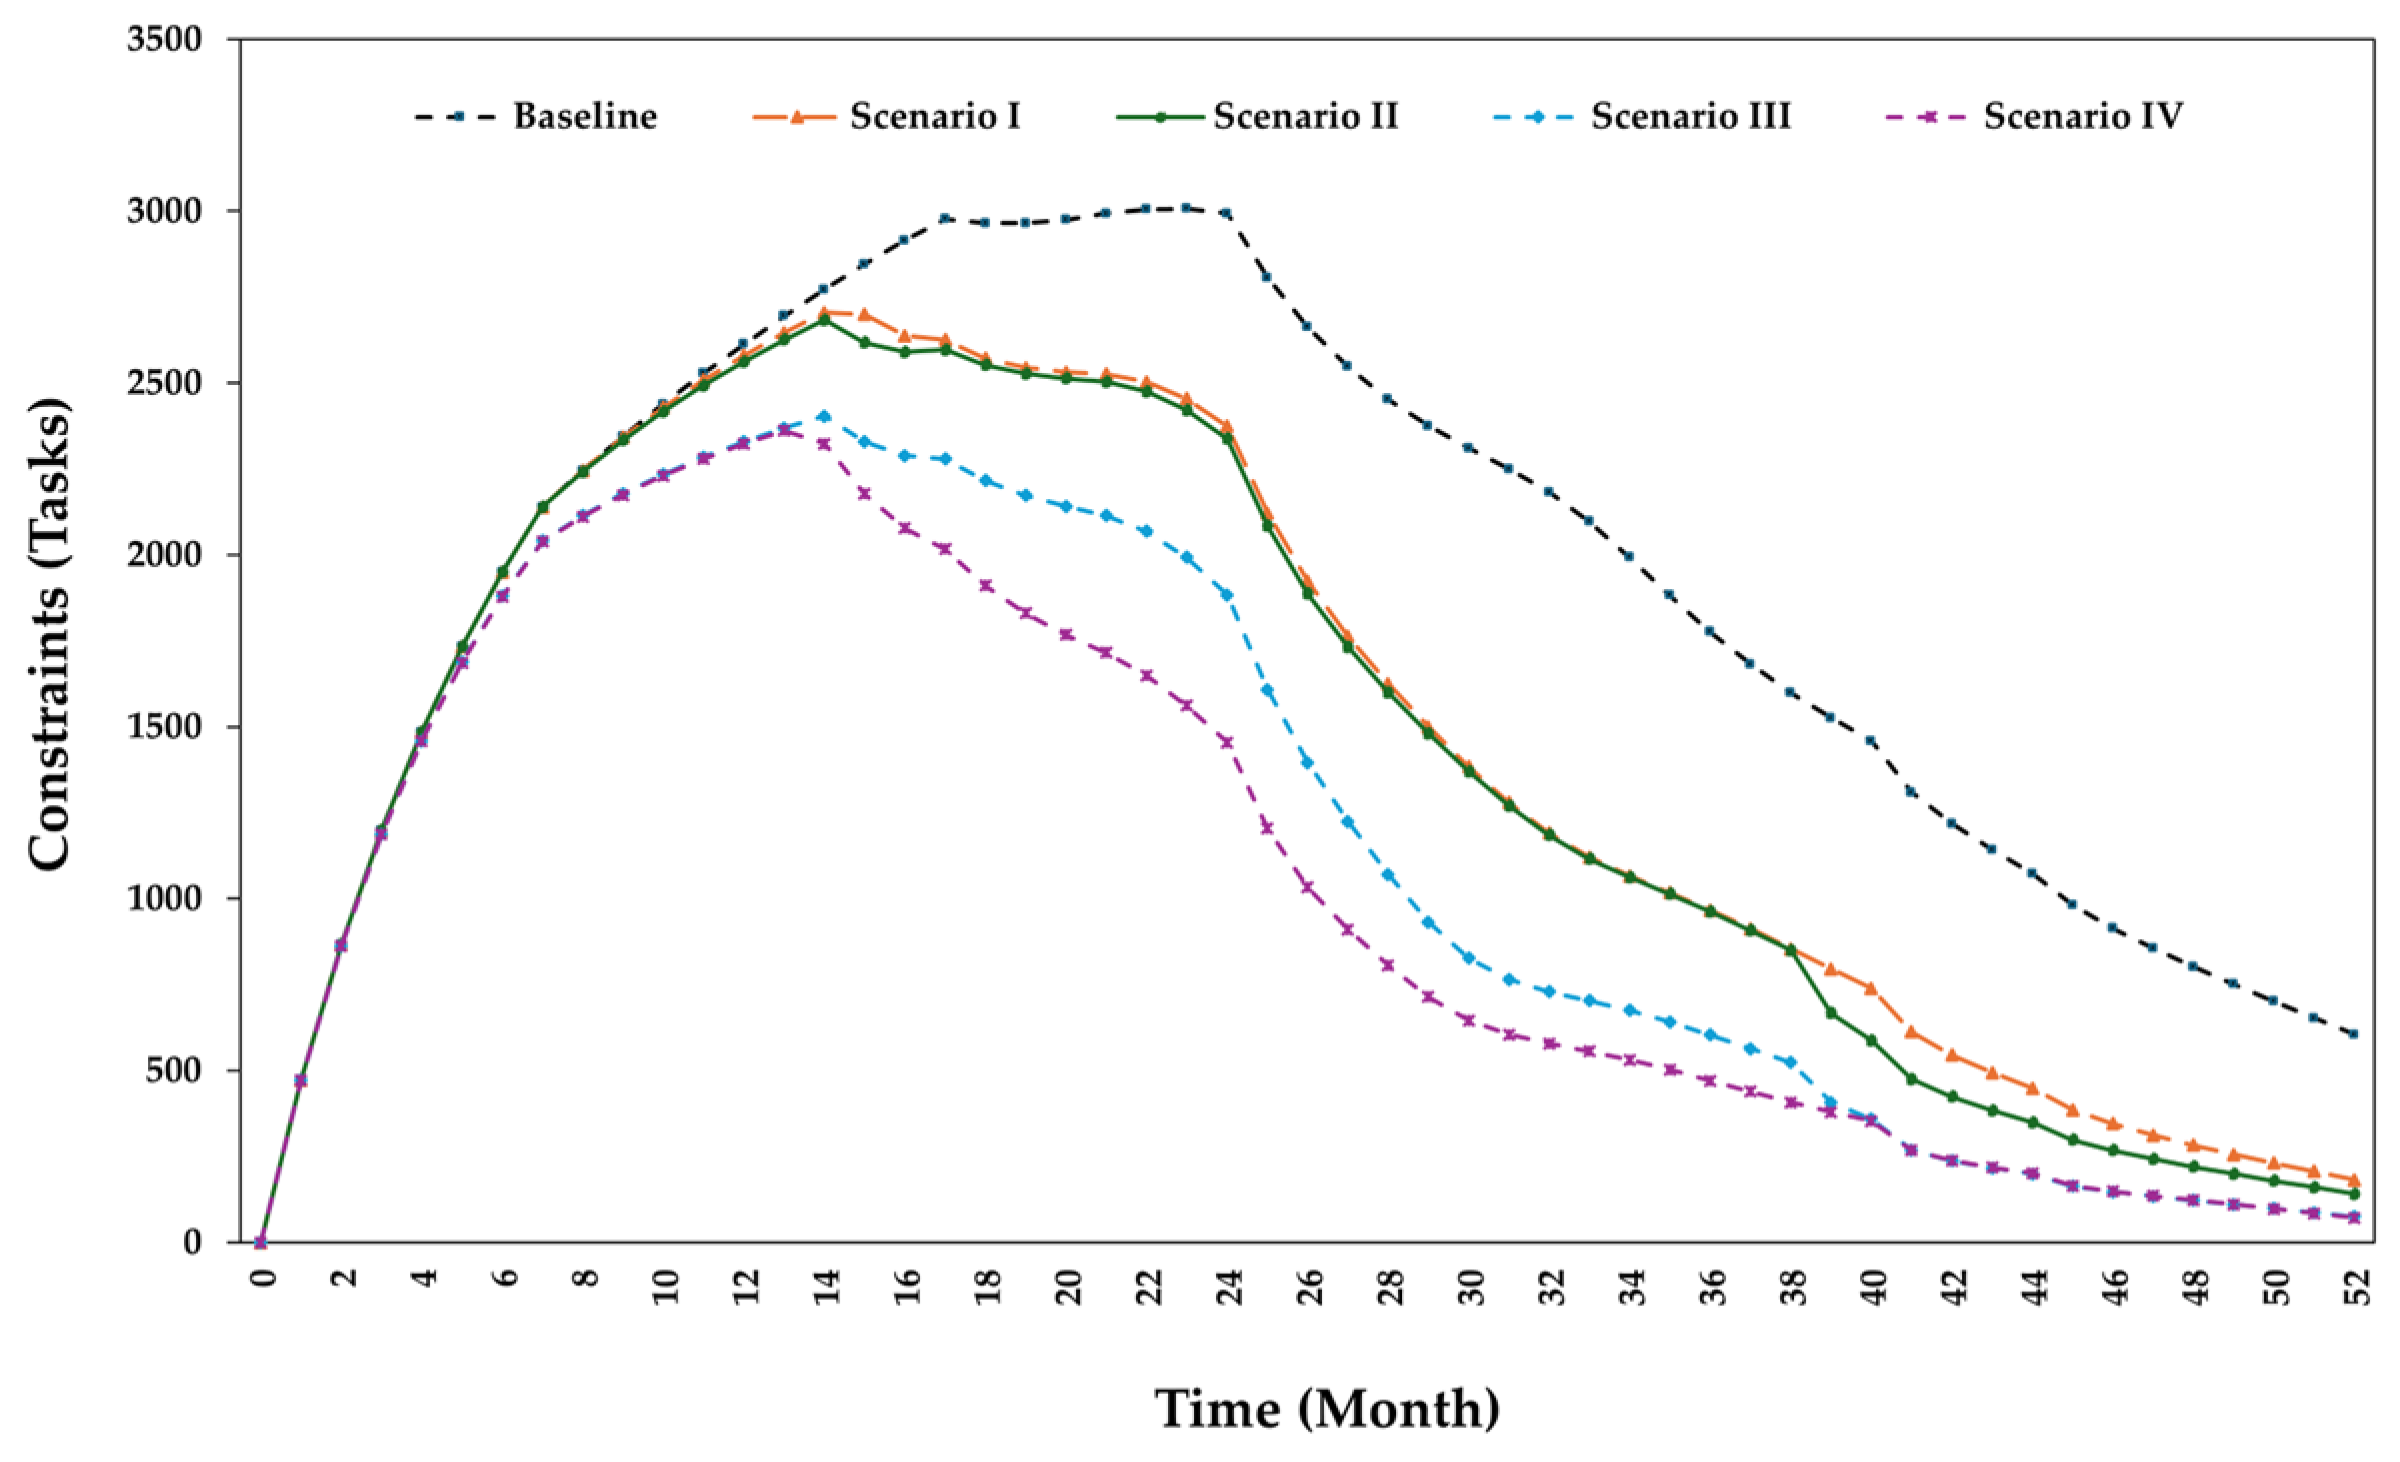
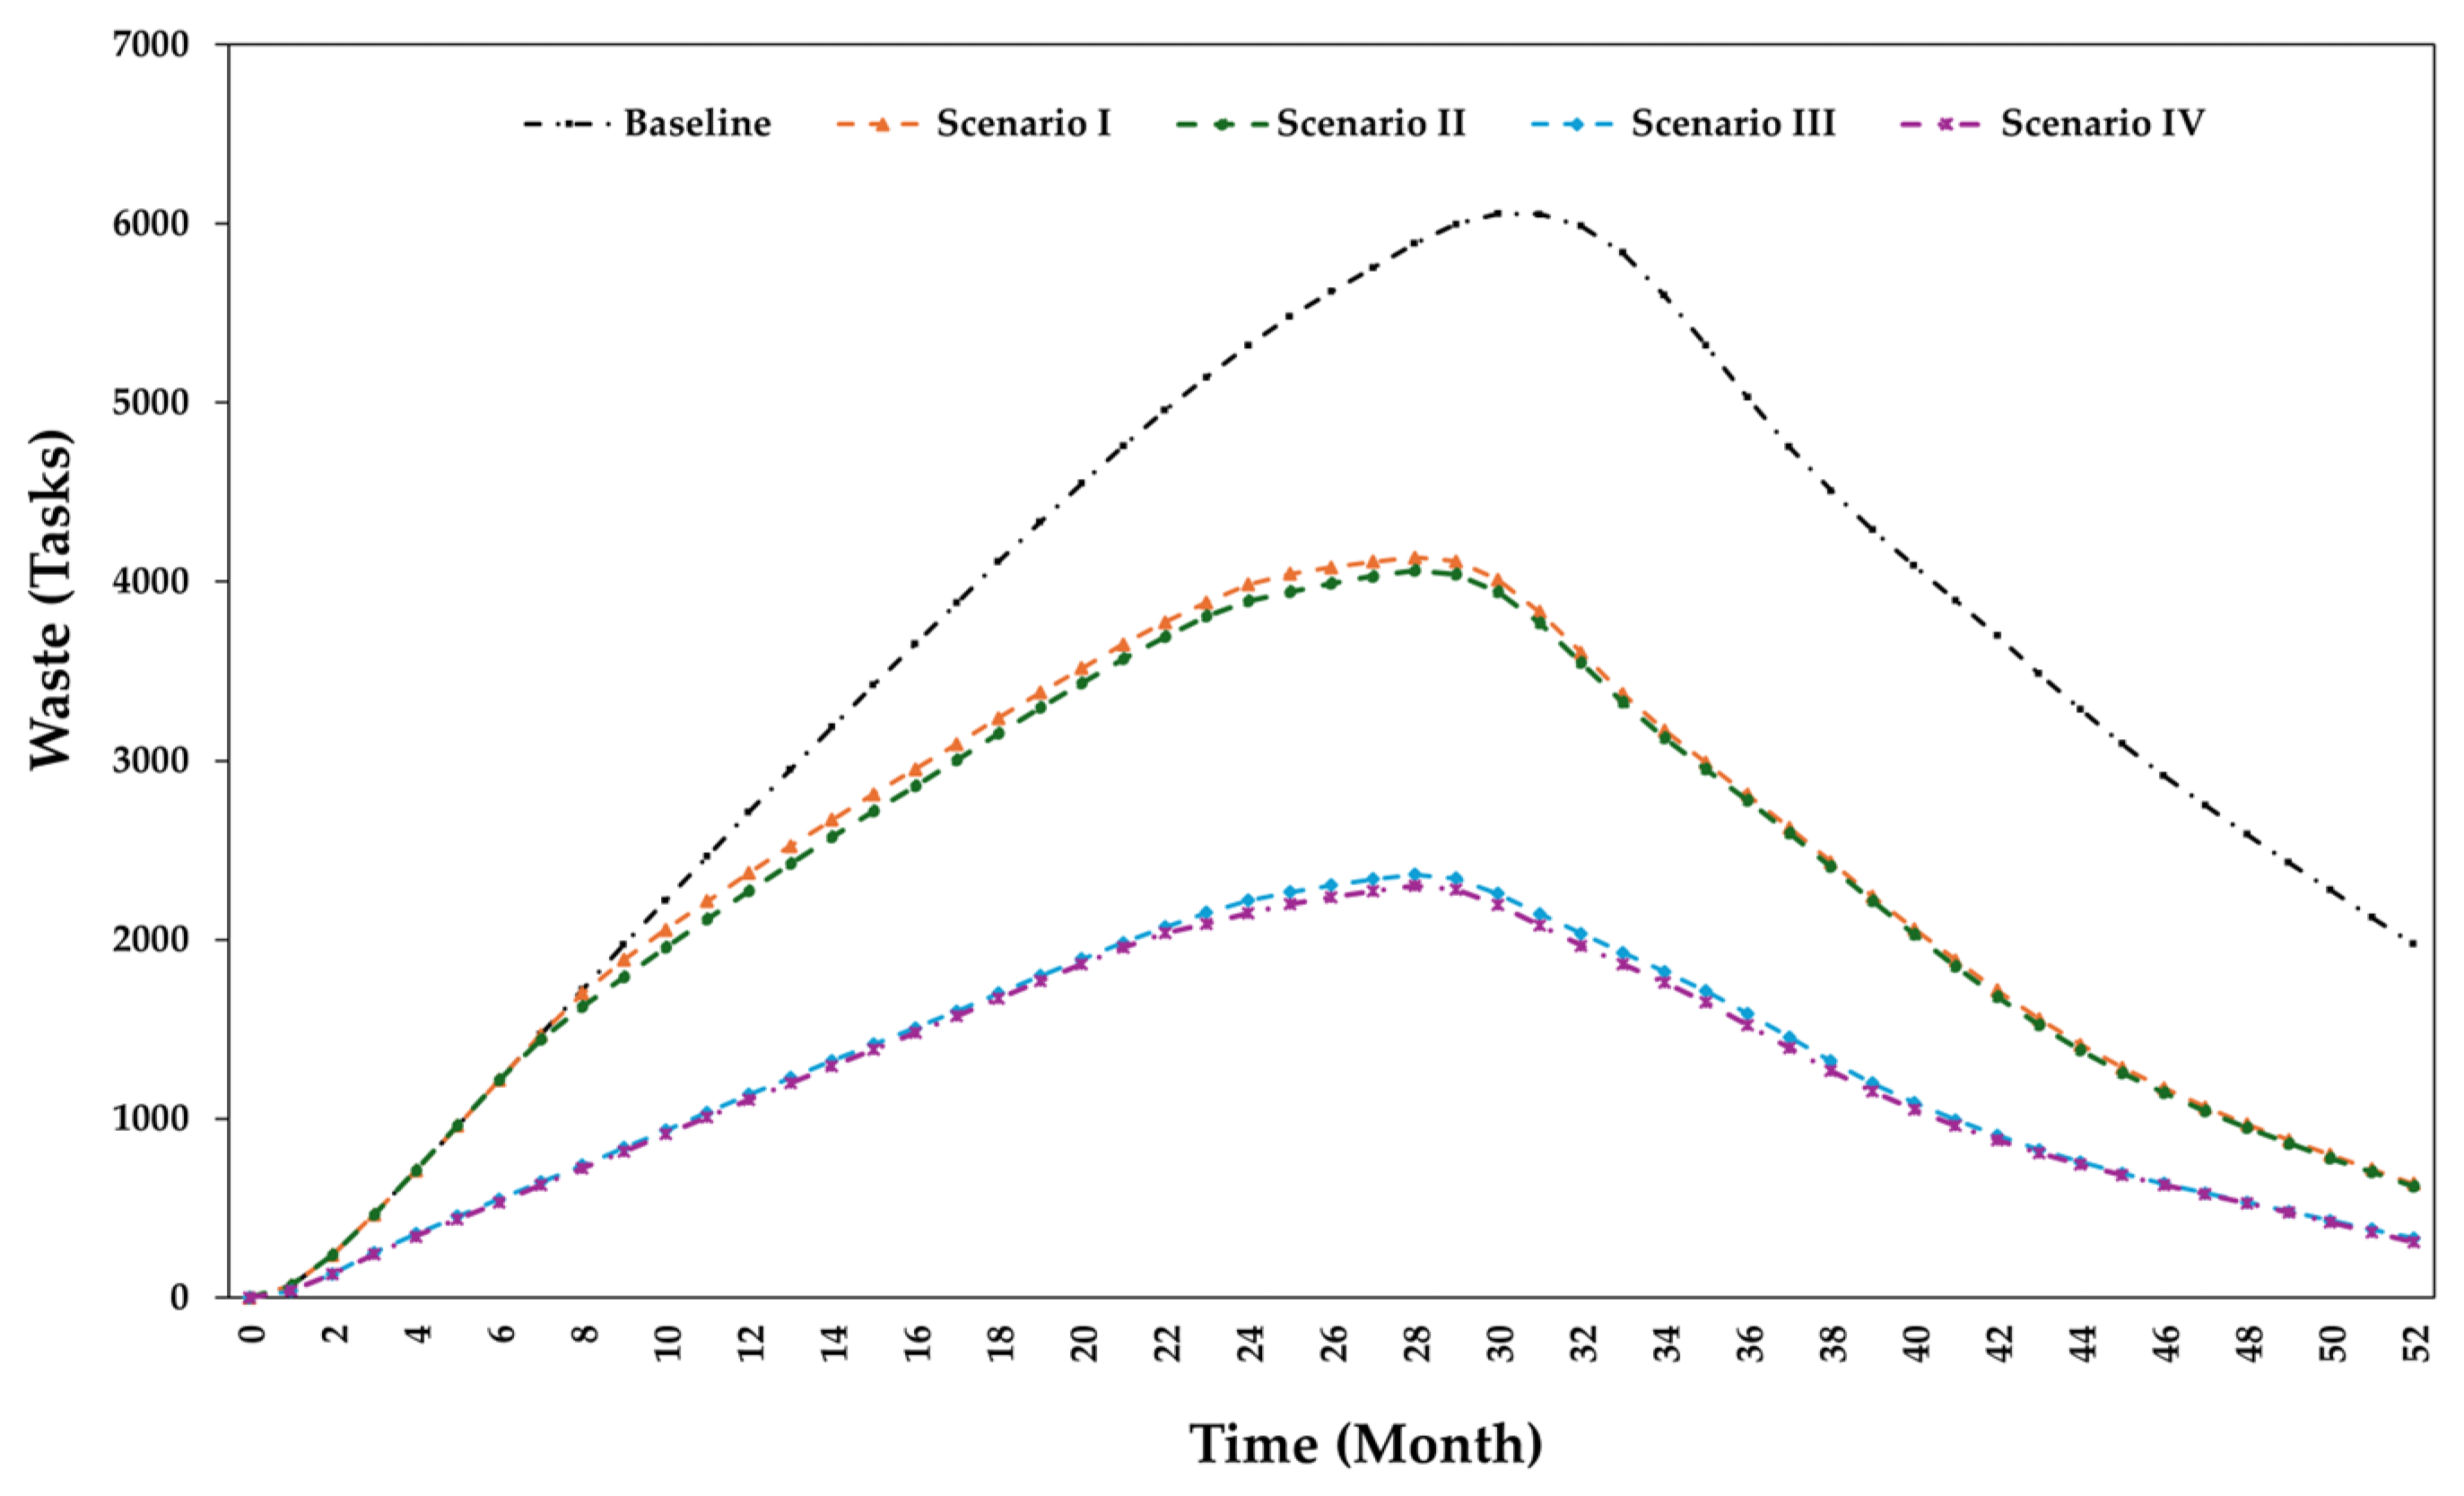
  • Four scenarios have been applied: Scenario I with LPS technical factors, Scenario II with the application of LPS technical factors in addition to collaboration (COO) factors, Scenario III with the application of LPS socio-technical parameters, and Scenario IV with full LPS and BIM parameters.
  • After a series of dynamic simulations for each scenario and compared to the baseline simulation. The dynamic simulation results show that after applying LPS-BIM, construction projects can reduce the number of unresolved constraints, MD decisions, and waste generated by MD, such as material waste, quality deviation, defects, and reworks.
  • Schedule pressure impacts the level of pushing work without proper screening for constraints, which may lead to mishandling uncertainty. However, cost overruns and failure to meet pressures are not considered in the scope of this paper, which is planned for future research.
  • BIM functionalities have a high impact on collaboration but a minimal impact on MDK, while MDK has the maximum value once LPS functions are implemented in integration with BIM.
  • Practical implications include enhancing overall planning reliability, coordination, and control and avoiding wasting resources and time. BIM improves stakeholder communication, while SDM facilitates decision-makers and analyzes multiple outcomes. Thus, further research with interventions to offer construction professionals adequate training to increase their awareness of MD and encourage preventive management measures is needed.
  • This study relies only on SDM, which entails analyzing the system at the strategic level with high levels of aggregation. Such a limitation may hinder a compelling discussion on the entire LPS hierarchy at the operation level. Further research is recommended to utilize SDM in coordination with ABM to incorporate advanced social interaction. Furthermore, there is an exception regarding validating the current SDM because it was validated using only residential projects. It is suggested that the findings be validated with other types of construction (e.g., industrial, healthcare, and transportation projects) to increase the study’s external validity.

Supplementary Materials

The following supporting information can be downloaded at https://www.mdpi.com/article/10.3390/buildings14082314/s1, Figure S1. Simulation results for constraints in Project A; Figure S2. Simulation results for MD in Project A; Figure S3. Simulation results for waste in Project A; Figure S4. Simulation results for constraints in Project B; Figure S5. Simulation results for MD in Project B; Figure S6. Simulation results for waste in Project B; Figure S7. Simulation results for constraints in Project C; Figure S8. Simulation results for MD in Project C; Figure S9. Simulation results for waste in Project C. Table S1: KMO and Bartlett’s Test; Table S2: Component labeling and corresponding criteria from factor analysis; Table S3. Measurement model validation; Table S4. HTMT analysis; Table S5. Loadings, reliability, and convergent validity; Table S6. Structural model validation; Table S7. Mediation analysis summary; Table S8. Evaluated parameters of LPS-BIM; Table S9. Dynamic equations of the proposed SDM; Table S10. Table functions used in the proposed SDM; Table S11. Array dimensions used in Anylogic; Table S12. Simulation results.

Author Contributions

Conceptualization, M.K. and J.M.C.T.; methodology, M.K.; software, M.K.; validation, M.K.; formal analysis, M.K. and T.G.d.A.; investigation, M.K.; resources, M.K., T.G.d.A. and J.M.C.T.; data curation, M.K. and T.G.d.A.; writing—original draft preparation, M.K.; writing—review and editing, M.K., T.G.d.A. and J.M.C.T.; visualization, M.K.; supervision, J.M.C.T. and T.G.d.A.; project administration, J.M.C.T.; funding acquisition, M.K. and J.M.C.T. All authors have read and agreed to the published version of the manuscript.

Funding

This research was funded by the Fundação para a Ciência e a Tecnologia (FCT), grant number 2021. 04751.BD, and the APC was funded by the Universidade do Minho.

Data Availability Statement

The data used in this study is available upon reasonable request from the first author.

Conflicts of Interest

The authors declare no conflicts of interest. The funders had no role in the study’s design, in the collection, analysis, or interpretation of data, in the writing of the manuscript, or in the decision to publish the results.

References

  1. Formoso, C.T.; Bølviken, T.; Viana, D.D. Understanding waste in construction. In Lean Construction Core Concepts and New Frontiers; Tzortzopoulos, P., Kagioglou, M., Koskela, L., Eds.; Routledge: London, UK, 2020; pp. 129–145. [Google Scholar]
  2. Koskela, L.; Ferrantelli, A.; Niiranen, J.; Pikas, E.; Dave, B. Epistemological Explanation of Lean Construction. J. Constr. Eng. Manag. 2019, 145, 04018131. [Google Scholar] [CrossRef]
  3. Horman, M.J.; Kenley, R. Quantifying Levels of Wasted Time in Construction with Meta-Analysis. J. Constr. Eng. Manag. 2005, 131, 52–61. [Google Scholar] [CrossRef]
  4. Daniel, E.I.; Garcia, D.; Marasini, R.; Kolo, S.; Oshodi, O. Improving construction management practice in the gibraltar construction industry. In Proceedings of the 27th Annual Conference of the International Group for Lean Construction, IGLC 2019, Dublin, Ireland, 1–7 July 2019; pp. 539–550. [Google Scholar] [CrossRef]
  5. Nassri, S.; Talebi, S.; Elghaish, F.; Koohestani, K.; McIlwaine, S.; Hosseini, M.R.; Poshdar, M.; Kagioglou, M. Labor waste in housing construction projects: An empirical study. Smart Sustain. Built Environ. 2023, 12, 325–340. [Google Scholar] [CrossRef]
  6. Ohno, T. Toyota Production System: Beyond Large-Scale Production; CRC Press: Boca Raton, FL, USA, 1988. [Google Scholar]
  7. Love, P.E.D.; Li, H. Quantifying the causes and costs of rework in construction. Constr. Manag. Econ. 2000, 18, 479–490. [Google Scholar] [CrossRef]
  8. Josephson, P.E.; Hammarlund, Y. The causes and costs of defects in construction: A study of seven building projects. Autom. Constr. 1999, 8, 681–687. [Google Scholar] [CrossRef]
  9. Kenley, R.; Harfield, T. Removing Hidden Waiting Time in Critical Path Schedules: A Location-Based Approach to Avoiding Waste. In Proceedings of the 23rd Annual Conference of the International Group for Lean Construction, Perth, Australia, 28–31 July 2015; pp. 203–210. [Google Scholar]
  10. Belayutham, S.; González, V.A.; Yiu, T.W. Clean-lean administrative processes: A case study on sediment pollution during construction. J. Clean. Prod. 2016, 126, 134–147. [Google Scholar] [CrossRef]
  11. Sarhan, S.; Pasquire, C.; Manu, E.; King, A. Contractual governance as a source of institutionalised waste in construction. Int. J. Manag. Proj. Bus. 2017, 10, 550–577. [Google Scholar] [CrossRef]
  12. Carvajal-Arango, D.; Bahamón-Jaramillo, S.; Aristizábal-Monsalve, P.; Vásquez-Hernández, A.; Botero, L.F.B. Relationships between lean and sustainable construction: Positive impacts of lean practices over sustainability during construction phase. J. Clean. Prod. 2019, 234, 1322–1337. [Google Scholar] [CrossRef]
  13. Golzarpoor, H.; González, V.; Shahbazpour, M.; O’Sullivan, M. An input-output simulation model for assessing production and environmental waste in construction. J. Clean. Prod. 2017, 143, 1094–1104. [Google Scholar] [CrossRef]
  14. Nahmens, I.; Ikuma, L.H. Effects of Lean Construction on Sustainability of Modular Homebuilding. J. Archit. Eng. 2012, 18, 155–163. [Google Scholar] [CrossRef]
  15. Formoso, C.T.; Soibelman, L.; De Cesare, C.; Isatto, E.L. Material Waste in Building Industry: Main Causes and Prevention. J. Constr. Eng. Manag. 2002, 128, 316–325. [Google Scholar] [CrossRef]
  16. Grosskopf, J.; Menezes, A.S.; Santos, D.G. Proposal of Activities That Facilitate Work in Order to Avoid Workflow Interruptions Caused By Making-Do. In Proceedings of the IGLC-21, Fortaleza, Brazil, 29 July–2 August 2013; pp. 719–728. [Google Scholar]
  17. Koskela, L. An Exploration towards a Production Theory and Its Application to Construction; VTT Technical Research Centre of Finland: Espoo, Finland, 2000. [Google Scholar]
  18. Womack, J.; Jones, D. Lean Thinking-Banish Waste and Create Wealth in Your Corporation; Simon and Schuster: New York, NY, USA, 2003. [Google Scholar]
  19. Koskela, L.; Bølviken, T.; Rooke, J. Which are the wastes of construction? In Proceedings of the 21st Annual Conference of the International Group for Lean Construction 2013, IGLC 2013, Fortaleza, Brazil, 29 July–2 August 2013; pp. 905–914. [Google Scholar]
  20. Koskela, L. Making-do the eighth category of waste. In Proceedings of the 12th Annual Conference of the International Group for Lean Construction, Helsingor, Denmark, 3–5 August 2004; p. 10. [Google Scholar]
  21. Formoso, C.T.; Sommer, L.; Koskela, L.; Isatto, E.L. An Exploratory Study on the Measurement and Analysis of Making-Do in Construction Sites. In Proceedings of the 19th Annual Conference of the International Group for Lean Construction, Lima, Peru, 13–15 July 2011; pp. 1–10. [Google Scholar]
  22. Emmitt, S.; Pasquire, C.; Mertia, B. Is good enough “making do”?: An investigation of inappropriate processing in a small design and build company. Constr. Innov. 2012, 12, 369–383. [Google Scholar] [CrossRef]
  23. Fireman, M.C.T.; Formoso, C.T.; Isatto, E.L. Integrating Production and Quality Control: Monitoring Making-Do and Unfinished Work. In Proceedings of the 21th Annual Conference of the International Group for Lean Construction, Fortaleza, Brazil, 29 July–2 August 2013; pp. 515–525. [Google Scholar]
  24. do Amaral, T.G.; Braga, P.D.B.; Vieira, S.V.; Neto J de, P.B. Relations Between Preconditions, Categories and Impacts of Making-Do Wastes. In Proceedings of the 30th Annual Conference of the International Group for Lean Construction (IGLC), Edmonton, AB, Canada, 25–31 July 2022; pp. 1111–1122. [Google Scholar] [CrossRef]
  25. Neve, H.H.; Wandahl, S. Towards identifying making-do as lead waste in refurbishment projects. In Proceedings of the IGLC 2018—Proceedings of the 26th Annual Conference of the International Group for Lean Construction: Evolving Lean Construction towards Mature Production Management Across Cultures and Frontiers, Chennai, India, 16–22 July 2018; Volume 2, pp. 1354–1364. [Google Scholar] [CrossRef]
  26. Dos Santos, É.M.; Fontenele, A.D.; Lima Machado, A.M.; De Paula Barros Neto, J.; Do Amaral, T.G. Analysis of making-do waste at construction site in Fortaleza, CearÁ, Brazil. In Proceedings of the IGLC 28—28th Annual Conference of the International Group for Lean Construction, Berkeley, CA, USA, 6–12 July 2020; pp. 853–864. [Google Scholar] [CrossRef]
  27. Formoso, C.T.; Sommer, L.; Koskela, L.; Isatto, E.L. The identification and analysis of making-do waste: Insights from two Brazilian construction sites. Ambiente Construído 2017, 17, 183–197. [Google Scholar] [CrossRef]
  28. Alhava, O.; Rinne, V.; Laine, E.; Koskela, L. Can a takt plan ever survive beyond the first contact with the trades on-site? In Proceedings of the 27th Annual Conference of the International Group for Lean Construction, IGLC 2019, Dublin, Ireland, 1–7 July 2019; pp. 453–464. [Google Scholar] [CrossRef]
  29. Pikas, E.; Sacks, R.; Priven, V. Go or No-Go Decisions at the Construction Workface: Uncertainty, Perceptions of Readiness, Making Ready and Making-Do. In Proceedings of the 20th Annual Conference of the International Group for Lean Construction, San Diego, CA, USA, 18–20 July 2012. [Google Scholar]
  30. Ko, C.H.; Chung, N.F. Making Design Process Lean Design. In Proceedings of the IGLC-22, Oslo, Norway, 25–27 June 2014; pp. 463–474. [Google Scholar]
  31. Leão, C.F.; Formoso, C.T.; Isatto, E.L. Integrating Production and Quality Control with the Support of Information Technology Waste in Construction. In Proceedings of the 22nd Annual Conference of the International Group for Lean Construction, Oslo, Norway, 25–27 June 2014; pp. 847–858. [Google Scholar]
  32. Leão, C.F.; Isatto, E.L.; Formoso, C.T. Proposta de modelo para controle integrado da produção e da qualidade com apoio da computação móvel. Ambiente Construído 2016, 16, 109–124. [Google Scholar] [CrossRef]
  33. Etges, B.M.; Reck, R.H.; Fireman, M.T.; Rodrigues, J.L.; Isatto, E.L. Using BIM with the Last Planner® System to improve constraints analysis. In Proceedings of the IGLC 28—28th Annual Conference of the International Group for Lean Construction, Berkeley, CA, USA, 6–12 July 2020; pp. 493–504. [Google Scholar] [CrossRef]
  34. Do Amaral, T.G.; Braga, P.B.; Barros Neto, J.P. Application of dynamic spreadsheets in the analysis of waste by making-do. In Proceedings of the IGLC 28—28th Annual Conference of the International Group for Lean Construction, Berkeley, CA, USA, 6–12 July 2020; pp. 829–840. [Google Scholar] [CrossRef]
  35. Hamzeh, F.R.; Abi Morshed, F.; Jalwan, H.; Saab, I. Is Improvisation Compatible with Lookahead Planning? An Exploratory Study. In Proceedings of the 20th Annual Conference of the International Group for Lean Construction, San Diego, CA, USA, 18–20 July 2012. [Google Scholar]
  36. Sacks, R.; Radosavljevic, M.; Barak, R. Requirements for building information modeling based lean production management systems for construction. Autom. Constr. 2010, 19, 641–655. [Google Scholar] [CrossRef]
  37. Ballard, G.; Tommelein, I.D. 2020 Current Process Benchmark for the Last Planner® System of Project Planning and Control; UC Berkeley: Berkeley, CA, USA, 2021. [Google Scholar]
  38. Sacks, R.; Eastman, C.; Lee, G.; Teicholz, P. BIM Handbook, 3rd ed.; John Wiley & Sons, Inc.: Hoboken, NJ, USA, 2018. [Google Scholar] [CrossRef]
  39. Ronen, B. The complete kit concept. Int. J. Prod. Res. 1992, 30, 2457–2466. [Google Scholar] [CrossRef]
  40. Ballard, G. The Last Planner System of Production Control; University of Birmingham: Birmingham, UK, 2000. [Google Scholar] [CrossRef]
  41. Fireman, M.C.T.; Saurin, T.A. Chain of wastes: The moderating role of making-do. In Proceedings of the IGLC 28—28th Annual Conference of the International Group for Lean Construction, Berkeley, CA, USA, 6–12 July 2020; pp. 409–418. [Google Scholar] [CrossRef]
  42. MacOmber, H.; Gregory, G.A.; Reed, D. Managing promises with the last planner system: Closing in on uninterrupted flow. In Proceedings of the 13th International Group for Lean Construction Conference, Sydney, Australia, 19–21 July 2005; pp. 13–18. [Google Scholar]
  43. Sukster, R. A Integração Entre o Sistema de gestão da Qualidade e o Planejamento e Controle da Produção em Empresas Construtoras. Master’s Thesis, Universidade Federal do Rio Grande do Sul, Farroupilha, Brazil, 2005. [Google Scholar]
  44. Dave, B. Developing a Construction Management System Based on Lean Construction and Building Information Modelling; University of Salford: Salford, UK, 2013. [Google Scholar]
  45. Karaz, M.; Teixeira, J.M.C. A System Dynamic Modelling Approach for Integrated Lean-BIM Planning and Control Methods. In Proceedings of the 31st Annual Conference of the International Group for Lean Construction (IGLC31), Lille, France, 26 June–2 July 2023; pp. 1220–1231. [Google Scholar] [CrossRef]
  46. Forrester, J. Industrial Dynamics; MIT Press: Cambridge, MA, USA, 1961. [Google Scholar]
  47. Kirkwood, C.W. System Dynamics Methods: A Quick Introduction; College of Business, Arizona State University: Tempe, AZ, USA, 1998. [Google Scholar]
  48. Coyle, R.G. System dynamics modelling: A practical approach. J. Oper. Res. Soc. 1997, 48, 544. [Google Scholar] [CrossRef]
  49. Love, P.E.D.; Manual, P.; Li, H. Determining the causal structure of rework influences in construction. Constr. Manag. Econ. 1999, 17, 505–517. [Google Scholar] [CrossRef]
  50. Borshchev, A.; Grigoryev, I. The Big Book of Simulation Modeling Modeling with AnyLogic 8; AnyLogic North America: Oakbrook Terrace, IL, USA, 2020. [Google Scholar]
  51. Kedir, N.; Siraj, N.; Fayek, A.R. Application of System Dynamics in Construction Engineering and Management: Content Analysis and Systematic Literature Review. Adv. Civ. Eng. 2023, 2023, 1058063. [Google Scholar] [CrossRef]
  52. Zhan, Z.; Tang, Y.; Wang, C.; Yap, J.B.H.; Lim, Y.S. System Dynamics Outlook on BIM and LEAN Interaction in Construction Quantity Surveying. Iran. J. Sci. Technol.—Trans. Civ. Eng. 2022, 46, 3947–3962. [Google Scholar] [CrossRef]
  53. Nguyen, D.T.; Sharmak, W. Hybrid Simulation for Value Stream Mapping to Improve the Environmental Performance of the Construction Phase. In Proceedings of the 30th Annual Conference of the International Group for Lean Construction, IGLC 2022, Edmonton, AB, Canada, 25–31 July 2022; pp. 421–432. [Google Scholar] [CrossRef]
  54. Meshref, A.N.; Elkasaby, E.l.A.F.A.; Abdel Kader Mohamed Farid, A. Reducing construction waste in the construction life cycle of industrial projects during design phase by using system dynamics. J. Build. Eng. 2023, 69, 106302. [Google Scholar] [CrossRef]
  55. Omotayo, T.; Awuzie, B.; Egbelakin, T.; Obi, L.; Ogunnusi, M. AHP-systems thinking analyses for kaizen costing implementation in the construction industry. Buildings 2020, 10, 230. [Google Scholar] [CrossRef]
  56. Ko, C.H. Improving Formwork Design Using Lean Thinking. In Lecture Notes in Mechanical Engineering; Springer: Berlin/Heidelberg, Germany, 2020; pp. 435–445. [Google Scholar] [CrossRef]
  57. Cano, S.; Rubiano, O. Dynamics model of the flow management of construction projects: Study of case. In Proceedings of the IGLC 28—28th Annual Conference of the International Group for Lean Construction, Berkeley, CA, USA, 6–12 July 2020; pp. 1045–1056. [Google Scholar] [CrossRef]
  58. Chinda, T. The Use of System Dynamics Modelling in Improving Construction Safety. In Proceedings of the 17th Annual Conference of the International Group for Lean Construction, Taipei, Taiwan, 15–17 July 2009; pp. 91–100. [Google Scholar]
  59. Creswell, J.W.; Creswell, J.D. Research Design: Qualitative, Quantitative, and Mixed Methods Approaches; Sage Publications: Thousand Oaks, CA, USA, 2017. [Google Scholar]
  60. Dusek, G.A.; Yurova, Y.V.; Ruppel, C.P. Using Social Media and Targeted Snowball Sampling to Survey a Hard-to-Reach Population: A Case Study. Int. J. Dr. Stud. 2015, 10, 279. [Google Scholar] [CrossRef]
  61. Hair, J.F.; Babin, B.J.; Black, W.C.; Anderson, R.E. Multivariate Data Analysis; Cengage: Boston, MA, USA, 2019. [Google Scholar]
  62. Singh, C.D.; Khamba, J.S. Structural Equation Modeling. In Manufacturing Competency and Strategic Success in the Automobile Industry; CRC Press: Boca Raton, FL, USA, 2019; pp. 171–188. [Google Scholar] [CrossRef]
  63. Collier, J.E. Applied Structural Equation Modeling Using AMOS; Routledge: London, UK, 2020. [Google Scholar] [CrossRef]
  64. Zlatanovic, D. System Dynamics Models in Management Problem Solving. Econ. Horiz. 2012, 14, 25–38. [Google Scholar]
  65. Wang, Y.; Zhao, J.; Gao, N.; Shen, F. A Dynamic Evaluation Method for the Development of Intelligent Construction Technology in the Construction Field Based on Structural Equation Model–System Dynamics Model. Buildings 2024, 14, 417. [Google Scholar] [CrossRef]
  66. Kaya, H.D.; Dikmen, I. Using System Dynamics to Support Strategic Digitalization Decisions. J. Constr. Eng. Manag. 2024, 150, 04024009. [Google Scholar] [CrossRef]
  67. Lakshmikantham, V.; Deo, S.G. Method of Variation of Parameters for Dynamic Systems; Routledge: London, UK, 2019. [Google Scholar] [CrossRef]
  68. Field, A. Discovering Statistics Using SPSS, 2nd ed.; Sage Publications, Inc: London, UK, 2005. [Google Scholar]
  69. Bentler, P.M. Comparative fit indexes in structural models. Psychol. Bull. 1990, 107, 238–246. [Google Scholar] [CrossRef]
  70. Bagozzi, R.P.; Yi, Y. On the evaluation of structural equation models. J. Acad. Mark. Sci. 1988, 16, 74–94. [Google Scholar] [CrossRef]
  71. Hu, L.; Bentler, P.M. Fit indices in covariance structure modeling: Sensitivity to underparameterized model misspecification. Psychol. Methods 1998, 3, 424–453. [Google Scholar] [CrossRef]
  72. Schumacker, R.E.; Lomax, R.G. A Beginner’s Guide to Structural Equation Modeling, 2nd ed.; Lawrence Erlbaum Associates Publishers: Mahwah, NJ, USA, 2004. [Google Scholar]
  73. Nunnally, J.; Bernstein, I. Psychometric Theory, 3rd ed.; McGraw-Hill: New York, NY, USA, 1994. [Google Scholar]
  74. Fornell, C.; Larcker, D.F. Evaluating structural equation models with unobservable variables and measurement error. J. Mark. Res. 1981, 18, 39–50. [Google Scholar] [CrossRef]
  75. Lyneis, J.M.; Cooper, K.G.; Els, S.A. Strategic management of complex projects: A case study using system dynamics. Syst. Dyn. Rev. 2001, 17, 237–260. [Google Scholar] [CrossRef]
  76. Thomas, H.R.; Maloney, W.F.; Horner, R.M.W.; Smith, G.R.; Handa, V.K.; Sanders, S.R. Modeling Construction Labor Productivity. J. Constr. Eng. Manag. 1990, 116, 705–726. [Google Scholar] [CrossRef]
  77. Garrido, M.C.; Mendes, R.; Scheer, S.; Campestrini, T.F. Using BIM for Last Planner System: Case Studies in Brazil. In Proceedings of the Computing in Civil Engineering (ASCE), Austin, TX, USA, 21–23 June 2015. [Google Scholar]
  78. Seppänen, O.; Modrich, R.; Ballard, G. Integration of Last Planner System and Location-Based Management System. In Proceedings of the 23rd Annual Conference of the International Group for Lean Construction, Perth, Australia, 28–31 July 2015; pp. 123–132. [Google Scholar]
  79. Dave, B.; Kubler, S.; Främling, K.; Koskela, L. Opportunities for enhanced lean construction management using Internet of Things standards. Autom. Constr. 2016, 61, 86–97. [Google Scholar] [CrossRef]
  80. Heigermoser, D.; García de Soto, B.; Abbott, E.L.S.; Chua, D.K.H. BIM-based Last Planner System tool for improving construction project management. Autom. Constr. 2019, 104, 246–254. [Google Scholar] [CrossRef]
  81. Seppänen, O. Location-based management system now and in the future. In Lean Construction; Routledge: London, UK, 2020; pp. 276–300. [Google Scholar]
  82. Kenley, R.; Seppänen, O. Location-Based Management for Construction: Planning, Scheduling and Control, 1st ed.; Spon Press by Taylor & Francis: Abingdon-on-Thames, UK, 2010. [Google Scholar]
  83. Koskela, L. Lean construction as a movement towards theory-based construction management. In Salford Centre for Research and Innovation International Symposium; SD Publishing: Hartlebury, UK, 2004; pp. 33–42. [Google Scholar]
Figure 1. A conceptual diagram of Making-Do phenomena.
Buildings 14 02314 g001
Figure 2. Evaluation criteria for LPS-BIM mitigation strategies.
Buildings 14 02314 g002
Figure 3. The research methodology design.
Buildings 14 02314 g003
Figure 4. (a) Education attainment of the respondents. (b) Occupational roles within the respondent group.
Buildings 14 02314 g004
Figure 5. (a) The percentage of education or knowledge of lean, BIM, and Making-Do terminology, as well as (b) experience in lean construction and BIM (in years).
Buildings 14 02314 g005
Figure 6. (a) Estimated percentage of MD in construction workflows according to the respondents. (b) Examination of respondents’ perspectives on the entities accountable for Making-Do (MD) waste generation.
Buildings 14 02314 g006
Figure 7. (a) Unadjusted measurement model. (b) Adjusted measurement model.
Buildings 14 02314 g007
Figure 8. Mediation analysis for the LPS, BIM, COO, and MDK.
Buildings 14 02314 g008
Figure 9. Causal loop diagram (CLD) of MD.
Buildings 14 02314 g009
Figure 10. A generic view of the stock flow diagrams for MD waste.
Buildings 14 02314 g010
Figure 11. Work progress subsystem.
Buildings 14 02314 g011
Figure 12. The dynamic variables affecting the construction productivity.
Buildings 14 02314 g012
Figure 13. The dynamic subsystem for resources.
Buildings 14 02314 g013
Figure 14. (a) Cost. (b) Locations of subsystems.
Buildings 14 02314 g014
Figure 15. (a) LPS dynamic subsystem. (b) BIM dynamic subsystem.
Buildings 14 02314 g015
Figure 16. Comparative simulations for average constraints in Project A between the baseline and Scenarios I, II, III, and IV.
Buildings 14 02314 g016
Figure 17. Comparative simulations for average MD categories in Project A between the baseline and Scenarios I, II, III, and IV.
Buildings 14 02314 g017
Figure 18. Comparative simulations for average waste in Project A between the baseline and Scenarios I, II, III, and IV.
Buildings 14 02314 g018
Table 1. Demographic characteristics of the survey respondents.
ResponsesPercentage
Total questionnaires sent out336
Total submitted responses118 (35.12%)
Discarded responses2
Total usable responses116 (34.52%)
Years of experience in the construction industry
0–5 years23.61%
6–10 years22.22%
11–15 years19.44%
16–20 years8.33%
Above 20 years12.50%
Table 2. Reliability analysis table with means and ranking of the LPS and BIM strategies for MD mitigation.
NoVariableMeanCronbach’s AlphaRank
VA24Identify and resolve time and space clashes using BIM Clash Detection tools.3.7360.9451
VA23Report task information in alignment with product specifications to ensure accuracy.3.7220.9452
VA25Facilitate the exchange and communication of Making-Do practices through online BIM models.3.7220.9443
VA22Utilize 4D planning to visualize constraints and their impact on project timelines.3.6810.9454
VA5Provide coaching, training, and seminars for superintendents and forepersons.3.6530.9455
VA11Ensure the availability of BIM models, design drawings, and site layout plans for reference during the Last Planner System implementation.3.6110.9446
VA21Facilitate daily discussions between trades to address constraints and coordinate activities.3.5830.9457
VA2Ensure high-level coordination among project stakeholders.3.5420.9468
VA20Collaboratively design operations using BIM for digital prototyping.3.4860.9459
VA12Maintain transparency by keeping all plans publicly accessible.3.4720.94510
VA14Apply constraint analysis proactively to identify and address potential issues as a team.3.4720.94511
VA9Facilitate knowledge exchange and the sharing of experiences among different companies.3.4580.94512
VA3Facilitate discussions to address concerns and foster consensus.3.4440.94513
VA7Establish a data bank to clarify misconceptions regarding lean construction, Making-Do, and Last Planner System principles.3.4440.94614
VA1Handle disagreements and interests effectively to foster collaboration.3.4310.94715
VA6Process and translate knowledge from experiential learning into actionable insights.3.4030.94616
VA13Utilize guiding information across digital and physical environments to enhance understanding.3.4030.94617
VA17Involve stakeholders in constraint management processes to enhance collaboration in mitigating MD.3.3470.94418
VA8Learn from past incidents of Making-Do.3.3060.94619
VA16Encourage stakeholders to communicate and share any constraints that may impede progress.3.2780.94520
VA10Compare and analyze multiple cases to understand how Making-Do is managed.3.2640.94621
VA4Adapt local adjustments to align with organizational requirements.3.1810.94722
VA18Maintain a workable backlog of tasks to prioritize and manage the workload effectively.3.1530.94423
VA15Delay tasks with uncertain constraints to avoid potential disruptions.2.9310.94724
VA19Break down tasks from processes to operations and further to individual tasks for clarity of management and control.2.8890.94725
Table 3. Constraints, MD, and MD impacts.
Constraints MD Categories MD Impacts
P1External ConditionsCAT1Access and MovementI1Decreased Productivity
P2InformationCAT2Component AdjustmentI2Material Waste
P3Interdependent TasksCAT3Equipment/ToolsI3Quality Deviation
P4LaborCAT4SequencingI4Rework
P5Materials and ComponentsCAT5WorkspaceI5Unfinished Works
P6Space
Table 4. Comparative overview of multi-storey condominium projects: Cases A, B, and C.
Project AProject BProject C
Buildings 14 02314 i001Buildings 14 02314 i002Buildings 14 02314 i003
Enterprise CodeMNK
CountryBrazilBrazilFrance
Start and finish datesMarch 2016–March 2021March 2020–September 2023February 2019–March 2021
Project typeConstructionConstructionRehabilitation
Building typeMulti-storey condominiumMulti-storey condominiumMulti-storey building
DescriptionThree towersTwo towersOne tower
Floors/tower20157
No. of units48045140
Land use (m2)944528601223
Table 5. Comparison of baseline simulated data with project data.
CategoryCost Increase ($)Actual Completion Rate (%)Total MD
(Tasks)
Total Constraints (Tasks)Total Waste
(Tasks)
Baseline A76,849.33782.540209.1261956.0663600.587
Project A data75,950.00080.57020519513590
Baseline B29,094.56087.996182.637973.8592427.597
Project B data27,200.00082.0101809682350
Baseline C11,134.50085.652180.345865.9701700.781
Project C data11,100.00083.2131778611699
Table 6. The mix of variables to be tested in Scenarios I to IV.
Tested VariableInvolved ParametersValues
Scenario ILPS technical factors enabledVA10, VA11, VA12, VA13, VA14, VA15, VA16, VA17, VA18, VA19, VA20, VA21All values set to five
Scenario IILPS technical factors enabled, associated with collaboration factorsVA6, VA7, VA8, VA9, VA10, VA11, VA12, VA13, VA14, VA15, VA16, VA17, VA18, VA19, VA20, VA21All values set to five
Scenario IIILPS socio-technical factors enabled with the association of Making-Do knowledge factorsVA1, VA2, VA3, VA5, VA6, VA7, VA8, VA9, VA10, VA11, VA12, VA13, VA14, VA15, VA16, VA17, VA18, VA19, VA20, VA21All values set to five
Scenario IVLPS socio-technical factors + BIM enabledVA1, VA2, VA3, VA5, VA6, VA7, VA8, VA9, VA10, VA11, VA12, VA13, VA14, VA15, VA16, VA17, VA18, VA19, VA20, VA21, VA22, VA23, VA24, VA25All values set to five
Table 7. Project A—baseline simulation, results of four simulated scenarios, and percentage improvements from baseline.
VariableBaselineScenario IScenario IIScenario IIIScenario IV
MD
Categories
CAT123.75415.57215.57211.79511.284
CAT299.03274.65574.09366.20866.455
CAT311.7607.3517.1945.1594.629
CAT453.45043.50843.31538.87839.017
CAT521.13015.76015.36612.31511.587
ConstraintsP149.81439.38138.62233.52830.993
P2158.584142.457141.579135.694125.442
P3221.538163.799157.679122.372109.533
P4572.133457.476446.363381.997344.119
P5766.068559.156544.587430.870382.813
P6187.928124.644121.70285.20875.007
MD
Impacts
I1292.140199.919194.74197.08692.304
I2322.522213.900209.476129.549124.458
I3354.241235.027229.363112.556109.578
I41247.717766.449747.751417.300404.727
I51383.967941.289941.289507.161498.680
Completion Rate (%)82.54094.84594.79495.35198.962
Cost$76,849.33773,566.8569,040.0861,036.0060,893.31
Disclaimer/Publisher’s Note: The statements, opinions and data contained in all publications are solely those of the individual author(s) and contributor(s) and not of MDPI and/or the editor(s). MDPI and/or the editor(s) disclaim responsibility for any injury to people or property resulting from any ideas, methods, instructions or products referred to in the content.

