Article

Thermal Effects on Prestress Loss in Pretensioned Concrete Girders

1
School of Civil Engineering, Southwest Jiaotong University, Chengdu 610031, China
2
Sichuan Jiaoda Engineering Detection & Consulting Co., Ltd., Chengdu 610031, China
*
Author to whom correspondence should be addressed.
Buildings 2024, 14(8), 2325; https://doi.org/10.3390/buildings14082325 (registering DOI)
Submission received: 16 June 2024 / Revised: 23 July 2024 / Accepted: 25 July 2024 / Published: 27 July 2024

Abstract

:
The fabrication process of pretensioned prestressed concrete (PC) girders involves temperature changes, which affect the effective prestress and mechanical properties of the girders. Currently, there is a lack of a holistic understanding and accurate calculation methods for the prestress variation due to temperature change (PVTC), leading to technical challenges in calculating effective prestress in pretensioned PC girders. This study investigates the PVTC in three stages considering the time-varying interaction between concrete and tendons, proposes a new method to consider the effect of a deviator on the PVTC of a bent tendon, conducts an experimental study to validate the theoretical analysis, and develops measures for reducing the PVTC. The results show that the presented method provides reasonable predictions of PVTC, and the PVTC of the girder with steam curing is up to 80.3 MPa. Based on the presented method, measures for reducing the PVTC are proposed. This study provides new insights into computing the PVTC and improves the design and fabrication of pretensioned PC girders.

1. Introduction

In recent years, pretensioned prestressed concrete (PC) girders have been widely applied for accelerated bridge construction [1,2]. The PC girders are prefabricated in a plant with high quality control and transported to the construction site for rapid assembly, greatly shortening the construction time and mitigating traffic congestion [3]. According to the internal loading of the girder, straight tendons are used to improve the bending resistance, and bent tendons are used to improve the shear resistance [4].
Prestress plays an important role in the cracking resistance and camber of PC girders [5,6,7]. Existing studies have shown that the effective prestress in the pretensioned PC girder changes with temperature during fabrication [8,9,10]. The change in the effective prestress affects the mechanical properties of the girder. Accurate prediction of prestress variation due to temperature change (PVTC) is a prerequisite in determining the effective prestress, which is essential in the design, fabrication, and operation of PC girders. Currently, the PVTC (Δσ) of a tendon in a PC girder is calculated using Equation (1) [11,12]:
Δ σ = k · α t · Δ T · E t
where αt and Et are the thermal expansion coefficient and elastic modulus of tendon, respectively; ΔT is the temperature change for the tendon, defined as the difference between the maximum temperature (Tmax) of the tendon during the curing of concrete and the temperature (T0) at tensioning of the tendon in existing codes [13,14,15]; k is a coefficient.
In Equation (1), different codes take different values for k, with the European code taking 0.5 [13], the German code taking 0.65 [14], and the Chinese code taking 1.0 [15]. All the codes take an empirical and safety point of view and do not analyze in depth at the mechanistic level, which leads to inaccurate calculation results. Moreover, the above equation has three limitations: (1) The equation focuses on the stage before formation of bonding between concrete and tendons but cannot be used to calculate the PVTC after the formation of bonding [16,17,18]. (2) There is a time-varying interaction between the tendon and concrete, so the PVTC must be analyzed in each stage [19,20,21]. (3) The above equation is only available for straight tendons; to date, there is no research on the PVTC of bent tendons in pretensioned PC girders; compared with straight tendons, bent tendons interact with the deviator, thus affecting the prestress significantly [22,23,24].
This paper aims to develop a new and unified method that can be applied to calculate the PVTC of both straight and bent tendons. The PVTC was analyzed in three stages to consider the time-varying interaction between tendons and concrete. The calculation method of stress adjustment was proposed to consider the effect of the deviator on the PVTC. An experiment was conducted to validate the theoretical analysis. Parametric studies were carried out to develop effective measures for reducing the PVTC. The investigated parameters include the temperature at the operation of tensioning the tendons, the temperature at the bonding development between concrete and tendons, and the thermal expansion of concrete. This study is expected to enable reasonable prediction of the PVTC and facilitate the design and fabrication of pretensioned PC girders.

2. Theoretical Analysis

2.1. Straight Tendons
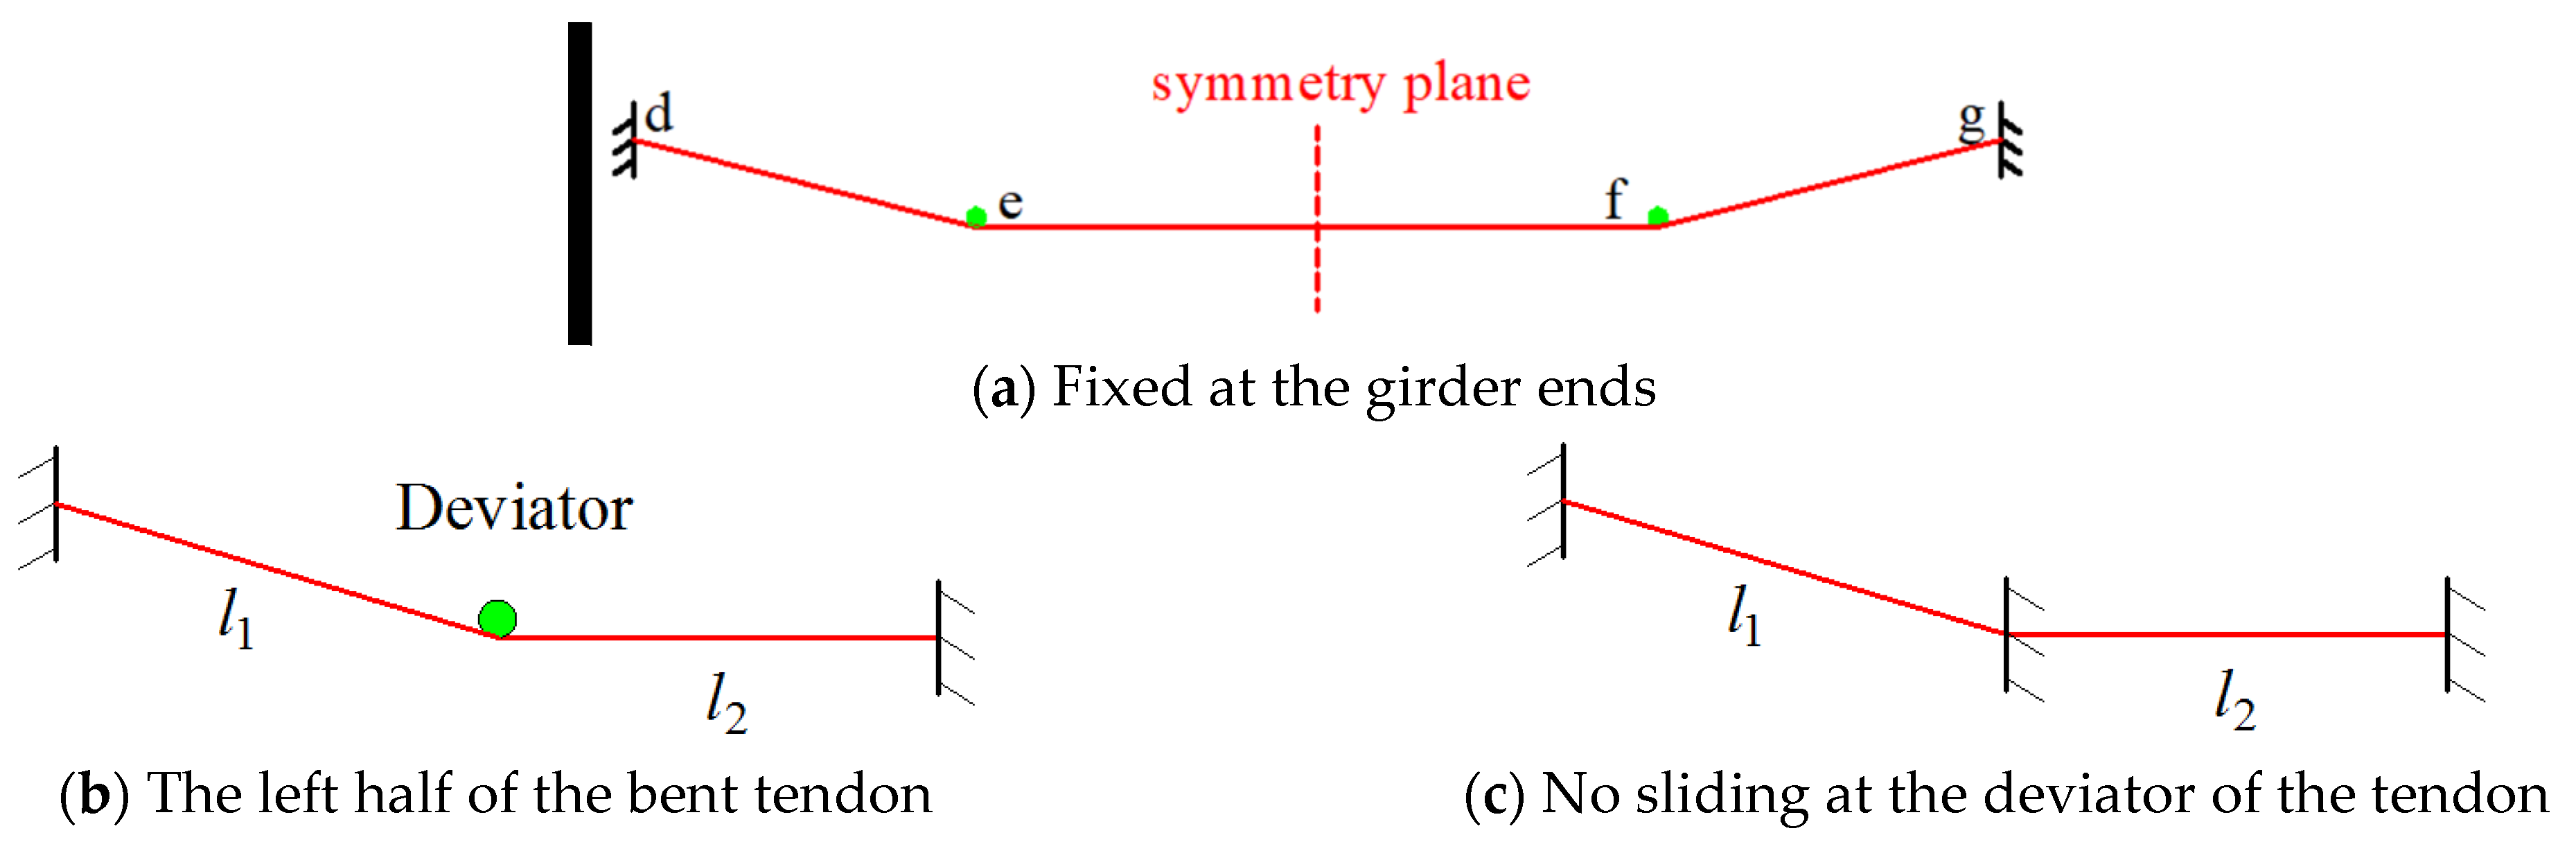
The arrangement of tendons and typical fabrication of pretensioned PC girders is shown in Figure 1. The prestressing tendons (red lines) are passed through the girder. Deviators (green circles) control the path of bent tendons. The tendons are anchored on the rigid frame at the two ends (a, a′, j, j′), and the rigid frames are anchored to the foundation. There is no longitudinal deformation for the two ends of tendons.
The PVTC of a straight tendon is analyzed in three stages to consider the time-varying interaction between tendons and concrete.
(I) The first stage: from tensioning prestressing tendons to pouring concrete. There is no interaction between the tendon and concrete at this stage. The longitudinal deformation of the straight tendon due to temperature change is limited by the constraints at the two ends (a′, j′, see Figure 1), leading to Δσs1:
Δ σ s 1 = α t · Δ T s 1 · E t
where ΔTs1 is the ambient temperature change at the first stage;
(II) The second stage: from pouring concrete to development of the bonding between the tendons and concrete. There is a weak interaction between the tendon and concrete at this stage due to the bite force between them. The PVTC can be analyzed in two curing scenarios: natural curing and steam curing;
(II-1) Under natural curing, the temperature of the external segments a′–d′ and g′–j′ is consistent with the ambient temperature, and the internal segment d′–g′ is consistent with the concrete temperature. If the straight tendon moves freely, the thermal elongation (Δls2) is as follows:
Δ l s 2 = α t · Δ T a d 2 · l a d + Δ T d g 2 · l d g + Δ T g j 2 · l g j
where ΔTa′d′2, ΔTd′g′2, and ΔTg′j′2 are the temperature differences of the tendon segments (a′d′, dg′, and g′j′) at the second stage; la′d′, ld′g′, and lg′j′ are the lengths of the tendon segments (a′d′, d′g′, and g′j′), respectively. The tendon is restrained by the rigid frames at both ends with a constant length, thus leading to the PVTC (Δσs2) under natural curing.
After the concrete is poured, the weak interaction due to the bite force between concrete and tendons alleviates the PVTC, so a reduction coefficient (kb) is introduced:
Δ l s 2 = Δ σ s 2 · l a j k b · E t
Δ σ s 2 = k b · α t · E t · Δ T a d 2 · l a d + Δ T d g 2 · · l d g + Δ T g j 2 · l g j l a j
(II-2) Under steam curing, the PVTC (Δσs2) of a straight tendon is as follows:
Δ σ s 2 = k b · α t · E t · Δ T a c 2 · l a c + Δ T c d 2 · l c d + Δ T d g 2 · l d g + Δ T g h 2 · l g h + Δ T h j 2 · l h j j l a j
If the length of the segments a′–d′ and g′–j′ is far less than that of the segment d′–g′, ld′g′ is approximately equal to la′j′. Thus, Equations (5) and (6) can be simplified as follows:
Δ σ s 2 k b · α t · Δ T d g 2 · E t
(III) The third stage: after the bonding development. There is a strong interaction between concrete and tendon, and no relative sliding between them occurs at this stage. The PVTC is generated by the different thermal expansion coefficients of the tendons and concrete. The PVTC (Δσs3) of the straight tendons is as follows:
Δ σ s 3 = E c · A c E c · A c + E t · A t · α t α c · Δ T 3 · E t
where Ec and αc are the elastic modulus and the thermal expansion coefficient of concrete in the current stage; Ac is the cross-sectional area of concrete; At is the total cross-sectional area of tendons; and ΔT3 is the temperature change for concrete in the third stage.
Because EtAt is far less than EcAc, Equation (8) can be simplified:
Δ σ s 3 α t α c · Δ T 3 · E t
In summary, the total PVTC of straight tendon Δσs is as follows:
Δ σ s = Δ σ s 1 + Δ σ s 2 + Δ σ s 3

2.2. Bent Tendons

Different from the straight tendons, the PVTC of bent tendons is affected by the deviator because of the friction at the contact interfaces. If the length of external tendon segments is much less than that of the internal segments (ldglaj in Figure 1), the effect of the external segments on the PVTC can be ignored (see Figure 2a). Due to symmetry, half of the tendon is analyzed, as shown in Figure 2b.
At the first stage, if there is no sliding between the tendon and deviator, the tendon is considered to be fixed at the fold point, as shown in Figure 2c. With a temperature change, the PVTC ( Δ σ l 1 and Δ σ l 2 ) of the tendon segments l1 and l2 can be expressed as follows:
Δ σ l 1 = α t · Δ T l 1 · E t
Δ σ l 2 = α t · Δ T l 2 · E t
where ΔTl1 and ΔTl2 are the temperature changes for the tendon segments l1 and l2, respectively.
The stresses σ l 1 and σ l 2 of the tendon segments l1 and l2 can be written as follows:
σ l 1 = σ l 1 + Δ σ l 1
σ l 2 = σ l 2 + Δ σ l 2
where σ l 1 and σ l 2 are the initial stresses of the segments l1 and l2, respectively. The initial stresses are constant and dependent on the specific design.
To judge whether there is sliding or not between the tendon and deviator, two assumptions are made: (i) The reverse friction is equal to the forward friction. (ii) The maximum static friction is equal to the kinetic friction between the deviator and tendon. The friction-induced stress σf is equal to the forward sliding friction divided by the cross-sectional area of the tendon. There are three different scenarios:
(1) If σ f σ l 1 σ l 2 σ f , there is no sliding between the deviator and tendon:
σ l 1 = σ l 1
σ l 2 = σ l 2
Δ σ l 1 = Δ σ l 1
Δ σ l 2 = Δ σ l 2
where σ l 1 and σ l 2 are the stresses of the tendon segments l1 and l2, respectively, after the temperature changes; Δ σ l 1 and Δ σ l 2 are the actual PVTC of the tendon segments l1 and l2, respectively, at the first stage.
(2) If σ l 1 σ l 2 > σ f , there is relative sliding between the deviator and tendon. Thus, the stresses in the tendon segments before and after the deviator are redistributed. The stress adjustment method is applied to analyze the stress redistribution:
σ l 1 σ l 2 = σ f
The deformations Δl1 and Δl2 of the tendon segments l1 and l2 are as follows:
Δ l 1 = σ l 1 σ l 1 E t · l 1
Δ l 2 = σ l 2 σ l 2 E t · l 2
Δ l 1 = Δ l 2
Equations (19) to (22) can be solved as follows:
σ l 1 = σ l 1 · l 1 + σ l 2 · l 2 + σ f · l 2 l 1 + l 2
σ l 2 = σ l 1 · l 1 + σ l 2 · l 2 σ f · l 1 l 1 + l 2
Δ σ l 1 = σ l 1 σ l 1
Δ σ l 2 = σ l 2 σ l 2
(3) If σ l 1 σ l 2 < σ f , there is relative sliding between the deviator and tendon. Similarly, the stresses can be calculated as follows:
Δ σ l 1 = σ l 1 σ l 1 = σ l 1 · l 1 + σ l 2 · l 2 σ f · l 2 l 1 + l 2 σ l 1
Δ σ l 2 = σ l 2 σ l 2 = σ l 1 · l 1 + σ l 2 · l 2 + σ f · l 1 l 1 + l 2 σ l 2
The PVTC ΔσF1 and ΔσF2 of the bent tendons at the first and second stages can be calculated with the stress adjustment in Equations (11)–(28). The reduction coefficient kb (see Section 2.1) is considered at the second stage. There is no relative sliding between the deviator and tendon at the third stage. The PVTC ΔσF3 is as follows:
Δ σ F 3 α t α c · Δ T 3 · E t
The total PVTC ΔσF of the bent tendon is as follows:
Δ σ F = Δ σ F 1 + Δ σ F 2 + Δ σ F 3

2.3. Pedestal with Bottom Countertop

Figure 3 illustrates another type of pedestal, comprising rigid frames at both ends and a countertop at the bottom; the rigid frames and the countertop are connected. There are longitudinal displacements at both ends of the pedestal under variable temperature. If the longitudinal temperature deformation of the pedestal is consistent with that of the tendon, the PVTC will be reduced, otherwise it will rise. The effect of longitudinal temperature deformation of the pedestal on the PVTC occurs before the formation of bonding between the tendons and concrete (the first and second stage).
The effect of the pedestal deformation on PVTC can be calculated with Equation (31):
Δ σ p α p · Δ T p · E t
where Δσp is the prestress variation of the tendon due to the pedestal deformation under temperature change; αp is the thermal expansion coefficient of the countertop of the pedestal; and ΔTp is the temperature change for the pedestal from the tensioning prestressing of the tendons to the development of bonding.
Therefore, the PVTC (Δσ) of the tendons can be obtained:
Δ σ = Δ σ 1 + Δ σ 2 + Δ σ 3 + Δ σ p
where Δσ1, Δσ2, and Δσ3 are the PVTC in the first, second, and third stages, respectively.

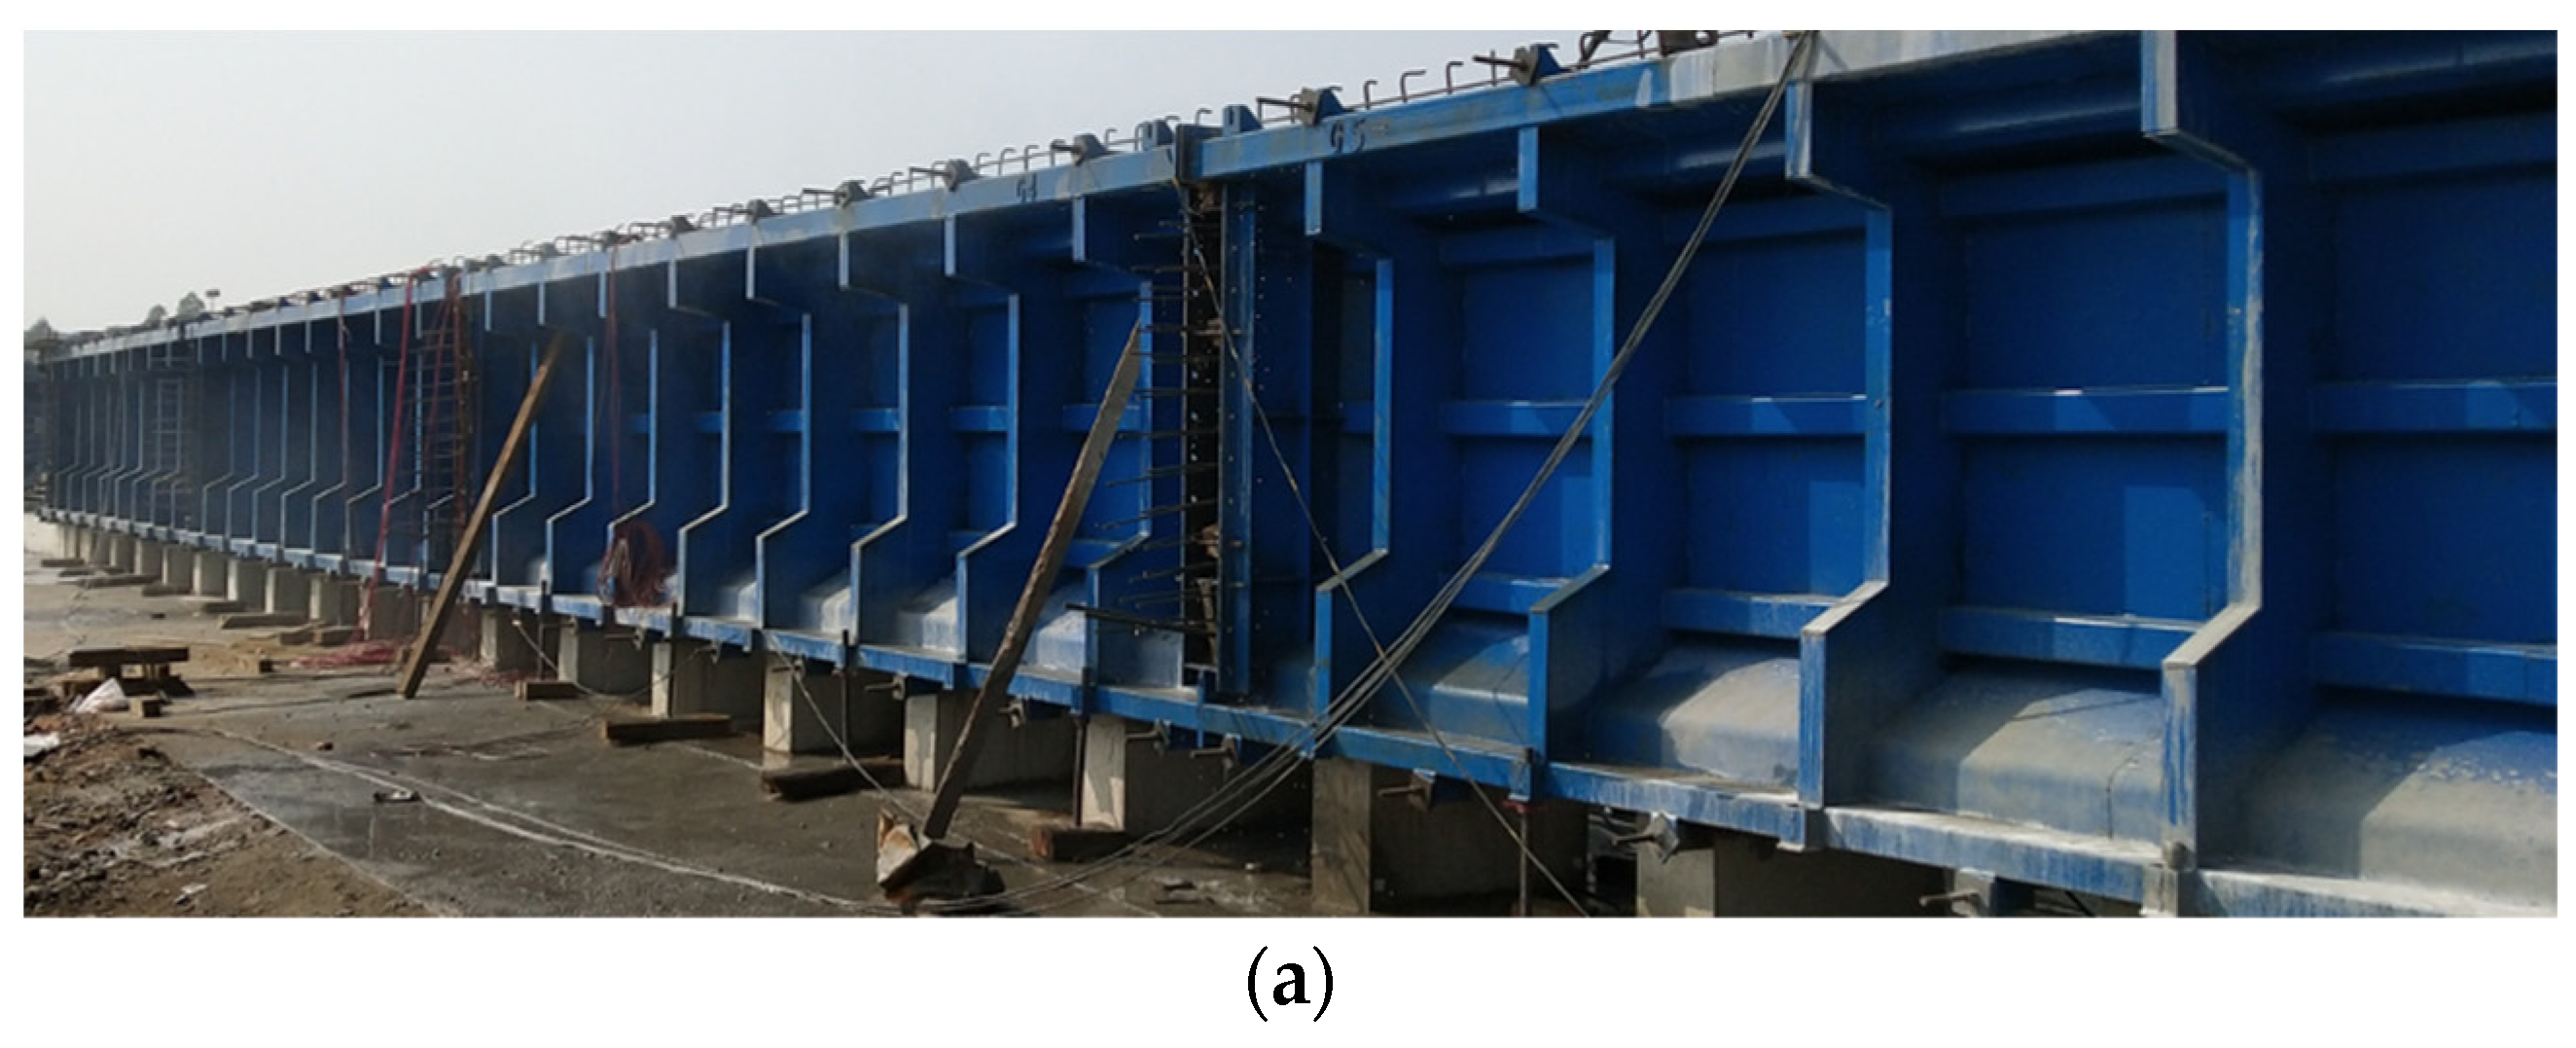
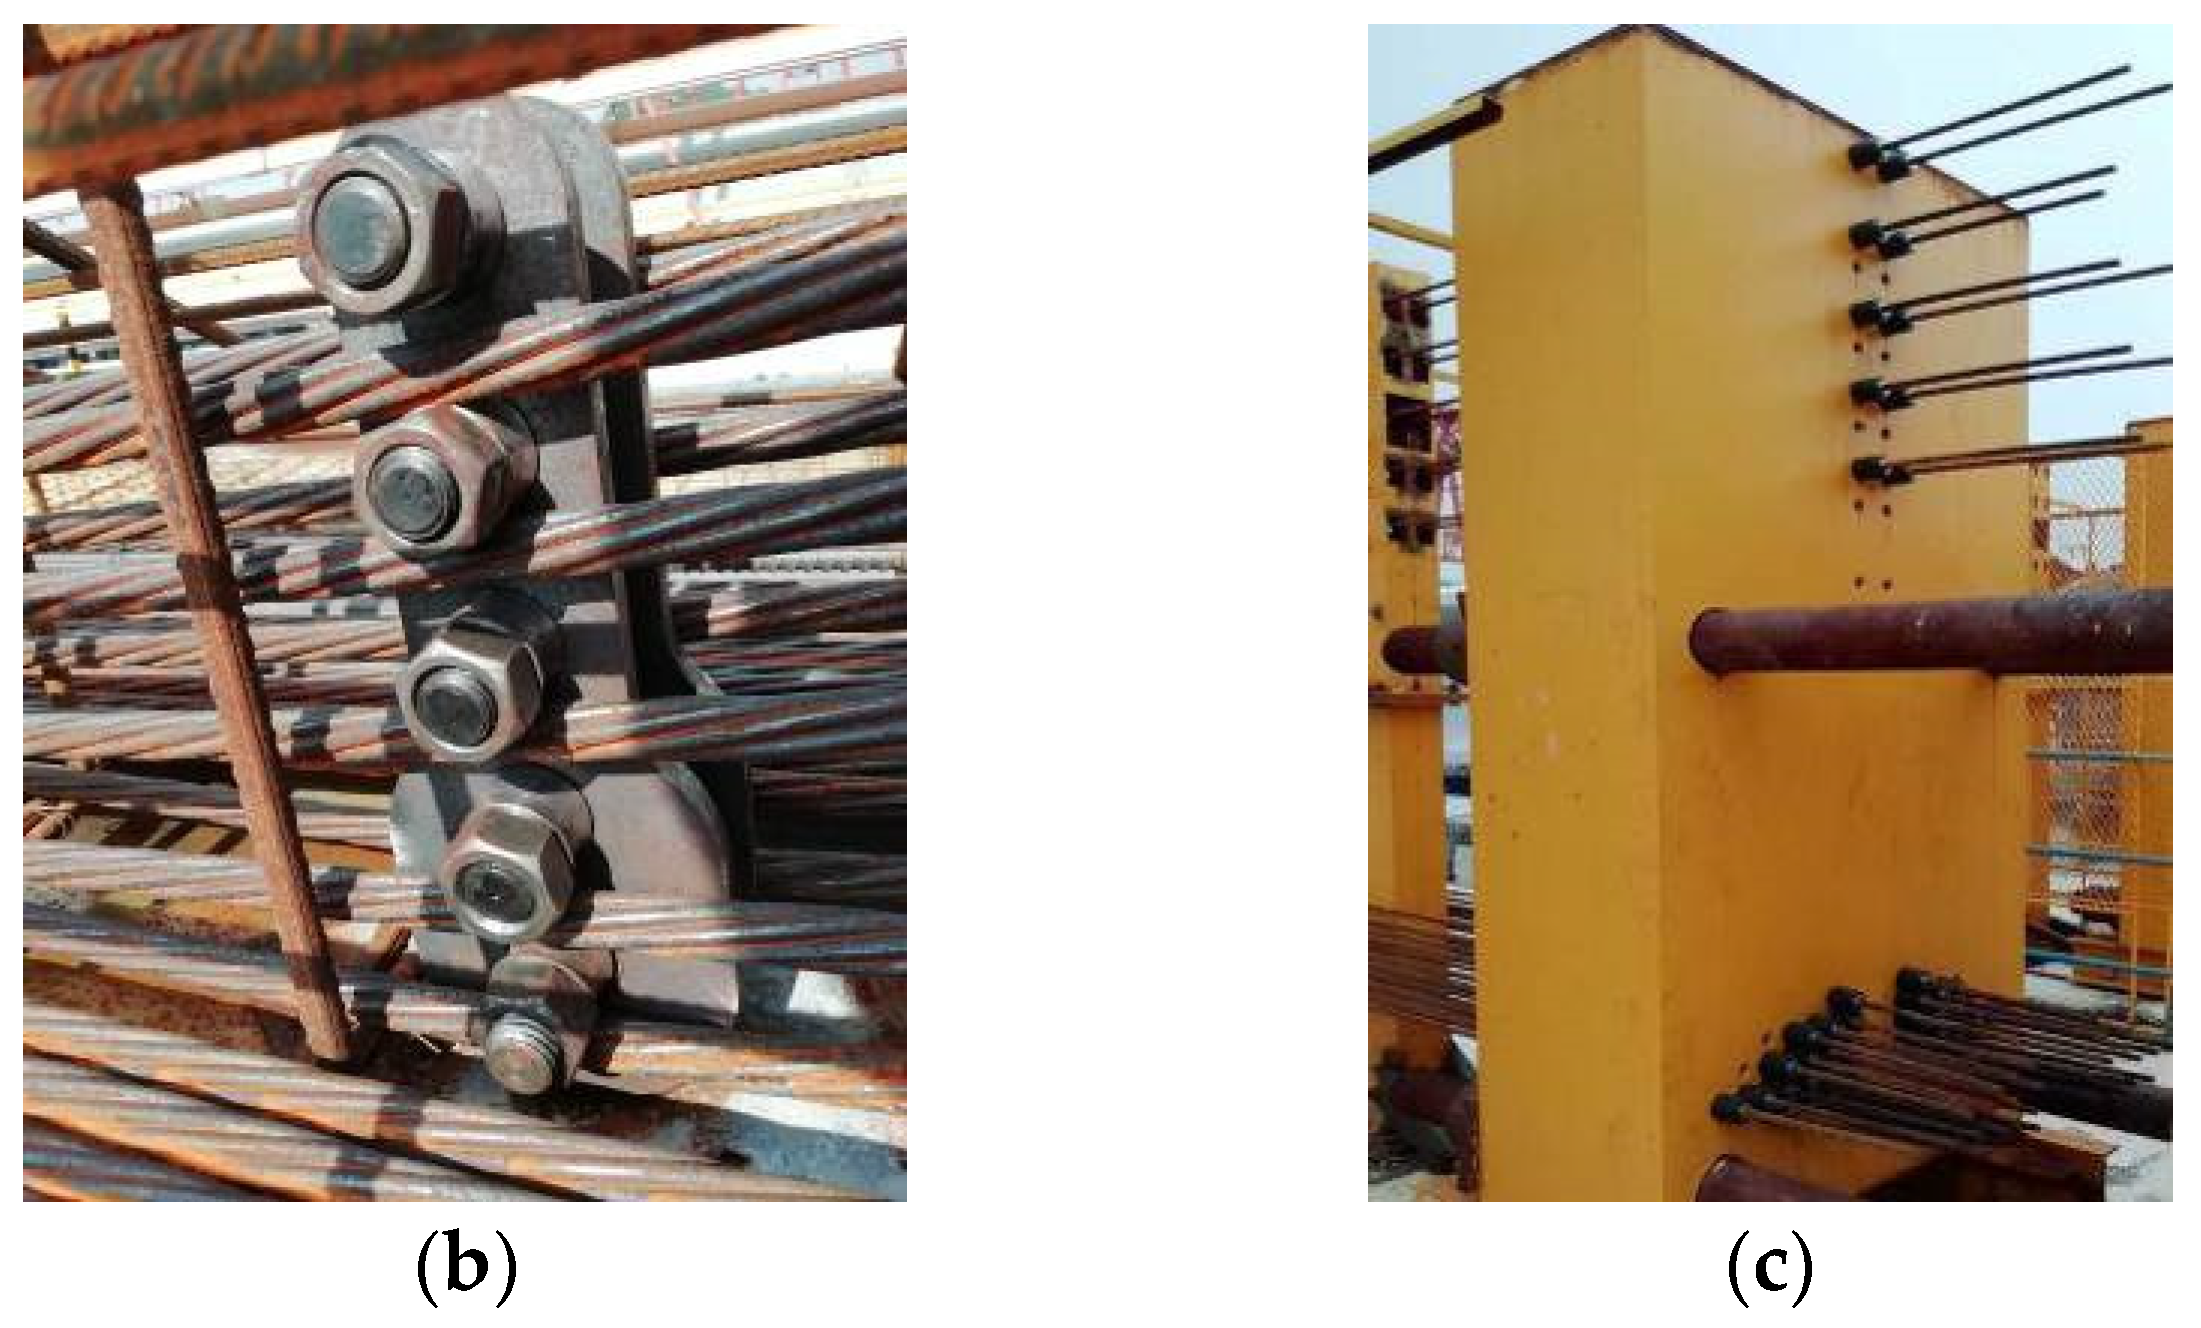
3. Experimental Investigation

3.1. Design of Experiment

An experimental study was conducted to validate the theoretical analysis and provide guides for the design, fabrication, and evaluation of the pretensioned PC girders. In this study, the experimental girder was fabricated on a typical immovable pedestal (see Figure 1). The strands are anchored on the rigid frames at both ends, and the rigid frames are anchored to the foundation, as shown in Figure 1 and Figure 4.
The length and height of the PC girders are 35 m and 2 m, respectively, as shown in Figure 5. The girders are fabricated using C70 concrete and prestressed using seven-wired low-relaxation strands (diameter: 15.2 mm, cross-sectional area: 140 mm2, and tensile strength fpk: 1860 MPa). The manufacturer-specified thermal expansion coefficient is 1.2 × 10⁻⁵/°C for the strands and 1.0 × 10⁻⁵/°C for the concrete. The manufacturer-specified elastic modulus of the strands is 195 GPa. The control stress of the strands is 1395 MPa, which is 75% of the tensile strength (fpk). Each girder has 10 bent strands and 36 straight strands, as shown in Figure 5. The arrangement of strands is symmetrical to the mid-span of each girder. The bent strands are bent upwards from the cross sections that are 900 cm away from the end sections. Five pairs of strands are bent, and the inclined angles are 7.56°, 8.18°, 8.80°, 9.41°, and 10.03°, respectively.
Regarding instrumentation, magnetic flux sensors (force measurement accuracy: 1 N) were used to measure tensile forces in the strands through the Villari effect (or magnetoelastic effect). At the time of tensioning the strands, the magnetic properties of the strands were changed [25,26,27], so the actual tension force in the strand could be evaluated. The magnetic flux sensors were pre-calibrated before the experiment. The strand is passed through the magnetic flux sensor, as shown in Figure 6. For each girder, the sensors were deployed on four bent strands (measuring points 5#, 6#, 7#, and 8#) and two straight strands (measuring points 9# and 10#) at the mid-span (section C-C), as shown in Figure 5a and Figure 6. The locations of the sensors are marked by squares in Figure 6. There were 12 magnetic flux sensors arranged in Girders #1 and #2 (six sensors for each girder). In the measurement, the magnetic signal of the strand was collected via the magnetic flux sensor and then transmitted (through a junction box) to a magneto-elastic instrument for analysis. The magnetic signals were converted into tension forces in the strands. The internal structure of the sensor and the principle of transformation between magnetic signal and force are shown in the literatures [25,26,27].
At the same time, temperatures were also measured via the magnetic flux sensors. The theoretical values of the PVTC were calculated according to the analysis in this paper and the measured temperatures. The theoretical and measured values were compared for validation.
Girder #1 was cured under steam curing, with the corresponding temperature–time curve presented in Figure 7. Girder #2 was naturally cured.

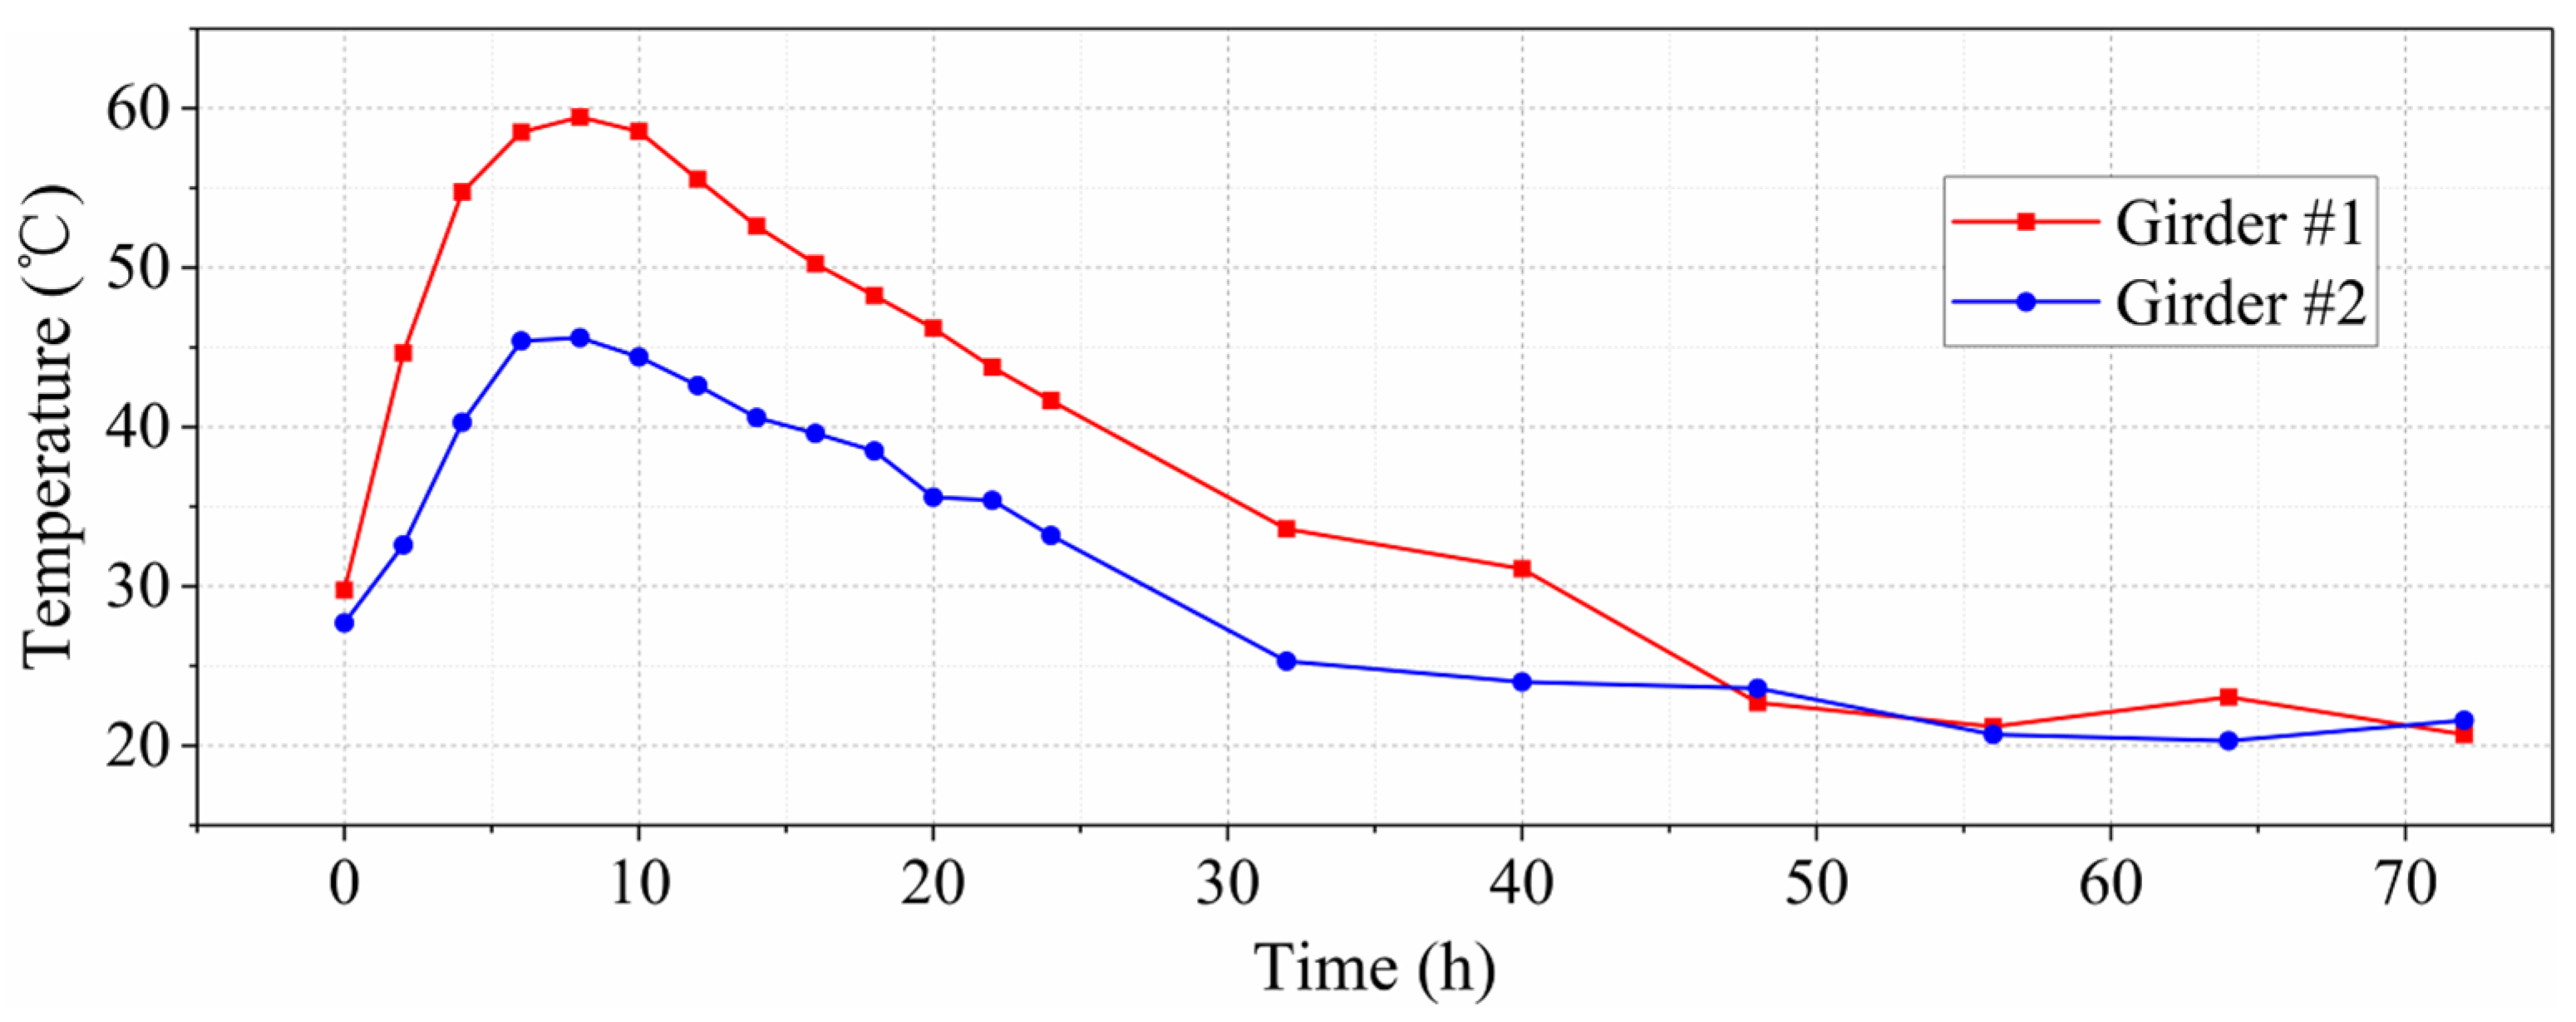
3.2. Temperature Variation

The average temperature of measuring points 9# and 10# are plotted in Figure 8. The tensioning operation of the prestressing strands was performed at t = −115 h, and the ambient temperature at the time was 16.0 °C. The concrete was cast from t = −2 h to t = 0 h. The temperature increased after concrete casting due to the heat of hydration of the cement.
The temperature of Girder #1 gradually increases from 0 to 8 h and reaches a peak at t = 8 h; the peak temperature is close to 60 °C. Then, the temperature gradually decreases, but the rate of temperature decrease is smaller than that of the temperature increase. At t = 48 h, the temperature gradually stabilized at about 22.5 °C, which indicated the completion of the PVTC process. The temperature of box Girder #2 gradually increased between 0 and 8 h, and peaked at t = 8 h, but the peak temperature was decreased compared to box Girder #1, which was about 45 °C, and then the temperature gradually decreased. At t = 32 h, the temperature gradually stabilized, which indicated the completion of the PVTC process. Compared to box Girder #1, box Girder #2 exhibited a shorter duration of the PVTC process due to the lower peak temperature.
According to existing material test data, the initial setting time of concrete under steam curing conditions is earlier than that under natural curing conditions. The average initial setting time under steam curing is 8 h, while under natural curing it is 10 h.

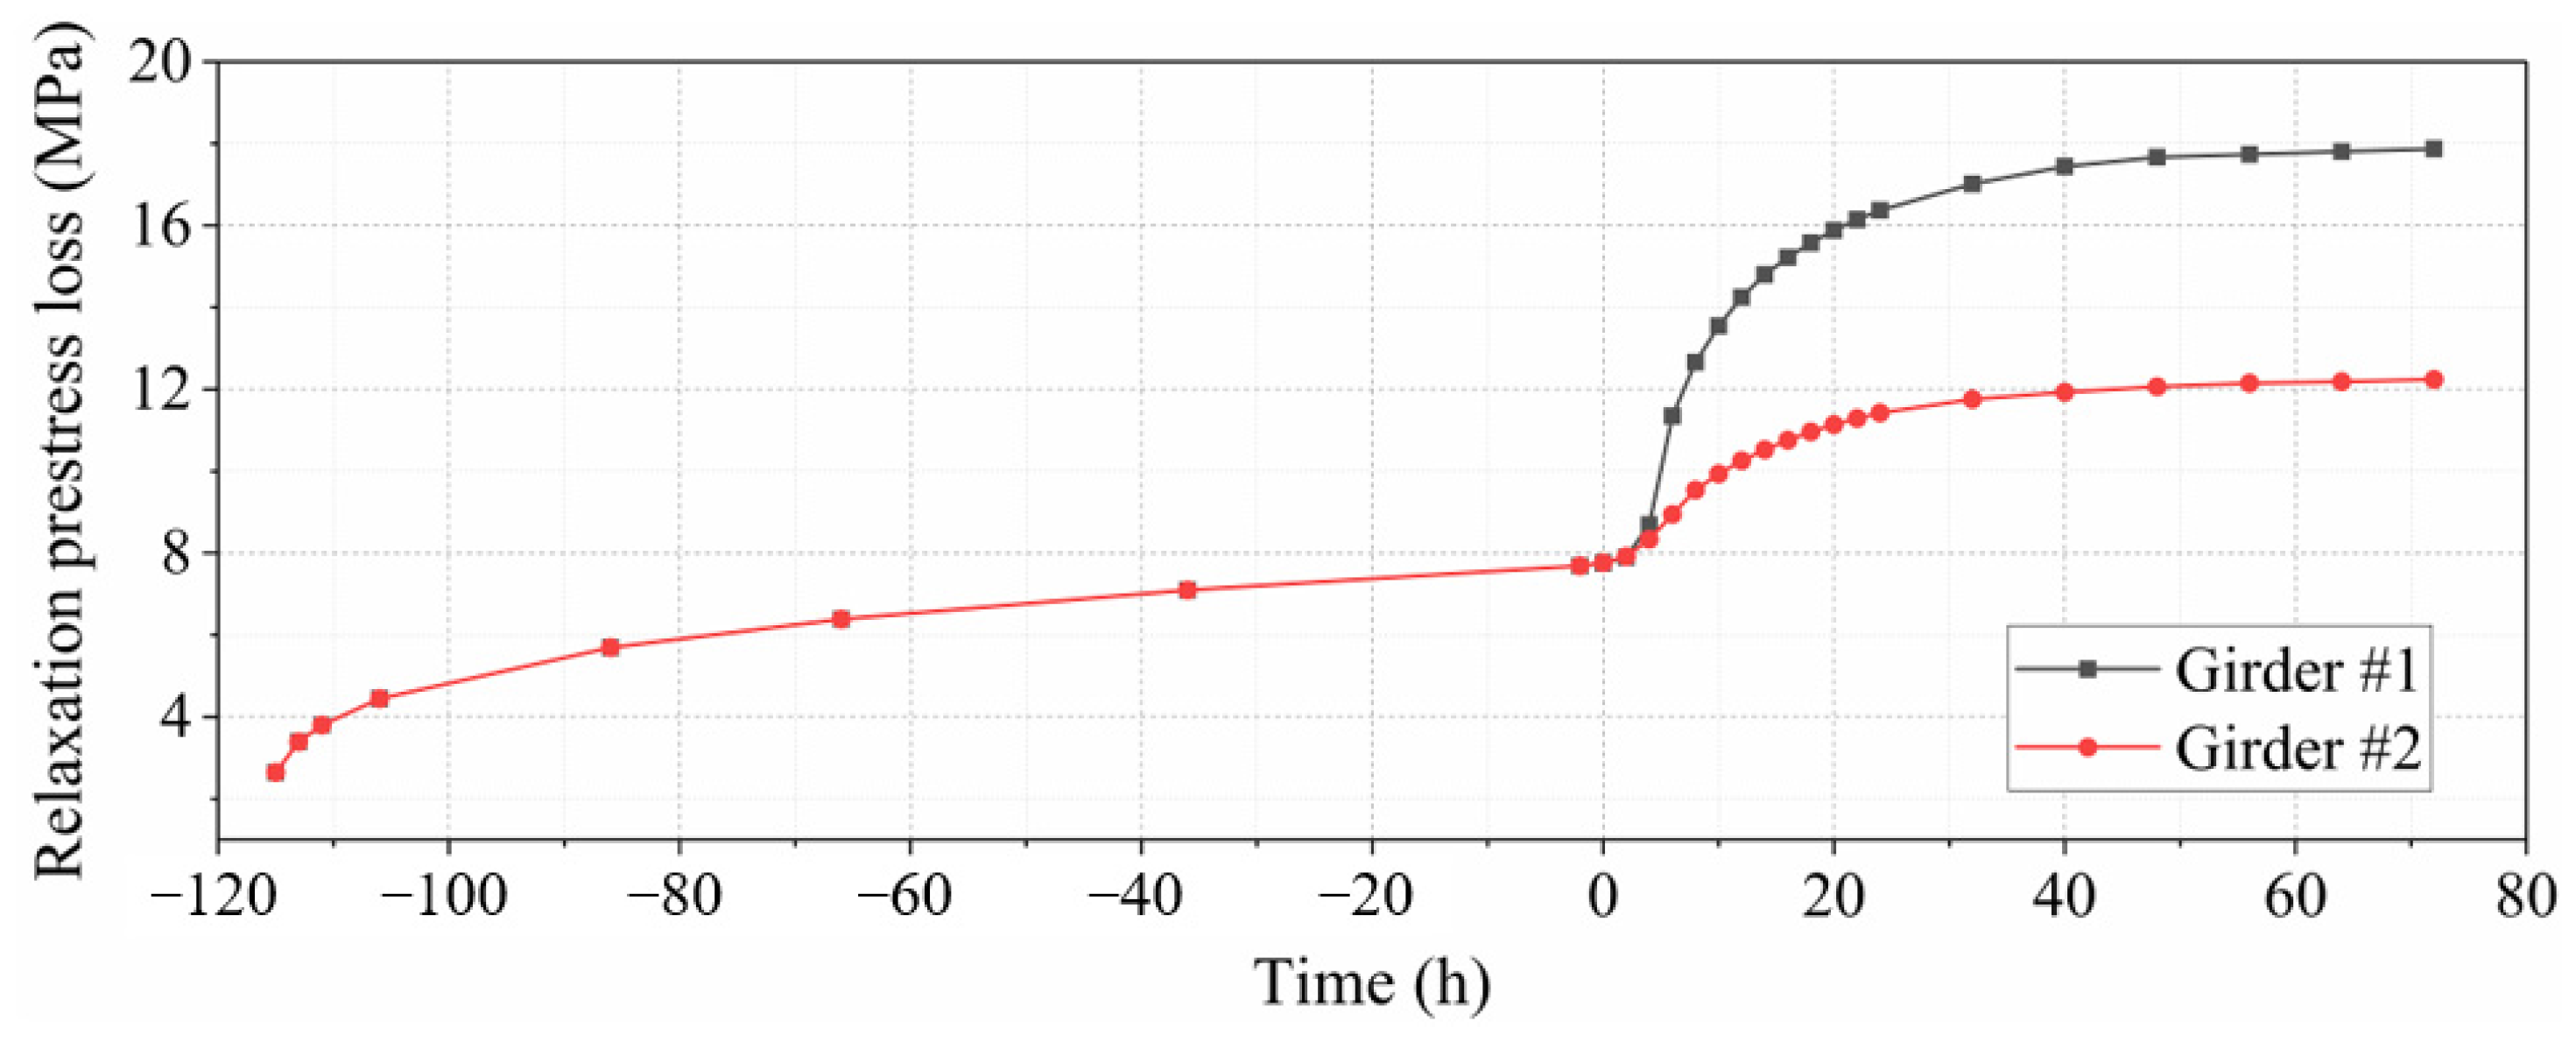
3.3. Relaxation Loss of Prestress
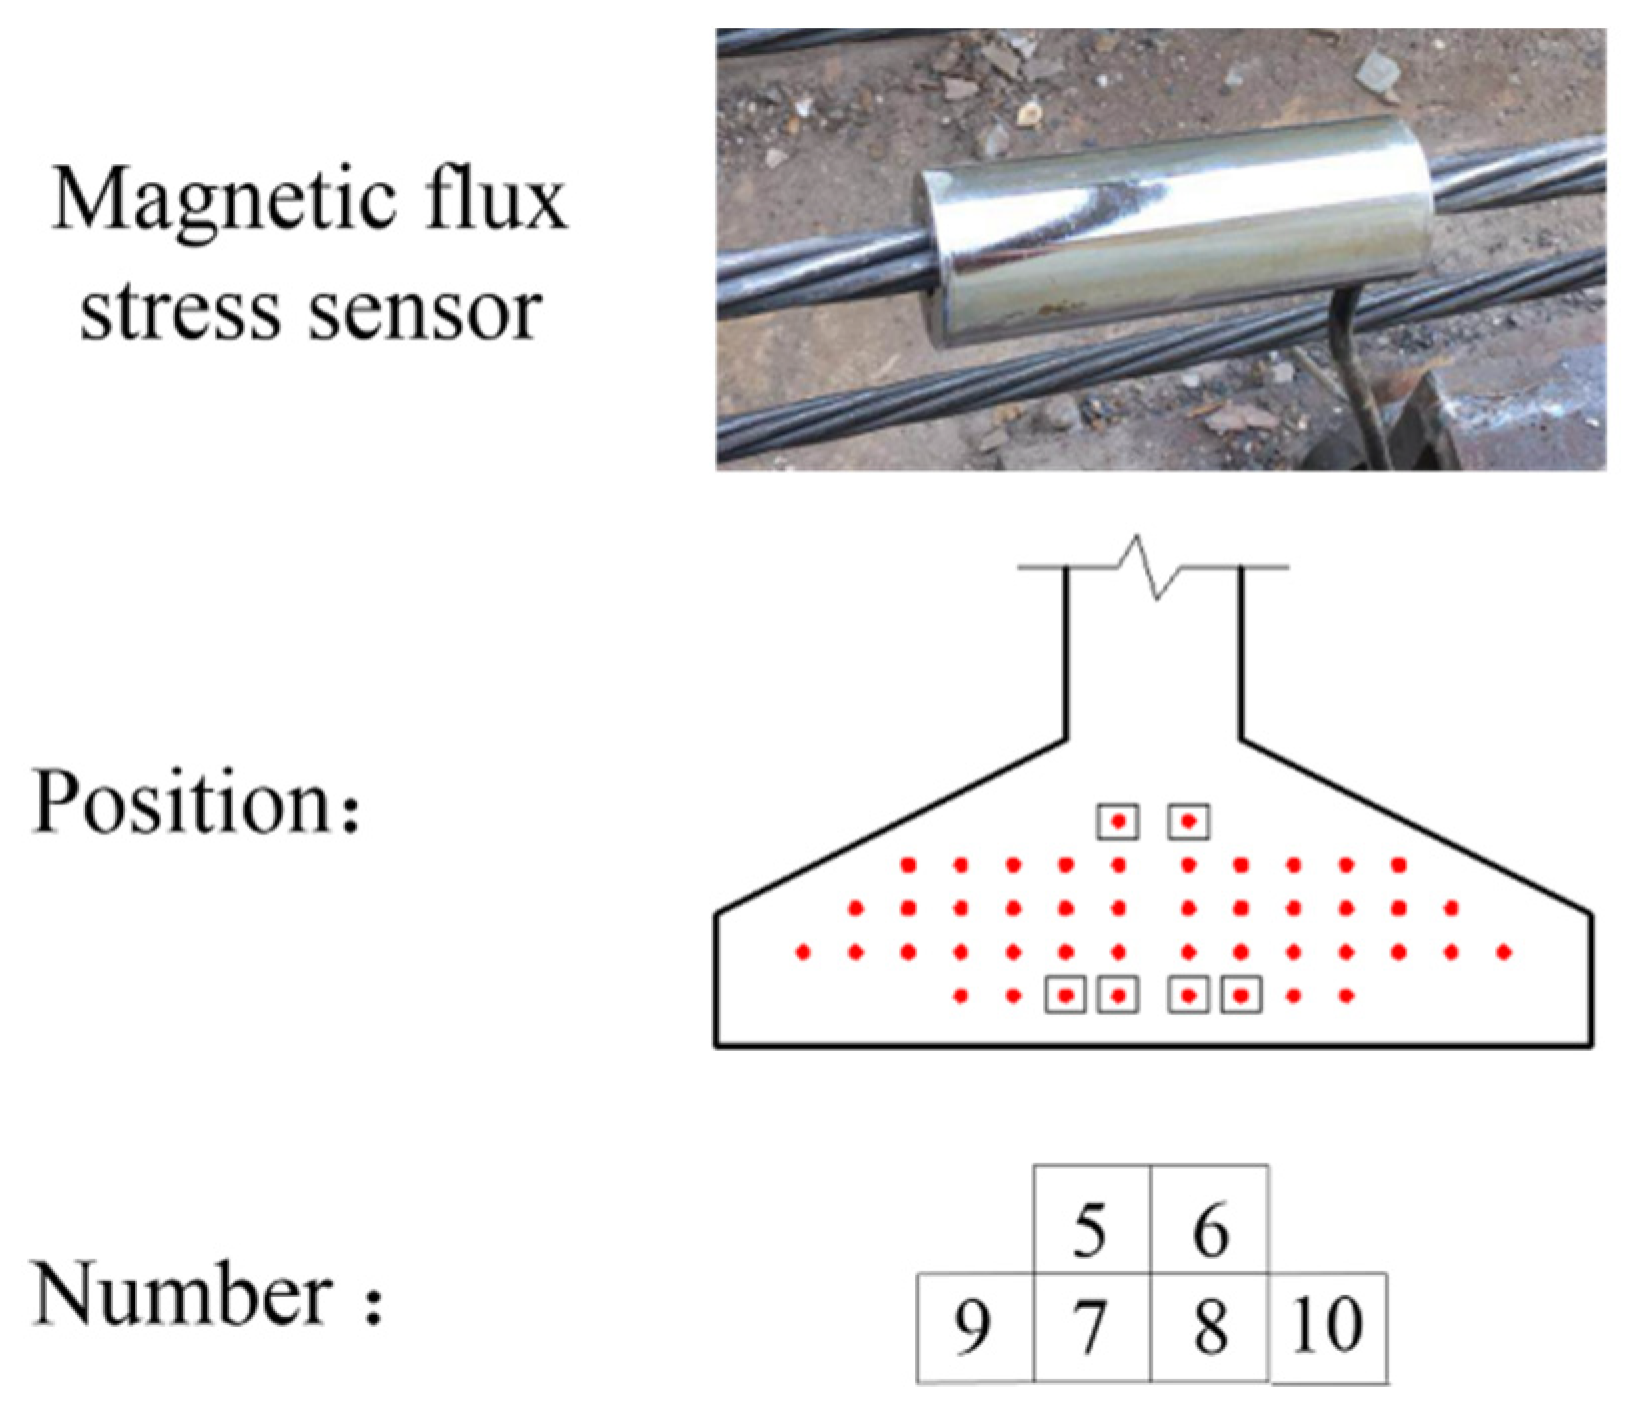
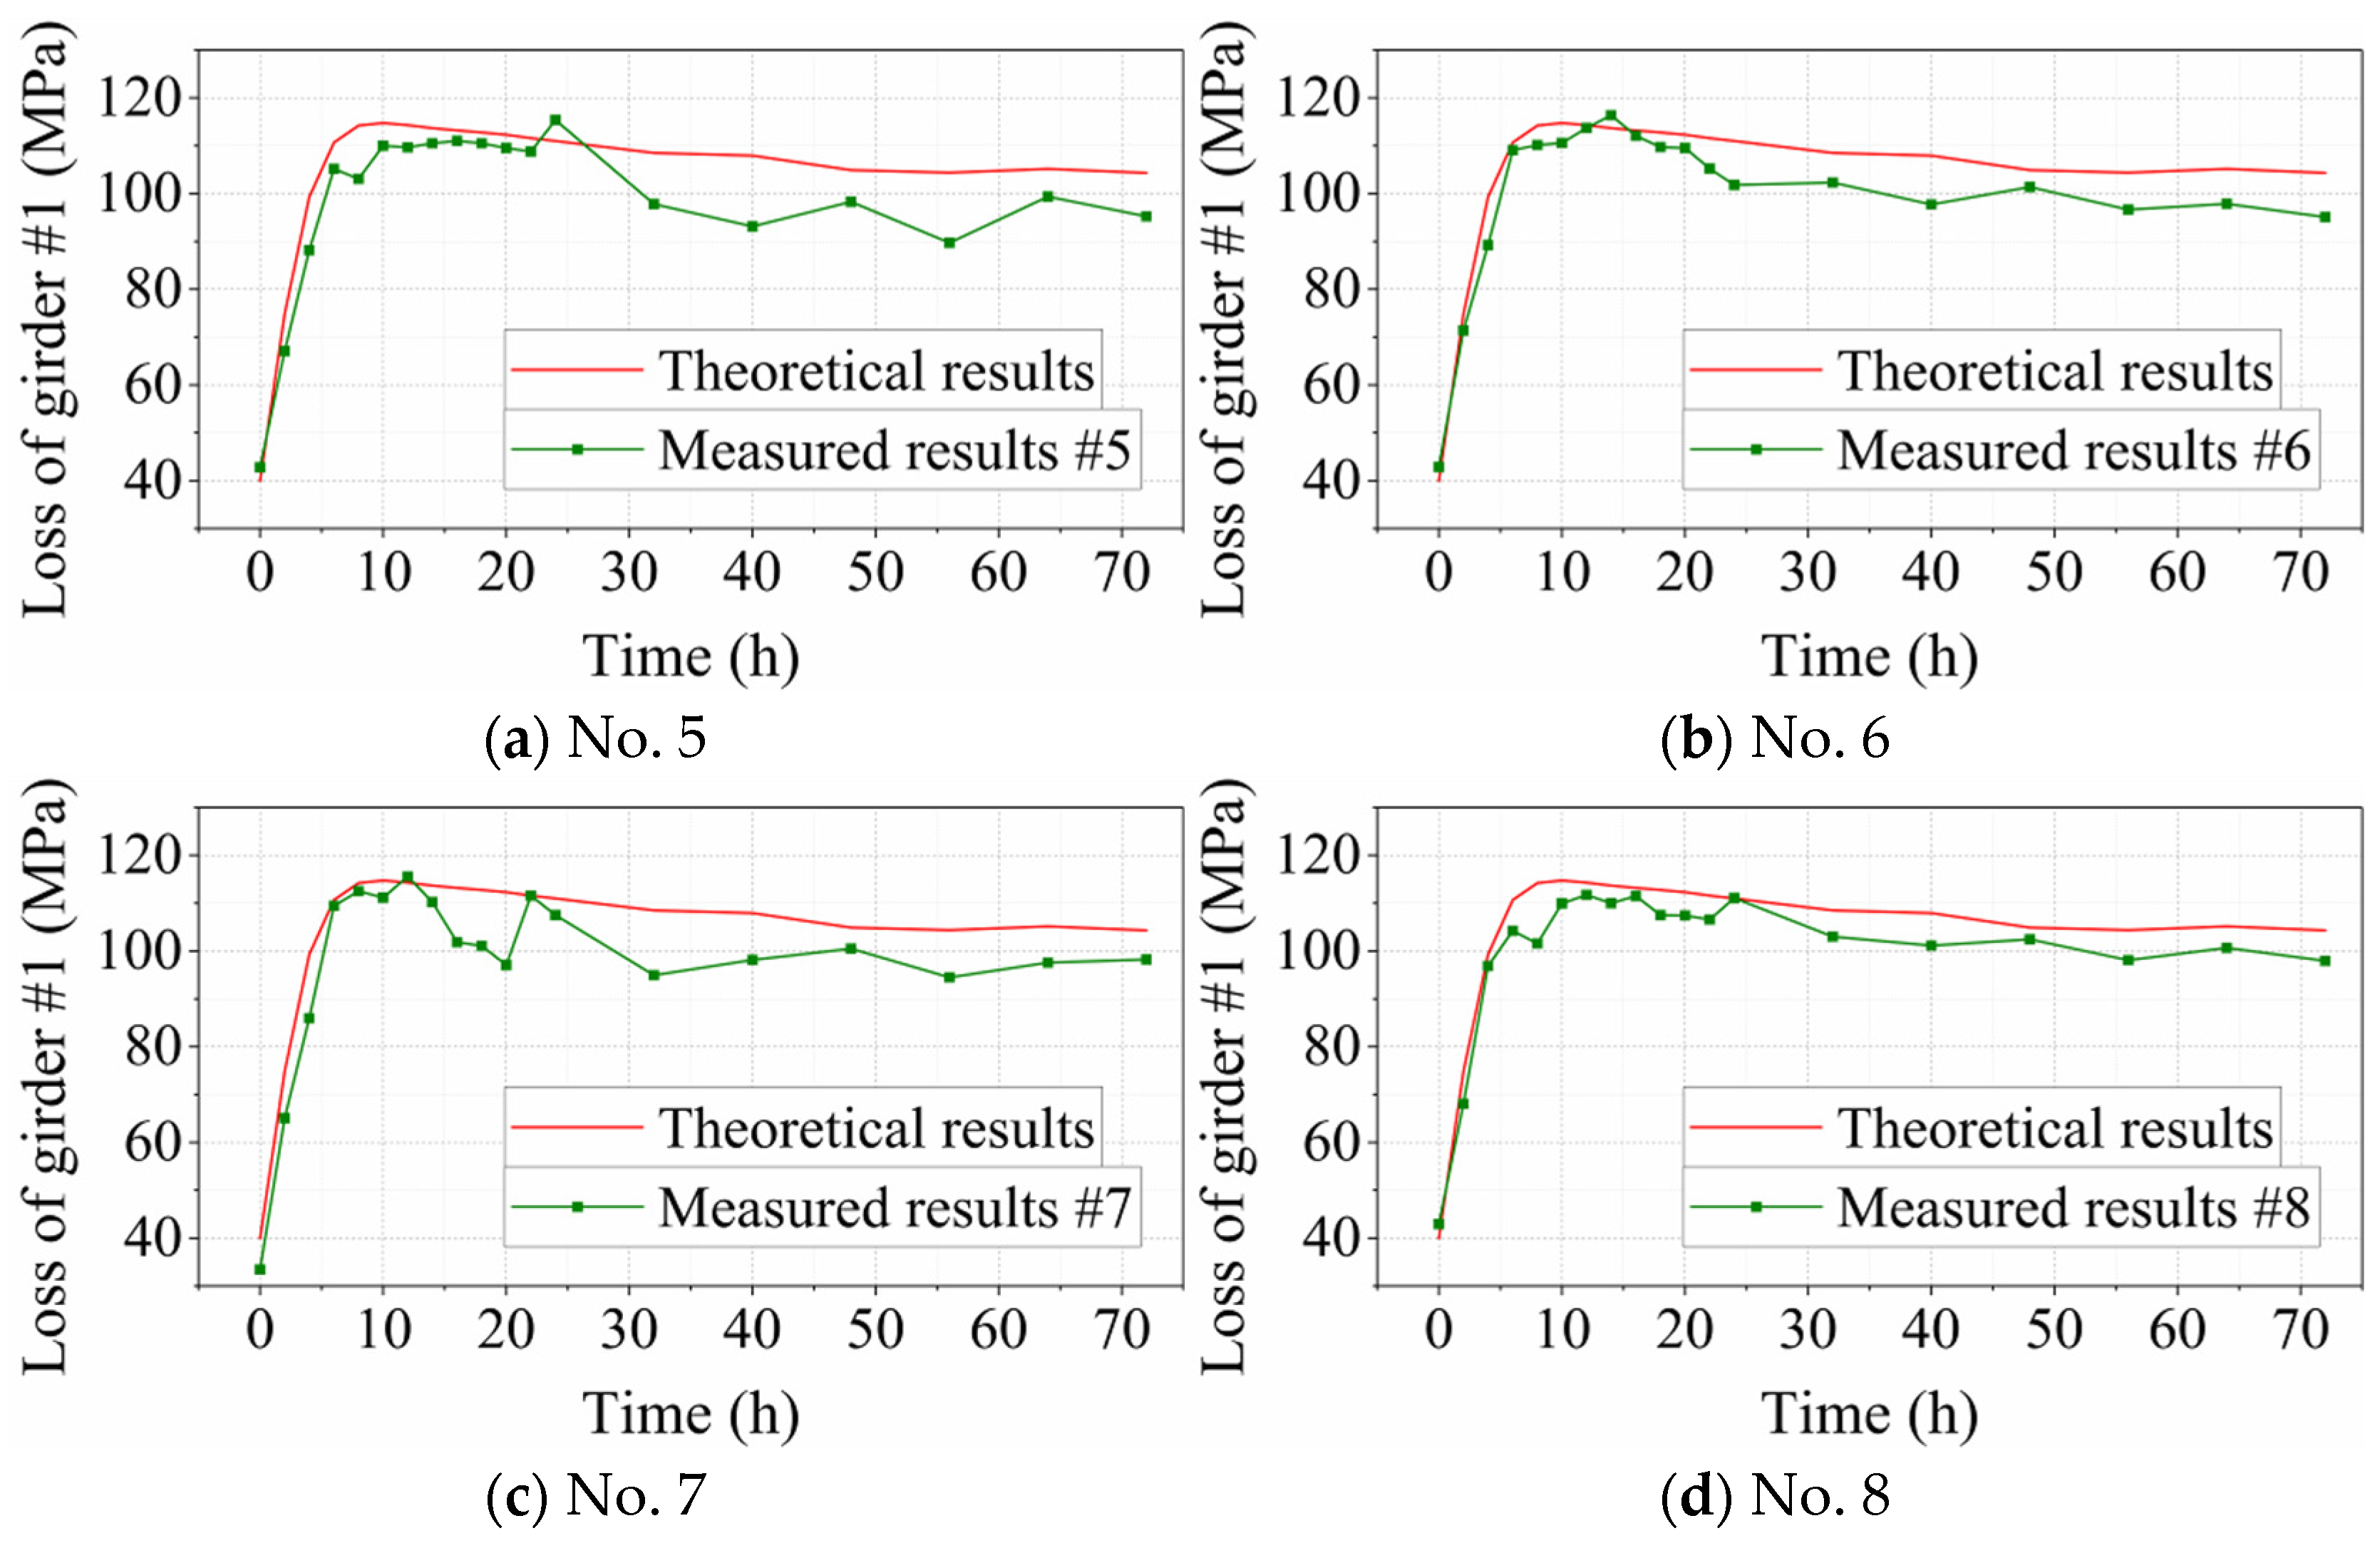
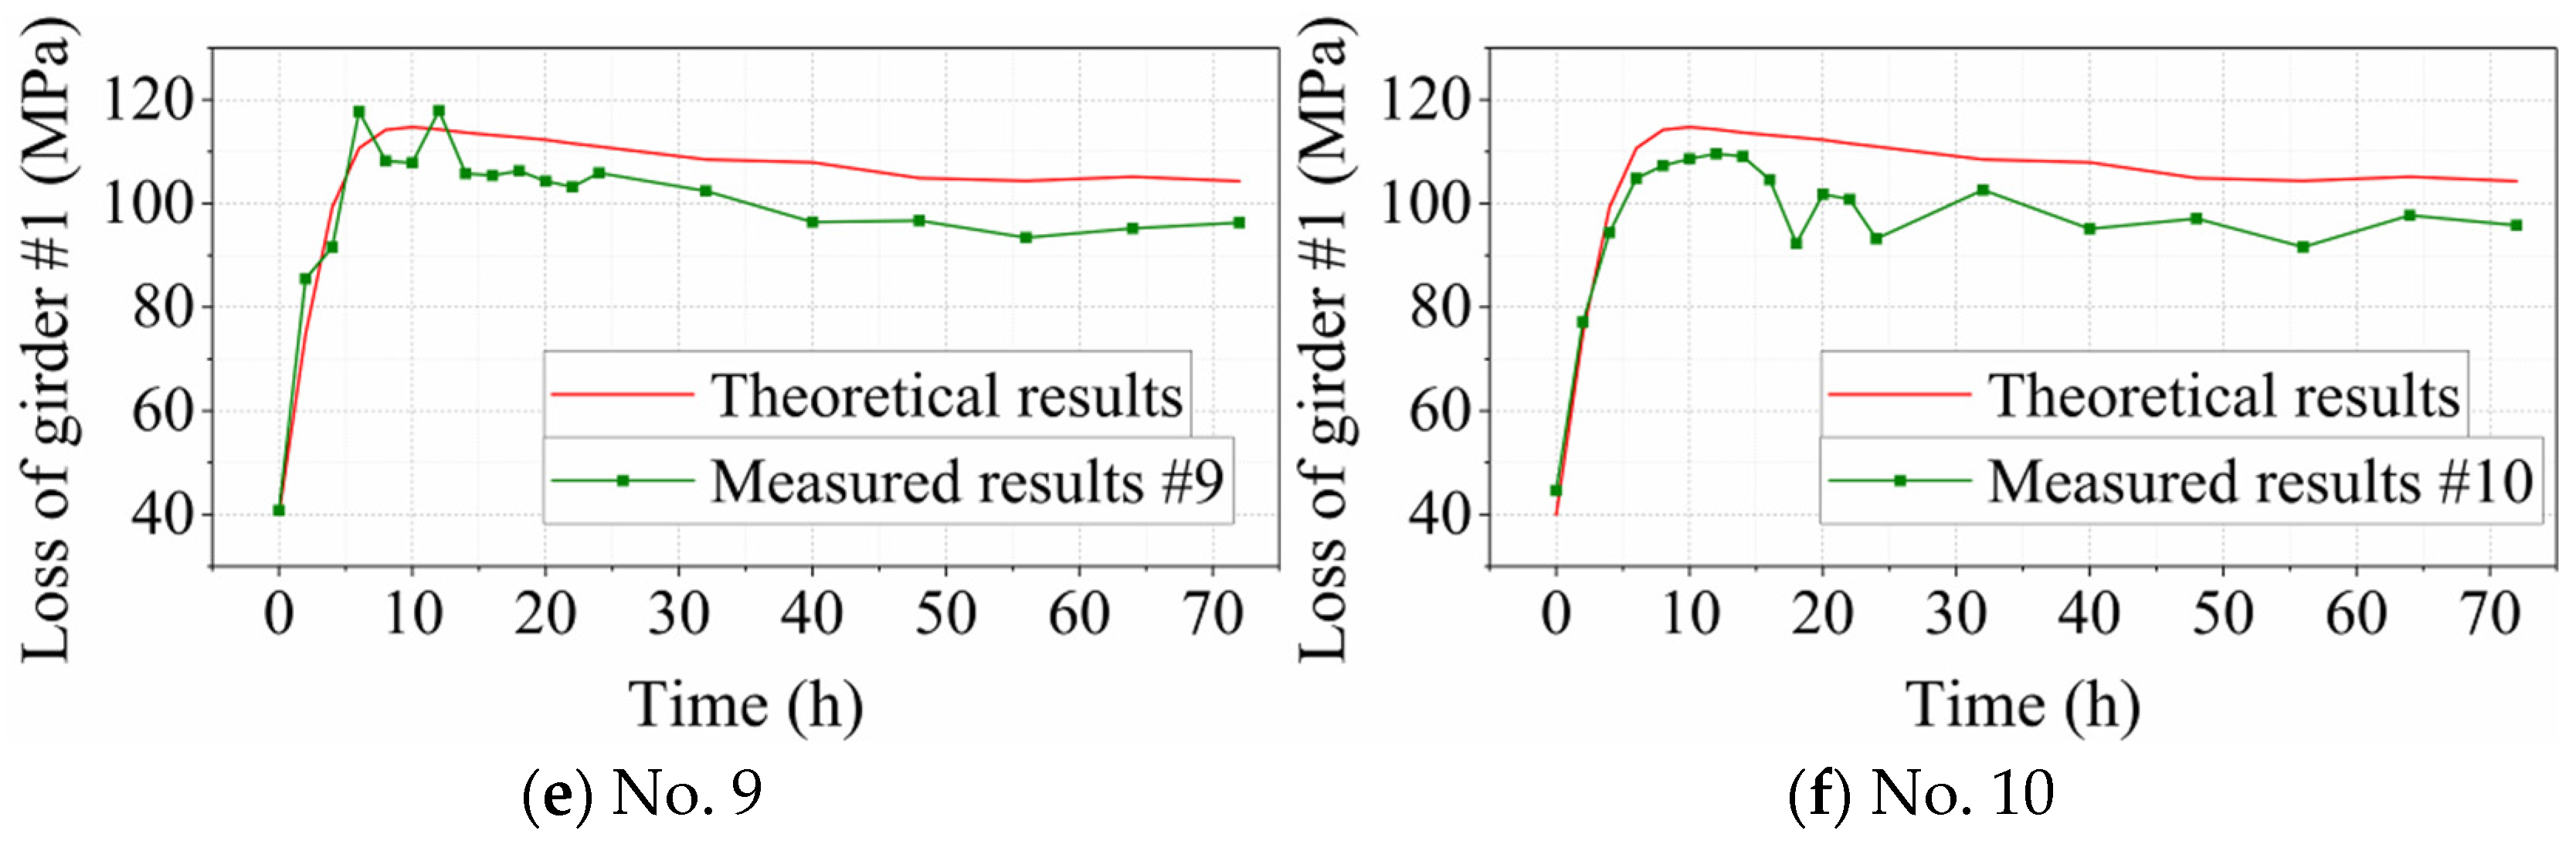
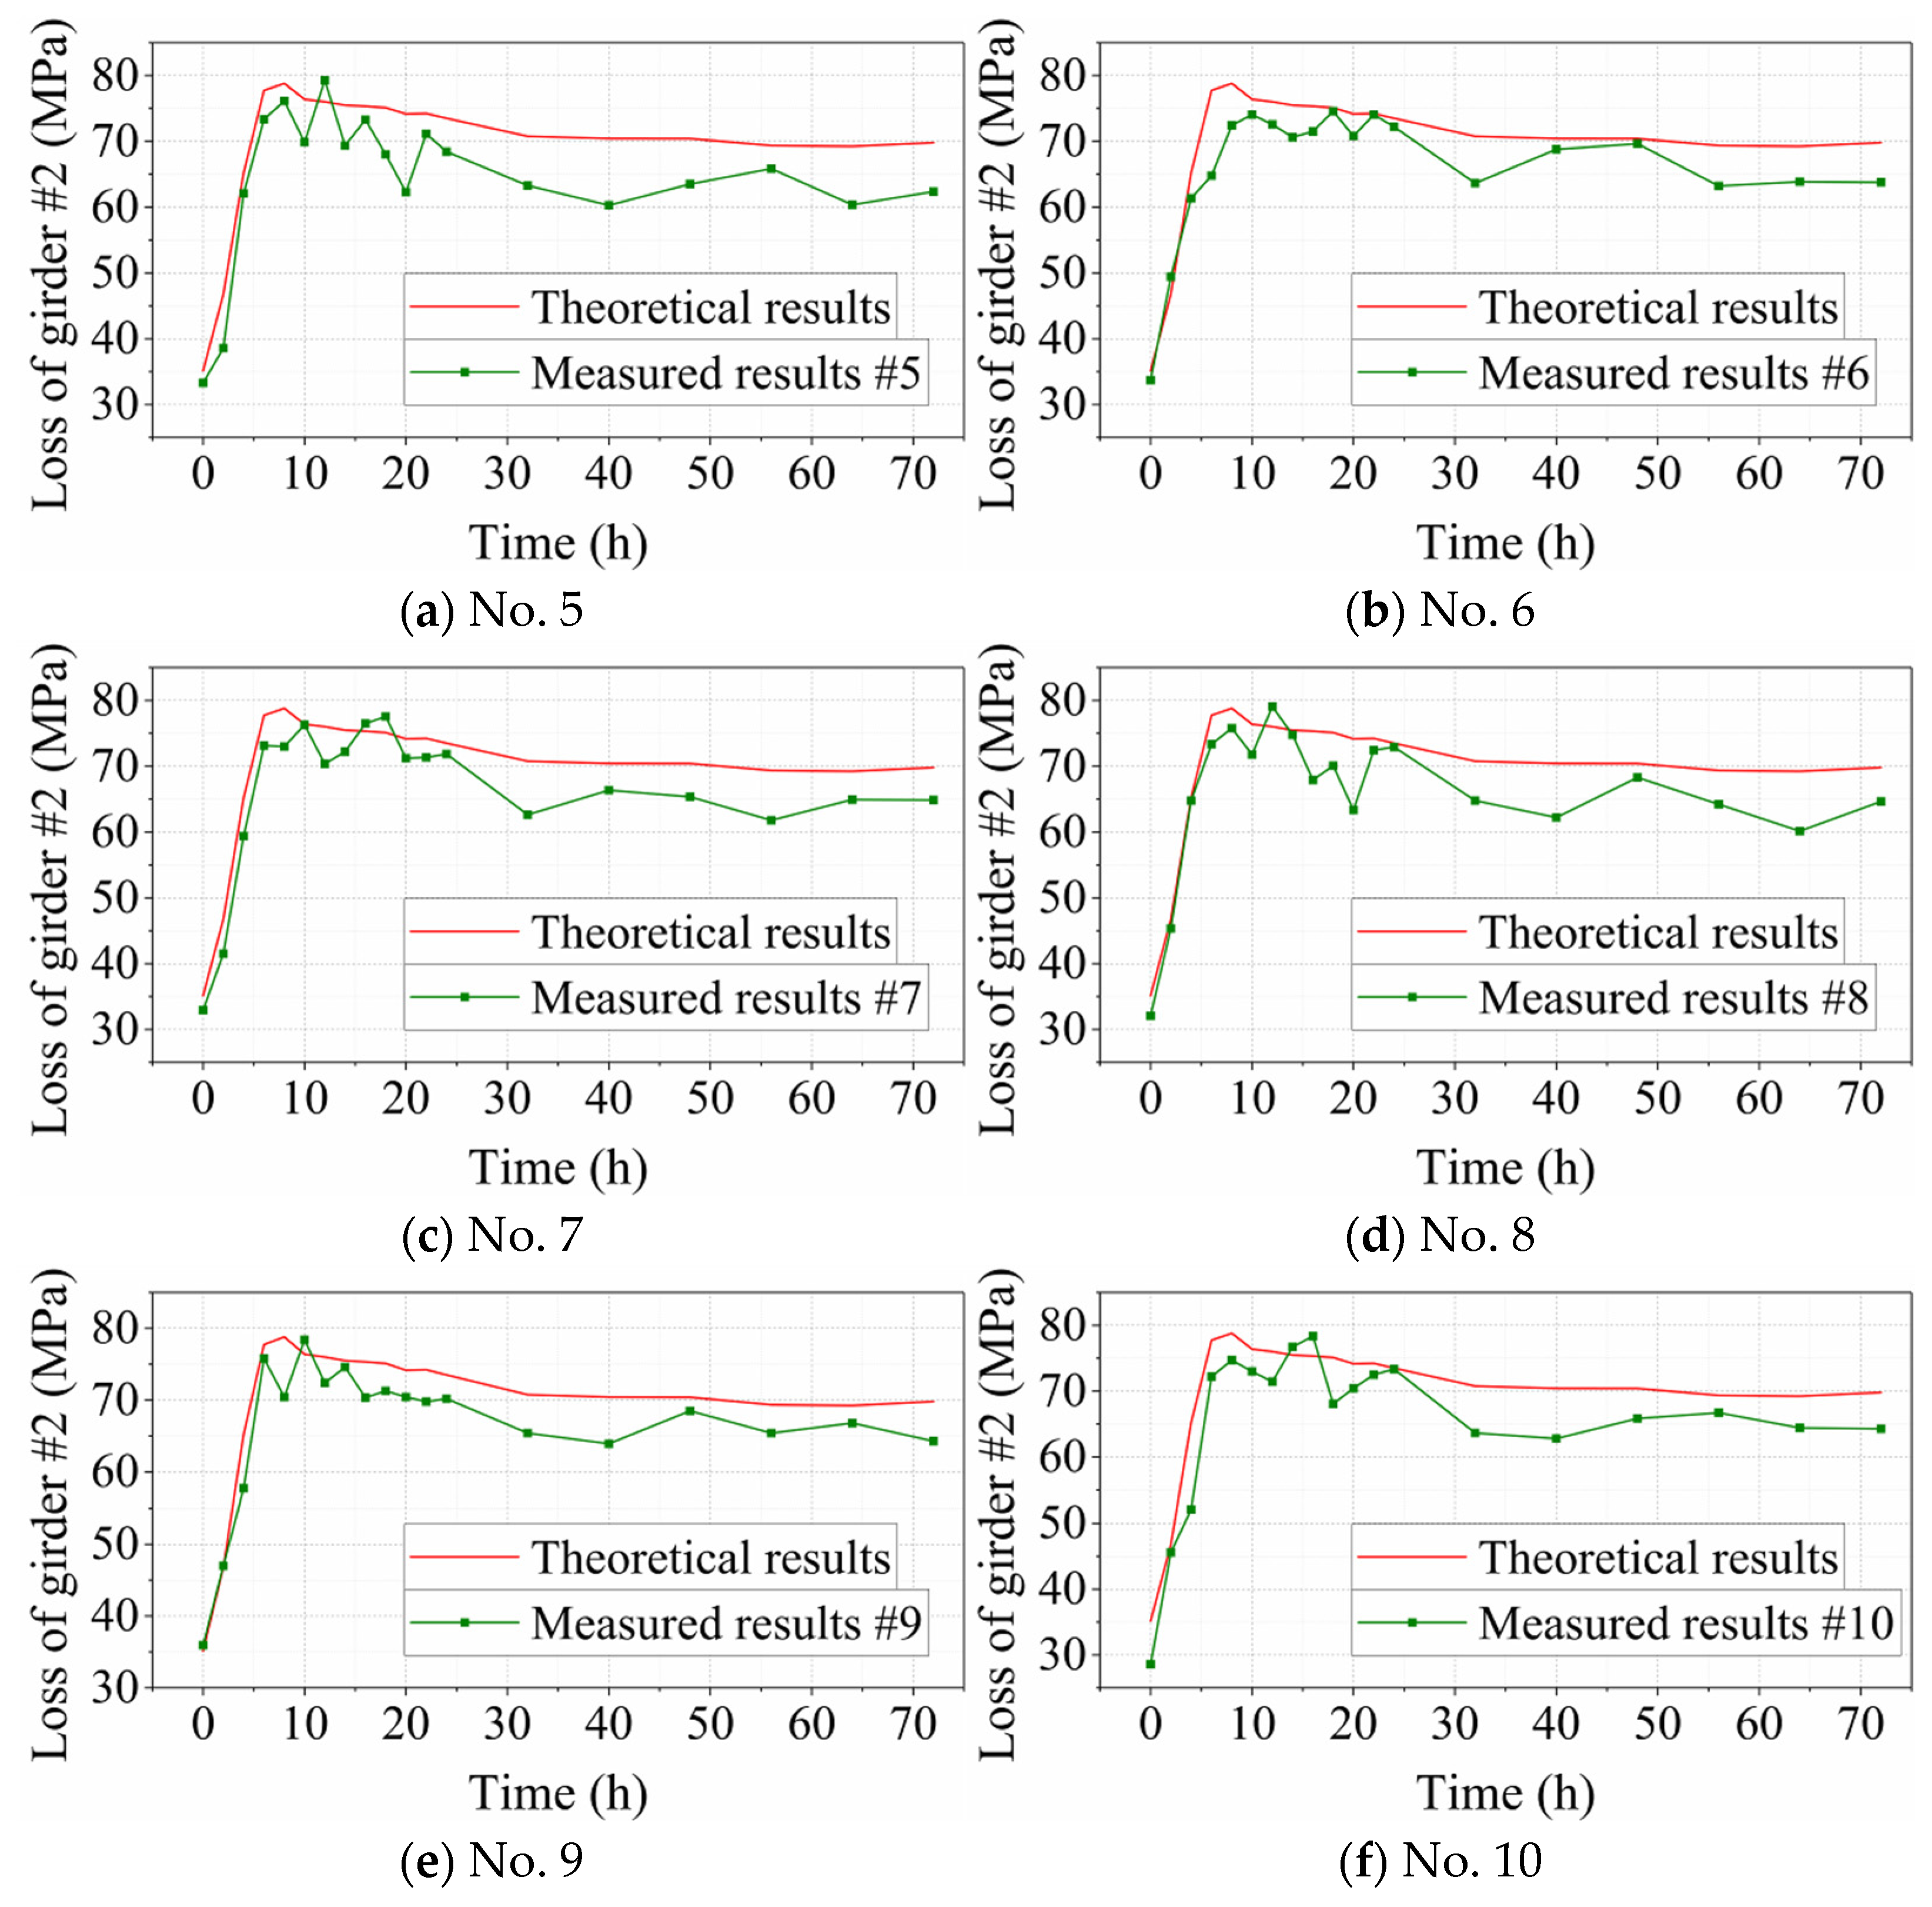
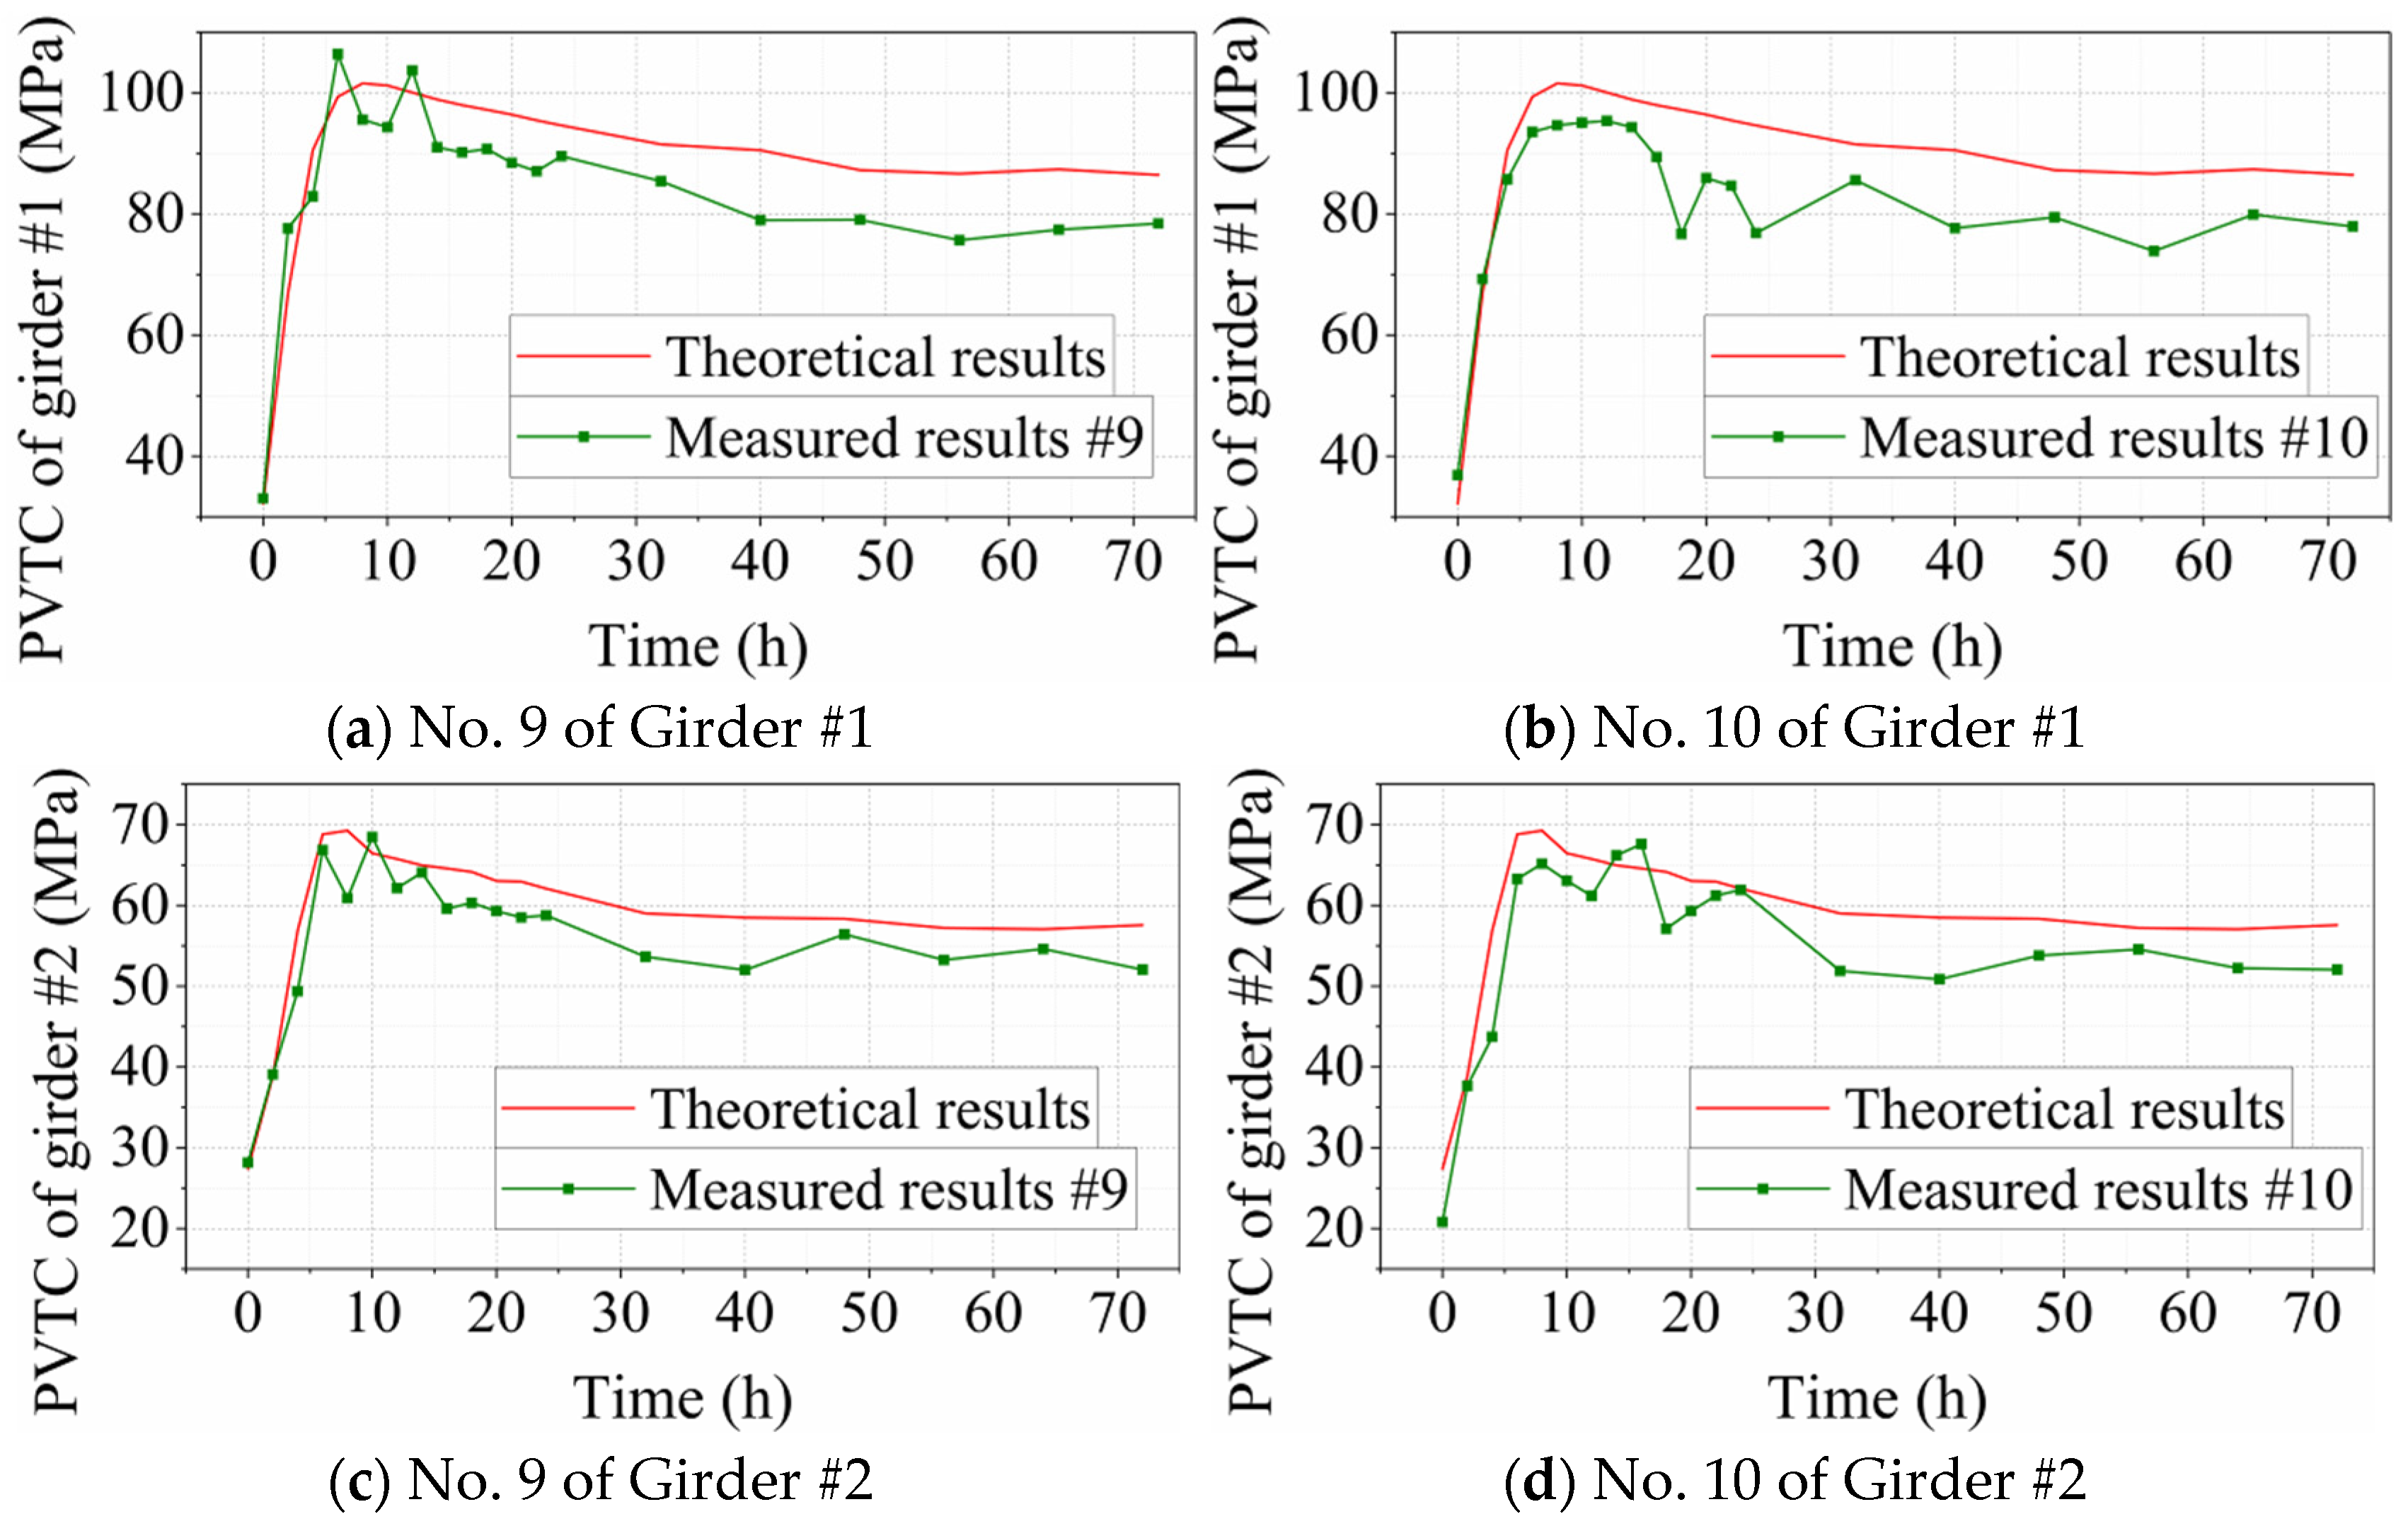
The relaxation of the strand occurs immediately after the tensioning operation [28,29] and causes prestress loss that is included in the stress change measured with the magnetic flux sensor. The relaxation loss needs to be deducted from the data to obtain the measured PVTC. In the code of ECE [5], Equation (33) is given to predict the relaxation loss evolution with time for the steel strand with low relaxation.
Δ σ pr ( t ) σ pi = 0.66 · ρ 1000 · e 9.1 μ t 1000 0.75 ( 1 μ ) · 10 5
where △σpr(t) is the relaxation loss of prestress of the strand at the time t; σpi is the tensile stress of the strand; ρ1000 is the value of the relaxation loss (unit: %) at 1000 h after tensioning and at a mean temperature of 20 °C; and μ = σpi/fpk.
However, the relaxation loss is very sensitive to the temperature of the strand [30,31,32], and there is a large temperature change due to the heat from hydration of the cement, so the effect of temperature on the relaxation must be considered. In the code of [5], an equivalent time teq is added to the time after tensioning in the relaxation time function to calculate the effect of temperature change, as shown in Equation (34).
t eq = 1.14 T max 20 T max 20 i = 1 n T Δ t i 20 Δ t i
where T Δ t i is the temperature (in °C) of the strand during the time interval Δ t i , and Tmax is the maximum temperature (in °C).
Based on Equations (33) and (34) and the measured temperature, the relaxation loss of prestress was calculated. The black line in Figure 9 illustrates the relaxation losses of the strands at the bottom of the mid-span of Girder #1 (steam curing). After the strand tensioning, the relaxation occurred immediately and increased by 2.6 MPa in an hour; the development of relaxation slowed down gradually between t = −115 h and t = −2 h (7.7 MPa); then, the growth rate in relaxation increased due to the heat from hydration of the cement from t = −2 h to t = 6 h (11.3 MPa), and slowed down again after t = 6 h, corresponding to the rising and decreasing of temperature in Figure 8; the growth rate stabilized after t = 32 h, and the relaxation loss achieved 17.9 MPa at the end of the test (t = 72 h).
The red line in Figure 9 illustrates the relaxation losses of the strands at the bottom of the mid-span of Girder #2 (natural curing). After the strand tensioning, the relaxation occurred immediately and increased by 3.4 MPa in an hour; the development of relaxation slowed down gradually between t = −115 h and t = −2 h (7.7 MPa); then, the growth rate of relaxation increased due to the heat from hydration of the cement from t = −2 h to t = 6 h (8.9 MPa), and slowed down again after t = 6 h, corresponding to the rising and decreasing of temperature in Figure 8; the growth rate stabilized after t = 32 h, and the relaxation loss achieved 12.2 MPa at the end of the test (t = 72 h).

3.4. PVTC

According to the theoretical calculations in the previous section, the relaxation loss of prestress and PVTC were obtained. The sum of the relaxation loss and PVTC is the theoretical total prestress loss. The comparisons between the measured total loss and the theoretical prestress loss of Girders #1 and #2 are shown in Figure 10 and Figure 11, respectively, and they are basically consistent, thus verifying the reliability of the analysis method. Figure 12 illustrate the measured and calculated results of PVTC. The theoretical and calculated results are basically consistent.
The PVTCs at various stages are provided in Table 1. Based on the experimental data, there are the following results:
For Girder #1, the first stage is from −115 to 0 h, with the PVTC ranging from 25.7 to 36.9 MPa. According to material tests, the average initial setting time of concrete under steam curing is 8 h. The second stage is from 0 to 8 h, with the PVTC ranging from 53.7 to 74.2 MPa. According to the figure above, the prestress loss stabilizes after 72 h. The third stage is from 8 to 72 h, with the PVTC ranging from −8.9 to −20.3 MPa;
For Girder #2, the first stage is from −115 to 0 h, with the PVTC ranging from 20.8 to 28.2 MPa. According to material tests, the average initial setting time of concrete under natural curing is 10 h. The second stage is from 0 to 10 h, with the PVTC ranging from 32.7 to 44.4 MPa. According to the figure above, the prestress loss stabilizes after 72 h. The third stage is from 10 to 72 h, with the PVTC ranging from −8.8 to −16.5 MPa.
Most of the measured values in the second stage are lower than the theoretical calculation results because the bonding part formed in the second stage hinders the thermal expansion of the material. This factor is not considered in the calculations, so the calculated values are larger. Therefore, a correction factor needs to be considered.
The difference is up to 15.7 MPa for Girder #1 and 9.2 MPa for Girder #2, indicating the significance of considering the reduction coefficient (kb) due to the weak interaction (bite force) between the strand and concrete (see Equation (5)). The coefficient (kb) was calibrated using the experimental data, as shown in Figure 11. The coefficient is between 0.77 and 0.90 (Girder #1), and the average value is 0.84. The coefficient is between 0.78 and 0.91 (Girder #2), and the average value is 0.89.
A comparison of the total PVTC test results with the calculated results is provided in Table 2. It can be found that the calculated value obtained with the European code is much smaller than the test value, and the average value of the test value divided by the calculated value is 1.82, which is unsafe. The German and Chinese codes are too conservative, and the average value of the ratio of the test value to the calculated value is 0.84 and 0.89, respectively. However, the equations obtained from the theoretical analysis and test results in this paper are more accurate for the prediction of total PVTC, and the average value, standard deviation, and coefficient of variation are 0.98, 0.02, and 0.02, respectively.

4. Parameter Analysis

The total PVTC of Girder #1 under steam curing is higher than that of Girder #2 under natural curing, which is significant enough to affect the functionality and durability of the PC girder. Therefore, it is significant to conduct parametric studies to investigate the effects of key variables on the PVTC, thus improving the quality of the PC girders. Based on experimental research, the key parameters of the PVTC formula are analyzed. The investigated parameters include the temperature during the operation of tensioning the strands and the temperature during the bonding development.

4.1. Temperature at Tensioning

The strands were tensioned at −116 h, and concrete was poured from −2 h to 0 h in the experiment. The ambient temperature changes periodically every 24 h, so the temperature at tensioning can be increased by adjusting the tensioning time. The PVTC mainly depends on the difference between temperatures at the operation of tensioning the strands and concrete curing. With the time of pouring concrete unchanged (with the temperature of concrete curing unchanged), the temperature difference and PVTC can be reduced by adjusting the tensioning time.
Figure 13 shows that the increase in the temperature at the moment of tensioning the strands helps reduce the PVTC. The strands in the experiment were tensioned at 16 °C, and the corresponding PVTC was 86.4 MPa for Girder #1 and 57.6 MPa for Girder #2. As the temperature at tensioning is increased by 1 °C, the absolute value of PVTC is decreased by 2.3 MPa; as the temperature at tensioning is increased from 10 °C to 30 °C, the prestress loss due to PVTC is only 46.8 MPa. Thus, raising the temperature at tensioning can reduce the PVTC (prestress loss) effectively.

4.2. Temperature at Bonding Development

As the temperature during bonding development is decreased, the difference between temperatures at tensioning and concrete curing is reduced, so is the PVTC. Figure 14 shows that the decrease in the temperature at bonding development helps reduce the PVTC. The temperature of the measuring points of girder #1 at bonding development was 59.5 °C in the experiment, and the corresponding PVTC was 86.4 MPa. As the temperature at bonding development is decreased by 1 °C, the absolute value of PVTC is decreased by 2.3 MPa; as the temperature is decreased from 70 °C to 40 °C, the absolute value of PVTC is decreased by 70.2 MPa. Thus, reducing the temperature at bonding development can control the PVTC (prestress loss) effectively.
The rest time before heating of the girder (under steam curing) in this paper was 3 h, and the temperature increasing rate was 10 °C/h (see Figure 7). The temperature at bonding development can be reduced by optimizing the steam curing regime, such as prolonging the rest time, reducing the temperature increasing rate, and adopting multiple heating.

5. Conclusions

Based on the above investigations, the following conclusions can be drawn:
(1)
The calculation method for PVTC changes for different stages of the fabrication process of a girder, because PVTC is closely associated with the interaction (i.e., bonding condition) between the strand and concrete, and the interaction changes with time;
(2)
The bent strand may slip relative to the deviator before the development of bonding between the strand and concrete, leading to force redistribution. The calculation method of stress adjustment is proposed to consider the effect on PVTC;
(3)
The PVTC at the first stage is caused by the change in ambient temperature. At the second stage, there is a remarkable temperature increase due to the steam curing and hydration heat of cement, corresponding to the significant PVTC and leading to the prestress losses. There is a growth in prestress at the third stage, due to the different thermal expansion coefficients of the strands and concrete, and the decreasing temperature of the girder. The total PVTC is up to 80.3 MPa for Girder #1 with steam curing and is up to 52.6 MPa for Girder #2 with natural curing;
(4)
Effective measures for reducing the PVTC of strands includes increasing the temperature at the operation of tensioning the strands, reducing the temperature at bonding development, and performing over-tensioning. The performance of each measure is evaluated in this study through parametric studies using the proposed formulae. The formulas established in this paper are more accurate for total loss prediction than the standards, and the average value of the ratio of experimental to calculated values is 0.98.

Author Contributions

Conceptualization, Q.Y. and Y.Y.; Writing—original draft, Q.Y.; Writing—review & editing, Q.Y. and Y.R.; Visualization, Y.R.; Supervision, Y.Y.; Project administration, Y.Y.; Funding acquisition, Y.Y. All authors have read and agreed to the published version of the manuscript.

Funding

This study was funded by the project of science and technology in Sichuan, China (Grant No. 2018RZ0102) and the project of the National Key Research and Development Program of China—Key Technologies and Emergency Devices for Rapid Repair and Reinforcement of Existing Urban Bridges with Low Traffic Impact (Grant No. 2017YFC0806007). The opinions of the authors do not reflect the opinions of the sponsors.

Data Availability Statement

Data are contained within the article.

Conflicts of Interest

Authors Qu Yu and Yongqing Yang were employed by the company Sichuan Jiaoda Engineering Detection & Consulting Co., Ltd. The remaining authors declare that the research was conducted in the absence of any commercial or financial relationships that could be construed as a potential conflict of interest.

References

  1. Darmawan, M.S.; Stewart, M.G. Spatial time-dependent reliability analysis of corroding pretensioned prestressed concrete bridge girders. Struct. Saf. 2007, 29, 16–31. [Google Scholar] [CrossRef]
  2. Ou, Y.C.; Prasetya, D.; Zhang, G.W.; Saputra, M.D. Effect of concrete mixture on shear behavior of prestressed concrete girders. Eng. Struct. 2023, 282, 115804. [Google Scholar] [CrossRef]
  3. Al-Kaimakchi, A.; Rambo-Roddenberry, M. Measured transfer length of 15.2-mm (0.6-in.) duplex high-strength stainless steel strands in pretensioned girders. Eng. Struct. 2021, 237, 112178. [Google Scholar] [CrossRef]
  4. Yan, M.; Yang, Y.; Li, X.; Bao, Y.; Sun, B. Pretensioned prestress friction losses considering contact imperfection at deviators in prestressed concrete girders. Struct. Infrastruct. Eng. 2020, 17, 1639–1650. [Google Scholar] [CrossRef]
  5. ACI (American Concrete Institute). Building Code Requirements for Structural Concrete; American Concrete Institute: Indianapolis, IN, USA, 2014. [Google Scholar]
  6. AASHTO. AASHTO LRFD Bridge Design Specifications, 8th ed.; AASHTO: Washington, DC, USA, 2017. [Google Scholar]
  7. Caro, L.A.; Martí-Vargas, J.R.; Serna, P. Prestress losses evaluation in prestressed concrete prismatic specimens. Eng. Struct. 2013, 48, 704–715. [Google Scholar] [CrossRef]
  8. Nassiraei, H.; Yara, A. Static Strength of Tubular K-Joints Reinforced with Outer Plates under Axial Loads at Ambient and Fire Conditions. Metals 2023, 13, 1857. [Google Scholar] [CrossRef]
  9. Roller, J.J.; Russell, H.G.; Bruce, R.N.; Hassett, B. Effect of curing temperatures on high strength concrete bridge girders. PCI J. 2003, 48, 74–79. [Google Scholar] [CrossRef]
  10. Breccolotti, M.; Materazzi, A.M. Prestress losses and camber growth in wing-shaped structural members. PCI J. 2015, 60, 98–117. [Google Scholar] [CrossRef]
  11. Tadros, M.K. Prestress Losses in Pretensioned High-Strength Concrete Bridge Girders; NCHRP Transportation Board: Washington, DC, USA, 2003. [Google Scholar]
  12. Rizkalla, S.; Zia, P.; Storm, T. Predicting Camber, Deflection, and Prestress Losses in Prestressed Concrete Members; Report No. FHWA/NC/2010-05; North Carolina Department of Transportation Research and Analysis Group: Raleigh, NC, USA, 2011.
  13. EN 1992-1-1; ECE. Eurocode 2: Design of Concrete Structures. CEN: Brussels, Belgium, 2004.
  14. FIB. Fib Model Code for Concrete Structures; Ernst and Sohn: Berlin, Germany, 2010. [Google Scholar]
  15. JTG 3362-2018; China Communications Construction Company Highway Consultants Company Limited. 2018. Specifications for Design of Highway Reinforced Concrete and Prestressed Concrete Bridges and Culverts. China Communications Press: Beijing, China, 2018.
  16. Ahlborn, T.M.; French, C.E.; Shield, C.K. High Strength Concrete Prestressed Bridge Girders: Long Term and Flexural Behavior; Report No. MN/RC-2000-32; University of Minnesota Digital Conservancy: Minneapolis, MN, USA, 2000. [Google Scholar]
  17. Barr, P.J.; Stanton, J.F.; Eberhard, M.O. Effects of temperature variations on precast, prestressed concrete bridge girders. J. Bridge Eng. 2005, 10, 186–194. [Google Scholar] [CrossRef]
  18. Newhouse, C.; Wood, T. The effect of temperature on the effective prestressing force at release for PCBT girders. In Proceedings of the Structures Congress 2008: Crossing Borders (ASCE) 2008, Vancouver, BC, Canada, 24–26 April 2008; pp. 1–10. [Google Scholar]
  19. Zahabizadeh, B.; Edalat-Behbahani, A.; Granja, J. A new test setup for measuring early age coefficient of thermal expansion of concrete. Cem. Concr. Compos. 2019, 98, 14–28. [Google Scholar] [CrossRef]
  20. Zhang, Y.; Ju, J.W.; Zhu, H.; Guo, Q.; Yan, Z. Micromechanics based multi-level model for predicting the coefficients of thermal expansion of hybrid fiber reinforced concrete. Constr. Build. Mater. 2018, 190, 948–963. [Google Scholar] [CrossRef]
  21. Zhou, C.; Feng, D.; Wu, X.; Cao, P.; Fan, X. Prediction of concrete coefficient of thermal expansion by effective self-consistent method considering coarse aggregate shape. J. Mater. Civ. Eng. 2018, 30, 04018312. [Google Scholar] [CrossRef]
  22. Küsel, F.; Kearsley, E.P.; Butler, L.J.; Skorpen, S.A.; Elshafie, M.Z.E.B. Measured temperature effects during the construction of a prestressed precast concrete bridge beam. MATEC Web Conf. 2018, 199, 11013. [Google Scholar] [CrossRef]
  23. Lee, C.; Shin, S.; Lee, S.; Oh, J. Modeling of bond stress-slip relationships of a strand in concrete during steam curing. Int. J. Concr. Struct. Mater. 2017, 11, 477–487. [Google Scholar] [CrossRef]
  24. Robitaille, S.; Bartlett, F.M.; Youssef, M.A. Evaluating prestress losses during pre-tensioning. In Proceedings of the Canadian Society for Civil Engineering Annual Conference, St. Johns, NL, Canada, 27–30 May 2009. [Google Scholar]
  25. Joh, C.; Lee, J.W.; Kwahk, I. Feasibility study of stress measurement in prestressing tendons using villari effect and induced magnetic field. Int. J. Distrib. Sens. Netw. 2013, 9, 249829. [Google Scholar] [CrossRef]
  26. Budelmann, H.; Holst, A.; Wichmann, H.J. Non-destructive measurement toolkit for corrosion monitoring and fracture detection of bridge tendons. Struct. Infrastruct. Eng. 2014, 10, 492–507. [Google Scholar] [CrossRef]
  27. Wichmann, H.J.; Holst, A.; Budelmann, H. Magnetoelastic stress measurement and material defect detection in prestressed tendons using coil sensors. In Proceedings of the 7th International Symposium on Non-Destructive Testing in Civil Engineering (NDT-CE), Nantes, France, 30 June–3 July 2009. [Google Scholar]
  28. Au, F.T.K.; Si, X.T. Accurate time-dependent analysis of concrete bridges considering concrete creep, concrete shrinkage and cable relaxation. Eng. Struct. 2011, 33, 118–126. [Google Scholar] [CrossRef]
  29. Wang, X.; Chen, Z.; Liu, H.; Yu, Y. Experimental study on stress relaxation properties of structural cables. Constr. Build. Mater. 2018, 175, 777–789. [Google Scholar] [CrossRef]
  30. Bažant, Z.P.; Yu, Q. Relaxation of prestressing steel at varying strain and temperature: Viscoplastic constitutive relation. J. Eng. Mech. 2013, 139, 814–823. [Google Scholar] [CrossRef]
  31. Ajimi, W.T.; Chataigner, S.; Gaillet, L. Influence of low elevated temperature on the mechanical behavior of steel rebars and prestressing wires in nuclear containment structures. Constr. Build. Mater. 2017, 134, 462–470. [Google Scholar] [CrossRef]
  32. Chhun, P.; Sellier, A.; Lacarriere, L.; Chataigner, S.; Gaillet, L. Incremental modeling of relaxation of prestressing wires under variable loading and temperature. Constr. Build. Mater. 2018, 163, 337–342. [Google Scholar] [CrossRef]
Figure 1. The illustration of the arrangement of tendons and the typical fabrication of pretensioned PC girders.
Buildings 14 02325 g001
Figure 2. Depiction of bent tendon symmetrical to the mid-span.
Buildings 14 02325 g002
Figure 3. Pedestal with bottom countertop.
Buildings 14 02325 g003
Figure 4. Test device. (a) Test girders; (b) Deviator; (c) Anchoring end.
Buildings 14 02325 g004aBuildings 14 02325 g004b
Figure 5. Arrangement of tendons (unit: 10−2 m). (a) Front view; (b) Section A-A (girder end); (c) Section C-C (mid-span).
Buildings 14 02325 g005aBuildings 14 02325 g005b
Figure 6. Arrangement of magnetic flux sensors.
Buildings 14 02325 g006
Figure 7. Temperature–time curve of the steam curing.
Buildings 14 02325 g007
Figure 8. The time-varying temperatures of various girders.
Buildings 14 02325 g008
Figure 9. Prestress loss due to relaxation of the tendons in the two girders.
Buildings 14 02325 g009
Figure 10. Prestress loss at different measuring points of Girder #1.
Buildings 14 02325 g010aBuildings 14 02325 g010b
Figure 11. Prestress loss at different measuring points of Girder #2.
Buildings 14 02325 g011
Figure 12. PVTC at different measuring points of the girders.
Buildings 14 02325 g012
Figure 13. Effect of temperature at tensioning on PVTC.
Buildings 14 02325 g013
Figure 14. Effect of temperature at bonding development on PVTC.
Buildings 14 02325 g014
Table 1. PVTC at various stages (unit: MPa).
GirderPointsStage 1Stage 2Stage 3
T.rM.rT.rM.rT.rM.r
Girder #15#32.235.069.455.4−15.1−13.1
6#32.235.169.462.4−15.1−20.3
7#32.225.769.474.2−15.1−19.5
8#32.235.269.453.7−15.1−8.9
9#32.233.069.462.5−15.1−17.1
10#32.236.969.457.8−15.1−16.7
Girder #25#27.425.541.941.1−11.7−16.5
6#27.425.941.936.9−11.7−11.3
7#27.425.241.938.3−11.7−10.8
8#27.424.341.941.9−11.7−13.8
9#27.428.241.932.7−11.7−8.8
10#27.420.841.944.4−11.7−13.1
Table 2. Comparison between test results and calculation results for total PVTC.
GirderPointsM.rThe European Code [13]The German Code [14]The Chinese Code [15]This Paper
T.rM.r/T.rT.rM.r/T.rT.rM.r/T.rT.rM.r/T.r
Girder #15#77.342.51.8291.70.8487.10.8979.50.97
6#77.242.51.8291.70.8487.10.8979.50.97
7#80.342.51.8991.70.8887.10.9279.51.01
8#80.142.51.8991.70.8787.10.9279.51.01
9#78.442.51.8591.70.8587.10.9079.50.99
10#77.942.51.8391.70.8587.10.8979.50.98
Girder #25#50.128.91.7462.30.8059.20.8553.80.93
6#51.528.91.7862.30.8359.20.8753.80.96
7#52.628.91.8262.30.8459.20.8953.80.98
8#52.428.91.8262.30.8459.20.8953.80.97
9#52.028.91.8062.30.8359.20.8853.80.97
10#52.028.91.8062.30.8359.20.8853.80.97
AVG 1.82 0.84 0.89 0.98
SD 0.04 0.02 0.02 0.02
COV 0.02 0.02 0.02 0.02
Note: AVG = average; SD = standard deviation; COV = coefficient of variation.
Disclaimer/Publisher’s Note: The statements, opinions and data contained in all publications are solely those of the individual author(s) and contributor(s) and not of MDPI and/or the editor(s). MDPI and/or the editor(s) disclaim responsibility for any injury to people or property resulting from any ideas, methods, instructions or products referred to in the content.

