Article

Experiment on Freeze–Thaw Resistance of Tunnel Portal-Lining Concrete with Silicone Coating in Cold Regions

1
Sichuan Highway Planning, Survey, Design and Research Institute Ltd., Chengdu 610041, China
2
Institute of Future Civil Engineering Science and Technology, Chongqing Jiaotong University, Chongqing 400074, China
3
CREC Southwest Research Institute Co., Ltd., Chengdu 611731, China
4
School of Civil Engineering, Chongqing Jiaotong University, Chongqing 400074, China
*
Author to whom correspondence should be addressed.
Buildings 2024, 14(8), 2330; https://doi.org/10.3390/buildings14082330 (registering DOI)
Submission received: 11 June 2024 / Revised: 10 July 2024 / Accepted: 25 July 2024 / Published: 27 July 2024
(This article belongs to the Section Building Materials, and Repair & Renovation)

Abstract

:
The freeze–thaw effect has a significant impact on the strength deterioration of tunnel-lining concrete in cold regions. Therefore, the strength deterioration characteristics of concrete in a tunnel were studied, and silicone coating materials were used to improve its frost resistance and durability under freeze–thaw cycles. Freeze–thaw cycle tests were conducted on concrete specimens with different coatings. The freeze–thaw damage phenomenon, dynamic elastic modulus, and mass loss of the specimens were used to evaluate the freeze–thaw durability of concrete strengthened with coatings. The results demonstrated that silicone coatings effectively prevented moisture and corrosive substances from infiltrating the concrete, thereby enhancing its durability; the silicone–polyether hybrid had the most significant frost resistance at 500 g/m2 and silane type III at 300 g/m2, with freezing resistance times of 175 and 300, respectively. During the freeze–thaw process, the strength reduction rate of specimens was much greater than the mass loss rate of concrete. Taking into account the water environment surrounding the lining concrete and the site temperature, an equivalent indoor freeze–thaw cycle conversion model was established. The results can provide an experimental basis for selecting better frost-resistant materials for tunnel concrete in cold regions.

1. Introduction

With the vigorous promotion of infrastructure construction in China, the highway network continues to expand to high-altitude areas. Taking tunnel construction in Western Sichuan as an example, there are more than 152 km/88 tunnels that have been built or are under construction in the Western Sichuan Plateau, such as Erlangshan Tunnel, Zhegushan Tunnel, Balangshan Tunnel, Gaoersi Tunnel, and Queershan Tunnel. These high-altitude areas have the characteristics of a high altitude, low temperature, long sunshine duration, and large temperature difference between the day and night. This extreme cold environmental condition imposes higher demands on the performance of concrete, especially its frost resistance and durability. The frost resistance and durability of concrete refer to the performance of saturated concrete in resisting freeze–thaw cycles. The freeze–thaw effect is one of the main reasons for concrete deterioration in cold climates [1] During the freezing process, the combined effect of volume expansion caused by frozen and unfrozen water movement will put pressure on the internal pore walls of concrete [2]. When the pore pressure exceeds the tensile strength of concrete, cracks and cavities will form [3,4]. It has been found that appropriate amounts of air-entraining agent, fiber, admixture, and surface antifreeze agent are conducive to improving the antifreeze durability of concrete, which is extremely important for concrete structures in high-altitude and cold regions [5].
Adding an air-entraining agent into concrete can generate a large number of uniform micropores, alleviating the hydrostatic pressure caused by free water migration during the freeze–thaw process of concrete [6]. Xianghui et al. [7] found that an air-entraining agent can significantly improve the porosity of concrete specimens, thereby improving frost resistance. Ma et al. [8] found that the compressive strength and relative dynamic modulus decreased with an increase in freeze–thaw cycles, and the freeze–thaw resistance of aerated concrete was better than that of fresh concrete. Adding an air-entraining agent is one of the effective methods for improving its frost resistance. As the amount of air-entraining agent increases, the concrete strength will decrease significantly [9]. Fiber-reinforced concrete is a new type of building material that is formed by uniformly dispersing fibers with high tensile strength and high elongation in the matrix of concrete. Ruizhen and Sai [10] showed that the addition of fiber can enhance the frost resistance of concrete. Hao [11] added an appropriate amount of basalt fiber to reduce the number of macro cracks in composite concrete and improve the mechanical properties of concrete. Nan et al. [12] used vitrified fiber concrete for lining channels, and its loss of frost expansion resistance was lower than that of ordinary concrete-lined channels. Yang and Yan [13] explored the frost resistance of straw fiber concrete under freeze–thaw cycle damage. As the number of freeze–thaw cycles increases, the compressive strength and dynamic elastic modulus of straw fiber concrete decreases significantly. Admixtures such as fly ash, slag, and silica fume have complex chemical and physical effects on the hydration of cement. These effects can make concrete achieve more excellent durability under appropriate dosage and curing conditions. Guizhen and Congqi [14] believed that adding an appropriate amount of fly ash and silica fume can refine the pore structure of concrete, which is conducive to the dispersion of bubbles and resistance to freeze–thaw hazards. Based on the quick-freeze method, Xu et al. [15] selected three mineral admixtures, silica fume, fly ash, and granulated blast furnace slag, to conduct freeze–thaw tests on concrete. The results showed that the admixtures could alleviate the damage of pore water expansion pressure on concrete and improve the frost resistance and durability of concrete. Shanqing et al. [16] evaluated the frost resistance and durability of alkali-activated fly ash concrete from the aspects of appearance damage, quality loss, compressive strength loss, and dynamic elastic modulus loss. However, due to the weak physical and mechanical properties of the aggregate mortar interface, the increase in admixtures will have an adverse impact on the concrete strength [17].
The design of concrete materials, such as admixtures, mineral admixtures, and fibers, is the foundation of concrete crack resistance and frost resistance, which are mainly used in tunnel construction. The protection of concrete surfaces is a reinforcement measure, which is mainly used for tunnels in operation. Coating or applying a film on the surface of concrete can prevent moisture and corrosive substances from entering the interior of concrete, improving its durability. Adding silane emulsion to concrete to prepare integral waterproof concrete is an effective means of improving the impermeability of concrete, which can effectively reduce the invasion of water and corrosive substances, improve the impermeability of concrete, and extend the durability of concrete structures [18,19].
Maojiang et al. and Lihai et al. [20,21] used a silane protective agent on pavements to enhance the surface performance of concrete. They found that the surface enhancer significantly improves the waterproofness and frost resistance of concrete. Lei et al. [22] applied a methylsilane waterproof agent to foam concrete specimens, which achieved better frost resistance after freeze–thaw cycles. Yuchen et al. [23] selected two reinforcement materials, silane and epoxy resin, for a rapid freeze–thaw cycle test on a test block of concrete. The results showed that these two reinforcement materials can improve the frost resistance and durability by improving the pore size distribution of the concrete surface, thereby blocking the entry of water. Zou et al. [24] used a silane emulsion to modify the surface of recycled aggregate, which can more effectively improve the compressive strength and freeze–thaw durability of concrete. Ma et al. [25] found that silane coupling agent surface waterproof treatment was suitable for repairing the durability of freeze–thaw-damaged concrete. Surface protection can improve the water resistance of concrete and reduce the internal saturation [26].
Research on enhancing the durability of operational tunnel lining concrete by applying anti-frost materials to the concrete surface is not abundant. Similar studies on the frost resistance of concrete mainly focus on the water–cement ratio, air content, cement dosage, and additives [27]. Accordingly, this study conducted on-site investigations into the strength deterioration characteristics of tunnel concrete in high-altitude and cold regions. Silicone coatings were applied to improve its frost resistance durability. The freeze–thaw cycle tests were conducted on specimens with different coatings to explore the damage patterns of concrete during the freeze–thaw cycle process. The freeze–thaw damage, dynamic elastic modulus, and mass loss of the specimens were used to evaluate the freeze–thaw durability of the coating reinforced concrete. It is aimed to provide an experimental basis for selecting better frost-resistant materials for tunnel concrete in high-altitude and cold regions. Considering the influence of the water environment on concrete and integrating tunnel temperature, a conversion model based on the saturation coefficient S was established to calculate the equivalent number of indoor freeze–thaw cycles.

2. Study on Strength Deterioration Characteristics of Lining Concrete of High-Elevation Tunnels

Through the investigation of the strength of lining concrete during the operation of highway tunnels in Western Sichuan Plateau, the strength deterioration characteristics of the tunnels were analyzed, which can provide a basis for the high-durability freeze–thaw-resistance concrete test of high-altitude tunnels.
According to the technical requirements of the “Technical Specification for Testing Concrete Compressive Strength by Rebound Method” [28], the ZBL-5260 digital rebound hammer was used. Each test area size was 20 cm (length) × 20 cm (width), and divided into 16 small squares. Sixteen rebound values were obtained from every small square. Then, a carbonation depth test was conducted. The concrete strength was obtained by the average strength value corrected by the carbonation depth in each test area. There were no core samples collected to test in all tunnels. Because the management department does not allow coring. The general situation of each tunnel and the layout of on-site measuring points are shown in Table 1.
The strength deterioration characteristics of on-site concrete were monitored according to the layout of each measuring point. The test results of the lining strength of each tunnel are shown in Figure 1. Figure 1a shows the lining strength in Balangshan Tunnel. The lining strength in the tunnel basically showed a gradual increase from the Xiaojin end to the Wenchuan end, which was mainly related to the environment at both ends of the tunnel. The Xiaojin end was a shady slope with a relatively low temperature, while the entrance near the Wenchuan end was a gradient with a high temperature, resulting in differences in the durability of concrete on both sides. Figure 1b shows the lining strength in Gaoersi Tunnel. The concrete strength at both ends of the tunnel portal was relatively low, and the concrete strength at the middle of the tunnel was relatively high. The whole was basically symmetrical. Figure 1c shows the strength test of the lining in Queershan Tunnel. The concrete strength at both ends of the tunnel portal was low, and the concrete strength in the middle of the tunnel was high. It was found that the concrete strength in the Dege end was higher than that in the Ganzi end. Figure 1d shows the lining strength in Lanashan Tunnel. The strength of the lining in the tunnel was discrete. From the investigation, the water leakage trace in the middle of the tunnel was significant, which may have had a certain impact on the strength of the lining.
The variation law of concrete strength in super-long tunnels is relatively complex. This is because the longer the tunnel, the greater the temperature difference between the entrance and the inside of the tunnel, and the slope effect is significant at both ends of the entrance. At the same time, due to the significant differences in the geological strata that the tunnel passes through, water leakage has a significant impact on the concrete, and there may be significant local differences in the strength of the concrete inside the tunnel. But the strength of the concrete at the entrance is lower than that in the middle of the tunnel. Therefore, the durability of concrete in the entrance area of high-altitude tunnels needs special attention.

3. Experimental Study on Freeze–Thaw of Lining Concrete with Different Silicone Coatings

In the current concrete freeze–thaw test methods, the rapid freezing method is the freeze–thaw method adopted by the vast majority of researchers. According to the relevant provisions of the “Standard Test Method for Long-Term Performance and Durability of Ordinary Concrete” [29], the rapid freezing method was used in this study, and the lowest and highest temperatures were −18 °C and 5 °C, respectively. Corresponding freeze–thaw tests were conducted on lining concretes with different organic silicon coatings.

3.1. Specimen Fabrication

The freeze–thaw durability of lining concrete research focuses on the lining deterioration of operational tunnels in cold regions. Common C35 concrete (standard cube compressive strength of the concrete at the age of 28 days is 35 MPa) was often used for tunnel lining. Therefore, common C35 concrete was used in the experiments to simulate tunnel lining concrete. Prisms with a size of 100 mm × 100 mm × 400 mm were made from the specimens, and each group of specimens should consist of 3. Through brushing silicone paint on the concrete surface according to the set, the coating t was distributed in the range of 200–400 g/m2, and the test scheme is shown in Table 2.
The freeze–thaw testing machine was set to 25 freeze–thaw cycles and automatically stopped after 25 freeze–thaw cycles. The freeze–thaw cycle tester was opened to take out the test mold carefully and pour out the water from the test mold, and then take out the test block. The test block was dried, and the mass and elastic modulus of the block were reset to calculate the mass loss and relative elastic modulus of the test piece. When the elastic modulus was less than 60% of the initial value or when the mass loss was greater than 5%, the test was terminated. This test was divided into three batches, and the test results were analyzed respectively.

3.2. Experimental Results and Analysis

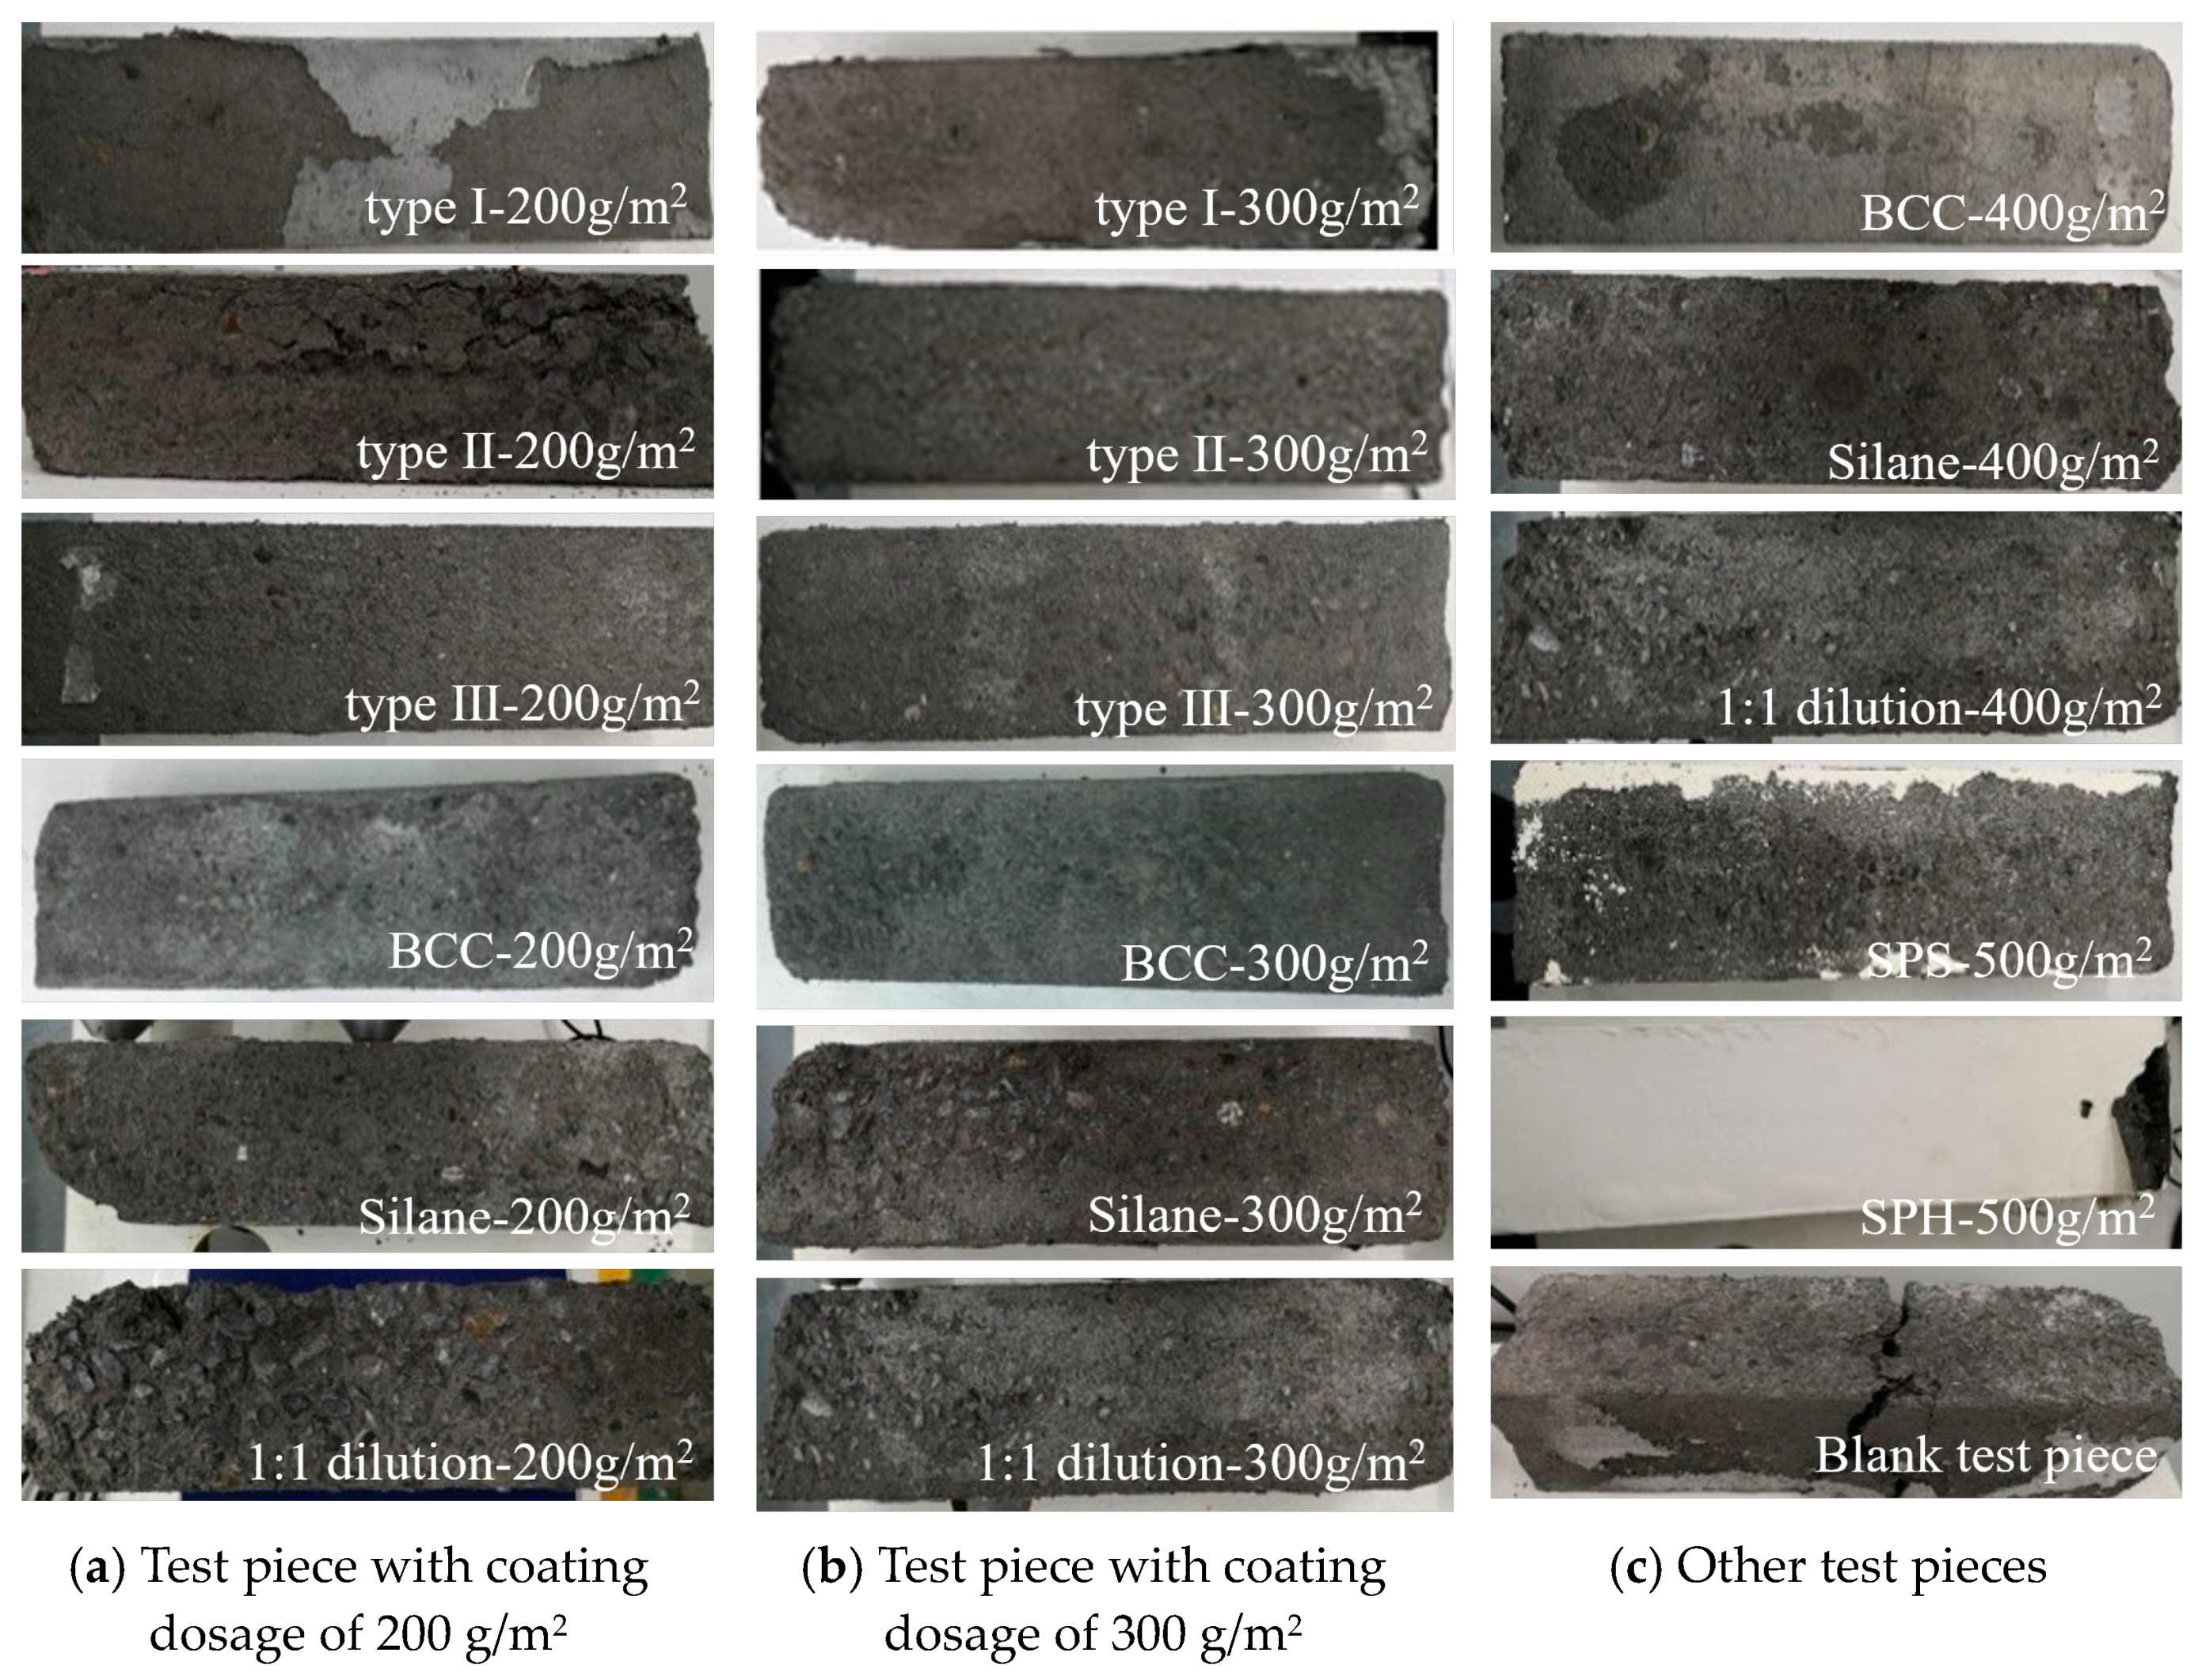
3.2.1. Freeze–Thaw Test Results and Analysis

During the freeze–thaw cycle process, the damage patterns of specimens with different antifreeze materials were generally consistent. The damage pattern could be roughly divided into three stages: The first stage involved the destruction of both ends of the specimen, causing spalling until the antifreeze material fell off. In the second stage, the cement mortar at both ends began to peel off, and as this continued, micro-cracks and fissures gradually appeared on the surface of the specimen. In the final stage, coarse aggregate is exposed or peels off, and the specimen becomes soft and damaged. The timing of these three stages varies among specimens with different types and amounts of coatings. As shown in Figure 2, the images depict different specimens after undergoing the maximum freeze–thaw cycles.
The freeze–thaw experiments revealed that the antifreeze properties of coating materials are primarily attributed to two factors: First, ice resistance is achieved by forming a superhydrophobic layer on the surface of the concrete specimen. This layer prevents water and erosive substances from entering the concrete and allows supercooled water to be removed from the surface by external forces before freezing into ice. Second, ice repellency is achieved, where ice can be easily removed from the surface with minimal external force after it forms. Due to the poor adhesion of coating materials at both ends of the concrete specimens and other factors, the freeze–thaw damage of the specimens significantly increased after the coatings at both ends peeled off under the influence of freeze–thaw cycles.
Table 3 is the statistical list of the freeze–thaw resistance cycles of test pieces. When the coating was 200 g/m2, the effect of silane type III antifreeze was the best, followed by silane, and silane type. The freeze–thaw resistance cycle numbers were 125, 100, and 75, respectively. When the coating dosage was 300 g/m2, the effect of silane type III antifreeze was the best, and the number of freeze–thaw resistance cycles was 175, while the effects of silane type I, silane type II, BS CREME C, and silane were the same, and the numbers of freeze–thaw resistance cycles were all 100. Compared with the test pieces with the coating dosage of 200 g/m2, the freeze–thaw resistance cycles of the test pieces with a coating dosage of 300 g/m2, such as silane type I, silane type II, silane type III, and BS CREME C, increased by 33%, 100%, 40%, and 100% respectively. When the coating dosage was 400 g/m2, the freeze–thaw resistances of BS CREME C and silane were the best, and the number of freeze–thaw resistance cycles was 125 times. Compared with the test piece with a coating dosage of 300 g/m2, the number of freeze–thaw resistance cycles of BS CREME C and silane increased by 25%. When the dosage of the coating was 500 g/m2, the effect of the silicone–polyether hybrid antifreeze was the most significant, and the number of freeze–thaw resistance cycles reached 300, followed by the silicone concrete protection system, and the number of freeze–thaw resistance cycles reached 125.
Comparing the amount of coating, it was found that the silicone antifreeze material with the application of 500 g/m2 had the best antifreeze effect, and the test pieces with the application of antifreeze agent at 300 g/m2 and 400 g/m2 had the second-best antifreeze effect, and the test pieces with the application of 200 g/m2 had the weakest antifreeze effect.

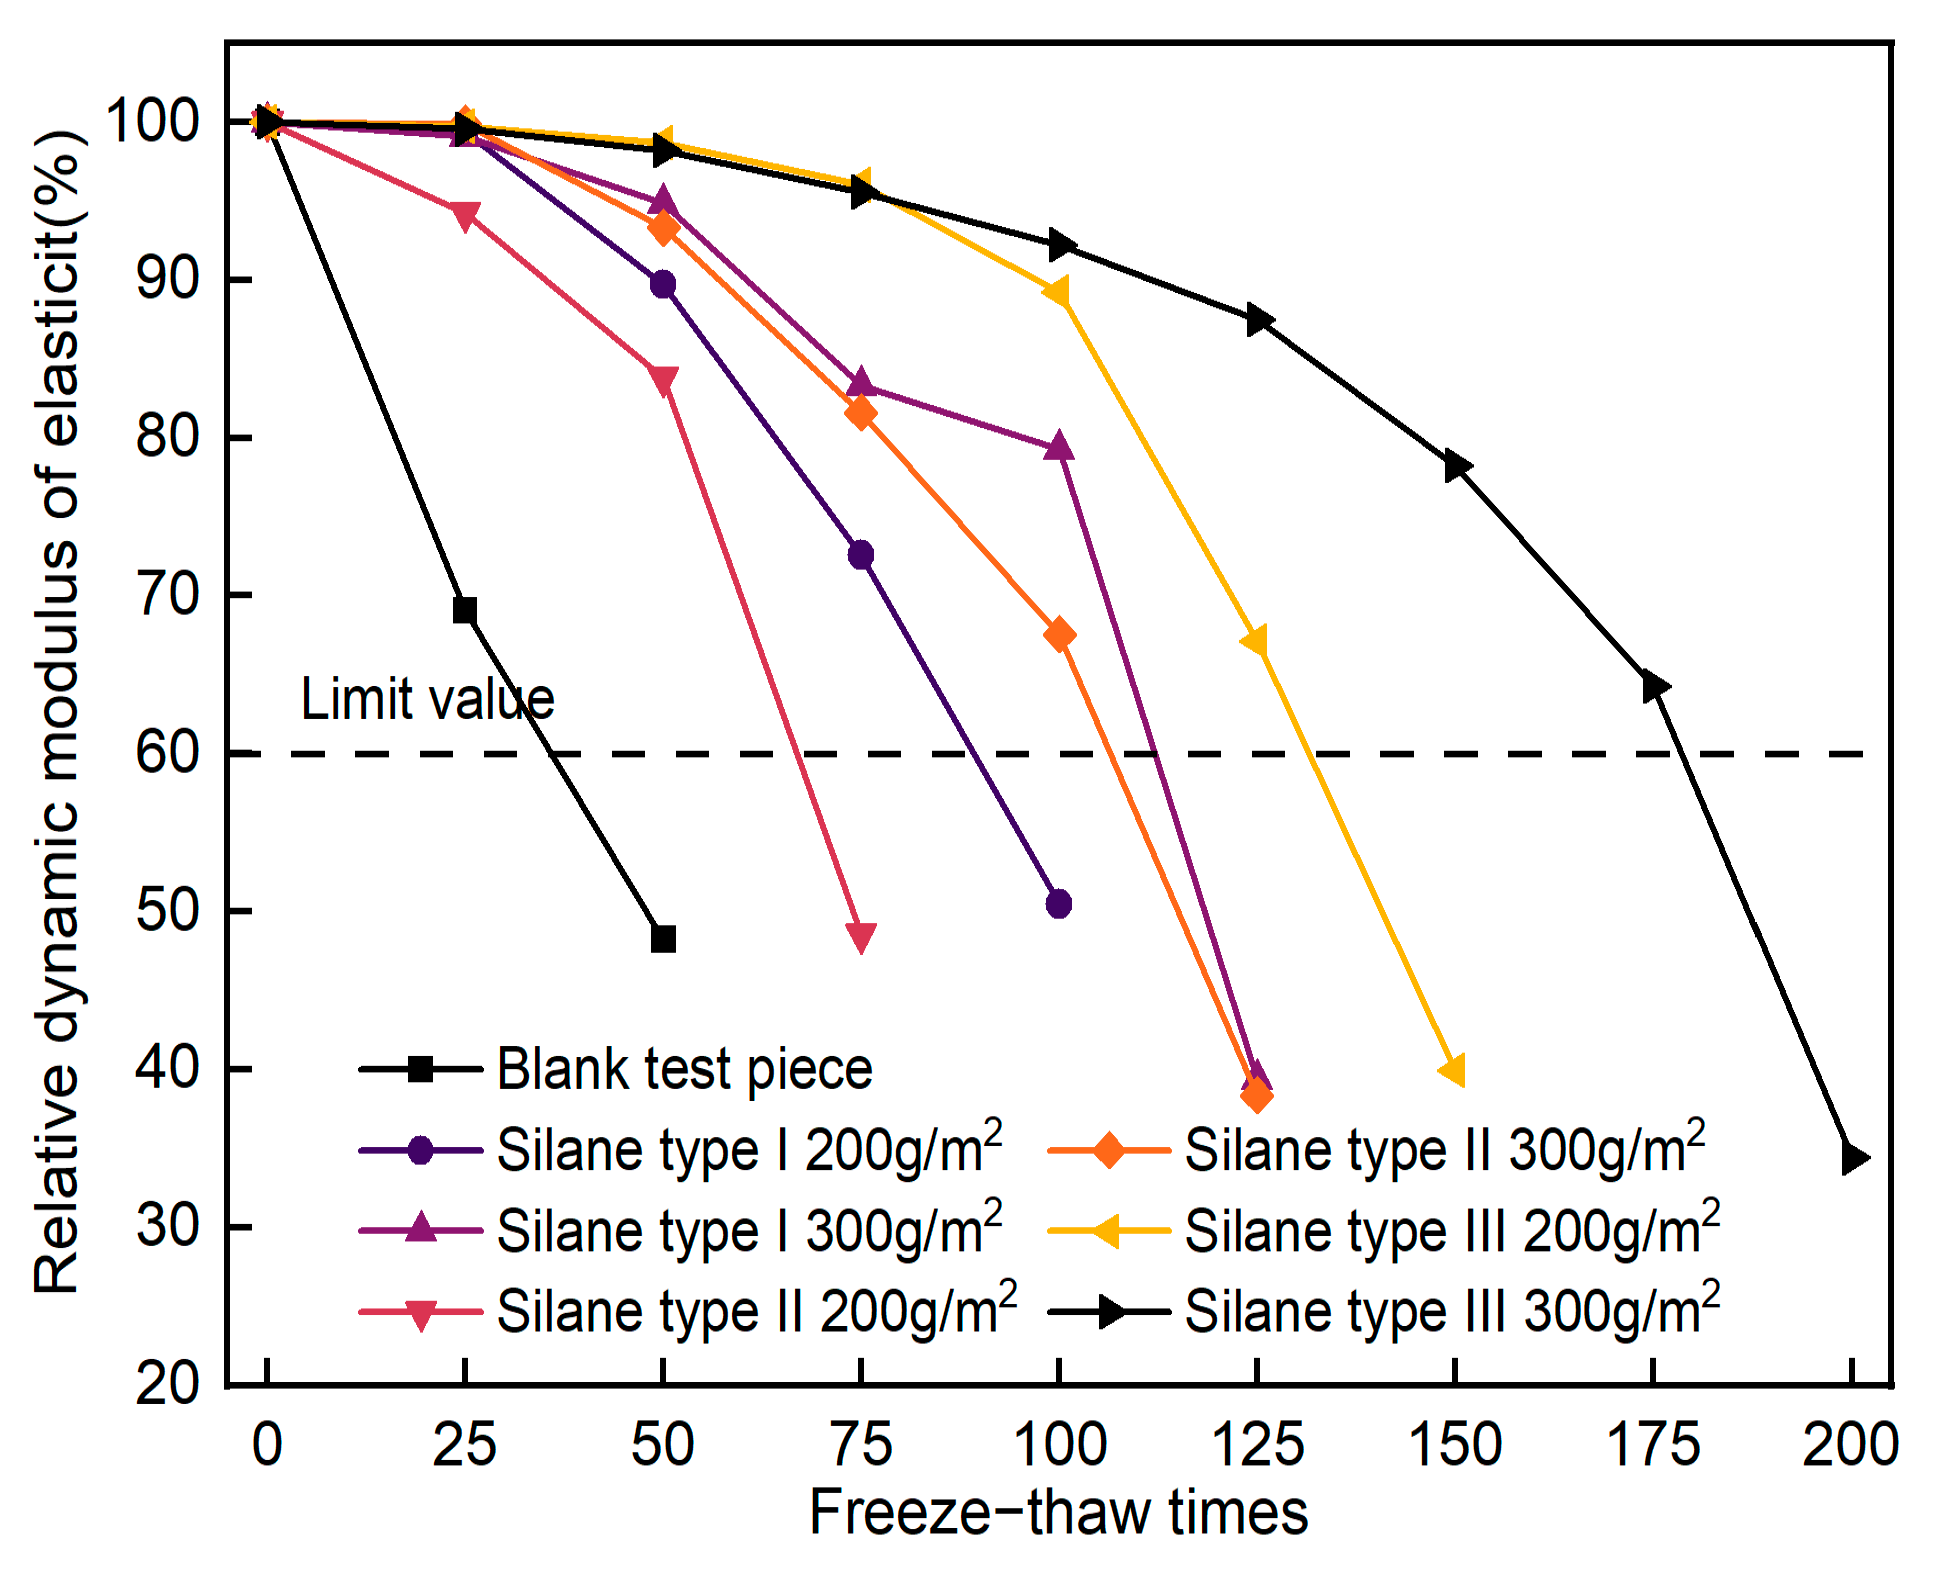
3.2.2. Test Results and Analysis of Dynamic Elastic Modulus

The dynamic elastic modulus of concrete is closely related to its structure. The internal structure of concrete with different numbers of freeze–thaw cycles is damaged at different levels, and the dynamic elastic modulus will change correspondingly. Therefore, the change in the dynamic elastic modulus of concrete can evaluate the frost resistance of concrete with different materials.
Based on the “Standard Test Method for Long-term Performance and Durability of Ordinary Concrete” [29], the relative dynamic modulus of elasticity (RDM) test method was employed. The DT-20 experimental instruments produced by Tianjin Gangyuan Testing Instrument Factory were used for the dynamic modulus of elasticity test.
Figure 3 shows the relative dynamic elastic modulus of the silane antifreeze specimen. When the specimen reached the limit of 60%, the freezing resistance cycles of the blank specimen, silane 200 g/m2, silane 300 g/m2, silane 400 g/m2, silane (1:1 dilution) 200 g/m2, silane (1:1 dilution) 300 g/m2, and silane (1:1 dilution) 400 g/m2 were 25, 100, 100, 125, 50, 75, and 75, respectively, and the relative dynamic elastic moduli of the specimens were 69.09%, 64.16%, 69.89%, 61.22%, 63.26%, 77.03%, and 65.21% respectively. Compared with the blank specimens, the frost resistances of the specimens increased by 3, 3, 4, 1, 2, and 2 times respectively. The frost resistance of silane 400 g/m2 was the best, followed by silane 200 g/m2 and silane 300 g/m2, then silane (1:1 dilution) 300 g/m2 and silane (1:1 dilution) 400 g/m2, and that of silane (1:1 dilution) 200 g/m2 was the weakest.
Figure 4 shows the relative dynamic elastic modulus of silane impermeable antifreeze specimens. When the specimen reached the limit of 60%, the frost resistance cycles of the blank specimen, type I 200 g/m2, type I 300 g/m2, type II 200 g/m2, type II 200 g/m2, type III 200 g/m2, and type III 300 g/m2 were 25, 75, 100, 50, 100, 125, and 175, respectively, and the relative dynamic elastic moduli of the specimens were 69.09%, 72.55%, 79.03%, 83.78%, 67.57%, 67.12%, and 64.28% respectively. Compared with the blank specimens, the frost resistances of the specimens increased by 2, 3, 1, 3, 4, and 6 times, respectively. The freezing resistance of silane type III 300 g/m2 was the best, followed by silane type III 200 g/m2, silane type II 300 g/m2, and silane type I 300 g/m2, and that of silane type Ⅰ 200 g/m2 was the worst.
Figure 5 shows the relative dynamic elastic moduli of the silicone antifreeze specimens. When the specimens reached the limit of 60%, the frost resistance cycle of the blank specimens, BS CREME C-200 g/m2, BS CREME C-300 g/m2, BS CREME C-400 g/m2, silicone protection system-500 g/m2, and silicone–polyether hybrid-500 g/m2 were 25, 50, 100, 125, 125, and 300, respectively, and the relative dynamic elastic moduli of the specimens were 69.09%, 77.21%, 62.56%, 63.99%, 67.61%, and 64.19% respectively. Compared with the blank specimen, the frost resistances of the specimens coated with silicone antifreeze agent increased by 1, 3, 4, 4, and 11 times, respectively. The frost resistance of the silicone–polyether hybrid 500 g/m2 was the best, followed by the silicone protection system 500 g/m2, and BS CREME C-400 g/m2, and that of BS CREME C-200 g/m2 was the worst.
It can be seen that the relative dynamic elastic moduli of all specimens gradually decreased with the increase in the number of freeze–thaw cycles, and the rate of decrease in the relative dynamic elastic modulus of concrete with frost-resistant materials was lower than that of blank specimens. This was because the surface coating closed the pores on the surface of the concrete specimen and external water could not easily invade the interior of the specimen. In this way, a hydrophobic layer was formed on the surface of the specimen to block or reduce the invasion of external water into the specimen and the hydrostatic pressure and osmotic pressure inside the specimen. As a result, the damage to the concrete specimen pores was weakened during freeze–thaw, improving the frost resistance. When the coating material peeled off, external water infiltrated the concrete, leading to a significant increase in freeze–thaw damage and accelerating the rate of decrease in the relative dynamic elastic modulus of the specimens.
Taking the relative dynamic elastic modulus of 60% as the limit, the frost resistance cycles of the silicone–polyether hybrid 500 g/m2 and silane type III 300 g/m2 reached 175 and 300 times respectively, and the frost resistance effect was the most significant.

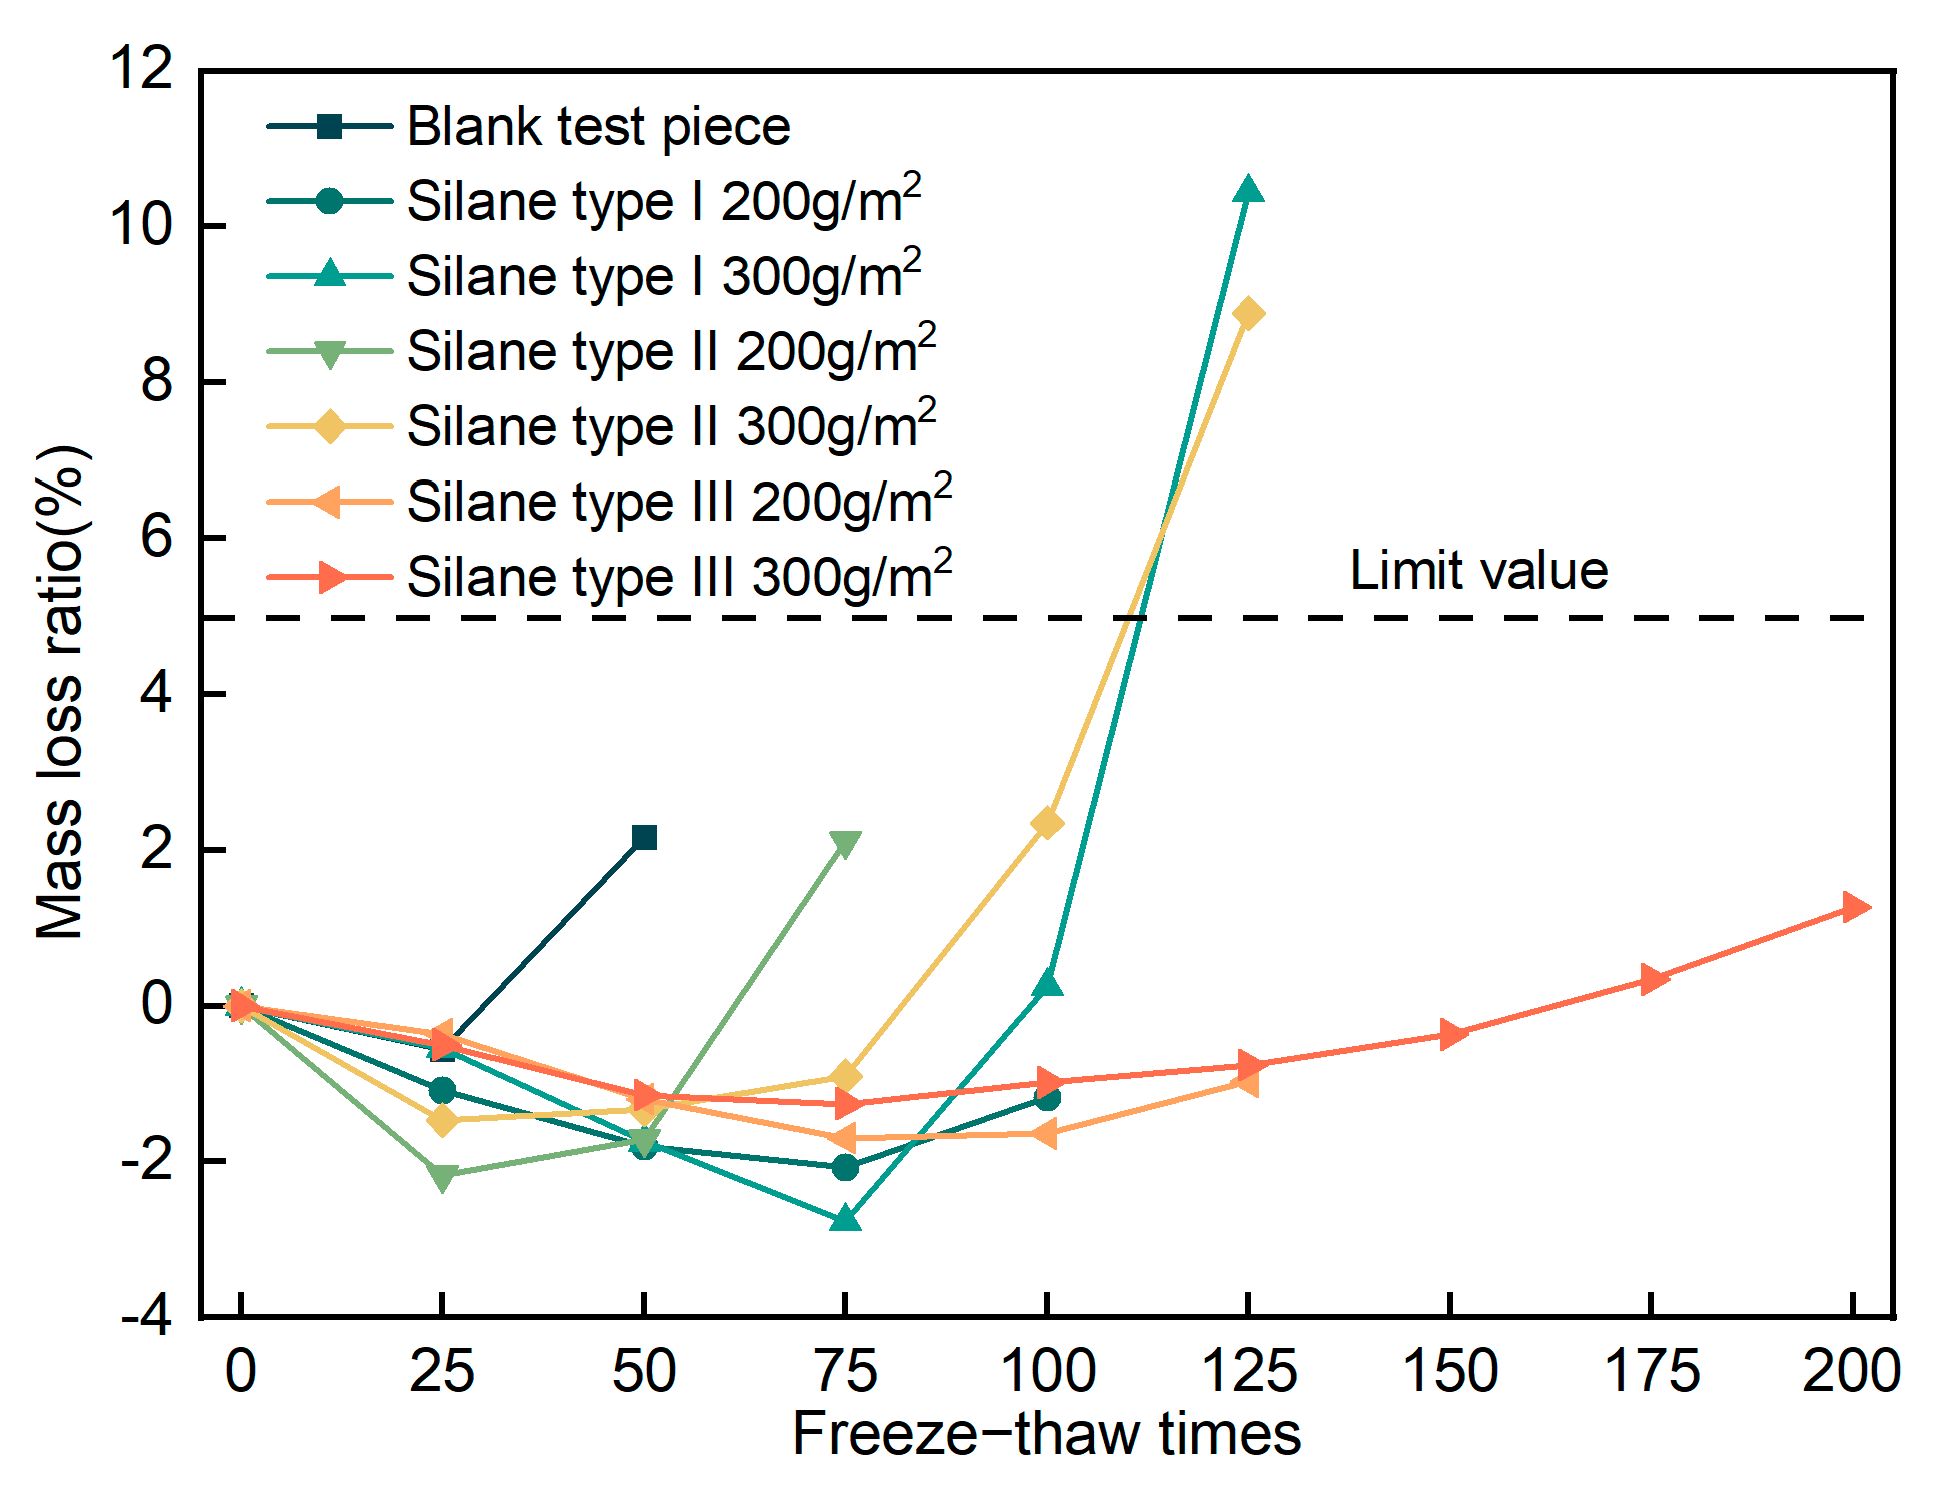
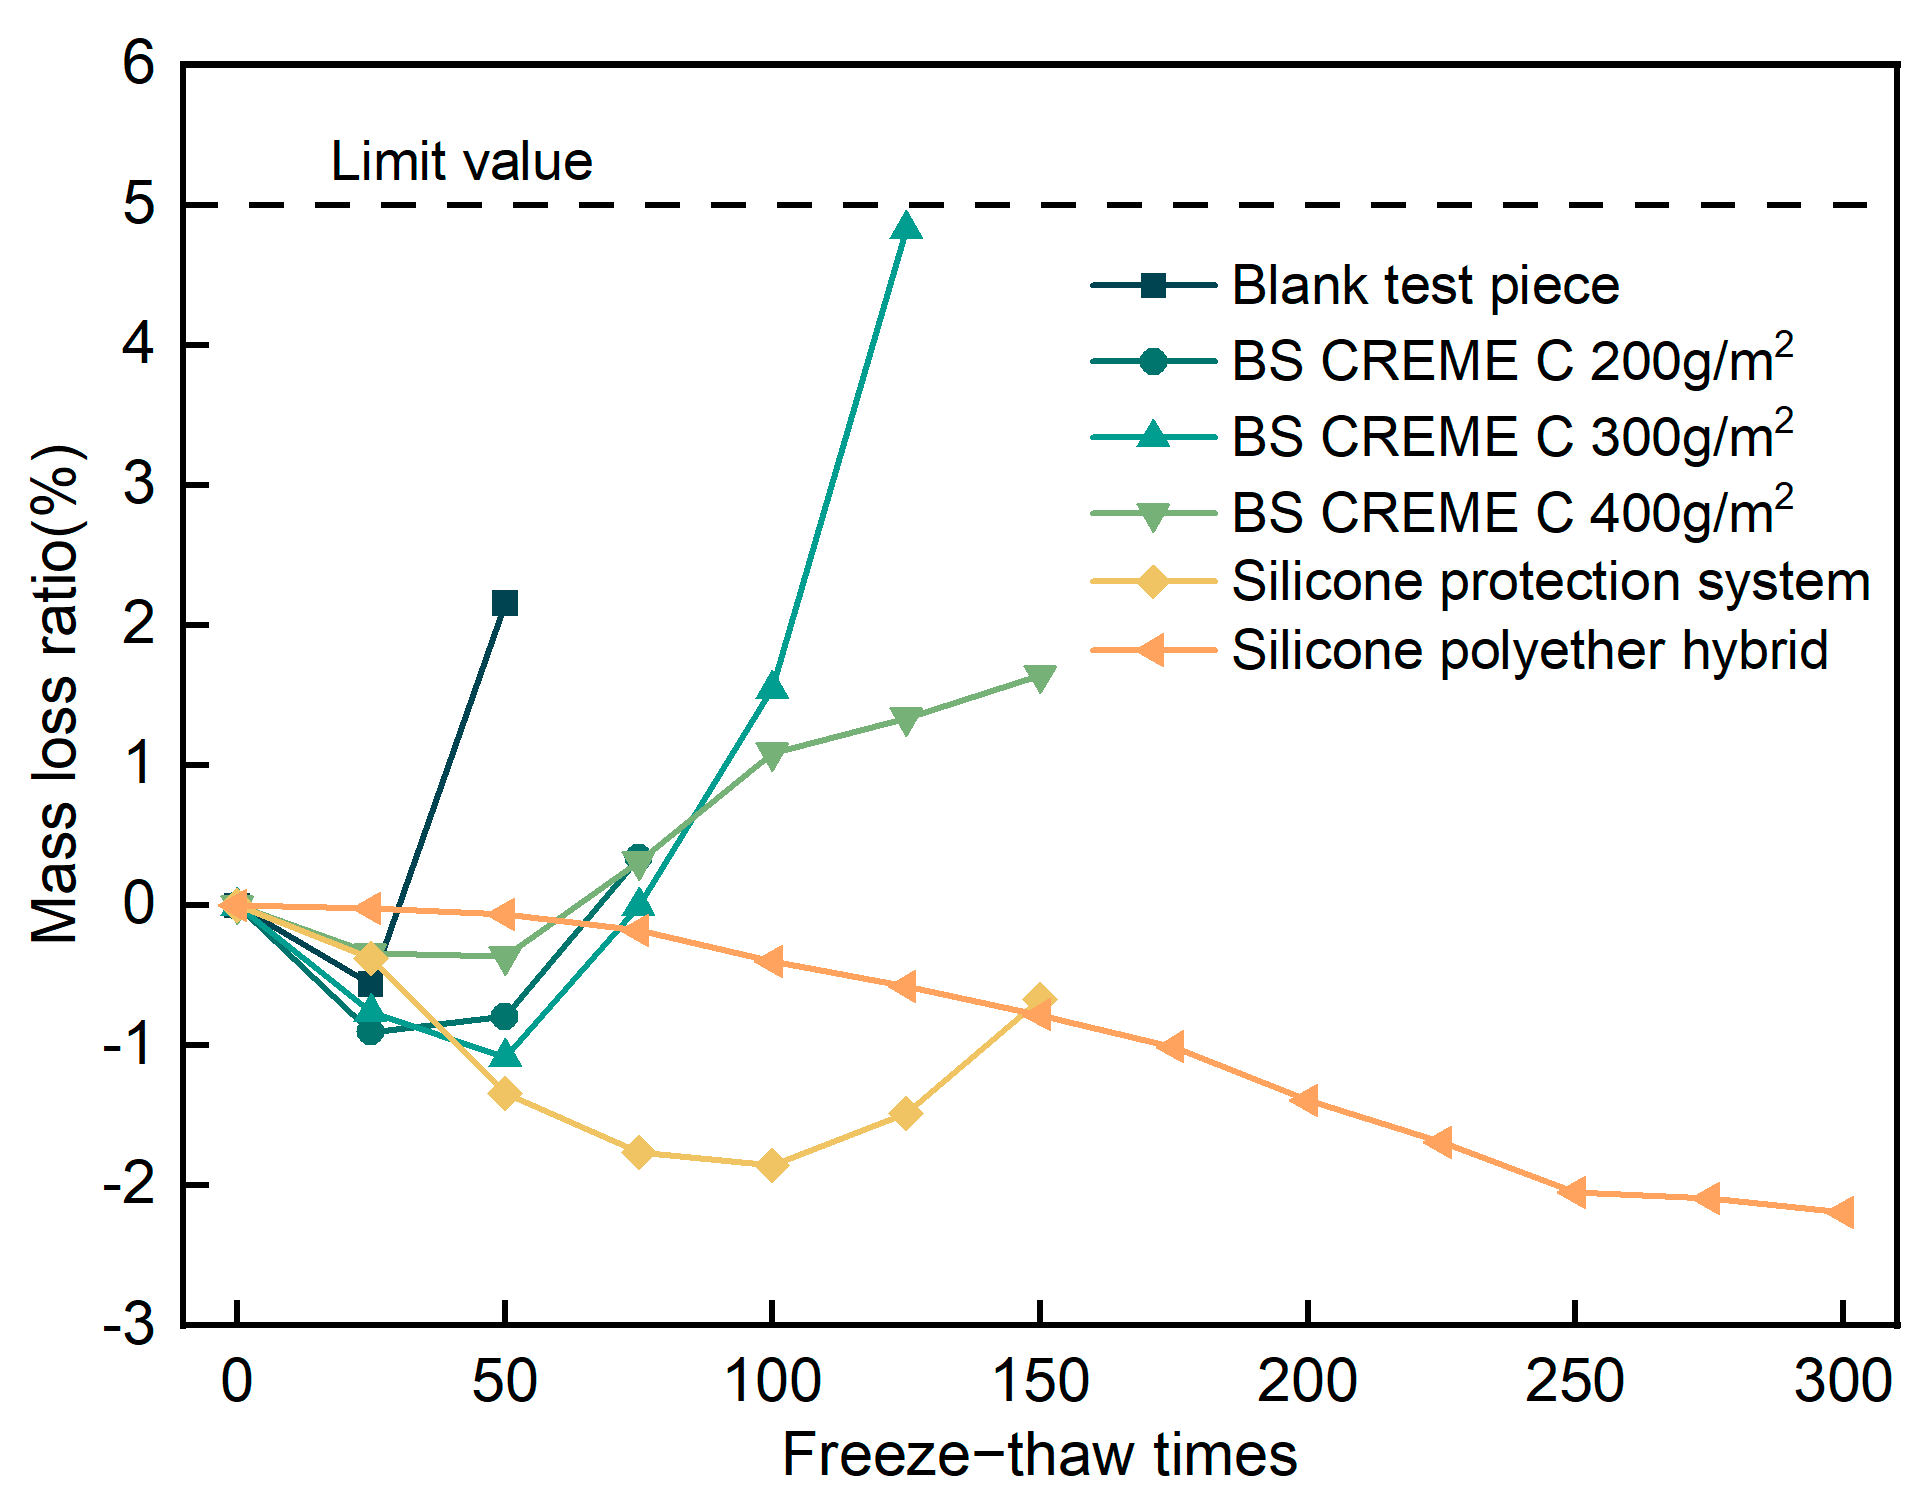
3.2.3. Mass Loss Test Results and Analysis

After several freeze–thaw cycles, peeling and slag dropping would appear in the concrete, causing mass loss. According to the “Standard Test Method for Long-term Performance and Durability of Ordinary Concrete” [29], mass loss is one of the important indexes for evaluating the frost resistance of concrete. Thus, mass loss was measured.
Figure 6 shows the mass loss ratio of the silane antifreeze specimens. When the number of freeze–thaw cycles was about 0–50, the mass of specimens with different contents of silane antifreeze and silane diluent will increase. This is mainly because, after the original specimen is made and shaped, as the number of freeze–thaw cycles increased, the micropores and microcracks in the specimens of concrete continued to sprout and expand, making the increase of water content in the specimen greater than the mass loss of the specimen. After 50 freeze–thaw cycles, the mass loss ratio of the specimen had an upward trend, and the mass of the concrete specimen gradually decreased. The mass damage was greater than the increase in water content, and the mass loss of the specimen was positive. As the number of freeze–thaw cycles increased, the mass loss gradually increased. According to the limit value of the mass loss ratio of 5%, when the relative dynamic elastic modulus of each concrete specimen reached 60%, the mass loss ratios of each concrete specimen were −0.56%, 0.95%, 0.62%, 3.90%, −0.09%, 2.86%, and 1.02%, and the mass loss ratio did not reach the limit of 5%.
Figure 7 shows the mass loss ratio of the silane impermeable antifreeze specimens. It has a similar trend to Figure 6. As the number of freeze–thaw cycles increased, the quality of the specimens first increased and then decreased. In terms of the mass loss ratio limit of 5%, when the concrete specimens reached the frost resistance cycles and the relative dynamic elastic modulus was 60%, the mass loss ratios of the specimens were −0.56%, −2.08%, 0.25%, 1.72%, 2.35%, 0.97%, and 0.34%, and the mass loss did not reach the limit value of 5%. This indicates that the strength of the specimens decreased faster than the mass loss rate of concrete during the freeze–thaw process.
Figure 8 shows the mass loss ratio of the silicone antifreeze specimens. The quality of the silicone–polyether hybrid 500 g/m2 specimen gradually increased with the increase in freeze–thaw cycles. The reason is that the antifreeze material had a certain tensile strength and optimal waterproof effect. As the number of freeze–thaw cycles increased, the local antifreeze layer of the specimen cracked and absorbed water. The modified antifreeze material had a certain tensile strength and could effectively wrap the specimen, so the specimen would basically not fall off. At the same time, when the mass loss ratio was 5% of the threshold value, when the frost resistance cycles of each concrete specimen reached 60% of the relative dynamic elastic modulus, the mass loss ratios of each concrete specimen were −0.56%, −0.79%, 1.55%, −1.09%, −1.48%, and−2.09%, respectively, while the mass loss did not reach the threshold of 5%. This also indicated that the strength value of the specimen decreased faster than the mass loss rate of concrete during the freeze–thaw process.
In general, the quality of concrete specimens with different freeze–thaw-resistant materials increased at the beginning of the freeze–thaw cycle. This was mainly due to the increase in the number of freeze–thaw cycles after the original specimen was formed, as well as the continuous initiation and expansion of micropores and microcracks in the concrete specimens, which increased the water content of the concrete specimens. In addition, the concrete mass loss at the beginning of the freeze–thaw cycles was small, and the mass loss value of the specimen was lower than the increase in the water content, resulting in an increase in the quality of the concrete specimen. As the number of freeze–thaw cycles increases, peeling, and slag dropping appeared in the concrete specimen, resulting in quality loss. Based on the limit of the mass loss ratio of 5%, when the frost resistance cycles of each concrete specimen reached 60% of the relative dynamic elastic modulus, the mass loss ratio of each concrete specimen did not reach the limit of 5%. This indicates that, during the freeze–thaw process, the strength value of the specimen decayed much faster than the mass loss rate of concrete.

4. Research on the Conversion of Freeze–Thaw Cycles of Concrete

4.1. Freeze–Thaw Failure Mechanism and Influencing Factors of Concrete

Freeze–thaw cycling refers to the internal stress generated by pore water during the freezing process of concrete structures in a saturated state. When the ambient temperature rises and ice melts into water, the pressure will be reduced. Such alternating stress acts repeatedly, ultimately leading to concrete fatigue and damage, such as micro cracks or surface erosion. Theories such as hydrostatic pressure hypothesis [30,31], osmotic pressure hypothesis [32,33], crystallization pressure theory [34,35], and critical saturation theory [36] have been developed on the mechanism of concrete freeze–thaw failure. The hydrostatic pressure theory and osmotic pressure theory proposed by Powers are mainly accepted [37]. According to the freeze–thaw damage mechanism of concrete, the frost resistance of concrete is related to the air bubble spacing, cooling rate, content of freezing water, permeability coefficient of materials, and the ability to resist damage. The most important factor is the average bubble spacing [38]. In addition, the water–cement ratio, saturated state, aggregates, cement varieties, and admixtures also have certain effects [39].

4.2. Difference and Relationship between Indoor and Outdoor Freeze–Thaw Process

Due to the significant differences between the on-site freeze–thaw environment and the indoor freeze–thaw environment, the laboratory’s use of the freeze–thaw cycle method to measure the frost resistance of concrete had a much faster cooling rate than the actual environment. Therefore, it was unreasonable to directly use the test results of the freeze–thaw cycle method to evaluate the frost resistance of concrete in practical engineering. The correlation between the indoor test environment and actual environment deserves further research.
According to the experimental requirements of the rapid freezing method, the highest and lowest temperatures of the freeze–thaw temperature cycle in the indoor rapid freezing test were fixed at (5 ± 2) °C and (−18 ± 2) °C, respectively. The cooling time and heating time are fixed and have a periodic pattern [29]. From the perspective of fatigue, the effect of indoor freeze–thaw cycles on concrete is a generalized periodic constant amplitude fatigue temperature load. The fluctuation in field temperature is caused by changes in the ground and atmosphere receiving solar radiation caused by the rotation of the earth, which has an approximate periodic law. Meanwhile, on-site temperature fluctuations are also affected by local topography and atmospheric movements. These factors lead to non-periodic patterns of on-site temperature fluctuation. From the perspective of fatigue, the effect of in situ temperature fluctuations on concrete is a generalized variable amplitude random fatigue temperature load.
On the premise of the same performance of concrete materials, the difference in the freeze–thaw damage process between indoors and outdoors depends on the difference in freeze–thaw environments. Xila and Guangpu [40] assumed that the saturation degree of concrete frequently exposed to water on site was the same as that of indoor water. To this end, the difference between indoor and outdoor freezing and thawing environments mainly depended on the difference between indoor and outdoor temperature cycling. For saturated concrete, the equivalent number of freeze–thaw cycles in the laboratory corresponding to the number of freeze–thaw cycles in the field was derived as follows:
N e q = κ i ζ i N i
where N e q is the equivalent number of indoor freeze–thaw cycles; N i is the number of on-site concrete freeze–thaw cycles; κ i is the proportional coefficient between the hydrostatic pressure generated by the on-site temperature freeze–thaw cycle and the hydrostatic pressure generated by the indoor fast freezing test temperature freeze–thaw cycle, and ζ is the concrete material parameter, taking as 0.946 [41].
According to the hydrostatic pressure hypothesis of Powers, the proportional coefficient κ i between the hydrostatic pressure generated by the on-site temperature freeze–thaw cycle and the hydrostatic pressure generated by the indoor fast freezing test temperature freeze–thaw cycle is approximately equal to the ratio of the on-site cooling rate and the indoor fast freezing test cooling rate:
κ i = T ˙ i / T ˙
where T ˙ i is the cooling rate at all levels of the on-site environment and T ˙ is the cooling rate of the indoor quick-freeze test, about 12.5 °C/h [29].

4.3. Equivalent Freezing–Thawing Cycle Conversion Model

The equivalent number of indoor freeze–thaw cycles refers to the number of corresponding indoor rapid freeze–thaw cycles that concrete will experience when the damage degree of concrete after several on-site freeze–thaw cycles is the same. The equivalent indoor freeze–thaw cycles are based on the indoor rapid freeze–thaw test environment as the standard condition, which can directly predict the severity of the surrounding environment, and can be used to predict the durability of concrete.
Based on the previous indoor experimental results, the frost resistance of concrete specimens is closely related to their surrounding water environment. As the moisture content increases, the frost resistance of concrete tends to decrease. Considering that the water saturation degree of the tunnel lining structure in the atmospheric environment is lower than the water saturation limit degree, the concrete saturation coefficient S is proposed. For concrete structures that are frequently exposed to water, the saturation coefficient S can be approximately taken as 1. In more cases, S needs to be determined according to the actual situation of the region and the target project.
The calculation method of equivalent freeze–thaw cycles in a concrete room under the site’s environment is as follows:
N e q = S κ i ζ i N i
It should be noted that the saturation coefficient S of concrete is closely related to the action level of the freeze–thaw environment. Combined with the environmental action level, the degree of saturation is divided into two working conditions: high saturation and moderate saturation. For different degrees of concrete saturation, the value of the saturation coefficient S can be taken according to Table 4 [42].
The critical water saturation degree of concrete damaged by freezing and thawing is about 85–90%. When the water content is lower than the critical water saturation degree, the concrete will not freeze. However, when there is water on the surface, frequent repeated freezing and thawing can continuously increase the water saturation degree of the concrete. Once the critical water saturation degree is reached or exceeded, the concrete may be damaged soon.

4.4. Engineering Application Examples

Based on the temperature data monitoring at the entrance of Queershan Tunnel, a conversion model of equivalent freeze–thaw cycles is established to convert the indoor freeze–thaw cycles of concrete at the entrance of Queershan Tunnel in the sense of damage equivalence. Table 5 shows the statistics of on-site freeze–thaw cycle temperatures.
As shown in Table 5, the number of site freeze–thaw cycles at the entrance of Queershan Tunnel was 95 a year. The equivalent indoor freeze–thaw cycles corresponding to the number of freeze–thaw cycles in one year on-site is calculated according to Formula (3):
N e q = i = 1 95 κ i ξ × 1 5.0   ( times )
When the site environmental conditions are highly saturated, that is, when the saturation coefficient is 1, the secondary lining concrete at the entrance of Queershan Tunnel experiences about 95 freeze–thaw cycles within a year, equivalent to about 5 indoor freeze–thaw cycles. When the environmental conditions of the site are moderately saturated, that is, when the saturation coefficient is 0.8, there are about four equivalent indoor freeze–thaw cycles.

5. Conclusions

This study investigates the characteristics of concrete strength degradation in different locations of operational tunnels, and silicon coatings were used to improve the freeze–thaw durability of lining concrete in tunnels. This study analyzed the freeze–thaw damage phenomena, dynamic elastic modulus, and mass loss of specimens subjected to different freeze–thaw cycles. An equivalent freeze–thaw cycle conversion model was established based on the concrete saturation coefficient S. The conclusions are as follows:
(1)
The strength deterioration of tunnel concrete was greatly affected by freeze–thaw action. As the tunnel length increased, the greater the temperature difference between the entrance and the tunnel, coupled with the sunny–shady slope effect at both ends of the entrance, the overall concrete strength of the tunnel showed asymmetric characteristics where the entrance area was smaller than the middle area. It was stated that the lining concrete deterioration law was similar to the temperature change. Special attention should be paid to the freeze–thaw durability of lining concrete in high-altitude tunnel entrance areas.
(2)
Silicon coatings can prevent moisture and corrosive substances from entering concrete, thereby enhancing durability. When the coating was 200 g/m2, silane type III antifreeze had the best effect, and the freeze–thaw resistance cycles reached 125 times. When the coating dosage was 300 g/m2, the freeze–thaw resistance cycles of silane type I, silane type II, silane type III, and BS CREME C increased by 33%, 100%, 40%, and 100%, respectively. When the coating dosage was 400 g/m2, the freeze–thaw resistance cycles of BS CREME C and silane reached 125. When the coating dosage was 500 g/m2, the freeze–thaw resistance cycles of silicone polyether hybrid antifreeze reached 300. The damage laws of the specimens during freeze–thaw cycles were basically the same, and the strength reduction rate of the specimens was much greater than the mass loss rate of concrete.
(3)
An equivalent freeze–thaw cycle conversion model was established. It contained the two important factors of the on-site cooling rate and water richness. The freeze–thaw resistance of concrete specimens was closely related to the water environment they were exposed to. Considering the impact of moisture content on the freeze–thaw resistance of concrete, the concrete saturation coefficient S was used. For highly saturated concrete, the saturation coefficient S was taken as 1; for moderately saturated concrete, the saturation coefficient S was taken as 0.8.

Author Contributions

Conceptualization, Y.Z.; Methodology, Y.Z. and R.G.; Software, F.Y.; Validation, F.Y.; Formal analysis, Y.Z. and F.Y.; Investigation, J.Z., B.Z. and R.G.; Resources, J.Z. and B.Z.; Data curation, J.Z. and B.Z.; Writing—original draft, Y.Z. and H.H.; Writing—review & editing, Y.Z. and H.H. All authors have read and agreed to the published version of the manuscript.

Funding

This work was supported by the Sichuan Provincial Transportation Technology Project (No. 2019-D-12), Natural Science Foundation of Chongqing, China (No. CSTB2022NSCQ-MSX1515), and the National Natural Science Foundation of China (No. 51708070).

Data Availability Statement

The original contributions presented in the study are included in the article, further inquiries can be directed to the corresponding authors.

Conflicts of Interest

Authors Yuanfu Zhou, Jinlong Zheng and Feng Yang were employed by the company Sichuan Highway Planning, Survey, Design and Research Institute Ltd. Author Bo Zheng was employed by the company CREC Southwest Research Institute Co., Ltd. The remaining authors declare that the research was conducted in the absence of any commercial or financial relationships that could be construed as a potential conflict of interest.

References

  1. Liu, L.; Ye, G.; Schlangen, E.; Chen, H.; Qian, Z.; Sun, W.; Van Breugel, K. Modeling of the internal damage of saturated cement paste due to ice crystallization pressure during freezing. Cem. Concr. Compos. 2011, 33, 562–571. [Google Scholar] [CrossRef]
  2. Rosenqvist, M.; Oxfall, M.; Fridh, K.; Hassanzadeh, M. A test method to assess the frost resistance of concrete at the waterline of hydraulic structures. Mater. Struct. 2015, 48, 2403–2415. [Google Scholar] [CrossRef]
  3. Qin, X.C.; Meng, S.P.; Cao, D.F.; Tu, Y.M.; Sabourova, N.; Grip, N.; Ohlsson, U.; Blanksvärd, T.; Sas, G.; Elfgren, L. Evaluation of freeze-thaw damage on concrete material and prestressed concrete specimens. Constr. Build. Mater. 2016, 125, 892–904. [Google Scholar] [CrossRef]
  4. Chen, F.; Qiao, P. Probabilistic damage modeling and service-life prediction of concrete under freeze—Thaw action. Mater. Struct. 2015, 48, 2697–2711. [Google Scholar] [CrossRef]
  5. Tang, S.W.; Yao, Y.; Andrade, C.; Li, Z.J. Recent durability studies on concrete structure. Cem. Concr. Res. 2015, 78, 143–154. [Google Scholar] [CrossRef]
  6. Xu, Y.; Yuan, Q.; Dai, X.; Xiang, G. Improving the freeze-thaw resistance of mortar by a combined use of superabsorbent polymer and air entraining agent. J. Build. Eng. 2022, 52, 104471. [Google Scholar] [CrossRef]
  7. Deng, X.H.; Gao, X.Y.; Wang, R.; Zhao, C.J. Study on Frost Resistance and Pore Distribution Change of Recycled Concrete. Mater. Rep. 2021, 35, 16028–16034. [Google Scholar]
  8. Ma, Z.M.; Zhao, T.J.; Yang, J. Fracture Behavior of Concrete Exposed to the Freeze-Thaw Environment. J. Mater. Civ. Eng. 2017, 29, 04017071. [Google Scholar] [CrossRef]
  9. Lund, M.S.; Kevern, J.T.; Schaefer, V.R.; Hansen, K.K. Mix design for improved strength and freeze—Thaw durability of pervious concrete fill in Pearl-Chain Bridges. Mater. Struct. 2017, 50, 42. [Google Scholar] [CrossRef]
  10. Ruizhen, W.; Sai, W. Performance evolution of fiber reinforced concrete under freeze-thaw cycles. Cryogenics 2020, 34, 38–41+67. [Google Scholar]
  11. Hao, G. Study on mechanical properties and frost resistance of basalt fiber/resin matrix composite concrete. J. Funct. Mater. 2024, 55, 2148–2154. [Google Scholar]
  12. Ma, N.; Wang, B.; Miao, F.-S.; Wang, Y.-D. Study on Frost Resistance of Lined Channels Based on Vitrified Fiber Concrete. Water Sav. Irrig. 2024, 4, 58–64. [Google Scholar]
  13. Yang, Y.; Yan, C. Effect of Straw Fiber on Frost Resistance of Concrete Composites. Plast. Sci. Technol. 2024, 52, 75–77. [Google Scholar]
  14. Duan, G.Z.; Fang, C.Q. Research progress and new thinking of destruction of concrete due to freeze-thaw cycles. Concrete 2013, 5, 16–20. [Google Scholar]
  15. Cheng, X.; Zhu, P.; Wang, X.; Liu, H.; Wang, H.; Wang, Y.; Chen, C. Effects of Mineral Admixtures on Frost Resistance and Renewability of Recycled Aggregate Concrete. Bull. Chin. Ceram. Soc. 2024, 43, 956–964. [Google Scholar]
  16. Shanqing, S.; Aimin, G.; Fulai, W. Study of damage to alkali-inspired fly ash concrete under the coupling effect of freeze-thaw by acid salt erosion. Yangtze River 2024, 55, 222–230. [Google Scholar]
  17. El-Hassan, H.; Kianmehr, P.; Zouaoui, S. Properties of pervious concrete incorporating recycled concrete aggregates and slag. Constr. Build. Mater. 2019, 212, 164–175. [Google Scholar] [CrossRef]
  18. Zhao, C.; Ma, Z. Properties of integral waterproofing concrete under the coupling effect of freeze-thaw and chloride. Concrete 2016, 9, 12–15+20. [Google Scholar]
  19. Zhao, W.; Huang, W.; Song, Q.; Xu, J. Studying on the permeability of waterproofing concrete processed with silane emuslion under freezing-thawing environment. Concrete 2016, 8, 39–42. [Google Scholar]
  20. Zhu, M.; Weng, X.; Gao, R.; Jiang, L.; Li, W.; Li, M. Study on Performance of Reinforced Concrete Material for Airport Pavement. J. Shandong Agric. Univ. (Nat. Sci. Ed.) 2018, 49, 295–302. [Google Scholar]
  21. Lihai, S.; Yan, L.; Xungao, J. Research on frost resistance of airport pavement concrete enhanced by surface material. Concrete 2019, 3, 30–34+39. [Google Scholar]
  22. Gong, L.; Guan, H.; Yang, X. Effect of methylsilane waterproof agent on frost resistance of foam concrete. J. Harbin Eng. Univ. 2018, 39, 2075–2079. [Google Scholar]
  23. Xie, Y.; Weng, X.; Liu, P.; Gao, R.; Zhao, W. Study on frost resistance durability of surface-strengthened concrete. J. Railw. Sci. Eng. 2017, 14, 1878–1885. [Google Scholar]
  24. Zou, D.; Wang, Z.; Shen, M.; Liu, T.; Zhou, A. Improvement in freeze-thaw durability of recycled aggregate permeable concrete with silane modification. Constr. Build. Mater. 2021, 268, 121097. [Google Scholar] [CrossRef]
  25. Ma, Z.M.; Zhu, F.Z.; Zhao, T.J. Effects of surface modification of silane coupling agent on the properties of concrete with freeze-thaw damage. Ksce J. Civ. Eng. 2018, 22, 657–669. [Google Scholar] [CrossRef]
  26. Kang, S.; Wu, H.; Lu, H.; Li, N.; Liu, C.; Shu, Z. Improvement of Freeze-Thaw Resistance of Concrete by Polyvinyl Alcohol Membrane and Silane. Adv. Eng. Mater. 2023, 25, 2300396. [Google Scholar] [CrossRef]
  27. Taheri, B.M.; Ramezanianpour, A.M.; Sabokpa, S.; Gapele, M. Experimental evaluation of freeze-thaw durability of pervious concrete. J. Build. Eng. 2021, 33, 101617. [Google Scholar] [CrossRef]
  28. JGJ/T 23-2011; Technical Specification for Inspecting of Concrete Compressive Strength by Rebound Method. Evaluation Standard of Industrialized Building. Shaanxi Academy of Building Sciences Co., Ltd: Xi’an, China, 2011; 68P. B5.
  29. GB/T 50082-2009; Standard for Test Methods of Long-TERM performance and Durability of Ordinary Concrete. General Administration of Quality Supervision, Inspection and Quarantine of the People’s Republic of China: Beijing, China, 2009; 176P. B5.
  30. Powers, T.C. A working hypothesis for further studies of frost resistance of concrete. J. Proc. 1945, 41, 245–272. [Google Scholar]
  31. Powers, T.C.; Willis, T. The air requirement of frost-resistant concrete. Highw. Res. Board Proc. 1949, 29, 184–211. [Google Scholar]
  32. Powers, T.C.; Helmuth, R. Theory of volume changes in hardened portland-cement paste during freezing. In Proceedings of the Thirty-Second Annual Meeting of the Highway Research Board, Highway Research Board Proceedings, Washington, DC, USA, 13–16 January 1953. [Google Scholar]
  33. Powers, T. Freezing effects in concrete. Spec. Publ. 1975, 47, 1–12. [Google Scholar]
  34. Scherer, G.W. Crystallization in pores. Cem. Concr. Res. 1999, 29, 1347–1358. [Google Scholar] [CrossRef]
  35. Bresme, F.; Cámara, L.G. Computer simulation studies of crystallization under confinement conditions. Chem. Geol. 2006, 230, 197–206. [Google Scholar] [CrossRef]
  36. Fagerlund, G. The critical degree of saturation method of assessing the freeze/thaw resistance of concrete. Matériaux Constr. 1977, 10, 217–229. [Google Scholar]
  37. Yiben, Z.; Fei, X.; Shansuo, Z. Review of research on freeze–thaw damage concrete. Concrete 2021, 3, 10–14. [Google Scholar]
  38. Sun, H.; Fang, C.; Cai, W.; Guo, B. Study on the influence factors of thermal stress of concrete under freezing and thawing cycles. Concrete 2017, 5, 29–32+38. [Google Scholar]
  39. Yuan, L. Study on Stochastic Predicting Method for the Freeze Proof Durability of Concrete Based on Damage Theory. Master’s Thesis, Zhejiang University, Hangzhou, China, 2006. [Google Scholar]
  40. Liu, X.; Tang, G. Research on Prediction Method of Concrete Freeze-thaw Durability under Field Environments. Chin. J. Rock Mech. Eng. 2007, 12, 2412–2419. [Google Scholar]
  41. Cai, H. Prediction Model of Concrete Freeze-Thaw Durability. Ph.D. Thesis, Tsinghua University, Beijing, China, 1998. [Google Scholar]
  42. Kefei, L.; Huizhen, L.; Xiaotan, D. Durability design of concrete structures: Principle, method and standard. China Civ. Eng. J. 2021, 54, 64–71+96. [Google Scholar]
Figure 1. Lining strength of each tunnel.
Buildings 14 02330 g001
Figure 2. Photos of the specimens after the maximum freeze–thaw cycles.
Buildings 14 02330 g002
Figure 3. Relative dynamic elastic modulus curves of silane antifreeze specimens.
Buildings 14 02330 g003
Figure 4. Relative dynamic elastic modulus curves of silane impermeable antifreeze specimens.
Buildings 14 02330 g004
Figure 5. Relative dynamic elastic modulus curve of silicone antifreeze specimen.
Buildings 14 02330 g005
Figure 6. Mass loss ratio curve of silane antifreeze specimen.
Buildings 14 02330 g006
Figure 7. Mass loss ratio curves of silane impermeability antifreeze agent specimens.
Buildings 14 02330 g007
Figure 8. Mass loss ratio curves of silicone antifreeze specimens.
Buildings 14 02330 g008
Table 1. Each tunnel and layout of measuring points.
Tunnel NameFull Length (m)Altitude (m)Whether to Lay Insulation BoardLocation of Tests along the Tunnel (m)
Balangshan Tunnel79543800750 m at both ends0, 750, 1500, 2300, 3500, 4000, 5000, 6000, 7000
Gaoersi Tunnel56823900800 m at both ends0, 750, 1500, 2500, 3500, 4000, 5000, 5682
Queershan Tunnel70604341820 m at both ends0, 750, 1500, 2500, 3500, 4500, 5000, 6000, 7000
Lanashan Tunnel34502980Unpaved0, 250, 1000, 1500, 2000, 2500, 3000
Table 2. Grouping of concrete test specimens.
Frost Resistant MaterialTest ItemsFrost Resistant MaterialTest Items
Silane antifreezeSilane antifreeze-200 g/m2Silane impermeability antifreeze agentType II-300 g/m2
Silane antifreeze-300 g/m2Type III-200 g/m2
Silane antifreeze-400 g/m2Type III-300 g/m2
Silane (1:1 dilution)-200 g/m2BS CREME C, siliconeBS CREME C-200 g/m2
Silane (1:1 dilution)-300 g/m2BS CREME C-300 g/m2
Silane (1:1 dilution)-400 g/m2BS CREME C-400 g/m2
Silane impermeability antifreeze agentType I-200 g/m2Silicone protection system-500 g/m2
Type I-300 g/m2Silicone polyether hybrid-500 g/m2
Type II-200 g/m2——Blank test piece
Table 3. Statistical list of freeze–thaw resistance cycles of test pieces.
DosageSpecimen NameFreeze-Thaw CyclesDosageSpecimen NameFreeze-Thaw Cycles
200 g/m2Silane type I-200 g/m275300 g/m2Silane type I-300 g/m2100
Silane type II-200 g/m250Silane type II-300 g/m2100
Silane type III-200 g/m2125Silane type III-300 g/m2175
BS CREME C-200 g/m250BS CREME C-300 g/m2100
Silane-200 g/m2100Silane-300 g/m2100
Silane (1:1 dilution)-200 g/m250Silane (1:1 dilution)-300 g/m275
400 g/m2BS CREME C-400 g/m2125500 g/m2Silicone protection system-500 g/m2125
Silane-400 g/m2125Silicone polyether hybrid-500 g/m2300
Silane (1:1 dilution)-400 g/m275——Blank test piece25
Table 4. Values of saturation coefficient S.
Serial NumberDegree of SaturationEnvironment ConditionSaturation Coefficient S
1High saturationLong-term or frequent contact with water before freezing, high water saturation in concrete1.0
2Moderately saturatedIt is wet before freezing or occasionally in contact with rain and water, and the degree of water saturation in the concrete is not high0.8
Table 5. Statistics of on-site freezing and thawing cycle temperature.
Freeze–Thaw CyclesTemperature Range °C Cooling   Rate   T i κ i Freeze–Thaw CyclesTemperature Range °C Cooling   Rate   T i κ i
Maximum
Temperature °C
Minimum
Temperature °C
Maximum
Temperature °C
Minimum
Temperature °C
115.94−7.01.090.09491.44−8.000.790.06
33.00−12.310.850.07514.56−3.880.700.06
54.94−5.560.700.06536.44−3.060.790.06
74.88−8.440.830.07554.94−2.440.490.04
91.63−6.250.660.05573.19−3.560.450.04
110.94−7.880.740.06593.19−5.380.710.06
132.69−7.50.680.05616.88−2.380.620.05
151.94−10.810.850.07634.00−2.000.400.03
171.75−3.630.360.03656.81−2.250.760.06
195.81−2.250.900.07675.25−3.810.760.06
214.13−1.690.970.08694.38−2.560.460.04
230.44−7.810.460.04713.81−3.690.420.03
251.63−10.000.650.05733.88−2.380.520.04
273.06−4.630.430.03755.00−2.310.610.05
291.69−4.940.370.03771.88−2.630.750.06
312.38−4.190.550.04795.31−1.940.480.04
330.50−9.500.670.05814.63−3.690.690.06
355.19−4.750.550.04832.81−4.810.640.05
370.81−9.310.670.05852.44−6.190.720.06
394.31−3.880.550.04872.19−6.560.730.06
411.25−8.000.620.05893.69−6.880.590.05
434.44−7.310.780.06911.19−8.380.640.05
458.75−2.310.740.06934.06−3.060.470.04
478.31−1.310.640.05953.88−5.630.630.05
Disclaimer/Publisher’s Note: The statements, opinions and data contained in all publications are solely those of the individual author(s) and contributor(s) and not of MDPI and/or the editor(s). MDPI and/or the editor(s) disclaim responsibility for any injury to people or property resulting from any ideas, methods, instructions or products referred to in the content.

