Abstract
Building projects as sub-sect of construction projects are complex and different in design and performance attributes. The prominent classes of building projects are high-rise residential buildings, hospitals, hotels, general offices, retail buildings/malls, educational institutions, and warehouses. In this study, building projects have been classified based on their end use. Complexities vary between construction projects and within various types of building projects, as well as across regions and countries. Understanding the sources of complexity is imperative to strategize their successful development. This research paper attempts to identify the sources of complexities using the design and performance attributes of seven prominent building types. A survey was conducted through experienced architects and construction professionals (the mean years of experience being approximately 13.88 years) over 34 different attributes or parameters under six categories. These attributes have been shortlisted from past research work by various authors, and the pilot study for this project. The Kruskal-Wallis Test was used to calculate the mean ranking and to confirm that the medians of each building type were not the same when compared against each attribute, irrespective of the level of complexity. Using data analysis and the mean ranking scores as a representation of relative complexity, primary sources of complexity in each class of buildings have been identified and listed. The results indicate that hospitals (as a building typology) are relatively the most complex building facilities in terms of design and performance attributes, showing the highest mean ranking towards 16 attributes (with only one shared ranking). Hospitals are followed by retail/malls (10 with one shared ranking), hotels (3), high-rise residential buildings (4), educational institutions (2), general offices (0), and warehouses (0). Strategies to manage these attributes have been proposed for each building typology so that the risks emanating from the complexities of these building projects can be mitigated and effectively managed at the design stage.
1. Introduction
Since early human civilization, construction has been a constant coexisting phenomenon. The progressive nature of modern settlements and increasing human needs kept this phenomenon evolving throughout history. Some of the greatest civilizations are known for modernity in their architecture. The structures built in that period are testimonies of these civilizations. Even to this day, remnants of the history of construction and its sophistication within early civilizations are seen in multitudes of heritage sites across the globe. The inherent reality is that these monuments, at some point in time, were projects that were planned, managed, and implemented.
Since then, construction has become widespread, and taken the shape of an industry, and the level of complexity increased. The Industrial Revolution of the 20th Century produced more inventions [1], which increased the complexity of the construction industry. Newer products, technological advancements, and the needs of the modern world have changed the scope of the industry. Uncertainties in the technologies and the development processes have made them more dynamic [2].
Modern construction projects encompass various stakeholders such as developers, contractors, consultants, project managers, sub-contractors, suppliers, functional specialists, designers, architect firms, etc.; managing these stakeholders without conflicts is a complex phenomenon [3]. The teams chosen are from different organizations with diverse natures and are brought together temporarily to deliver a project [4]. The factors associated with project execution vary for each country or region [5]. Two construction projects are never the same and, if there is some similarity between them, the reality of the execution process is often different as they are based on the nature of the sites [6].
Many researchers have attempted to classify projects in the past. From the earlier classification of projects into “Industrial”, “Infrastructure”, and “Buildings”, the classification has expanded over time under these broader segments into sub-classifications based on their complexities, scope, and end use [7]. What can be noticed is that they can broadly be grouped in multiple ways and hierarchies based on functionality, end-use attributes, etc.
Within the classifications, buildings as a sub-sect of construction projects are considered the backbone of economic growth [8]. The level of complexity and the success and failure factors vary between the types of building projects. For example, high-rise buildings or buildings with complex designs, variable technical specifications, massive basement works, and difficult access have higher productivity issues than buildings with simple designs and accessibility [9]. It is well established that the building construction process is complex due to the diversity in types, functions, and stakeholders involved [10]. Managing complexity is critical to making any building project successful, as complexity is highly correlated to failure [11]. In fact, complexity can lead to risk as well as opportunities, so the endeavor should be to mitigate the risk and unleash the opportunities [12]. Managing complexity is crucial to project management, as many decisions and strategies revolve around complexities.
Further, complexities directly impact the planning, organization, and organization model and, eventually, project outcome, including project cost, schedule, safety, and quality [13]. In the study on the relationship between complexity and project success by Luo and Guangdong, project success is seen as directly impacted by project complexity, especially goal and communication complexity [14]. The increasing number of published research papers on this subject in the last 20 years (from less than 10 pre-2005 to nearly 40–50 papers per annum by 2020) proves increasing interest and focus on Complexity [15]. So, if we must identify the sources of complexities in building projects, the evaluation must be done on specific parameters or attributes. This will help us create strategies around each building type in their planning, preparation, and execution.
A systematic Literature Review by Luo et al. of 64 papers published between 1996 and 2015 provides a consensus view that complexity in projects leads to negative project performance; hence, the focus has been on managing risk, capacity for adaptability, and management style [16]. As per their analysis, very few studies focus on building projects. The current research has been inspired by their suggestions for future research, where they have recommended evaluating and measuring complexities apart from others, considering dynamic, structural, and interactive elements for different project types and life cycles.
Based on the classification by O’Connor et al. [7], the building projects chosen for comparison are high-rise residential buildings, hotels, general offices, retail buildings/malls, hospitals, educational institutions, and warehouses. Prior research on project complexity has been limited to factors causing it, impact analysis, how to measure it, and its management. Past research has focused on different frameworks and types of complexities within factors causing complexities [16].
This research paper aims to address the following research objectives.
- (a)
- Establishing the sources of complexities in building projects due to design and performance attributes
- (b)
- Evaluating whether these complexities are the same between the building types, viz. high-rise residential buildings, hotels, general offices, retail buildings/malls, hospitals, educational institutions, and warehouses
- (c)
- Identify and summarize the important design and performance attributes resulting in complexity for each of the building types
- (d)
- Explore general strategies that a developer can adopt to derisk the project from the above complexities
Based on the literature review, thirty-four attributes or parameters have been used to evaluate the complexity of building projects under six heads based on the life cycle stages. The Kruskal-Wallis Test has been used to calculate the mean ranking of each type of building against each attribute to establish relative complexity. In the Kruskal-Wallis test, the mean ranks are used for the comparison, and the mean ranks represent the average position of observations within each group. Chi-square statistic (Chi2) was used to evaluate the magnitude of the difference between the observed and expected frequencies.
The null hypothesis for the Kruskal-Wallis Test is that there is no difference between the groups of independent variables or between the medians of the groups. In the current study of complexity evaluation between different types of buildings, the Null hypothesis proposed is (median here represents the median of responses against each attribute);
H0 = The medians of all the building types are the same, irrespective of the level of complexity
When the p-value derived from the test is below the chosen significance level (0.05), the null hypothesis fails to be accepted, and we may safely conclude that there are significant differences between at least two types of buildings.
Given that this research paper focuses on complexities in building projects from the point of view of the Designer at various project life cycle stages, the research outcome is expected to help the project developers understand the source of complexities in various building types and help construction professionals form suitable strategies in the project development life cycle of the building types discussed herein. Building interacts with the environment through the exchange of energy and materials and with society through its existence in the neighborhood, connectivity, and services it offers. Understanding and addressing their complexity will positively shape interaction [17].
The remainder of the paper has been organized into multiple sections. Section 2 dwells on past research relevant to current research done by various authors. Section 3 details the methodology and attributes used for measuring complexity under multiple heads. Section 4 covers the scope of data collection and its analysis, followed by Section 5, the conclusion and practical implications, and Section 6, the limitations of the study and future scope.
2. Theoretical Background
2.1. Need to Classify the Projects
The first step in our endeavor to manage the complexity is to understand the need for the classification of projects. If we must bring some order into successfully managing the construction project complexity, we must first classify the projects on specific common attributes as the leadership styles, level of competencies required, and management procedures vary as to types of projects [18]. Classification is a necessary pre-condition for standardization to be successful [19]. Even the project success factors are closely associated with project types, and classification helps to group the factors and forces driving the project’s success so that suitable project management strategies can be devised [20]. Concerning project management, the techniques and processes need to be different for each project, and they cannot be commonly applied across all projects [21]. The complexity of the factors analyzed by construction managers is also induced by uniqueness emanating from the variability of the projects [22]. Factors such as labor productivity vary between building and infrastructure projects as the expertise, methods, equipment, tasks, etc., vary for each type [23]. The performance of the supply chain varies according to project types, teams, and geographical regions [24]. Further, each project type would require varying processes, control, and planning [25]. So, the classification based on classes and types of projects is essential, as the issues of one type may vary from the other [26].
2.2. About Project Complexity
Project complexity is contextual, and no standardized definition can be applied to multiple projects [12]. Contrary to other industries’ systems and processes, the construction industry lacks a universal framework capturing all complexities and relies merely on onsite experience from executed projects to refine the process to achieve competitiveness [27]. There is also a risk of the term complexity getting confused with being complicated. Chao Xiao and José L. Fernandez-Solis [28] differentiate between complicated and complex systems. They opine that complicated systems can be studied and controlled. They, too, are highly interconnected systems with multiple sub-systems and elements. The “spatial and temporal interaction” between various elements, such as the quantum of resources, resource productivity, decisions by the managers on scheduling and how resources are used, and external disturbances, etc., make the process complex [28]. As per José L. Fernandez-Solis [29], construction (building a thing) is based on a change from a natural environment (nothing) to an artificial environment (building) through the process of construction. The outcome (Building) is a product. So, the process is on the primary axis, and the product is on the secondary axis.
Vidal and Marle [30], in their evaluation of the implication of project complexity in project management, concluded that uncertainties in the project are consequences of complexities. They have opined that the reasons for the same are differences in perception and understanding of project systems by the project manager due to cultural differences and varying contextual references, as well as an inability to understand the systems in their entirety. The actions are based on perceptional complexity, which may differ from real complexity, leading to further uncertainty. The organizational culture impacts even the actions or responses, and the time lag leads to more uncertainties. The interconnectivity and interdependency between and within the project elements add to the existing uncertainties.
2.3. Classification of Complexity
The oldest yet relevant classification of complexity was first attempted by David Baccarini in 1996 [31]. He opined that organizational complexity can be defined by differentiation, technology, and interdependency. In the former, the scope and scale of differentiation make the organization more complex. In the case of complexity based on interdependency, it emanates from the interdependency of organizational elements. However, Technological complexity is evaluated from the context of technology and defined as getting the outputs from the inputs. There is a greater risk of defining technological complexity from the perspective of difficulties in executing tasks and the uncertainties around their execution. The complexity could result from the type of buildings being constructed, their location, the overlapping, and the interdependency of the tasks. So, technological complexity is best defined in terms of differentiation, viz., diversity and interdependency between tasks, teams, technologies, and inputs. Similar to organizational complexity, technological interdependence could be pooled, sequential, or reciprocal, with the reciprocal being the most complex among them.
K.Gidado [32] summarizes that project complexity has six main components. These are “Inherent complexity, Uncertainty, Number of technologies, Rigidity of sequence, Overlap of phases or concurrency, and Organizational complexity.” As per the evaluation of complexity by Wood and Gidado [33], the reasons for poor performance in project execution come from the complex process of design and execution. An early understanding of the complexity will help devise suitable strategies ahead of time. They opine that “The interplays between order and disorder, predictability and unpredictability, regularity and chaos, are characteristics of complex systems.” In line with the thoughts of David Baccarini, they suggest that complexity can be viewed from the perspectives of (a) Managerial and (b) operative and technological.
Wood et al., in their study on understanding the complexity in the AEC industry [34], have opined that organization and project complexities are two larger dimensions in the construction industry and, many a time, intertwined. The developers and the end-users set the narrative of the project by defining and redefining their requirements and expectations; the actors responsible for translating them into reality, viz consultants, contractors, and project managers, bring in their complexity due to the organizational hierarchy inherent in the industry.
In Wood and Ashton’s study on modeling project complexity [35], 16 aspects were evaluated under five themes: organization, planning and management, operation and technology, Environment, and Uncertainty. However, this study covers projects in general and focuses on effects during the pre-construction stage to improve project planning.
Luo et al., in their study of research trends and their implications in the construction industry project complexity [16], evaluated 64 relevant articles published between 1996 and 2015 and concluded that (a) there is no universal definition of complexity and (b) project complexities are mainly driven by organizational and technological complexities. They found that the focus has been on managing risk, capacity for adaptability, and management style, given that complexities impact project performance [25].
2.4. Measuring the Complexity
As per the earlier studies on complexity by David Baccarini, the number of stakeholders and volume of information make the construction ecosystem complex and disorderly [31]. He further states that project complexity determines and impacts planning, control mechanisms, goals, a form of organization, the expertise required, procurement, completion time, budget, quality, etc., and determines the type of responses and their management. He concludes that the project complexity can be operationalized by the differential between multiple diverse elements in terms of “tasks, specialists, components, interdependency or connectivity”, which is in line with the systems theory.
The CIFTER (Crawford-Ishikura Factor Table for Evaluating Roles) factors by GAPPS (Global Alliance for the Project Professions) are an established measurement model for evaluating management complexity. These include the stability of the context, diversity in disciplines, the project’s impact on social, legal, and environmental aspects, the impact on stakeholder finances, the project’s importance to the organization, inter-stakeholder agreement on the project outcome, and the magnitude of interfaces and entities involved [36].
Brockmann and Kähkönen, in their study on project complexity [37], use the source of complexity in five categories, viz. tasks, social, cultural, cognitive, and operational, to develop the complexity index for construction projects. One of their key assertions is that complexity is not a real entity; it is by nature. They also state that it is from the world of experiences and logical contents visualized generally as a physical entity. This finding is important because complexity is a phenomenon generated or perceived by attributes and actions associated with the construction industry. What is considered complex may not necessarily be for another project in another time or space. The source of complexity can be from the project’s goal (performance attributes) and the strategies to achieve the goals (Design and execution attributes).
Kermanshachi et al., using the Delphi study [38], shortlisted ten indicators of complexity: scope change intensity and timing, the volume of interfaces, resource availability in time, the familiarity of the design and technology, location, governance mechanism and people involved, and stakeholder management. However, most of the indicators of complexity are associated mainly with the execution stage of the project lifecycle.
Based on the study by the Construction Industry Institute, Dao et al. shortlisted 37 indicators of complexity related to stakeholders, governance, permissions, financing, scope, system design and technologies, project location, change and quality management, project resources and execution goals, which encompass the whole lifecycle of the project [39].
In the study by Kermanshachi and Safapour [40], complexity was evaluated from the perspective of three key stakeholders: Project Owners, Consultants, and Contractors from construction projects in the United States. Quantum and time of change orders, labor, and quality issues, the quantum of approvals required, and decision authorities over the PM team were found to be the reasons for the projects’ complexity. However, this study focused on construction projects in general and was not specific to building projects.
Moza et al., in their study on evaluating project complexities in the construction sector in India [41], attributed all the complexities in a construction project to three types: scope, context, and organization. Twenty-three factors were shortlisted and grouped under the above classification to arrive at the complexity index for the construction project. This study, too, focuses on construction projects in general.
In the Systematic Literature Review by Ghaleb et al., [15] 644 documents (limited to the Scopus database) over the last 20 years were analyzed to understand the contribution of various studies on the complexity of the construction industry. The prominent topics so far have been identifying and measuring the complexity, performance of complexity on the schedule and cost, risk assessment and uncertainties involved, and system integration and capabilities. They observe that effective complexity management is a strategy to improve project overall performance and delivery success. To this end, measuring complexity is critical for its management through effective and efficient resource allocation. On the research trend, they conclude that integrated project delivery, safety in performance, and organizational resilience are the prominent themes. While this study details the scope of complexity in general, it focuses on the construction industry in general and not specifically on building projects.
2.5. Complexity in Building Projects
According to Xiao and Fernandez-Solis [28], a completed building represents a complicated system, whereas the construction process represents a complex system. So, the complexity in building projects emanates from the construction process and not the product itself.
In the analysis by Wood and Gidado [33], complexity in building projects is found to be driven by (a) the combination of many diverse systems and the existence of multiple interfaces between the elements, (b) a confined site with access difficulty and multiple trades compelled to work together, (c) the inability to define the strategy or path to achieve the goal and the time frame given the intricacies, (d) they require detailing on execution and greater coordination, monitoring, and control from end to end, and (e) they require logistical linkages to deal with revisions and changes.
Xia and Chan, [42] developed a complexity index for measuring building projects’ complexity using the Delphi model. They opine that (a) there is no clear consensus on measuring the complexity in building projects, (b) measures include characteristics of projects apart from concepts around complex systems, (c) if the degree of difficulty in delivering the building projects is what complexity means, the measures of complexity will vary as to each region. They have concluded that the complexity measures in building projects are (a) the building structure and its functions, (b) the method of construction, (c) schedule urgency, (d) the size and scale of the project, (e) site conditions, and (f) environment in the neighborhood. While this study is more relevant as it focuses on measuring complexities in building projects, it does not measure the complexities between the various classes of building projects.
In his attempt to build a complexity index for building projects, Leung Tak used variables such as the duration of the project, working spaces, project contract sum, area of the site, structure type, height, project location, use of the building, type of client, and floor area [43].
High-rise buildings are known for their complexity emanating from project location, land constraints, multidiscipline trades and stakeholders, and greater uncertainties with relatively higher quantum of risks. The high volume and shorter timeline make it riskier [44]. The root of complexity in building projects also emerges from the type of buildings and their components, functionality, and diversity of the stakeholders [10]. Understanding these dynamic attributes in detail is essential to evaluate the complexity of building projects.
Pantazis and Gerber, in their seminal study on relating complexity theory to Architecture, Engineering, and Construction (AEC) [45], have opined that the source of complexity emanates from the number of components in the building system, their coupling at multiple levels, the hierarchy between them and the nonlinear interaction. This calls for terming the inhabited buildings as a complex holistic system. They have viewed complexity in building construction (a) at a higher level as organizational complexity that comes from the project size and volume of teams and people with varied specializations and expertise involved over more prolonged periods from multiple locations and the consequent challenges in information exchange (b) at a lower level that comes from fabrication and assembly activities having non-geometric and non-repetitive elements and the process and steps required to be adopted to transform them into a structure.
No consensus on the complexity measures for building projects could be found in the literature. Researchers assess the project’s complexity from different perspectives and contexts, and we still lack a systematic and holistic framework [34]. Furthermore, if we consider complexity in terms of the degree of difficulty when delivering building projects [42], the complexity measures would vary in different geographical locations due to their unique market conditions. Many studies in the past on various issues connected to the construction industry have repeatedly stated that the challenges vary for each country, and it would not be appropriate to generalize a problem for a particular country based on a global study [46].
The present study aims to understand the source of complexity in various types of building projects in India based on design and performance attributes. For this, we have relied upon the work by Ujong et al. [22] and used the variables having an impact on the outcome of the project, such as the type of project, area, floors, type of clients, type of contractors, etc. as they have a high correlation between them. We have also relied upon the works of David Baccarini [31] to shortlist the variables identified as a source of complexity, such as the type of buildings being constructed, their location, and the overlapping and interdependency of the tasks. The works of Ling et al. [47] have also been used, wherein they listed 30 explanatory variables measuring project characteristics (Factors affecting project performance). The works of G. Santana [48] suggest complexity from multiple design and execution attributes, and the same have been used in arriving at the parameters for identification. Works of Xia and Chan [42] in identifying the measures of complexities in building projects have also been used along with Leung Tak in variables for measuring building complexity [43]. All these factors were summarized, grouped into various project life cycle stages, and developed into a questionnaire for the pilot study.
3. Methodology
3.1. Development of Questionnaire
This study focuses on evaluating the source of complexity in various types of building projects in India based on design and performance attributes. Hence, it relies on the contextual experience of the respondents and their knowledge and perceptions of the subject matter [49]. This helps to understand the knowledge available, and the gaps based on expertise. Professionals from the architectural and design domain were chosen as the respondents to the survey as most of the measurements are related to design and pre-construction activities, with limited indicators linked to the construction and operation stages. This is in line with the findings from the literature, where it is established that complexity in construction projects starts at the design stage [9,44,50]. The design development stage is crucial in the development life cycle of a building as the scope and design of all major components, apart from all major decisions, are finalized in discussion with stakeholders at this stage [51]. The lead design consultants/architects of the project champion this process. Since no ready measurement tool was available, the attributes representing design and performance in building projects were sourced from various previous studies. They were framed into a questionnaire to satisfy the research objectives and aim. This was duly validated through a pilot test by three experts with nearly 17 years of average experience to remove ambiguity and establish clarity in the description [49]. A 5-point Likert scale was adopted to collect the responses. The questions were framed such that the highest score represents the highest level of agreement for that attribute [52]. The list of attributes chosen for evaluation and the justification are given in the next section.
3.2. Variables (Attributes or Parameters) Considered for the Measurement
Thirty-four different attributes or parameters have been used to evaluate the complexity. Each one is independent of the others as they measure different sources and dimensions of the complexity. They cannot be considered latent variables but are items themselves. For convenience, they have been grouped under six heads based on the life cycle stages, and this does not mean that they are correlated within each group. To better understand how each attribute impacts the building projects, it is necessary to understand the building classification and features. The earlier classification of the Architecture, Engineering, and Construction (AEC) industry was broadly Industrial, Infrastructure, and Buildings. Over time, the classification has expanded under these broader segments into sub-classifications based on the complexities, scope, and end-use [7].
In the study of project delivery systems performance [53], Franz et al. grouped the projects into six categories based on various attributes under (A) Light industrial—The intensity of use is low with minimum mechanical, electrical, and plumbing (MEP) loads such as warehouses and parking with open spaces, (B) Multistory dwelling—High repetition of similar units as found in hotels, apartments, and dormitories, (C) Simple offices—As part of multipurpose mixed-use development and general offices with flexible interiors, (D) Buildings having monumental finishes such as museums or courts and buildings with high MEP loads such as medical center and corporate offices (E) Heavy industrial with manufacturing areas requiring very high MEP loads or stringent processing and (F) High tech buildings such as Hospitals, Research and Development centers, Data centers, etc.
As per the study on project performance versus the use of technologies by O’Connor et al. [7], buildings based on end-use were further classified as high-rise residential buildings, hotels, general offices, retail buildings/malls, hospitals, educational institutions, etc. warehouses, as a class of buildings, were added to this list to make the study inclusive. Since the above classification used is based on the end use and is widely used, the same has been adopted for this study.
3.2.1. Choosing the Project Location
Location is a paramount consideration when selecting land parcels for any building project [54,55]. Given the logistical constraints, infill location construction costs tend to be higher than in locations away from the city [56]. The pricing of the micro market varies in different proportions for each type of facility and is not always elastic. As there is a more significant association between complexity and project failures [57], the endeavor of the developer will always be to pick up the best locations to maximize the probability of success while ensuring the complexities are balanced and well managed.
In the study by Ali and Suciana on house purchase decisions [55], the three attributes identified and evaluated for influence on the decision were Location, Price, and Service Quality. Complexity is perceived to be higher where the location is more important, as prominent locations involve higher capital outlay and logistical challenges that increase project risk levels [58]. Similarly, complexity could still be higher in projects where scope and quality are essential as they demand better project design, higher quantum of scope, and stringent quality management. Finally, if the closeness to an infill location or city center is crucial for the project’s success, they do come with their execution complexity of logistics, space available for construction, adjoining developments, traffic restrictions, etc. [42,56]. Location is considered one of the critical indicators of complexity in many of the studies [38,59]. All these factors make a project relatively riskier if it has to be executed near the city center. Therefore, under location attributes, the complexity of building projects has been evaluated based on the importance assigned by the end-user to location over price (parameter 1), the importance assigned by the end-user to scope and quality over the location (parameter 2), and criticality of the facility is closer to the city center to be commercially successful (parameter 3).
3.2.2. Planning and Design Approaches
The design of a project is a crucial component in project development. During the design development phase, various project requirements and features are transformed into actionable designs and drawings. The quantum of components within the larger system, their interdependencies in functionality and intricacies of each system, etc., determine the overall complexity of the technical design. Further, to make the project commercially viable, the designer needs to make sure the facility designed is better than or at least at par with the competing facilities, meets the project goals and vision, meets the end user and client requirements, and makes sure that they serve the purpose for which they are created [60]. Each designer has a unique approach to producing a desired outcome. While they all might look similar on a larger scale, the designers attempt to play within the established parameters to bring in more differences and efficiencies so that the product looks and functions better than others. In this process, unknowingly, they end up making the projects more complex from the design and execution point of view [17].
Another important aspect of planning and designing the building project is the involvement of multiple trade specialist consultants and the complexity resulting from integrating the varied approaches adopted by each consultant. In the case of Design and Build projects, the responsibility lies with the contractor, who in turn must depend on the consultants from within or outside his organization. The above issues have been captured into attributes such as distinct design in enhancing/impacting users’ efficiency and capacity (parameters 4 and 5), influence of design approach on the economic value of the facility [61] (parameter 6), insistence of innovation in the design and development by end-users [10] (parameter 7), level of complexity in planning (parameter 8) and number of specialist consultants required for the design of the facility [51] (parameter 9).
3.2.3. The Volume of the Facility and Its Key Components
Complexity in a project can also arise due to the volume of usage and the resultant quantum of the facilities to be created to support the volume of usage. Higher occupancy/density, with space being a constant, results in a higher volume of operations and impacts vertical transportation, HVAC (heating, ventilation, and air conditioning), power consumption, etc. While some building types, such as residential buildings, might have a lower density, public places, such as retail buildings/malls, will have a very high usage density, requiring additional parking spaces and infrastructure to support the volume.
The quantum of amenities to be created in a building also creates complexity due to the need for additional space to accommodate these facilities, their support infrastructure, and the resultant capital investment required for their creation. Since these amenities support the main facility, they may not yield the same return as the primary facility; instead, they will create more financial burdens until stabilization. In many instances, they are provided for free (for example, amenities in many Residential buildings or Hospitals).
Another dimension that brings complexity to the volume is the electromechanical equipment required to operate the facility. The scope is generally intense in Hospitals and Data centers and minimal in the case of Residential and Warehouses. Functional facilities such as fire alarms, security, access control, lifts, public address systems, HVAC, pressurization, ventilation, power backup Generators, etc., need to be integrated to work in a comprehensive single system and further managed through robust building management systems [62]. Due to higher footfalls, the intensity, scope, and integration could vary between these building types, such as Hospitals, Malls, etc.
Finally, as a standard, each facility has a typical/preferred range of floor plates and height (number of floors). This differentiates each facility’s standard/typical volume, directly correlating with the complexity [63]. The Codal and Development Control Regulations applicable for each facility become stringent when the volume of people/users is high, making the development process complex. Based on the literature and discussion with the experts, under the volume of the facility, the complexity of building projects has been evaluated based on attributes such as occupancy density per 1000 square feet of usable area (parameter 10), number of parking spaces planned for every 1000 SFT of usable area (parameter 11), vertical transportation logistics complexity (parameter 12), the Scope of amenities within the project (as % of overall development in SFT) (parameter 13), installation of much electromechanical equipment as part of the scope (parameter 14), the level and intensity of safety and security, as part of the project design and scope (parameter 15), the scope, complexity, and intelligence of Building Management System (BMS) (parameter 16), the scope of integration represented by the number of sub-components of the project (parameter 17), building height used for setting up this facility (parameter 19), typical floor plate size of a standard building (parameter 18) and stringency of development control regulations and codal compliances (parameter 20) [42].
3.2.4. End-User Influence on Design
End users are the actual users of these facilities, and they play an impacting role in many of the developments. The involvement of the end user is not limited to changes in design but also includes their choices and preferences. Off-late ESG (Environmental, Social, and Governance) compliance is considered one of the essential compliance requirements for the developer by many international office clients [64]. There are situations where the end-user insists upon being built-to-suit. These are typically seen in anchor clients in large mall developments or office buildings. Ergonomics in operations is gaining momentum where user, usage, and operations are studied in detail, and facilities are designed to meet the requirements. Finally, the type of end-user also leads to complexity in development. Typically, if the end-user is a government body, they have non-negotiable standards and stringent contractual conditions and do not operate based on the relationship, making the whole development complex. Retail users are critical and noisy but have lesser contractual powers. So, the type of end-user has been included as one of the criteria for evaluating the complexity of the buildings. Relying on the literature review and inputs from the experts, the attributes such as the sensitiveness of the end users to ESG Compliance in the operation phase (parameter 21), the prevalence of end-user interference in the design and scope (parameter 22), the prevalence of built to suit and customization for the end users (parameter 23) and the critical nature of ergonomics in operations and the design (parameter 24), and type of client for whom the facility is developed (parameter 25) have been identified to evaluate the complexity from end-user attributes and powers.
3.2.5. Construction Management
Execution is the phase where complexity surfaces irrespective of at what stage of the development process it creeps in. In addition, the execution itself often leads to more complexity. The general attributes or factors leading to execution complexity, irrespective of the type of development, are not covered here as this study aims to establish the varying complexity between different kinds of building projects. The first notable parameter is the complexity of obtaining approval from the government. Typically based on the stringency of development control regulations and the intensity of public usage, the approval time also varies due to more intense checks and inspections. In many situations, the Government interferes and insists on changes to the design to comply with specific safety and environmental requirements, making the whole approval process time-consuming and adding more complexity to the development.
The stringent timeline or urgency of the schedule for the typical development of the facility is a notable parameter leading to complexity [40]. While smaller facilities could be outliers, a comparison is made between the typical size of building projects and their inherent urgency. The longer the project duration, the more complex it will be due to multiple weather cycles, varying economic conditions and inflation factors, increased administration costs, changing vendor performance due to order book, etc. The complexity also increases when the number of packages/trades for execution increases as each needs to be coordinated on the ground. When multiple specialist trade vendors are appointed for execution, the complexity is multifold due to extensive coordination, interdependencies between trades/vendors, and delays caused by one or the other. Poor coordination leads to delays, reworks due to poor quality, and additional spending on time-based recurring costs. The project schedule is sometimes squeezed when customers are waiting to occupy, thus increasing the complexity of the project management.
Based on the literature review and discussion with experts, to evaluate the complexity emanating from the construction management of the project, the parameters shortlisted include the ease of obtaining government approval (sanction of permit) (parameter 26), the average time (in years) of development of a typical project (parameter 27), the complexity of project management during execution (based on the intensity of coordination) (parameter 28), the risks associated with the execution of the project (risks impacting cost, time and quality) (parameter 29), the time urgency for development (based on the number of pre-booked clients waiting to use the facility) (parameter 30) and the number of specialist contractors required for the execution of the project/facility (parameter 31).
3.2.6. Operations
The final phase of any development is putting the facility into successful operations so that there is greater satisfaction amongst the end users. Complexities are seen in this phase as many facilities have inherent complexity in operations due to the involvement of a multitude of electromechanical equipment or greater quality of infrastructure services required, such as hospitals or data centers. In addition, higher footfalls or traffic intensity make the operations very complex, such as in retail buildings/malls. Many facilities, such as data centers, require very high operational power and have the criticality of complex backup systems. Some of the key attributes of operations leading to complexity shortlisted from the literature review and discussion with experts include the Complexity of operations and maintenance of the facility after completion (parameter 32), Traffic intensity during operations/while in use (parameter 33), Power consumption, connected load and requirement of maintaining backup power (parameter 34).
Table 1 summarizes the design and performance attributes considered for evaluating complexities in seven building project classes viz. high-rise residential buildings, hotels, general offices, retail buildings/malls, hospitals, educational institutions, and warehouses. The source/reference of the measurement items is given against each group of attributes, and they have been duly modified in consultation with the experts. New items have been added as per the expert advice.

Table 1.
List of Attributes Leading to Complexity.
4. Data Collection and Analysis
4.1. Overview of the Data Collected
While many studies have been performed to evaluate the complexity in construction projects, and a few studies have evaluated building projects, no previous research has been performed specifically assessing the measures of complexity in various types of building projects based on design and performance attributes [16]. The process framework, as detailed in Table 2, was adopted for data collection.
Table 2.
Process framework for the study.
Design and performance attributes were chosen to evaluate the source of complexity, as the construction management aspect has been widely covered in earlier research. As in the earlier section, the variables or attributes were validated for measurement by consulting three architects and designers with nearly 17 years of average experience in this field to remove ambiguity and establish clarity in the description [49]. The draft questionnaire was circulated amongst these experts, and their inputs and suggestions were suitably incorporated. With the help and reference of experts, the final survey questionnaire was distributed to a few select architects and designers. They were requested to refer a few other architects and designers from their professional circle. Using the snowball technique, of all the Architects and designers contacted, about 40 volunteered to participate in the survey. The snowball technique is an accepted method of collecting data, especially when dealing with exploratory research where no definite database is available [4].
Given that 34 attributes need to be evaluated for seven building types, the survey required a minimum of 45 min (as per the experts who participated in the pilot study), which was informed to all the potential participants at the first briefing. Given these professionals’ general time constraints, many declined to participate in the survey in the initial inquiry stage. Only those who agreed to devote time to the survey were shared the questionnaire. Overall, 31 completed surveys were returned with a response rate of over 75%. While the sample size is not large enough, the statistical analysis can still be performed as the central limit theorem holds so long the sample size is more than 30 [66]. The Respondents’ profile is as given in Table 3.
Table 3.
Respondents’ profile.
A total of 25 of the 31 respondents were Bachelorettes in architecture, with three having completed a Master’s in the same field. The remaining six have a bachelor’s degree in engineering or construction management.
Of those who responded, nine were female, and the remaining 22 were male. The average age of the respondents was 36.93 years. The overall average experience is 13.88 years, and the number of years of experience associated with/relevant to the building construction industry is 12.80 years. Most of these respondents are located in the Metros, viz. Hyderabad, Bangalore, Chennai, New Delhi. 21 of the 31 respondents are employed in architectural firms, and the remaining are with developers, contracting companies, and the government. Architects and designers were chosen as the respondents as the research evaluates the source of complexity predominantly in the design and pre-construction stages.
4.2. Data Analysis and Discussion
Within each parameter, the highest scale rating was assigned for the responses with the highest level of conformity to the statement, thus the complexity [67]. Since 34 items are evaluated for seven building classes, internal consistency has been calculated using Cronbach Alpha for each type of building, and the resultant values are given in Table 4 hereunder. When developing a measurement scale, it is essential to assess the reliability of the constructs. This is done by evaluating the consistency of the repeated measurements or to what extent the items measure the same thing. Cronbach’s alpha is one of the established and well-accepted internal consistency reliability estimating methods. Cronbach’s alpha coefficients are used as the benchmark to verify the reliability and validity of the data collected through the survey. The online statistical tool was used to calculate Cronbach’s alpha coefficient for the survey data.
Table 4.
Cronbach Alpha for each type of building.
The acceptable level of internal consistency is 0.7 to 0.95, and in our analysis, the range is between 0.84 and 0.95. However, it is to be noted that values higher than 0.90 may indicate redundancy, requiring shortening the questionnaire [68]. Since the questionnaire needs to be standard across all types of buildings, no changes were made. The recommended values for Corrected items to Total correlation should be ideally between 0.3 and 0.7 [69]. In some cases, the lower range can be up to 0.20, subject to minimal impact in Cronbach’s Alpha if the item is deleted. Since the research is evaluating the complexity between various types of buildings, the measurement needs to be similar, and hence, internal consistency reliability may not be achieved on all items. Overall, as seen in Appendix A, in 76% of the instances (number of items X types of buildings), Corrected items to Total correlation is more than 0.3, and in 88% of the cases, they are less than 0.7.
There are many statistical test options available for the evaluation of data from more than one group. The Kruskal-Wallis Test is the preferred method for inferential statistics, especially licker scale data, where the data may not follow a normal distribution. Whereas the t-test (two Samples) and the Chi-Square test are best used in numerical data and data with binary responses, respectively [70], Kruskal-Wallis is a non-parametric test and compares three or more groups in the ordinal or continuous data [71]. This test is widely used when the assumption of one-way ANOVA, such as equal variances or normality, is unmet [72]. In comparison to all other options, viz. t-test, ANOVA, Wilcoxon Signed Rank test, Friedman test, and Mann-Whitney test, the Kruskal-Wallis test is (a) preferred where the data is not normally distributed and (b) compares multiple groups that are not paired or repeated measures. These two essential conditions are pertinent in evaluating seven building typologies on multiple parameters. In addition, the Kruskal-Wallis test provides the mean ranks that are effectively used to understand the relative position of each building typology against each parameter. The null hypothesis for the Kruskal-Wallis Test is that there is no difference between the groups of independent variables or between the medians of the groups [73]. Regarding complexity evaluation, the Null hypothesis is that the medians of all the building types are the same irrespective of the level of complexity [70]. Even if one building type has a different median, the null hypothesis fails to be accepted, and the complexity of at least one building is different than the other types of buildings. When the p-value derived from the test is below the chosen significance level, the null hypothesis fails to be accepted, and we may safely conclude that there are significant differences between at least two types of buildings [73]. In the Kruskal-Wallis test, the central tendency of each group can be identified using the mean ranks, which provide early insight into the differences among the groups. The mean ranks are used for the comparison, and the mean ranks represent the average position of observations within each group. In the study on “Identifying and Measuring Project Complexity” by Dao et al., [70] the Kruskal-Wallis test was used as one of the statistical methods with the Null hypothesis of measuring the probability of the Median of a highly complex project being more than 0.5.
The chi-square statistic (Chi2) here represents the magnitude of the difference between the observed and expected frequencies. Degrees of Freedom (df) is the number of categories or groups minus 1. p-value (p) indicates the probability of observing a chi-square statistic as extreme as the one calculated, with the assumption that the null hypothesis is true. In most cases, the p-value observed is less than 0.001, indicating a very low probability of obtaining the observed results with the assumption that there is no association between the variables. This low p-value typically leads to the null hypothesis being rejected in favor of the alternative hypothesis.
The online Statistics Calculator DATAtab “https://datatab.net/ (accessed on 8 April 2024)” was used for statistical calculations. The mean ranks obtained under the Kruskal-Wallis Test have been used to represent the relative complexity between buildings against each attribute/parameter, and the questions have been framed such that the highest value for a type of building represents relatively higher complexity between all kinds of buildings, for that parameter. Attributes on which the comparison is made between the types of buildings are called parameters.
The analysis is based on 31 completed surveys from respondents with an average experience of 13.88 years and from different cities in India. The data exhibit good internal consistency and reliability. The sample size may not be representative of the entire population of architects and building professionals in India, and increasing the sample size may ensure a more diverse representation of participants from different regions and project types.
4.2.1. Project Location as a Source of Complexity
Figure 1 and Table 5 give the results from evaluating parameters connected to the project location using the Kruskal-Wallis Test. (For complete data, refer to Appendix B).
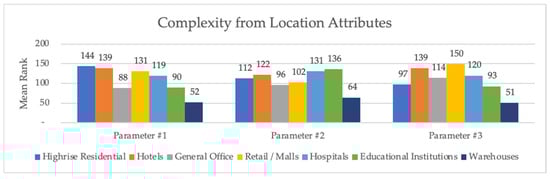
Figure 1.
Mean ranks of building typology for Location Attributes.
Table 5.
Hypothesis Testing-Location Attributes.
We can infer the following using the mean ranks of each building class against the parameters.
Compared to other facilities, the location is more important than the price for Residential as it has the highest mean rank (parameter 1) and moderate mean rank score under importance assigned by the end-user to scope and quality over location (parameter 2). However, it does not necessarily need to be closer to the city center to be commercially successful (parameter 3). For the hotels and retail buildings/malls, the criticality of the facility being closer to the city center to be commercially successful (parameter 3) and the importance assigned by the end-user to location over price (parameter 1) is more important than the importance assigned by the end-user to scope and quality over location (parameter 2). For educational institutions and hospitals, the importance assigned by the end-user to scope and quality over the location (parameter 2) takes precedence over the importance assigned by the end-user to be closer to the city center (parameter 3) or location over price (parameter 1). Surprisingly, general offices did not have preferences for location over price, scope, and quality (parameters 1 and 2), except to some extent, they prefer to be closer to the city center as it has a moderate mean rank score under parameter 3. Warehouses score the least out of all of them.
As mentioned earlier, projects closer to the city center will always be challenging due to constrained space, logistical challenges, etc. [42,56]. Moreover, this leads to higher construction costs. All these factors make a project closer to the city center and location-centric riskier and more complex. With limital capital in hand for the developer and limited room to increase the price of the end product/service, if a more significant capital outlay is towards the land, there shall be pressure on the developer to lower the project cost and may resort to appointing the lowest bidder, reducing cost by choosing lesser technologies, eventually leading to higher risks in the execution [74] and increase the complexity.
So, regarding choosing the project location, high-rise residential buildings get their complexity from the need to select the correct location [75], which is subject to availability, demand-supply, price, and issues around the land parcel. In the case of hotels, as per the study on critical success factors, location attributes or business influencing factors play a crucial role in choosing the location or making the investment decision [76]. In the study on CSF of Shopping mall development in Malaysia [77], the location was identified as the single most critical external factor impacting the development of shopping malls. This makes the hotels and retail buildings/malls required to be next to the city center, resulting in issues such as land availability, traffic restrictions, higher construction costs, logistical constraints, etc. For educational institutions and hospitals, the importance assigned by the end-user to scope and quality is much higher, requiring prudent design and robust execution, resulting in complexity.
4.2.2. Planning and Design Approaches as the Source of Complexity
Six parameters were selected and evaluated as the source of complexity for the planning and design approaches. The results from the Kruskal-Wallis Test on the data are given in Figure 2 and Table 6 (For complete data, refer to Appendix C).

Figure 2.
Mean ranks of building typology for attributes related to planning and design approaches.
Table 6.
Hypothesis Testing—Attributes related to differences in planning and design approaches.
In a critical review of complexity theory and how it relates to architecture, engineering, and construction [45], the authors opined that it is difficult to determine the measures of complexity in the design, construction, and management of building projects as it involves multiple disciplines. They can, at best, be examined in the functional domain (design problem and process) and physical domain (construction and system integration). On the distinct design enhancing/impacting users’ efficiency (parameter 4), retail buildings/malls stand out with the highest mean rank, followed by educational institutions and high-rise residential. Hotels and hospitals have almost similar mean rankings.
Design plays a crucial role in the spatial planning and creation of various sub-facilities, their location, size, scope, etc. A sound design basis is expected to improve the facility’s and its users’ overall performance. Regarding different design approaches varying the capacity and scalability of operations (parameter 5), Retail buildings/malls still score the highest mean rank; however, high-rise residential buildings and hotels scores are higher than those of hospitals and educational institutions. This attribute indicates how the designer helps increase the overall scale of operations using smart designs, and this looks more relevant in the case of retail buildings/malls, residential buildings, and hotels. Regarding the influence of the design approach on the economic value of the facility (parameter 6), high-rise residential buildings score the highest mean rank, followed by hotels and retail buildings/malls at the second mean rank. All the other facilities do not score enough on the mean ranking, making design highly sensitive in the case of residential buildings, hotels, and retail buildings/malls. On questioning whether the end-users insist upon innovation in design and development (parameter 7), Hotels score the highest mean rank, followed by retail buildings/malls and residential buildings. In these types of buildings, value creation happens by having the right design. As the design takes center stage, the developers will be able to create the distinction over the period for its design and design-related benefits to the end user; however, in the short term, it might lead to additional costs towards development.
The complexity of these buildings emanates from the criticality of the design to achieve the desired project goals, leading to project success. In many of these projects, these attributes are included in the goals and strategies, such as Target Value Design and Value Management [61]. However, all these attributes increase the burden on the designer to provide a robust design and on the developer to select the right consultant and develop these facilities as per the design despite its cost. These compulsions lead to the risk of the design becoming complicated and the budget increasing.
Regarding complexity in planning (i.e. floor efficiency, services, structure, façade, etc.) (parameter 8), hospitals and hotels are far ahead in the mean rank score. However, due to the number of specialist consultants required for the design of the facility (parameter 9) being the highest in hospitals, hospitals are most complex by nature.
Therefore, what is evident from the above is hospitals, followed by hotels and retail buildings/malls involve highly complex design processes compared to their peers in terms of the nature of the facility. On the design impacting productivity, efficiency, capacity, capability, economic value, etc., as a strategy, residential buildings join hotels and retail buildings/malls. Educational institutions are sensitive to the design impacting efficiency and scoring relatively better than general offices on other parameters. Warehouses have the lowest mean rank score.
4.2.3. The Volume of the Facilities and Their Key Components as the Source of Complexity
There are 11 parameters through which complexity through the volume of the facility has been evaluated. The results from the Kruskal-Wallis Test on the data are given in Figure 3 and Figure 4 and Table 7 and Table 8. (For complete data, refer to Appendix D and Appendix E).
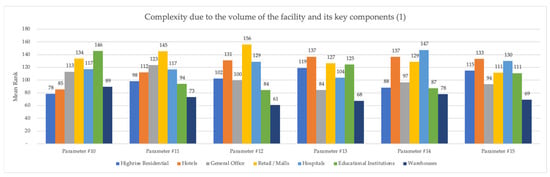
Figure 3.
Mean ranks of building typology for attributes related to volume of the facility and its key components (1).

Figure 4.
Mean ranks of building typology for attributes related to volume of the facility and its key components (2).
Table 7.
Hypothesis Testing—Attributes related to the volume of the facility and its key components (1).
Table 8.
Hypothesis Testing—Attributes related to the volume of the facility and its key components (2).
Complexity in construction can be either vertical (level of details required) or horizontal (level of specialization required). The premise under this section is that occupational density, the requirement of higher parking, complexity in vertical transportation, the scope of amenities, many electromechanical installations being part of the facility, the level of safety and security required, the scope of integration of various sub-components of the project, building height, size of floor pate, the stringency of development control regulations, etc. lead to complexity in the development of any buildings.
Retail buildings/malls scored the highest mean rank overall within the volume of facilities. They score the highest mean rank on the number of parking spaces planned for every 1000 SFT of usable area (parameter 11) and vertical transportation logistics complexity (parameter 12). This is due to higher footfalls and floating population in the retail buildings/malls. They also score the highest mean rank in the typical floor plate size of a standard building (parameter 18), as malls are generally more horizontal than vertical in development. The score on the stringency of development control regulations and codal compliance (parameter 20) is possibly high due to the large number of people visiting the building, creating huge safety/risk issues.
Retail buildings/malls scored the second highest mean rank in occupancy density per 1000 square feet of usable area (parameter 10) next to educational institutions. While the floating population is higher in the case of retail buildings/malls, the student population is much higher based on more extended usage by time as end users. Surprisingly, they score lower than hotels in the scope of amenities within the project (parameter 13). On installation of many electro-mechanical equipment as part of the scope (parameter 14), retail buildings/malls score next to hospitals, as hospitals have more complicated electro-mechanical systems than any other buildings. Its mean rank on the general range of building height (parameter 19) is much lower than that of all other buildings, as retail buildings/malls are more horizontally developed. On the scope, complexity, and intelligence of BMS (parameter 16), the scope of integration represented by the number of sub-components of the project (parameter 17), and the level and intensity of safety and security (Parameter 15), retail buildings/malls score lower mean rank than hospitals and hotels. This is possibly due to the requirement for the highest quality of operations in hospitals and hotels compared to retail buildings/malls.
Hospitals, with the second highest overall mean ranking within this group, have the highest mean rank on the installation of much electro-mechanical equipment as part of the scope (parameter 14), scope, complexity, and intelligence of Building Management System (BMS) (parameter 16), the scope of integration represented by the number of sub-components of the project (parameter 17), and the stringency of development control regulations and codal compliance (parameter 20). While the first three parameters are due to the criticality of the hospital facilities, the fourth parameter above was high due to the criticality of the nature of services, viz., medical and health.
Hospitals scored very close to hotels on the level and intensity of safety and security as part of the design and scope (parameter 15), which is likely due to the volume of people they handle. However, they scored lower (third rank) on occupancy density per 1000 square feet of usable area (parameter 10), number of parking spaces planned for every 1000 SFT of usable area (parameter 11), and vertical transportation logistics complexity (parameter 12) as they have moderate density. Hospitals scored moderate-to-low on the scope of amenities within the project (parameter 13), the typical floor plate size of a standard building (parameter 18), and the general range of the building height (parameter 19). It is interesting to note that they scored moderately both on floor plate and height, meaning that the size of the facilities considered for evaluation is not large hospitals.
The ranking of the hotels was close to retail buildings/malls and hospitals in terms of the overall mean ranking of all the above parameters. While they score the highest in the level and intensity of safety and security as part of the design scope (parameter 15) and second highest in the general range of the building height (parameter 19), they scored low on occupancy density per 1000 SFT (parameter10), typical floor plate size of a standard building (parameter 18), and the number of parking spaces planned for every 1000 SFT of usable area (parameter 11).
The category of high-rise residential buildings scored high in the general range of building height (parameter 19). It also scores a moderate mean rank on the scope of amenities within the project (parameter 13) and the level and intensity of safety and security as part of the project design and scope (parameter 15). Its mean ranking on all the other parameters is lower than the midpoint. Therefore, we can safely conclude that the residential projects are not generally complex due to the volume of facilities. The most surprising is the moderate ranking on the scope of amenities within the project (parameter 13), which needs to be explored further.
The category of educational institutions scored highest in occupancy density per 1000 square feet of usable area (parameter 10), moderate in the scope of amenities within the project (parameter 13), and typical floor plate size of a standard building (Parameter 18). general offices scored second highest mean rank in the number of parking spaces planned for every 1000 SFT of usable area (parameter 11). Surprisingly, they do not score high on the general range of building height (parameter 19) or the typical floor plate size of a standard building (parameter 18). Warehouses, like before, scored the low mean rank in almost all parameters except in the typical floor plate size of a standard building (parameter 18), where they score the second highest rank, making them the least complex on the volume of the facility and its components.
4.2.4. Complexity Due to the End-User Influence on Design
Five parameters have been used to assess the complexity due to end user attributes, influence, and powers. The Kruskal-Wallis Test was applied to the data, and the results are shown in Figure 5 and Table 9 (For complete data, refer to Appendix F).

Figure 5.
Mean ranks of building typology for attributes related to end-user influence on design.
Table 9.
Hypothesis Testing—attributes related to End-user influence on design.
On end-user influence on design, sensitiveness of the end users to ESG Compliance in the operation phase (parameter 21), prevalence of end users interference in the design and scope (parameter 22), prevalence of “built to suit” and customization for the end users (parameter 23) and critical nature of considerations for ergonomics in operations, in the design (parameter 24) were evaluated apart from the type of client (parameter 25). The facility users, such as hotel guests in the case of hotels, shoppers in the case of Retail buildings/malls, and students in the case of educational institutions, will not have much of a say as they enter the operation stage. So, end users in these facilities are assumed to be the entities owning and operating the facility, which needs validation.
If we exclude the type of client for whom the facility is developed (Parameter 25), viz. Business to Govt (B2G), Business to Business (B2B), or Business to Consumer (B2C), from the evaluation, the results show hospitals are highly sensitive to end-user requirements on all four parameters. This is followed by high-rise residential buildings, hotels, retail buildings/malls, and educational institutions. The complexity is always higher where there is client intervention in the design and are sensitive to the final product. Regarding the prevalence of end-user interference in the design and scope (parameter 22), high-rise residential buildings and hospitals are almost at par. Regarding the prevalence of built-to-suit and customization for the end users (parameter 23), Hospitals score the highest on the mean rank score, followed by high-rise residential buildings and retail buildings/malls. Based on the above, excluding parameter 25, we can conclude that hospitals, followed by high-rise residential buildings, are more complex due to the influence of the end users.
For the type of business, the median is 2 and 3 in all cases, indicating these are business to consumer or business to a combination of business and consumer. So, there is not much of an impact on the complexity due to the type of business. In the case of whether the end-user is sensitive to ESG compliance in the operation phase (parameter 21), except for warehouses, the median of all the facilities is four, which indicates that they somewhat agree with the statement, and this is a positive trend towards sustainable operations.
4.2.5. Complexity Due to Construction Management Factors
Six parameters were evaluated under the complexity criteria due to construction management factors. The results of applying the Kruskal-Wallis Test to the survey data are shown in Figure 6 and Table 10 (For complete data, refer to Appendix G).
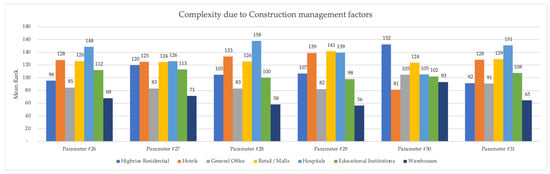
Figure 6.
Mean ranks of building typology for attributes related to construction management factors.
Table 10.
Hypothesis Testing—Attributes related to Construction Management Factors.
As per the data above, only on time urgency for development (Parameter 30) does the data look skewed in favor of high-rise residential buildings, followed by retail buildings/malls, and hotels score the lowest mean rank under this parameter. Hospitals collectively score the highest mean rank on all the other parameters, followed by retail buildings/malls and hotels. High-rise residential buildings and educational institutions are much lower than the above three facilities, followed by general offices and warehouses. Regarding the ease of obtaining government approval (sanction of permit) (parameter 26), Hospitals stand way ahead in terms of their difficulty level compared to all other facilities, followed by hotels. On average of time (in years) of development of a typical project (parameter 27), hospitals, hotels, and retail buildings/malls are almost at par on the mean score ranking, with the Median score being 1–3 years (hospitals) and 3–5 years (hotels and retail buildings/malls). Regarding the complexity of project management during execution (parameter 28) and the number of specialist contractors required for the execution of the project (parameter 31), hospitals score way ahead of all other buildings, indicating the overall complexity of the execution. Regarding the risks associated with execution impacting time, cost, and quality (parameter 29), retail buildings/malls score the highest mean rank, closely followed by hospitals and hotels, which are almost at par. So, on the complexity level due to construction management factors, based on mean ranks, hospitals have the maximum complexity, followed by retail buildings/malls and hotels.
4.2.6. Complexity Due to Operational Attributes
Three parameters are under the complexity due to operational attributes. The results based on applying the Kruskal-Wallis Test are given in Figure 7 and Table 11. (For complete data, refer to Appendix H).
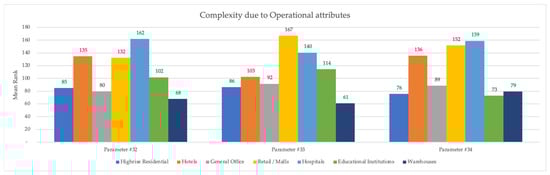
Figure 7.
Mean ranks of building typology for operational attributes..
Table 11.
Hypothesis Testing—Operational Attributes.
Based on the assessment of the results from the Kruskal-Wallis Test and the mean ranks under all the parameters of operational attributes, hospitals score the highest, indicating relatively higher complexity during the operation phase. Hospitals score the highest mean rank in the complexity of operations and maintenance of the facility after completion (parameter 32) and power consumption, connected load, and criticality of backup power (parameter 34). However, on traffic intensity during operations/while in use (parameter 33), retail buildings/malls score higher than hospitals.
This can be corroborated by the fact that Hospitals are very sensitive to operations due to medical services, complicated electro-mechanical systems, and the quality of services required to be maintained 24/7. This is followed very closely by retail buildings/malls and hotels due to the volume of facilities and traffic. Educational institutions and general offices score over the high-rise residential and warehouses score the least in mean ranking, indicating the least complex among all the facilities.
4.3. Summary—Buildings-Wise Complexities Based on Mean Ranking on All Parameters
Table 12, Table 13, Table 14, Table 15 and Table 16 below contain the primary source of complexity in various types of buildings using the mean ranking of the Kruskal-Wallis test. The complexity discussed herein is relative and not the absolute quantum of complexity. To arrive at this, the highest mean rank within each Parameter is mapped to the respective Building types. Suitable strategies have been proposed alongside.
Table 12.
Primary Sources of Complexity in High-rise Residential Buildings, based on Design and Performance Attributes.
Table 13.
Primary sources of Complexity in Hotels based on Design and Performance Attributes.
Table 14.
Primary Sources of Complexity in Retail Buildings/Malls, based on Design and Performance Attributes.
Table 15.
Primary sources of Complexity in Hospitals based on Design and Performance Attributes.
Table 16.
Primary sources of complexity in educational institutions, based on Design and Performance attributes.
4.3.1. High-Rise Residential Projects
The end users of high-rise residential projects are retail customers wanting to own and use it for longer periods. Hence, location plays a key role compared to the end product’s price, as shown Table 12. In fact, it is usually stated that three things determine the house price: location, location, and location (e.g., “Location, location, location: The 3L Approach to house price determination”) [75]. Customers prefer projects to be part of the neighborhood with schools, amenities, and good connectivity. Better planning of the development fetches higher economic value. Unlike other building projects, sales start from the day the project is launched; hence, there is always pressure from the existing customer to complete the project.
The developer of a high-rise residential project needs to focus on (a) choosing the right location, (b) assigning the highest importance to the design and planning (Choosing an experienced architect), and (c) delivering the building in the quickest possible time so that he can maximize the economic value of the development (e.g., “Critical success factors for public housing projects in developing countries: a case study of Nigeria) [78]. It is also important to choose an experienced management team and an experienced contractor with adequate resources, as they are key to its success (e.g., “Success Factor for Project Management on High Rise Building Project”) [79]. Not adhering to any of these would lead to economic loss and loss of reputation for the builder, which is a key component in this industry (e.g., “Assessment of Critical Success Factors for Strategic Planning: A Case Study of the Residential Construction Company in Kosovo”) [80].
Given that design influences the economic value of the property, the design may become complex due to elements such as optimization of Floor Area Ratio (FAR)/Floor Space Index (FSI) by building vertically, aesthetics, functionality, layout, sustainability measures, safety, climate adaptation, integration with the neighborhood, market trends, etc. To reduce complexity, constructability aspects and procurement challenges should be addressed during the design stage. This can be addressed by involving the potential contractor in the design stage or Early Contractor Involvement (ECI) as they bring in improved constructability, improved cost estimation, better construction plan, and effective risk management [81,82].
4.3.2. Hotels
As seen in Table 13, one source of complexity in hotel projects is the insistence of the end users on innovation in the design development and scope of amenities within the project. Here, the end users are presumed to be the project developers more than guests. Innovation in the design of a hotel provides a competitive advantage to its owners and enhances its guests’ experiences. Architects and experts strongly believe that design plays a key role in modern-day tourism and is one of the bases for choosing a hotel [83]. As per a study on critical success factors of hotel opening in South Africa, strategic planning is one of the important critical success factors (e.g., “A review on critical success factors in tourism”) [84], and the scope of facilities and quality appeared as one of top five critical success factors both on demand and supply side approaches. Sustainability in construction and operations has become the center point of design in newer developments as they generally appeal to eco-conscious travelers. Smart rooms with automated systems and biophilic design to enhance the living experience are getting more traction. While all of these improve the viability of the projects, they also lead to complexity in the design.
Much of the complexity in hotels emanates from innovation in design and the operational scope. Developers should carry out a thorough market study of the demand and supply scenario to finalize the scope and positioning and also engage a very well-reputed and experienced architect/consultant firm specializing in designing hotels so that most of the complexity associated with innovation, the scope of amenities, requirement of safety, and security can be well managed in the design. Involving the key stakeholders in the early design development stage and appointing an experienced operation and management team are crucial in managing the design-led complexity. The study on “Innovation in special hotels—as a key to success” [85] suggests that apart from service innovation, non-management innovations such as psychology and culture are equally important. These aspects should be included in the overall corporate-level strategies.
4.3.3. Retail Buildings/Malls
Much of the complexity in a retail/mall facility comes from the planning and design approaches, volume, and key components of the facility. In the study titled “Preliminary Study on the Critical Success Factors of Shopping Mall Developments in Klang Valley, Malaysia” [77], location and retail layout and design strategies were identified as two of the four critical success factors. The other two factors were the tenancy and management of the facility. In the study “An Investigation of Shopping Mall Design Requirements” [86], the authors have emphasized accessibility as the critical criterion for users in choosing the Mall. They have further observed that the shape of the mall plot, floor area utilization, circulation plan, meeting environmental standards, operation and maintenance requirements, compliance with local regulations, etc., are some of the factors that need to be considered in the design. In the study on customers’ experiences (e.g., “Identification and ranking the significant factors influencing customer experience for shopping malls in the Indian context”) [87], exploration, entertainment, and assortment were found to be the top three key factors. Customer experience can be provided through proper design and layout of the facilities. In the study conducted in India titled “Factors influencing the selection of shopping Malls: An exploratory study of consumer perception” [88], seven factors were identified as key to influencing a consumer to choose a particular Mall. Amongst these, service experience (scope, amenities, and operational attributes), the internal environment (design, architectures, spatial utilization, etc.), convenience (accessibility, timing, parking, etc.), and proximity are factors influenced by the developer. Newly developed Malls have better sustainability measures, such as energy efficiency, waste management, etc., incorporated into the design.
As seen in Table 14, the complexity of Retail/Mall is driven mainly by the location, volume of space, and number of visitors. The strategy of the developer should be to have a clear estimation of the volume of users by conducting a detailed market study and ensuring the facility is suitably located and neither over nor under-designed. Further, emphasis should be given to the solutions proposed by the consultants to handle the volume, such as people movement, vehicular movement, etc. In this regard, conducting a detailed traffic study and creating infrastructure that meets the requirements is crucial. Given that compliance with local laws and developmental guidelines is critical, the architects, as part of the design team, should have suitable liaison experts with sound knowledge of codal compliances. Finally, an experienced and established facility management agency should be appointed to oversee the upkeep and maintenance of the facility, as user experience is one of the driving factors that attract consumers to a mall.
4.3.4. Hospitals
Based on the current study on design and performance attributes, hospitals are the most complex building type among all the seven building types under consideration. As seen in Table 15, except for the location, it has attributes with the highest complexity in planning and design, volume, end-user influence, construction management, and operations. They have stringent regulations to comply with. For example, according to the American Association “www.aha.org (accessed on 17 July 2024)”, health systems, hospitals, and post-acute care providers must comply with 629 regulatory requirements over nine domains. The mechanical and electrical systems that enable fresh air, oxygen, uninterrupted power, clean water, and other medical supplies play a pivotal role in the functioning of hospitals. A study performed on hospital architecture (e.g., “Building for Change: Comparative Case Study of Hospital Architecture”) [89] demonstrates that strategies adopted in the early stage of the hospital facility’s design significantly impact how hospitals evolve in the future, placing the design process of hospitals at the center stage of discussion. In the study on innovation in hospital building design (e.g., “The nature of innovation in hospital building design: a mixed grounded theory study”) [90], it is concluded that the shortcomings in the hospital building design are due to the absence of a “holistic approach” and lack of understanding of the factors and forces. In the study on optimizing the infrastructure design of hospital construction projects [91], project management, safety and security during construction and operation, and design complexity have been identified as three of the six critical factors in their design and construction.
Given that the development control regulations are stringent, and the complexity associated with the involvement of multiple consultants and coordination between various design branches [92], the developer intending to construct a hospital should make sure the designs are futuristic, expandability of operations is in-built, spatial allocation is optimal, and the designs are fully coordinated. Such a comprehensive exercise requires an experienced designer team’s involvement and consultation with all the functional departments while finalizing the design. One of the recommendations for the developers is the use of Building Information Modelling (BIM) technology in all stages of the project, including operation and maintenance. As per the study on the usage of BIM in healthcare projects [93], implementing BIM along with aiding management practices has been found to have compelling benefits for healthcare projects. Since hospital projects involve installing many electro-mechanical equipment with the highest level of functional accuracy, designed by multiple specialist consultants that need to be integrated with specialized building management systems, BIM can play a pivotal role in reducing the above complexity. BIM additionally helps in value maximization and waste reduction [93]. The developers should resort to the Design & Build contracting method. This will help the contractor control the design, help the developer achieve the design goals, and manage the MEP complexity for the developer [94]. Integrated project delivery is another popular method suitable for hospital projects where the design, fabrication, and construction teams collaborate from the very early stage of the project, should the Design & Build method not be feasible. At the very least, the entire design process should be managed by a Lead Design Consultant who coordinates and manages all the specialist consultants.
4.3.5. Educational Institutions
Educational institutions have a destination effect and are not driven by location; however, the scope and quality of the facility are complex to make them successful (Table 16). They have relatively higher occupancy density. It is well established in the study on performance evaluation of buildings in educational institutions (e.g., “Performance Evaluation of Buildings in Educational Institutions: A Case of Universities”) [95] that the two key drivers for achieving higher effectiveness in education are the building’s physical condition and functional effectiveness. These two drivers are directly correlated to the scope and quality. An educational institution’s developer should make sure that the scope and quality are given the highest importance in the design stage over the location. So long the facility is functionally appealing to the end user, the location does not matter.
4.3.6. Overall Assessment
If we must make an overall assessment of the complexity of these facilities across all parameters, under the assumption that a higher mean ranking indicates relatively higher complexity compared to other facilities and vice-versa, we need to view the ranking of mean ranking using the Kruskal-Wallis Test of all the parameters together. Appendix I contains the ranking of the mean ranks of each of the building types against design and performance attributes. A higher ranking indicates the highest mean rank obtained within that parameter. Hospitals score the maximum ranks amongst all the types of buildings, making it the most complex of all building projects, followed by retail buildings/malls, hotels, high-rise residential buildings, educational institutions, general offices, and warehouses, respectively.
5. Conclusions and Practical Implications
From the above data analysis, with 16 parameters scoring the highest mean rank, we can conclude that hospitals are relatively the most complex building facilities from design and performance attributes or parameters. The complexity is spread across planning and design approach, volume and key components, end-user influence, construction management, and operations. This is probably due to the multitude of organizational units in a large medical facility and its operational intensity, the volume of patients and medical professionals and their movement, and the volume of materials that must be transported between the facilities [96]. This is in line with the findings by Moslehian et al. [90], wherein it is observed that the variety of functions, operations, and systems makes the hospital one of the most complex and dynamic building typologies. This calls for the designers to take cognizance of the perspectives of stakeholders. They further observe that advancements in the field and medical practices, technological developments, enhanced research and development, and economic shifts have constantly influenced how hospitals are designed.
Hospitals are followed by retail buildings/malls, hotels, high-rise residential buildings, educational institutions, general offices, and warehouses. The modern trends in the development of Malls (including large shopping centers) involve large floor plates, are rich in functionality, and involve high commercial, food, and entertainment aspects, making them complex in terms of architectural, spatial, and urban planning [97]. In the study on identifying and ranking significant factors influencing customers’ experience of shopping malls in the Indian context [87], the authors observe that exploration, entertainment, and assortment appeal to the visitors coming to the mall. Retail buildings/malls have ten parameters scoring the highest mean ranks, most related to layout, arrangement, and visitor movement (including parking).
Hotels, too, are complex systems due to the combination management of hard infrastructure such as mechanical systems, electrical systems, public health engineering, utilities, etc., but also higher dependency on soft services such as data services, room services, help desk services, first aid service, housekeeping, security, car parking, business travel, restaurants management and food service, etc. on spatial planning, engineering and system designs [98]. This is in line with the finding of this study, where hotels are complex on account of innovation in design and development required by the end user and the scope of amenities within the project. In the study on value generators for luxury hotels by Buehring and O’Mahony [99], the authors identified these generators as services, atmosphere, culture, technology, and sensory. Notably, most of these originate from the design and scope development stage of the hotel. In addition, it is evident from the above analysis that the design and the volume of the facility drive most of the complexities in development; hence, the developer should create strategies around these parameters to mitigate the risks.
More than the outcome of which facility is most complex, this study is important in understanding specific design and performance attributes causing the complexity in each building type, which has not been achieved before. This research will help others to understand the source of complexities in the design and performance of various types of buildings, especially for developers interested in venturing into one or more of these facilities, as complexities directly impact the planning, organization, and organization model and, eventually, project outcome, including project cost, schedule, safety, and quality [13]. In addition, this research will benefit architects, consultants, project management professionals, and facility managers by helping them understand how and where the complexity due to design and performance attributes originate in these facilities, which, in turn, will help them strategize and help the developers achieve the project and organizational goals. One of the strategies to derisk the complexity in a Building project is the architectural design and planning domain, treating the building as a complex natural system with interrelated elements, aiming for multipurpose use and fostering diversity in the plan, and ensuring adaptability to unplanned transformation [17].
With the built environment accounting for 40% of global energy consumption and contributing 30% of greenhouse gas [45], sustainable development and sustainability in construction are expected to redefine the scope of future complexities on design and performance attributes in building projects [17].
6. Limitations of the Study and Future Scope
This study has the following limitations:
- a.
- This research is based on data collected from 31 respondents. While this quantum meets the minimum required response for statistical analysis as per the generally accepted norms, as the central limit theorem holds for this sample size [66], given the qualitative nature of the study and the number of variables, a higher number of samples could have impacted the findings of the study.
- b.
- The survey questionnaire evaluates 34 parameters against seven types of building projects. Completing a lengthy questionnaire requires time and patience and is prone to error. The architects and consultants are generally very busy and may not provide the same quantum of attention and alertness throughout the survey process. Future research in this field should attempt to limit the parameters to only those significantly impacting project goals.
- c.
- Most of the survey respondents are from the metros in the southern part of India. Responses from architects and consultants who have worked in other metros and Tier II cities could have enriched the study further.
- d.
- Given that this study is limited to the Indian context, the research findings cannot be used in other countries without further contextual evaluation of these attributes and evaluating how much a country’s culture impacts them.
- e.
- There is no prior measurement model for evaluating complexities based on design and performance attributes for different types of buildings. While this research relies upon past works done in this area by various authors, the shortlisting of the attributes to be measured and the scale to be used for measurement are based on the authors’ interpretations of relevant papers and the outcome of the pilot study.
- f.
- This study only establishes the relative complexity between various types of buildings based on design and performance attributes using mean rank data from the Kruskal-Wallis test assuming equal weightage. Future studies should attempt to expand the scope of complexities to cover other dimensions of development, such as external factors, sustainability, use of technology, countries beyond India, etc., and could use quantitative evaluation such as regression analysis.
- g.
- This study relies mainly on the subjective evaluation of professionals from the field of architecture and design. Future research should be based on objective data from completed projects to support and validate the conclusions.
However, the findings of this study still provide a reasonable basis for a developer to understand the source of complexities in various types of buildings and help devise strategies based on the risks associated with the complexity and adequately address them in the design stage itself.
Author Contributions
Conceptualization, J.B.R. and A.R.; methodology, J.B.R.; software, J.B.R.; validation, J.B.R. and A.R.; formal analysis, J.B.R.; investigation, J.B.R.; resources, J.B.R.; data curation, J.B.R.; writing—original draft preparation, J.B.R.; writing—review and editing, J.B.R. and A.R.; visualization, J.B.R.; supervision, A.R.; project administration, A.R. All authors have read and agreed to the published version of the manuscript.
Funding
This research received no external funding.
Data Availability Statement
The data collated and used to arrive at this study’s findings are available upon reasonable request to the corresponding author.
Conflicts of Interest
The authors declare no conflicts of interest.
Appendix A. Cronbach Alpha by Parameters
| High-Rise Residential Buildings | Hotels | General Offices | Retail Buildings/Malls | Hospitals | Educational Institutions | Warehouses | ||||||||
|---|---|---|---|---|---|---|---|---|---|---|---|---|---|---|
| A | B | A | B | A | B | A | B | A | B | A | B | A | B | |
| Parameter 1 | −0.21 | 0.88 | 0.33 | 0.84 | 0.53 | 0.95 | 0.32 | 0.84 | 0.38 | 0.86 | 0.46 | 0.92 | 0.58 | 0.95 |
| Parameter 2 | 0.29 | 0.88 | 0.08 | 0.84 | 0.32 | 0.95 | 0.33 | 0.84 | 0.08 | 0.87 | 0.03 | 0.92 | 0.49 | 0.95 |
| Parameter 3 | 0.02 | 0.89 | 0.07 | 0.84 | 0.35 | 0.95 | 0.26 | 0.84 | 0.31 | 0.86 | 0.41 | 0.92 | 0.53 | 0.95 |
| Parameter 4 | 0.2 | 0.88 | 0.15 | 0.84 | 0.57 | 0.95 | 0.19 | 0.85 | 0.39 | 0.86 | 0.19 | 0.92 | 0.58 | 0.95 |
| Parameter 5 | 0.44 | 0.88 | 0.21 | 0.84 | 0.41 | 0.95 | 0.17 | 0.85 | 0.37 | 0.86 | 0.36 | 0.92 | 0.41 | 0.95 |
| Parameter 6 | −0.17 | 0.88 | −0.08 | 0.84 | 0.55 | 0.95 | 0.09 | 0.85 | 0.07 | 0.87 | 0.55 | 0.92 | 0.52 | 0.95 |
| Parameter 7 | 0.39 | 0.88 | 0.3 | 0.84 | 0.58 | 0.95 | 0.31 | 0.84 | 0.5 | 0.86 | 0.58 | 0.92 | 0.62 | 0.95 |
| Parameter 8 | 0.29 | 0.88 | 0.28 | 0.84 | 0.63 | 0.95 | 0.02 | 0.85 | 0.28 | 0.86 | 0.63 | 0.92 | 0.57 | 0.95 |
| Parameter 9 | 0.72 | 0.87 | 0.51 | 0.83 | 0.79 | 0.95 | 0.73 | 0.83 | 0.55 | 0.86 | 0.56 | 0.92 | 0.74 | 0.95 |
| Parameter 10 | 0.2 | 0.88 | 0.5 | 0.83 | 0.4 | 0.95 | 0.57 | 0.83 | 0.3 | 0.86 | 0.25 | 0.92 | 0.56 | 0.95 |
| Parameter 11 | −0.18 | 0.89 | 0.09 | 0.84 | −0.09 | 0.95 | 0.04 | 0.85 | 0.06 | 0.87 | 0.16 | 0.93 | 0.28 | 0.95 |
| Parameter 12 | 0.66 | 0.87 | 0.56 | 0.83 | 0.76 | 0.95 | 0.48 | 0.84 | 0.61 | 0.86 | 0.42 | 0.92 | 0.71 | 0.95 |
| Parameter 13 | 0.26 | 0.88 | −0.09 | 0.85 | 0.61 | 0.95 | −0.01 | 0.86 | 0.33 | 0.86 | 0.25 | 0.92 | 0.77 | 0.95 |
| Parameter 14 | 0.34 | 0.88 | 0.12 | 0.84 | 0.69 | 0.95 | 0.43 | 0.84 | 0.22 | 0.87 | 0.44 | 0.92 | 0.64 | 0.95 |
| Parameter 15 | 0.29 | 0.88 | 0.22 | 0.84 | 0.65 | 0.95 | 0.39 | 0.84 | 0.36 | 0.86 | 0.51 | 0.92 | 0.59 | 0.95 |
| Parameter 16 | 0.58 | 0.87 | 0.56 | 0.83 | 0.72 | 0.95 | 0.51 | 0.84 | 0.55 | 0.86 | 0.72 | 0.92 | 0.7 | 0.95 |
| Parameter 17 | 0.66 | 0.87 | 0.52 | 0.83 | 0.75 | 0.95 | 0.5 | 0.84 | 0.25 | 0.86 | 0.64 | 0.92 | 0.7 | 0.95 |
| Parameter 18 | 0.48 | 0.88 | 0.36 | 0.83 | 0.6 | 0.95 | −0.12 | 0.86 | 0.4 | 0.86 | 0.13 | 0.92 | 0.06 | 0.95 |
| Parameter 19 | 0.16 | 0.88 | 0.27 | 0.84 | 0.66 | 0.95 | 0.53 | 0.84 | 0.4 | 0.86 | 0.49 | 0.92 | 0.55 | 0.95 |
| Parameter 20 | 0.36 | 0.88 | 0.52 | 0.83 | 0.58 | 0.95 | 0.34 | 0.84 | 0.38 | 0.86 | 0.58 | 0.92 | 0.64 | 0.95 |
| Parameter 21 | 0.47 | 0.88 | 0.51 | 0.83 | 0.72 | 0.95 | 0.49 | 0.84 | 0.6 | 0.86 | 0.71 | 0.92 | 0.7 | 0.95 |
| Parameter 22 | 0.58 | 0.87 | 0.61 | 0.82 | 0.78 | 0.95 | 0.44 | 0.84 | 0.55 | 0.86 | 0.78 | 0.92 | 0.6 | 0.95 |
| Parameter 23 | 0.39 | 0.88 | 0.38 | 0.83 | 0.65 | 0.95 | 0.54 | 0.84 | 0.42 | 0.86 | 0.63 | 0.92 | 0.59 | 0.95 |
| Parameter 24 | 0.61 | 0.88 | 0.3 | 0.84 | 0.63 | 0.95 | 0.4 | 0.84 | 0.38 | 0.86 | 0.35 | 0.92 | 0.75 | 0.95 |
| Parameter 25 | 0.38 | 0.88 | 0.35 | 0.83 | 0.15 | 0.95 | 0.32 | 0.84 | 0.5 | 0.86 | 0.34 | 0.92 | 0.02 | 0.95 |
| Parameter 26 | 0.53 | 0.88 | 0.24 | 0.84 | 0.33 | 0.95 | 0.2 | 0.85 | 0.4 | 0.86 | 0.46 | 0.92 | 0.54 | 0.95 |
| Parameter 27 | 0.39 | 0.88 | 0.34 | 0.83 | 0.56 | 0.95 | 0.5 | 0.84 | 0.34 | 0.86 | 0.37 | 0.92 | 0.51 | 0.95 |
| Parameter 28 | 0.68 | 0.87 | 0.46 | 0.83 | 0.64 | 0.95 | 0.57 | 0.84 | 0.4 | 0.86 | 0.77 | 0.92 | 0.72 | 0.95 |
| Parameter 29 | 0.54 | 0.88 | 0.25 | 0.84 | 0.77 | 0.95 | 0.31 | 0.84 | 0.46 | 0.86 | 0.75 | 0.92 | 0.77 | 0.95 |
| Parameter 30 | 0.07 | 0.88 | 0.52 | 0.83 | 0.69 | 0.95 | 0.42 | 0.84 | 0.68 | 0.85 | 0.76 | 0.92 | 0.48 | 0.95 |
| Parameter 31 | 0.62 | 0.87 | 0.57 | 0.83 | 0.76 | 0.95 | 0.47 | 0.84 | 0.34 | 0.86 | 0.62 | 0.92 | 0.67 | 0.95 |
| Parameter 32 | 0.62 | 0.87 | 0.39 | 0.83 | 0.66 | 0.95 | 0.53 | 0.84 | 0.28 | 0.86 | 0.67 | 0.92 | 0.74 | 0.95 |
| Parameter 33 | 0.63 | 0.87 | 0.68 | 0.82 | 0.7 | 0.95 | 0.41 | 0.84 | 0.3 | 0.86 | 0.47 | 0.92 | 0.69 | 0.95 |
| Parameter 34 | 0.66 | 0.87 | 0.37 | 0.84 | 0.72 | 0.95 | 0.37 | 0.84 | 0.23 | 0.86 | 0.7 | 0.92 | 0.52 | 0.95 |
A—Corrected Item-Total Correlation, B—Cronbach’s Alpha if Item Deleted.
Appendix B. Complexity from Location Attributes
| Parameter #1 | Parameter #2 | Parameter #3 | |||||
| Groups (M = Median) | Sample | M | Mean Rank | M | Mean Rank | M | Mean Rank |
| High-rise Residential Buildings | 31 | 5 | 144.39 | 5 | 112.45 | 4 | 96.98 |
| Hotels | 31 | 5 | 139.06 | 5 | 121.76 | 5 | 138.71 |
| General Offices | 31 | 4 | 87.74 | 4 | 95.60 | 4 | 113.98 |
| Retail Buildings/Malls | 31 | 5 | 131.13 | 4 | 102.15 | 5 | 149.55 |
| Hospitals | 31 | 5 | 118.90 | 5 | 131.27 | 4 | 120.05 |
| Educational Institutions | 31 | 4 | 89.82 | 5 | 135.73 | 4 | 92.74 |
| Warehouses | 31 | 3 | 51.95 | 4 | 64.05 | 3 | 50.98 |
| n | 217 | 4 | 4 | 4 | |||
| Chi2 | 60.95 | 33.72 | 55.35 | ||||
| df | 6 | 6 | 6 | ||||
| p-value | <0.001 | <0.001 | <0.001 | ||||
| Null Hypothesis | H0 failed to be accepted | H0 failed to be accepted | H0 failed to be accepted | ||||
Appendix C. Complexity Due to Differences in Planning and Design Approaches
| Parameter #4 | Parameter #5 | Parameter #6 | Parameter #7 | Parameter #8 | Parameter #9 | ||||||||
| Groups (M = Median) | Sample | M | Mean Rank | M | Mean Rank | M | Mean Rank | M | Mean Rank | M | Mean Rank | M | Mean Rank |
| High-rise Residential Buildings | 31 | 5 | 117.16 | 5 | 122.81 | 5 | 140.71 | 4 | 122.35 | 4 | 122.52 | 2 | 84.71 |
| Hotels | 31 | 5 | 115.50 | 5 | 121.58 | 5 | 136.39 | 5 | 144.65 | 5 | 140.42 | 4 | 130.48 |
| General Offices | 31 | 4 | 100.34 | 5 | 97.11 | 4 | 88.97 | 4 | 82.47 | 4 | 85.10 | 3 | 85.68 |
| Retail Buildings/Malls | 31 | 5 | 130.11 | 5 | 129.35 | 5 | 134.52 | 4 | 128.29 | 4 | 123.65 | 3 | 130.74 |
| Hospitals | 31 | 5 | 115.50 | 5 | 109.98 | 4 | 96.39 | 4 | 117.34 | 5 | 141.45 | 4 | 156.97 |
| Educational Institutions | 31 | 5 | 119.77 | 5 | 106.50 | 5 | 102.84 | 4 | 96.32 | 4 | 94.74 | 3 | 104.15 |
| Warehouses | 31 | 4 | 64.61 | 4 | 75.66 | 4 | 63.19 | 3 | 71.58 | 3 | 55.13 | 2 | 70.27 |
| n | 217 | 5 | 5 | 5 | 4 | 4 | 3 | ||||||
| Chi2 | 28.2 | 21.4 | 54.2 | 36.25 | 53.03 | 48.42 | |||||||
| df | 6 | 6 | 6 | 6 | 6 | 6 | |||||||
| p-value | <0.001 | 0.002 | <0.001 | <0.001 | <0.001 | <0.001 | |||||||
| Null Hypothesis | H0 failed to be accepted | H0 failed to be accepted | H0 failed to be accepted | H0 failed to be accepted | H0 failed to be accepted | H0 failed to be accepted | |||||||
Appendix D. Complexity Due to the Volume of the Facility and Its Key Components (1)
| Parameter #10 | Parameter #11 | Parameter #12 | Parameter #13 | Parameter #14 | Parameter #15 | ||||||||
| Groups (M = Median) | Sample | M | Mean Rank | M | Mean Rank | M | Mean Rank | M | Mean Rank | M | Mean Rank | M | Mean Rank |
| High-rise Residential | 31 | 2 | 78.42 | 2 | 98.27 | 3 | 102.4 | 3 | 119.26 | 4 | 88.37 | 5 | 114.95 |
| Hotels | 31 | 2 | 85.32 | 2 | 111.92 | 4 | 130.89 | 4 | 136.81 | 5 | 136.5 | 5 | 133.15 |
| General Offices | 31 | 3 | 113.29 | 2 | 123.47 | 3 | 99.71 | 2 | 84.26 | 4 | 96.58 | 4 | 93.56 |
| Retail Buildings/Malls | 31 | 4 | 133.68 | 3 | 145.32 | 5 | 155.79 | 3 | 126.52 | 5 | 128.81 | 5 | 111.47 |
| Hospitals | 31 | 3 | 117.1 | 2 | 116.58 | 4 | 128.94 | 3 | 103.9 | 5 | 147.39 | 5 | 129.92 |
| Educational Institutions | 31 | 4 | 145.87 | 2 | 94.15 | 3 | 84.29 | 4 | 124.63 | 4 | 87.29 | 5 | 110.89 |
| Warehouses | 31 | 3 | 89.32 | 1 | 73.29 | 2 | 60.98 | 2 | 67.63 | 4 | 78.06 | 4 | 69.06 |
| n | 217 | 3 | 2 | 3 | 3 | 4 | 5 | ||||||
| Chi2 | 32.35 | 27.77 | 51.29 | 31.08 | 41.66 | 27.43 | |||||||
| df | 6 | 6 | 6 | 6 | 6 | 6 | |||||||
| p-value | <0.001 | <0.001 | <0.001 | <0.001 | <0.001 | <0.001 | |||||||
| Null Hypothesis | H0 failed to be accepted | H0 failed to be accepted | H0 failed to be accepted | H0 failed to be accepted | H0 failed to be accepted | H0 failed to be accepted | |||||||
Appendix E. Complexity Due to the Volume of the Facility and Its Key Components (2)
| Parameter #16 | Parameter #17 | Parameter #18 | Parameter #19 | Parameter #20 | |||||||
| Groups (M = Median) | Sample | M | Mean Rank | M | Mean Rank | M | Mean Rank | M | Mean Rank | M | Mean Rank |
| High-rise Residential Buildings | 31 | 4 | 90.66 | 3 | 88.45 | 2 | 73.44 | 3 | 158.48 | 4 | 103.87 |
| Hotels | 31 | 5 | 142.02 | 4 | 132.89 | 3 | 93.19 | 3 | 138.71 | 5 | 125.69 |
| General Offices | 31 | 4 | 90.35 | 3 | 91.1 | 3 | 77.18 | 2 | 105.32 | 4 | 93.74 |
| Retail Buildings/Malls | 31 | 5 | 132.73 | 4 | 130.85 | 4 | 145.48 | 2 | 102.71 | 5 | 131.31 |
| Hospitals | 31 | 5 | 147.84 | 5 | 152.84 | 3 | 116.42 | 2 | 103.71 | 5 | 131.31 |
| Educational Institutions | 31 | 4 | 95.84 | 3 | 99.71 | 4 | 126.74 | 2 | 88.31 | 5 | 109.74 |
| Warehouses | 31 | 3 | 63.56 | 3 | 67.16 | 4 | 130.55 | 1 | 65.76 | 3 | 67.34 |
| n | 217 | 4 | 3 | 3 | 2 | 4 | |||||
| Chi2 | 53.17 | 45.92 | 38.93 | 48.42 | 30.15 | ||||||
| df | 6 | 6 | 6 | 6 | 6 | ||||||
| p-value | <0.001 | <0.001 | <0.001 | <0.001 | <0.001 | ||||||
| Null Hypothesis | H0 failed to be accepted | H0 failed to be accepted | H0 failed to be accepted | H0 failed to be accepted | H0 failed to be accepted | ||||||
Appendix F. Complexity Due to End-User Influence on Design
| Parameter #21 | Parameter #22 | Parameter #23 | Parameter #24 | Parameter #25 | |||||||
| Groups (M = Median) | Sample | M | Mean Rank | M | Mean Rank | M | Mean Rank | M | Mean Rank | M | Mean Rank |
| High-rise Residential Buildings | 31 | 4 | 131.95 | 4 | 126.79 | 4 | 122.11 | 4 | 113.60 | 2 | 64.19 |
| Hotels | 31 | 4 | 106.00 | 4 | 119.77 | 3 | 110.76 | 4 | 128.65 | 3 | 120.00 |
| General Offices | 31 | 4 | 93.21 | 3 | 93.74 | 3 | 97.50 | 3 | 84.52 | 3 | 127.13 |
| Retail Buildings/Malls | 31 | 4 | 106.55 | 3 | 111.76 | 4 | 121.98 | 4 | 106.89 | 3 | 130.94 |
| Hospitals | 31 | 4 | 136.94 | 4 | 128.02 | 4 | 130.61 | 5 | 148.15 | 2 | 103.18 |
| Educational Institutions | 31 | 4 | 119.15 | 3 | 99.68 | 3 | 95.94 | 4 | 114.89 | 2 | 89.89 |
| Warehouses | 31 | 3 | 69.21 | 3 | 83.24 | 3 | 84.10 | 3 | 66.32 | 3 | 127.68 |
| n | 217 | 4 | 3 | 3 | 4 | 3 | |||||
| Chi2 | 28.74 | 14.98 | 14.5 | 37.87 | 31.6 | ||||||
| df | 6 | 6 | 6 | 6 | 6 | ||||||
| p-value | <0.001 | 0.02 | 0.025 | <0.001 | <0.001 | ||||||
| Null Hypothesis | H0 failed to be accepted | H0 failed to be accepted | H0 failed to be accepted | H0 failed to be accepted | H0 failed to be accepted | ||||||
Appendix G. Complexity Due to Construction Management Factors
| Parameter #26 | Parameter #27 | Parameter #28 | Parameter #29 | Parameter #30 | Parameter #31 | ||||||||
| Groups (M = Median) | Sample | M | Mean Rank | M | Mean Rank | M | Mean Rank | M | Mean Rank | M | Mean Rank | M | Mean Rank |
| High-rise Residential Buildings | 31 | 3 | 95.52 | 3 | 119.94 | 3 | 104.77 | 4 | 106.69 | 5 | 152.39 | 2 | 91.60 |
| Hotels | 31 | 4 | 128.03 | 3 | 125.06 | 4 | 133.24 | 4 | 139.10 | 3 | 81.29 | 4 | 128.34 |
| General Offices | 31 | 3 | 84.61 | 2 | 83.19 | 3 | 83.23 | 3 | 82.27 | 3 | 104.77 | 3 | 90.98 |
| Retail Buildings/Malls | 31 | 4 | 126.21 | 3 | 124.42 | 4 | 125.61 | 4 | 141.48 | 4 | 123.74 | 3 | 129.05 |
| Hospitals | 31 | 5 | 148.47 | 2 | 125.87 | 5 | 157.81 | 4 | 139.31 | 4 | 105.23 | 4 | 150.95 |
| Educational Institutions | 31 | 4 | 112.08 | 2 | 113.16 | 3 | 100.16 | 4 | 98.03 | 4 | 102.16 | 3 | 107.56 |
| Warehouses | 31 | 3 | 68.08 | 2 | 71.35 | 2 | 58.18 | 3 | 56.11 | 3 | 93.42 | 2 | 64.52 |
| n | 217 | 4 | 2 | 4 | 4 | 4 | 3 | ||||||
| Chi2 | 39.27 | 26.93 | 55.61 | 55.85 | 26.88 | 42.25 | |||||||
| df | 6 | 6 | 6 | 6 | 6 | 6 | |||||||
| p-value | <0.001 | <0.001 | 0.003 | <0.001 | <0.001 | <0.001 | |||||||
| Null Hypothesis | H0 failed to be accepted | H0 failed to be accepted | H0 failed to be accepted | H0 failed to be accepted | H0 failed to be accepted | H0 failed to be accepted | |||||||
Appendix H. Complexity Due to Operational Attributes
| Parameter #32 | Parameter #33 | Parameter #34 | |||||
| Groups (M = Median) | Sample | M | Mean Rank | M | Mean Rank | M | Mean Rank |
| High-rise Residential Buildings | 31 | 3 | 84.98 | 3 | 86.24 | 4 | 75.69 |
| Hotels | 31 | 4 | 134.71 | 4 | 102.53 | 5 | 135.71 |
| General Offices | 31 | 3 | 79.53 | 4 | 91.50 | 4 | 88.68 |
| Retail Buildings/Malls | 31 | 4 | 132.48 | 5 | 166.94 | 5 | 151.87 |
| Hospitals | 31 | 5 | 161.81 | 4 | 140.45 | 5 | 158.92 |
| Educational Institutions | 31 | 3 | 101.76 | 4 | 114.48 | 4 | 72.76 |
| Warehouses | 31 | 3 | 67.73 | 3 | 60.85 | 4 | 79.37 |
| n | 217 | 4 | 4 | 4 | |||
| Chi2 | 60.9 | 64.26 | 79.52 | ||||
| df | 6 | 6 | 6 | ||||
| p-value | <0.001 | <0.001 | <0.001 | ||||
| Null Hypothesis | H0 failed to be accepted | H0 failed to be accepted | H0 failed to be accepted | ||||
Appendix I. Ranking of Mean Ranks of Each of the Building Types against Design and Performance Attributes
| High-Rise Residential Buildings | Hotels | General Offices | Retail Buildings/ Malls | Hospitals | Educational Institutions | Ware Houses | |
| Parameter 1 | 7 | 6 | 2 | 5 | 4 | 3 | 1 |
| Parameter 2 | 4 | 5 | 2 | 3 | 6 | 7 | 1 |
| Parameter 3 | 3 | 6 | 4 | 7 | 5 | 2 | 1 |
| Parameter 4 | 5 | 3 | 2 | 7 | 3 | 6 | 1 |
| Parameter 5 | 6 | 5 | 2 | 7 | 4 | 3 | 1 |
| Parameter 6 | 7 | 6 | 2 | 5 | 3 | 4 | 1 |
| Parameter 7 | 5 | 7 | 2 | 6 | 4 | 3 | 1 |
| Parameter 8 | 4 | 6 | 2 | 5 | 7 | 3 | 1 |
| Parameter 9 | 2 | 5 | 3 | 6 | 7 | 4 | 1 |
| Parameter 10 | 1 | 2 | 4 | 6 | 5 | 7 | 3 |
| Parameter 11 | 3 | 4 | 6 | 7 | 5 | 2 | 1 |
| Parameter 12 | 4 | 6 | 3 | 7 | 5 | 2 | 1 |
| Parameter 13 | 4 | 7 | 2 | 6 | 3 | 5 | 1 |
| Parameter 14 | 3 | 6 | 4 | 5 | 7 | 2 | 1 |
| Parameter 15 | 5 | 7 | 2 | 4 | 6 | 3 | 1 |
| Parameter 16 | 3 | 6 | 2 | 5 | 7 | 4 | 1 |
| Parameter 17 | 2 | 6 | 3 | 5 | 7 | 4 | 1 |
| Parameter 18 | 1 | 3 | 2 | 7 | 4 | 5 | 6 |
| Parameter 19 | 7 | 6 | 5 | 3 | 4 | 2 | 1 |
| Parameter 20 | 3 | 5 | 2 | 6 | 6 | 4 | 1 |
| Parameter 21 | 6 | 3 | 2 | 4 | 7 | 5 | 1 |
| Parameter 22 | 6 | 5 | 2 | 4 | 7 | 3 | 1 |
| Parameter 23 | 6 | 4 | 3 | 5 | 7 | 2 | 1 |
| Parameter 24 | 4 | 6 | 2 | 3 | 7 | 5 | 1 |
| Parameter 25 | 1 | 4 | 5 | 7 | 3 | 2 | 6 |
| Parameter 26 | 3 | 6 | 2 | 5 | 7 | 4 | 1 |
| Parameter 27 | 4 | 6 | 2 | 5 | 7 | 3 | 1 |
| Parameter 28 | 4 | 6 | 2 | 5 | 7 | 3 | 1 |
| Parameter 29 | 4 | 5 | 2 | 7 | 6 | 3 | 1 |
| Parameter 30 | 7 | 1 | 4 | 6 | 5 | 3 | 2 |
| Parameter 31 | 3 | 5 | 2 | 6 | 7 | 4 | 1 |
| Parameter 32 | 3 | 6 | 2 | 5 | 7 | 4 | 1 |
| Parameter 33 | 2 | 4 | 3 | 7 | 6 | 5 | 1 |
| Parameter 34 | 2 | 5 | 4 | 6 | 7 | 1 | 3 |
References
- Brugger, S.; Mack, O. Cultural communication patterns: A way how management and engineering can improve their mutual understanding. In Phantom Ex Machina: Digital Disruption’s Role in Business Model Transformation; Springer International Publishing: Cham, Switzerland, 2017; pp. 37–51. [Google Scholar] [CrossRef]
- Erpen, M.L.; de Cerqueira e Souza, A.L.A.; Neumann, C.; Coelho, M.C.B. Proposed model of analysis of the perception of the relative importance of critical success factors (CSF) in the civil construction industry (CCI) using artificial neural networks (ANNs): Application in the academic universe. Gest. Prod. 2021, 28, e5712. [Google Scholar] [CrossRef]
- Chaturvedi, S.; Bhatt, N.; Rajasekar, E.; Patel, H. Assessment of Critical Causes of Conflicts for Building Construction Projects in India Using Fuzzy Analytical Network Process. J. Inst. Eng. (India) Ser. A 2021, 102, 919–941. [Google Scholar] [CrossRef]
- Dada, M.O. The influence of project team relationships on cost growth. J. Financ. Manag. Prop. Constr. 2014, 19, 76–94. [Google Scholar] [CrossRef]
- De Almeida, E.L.G.; Da Silva Feitoza, V.A.; Carvalho, M.T.M.; Piña, A.B.S.; Araújo, L.G.; Aidar, L.A.G. Study of delays in constructions: A managerial point of view of private companies in Brasilia, Brazil. Gest. Prod. 2021, 28, e5194. [Google Scholar] [CrossRef]
- Aljohani, A.; Dominic, A.-D.; David, M. Construction Projects Cost Overrun: What Does the Literature Tell Us? Int. J. Innov. Manag. Technol. 2017, 8, 137–143. [Google Scholar] [CrossRef]
- O’connor, J.T.; Asce, M.; Yang, L.-R. Project Performance versus Use of Technologies at Project and Phase Levels. J. Constr. Eng. Manag. 2004, 130, 322–329. [Google Scholar] [CrossRef]
- Elzomor, M.; Parrish, K. Investigating Building Construction Process and Developing a Performance Index. Procedia Eng. 2016, 145, 211–218. [Google Scholar] [CrossRef]
- Jarkas, A.M.; Horner, R.M.W. Creating a baseline for labour productivity of reinforced concrete building construction in Kuwait. Constr. Manag. Econ. 2015, 33, 625–639. [Google Scholar] [CrossRef]
- Eryürük, Ş.; Varolgüneş, F.K.; Varolgüneş, S. Assessment of stakeholder satisfaction as additive to improve building design quality: AHP-based approach. J. Hous. Built Environ. 2022, 37, 505–528. [Google Scholar] [CrossRef]
- Ahmed, R.; Jawad, M. Avoiding or disregarding: Exploring the relationship between scope creep, project complexity, and the success of construction projects. Proj. Leadersh. Soc. 2022, 3, 100064. [Google Scholar] [CrossRef]
- Kermanshachi, S.; Dao, B.; Shane, J.; Anderson, S. An Empirical Study into Identifying Project Complexity Management Strategies. Procedia Eng. 2016, 145, 603–610. [Google Scholar] [CrossRef]
- Hossam, H.E.; Ahmed, I.H.; Abeer, E. Factors affecting complex construction project complexity. Egypt. Int. J. Eng. Sci. Technol. 2022, 37, 24–33. [Google Scholar]
- Luo, L.; He, Q.; Xie, J.; Yang, D.; Wu, G. Investigating the Relationship between Project Complexity and Success in Complex Construction Projects. J. Manag. Eng. 2017, 33, 04016036. [Google Scholar] [CrossRef]
- Ghaleb, H.; Alhajlah, H.H.; Abdullah, A.A.B.; Kassem, M.A.; Al-Sharafi, M.A. A Scientometric Analysis and Systematic Literature Review for Construction Project Complexity. Buildings 2022, 12, 482. [Google Scholar] [CrossRef]
- Luo, L.; He, Q.; Jaselskis, E.J.; Xie, J. Construction Project Complexity: Research Trends and Implications. J. Constr. Eng. Manag. 2017, 143, 04017019. [Google Scholar] [CrossRef]
- Schalcher, H.R. Complexity in construction. In Proceedings of the 3rd International Holcim Forum 2010, Mexico City, Mexico, 14–17 April 2010; pp. 1–8. [Google Scholar]
- Müller, R.; Turner, R. Leadership competency profiles of successful project managers. Int. J. Proj. Manag. 2010, 28, 437–448. [Google Scholar] [CrossRef]
- Lo, P.; Algeo, C.; Moehler, R.C. Project Categorization Systems and Their Role for Project Portfolio Management as HR Succession Tool. 2019. Available online: https://www.researchgate.net/publication/333446663 (accessed on 6 August 2023).
- Dvir, D.; Lipovetsky, S.; Shenhar, A.; Tishler, A. In search of project classification: A non-universal approach to project success factors. Res. Policy 1998, 27, 915–935. [Google Scholar] [CrossRef]
- Shenhar, A.; Dvir, D.; Milosevic, D.; Mulenburg, J.; Patanakul, P.; Reilly, R.; Ryan, M.; Sage, A.; Sauser, B.; Srivannaboon, S.; et al. Toward a nasa-specific project management framework. EMJ-Eng. Manag. J. 2005, 17, 8–16. [Google Scholar] [CrossRef]
- Ujong, J.A.; Mbadike, E.M.; Alaneme, G.U. Prediction of cost and duration of building construction using artificial neural network. Asian J. Civ. Eng. 2022, 23, 1117–1139. [Google Scholar] [CrossRef]
- Khahro, S.H.; Ali, T.H.; Memon, N.A.; Memon, Z.A. Improving Labour Productivity: An Attribute Case Study of Building Sector Projects in Pakistan. 2016. Available online: http://www.ripublication.com (accessed on 8 December 2022).
- Abas, M.; Khattak, S.B.; Habib, T.; Nadir, U. Assessment of critical risk and success factors in construction supply chain: A case of Pakistan. Int. J. Constr. Manag. 2022, 22, 2258–2266. [Google Scholar] [CrossRef]
- Safa, M. An Advanced Construction Supply Nexus Model. Ph.D. Thesis, University of Waterloo, Waterloo, ON, Canada, 2013. [Google Scholar]
- Zamani, S.H.; Rahman, R.A.; Fauzi, M.A.; Yusof, L.M. Effect of COVID-19 on building construction projects: Impact and response mechanisms. IOP Conf. Ser. Earth Environ. Sci. 2021, 682, 012049. [Google Scholar] [CrossRef]
- Aisheh, Y.I.A. Lessons learned, barriers, and improvement factors for mega building construction projects in developing countries: Review study. Sustainability 2021, 13, 10678. [Google Scholar] [CrossRef]
- Xiao, C.; Fernandez-Solis, J.L. Are Building Construction Delivery Systems Complicated or Complex? In Proceedings of the Construction Research Congress, San Juan, Puerto Rico, 31 May–2 June 2016; pp. 1844–1854. [Google Scholar]
- Fernández-Solís, J.L. The systemic nature of the construction industry. Archit. Eng. Des. Manag. 2008, 4, 31–46. [Google Scholar] [CrossRef]
- Vidal, L.-A.; Marle, F. Understanding project complexity Implications on project management. Kybernetes 2008, 37, 1094–1110. [Google Scholar] [CrossRef]
- Baccarini, D. The concept of project complexity—A review. Int. J. Proj. Manag. 1996, 14, 201–204. [Google Scholar] [CrossRef]
- Gidado, K. Enhancing the Prime Contractors Pre-Construction planning. J. Constr. Res. 2004, 5, 87–106. [Google Scholar] [CrossRef]
- Wood, H.; Gidado, K. Project Complexity in Construction. In Proceedings of the COBRA 2008—Construction and Building Research Conference of the Royal Institution of Chartered Surveyors, Dublin, Ireland, 4–5 September 2008. [Google Scholar]
- Wood, H.L.; Piroozfar, P.; Farr, E.R.P. Understanding Complexity in the AEC Industry. In Proceedings of the 29th Annual ARCOM Conference 2013, Reading, UK, 2–4 September 2013; pp. 859–869. [Google Scholar]
- Wood, H.L.; Ashton, P. Modelling Project Complexity. In Proceedings of the 26th Annual ARCOM Conference, Leeds, UK, 6–8 September 2010; pp. 1111–1120. [Google Scholar]
- Global Alliance for Project Performance Standards (GAPPS). A Framework for Performance Based Competency Standards for Global Level 1 and 2 Project Managers. 2007. Available online: https://www.projectmanagement.com/content/attachments/Primus1_201011023434.pdf (accessed on 23 April 2024).
- Brockmann, C.; Kähkönen, K. Evaluating Construction Project Complexity. In Joint CIB International Symposium—Management of Construction: Research to Practice; Birmingham School of Built Environment: Montreal, QC, Canada, 2012; pp. 716–727. [Google Scholar]
- Kermanshachi, S.; Dao, B.; Shane, J.; Anderson, S. Project Complexity Indicators and Management Strategies—A Delphi Study. Procedia Eng. 2016, 145, 587–594. [Google Scholar] [CrossRef]
- Dao, B.; Kermanshachi, S.; Shane, J.; Anderson, S.; Hare, E. Exploring and Assessing Project Complexity. J. Constr. Eng. Manag. 2017, 143, 04016126. [Google Scholar] [CrossRef]
- Kermanshachi, S.; Safapour, E. Identification and quantification of project complexity from perspective of primary stakeholders in us construction projects. J. Civ. Eng. Manag. 2019, 25, 380–398. [Google Scholar] [CrossRef]
- Moza, A.; Paul, V.K.; Solanki, S.K. Evaluating Project Complexity in Construction Sector in India. J. Eng. Res. Sci. 2022, 1, 198–212. [Google Scholar] [CrossRef]
- Xia, B.; Chan, A.P. Measuring complexity for building projects: A Delphi study. Eng. Constr. Archit. Manag. 2012, 19, 7–24. [Google Scholar] [CrossRef]
- Tak, L.W. Classification of Building Project Complexity and Evaluation of Supervisory Staffing Patterns Using Cluster and Factor Analysis Techniques. Ph.D. Thesis, City University of Hong Kong, Hong Kong, China, 2007. [Google Scholar]
- Salim, W.N.; Sujana, C.M. Project delay analysis of highrise building project in Jakarta. IOP Conf. Ser. Earth Environ. Sci. 2020, 426, 012051. [Google Scholar] [CrossRef]
- Pantazis, E.; Gerber, D.J. Beyond geometric complexity: A critical review of complexity theory and how it relates to architecture engineering and construction. Arch. Sci. Rev. 2019, 62, 371–388. [Google Scholar] [CrossRef]
- Alshihri, S.; Al-Gahtani, K.; Almohsen, A. Risk Factors That Lead to Time and Cost Overruns of Building Projects in Saudi Arabia. Buildings 2022, 12, 902. [Google Scholar] [CrossRef]
- Ling, F.Y.Y.; Chan, S.L.; Edwin, C.; Ee, L.P. Predicting Performance of Design-Build and Design-Bid-Build Projects. J. Constr. Eng. Manag. 2004, 130, 75–83. [Google Scholar] [CrossRef]
- Santana, G. Classification of construction projects by scales of complexity. Proj. Manag. 1990, 8, 102–104. [Google Scholar] [CrossRef]
- Tan, A.Z.T.; Zaman, A.; Sutrisna, M. Enabling an effective knowledge and information flow between the phases of building construction and facilities management. Facilities 2018, 36, 151–170. [Google Scholar] [CrossRef]
- Rodrigo, M.N.N.; Perera, B.A.K.S. Selection of Nominated Subcontractors in Commercial Building Construction in Sri Lanka. In Proceedings of the MERCon 2016: Moratuwa Engineering Research Conference, Moratuwa, Sri Lanka, 5–6 April 2016; pp. 210–215. [Google Scholar]
- Lee, J.W.; Cho, K.; Hwang, T.; Han, J.Y.; Kim, T. Process for Integrating Constructability into the Design Phase in High-Rise Concrete Buildings: Focused on Temporary Work. Int. J. Concr. Struct. Mater. 2018, 12, 81. [Google Scholar] [CrossRef]
- Le-Hoai, L.; Lee, Y.D.; Nguyen, A.T. Estimating time performance for building construction projects in Vietnam. KSCE J. Civ. Eng. 2013, 17, 1–8. [Google Scholar] [CrossRef]
- Franz, B.; Molenaar, K.R.; Roberts, B.A.M. Revisiting Project Delivery System Performance from 1998 to 2018. J. Constr. Eng. Manag. 2020, 146, 04020100. [Google Scholar] [CrossRef]
- Asal, E.M. Factors Affecting Building Construction Projects’ Cost Estimating. Master’s Thesis, College of Engineering and Technology, Arab Academy for Science, Technology and Maritime Transport, Cairo, Egypt, 2014. [Google Scholar]
- Ali, M.M.; Suciana, A. The Influence of Location, Price and Service Quality On A House Purchase Decision. 2019. Available online: www.ijbmm.com (accessed on 4 February 2024).
- Shakir, R.; Sattar, F. Construction Logistics in Dense Urban Areas a Qualitative Study on the Challenges and Solutions for Construction Logistics in Dense Areas. Chalmers University of Technology, Sweden. 2022. Available online: www.chalmers.se (accessed on 4 February 2024).
- Fernandez-Solis, J.L. Building construction: A deterministic non-periodic flow-A case study of chaos theories in tracking production flow. Archit. Eng. Des. Manag. 2013, 9, 21–48. [Google Scholar] [CrossRef]
- Hamilton, C.; Kellett, J. Cost comparison of infrastructure on greenfield and infill sites. Urban Policy Res. 2017, 35, 248–260. [Google Scholar] [CrossRef]
- Dao, B.P. Exploring and Measuring Project Complexity. Ph.D. Thesis, Texas A&M University, College Station, TX, USA, 2016. [Google Scholar]
- Bjorberg, S.; Larssen, A.K.; Salaj, A.T.; Haddadi, A. Optimizing building design to contribute to value creation. In Proceedings of the IPMA 29th World Congress, Panama City, Panama, 28–30 September 2015; pp. 1–8. [Google Scholar]
- Schöttle, A.; Arroyo, P.; Christensen, R. Does your decision-making process protect customer value? In Proceedings of the IGLC 28—28th Annual Conference of the International Group for Lean Construction, Berkeley, CA, USA, 6–12 July 2020; pp. 49–58. [Google Scholar] [CrossRef]
- Zhang, L.-M.; Llu, B.-C.; Tang, Q.-H.; Wu, L.-P. The Development and Technological Research of Intelligent Electrical Building. In Proceedings of the 2014 China International Conference on Electricity Distribution (CICED), Shenzhen, China, 23–26 September 2014. [Google Scholar]
- Burmistrov, A.; Siniavina, M.; Iliashenko, O. Project Management Life Cycle Models to Improve Management in High-rise Construction. E3S Web Conf. 2018, 33, 03005. [Google Scholar] [CrossRef]
- Kempeneer, S.; Peeters, M.; Compernolle, T. Bringing the user back in the building: An analysis of ESG in real estate and a behavioral framework to guide future research. Sustainability 2021, 13, 3239. [Google Scholar] [CrossRef]
- Kermanshachi, S.; Asce, M.; Rouhanizadeh, B.; Asce, S.M.; Dao, B.; Asce, A.M. Application of Delphi Method in Identifying, Ranking, and Weighting Project Complexity Indicators for Construction Projects. J. Leg. Aff. Disput. Resolut. Eng. Constr. 2020, 12, 04519033. [Google Scholar] [CrossRef]
- Hwang, B.-G.; Zhu, L.; Ming, J.T.T. Factors Affecting Productivity in Green Building Construction Projects: The Case of Singapore. J. Manag. Eng. 2017, 33, 04016052. [Google Scholar] [CrossRef]
- Hanif. Contractor Project Organization Problems on the Implementation of Building Construction at Lhokseumawe City. IOP Conf. Ser. Mater. Sci. Eng. 2019, 536, 012101. [Google Scholar] [CrossRef]
- Tavakol, M.; Dennick, R. Making sense of Cronbach’s alpha. Int. J. Med. Educ. 2011, 2, 53–55. [Google Scholar] [CrossRef]
- Ferketich, S. Focus on Psychometrics aspects of Item Analysis. Res. Nurs. Health 1991, 14, 165–168. [Google Scholar] [CrossRef]
- Dao, B.; Kermanshachi, S.; Shane, J.; Anderson, S.; Hare, E. Identifying and Measuring Project Complexity. Procedia Eng. 2016, 145, 476–482. [Google Scholar] [CrossRef]
- Heravi, A.; Coffey, V.; Trigunarsyah, B. Evaluating the level of stakeholder involvement during the project planning processes of building projects. Int. J. Proj. Manag. 2015, 33, 985–997. [Google Scholar] [CrossRef]
- Vargha, A.; Delaney, H.D. The Kruskal-Wallis Test and Stochastic Homogeneity. J. Educ. Behav. Stat. 1998, 23, 170–192. [Google Scholar] [CrossRef]
- Chan, Y.; Walmslqr, R.P. Learning and Understanding the Kruskal-Wallis One-Way Analysis-of-Variance-by-Ranks Test for Differences among Three or More Independent Groups. 1997. Available online: https://academic.oup.com/ptj/article/77/12/1755/2633123 (accessed on 18 February 2024).
- Yong, Y.C.; Mustaffa, N.E. Analysis of factors critical to construction project success in Malaysia. Eng. Constr. Archit. Manag. 2012, 19, 543–556. [Google Scholar] [CrossRef]
- Kiel, K.A.; Zabel, J.E. Location, location, location: The 3L Approach to house price determination. J. Hous. Econ. 2008, 17, 175–190. [Google Scholar] [CrossRef]
- Spencer, A.J.; van Zyl, G. Hotel Openings: Critical Success Factors and Challenges. 2015. Afr. J. Hosp. Tour. Leis. 2015, 4, 1–20. [Google Scholar]
- Ying, Q.X.; Alias, A. Preliminary Study on the Critical Success Factors of Shopping Mall Developments in Klang Valley, Malaysia. J. Build. Perform. 2022, 13, 1–9. Available online: http://spaj.ukm.my/jsb/index.php/jbp/index (accessed on 6 July 2024).
- Mukhtar, M.M.; Amirudin, R.B.; Sofield, T.; Mohamad, I.B. Critical success factors for public housing projects in developing countries: A case study of Nigeria. Environ. Dev. Sustain. 2017, 19, 2039–2067. [Google Scholar] [CrossRef]
- Zainal, R.; Al-Tawil, Y.M.; Kasim, N.; Musa, S.M.; Mohammed, M. Success Factor for Project Management on High Rise Building Project. J. Technol. Manag. Bus. 2019, 6, 50–059. [Google Scholar] [CrossRef]
- Veseli, A. Assessment of Critical Success Factors for Strategic Planning: A Case Study of the Residential Construction Company in Kosovo. İş Ve İnsan Derg. 2020, 7, 171–187. [Google Scholar] [CrossRef]
- Graham, R. Analysing the advantages of early contractor involvement. Int. J. Procure. Manag. 2014, 7, 661–676. [Google Scholar]
- Sødal, A.H. Early Contractor Involvement: Advantages and Disadvantages for the Design Team. Master’s Thesis, Institutt for bygg, anlegg og transport, Norwegian University of Science and Technology (NTNU), Trondheim, Norway, 2014. [Google Scholar]
- Anastasiadou, P.; Sarantakou, E.; Maniati, E.; Tsilika, E. Exploring Stakeholders’ Perspectives on Hotel Design. In Springer Proceedings in Business and Economics; Springer: Cham, Switzerland, 2022; pp. 239–255. [Google Scholar] [CrossRef]
- Marais, M.; du Plessis, E.; Saayman, M. A review on critical success factors in tourism. J. Hosp. Tour. Manag. 2017, 31, 1–12. [Google Scholar] [CrossRef]
- Gyurácz-Németh, P.; Friedrich, N.; Clarke, A. Innovation in Special Hotels-as a Key to Success. In Proceedings of the Management Knowledge and Learning International Conference, Zadar, Croatia, 19–21 June 2013; pp. 19–21. [Google Scholar]
- Çavka, H.B. An Investigation of Shopping Mall Design Requirements. Eng. Proc. 2023, 53, 42. [Google Scholar] [CrossRef]
- Kharat, M.G.; Chikhalkar, R.D.; Jha, M.K.; Kharat, M.G. Identification and ranking the significant factors influencing customer experience for shopping malls in the Indian context. Int. J. Indian Cult. Bus. Manag. 2020, 21, 340–368. [Google Scholar] [CrossRef]
- Kushwaha, T.; Ubeja, S.; Chatterjee, A.S. Factors Influencing Selection of Shopping Malls: An Exploratory Study of Consumer Perception. Vision 2017, 21, 274–283. [Google Scholar] [CrossRef]
- Pilosof, N.P. Building for Change: Comparative Case Study of Hospital Architecture. Health Environ. Res. Des. J. 2021, 14, 47–60. [Google Scholar] [CrossRef]
- Moslehian, A.S.; Kocaturk, T.; Andrews, F.; Tucker, R. The nature of innovation in hospital building design: A mixed grounded theory study. Constr. Innov. 2023, 23, 792–814. [Google Scholar] [CrossRef]
- Pandey, A.K.; Dixit, S.; Bansal, S.; Saproo, S.; Mandal, S.N. Optimize the Infrastructure Design of Hospital Construction Projects to Manage Hassle Free Services. Int. J. Civ. Eng. Technol. (IJCIET) 2017, 8, 87–98. Available online: https://iaeme.com/Home/journal/IJCIET (accessed on 16 July 2024).
- Juntunen, V. Characteristics of Structural Design in Hospital Construction. Master’s Thesis, Tampere University, Tampere, Finland, 2022. [Google Scholar]
- Pikas, E.; Koskela, L.; Sapountzis, S.; Dave, B.; Owen, R.B. Overview of building information modelling in healthcare projects. In Global Health Infrastructure-Challenges for the Next Decade: Delivering Innovation, Demonstrating the Benefits; HaCIRIC-Health and Care Infrastructure Research and Innovation Centre: Salford, UK, 2011; pp. 286–298. [Google Scholar]
- Franz, B.W.; Leicht, R.M.; Riley, D.R. Project Impacts of Specialty Mechanical Contractor Design Involvement in the Health Care Industry: Comparative Case Study. J. Constr. Eng. Manag. 2013, 139, 1091–1097. [Google Scholar] [CrossRef]
- Okolie, K. Performance Evaluation of Buildings in Educational Institutions: A Case of Universities. Ph.D. Thesis, Nelson Mandela Metropolitan University, Port Elizabeth, South Africa, 2011. [Google Scholar]
- Helber, S.; Böhme, D.; Oucherif, F.; Lagershausen, S.; Kasper, S. A Hierarchical Facility Layout Planning Approach for Large and Complex Hospitals. Flex. Serv. Manuf. J. 2016, 28, 5–29. [Google Scholar] [CrossRef]
- Malec, T.E. Modern Shopping Malls in the USA and Europe. ACE-Archit. Civ. Eng. Environ. 2010, 3, 15–24. [Google Scholar]
- Fernando, D.J.; Dissanayake, P.; Naiduwa-Handi, C.; Weerainghe, A.S. Key Performance Indicators for Measuring the Performance of Facilities Management Services in Hotel Buildings: A Literature Review. 2018. Available online: https://www.researchgate.net/publication/326826963 (accessed on 16 July 2024).
- Buehring, J.; O’Mahony, B. Designing memorable guest experiences: Development of constructs and value generating factors in luxury hotels. J. Hosp. Tour. Insights 2019, 2, 358–376. [Google Scholar] [CrossRef]

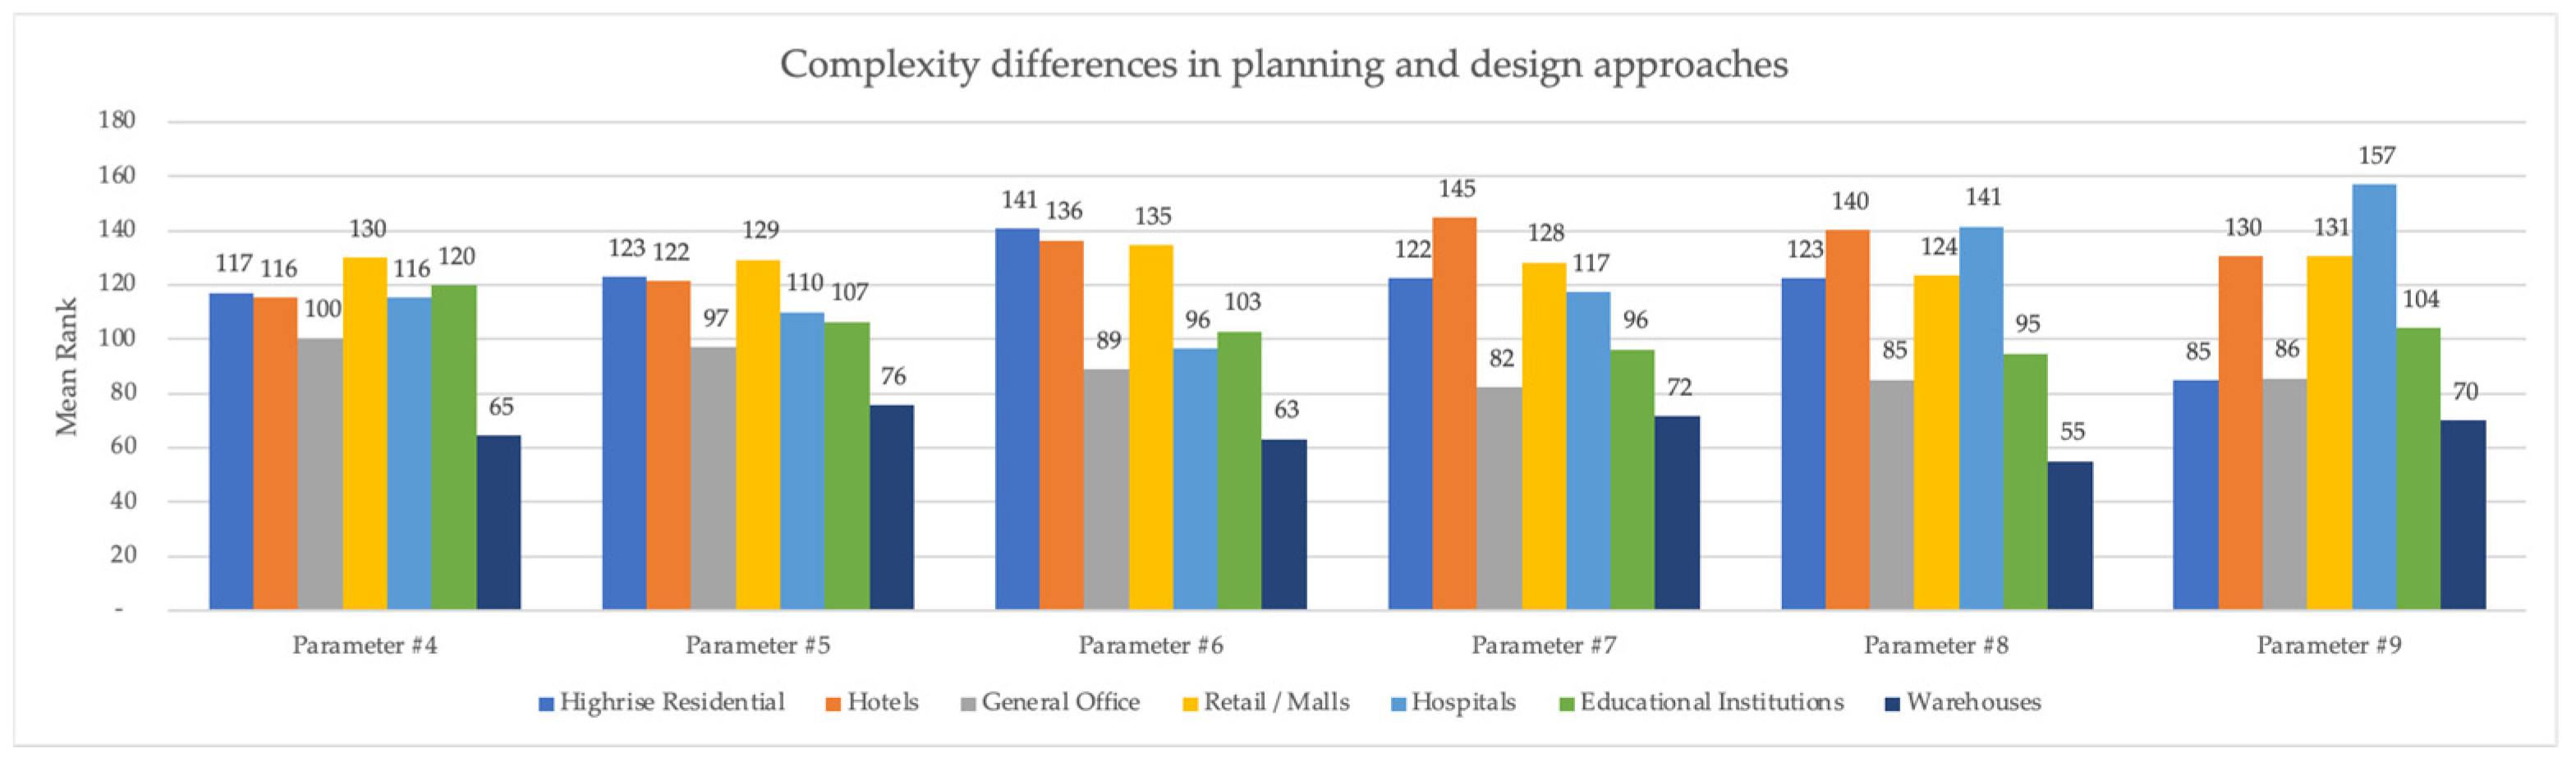
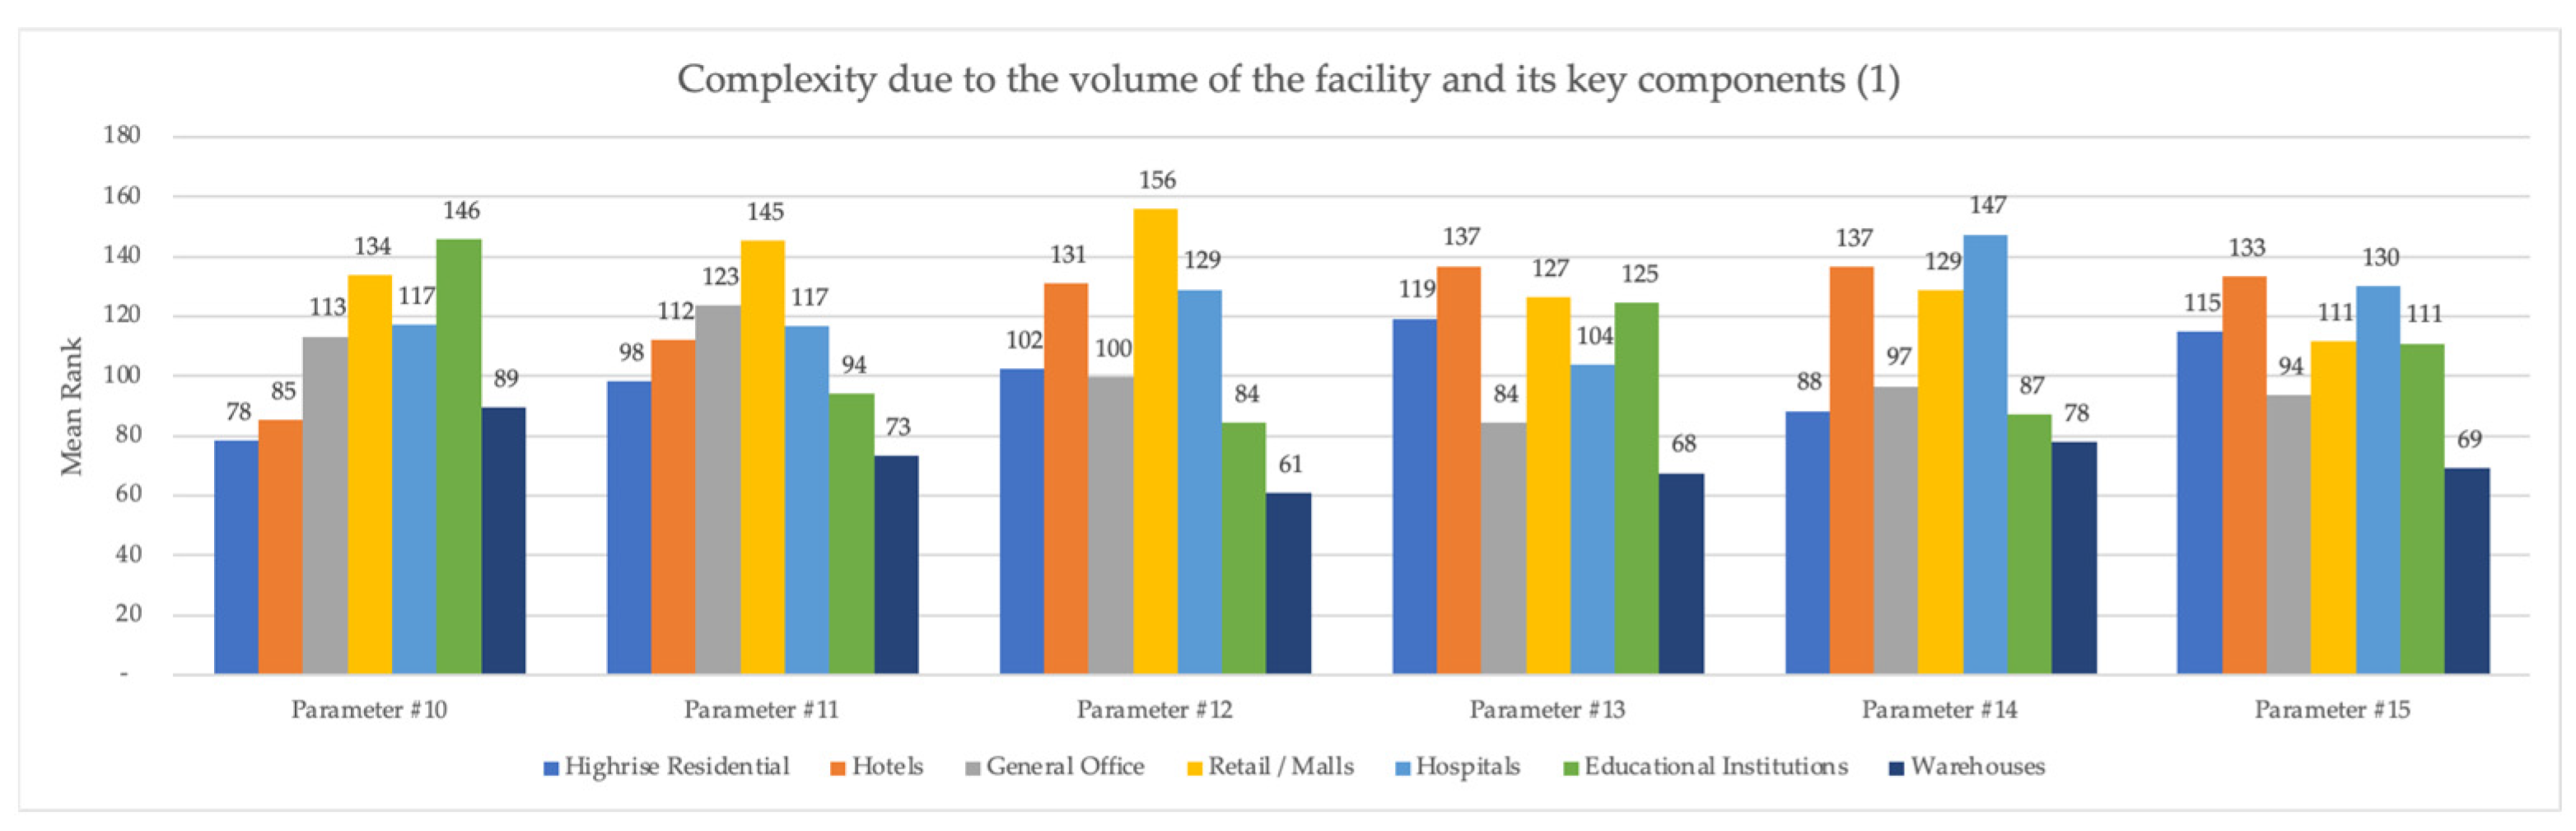
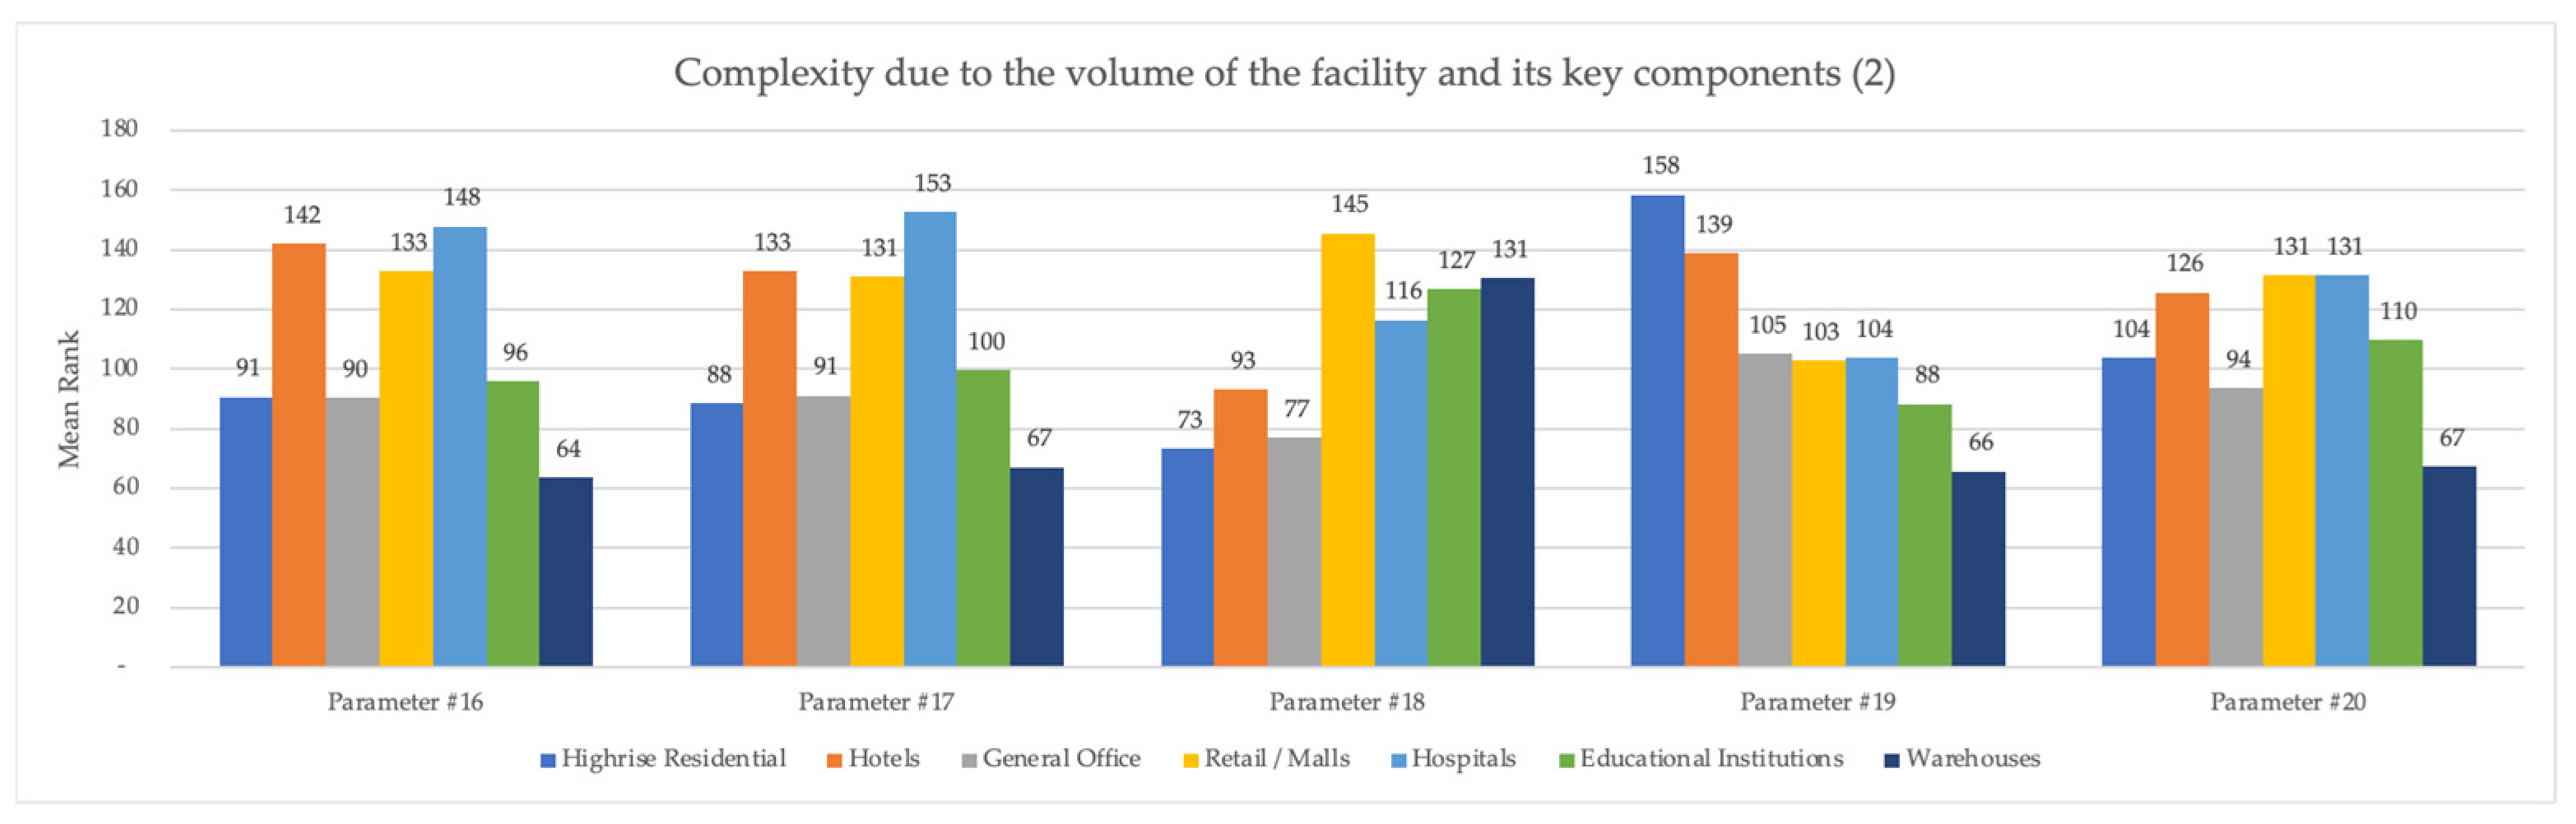
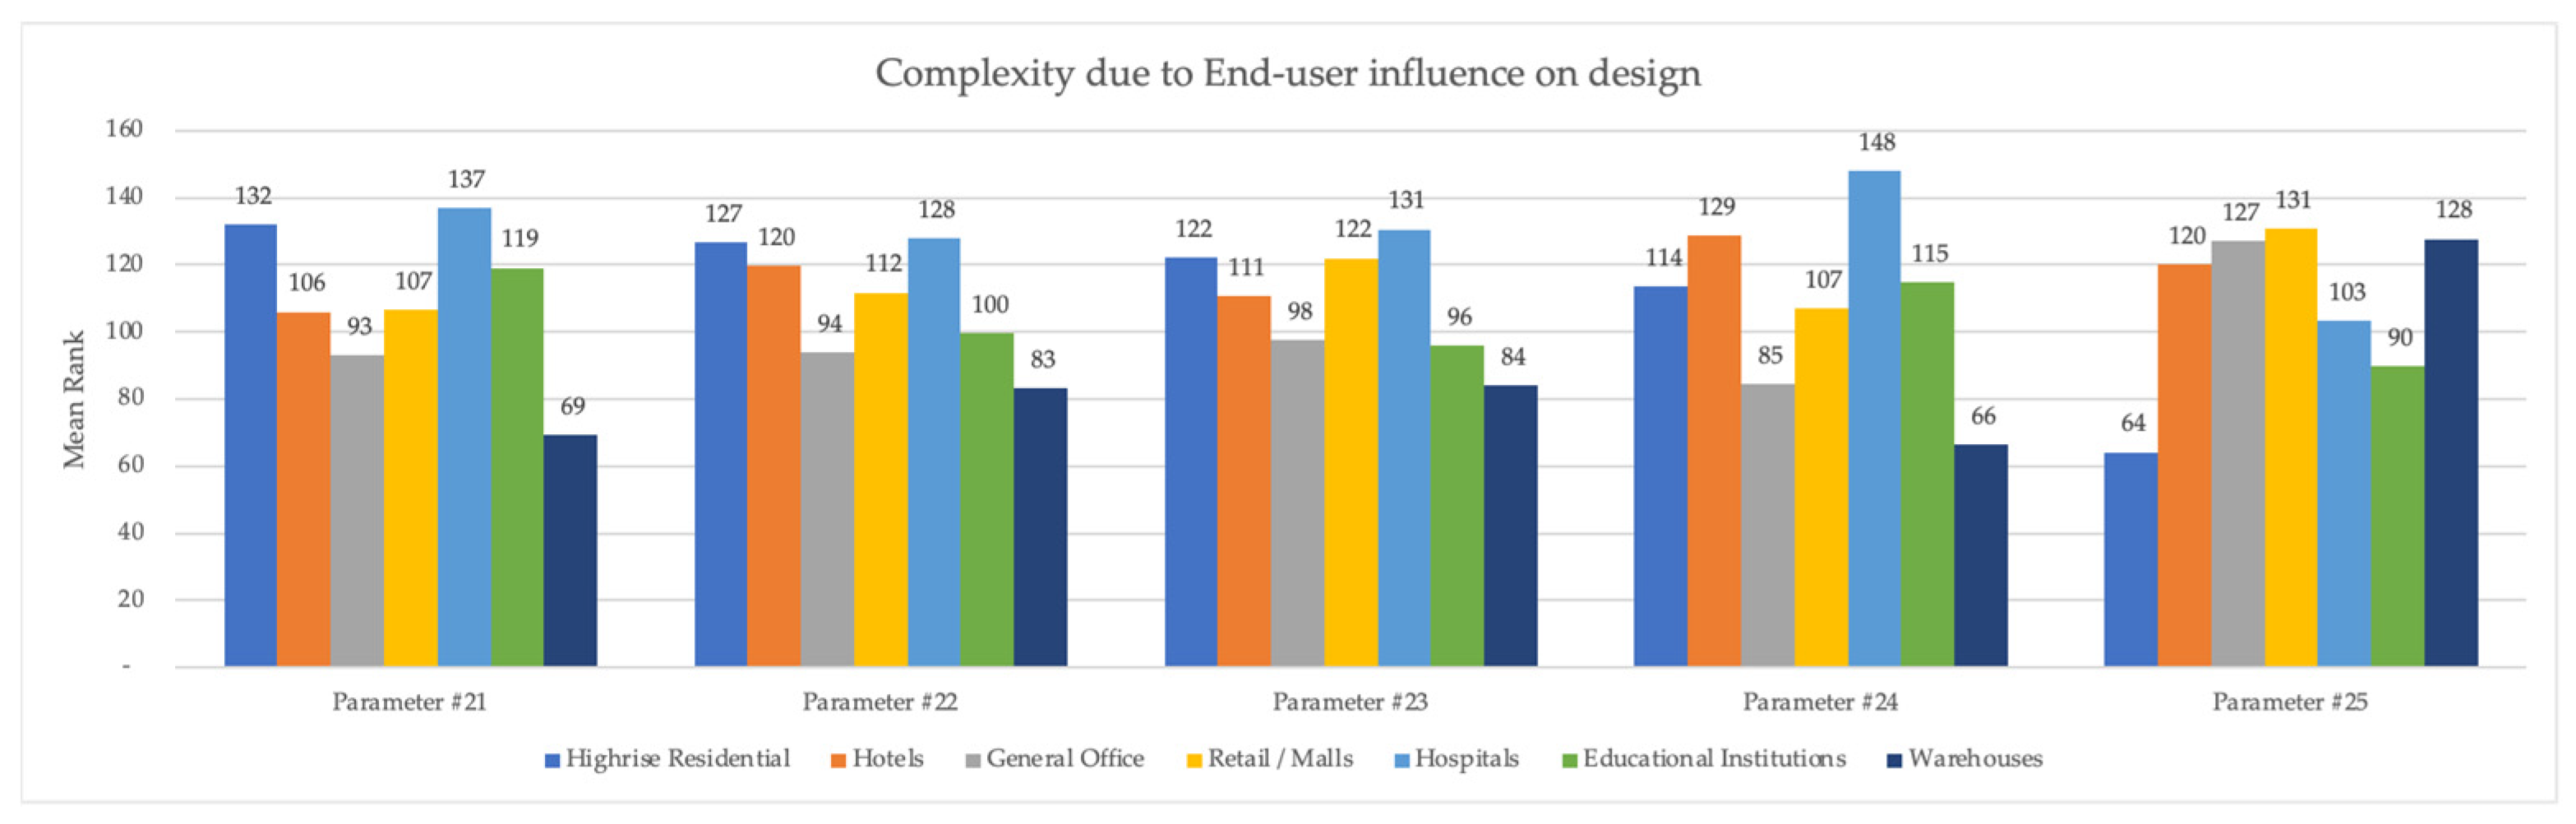

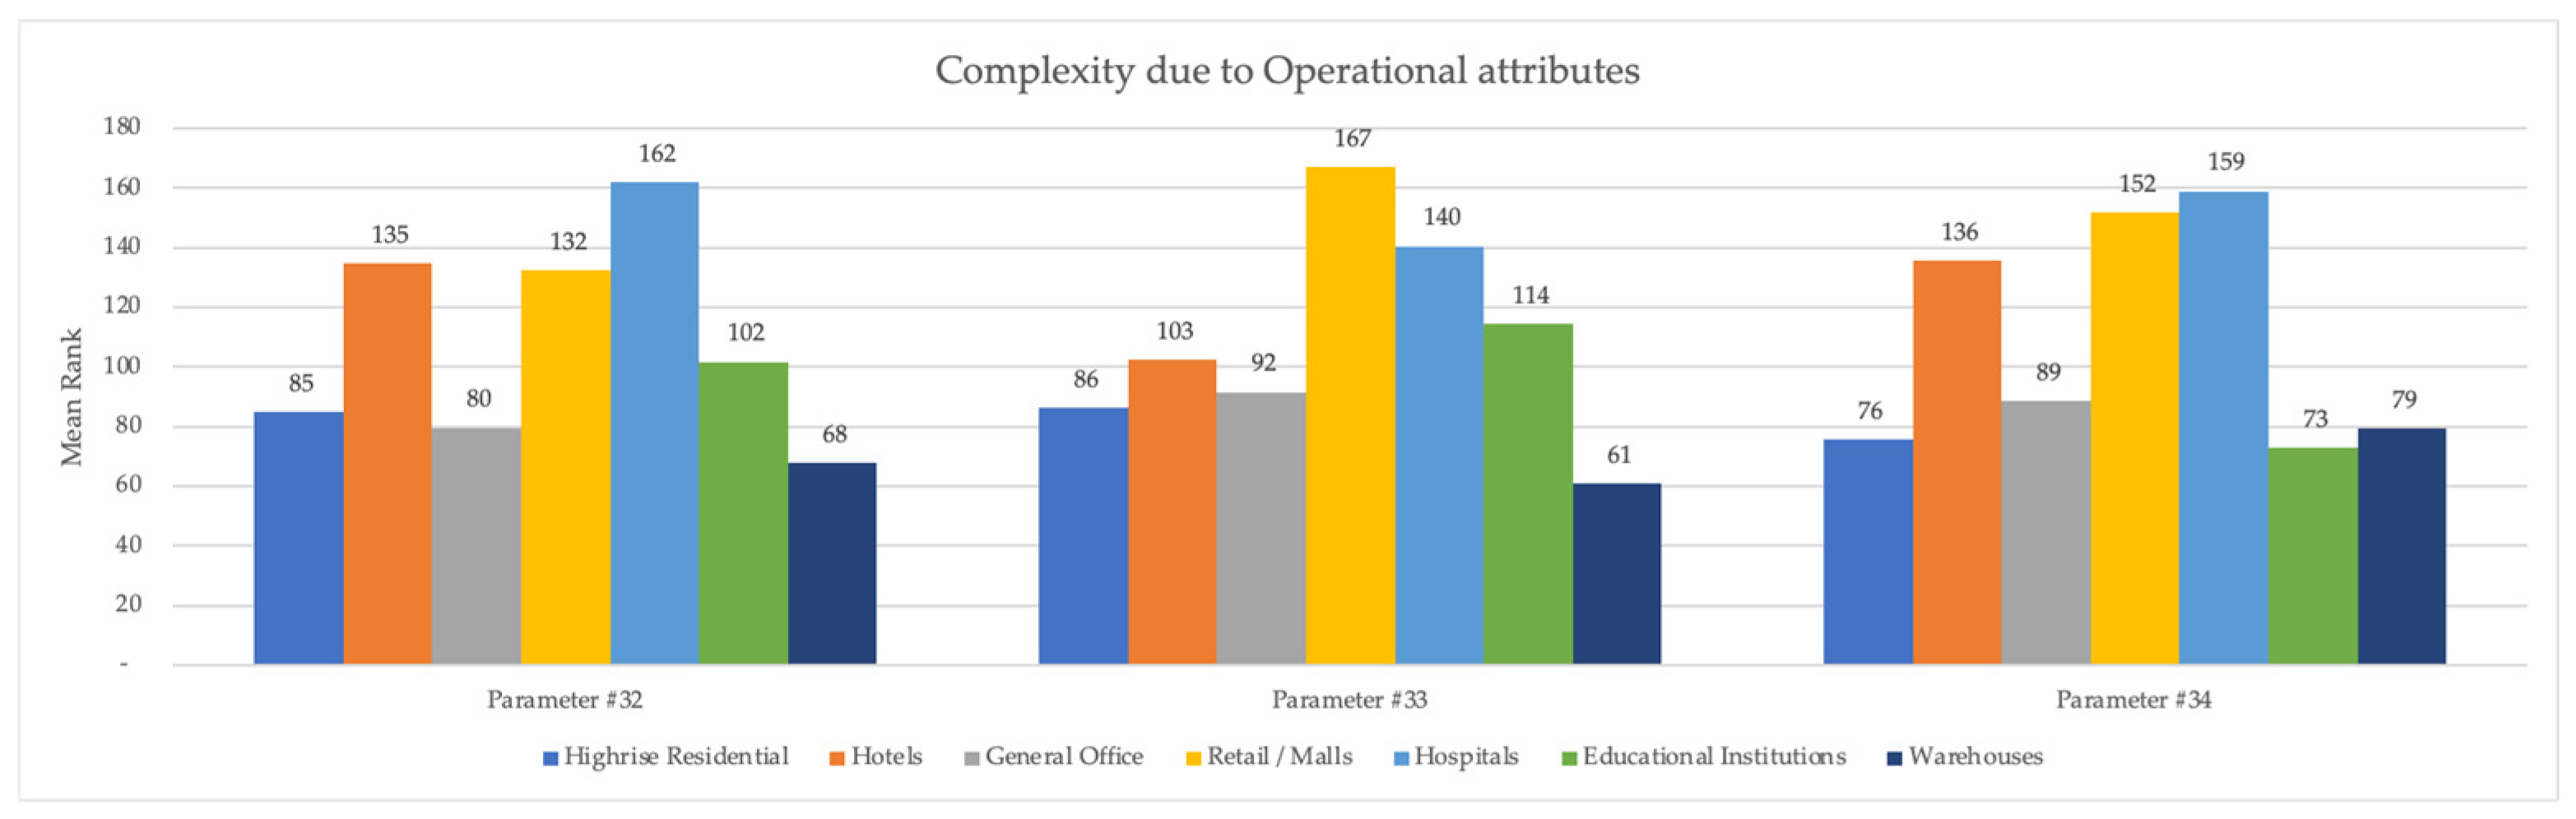
Disclaimer/Publisher’s Note: The statements, opinions and data contained in all publications are solely those of the individual author(s) and contributor(s) and not of MDPI and/or the editor(s). MDPI and/or the editor(s) disclaim responsibility for any injury to people or property resulting from any ideas, methods, instructions or products referred to in the content. |
© 2024 by the authors. Licensee MDPI, Basel, Switzerland. This article is an open access article distributed under the terms and conditions of the Creative Commons Attribution (CC BY) license (https://creativecommons.org/licenses/by/4.0/).