Abstract
This study investigates the skid resistance performance of asphalt mixtures containing composite aggregates of basalt and limestone. The research aimed to predict the service life of the asphalt mixtures and identify the optimal basalt content for enhanced performance. Using an accelerated friction tester, friction indices such as the British pendulum number (BPN), mean texture depth (MTD), and dynamic friction coefficient (Dµ) were measured. The study conducted accelerated wear tests on mixtures with varying basalt contents under different water flow rates and loads. Results indicate that anti-skid performance decreased with increasing water flow, load, and wear cycles, initially showing a sharp decline followed by a gradual stabilization. Orthogonal experiments determined that basalt content had the most significant impact on skid resistance, followed by load and water flow rate. By converting skid resistance and MTD values into IFI values, a four-area diagram was created to illustrate skid resistance deterioration. The four-area IFI diagram also demonstrated that higher basalt content significantly enhances the skid resistance and service life of asphalt mixtures. Cost analysis based on life prediction showed that a 40% basalt content mixture is cost effective while maintaining excellent skid resistance. A test section study further validated that a 40% basalt content ensures good skid resistance, with indoor test predictions aligning closely with field data. Although the test section has been operational for only two years, ongoing monitoring will provide further insights into long-term skid resistance performance.
1. Introduction
In years of operation and management, it has been found that the loss of skid resistance in asphalt road surfaces is the most common defect in mountainous roads. On these road segments, the risks associated with driving increase with the decrease in skid resistance of road surfaces. In southwest China, where rainfall is abundant, the lateral friction coefficient of road surfaces decreases, leading to greater driving safety risks caused by skid resistance. Meanwhile, road surface structures that are mainly composed of limestone often experience rapid deterioration in skid resistance. According to statistical data from routine inspections of ordinary national and provincial highways in Guizhou province, China, the unqualified rate of skid resistance coefficients of newly opened highways exceeds 80% within six months of operation. The insufficient skid resistance caused by road materials is receiving increasing attention [1]. The commonly used limestone aggregates have advantages, such as abundant production and low prices, and have been widely used in both asphalt pavement surface layers [2] and base courses [3]. It was found to have a good bonding with asphalt [4], so it can be used in a sealing layer when working with asphalt [5]. However, on asphalt pavement surfaces, the lithology of coarse aggregates has a significant impact on the wear behavior of macrotextures, and limestone coarse aggregates lead to relatively low polishing resistance [3].
Besides limestone, basalt is another common type of aggregate used in highway construction and suitable for high-grade roads. Compared with limestone asphalt mixtures, basalt asphalt mixtures have better resistance to rutting and skidding [4,5]. In contrast, the mechanical properties of limestone are lower than those of basalt. When used as aggregate in asphalt pavement, limestone is prone to polishing under the action of high-speed and heavy-duty vehicles, resulting in poor long-term skid resistance [6,7,8]. Altan Yılmaz [9] conducted tests on basalt aggregates and compared them with current particle material quality standards. Their results show that basalt aggregates performed well in engineering properties, with high impact resistance and low flatness rate. Compared with limestone, basalt aggregates exhibited better performance in freeze–thaw durability, micro-Deval abrasion, and aggregate impact value [10,11]. Basalt can significantly improve the mechanical properties and aging resistance of asphalt mixtures [12].
Many scholars have studied the properties of mixtures using basalt and limestone in combination. Studies on the ratio of basalt to limestone in asphalt pavements have shown that a reasonable ratio of basalt to limestone can significantly improve the performance of asphalt pavements [13]. Erol İskender [14] investigated the long-term rutting resistance performance of basalt aggregates with the inclusion of limestone aggregates as fine aggregates or filler SMA mixtures. Dezhi Kong et al. [15] proposed and studied two synthesis methods of using basalt and limestone together: the coarse–fine (C–F) synthesis method and the coarse–coarse (C–C) synthesis method. Their results show that the addition of composite aggregates changes the volumetric properties of composite asphalt mixtures. Asi Ibrahim et al. [16] investigated the possibility of improving the performance of local asphalt concrete mixtures by partially replacing commonly used limestone aggregates with basalt. Their results indicate that the optimal mixture consists of basalt coarse aggregates and limestone fine aggregates. Guangji Xu et al. [8] determined the optimal asphalt content for the mixture of limestone and basalt PAC-16, and obtained its temperature stability, water stability, and permeability. Through experiments, it was found that basalt aggregates can replace limestone aggregates larger than 13.2 mm while ensuring the strength of the aggregate skeleton.
The combination and use of basalt and limestone have great potential to enhance the skid resistance of road surfaces. Mineral composition, shape indices, and gradation are crucial to the skid resistance of asphalt mixtures [17,18]. Different combinations of coarse aggregates and asphalt can significantly improve the skid resistance and durability of roads [19]. Furthermore, different proportions of components in a composite aggregate may change the macro texture [20,21]; therefore, the proportion of basalt and limestone is also of significance. Lin et al. [22] conducted polishing and skid resistance tests on asphalt slabs made of limestone, basalt, and mixed sand fine aggregates, finding that the angle of fine aggregates significantly affects skid resistance at the macro-texture level. Burak Sengoz et al. [23] evaluated the formation of dense graded mixtures using two different types of mineral aggregates (basalt and limestone) through sand patch tests, three-dimensional laser scanning, and dynamic friction tests, and found that, compared with limestone aggregates, basalt aggregates demonstrate higher friction values.
However, existing research lacks investigation on skid resistance under the combined use of limestone and basalt as coarse aggregates. Furthermore, studies on the deterioration of skid resistance of the asphalt mixture with composite aggregates are rare. The skid resistance performance of a pavement is tested after construction, but the performance at the initial service stage of the pavement does not fully represent the long-term skid resistance of asphalt pavements [24], because the skid resistance indicators of some asphalt pavements quickly deteriorate to below the standard requirements after a period of vehicle load [25]. Therefore, it is crucial to study the long-term skid resistance of pavements.
In recent years, accelerated polishing testing (APT) has become a primary tool for evaluating the long-term skid resistance performance of pavements [19,25,26,27,28,29]. Wu et al. [30] used accelerated polishing and testing procedures and conducted laboratory evaluations of 12 types of wearing course mixtures, including dense-graded and open-graded mixtures with different aggregate sources. Their study considered both micro and macro texture characteristics and focused on the long-term friction properties of typical wearing courses in Louisiana. A.M. Dunford et al. [31] used an accelerated polishing machine to simulate aggregate service times and measured the three-dimensional surface texture of aggregates at five friction levels. Their results show that the roughness parameters measured by the accelerating test method could accurately reflect the texture level of aggregates, thereby assessing their long-term skid resistance.
The novelties of this study are as follows. First, the skid resistance property of an asphalt mixture made with composite aggregates of basalt and limestone was investigated. Second, accelerated polishing tests were carried out using an APT facility, and long-term skid resistance was predicted and partially validated on a test section.
The contents and steps of this study are as follows. Accelerated polishing tests were carried out using an APT facility, and long-term skid resistance was predicted and partially validated on a test section. The contents of the paper are as follows. First, skid resistance tests were performed on asphalt mixtures with composite aggregates. Skid resistance was evaluated by British pendulum number (BPN), mean texture depth (MTD), and dynamic friction coefficient (Dµ). Second, the International Friction Index (IFI) was used as an indicator to describe the degradation pattern of skid resistance of mixtures containing composite aggregates. Third, the service life of mixtures containing composite aggregates was predicted, based on which the optimum basalt content was chosen in combination with a cost analysis. Finally, a test section was paved according to the selected optimal basalt content, and the long-term skid resistance performance degradation was partially validated. This study provides further understanding of the use of basalt and limestone combinations to enhance material wear resistance and extend the service life of pavements.
2. Materials and Experiments
2.1. Materials
2.1.1. Limestone and Basalt Aggregates
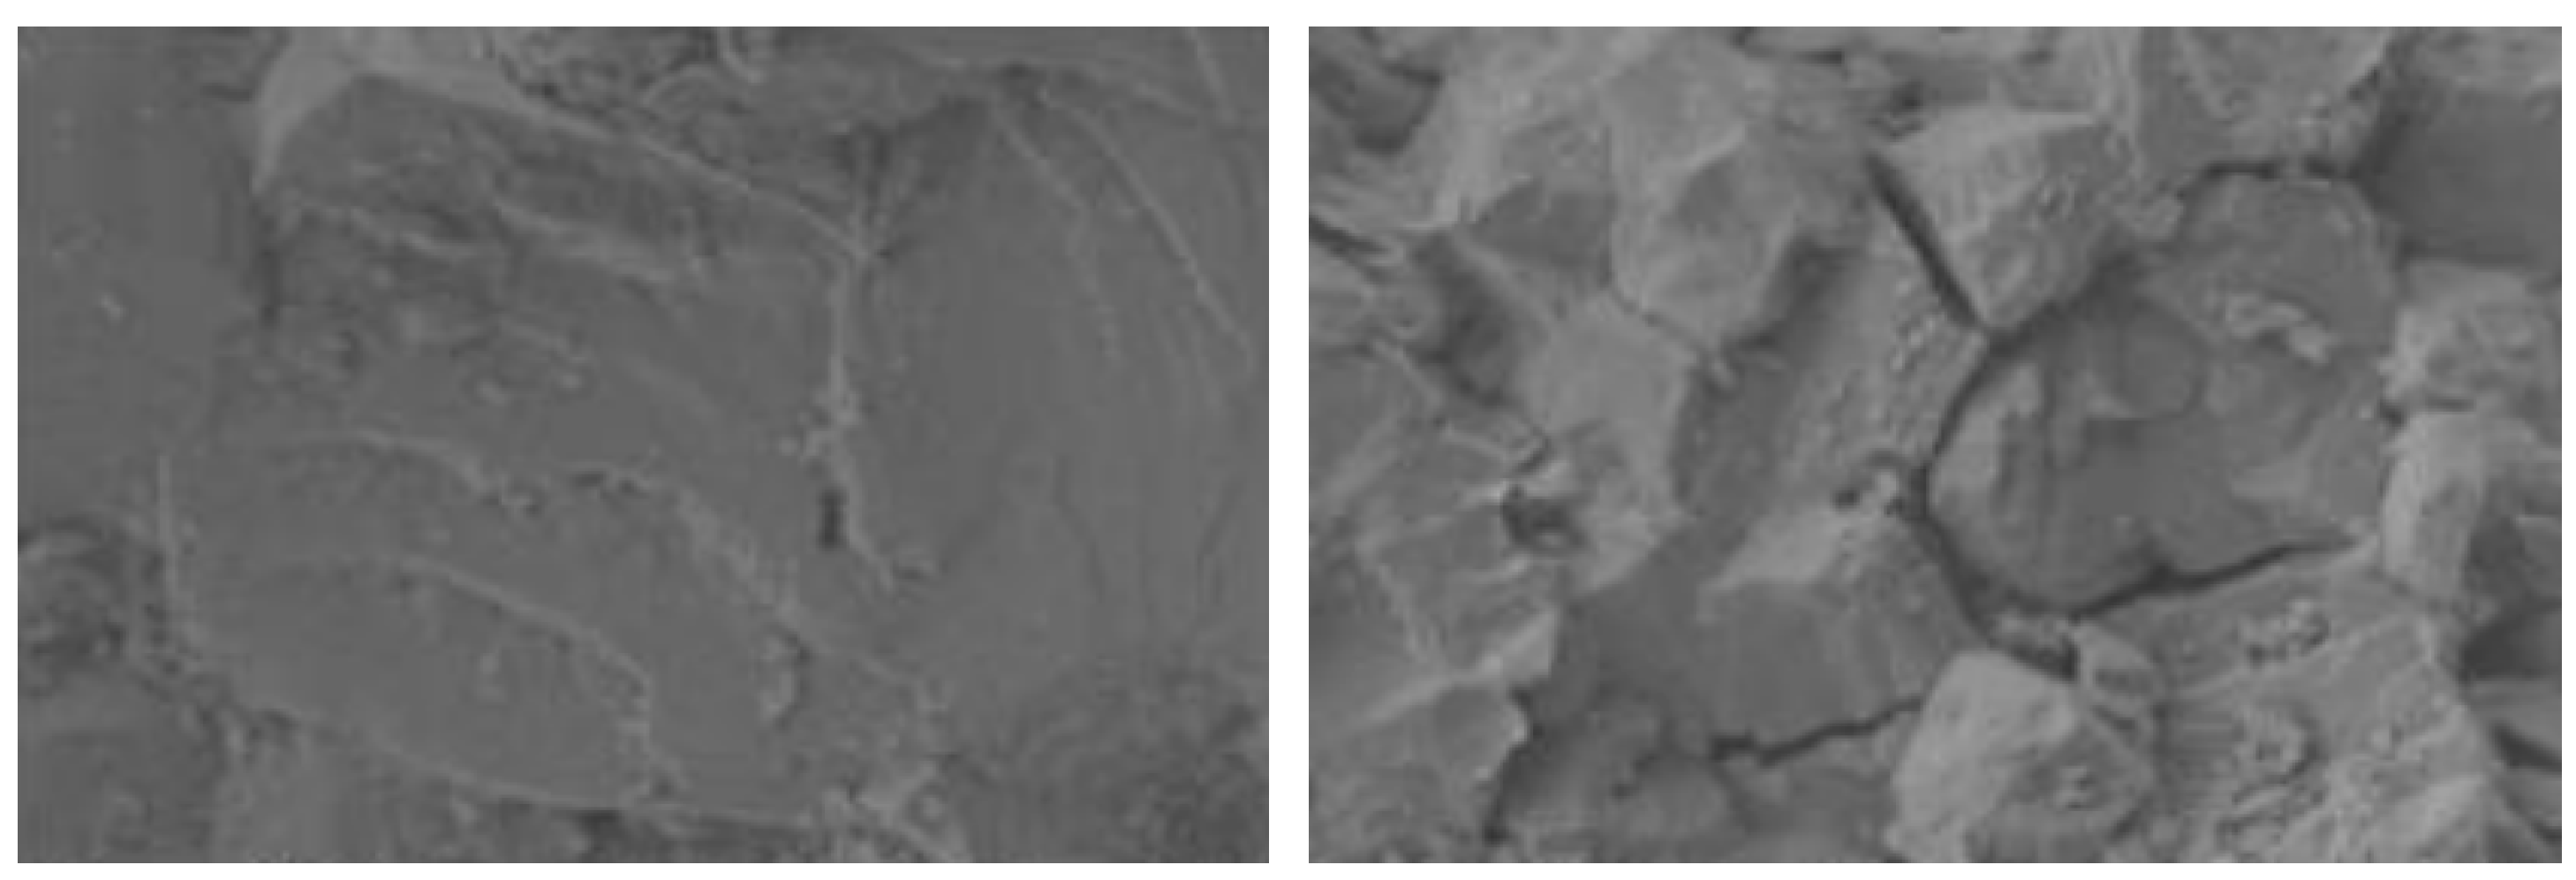
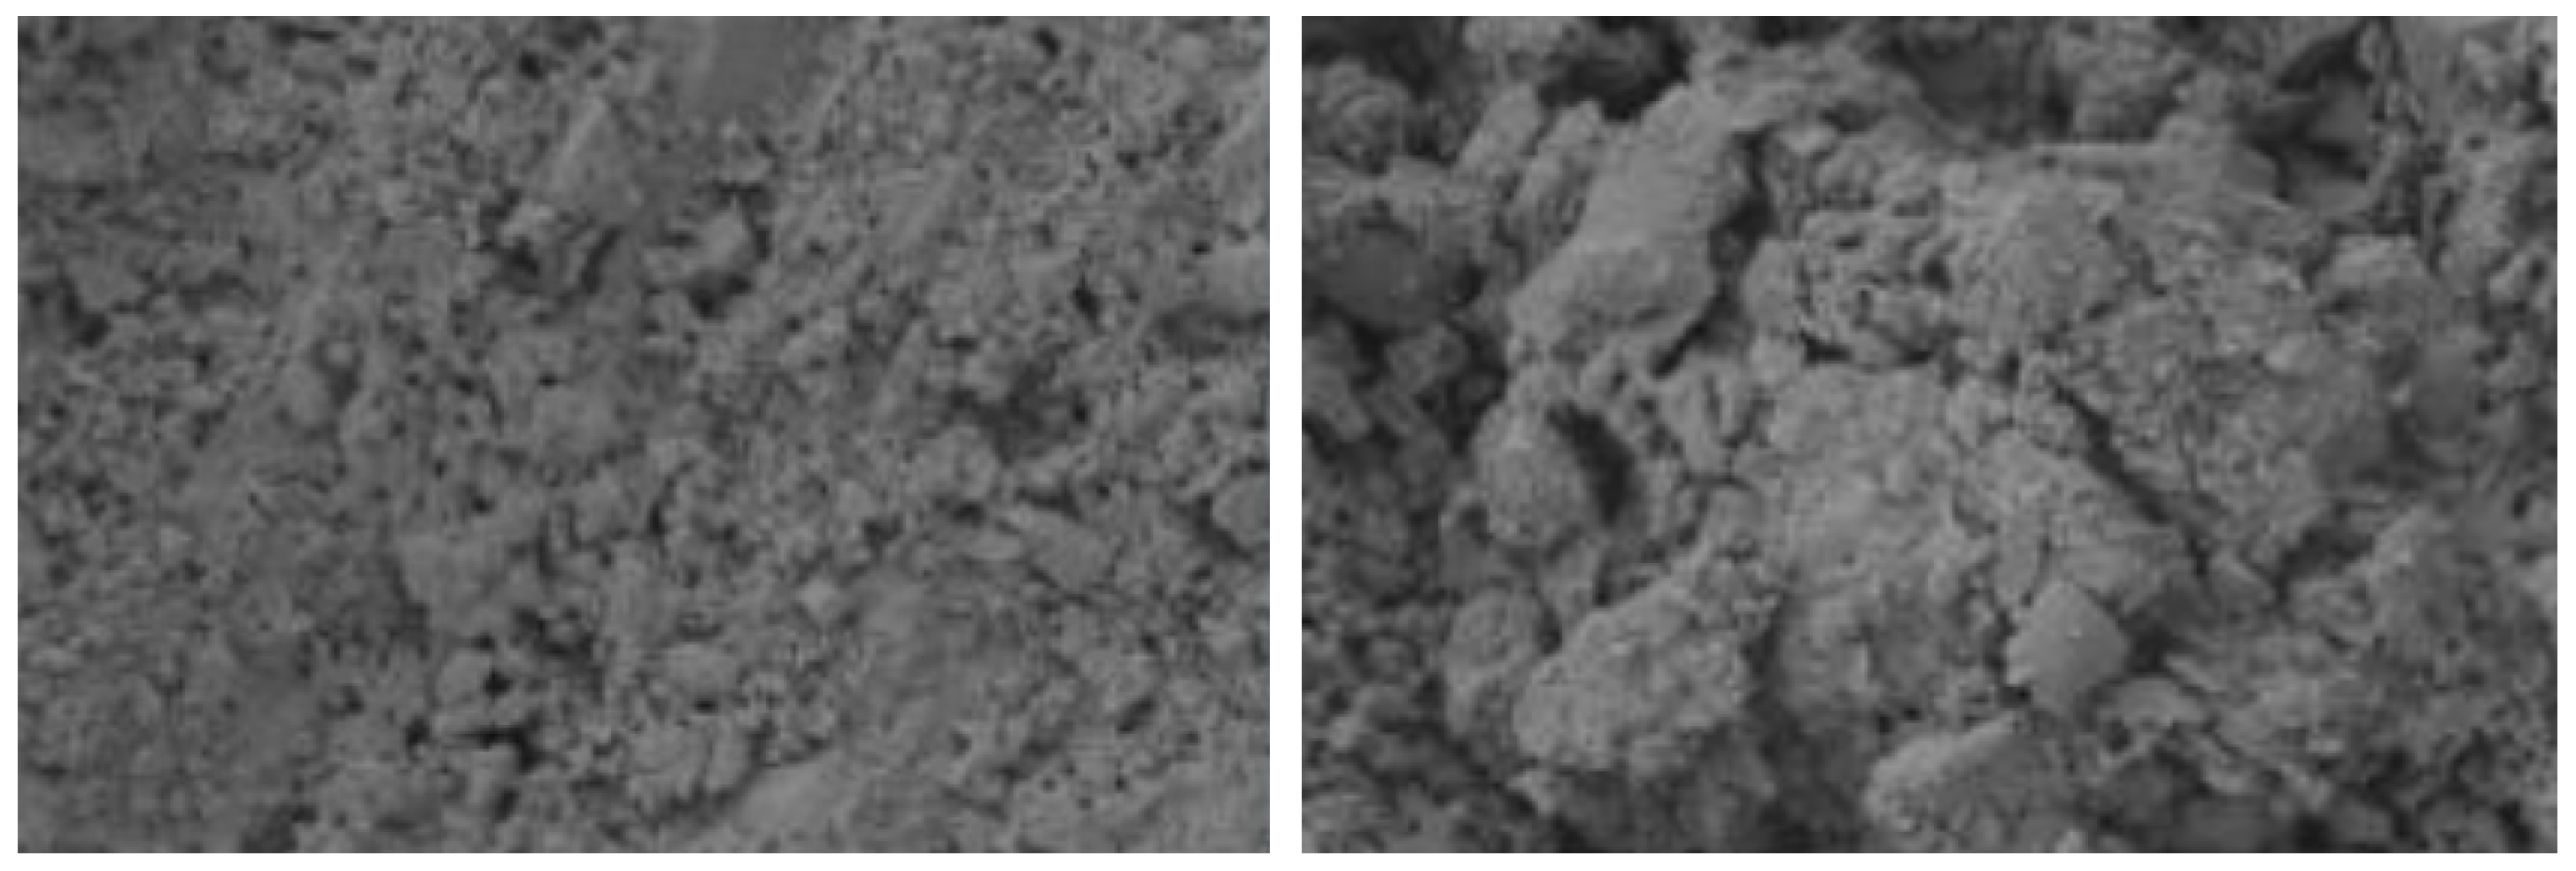
The limestone and basalt aggregates used in the experiment were provided by Anshun Highway Construction and Maintenance Co., Ltd, and are all sourced from Anshun city, Guizhou province, China. A scanning electron microscope (SEM) was used to observe the limestone and basalt in detail (Figure 1).

Figure 1.
Limestone SEM microstructure.
It can be seen in Figure 1 that The surface of limestone crystals is relatively smooth, and the crystal form of its main component, calcite, is relatively complete, with interlocking crystal arrangements observable. However, the particles exhibit a porous structure, resulting in SEM images that show numerous gaps and dispersed structural distribution with microcracks between structures (Figure 2).
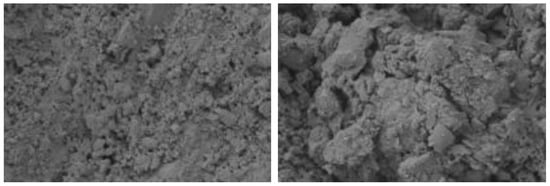
Figure 2.
Basalt SEM microstructure.
In contrast, basalt has a denser structure with a high surface roughness, featuring irregular concave and convex patterns, as shown in Figure 2. The interior of the basalt contains a small amount of granular crystals. Basalt mainly consists of plagioclase, pyroxene, and a small amount of quartz. Compared with limestone, basalt has a higher density, fewer voids on the matrix surface, and thus a higher strength.
The aggregate particle characteristics related to skid resistance include technical indicators such as aggregate density and water absorption, abrasion value, aggregate solidity, etc., as shown in Table 1.
The aggregate solidity test involves soaking aggregate samples in a sodium sulfate solution, then drying them, and repeating this process several times to simulate freeze–thaw cycles. The test measures the mass loss of the aggregates to evaluate their durability. This is similar to ASTM C88 [32]. The adhesion test used 70 penetration grade bitumen to assess the adhesion between aggregate and bitumen with the boiling method. We observed the degree of bitumen film detachment in water to evaluate adhesion, which is typically categorized into five grades. This is similar to ASTM D36 [33]. PSV was tested by first polishing specimens with a standard wheel for 57,600 turns, then the results were measured with a pendulum friction tester and expressed as PSV. This is similar to ASTM E303 [34].

Table 1.
Aggregate particle characteristics.
Table 1.
Aggregate particle characteristics.
| Performance | Technical Requirements | Measured Values of Limestone | Measured Values of Basalt | Standard |
|---|---|---|---|---|
| Apparent relative density | ≥2.45 | 2.8 | 2.823 | JTG E42-2005 [35] |
| Bulk volume relative density | - | 2.705 | 2.839 | JTG E42-2005 [35] |
| Aggregate water absorption | ≤3.0% | 1.36% | 0.75% | JTG E42-2005 [35] |
| Los Angeles abrasion loss | ≤35% | 14.5% | 6.8% | JTG E42-2005 [35] |
| Uniaxial compressive strength, MPa | - | 97.7 | 217.4 | JTG E41-2005 [36] |
| Aggregate solidity | - | 0.3% | 0.2% | JTG E42-2005 [35] |
| Aggregate adhesion grade (stripping ratio) | - | Level 5 (0%) | Level 4 (<10%) | JTG E20-2011 [37] |
| Polished stone value | - | 57.1 | 42.5 | JTG E42-2005 [35] |
2.1.2. Asphalt, Fine Aggregate, and Mineral Powder
Asphalt, fine aggregate, and mineral powder are provided by Guizhou Xiuwen Xinhengda Asphalt Mixing Plant Co., Ltd., Guiyang, China. The dosage and type of asphalt affect the skid resistance performance of road surfaces. China’s climate zone is characterized by hot summers, mild winters, and high humidity. Therefore, the grade 70 matrix asphalt used in the experiment can meet the design and usage requirements. Its main technical indicators are as follows: the apparent relative density of fine aggregate is 2.680, the water absorption rate is 0.863%, and the sand equivalent is 87%. The mineral powder used in the experiment is limestone rock powder. The test results indicate that the apparent relative density is 2.706 g/cm3, and the hydrophilic coefficient is 0.84. The hydrophilic/hydrophobic properties of mineral fillers were determined by the ratio of sedimentation of the different fractions in water and paraffin. If they have hydrophobic properties, fillers generate a strong interaction when mixed with bitumen. The tested hydrophilic coefficient of less than 1 indicates a greater affinity for asphalt than for water. No agglomeration or blockage phenomenon is observed, and there is no alteration in heating stability. The sieving results show a passing rate of 89.2% for a 0.15 mm sieve.
2.1.3. Mix proportion design
In this study, the basalt content was set to 35%, 40%, and 45% for three schemes, with additional pure limestone and pure basalt groups as control schemes. The schemes are shown in Table 2.
Table 2.
Schemes 1–5.
It is noted that the basalt proportion selected is around 40%. This selection is based on the abrasion loss results and crushing value results. Under the same number of polishing cycles, the abrasion loss rate decreases gradually with the increase in basalt content. However, for mixed aggregates with basalt content reduced to 40% and below, the increase in abrasion loss rate is significant. The preliminary results indicate that there is a significant change in the abrasion loss rate of around 40% basalt content, suggesting a turning point in the abrasion loss rate within the 40% basalt content range. In the crushing value results, the increasing trend of crashing resistance also slows down. Therefore, 40% is used as a critical content. Considering this, the experimental design focuses on three experimental groups with a basalt content of around 40%, achieved by selecting experimental groups of 35%, 40%, and 45%.
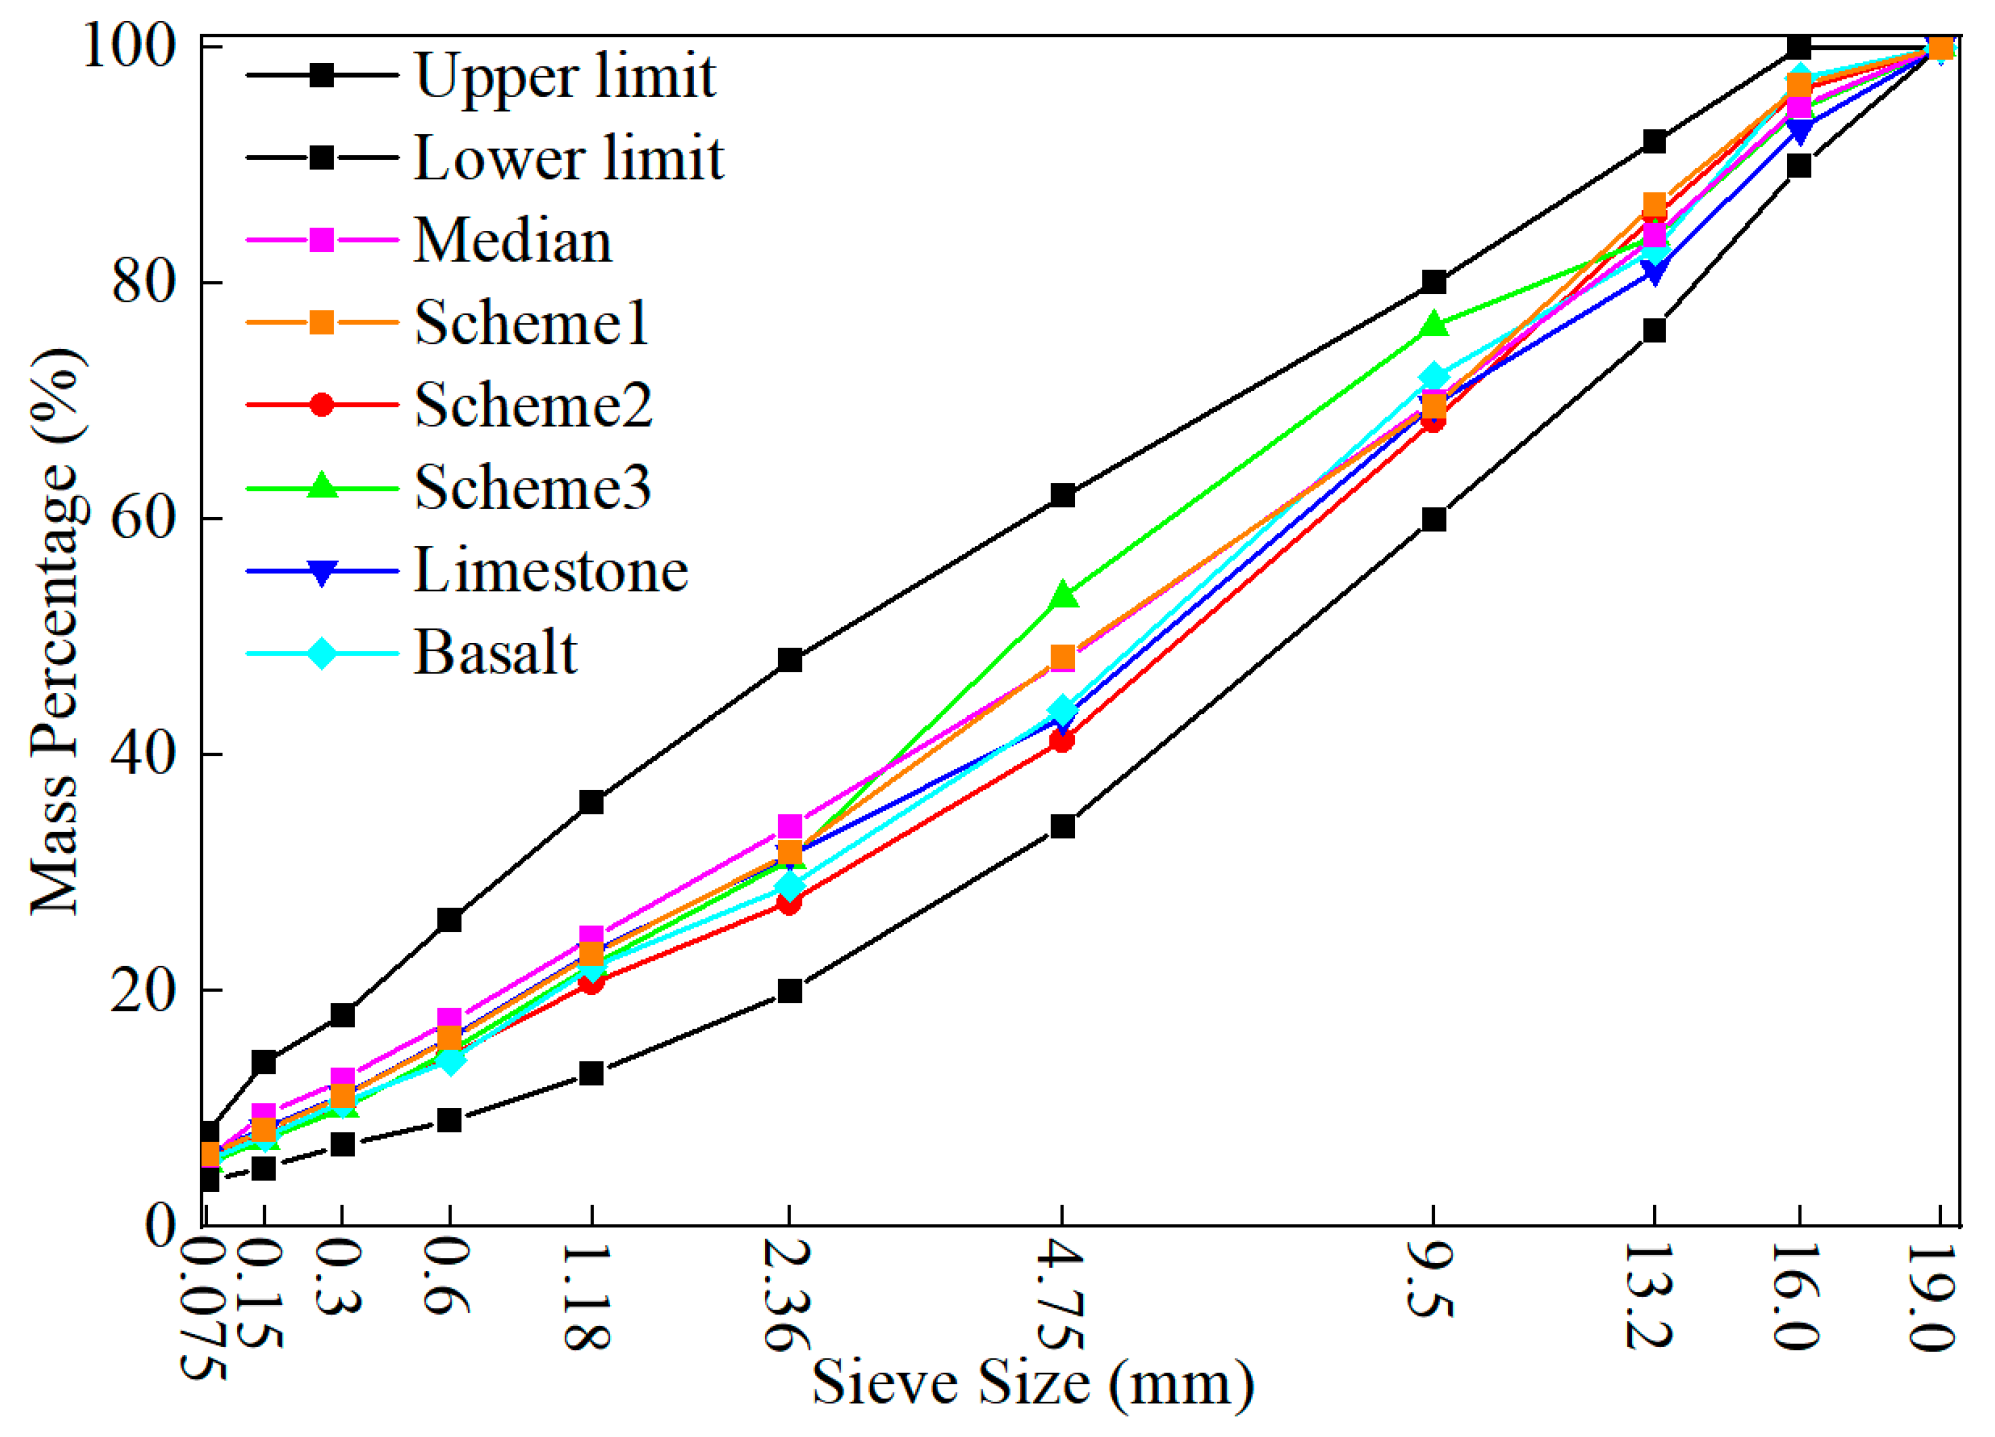
In this study, an AC-16 asphalt mixture was used (continuously graded asphalt mixture with a nominal maximum particle size of 16 mm), with aggregates consisting of mixed aggregates containing different proportions of basalt. The aggregates were divided into five size ranges: 0~4 mm, 4~7 mm, 7~11 mm, 11~16 mm, and 16~19 mm for proportioning. The AC-16 mixture design is shown in Table 3. The grading curves for each scheme are shown in Figure 3.
Table 3.
AC-16 mix proportion.
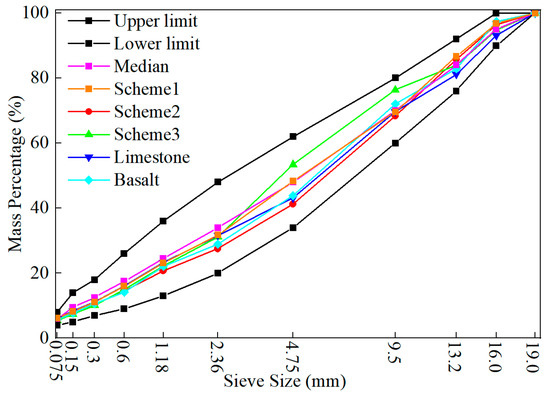
Figure 3.
Gradation composition diagrams for each scheme.
2.2. Asphalt Mixture Friction Test
2.2.1. Test Facility
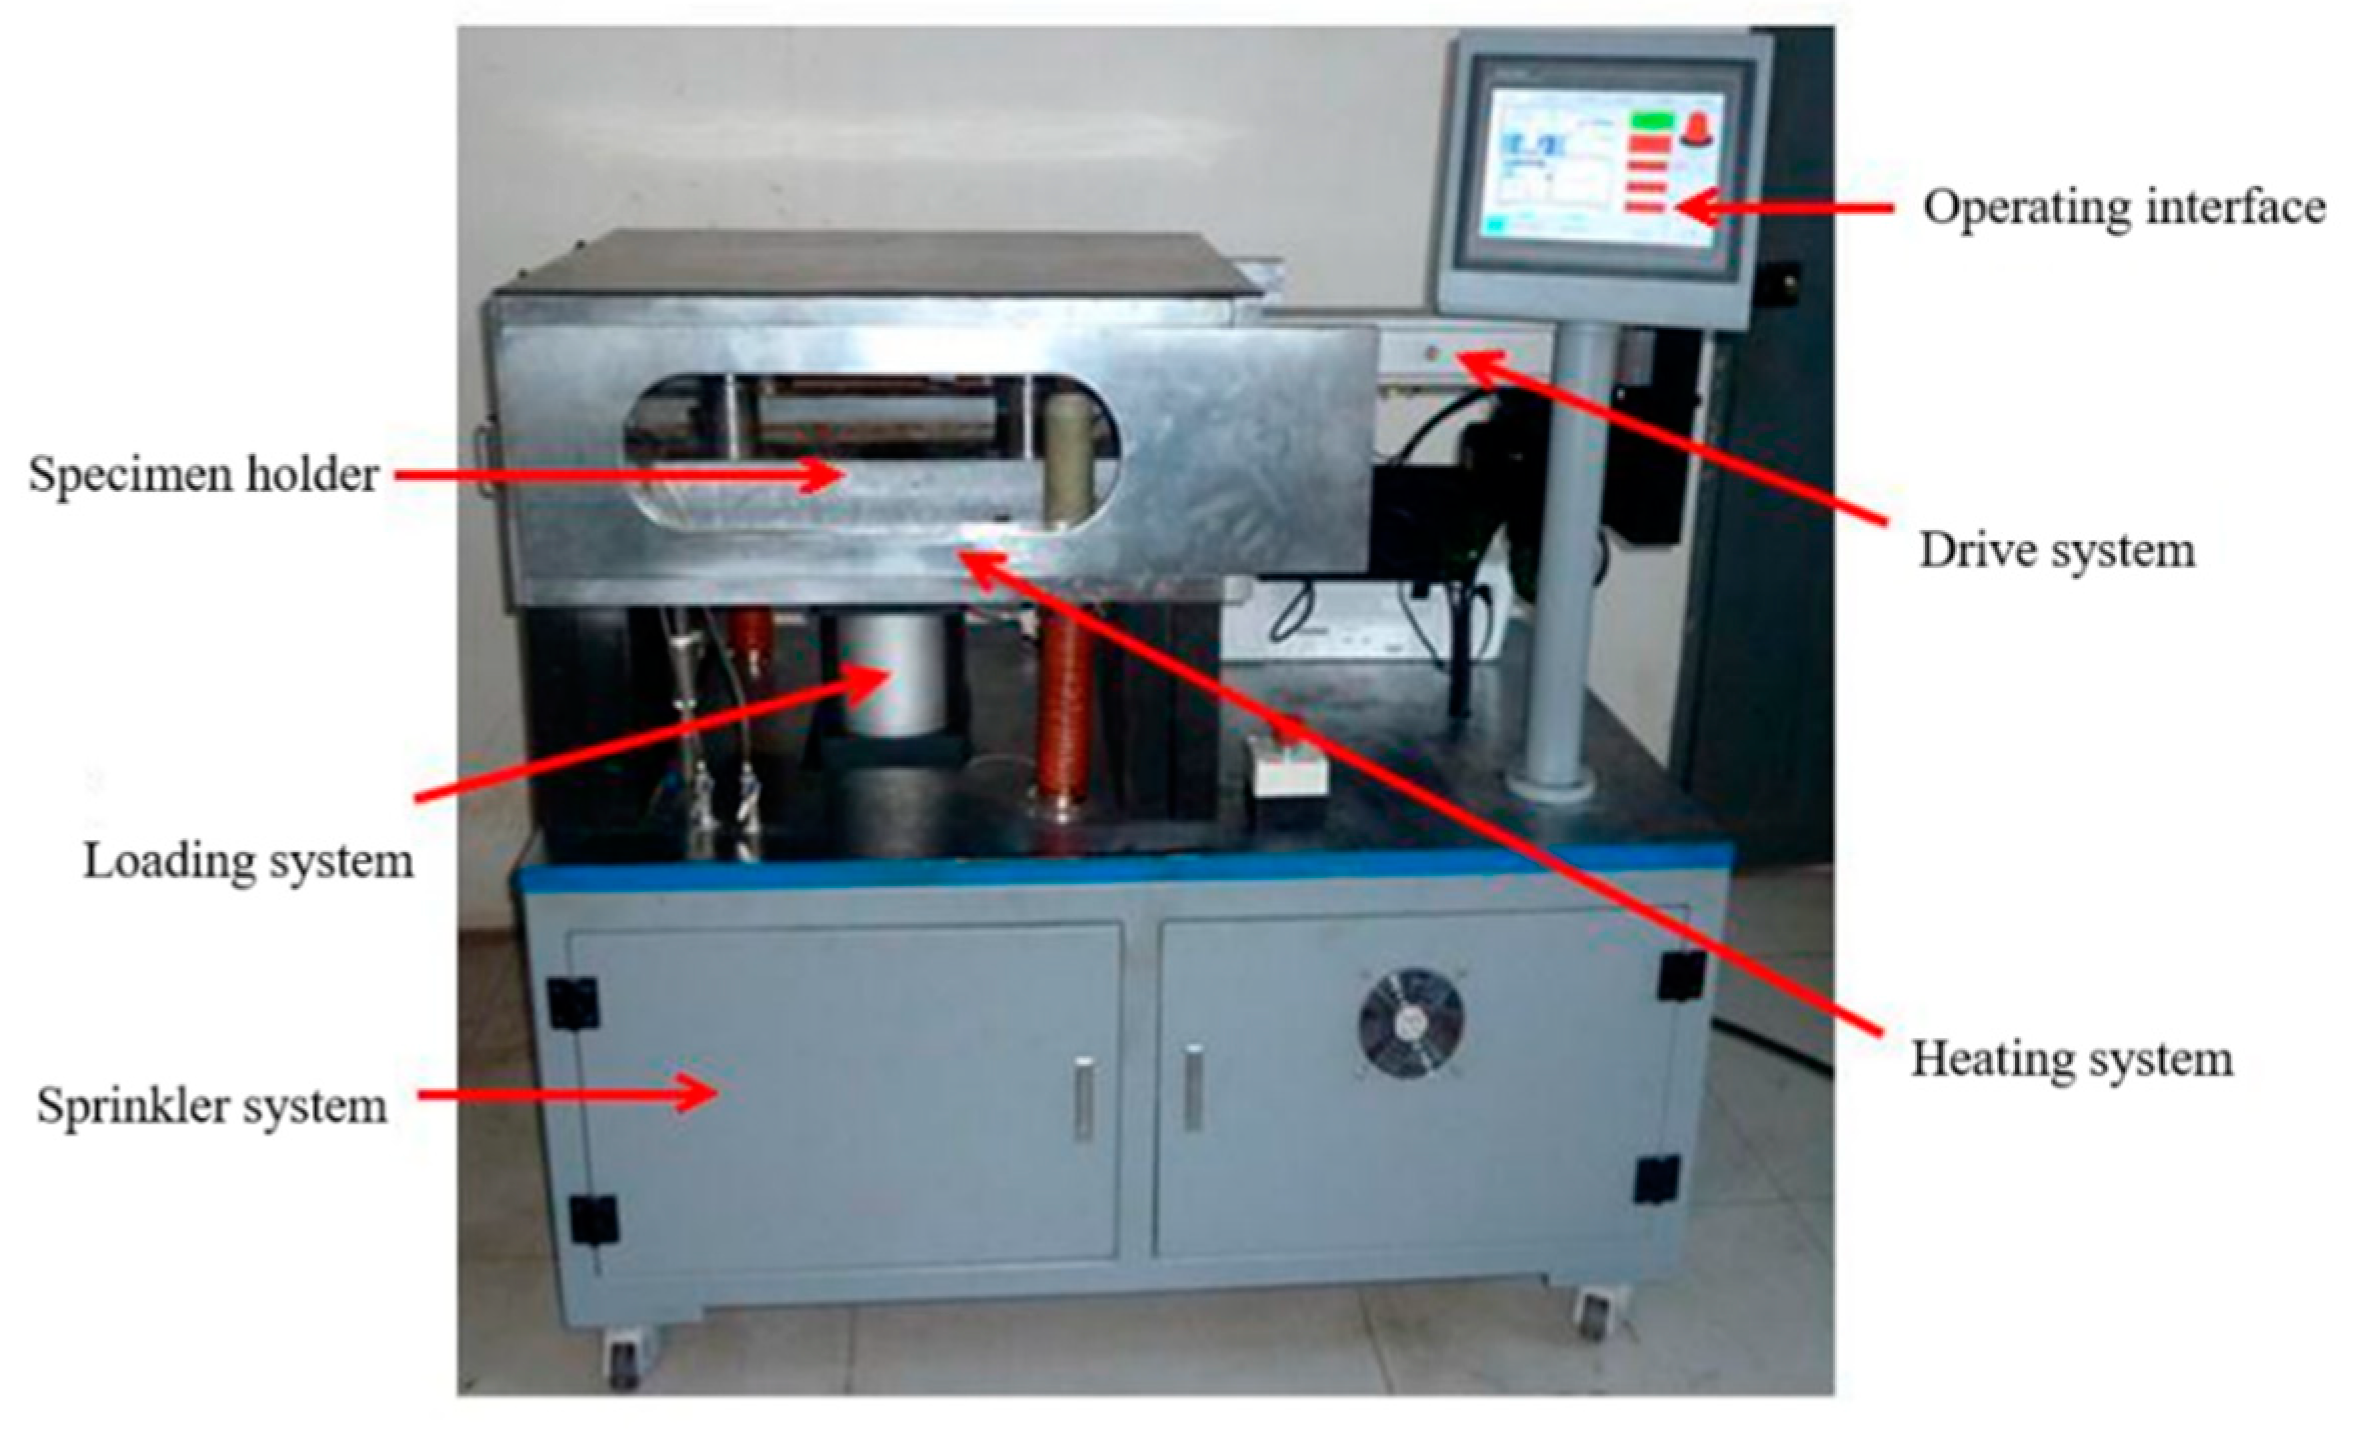
The test facility used in this study is the aggregate/asphalt mixture friction tester (referred to as the friction tester in the following text of this paper) developed by China Merchants Chongqing Communications Technology Research and Design Institute Co., Ltd., Chongqing, China. It is a miniature straight-line test system, as illustrated in Figure 4. It evaluates the sliding friction between the specimen and the sliding plate, with a slip ratio of 100%. During the experiment, the pavement material specimen (aggregate slab or asphalt mixture slab) is mounted in the instrument’s sample groove to simulate the aggregates or asphalt mixtures used in asphalt pavement construction. The specimen’s surface undergoes reciprocal polishing and abrasion motion from the rubber block abrasion tool, which accelerates the loading process, simulating the changes in vehicle speed and the frequency of vehicle loading on the road. Additionally, temperature control components and spray–drainage cycle components are utilized to simulate the on-site temperature and surface moisture conditions of asphalt pavement. The equipment’s parameters are shown in Table 4.

Figure 4.
Aggregate/asphalt mixture friction characteristics tester.
Table 4.
Aggregate/asphalt mixture friction tester parameters.
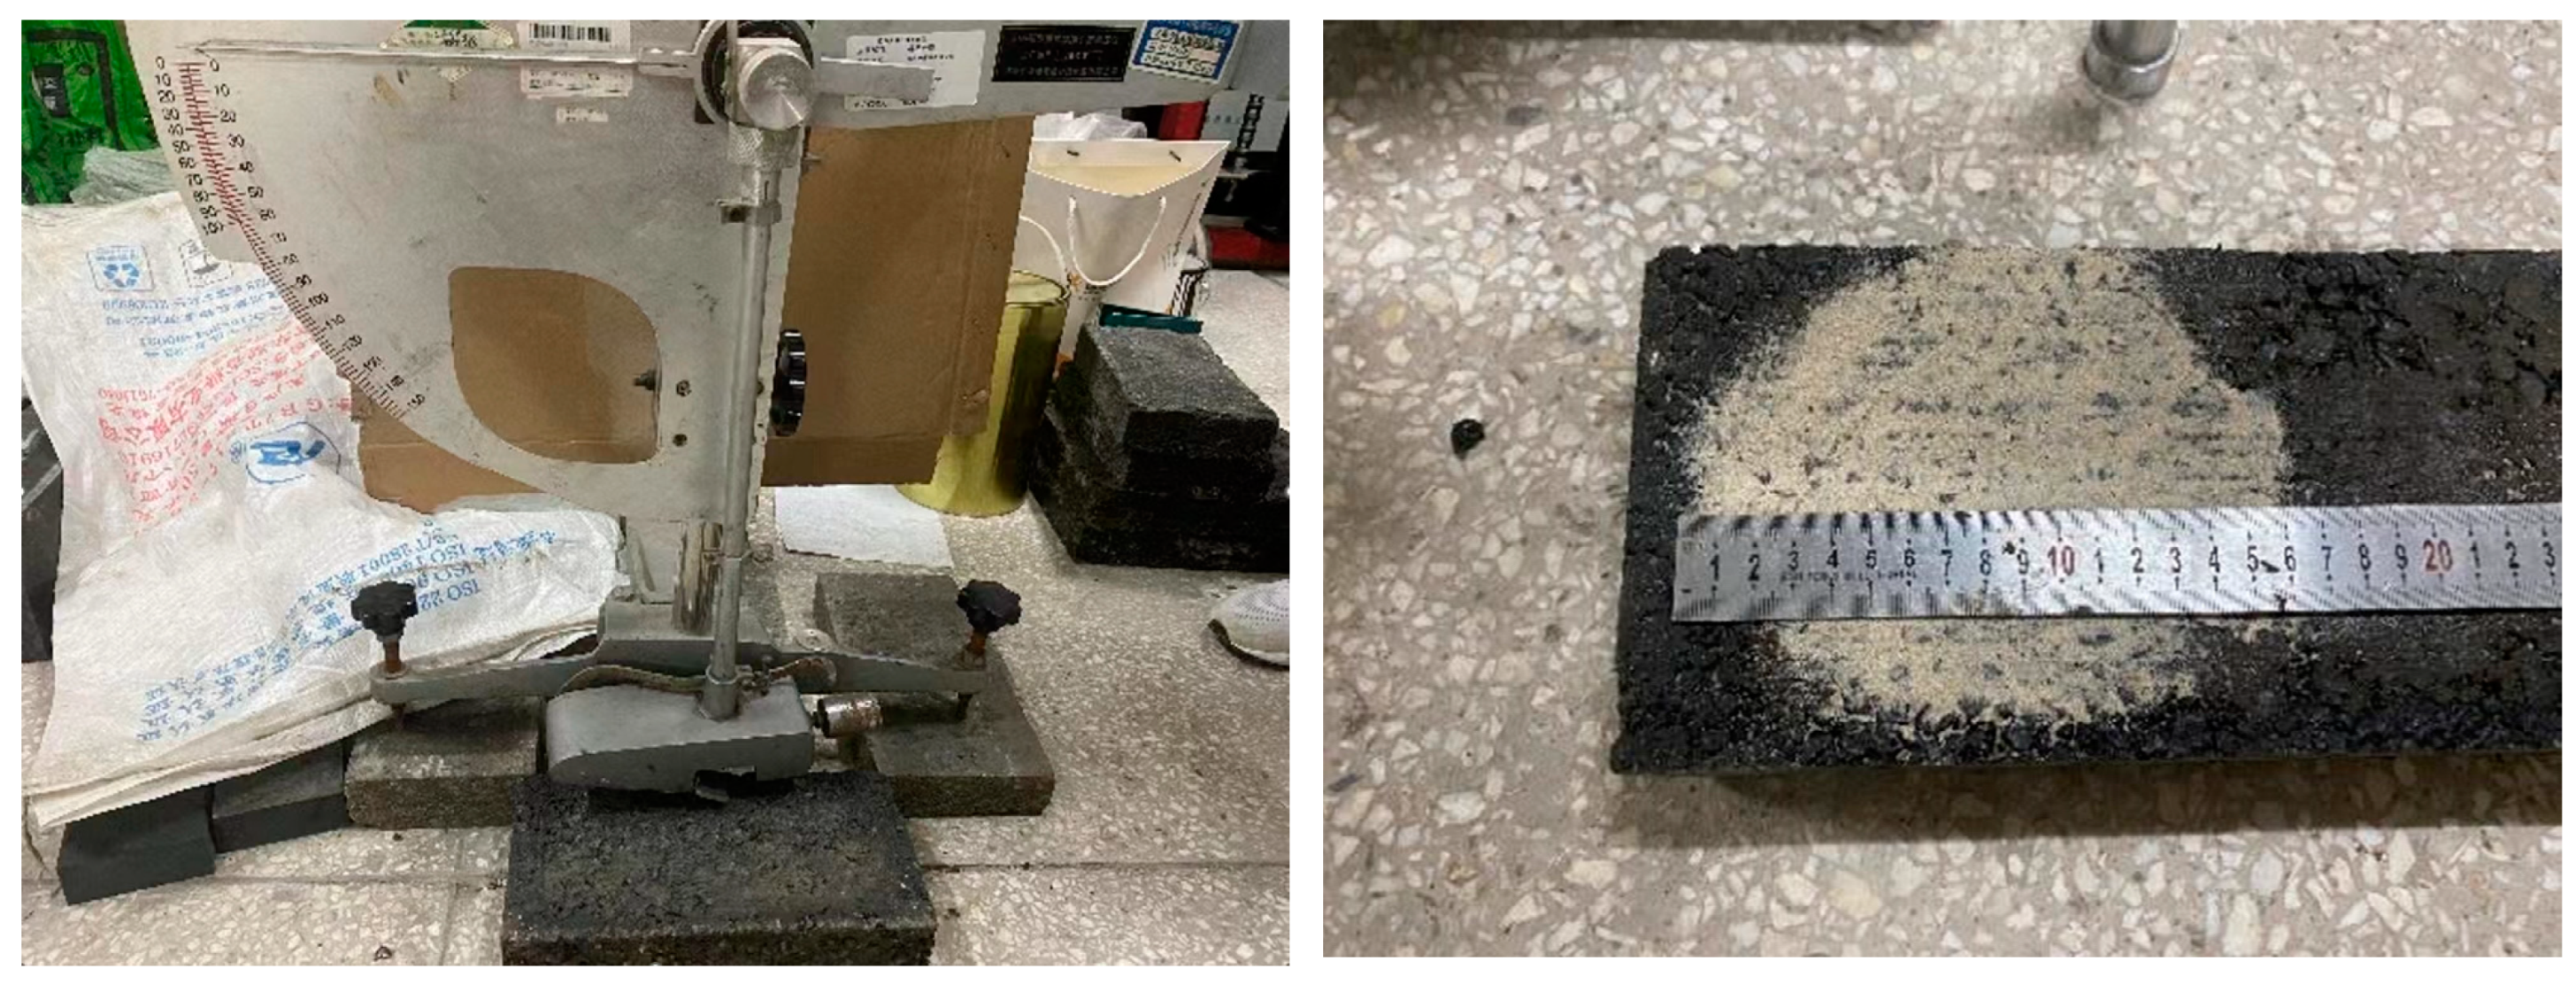
This apparatus directly measures the dynamic friction coefficient, Dμ, derived by the applied load and horizontal pushing–pulling force. After running for a certain amount of time in the tester, the specimen was taken out to measure the British pendulum number (BPN) using the BM-III type pendulum friction coefficient tester and mean texture depth using the sand patch method, as shown in Figure 5.

Figure 5.
Measuring the British pendulum number and mean texture depth.
2.2.2. Test Factorial Design
The main factor that influences the skid resistance performance of a pavement is the materials and composition of the asphalt pavement, tire characteristics, surface texture properties of the pavement, traffic volume, interface media, and the relative motion between the tire and the pavement [9]. In our research, the use of basalt and limestone is predetermined considering the project location; tire and pavement interaction was not studied because of the large variation of type types. This study ultimately decided to focus on three factors: water flow rate, load, and basalt proportion. An orthogonal experiment was designed to explore the impact of these three factors on the skid resistance performance of AC-16, as shown in Table 5. The water flow rates are set to 0 mL/s, 5 mL/s, and 10 mL/s, corresponding to total water volumes of 0 L, 18 L, and 36 L per hour, respectively. The loads are set to 100 kg, 150 kg, and 200 kg. Five schemes of basalt content are selected: 40%, 35%, 45%, 0%, and 100%. The reciprocating operating frequency is 30 times per minute.
Table 5.
Experimental factorial design.
2.2.3. Anti-Skid Surface Construction on Test Section
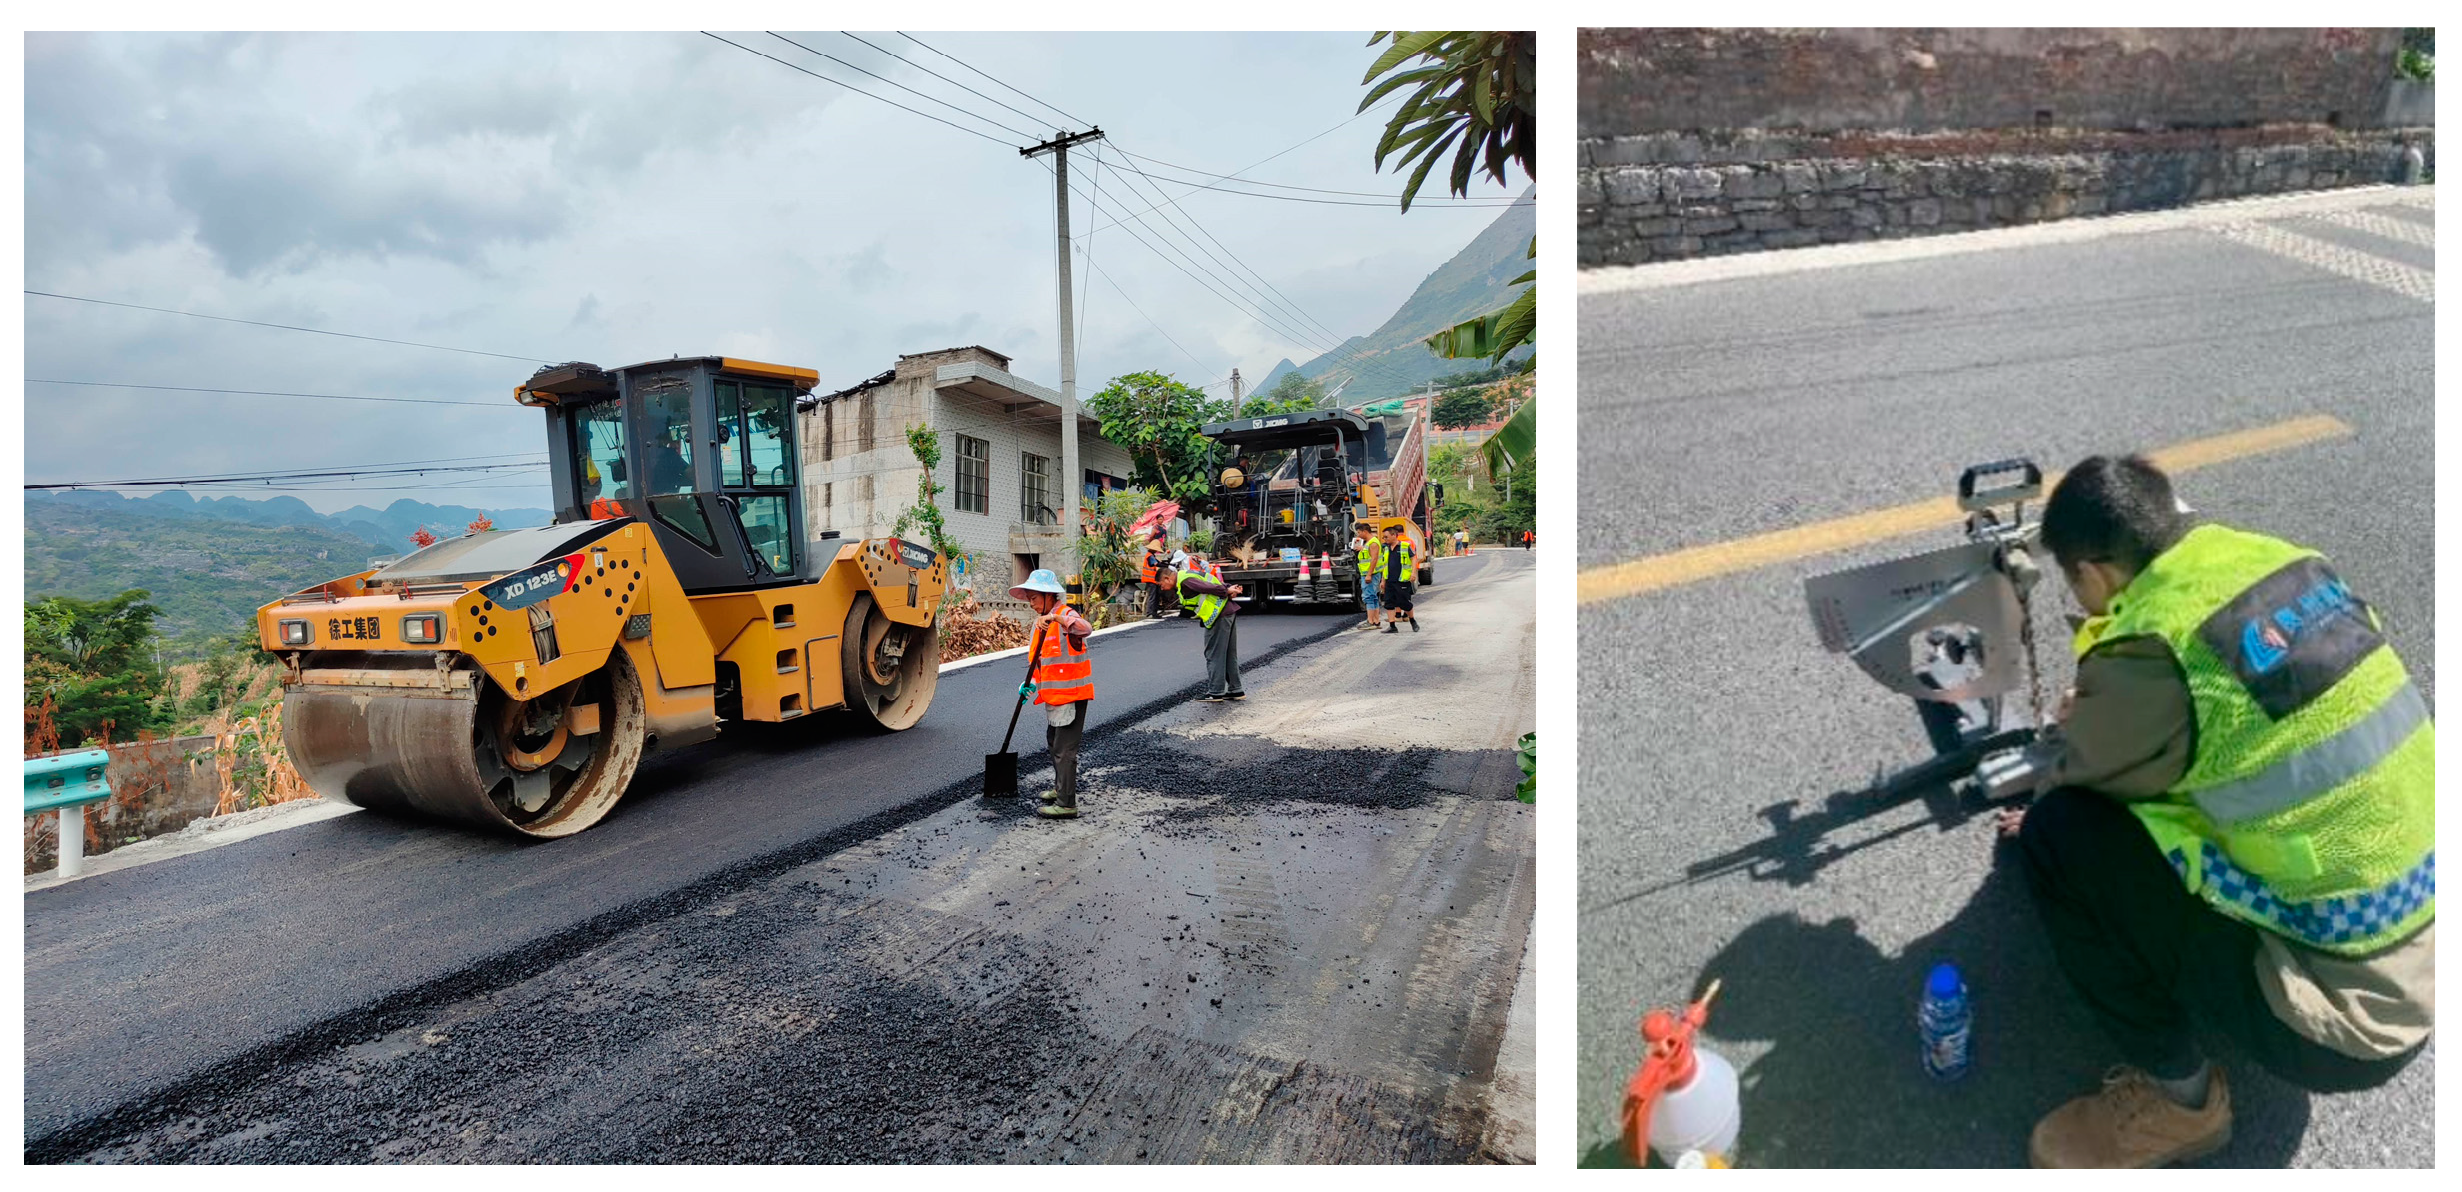
There are certain differences in temperature, humidity, load, and other environmental factors between indoor experiments and actual construction sites. Therefore, it is necessary to build a test section to investigate the real skid resistance performance of asphalt pavements. Scheme 1, with 40% basalt content, was applied to the anti-skid pavement test section. The test site is located on a segment of an arterial highway in Pingba district, Anshun city, Guizhou province, with a total length of 0.638 km. The construction site is shown in Figure 6. After mixing, transporting, paving, compacting, and opening the test section to traffic, the pavement MTD was measured using the sand patch method.
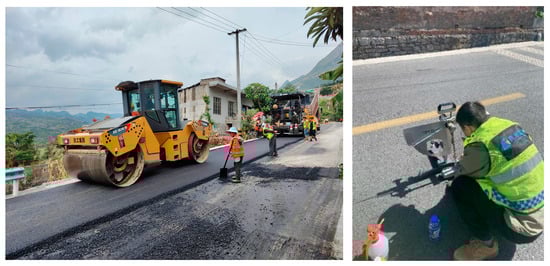
Figure 6.
Construction site and subsequent measurements.
3. Results and Analysis
3.1. British Pendulum Number (BPN) and Mean Texture Depth (MTD)
BPN and MTD attenuation trends under different time conditions were analyzed using the exponential decay model ExpDec1 curve equation after the experiment, where the fitting curve follows Equation (1).
where y represents the skid resistance performance indicator for either BPN or MTD, x represents the time of the accelerated loading test, A represents the amplitude of skid resistance performance attenuation, B represents the attenuation rate and C represents the attenuation final value, . The initial value of the skid resistance equals to A + C.
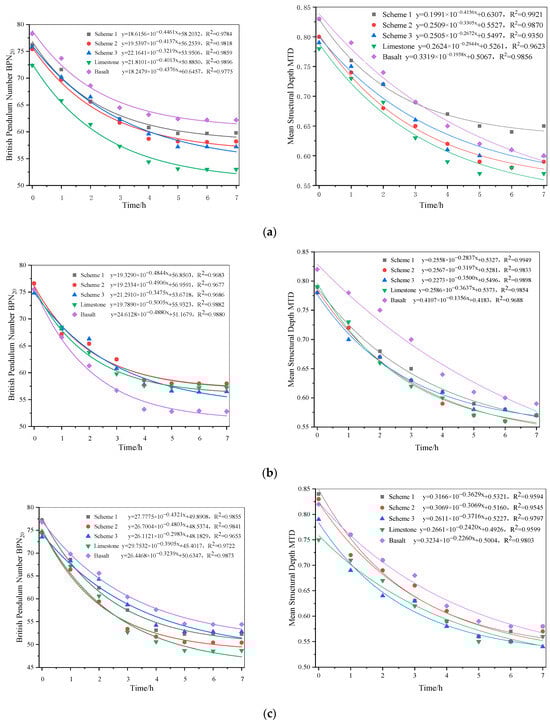
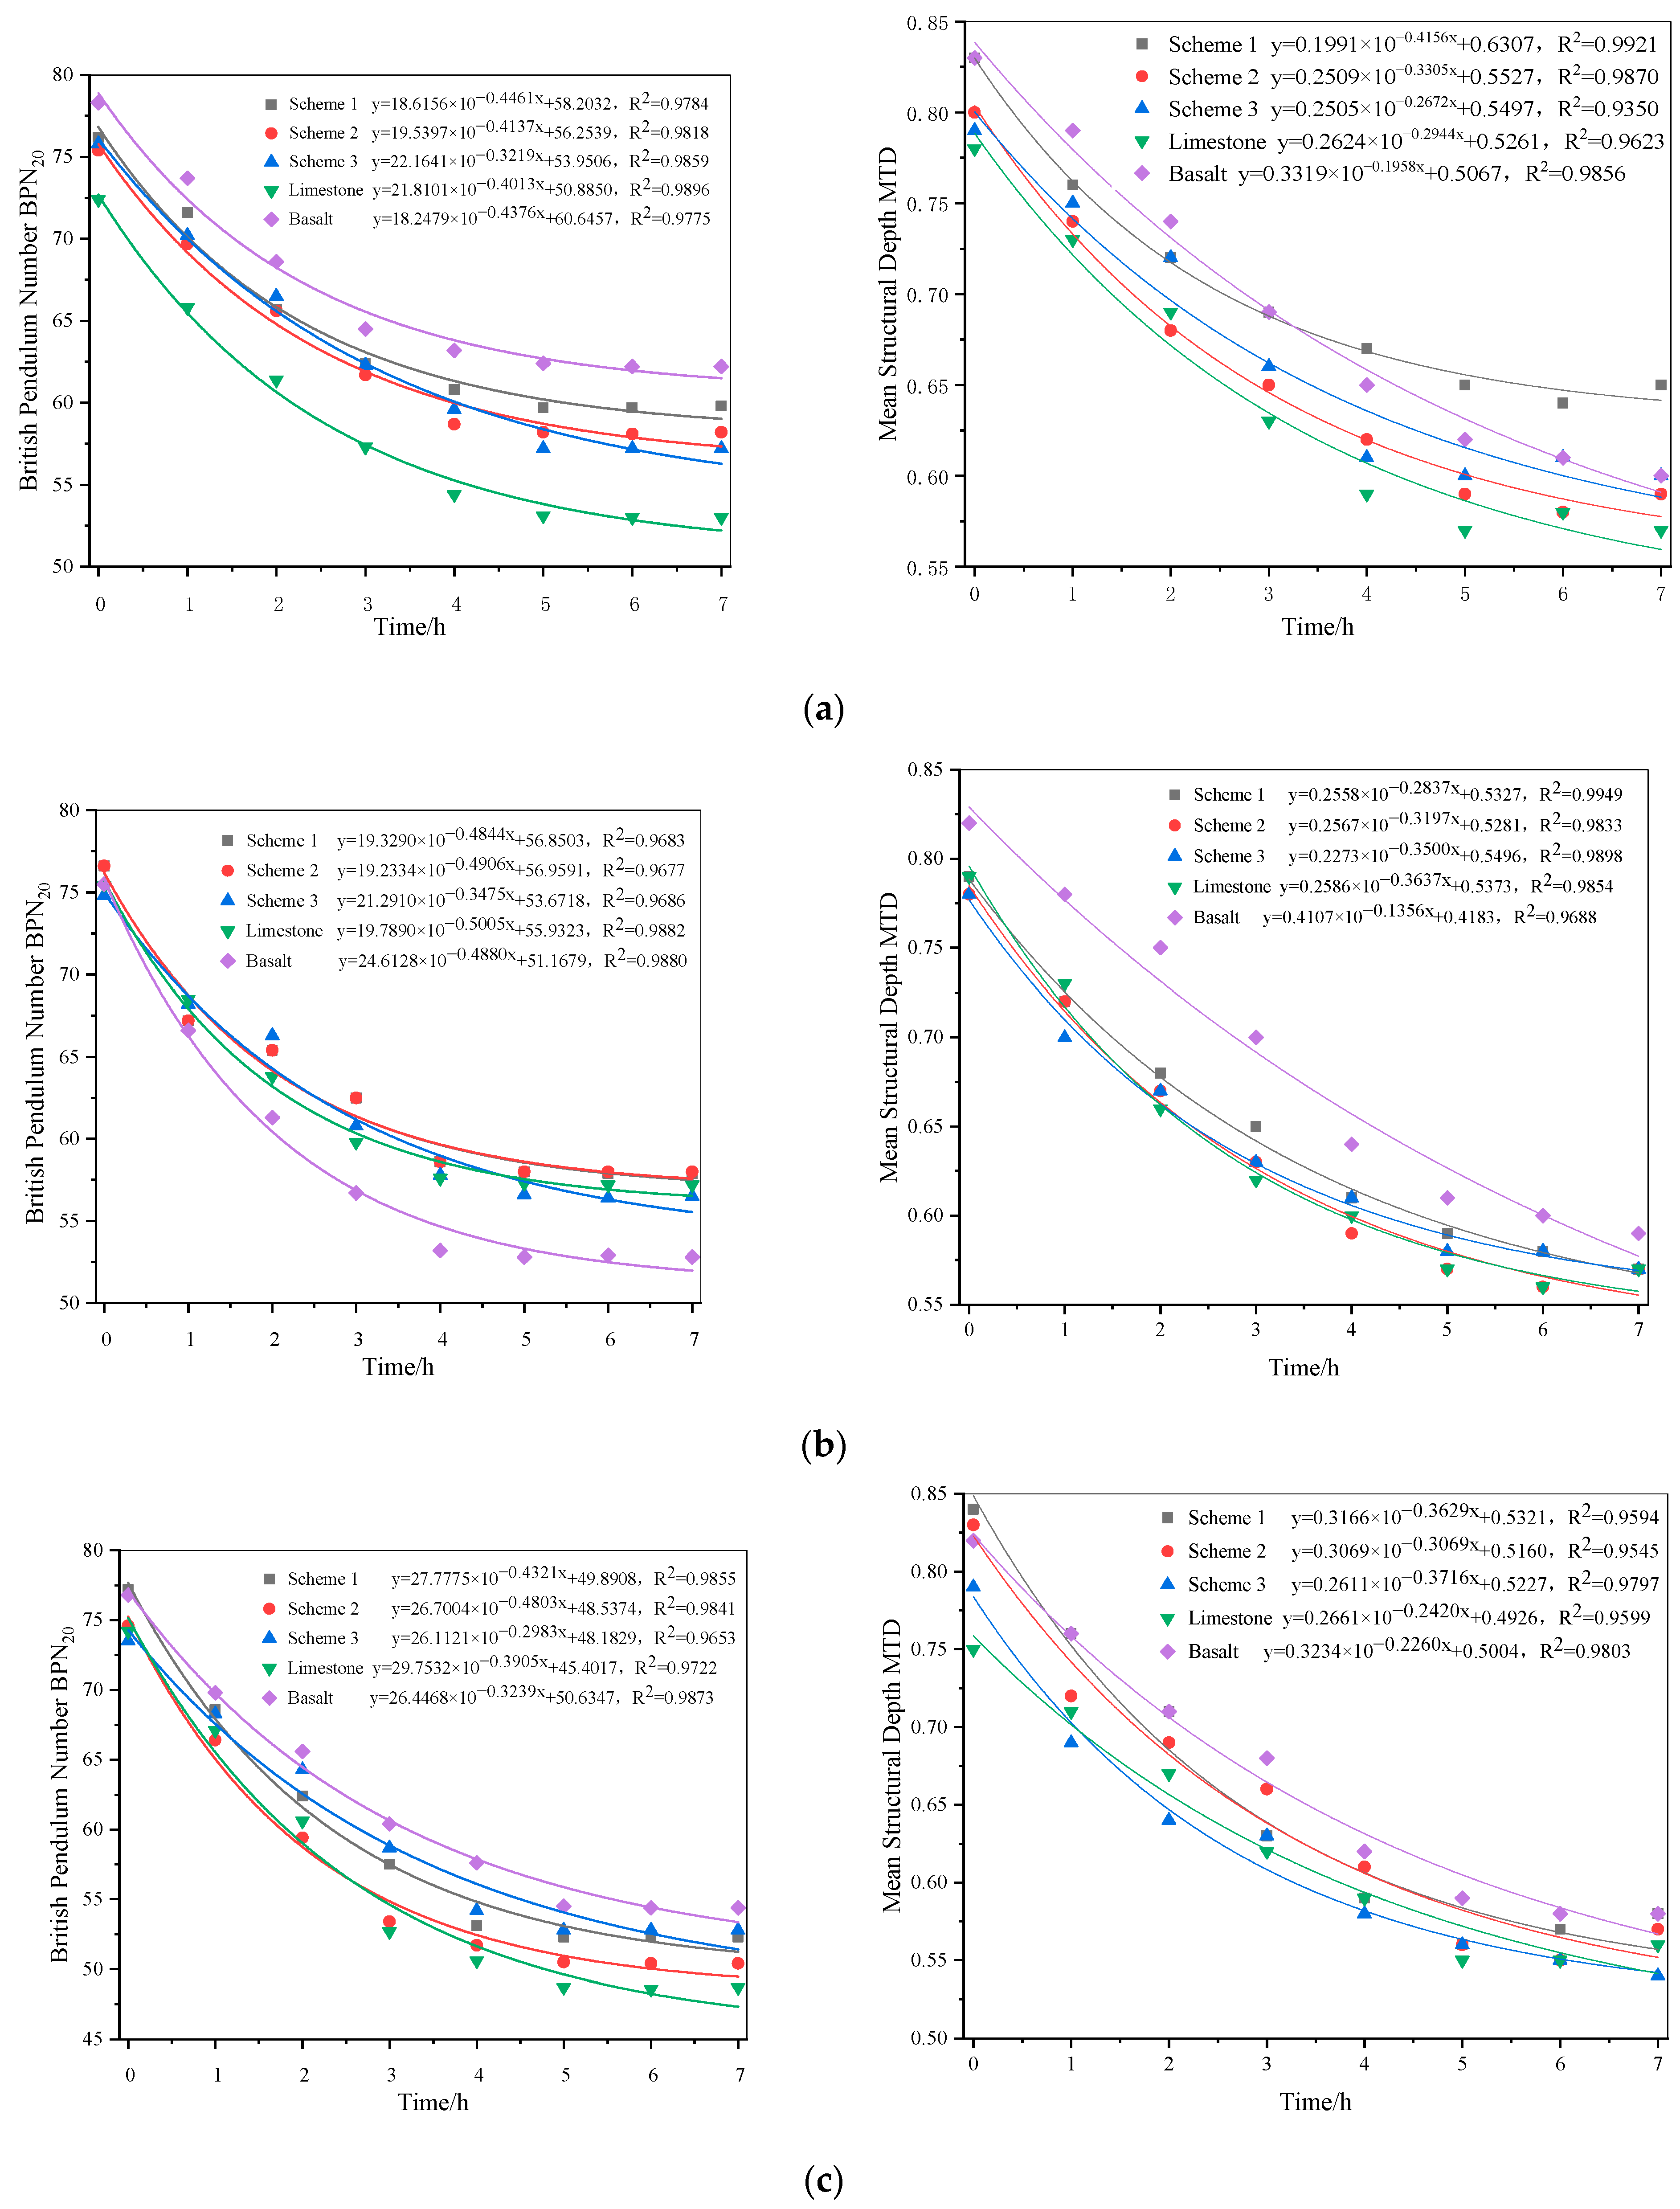
Figure 7.
BPN and MTD results at the water flow rate of 0 mL/s: (a) 100 kg load; (b) 150 kg load; (c) 200 kg load.
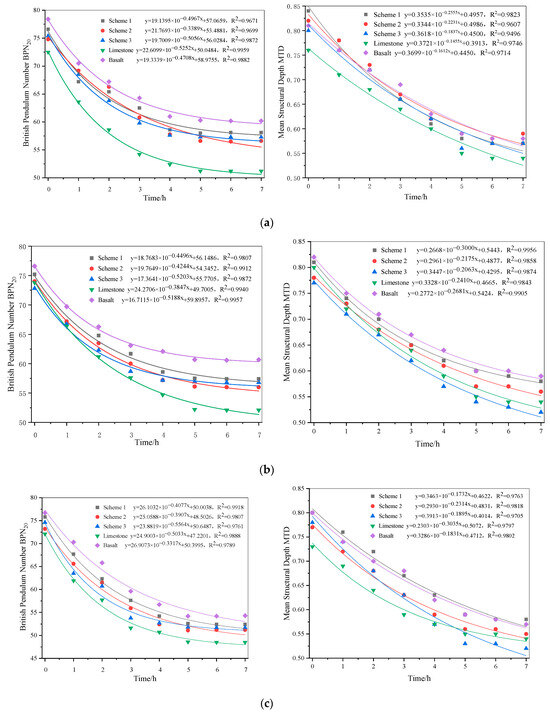
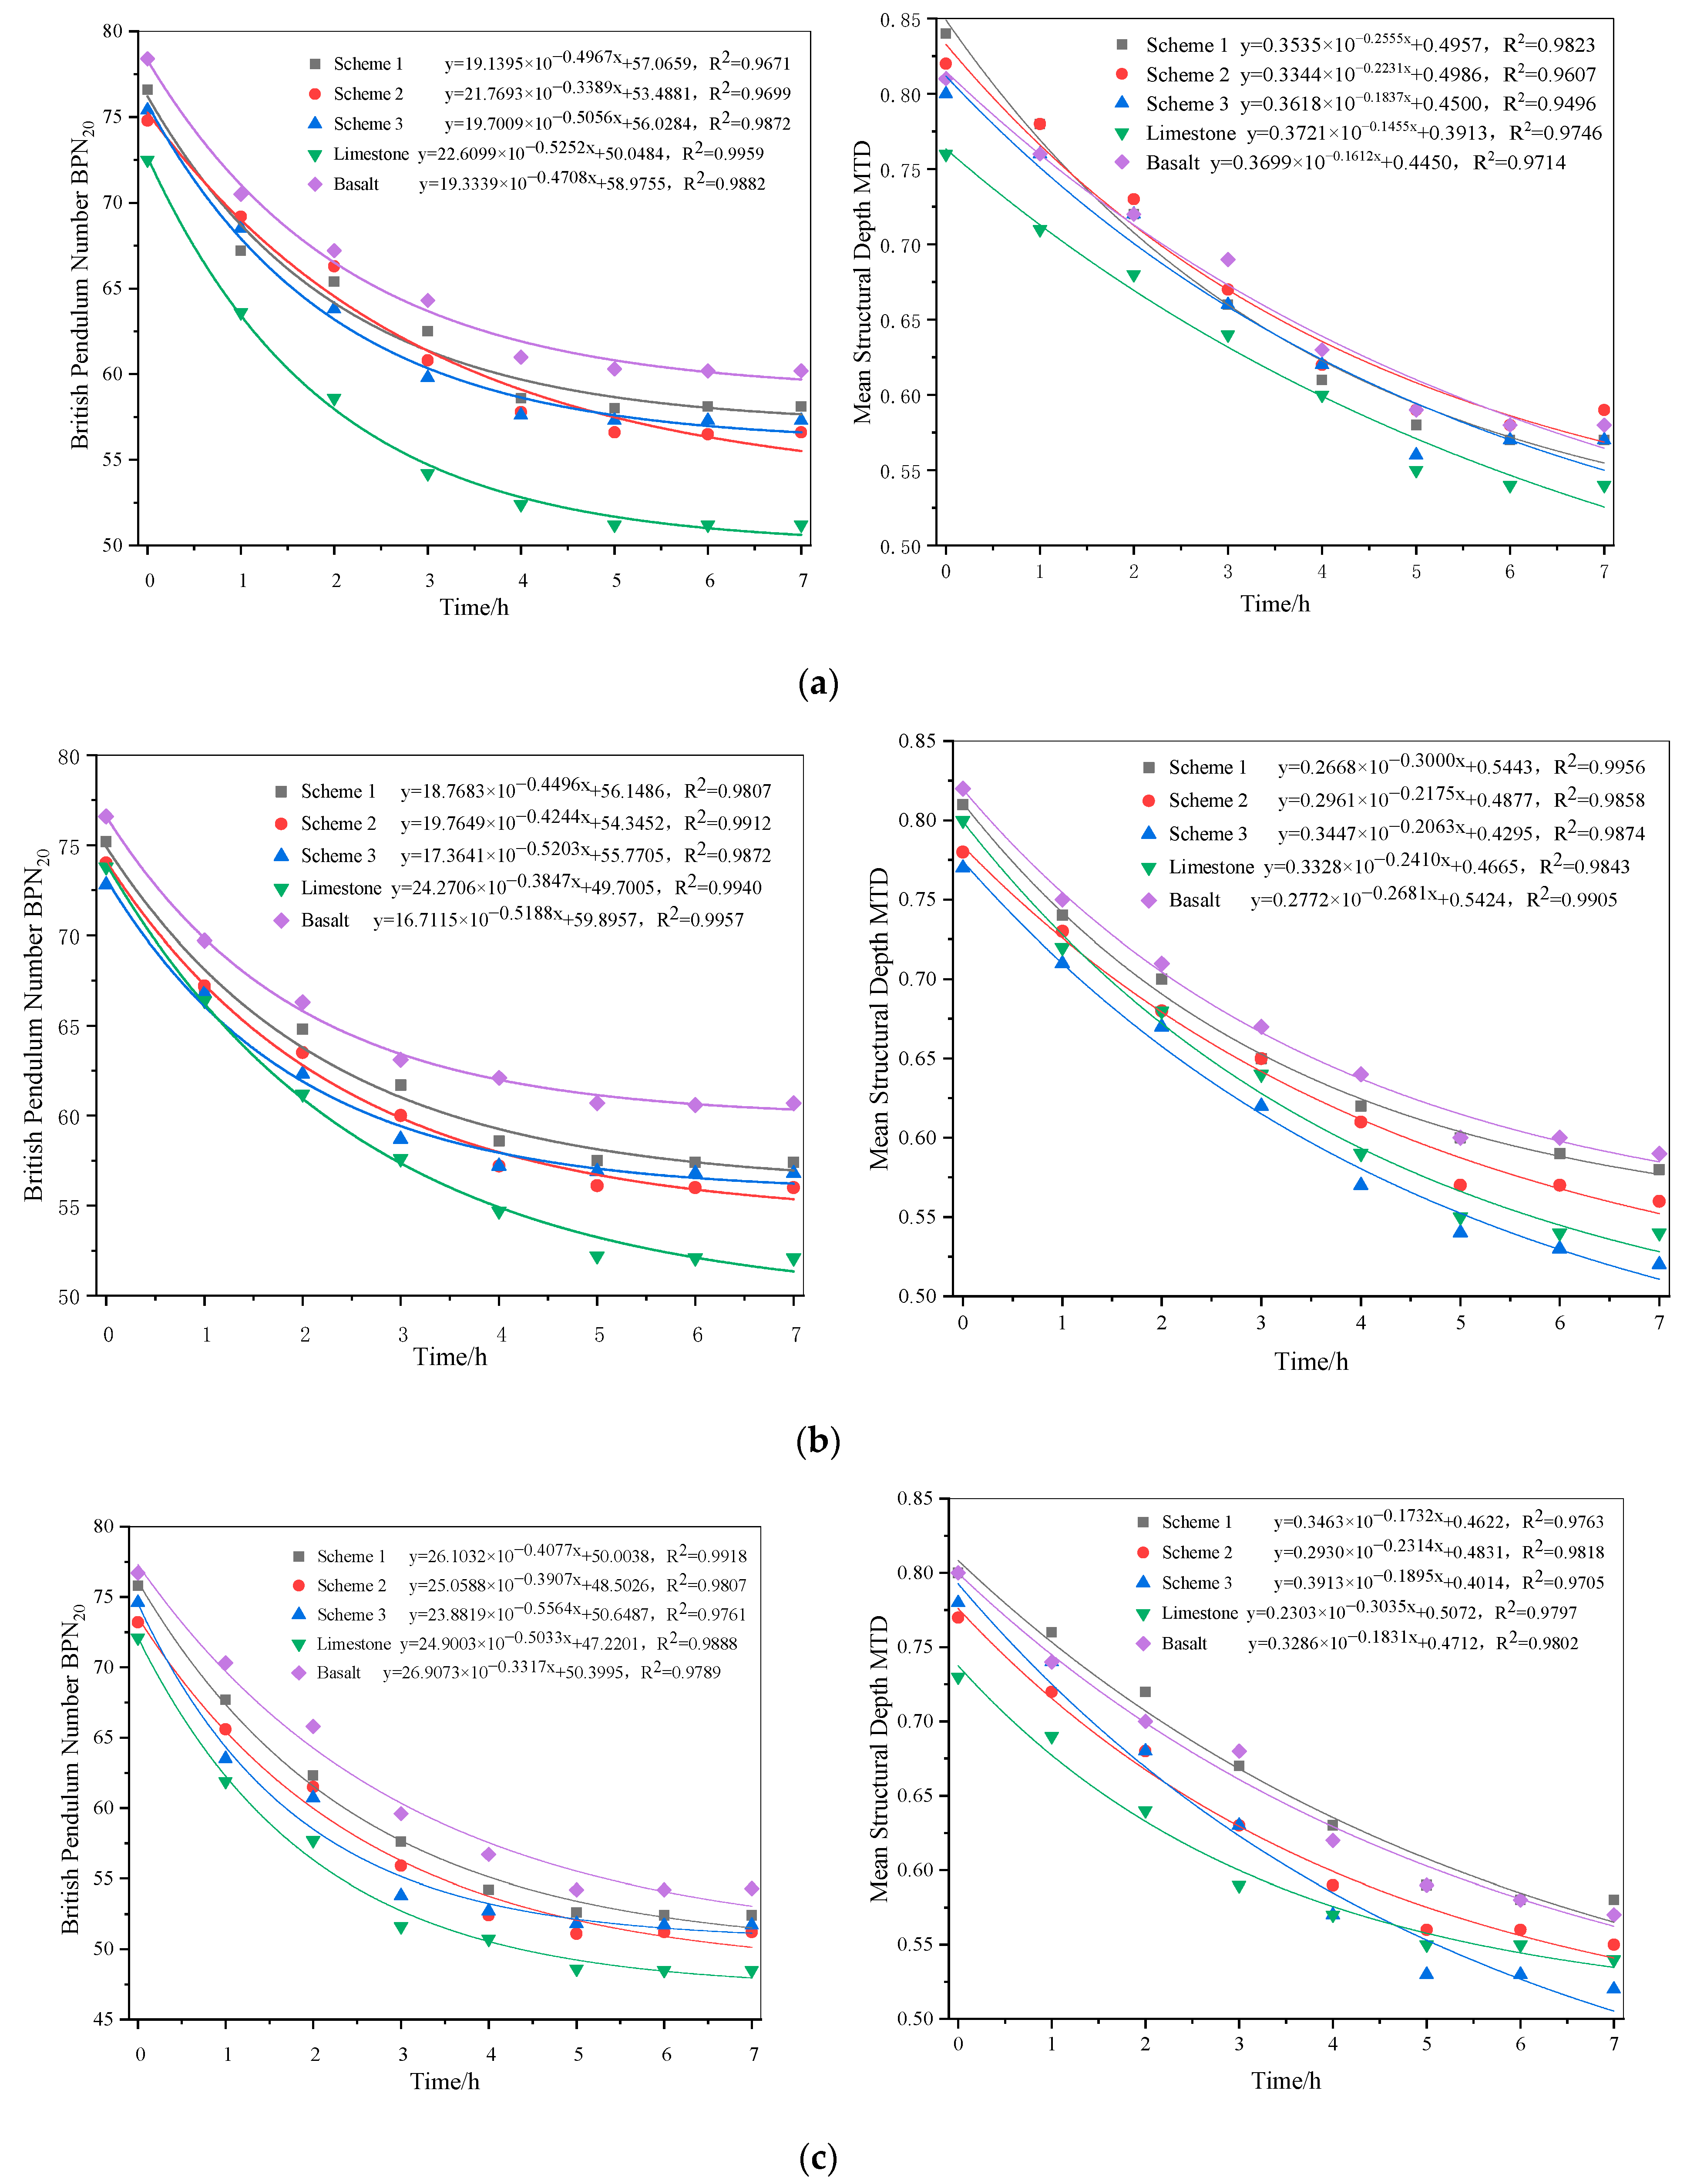
Figure 8.
BPN and MTD results at the water flow rate of 5 mL/s: (a) 100 kg load; (b) 150 kg load; (c) 200 kg load.
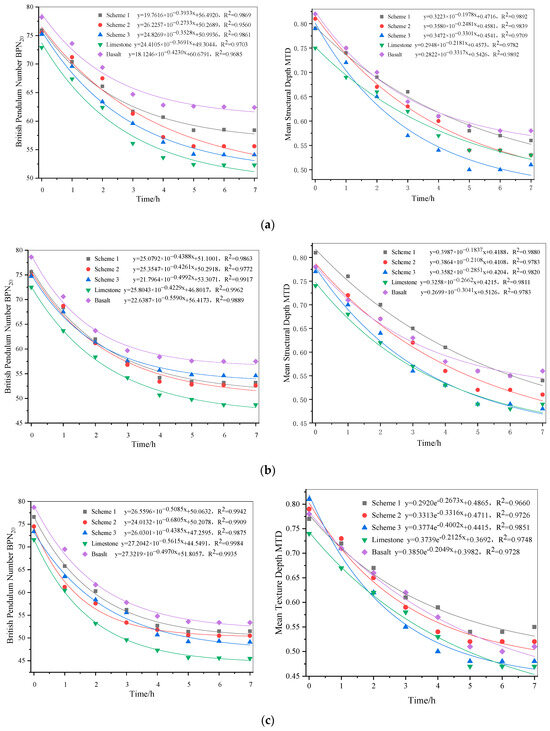
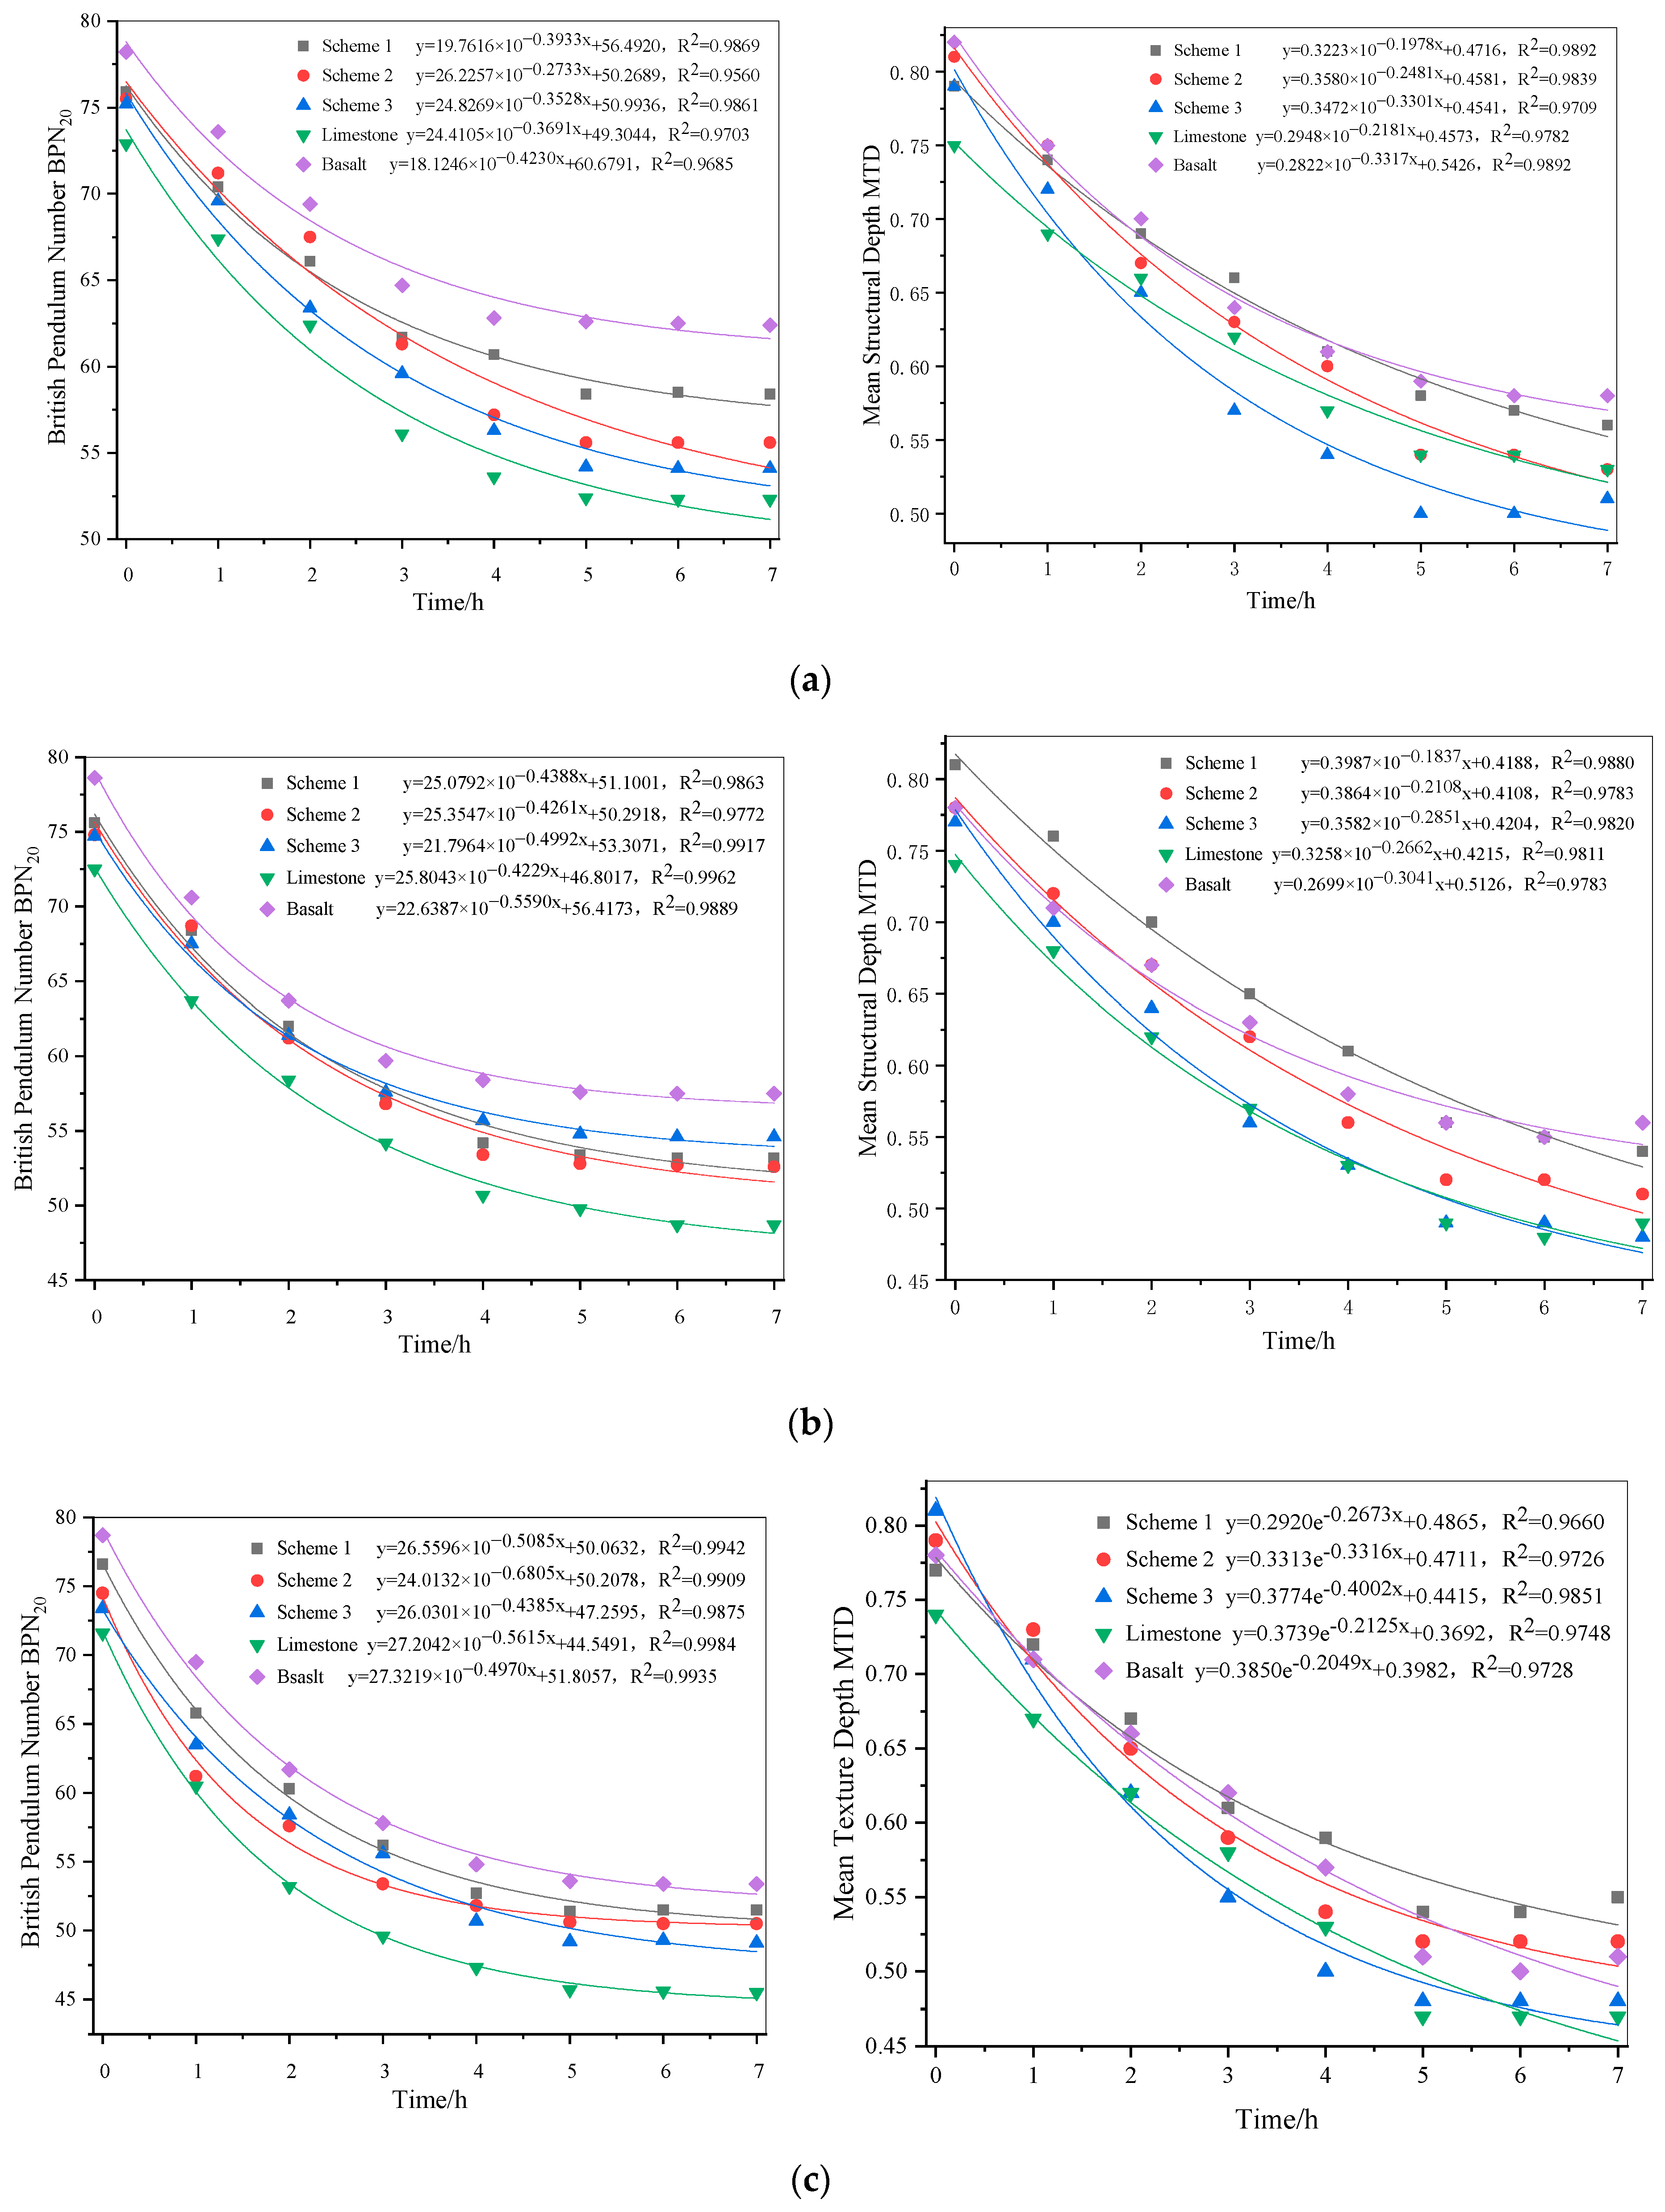
Figure 9.
BPN and MTD results at the water flow rate of 10 mL/s: (a) 100 kg load; (b) 150 kg load; (c) 200 kg load.
Over the course of the experiments, both the British pendulum number (BPN) and the mean texture depth (MTD) of the test specimens gradually decreased and eventually stabilized. Under different load conditions, the initial and final BPN values for scheme 1, scheme 2, and scheme 3 showed minimal differences and exhibited similar evolution trends. The BPN value trends for the three asphalt mixtures were analogous, characterized by three distinct phases: an initial phase (0–1 h) with a rapid decline in BPN values, a middle phase with a slower decline, and a final phase where the decline slowed further and stabilized.
As the test load increased, the initial and final BPN values for schemes 1, 2, and 3 followed the order of scheme 1 > scheme 2 > scheme 3. This indicates that under the same load conditions, scheme 1 had the highest BPN values, while scheme 3 had the lowest.
The specimens with a water flow rate of 10 mL/s exhibited a slightly higher decline in BPN values compared with those with 0 mL/s and 5 mL/s, indicating that water flow rate has a minimal impact on BPN values. Under the same water flow conditions, as the load increased, the texture depth of the specimens showed a significant downward trend, which gradually moderated over time. The impact of load pressure on BPN values was found to be greater than that of water flow rate.
During the experiment, it was observed that accelerated loading wear generated new textures on the specimen surfaces, which slowed the decline in skid resistance. Due to the lower hardness of limestone, the new textures produced were less pronounced, resulting in a more noticeable decrease in skid resistance. Under the same test conditions, the initial decline in BPN values and MTD values was substantial, as surface texture wear was severe in the initial loading phase, leading to a sharp decline in skid resistance. In the middle phase, the rate of decline reduced, and, in the final phase, the changes tended to stabilize.
In summary, the limestone scheme exhibited the weakest skid resistance, while the basalt scheme demonstrated the strongest skid resistance. The skid resistance performance of the other three schemes fell between these two extremes. Scheme 1 (40% basalt) exhibited the smallest decline in BPN values and a stable downward trend, with differences from scheme 3 (45% basalt) being insignificant and both performing better than scheme 2.
The orthogonal experiment is a three-factor, three-level design. Subsequently, the obtained BPN are filled into the L9 (34) orthogonal table, as shown in Table 6.
Table 6.
Pendulum test results (BPN) of the orthogonal experiment.
Sensitivity analysis and the impact priority order of water flow, load, and basalt content on asphalt mixture skid resistance within 0 h, 3 h, and 7 h time intervals were performed. The results are presented in Table 7.
Table 7.
Orthogonal experiment analysis table for three factors.
In Table 7, the range of basalt content is 1.9, 2.5, and 1.8, respectively and the range of load is 0.9, 7.5, and 5.8, respectively. The range of water flow is 0.6, 1.0, and 1.4, respectively. This analysis reveals that the load has the most significant effect on pavement skid resistance, while water flow has the least impact among the three factors.
At 0 h, the basalt content has the most significant effect on skid resistance. This is because during the initial formation of the rutting board, the asphalt film covering the surface has not been polished, and the aggregates have not been exposed. Additionally, the particle size of the aggregates on the surface of the rutting board cannot be artificially controlled, leading to different skid resistance on the surface.
The range of the three factors tends to increase with time. This is mainly because, at 0 h, the asphalt on the specimen’s surface has not been worn, and the skid resistance provided by the surface of the mixture is not significantly different. As time progresses, the asphalt on the specimen’s surface wears away, leading to larger differences in skid resistance provided by the aggregates.
3.2. Skid Resistance Evaluation Using Comprehensive Indicator IFI
The main indicators for characterizing pavement skid resistance are the friction coefficient and pavement texture, which can be further divided into microtexture and macrotexture. Various friction coefficient and texture depth testing devices have been developed and researched worldwide. However, due to the differences in testing equipment used by different countries, China commonly uses the British pendulum tester (measuring BPN) and the sand patch method (measuring MTD), leading to inconsistencies in skid resistance evaluation indicators and standards.
The World Road Association (PIARC) first proposed the International Friction Index (IFI) (F60, Sp) to evaluate pavement skid resistance in 1995, and it was quickly adopted by many countries [38]. Although some literature in China has briefly introduced IFI, it has not yet been widely applied. In response to this situation, this paper uses IFI as an evaluation method, aiming to provide reference and guidance for the skid resistance evaluation system of pavements in China.
The PIARC model adopted the International Friction Index (IFI), which includes the components F60 and Sp, to evaluate pavement skid resistance. F60 represents the friction coefficient at a speed of 60 km/h, and Sp denotes the speed parameter. The PIARC model assesses skid resistance at 60 km/h, and the calculated friction coefficient can be converted into the corresponding friction factor F60. The IFI (F60, Sp) can be calculated using the following formulas, allowing conversion to the corresponding friction factor F60.
First, the speed parameter (Sp) is estimated from the pavement texture depth parameter:
where refers to the mean texture depth (MTD) of the pavement surface in this study and a and b are calibration constants for the pavement’s macroscopic texture. Subsequently, the friction coefficient FRS, measured at slip speed S, is converted to the friction coefficient at a speed of 60 km/h.
where S denotes the driving speed. The friction number at the standard speed, F60, is calculated based on the friction coefficient value FR60 at a speed of 60 km/h. Here, the test tires are categorized into two scenarios:
In the equation, FR60 is calculated using Equation (3). Constants A and B are specified by the American Society for Testing and Materials (ASTM E-1960) standard [39]. When measuring friction with a smooth tire, C is set to 0.
Combining the above formulas, we derive the following equation:
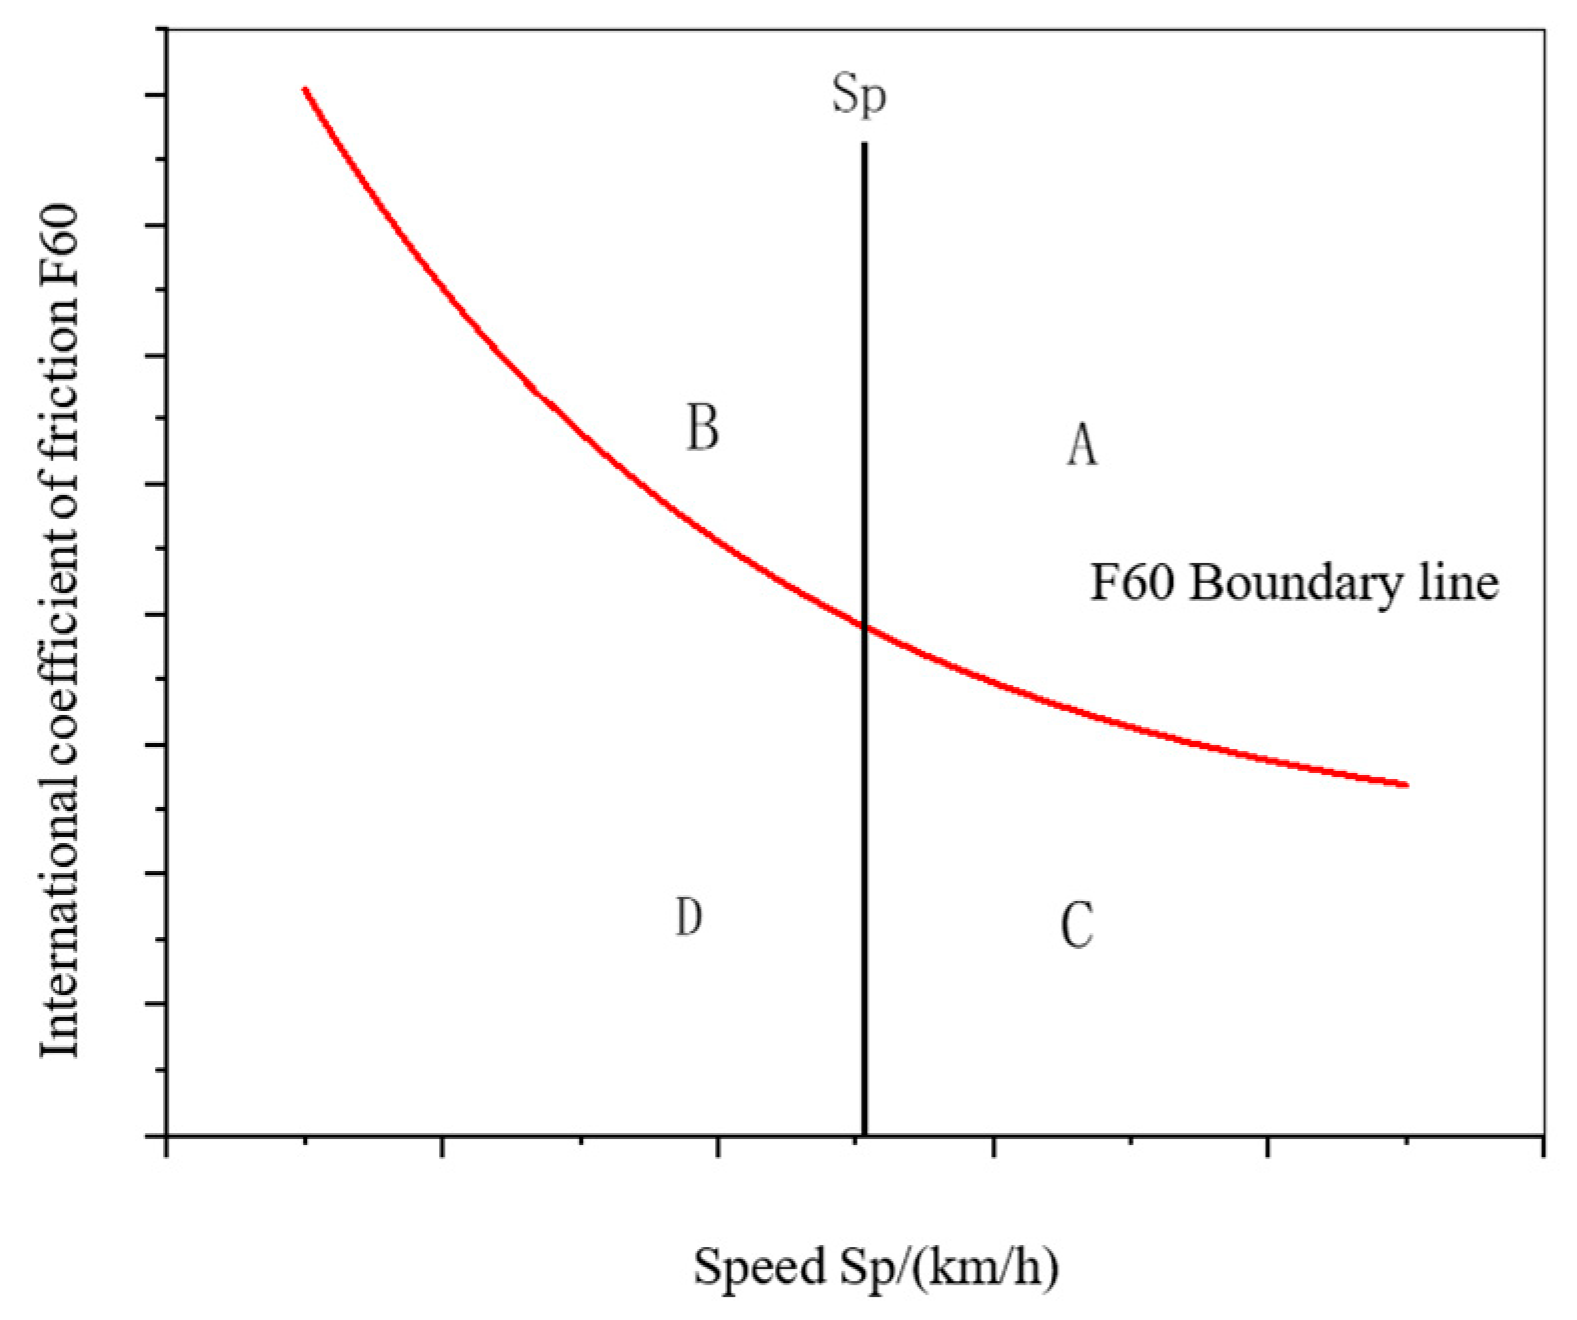
As per the specifications, the evaluation criteria for the International Friction Index (IFI) (F60, Sp) are established based on drawing corresponding curves to determine the specific conditions of road skid resistance performance and identify areas requiring improvement. The schematic diagram is illustrated in Figure 10.

Figure 10.
The schematic diagram of the International Friction Index (IFI) (F60, Sp).
The diagram is divided into four areas. If (Sp, F60) is located in area A, it indicates good road surface skid resistance; if it is in area B, the small Sp value suggests that road surface roughness should be improved; if it is in area C, the small F60 value suggests that road surface texture should be improved; and if it is in area D, both Sp and F60 are small, indicating that both road surface roughness and texture should be improved.
The World Road Association (PIARC) has conducted experiments on various commonly used BPN testing devices and MTD testing devices, calibrating the system parameters a, b, A, B, and C for these devices using IFI [40]. The required parameters are listed in Table 8 and Table 9.
Table 8.
Constants ‘a’ and ‘b’ in the speed–number SP (artificial sand paving method).
Table 9.
Constants A, B, and C in the friction factor F60 (pendulum method).
Next, the quality requirements for the road surface of highways, primary roads, and secondary and tertiary roads in mountainous areas from the current Chinese specifications were converted into International Friction Index (IFI) values (F60, Sp), where SP is 50.9 km/h and F60 is 0.183, as shown in Figure 8.
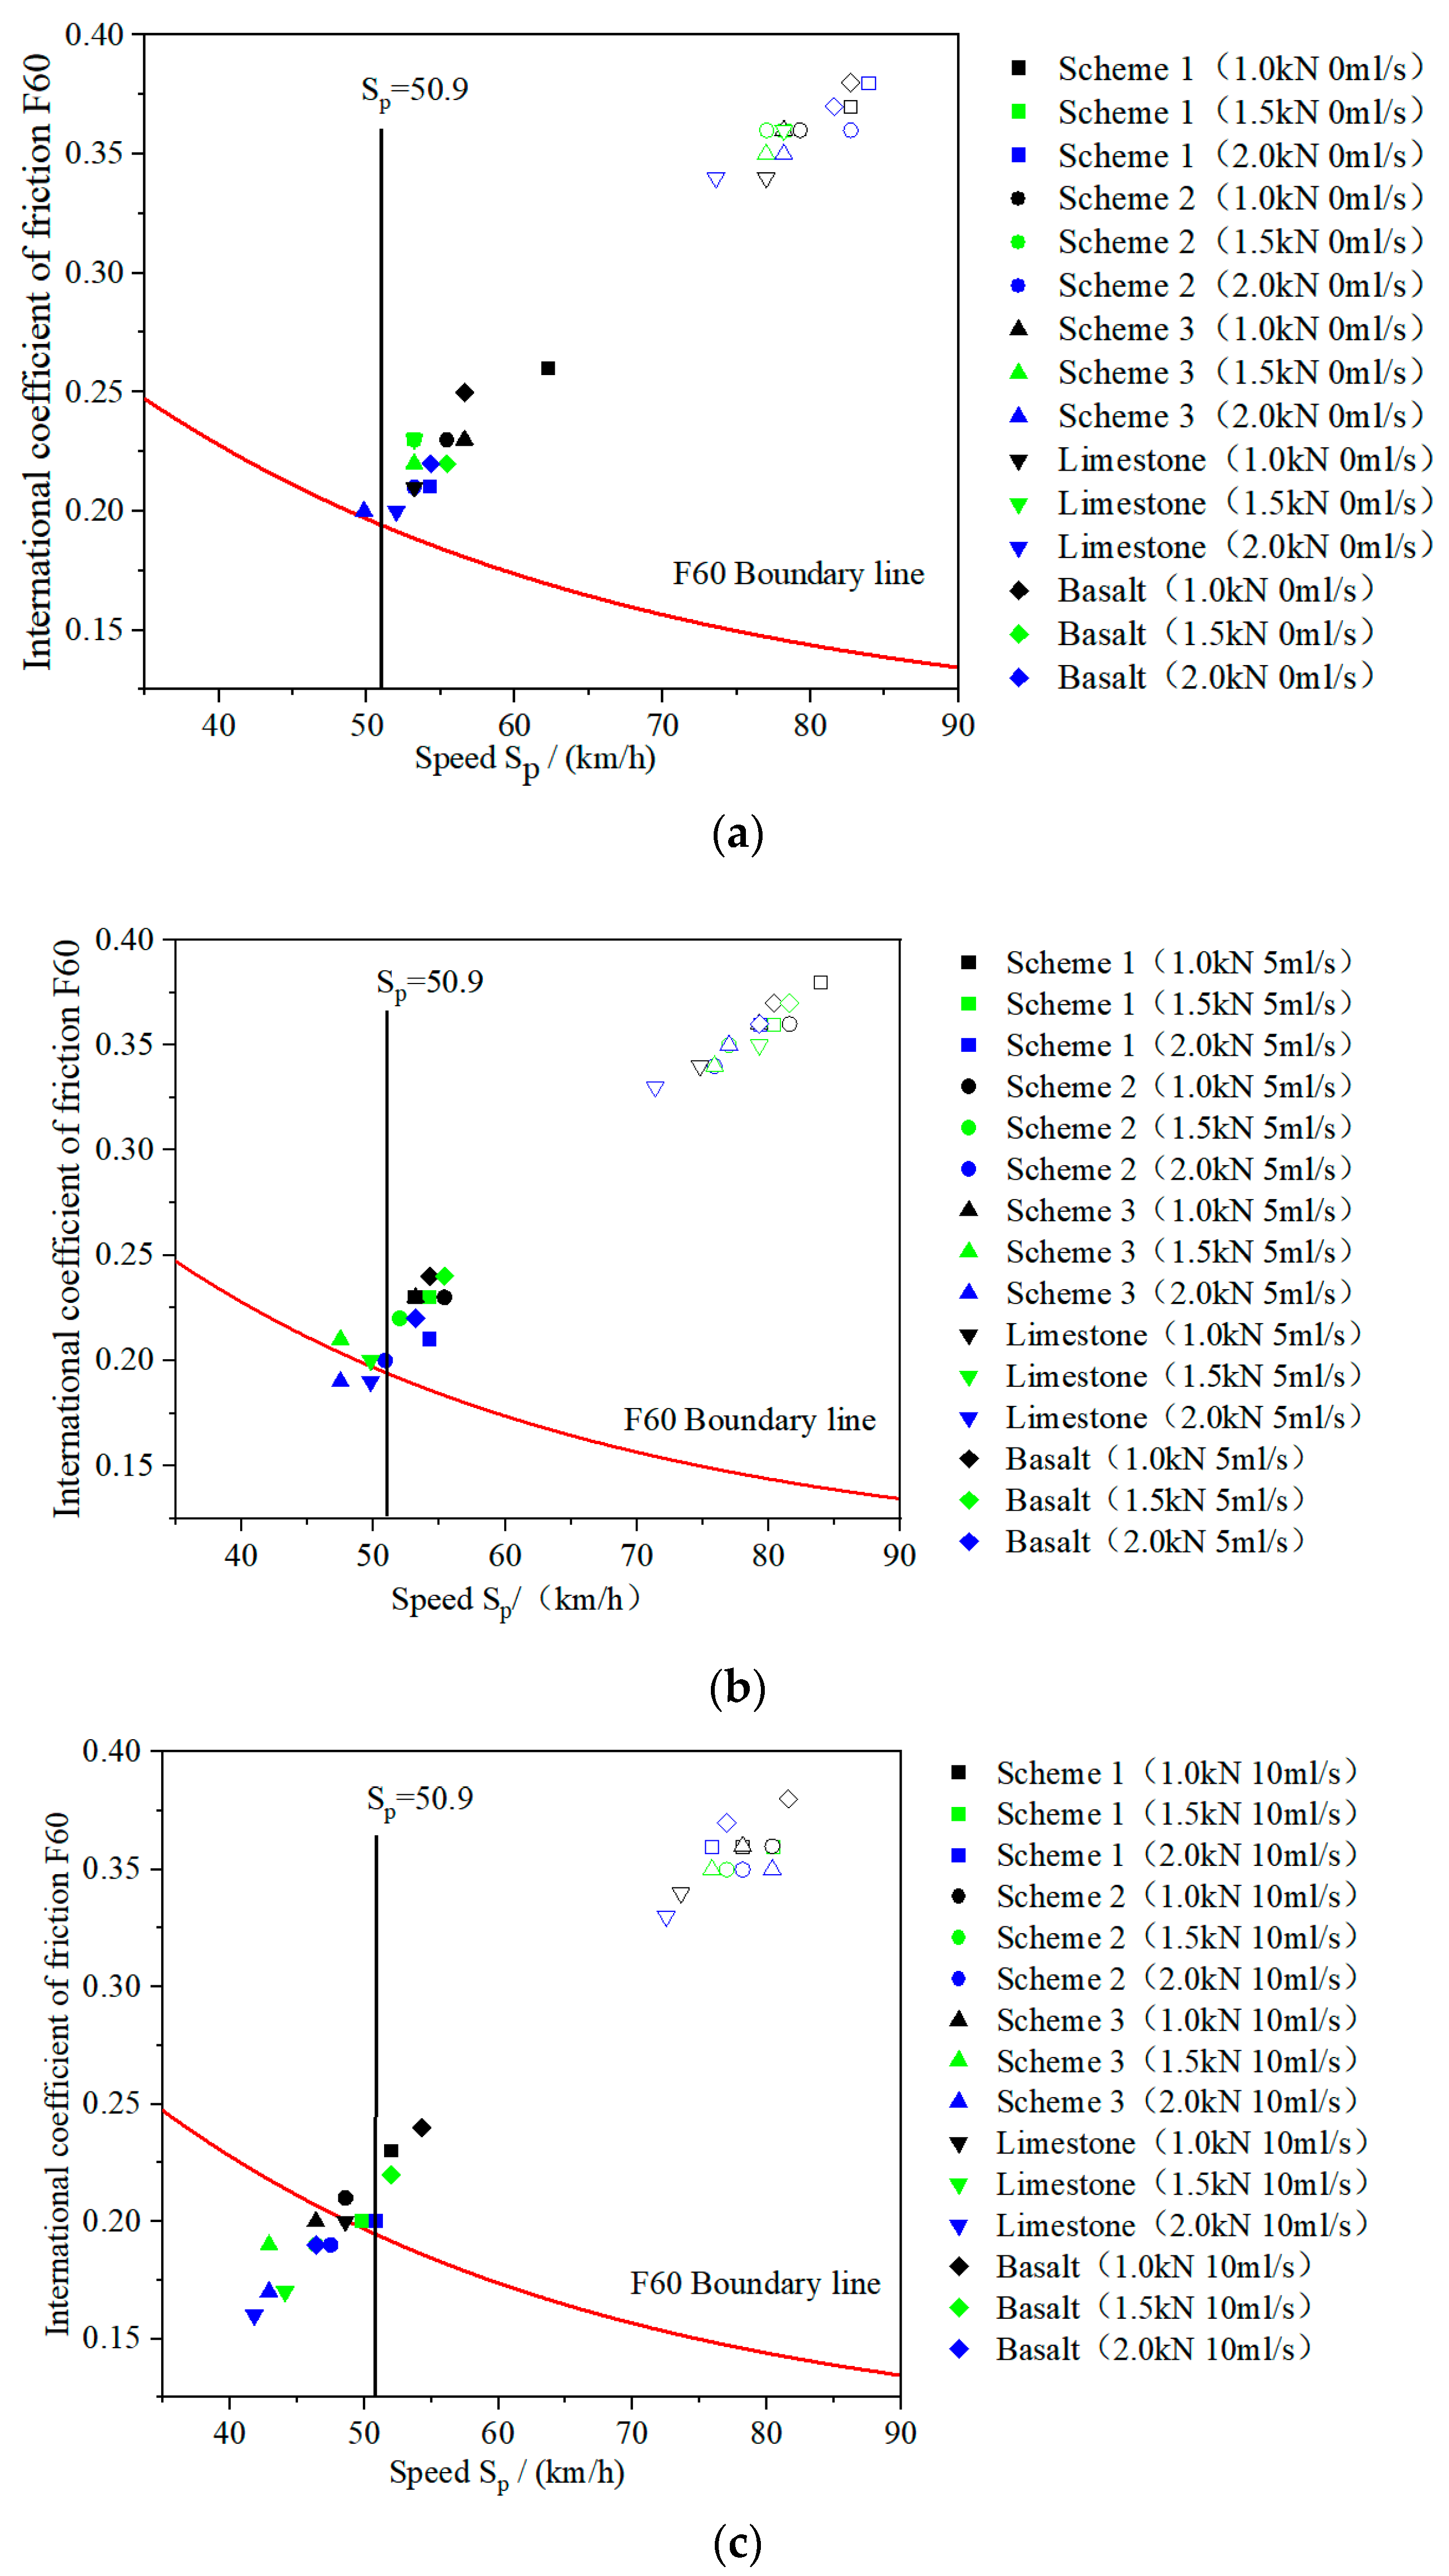
Substitute the mean texture depth (MTD) obtained from the moving load test and the PIARC-calibrated system parameters of the testing equipment (A, B, a, b) into the PIARC model to calculate the International Friction Index (IFI) values (F60, Sp). White dots represent initial values, while solid dots represent final values (Figure 11).
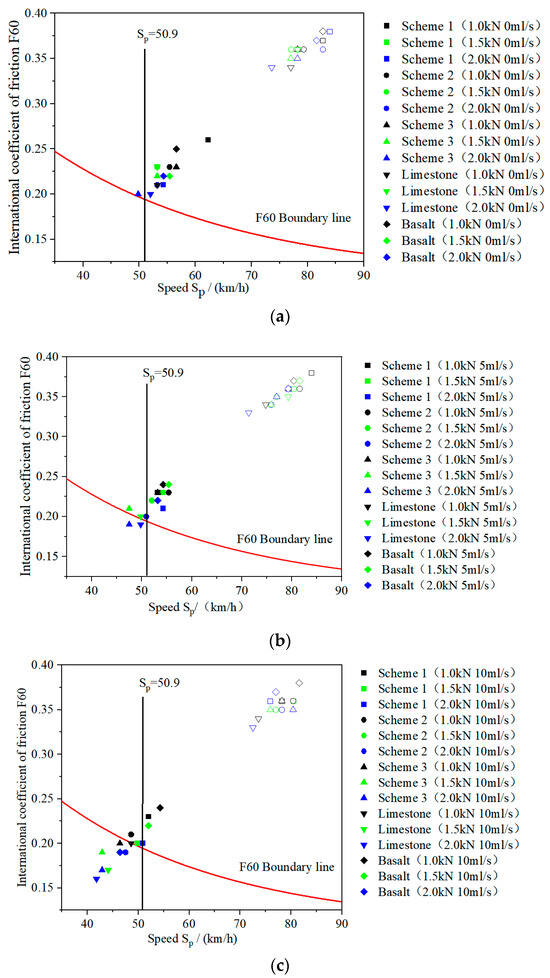
Figure 11.
IFI values (F60, SP) for each scheme: (a) 0 mL/s water flow; (b) 5 mL/s water flow; (c) 10 mL/s water flow.
As shown in the above figure, at hour 0, scheme 1 and the pure basalt scheme exhibit higher F60 values, concentrated between 0.36 to 0.38 and 0.37 to 0.38, respectively, indicating good skid resistance performance. As time progresses, the overall friction values move towards the lower left corner while still maintaining their position in the upper right corner, demonstrating good skid resistance of the road. Over time, some schemes’ friction values start to appear in zones B and D, especially under a water flow of 10 mL/s and a pressure of 2.0 kN. The variation in friction values under different water flow conditions also shows different trends, with the basalt content having a significant impact on the skid resistance performance of the mixtures.
Under the same load pressure conditions, the decrease in the International Friction Index values with increasing water flow is not significant, while the influence of load pressure is greater than that of water flow, which once again confirms the conclusions of the orthogonal test.
3.3. Anti-Skid Surface Service Life Estimation
Hofko et al. [42] proved it possible to establish correlations between laboratory wear tests and field data under actual traffic conditions to predict pavement skid resistance. In this study, the estimation of anti-skid service life was first carried out by establishing the equivalent relationship between indoor test loading time and actual traffic volume. Subsequently, the anti-skid life based on indoor experiments was converted to pavement service life.
3.3.1. Relationship between Indoor Experiments and Actual Traffic Volume
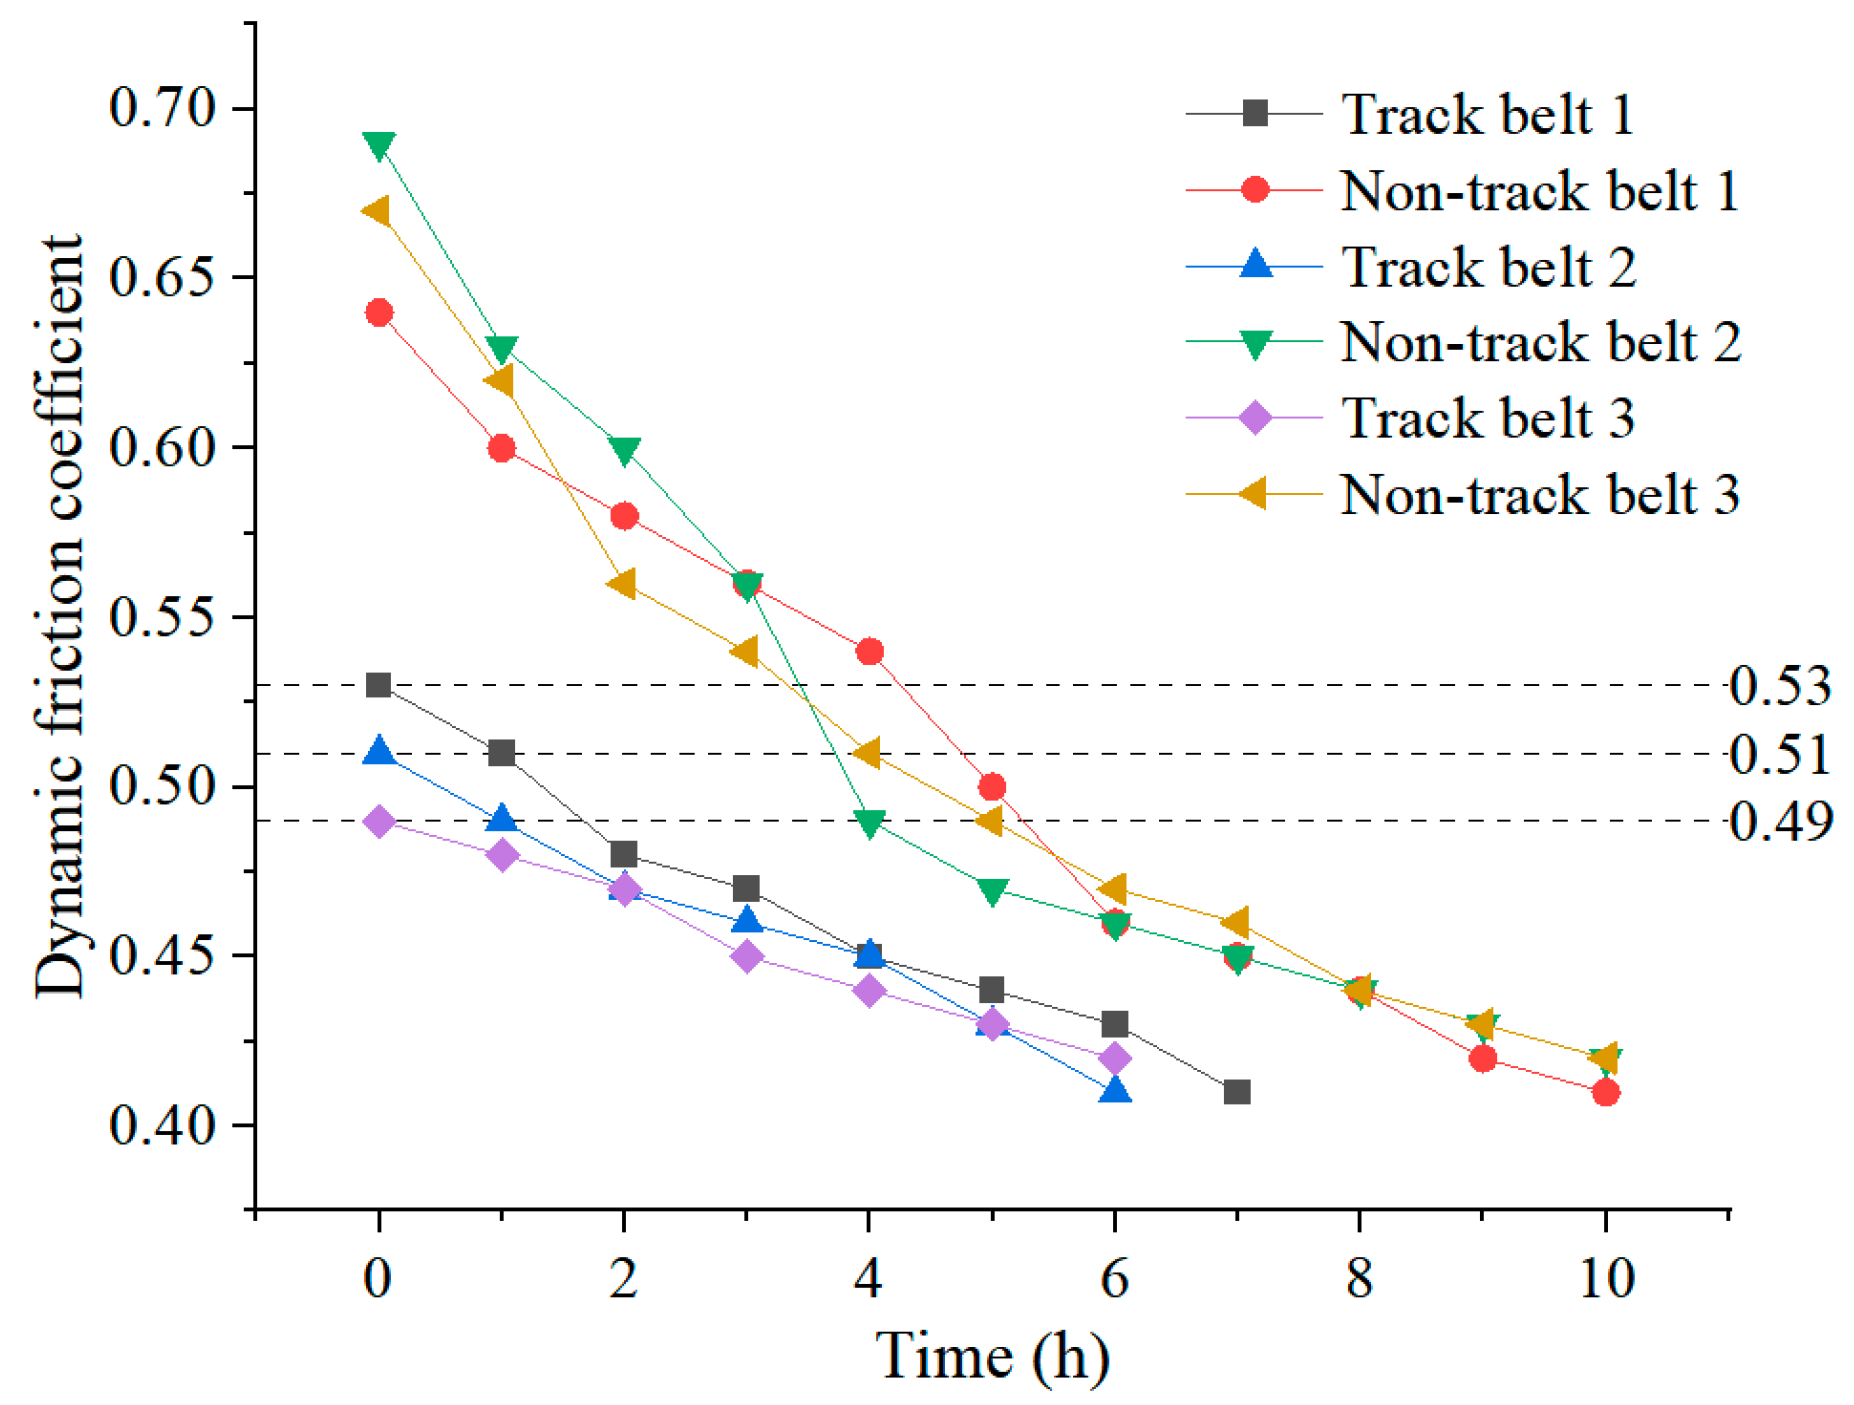
Samples of the anti-skid surface are cut from both the roadway and the roadside of the outdoor experimental section. Using the friction tester (as shown in Figure 2), data on the anti-skid abrasion resistance of the aggregate mixture specimens during accelerated wear processes are recorded in hours, represented by the friction coefficient Dμ during abrasion. The experiment utilizes the “5 mL/s, 100 kg” procedure to subject the specimens to accelerated wear tests, and measurements of the dynamic friction coefficient Dμ are taken using the friction tester. The dynamic friction coefficient curve is then plotted, as shown in Figure 12.

Figure 12.
Different position decay curves of dynamic friction coefficients.
As shown in the figure, when several non-track band specimens reach the same polished wear state as the non-track band specimens, they need to undergo accelerated loading tests for 4.3 h, 3.8 h, and 5 h, respectively (adjustable), with an average of 4.4 h. After verification, the annual traffic volume on this section of the road since its opening is shown in Table 10.
Table 10.
Annual traffic volume on the road section (unit: vehicles).
According to Table 9, it can be inferred that the anti-skid performance of the roadway after being subjected to friction by 572,780 standard vehicles is approximately equivalent to the anti-skid performance of the friction tester after 4.4 h of friction. Therefore, 1 h of friction in the friction tester is equivalent to the effect of 130,177 standard vehicles.
3.3.2. Skid Resistance Performance of Asphalt Mixture with Different Basalt Content
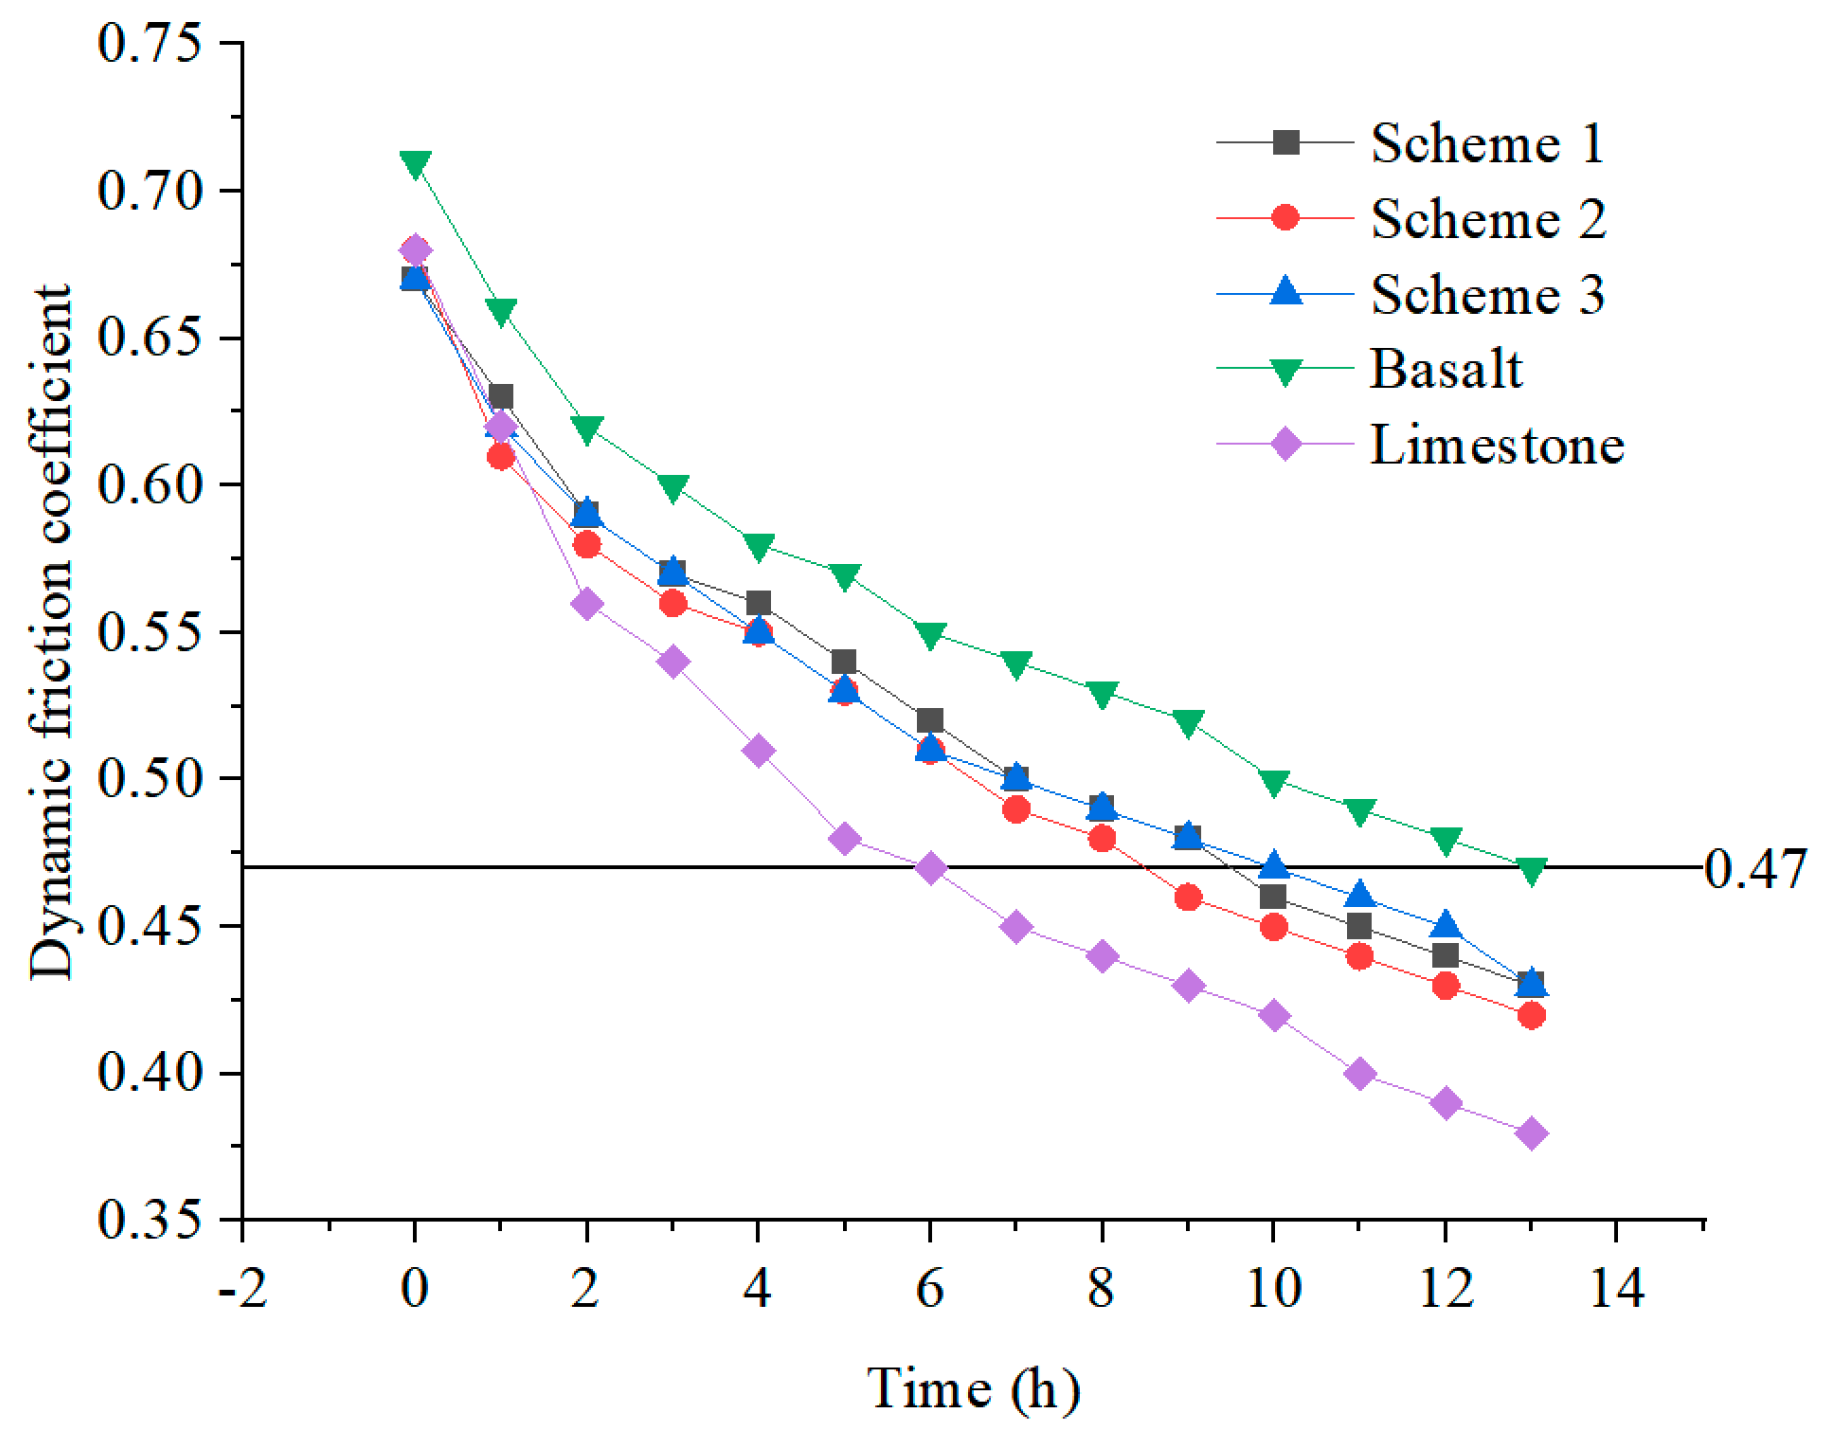
The friction tester’s test procedure was set with a water flow rate of 5 mL/s and a load of 100 kg to test the dynamic friction coefficients of asphalt mixture specimens with different basalt content. The resulting curves are shown in Figure 13.
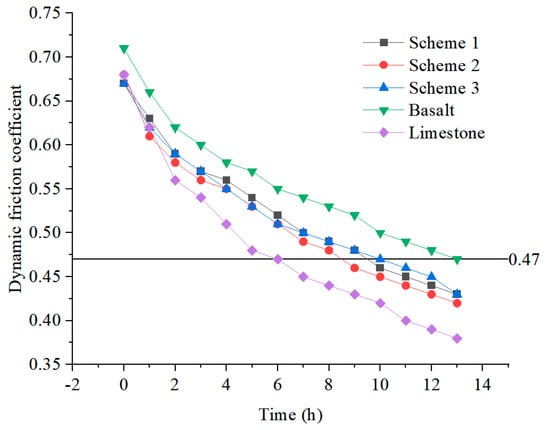
Figure 13.
Dynamic friction coefficient decay curves for several schemes.
According to the Specifications for Design of Highway Asphalt Pavement of China (JTG D50-2017 [43]), for highways, primary roads, secondary roads in mountainous and hilly areas, and tertiary roads, the pavement at the acceptance inspection must have a texture depth of at least 0.55 mm when the average annual rainfall exceeds 1000 mm. The corresponding limit value for the dynamic friction coefficient (Dμ) is 0.47. Based on this value, the long-term skid resistance life of each specimen can be calculated. As shown in the figure, the times for the dynamic friction coefficient Dμ of asphalt mixtures with different basalt contents to reach the limit value of 0.47 are 9.6 h, 8.5 h, 10 h, 13 h, and 6 h. These times correspond to the effects of 1,249,699, 1,106,505, 1,301,770, 1,692,301, and 781,062 standard vehicles, respectively. Based on historic traffic information (seen in Table 8), the vehicle numbers are converted to the number of years (starting from 2021) for the five schemes, which are 9.34 years, 8.37 years, 9.69 years, 12.34 years, and 6.16 years, respectively. The asphalt mixture with pure basalt has a friction life more than double that with pure limestone.
3.3.3. Aggregate Cost Budget
The cost budget was based on a potential pavement test section that is 607 m long, with a roadbed width of 6.5 m and a 4 cm thick surface layer. Using the previously studied basalt content levels of 100% and 0% as a comparison, the aggregate usage for the anti-skid surface layer with different basalt content is calculated as shown in Table 11. The quantities and costs of basalt and limestone aggregates for different basalt contents are detailed in Table 12. Finally, the total maintenance costs for basalt and limestone aggregates over the same period (proposed 50 years) are calculated and presented in Table 13. The number of maintenance cycles for each test group was determined by dividing the maintenance period of 50 years by the pavement service life of each group.
Table 11.
Aggregate usage statistics table for different basalt contents.
Table 12.
Aggregate usage and cost for different basalt contents.
Table 13.
Total aggregate costs for different basalt contents over the same period (50 years).
After calculating the cost of outdoor experiment project quantities, the total maintenance cost over a proposed 50-year period was estimated. The number of maintenance activities required for each scheme over 50 years was multiplied by the respective maintenance costs and compared with scheme 1. The costs for scheme 1 over the same period were found to be 95% of scheme 2, 96.8% of scheme 3, 86.5% of the pure basalt scheme, and 99.6% of the pure limestone scheme. The scheme with 40% basalt content proves to be more cost effective while maintaining good skid resistance performance of the asphalt pavement.
In addition, according to the calculation results of the International Friction Index (IFI), scheme 1 remains in zone A after accelerated loading tests, indicating that its skid resistance performance remains excellent. Simultaneously, under a water flow rate of 10 mL/s, the IFI value after wear is precisely at the boundary between zones A and B. This approach not only ensures adequate skid resistance but also allows for cost control by using a lower proportion of basalt aggregate.
Based on the above cost budget table and the IFI calculation results, it was ultimately decided that scheme 1 (with 40% basalt aggregate) be used for the asphalt mixture in the outdoor test section.
4. Testing Section Study
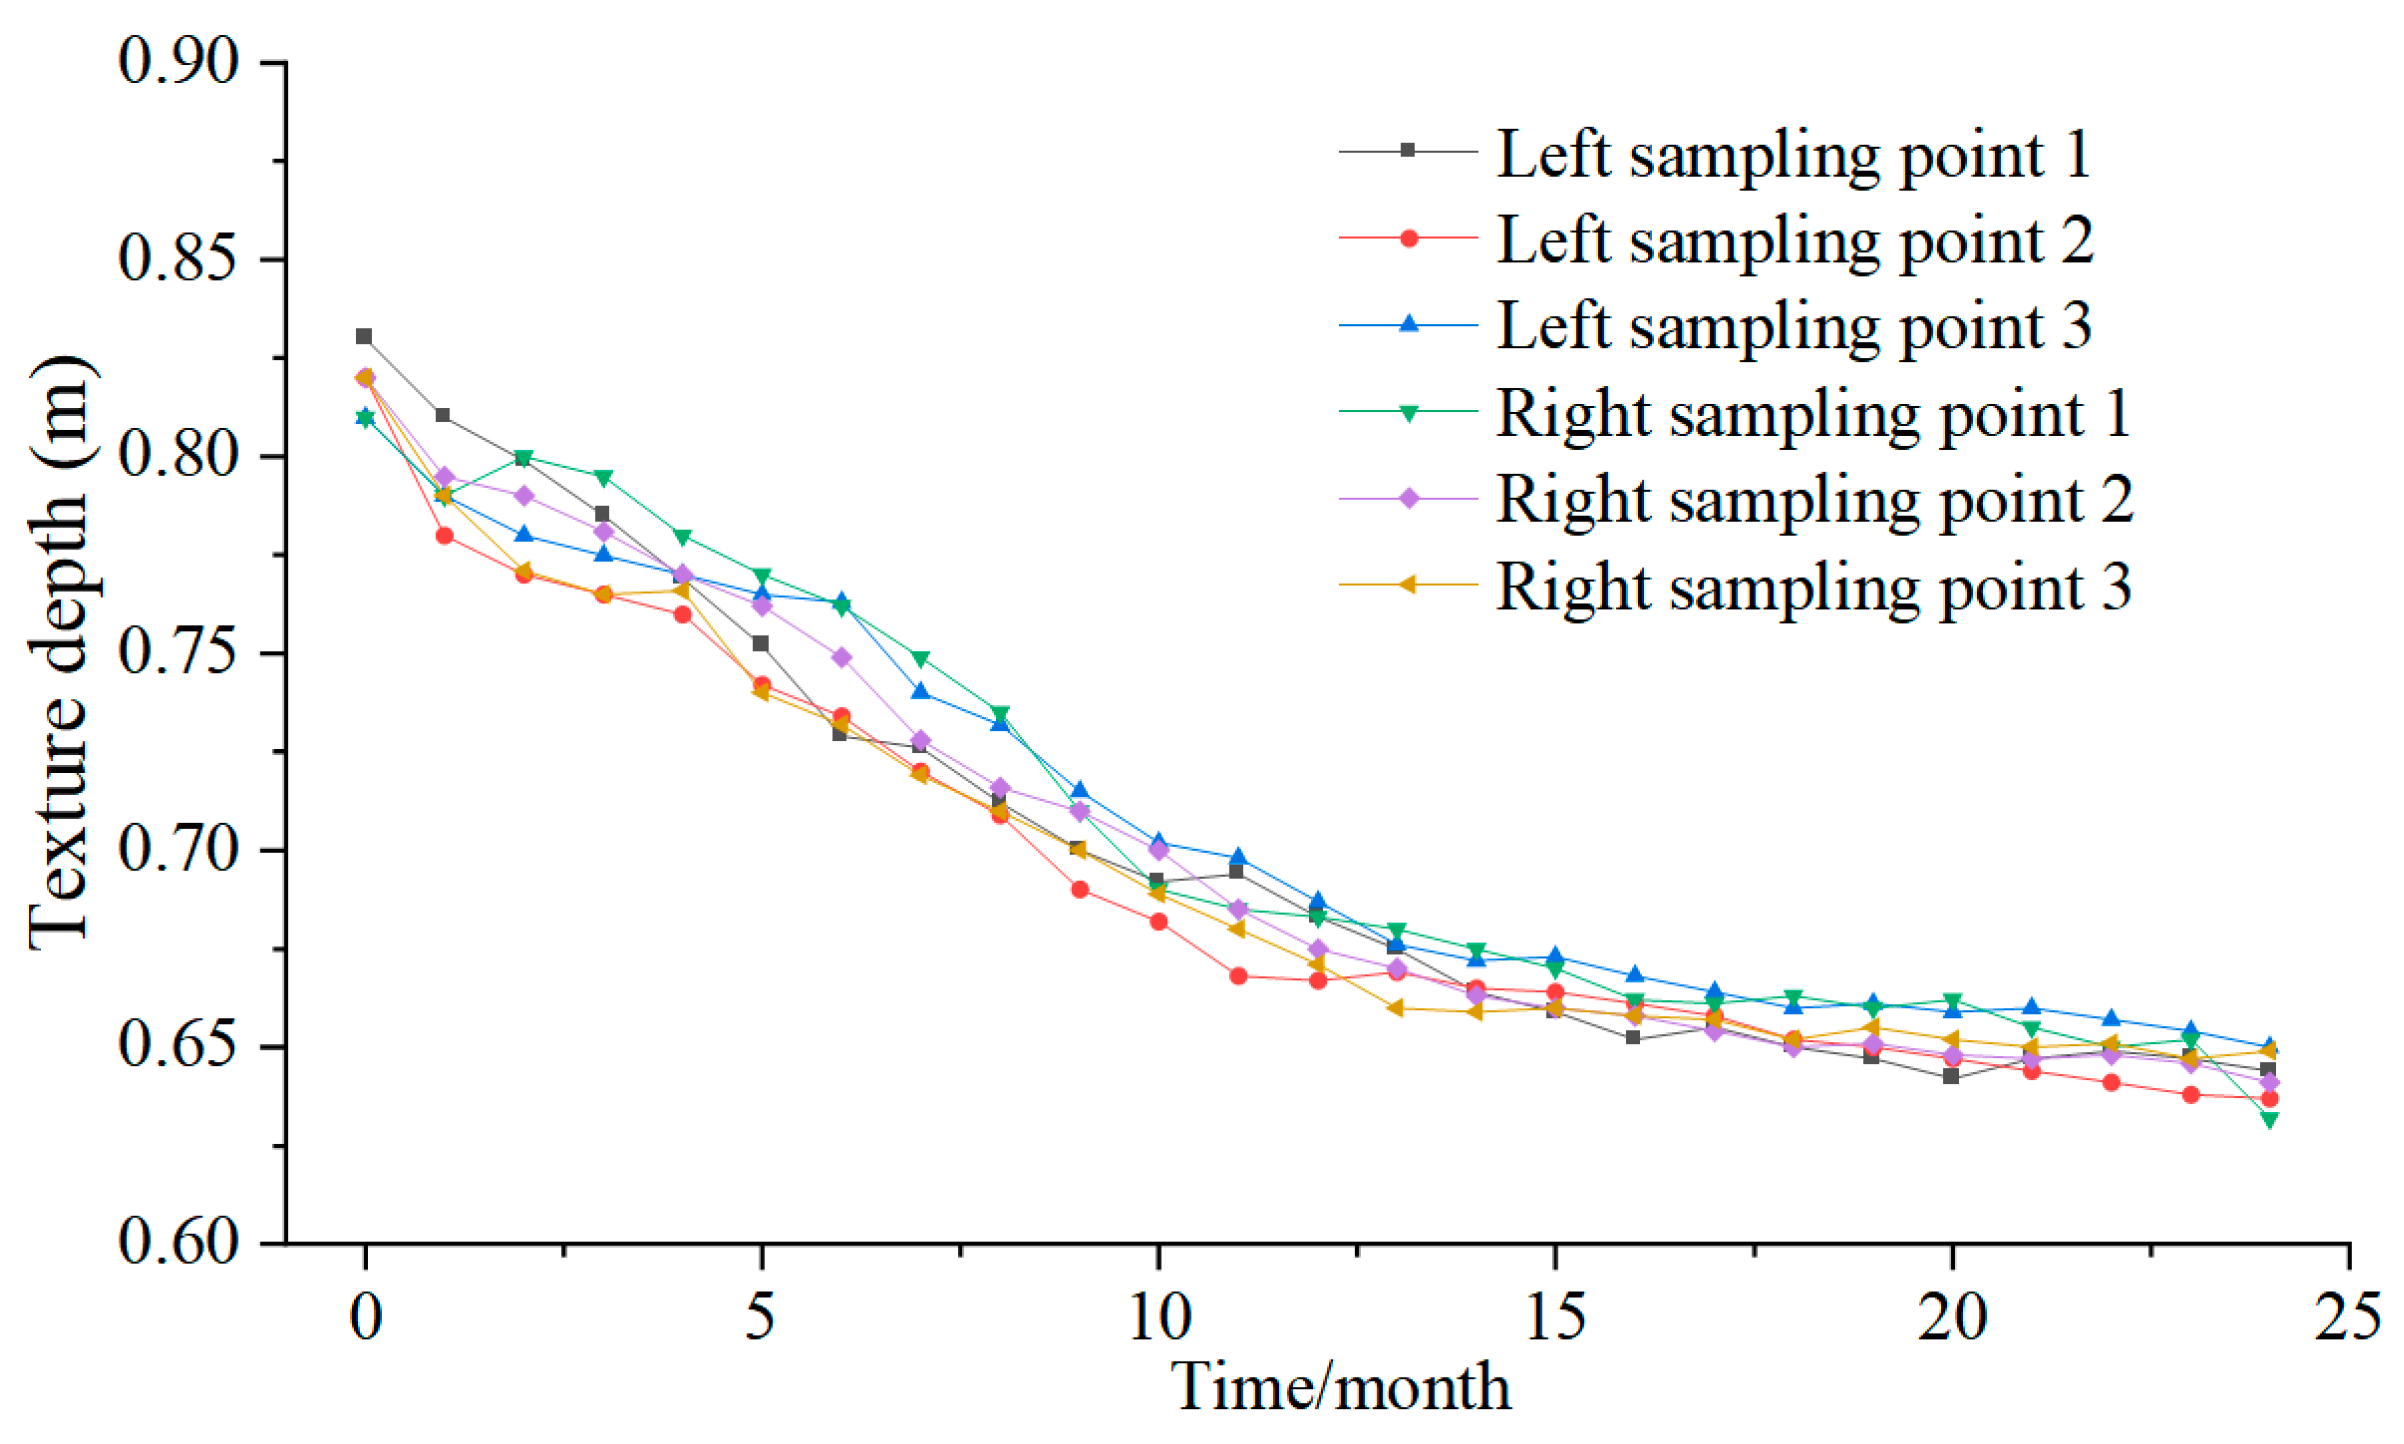
The study selected a total of six points to measure the texture depth (three points from each lane, all taken from the wheel paths). Data were collected over a total of 24 months, and the measurement results are shown in Figure 14.
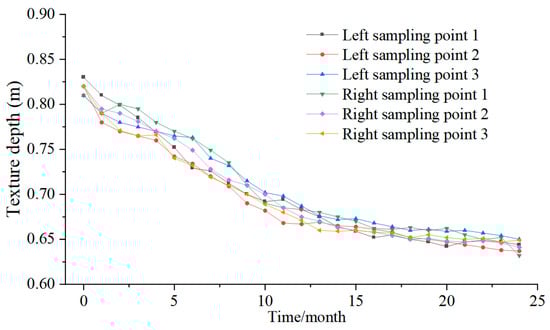
Figure 14.
Results of MTD measurements on the road over two years.
As shown in Figure 11, the texture depth of the road surface decreased rapidly immediately after opening to traffic. Starting from the tenth month, the rate of decrease in texture depth gradually slowed down. The actual measurement values of scheme 1 were converted into IFI values and compared with the indoor test results of scheme 1 (100 kg), the results of which are shown in Figure 15.
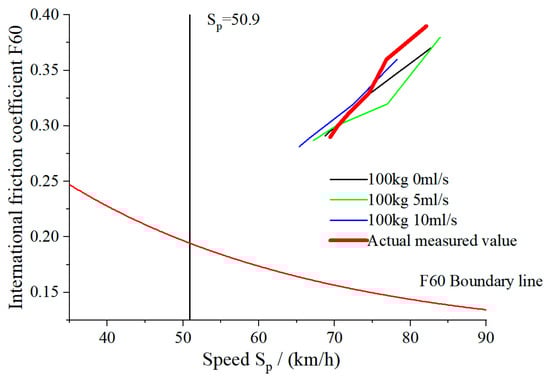
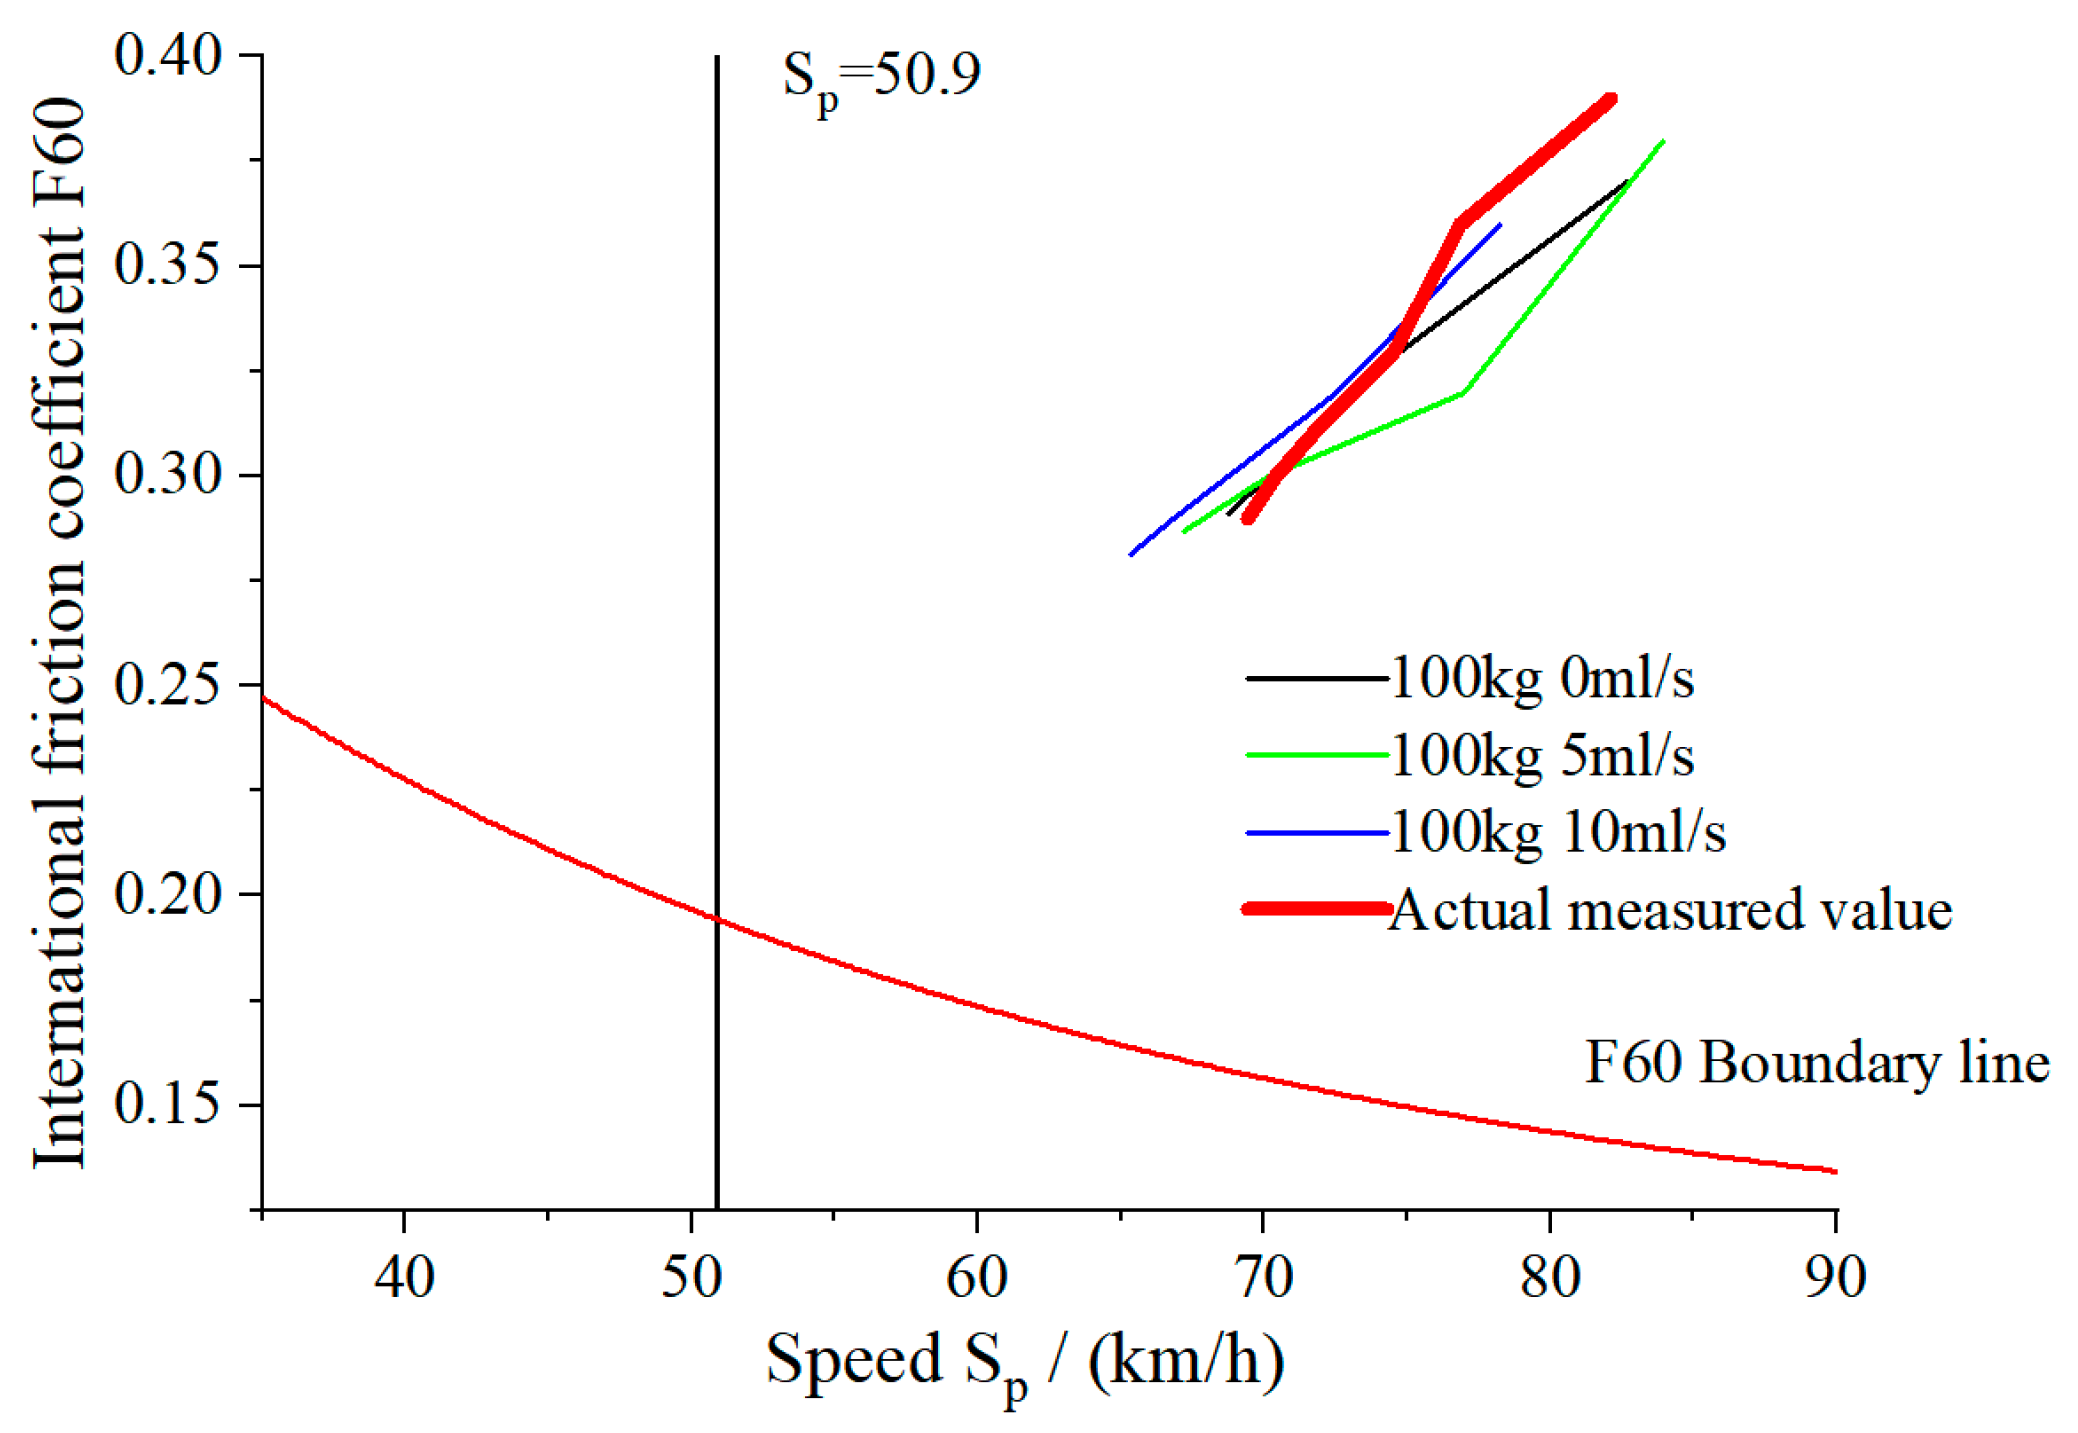
Figure 15.
IFI curves for road surface and indoor testing.
According to the investigation, the cumulative traffic volume on the test section over two years after completion of the paving was 316,074 vehicles. At the same time, during the service life prediction stage, it was determined that one hour of friction testing with the friction characteristics tester is equivalent to the action of 130,177 standard vehicles on the road surface. Therefore, the wear on the road surface from two years of traffic is equivalent to 2.44 h of testing with the friction tester. To more intuitively compare the abrasion resistance effect of outdoor experiments, several sets of scheme 1 (40% basalt) indoor test IFI curves for a load of 100 kg were extracted for the first 2.44 h of operation and compared with the calculated actual measurement values.
Figure 12 shows that IFI values calculated from the two-year road surface MTD and BPN both remain in zone A (upper right quadrant), indicating that the test section can provide good skid resistance performance for an extended period. Over time, the IFI values gradually move from the upper right quadrant of zone A towards the lower left quadrant. The downward trend in IFI values over two years is similar to the trend observed in indoor accelerated wear tests. Both measured and tested points are shifting towards the Sp = 50.9 and F60 boundary line intersection at a similar rate. Overall, the results from the test section confirmed that scheme 1 (40% basalt) can ensure good skid resistance. Additionally, the comparison of indoor tests and measured data can validate the accuracy obtained when using traffic volume to predict the service life of the anti-skid surface layer of the asphalt mixture.
The material properties of limestone and basalt vary across different regions of the world, so the optimal basalt content cannot be universally applied to other countries. However, the methods proposed in this study to determine the optimal basalt content can serve as a reference for other regions, via which engineers across the world can learn from the experience of this study. First, the potential range of optimal basalt content can be estimated based on the results of basic friction tests, such as PSV and crushing value. Second, the IFI can be used to determine the basalt content, with the optimal amount ideally bringing the IFI value just above the lower limit set by standards. If the IFI is significantly higher than this lower limit, it results in unnecessary use of basalt material. Additionally, cost control is an effective method for determining the basalt content. While a higher basalt content increases construction costs, it reduces maintenance costs in the long run by decreasing the required maintenance time. By balancing these factors, the optimal basalt content can be determined.
5. Conclusions
This study investigated the skid resistance performance of asphalt mixtures containing composite aggregates of basalt and limestone. An accelerated wear tester was employed to obtain the following friction indices: the British pendulum number (BPN), mean texture depth (MTD), and dynamic friction coefficient (Dµ). The International Friction Index (IFI) was introduced to describe the degradation of skid resistance. The service life of the mixture was predicted, and the optimum basalt content was chosen. The optimal basalt was validated through a test section study. The main conclusions drawn from the study are as follows:
Accelerated wear tests were conducted on mixtures with different basalt contents under varying water flow rates (0 mL/s, 5 mL/s, 10 mL/s) and loads (100 kg, 150 kg, 200 kg). The results indicate a decrease in BPN and MTD with increasing water flow, load, and wear cycles. The skid resistance initially sharply decreased followed by a more gradual decline, eventually stabilizing. Orthogonal experiments revealed that the sensitivity sequence of factors affecting skid resistance performance was basalt content > load > water flow rate, highlighting the significance of basalt content in influencing the skid resistance performance of asphalt mixtures.
The skid resistance and MTD values were converted into IFI values, and a four-area diagram was drawn to describe the deterioration of skid resistance. In the four-area IFI diagram, IFI points with a higher basalt content mixture (over 40%) move toward the lower left corner while still maintaining their position in the upper right corner, demonstrating good skid resistance. However, lower basalt content mixtures fall into the undesirable area. The IFI indicator shows that the basalt content has a significant impact on the skid resistance performance of the mixtures.
The estimation of anti-skid service life was first carried out by establishing the equivalent relationship between indoor test loading time and actual traffic volume. Subsequently, the anti-skid life of asphalt mixtures containing various contents of basalt obtained from indoor experiments was converted to pavement service life. The asphalt mixture containing basalt significantly increases the friction life. Specifically, the asphalt mixture with pure basalt has a friction life more than double that with pure limestone (for the specific traffic pattern of this study). The scheme with 40% basalt content proves to be more cost effective while maintaining good skid resistance performance of the asphalt pavement after a cost analysis based on the life prediction.
The test section study confirmed that 40% basalt can ensure good skid resistance. Additionally, the comparison of indoor tests and measured data validated the accuracy obtained when using traffic volume to predict the service life of the asphalt mixture’s anti-skid surface layer. However, the test section has been running for only two years, and more data will be obtained in the future to validate the skid performance over a longer period.
Author Contributions
Conceptualization, Y.M.; methodology, Y.M. and Z.C.; experiment, Z.C. and Z.W.; validation, Y.M., Z.C. and H.L.; formal analysis, Z.W.; investigation, Z.C.; resources, Z.L.; data curation, H.L.; writing—original draft preparation, Z.C.; writing—review and editing, H.L. and Y.W.; visualization, Z.W.; supervision, Y.M.; project administration, G.Q.; funding acquisition, Z.L. All authors have read and agreed to the published version of the manuscript.
Funding
The research is supported by the National Key Research and Development Program of China (2022YFC3002603); the Science and technology project from the Highway Bureau of Guizhou (2023QLK02); and the Graduate Joint Training Base Construction Project of Chongqing (JDLHPYJD-2020029).
Data Availability Statement
The authors confirm that the data supporting the findings of this study are available within the article.
Conflicts of Interest
Authors Guangyan Qing and Zhongshuai Liu were employed by the company China Merchants Chongqing Transportation Research and Design Institute Co., Ltd. The remaining authors declare that the research was conducted in the absence of any commercial or financial relationships that could be construed as a potential conflict of interest.
References
- Wang, D.; Chen, X.; Oeser, M.; Stanjek, H.; Steinauer, B. Study of micro-texture and skid resistance change of granite slabs during the polishing with the Aachen Polishing Machine. Wear 2014, 318, 1–11. [Google Scholar] [CrossRef]
- Wang, Y.; Chen, X.; Lu, H.; Xiao, R.; Hu, W.; Jiang, X.; Zhou, H.; Huang, B. Laboratory investigation on electrical and mechanical properties of asphalt mixtures for potential snow-melting and deicing pavements. Constr. Build. Mater. 2024, 413, 134901. [Google Scholar] [CrossRef]
- Xiao, R.; Nie, Q.; He, J.; Lu, H.; Shen, Z.; Huang, B. Utilizing lowly-reactive coal gasification fly ash (CGFA) to stabilize aggregate bases. J. Clean. Prod. 2022, 370, 133320. [Google Scholar] [CrossRef]
- Xiao, R.; Polaczyk, P.; Wang, Y.; Ma, Y.; Lu, H.; Huang, B. Measuring moisture damage of hot-mix asphalt (HMA) by digital imaging-assisted modified boiling test (ASTM D3625): Recent advancements and further investigation. Constr. Build. Mater. 2022, 350, 128855. [Google Scholar] [CrossRef]
- Lu, H.; Zhao, C.; Yuan, J.; Yin, W.; Wang, Y.; Xiao, R. Study on the Properties and Benefits of a Composite Separator Layer in Airport Cement Concrete Pavement. Buildings 2022, 12, 2190. [Google Scholar] [CrossRef]
- Miao, Y.; Wang, S.; Sun, F.; Yang, J. A laboratory investigation into the polishing behavior of stone matrix asphalt with different lithology types of coarse aggregates. J. Test. Eval. 2022, 50, 1749–1762. [Google Scholar] [CrossRef]
- Tanzadeh, R.; Tanzadeh, J.; Tahami, S.A. Experimental study on the effect of basalt and glass fibers on behavior of open-graded friction course asphalt modified with nano-silica. Constr. Build. Mater. 2019, 212, 467–475. [Google Scholar] [CrossRef]
- Xu, G.; Fan, J.; Ma, T.; Zhao, W.; Ding, X.; Wang, Z. Research on application feasibility of limestone in sublayer of Double-Layer permeable asphalt pavement. Constr. Build. Mater. 2021, 287, 123051. [Google Scholar] [CrossRef]
- Asi, I.M. Evaluating skid resistance of different asphalt concrete mixes. Build. Environ. 2007, 42, 325–329. [Google Scholar] [CrossRef]
- Boğa, A.R.; Şenol, A.F. The effect of waste marble and basalt aggregates on the fresh and hardened properties of high strength self-compacting concrete. Constr. Build. Mater. 2023, 363, 129715. [Google Scholar] [CrossRef]
- Kong, L.; Zeng, Q.; Zhang, Z.; Peng, Y.; Wang, D.; Yu, M.; Zhan, Y. Antiskid decay prediction of asphalt mixtures based on aggregate mechanical properties and gradation fractals. J. Southeast Univ. (Engl. Ed.) 2024, 40, 58. [Google Scholar]
- Cao, J.B. Structural and Functional Study of Asphalt Pavement Structure with Limestone as Coarse Aggregate. Master’s Thesis, Chongqing Jiaotong University, Chongqing, China, 2017. [Google Scholar]
- Xu, X.H. Study on the Application of Limestone in the Skid-Resistant Surface Layer of Asphalt Pavement on Highways. Ph.D. Thesis, Chongqing Jiaotong University, Chongqing, China, 2010. [Google Scholar]
- İskender, E. Rutting evaluation of stone mastic asphalt for basalt and basalt–limestone aggregate combinations. Compos. Part B Eng. 2013, 54, 255–264. [Google Scholar] [CrossRef]
- Kong, D.; Xiao, Y.; Wu, S.; Tang, N.; Ling, J.; Wang, F. Comparative evaluation of designing asphalt treated base mixture with composite aggregate types. Constr. Build. Mater. 2017, 156, 819–827. [Google Scholar] [CrossRef]
- Ibrahim, A.; Faisal, S.; Jamil, N. Use of basalt in asphalt concrete mixes. Constr. Build. Mater. 2009, 23, 498–506. [Google Scholar] [CrossRef]
- Li, J.; Wu, H.; Wu, X.; Cai, D.; Yao, Y.; LÜ, J.; Tian, Y. Effects of long-term tillage measurements on soil aggregate characteristic and microbial diversity. Yingyong Shengtai Xuebao 2014, 25, 2341. [Google Scholar]
- Li, P.; Yi, K.; Yu, H.; Xiong, J.; Xu, R. Effect of aggregate properties on long-term skid resistance of asphalt mixture. J. Mater. Civ. Eng. 2021, 33, 04020413. [Google Scholar] [CrossRef]
- Qi, L.; Liu, J.; Liu, Z. Anti-skid durability of porous drainage asphalt mixture based on discrete element. Proc. Inst. Civ. Eng.-Smart Infrastruct. Constr. 2023, 40, 1–11. [Google Scholar] [CrossRef]
- Adresi, M.; Lacidogna, G. Investigating the micro/macro-texture performance of roller-compacted concrete pavement under simulated traffic abrasion. Appl. Sci. 2021, 11, 5704. [Google Scholar] [CrossRef]
- Flintsch, G.W.; De León, E.; McGhee, K.K.; AI-Qadi, I.L. Pavement surface macrotexture measurement and ap-plications. Transp. Res. Rec. 2003, 1860, 168–177. [Google Scholar] [CrossRef]
- Lin, C.; Tongjing, W. Effect of fine aggregate angularity on skid-resistance of asphalt pavement using accelerated pavement testing. Constr. Build. Mater. 2018, 168, 41–46. [Google Scholar] [CrossRef]
- Sengoz, B.; Onsori, A.; Topal, A. Effect of aggregate shape on the surface properties of flexible pavement. KSCE J. Civ. Eng. 2014, 18, 1364–1371. [Google Scholar] [CrossRef]
- Kane, M.; Artamendi, I.; Scarpas, T. Long-term skid resistance of asphalt surfacings: Correlation between Wehner–Schulze friction values and the mineralogical composition of the aggregates. Wear 2013, 303, 235–243. [Google Scholar] [CrossRef]
- Yu, Y.; Tang, S.; Xu, G.; Fan, Y.; Wu, Y.; Wang, H.; Yang, J. Investigations on the long-term skid resistance of epoxy asphalt mixture based on accelerated loading test. Constr. Build. Mater. 2023, 365, 130150. [Google Scholar] [CrossRef]
- Saeed, A.; Hall, J.W. NCHRP Report 512: Accelerated Pavement Testing Data Guidelines. Natl. Highw. Coop. Res. Program 2003. [Google Scholar] [CrossRef]
- Ragni, D.; Montillo, T.; Marradi, A.; Canestrari, F. Fast falling weight accelerated pavement testing and laboratory analysis of asphalt pavements reinforced with geocomposites. Lect. Notes Civ. Eng. 2020, 48, 417–430. [Google Scholar]
- Manosalvas-Paredes, M.; Comes, A.N.; Francesconi, M.; Khosravifar, S.; Ullidtz, P. Fast falling weight deflectometer (FastFWD) for accelerated pavement testing (APT). In Bearing Capacity of Roads, Railways and Airfields; CRC Press: Boca Raton, FL, USA, 2017; pp. 2235–2241. [Google Scholar]
- Ingrassia, L.P.; Virgili, A.; Canestrari, F. Accelerated pavement testing and laboratory analysis. Case Stud. Constr. Mater. 2020, 12, e00342. [Google Scholar]
- Wu, Z.; Abadie, C. Laboratory and field evaluation of asphalt pavement surface friction resistance. Front. Struct. Civ. Eng. 2018, 12, 372–381. [Google Scholar] [CrossRef]
- Dunford, A.M.; Parry, A.R.; Shipway, P.H.; Viner, H.E. Three-dimensional characterization of surface texture for road stones undergoing simulated traffic wear. Wear 2012, 292, 188–196. [Google Scholar] [CrossRef]
- ASTM C88/C88M-24; Standard Test Method for Soundness of Aggregates by Use of Sodium Sulfate or Magnesium Sulfate. ASTM: West Conshohocken, PA, USA, 2024.
- ASTM D36/D36M-14(2020); Standard Test Method for Softening Point of Bitumen (Ring-and-Ball Apparatus). ASTM: West Conshohocken, PA, USA, 2020.
- ASTM E303-22; Standard Test Method for Measuring Surface Frictional Properties Using the British Pendulum Tester. ASTM: West Conshohocken, PA, USA, 2022.
- JTG E42-2005; Test Methods of Aggregate for Highway Engineering. Ministry of Transport: Beijing, China, 2005.
- JTG E41-2005; Test Methods of Rock for Highway Engineering. Ministry of Transport: Beijing, China, 2005.
- JTG E20-2011; Standard Test Methods of Bitumen and Bituminous Mixtures for Highway Engineering. Ministry of Transport: Beijing, China, 2011.
- Fuentes, L.G.; Gunaratne, M. Revised Methodology for Computing International Friction Index. Transp. Res. Rec. 2011, 2227, 129–137. [Google Scholar] [CrossRef]
- ASTME 1960(R2015); Standard Practice for Calculating International Friction Index of a Pavement Surface. ASTM: West Conshohocken, PA, USA, 2015.
- Wambold, J.C.; Antle, C.E.; Henry, J.J.; Rado, Z. International PIARC Experiment to Compare and Harmonize Texture and Skid Resistance Measurements; PIARC: Paris, France, 1995. [Google Scholar]
- ASTM E965; Standard Test Method for Measuring Pavement Macrotexture Depth Using a Volumetric Technique. ASTM: West Conshohocken, PA, USA, 2019.
- Hofko, B.; Kugler, H.; Chankov, G.; Spielhofer, R. A laboratory procedure for predicting skid and polishing resistance of road surfaces. Int. J. Pavement Eng. 2019, 20, 439–447. [Google Scholar] [CrossRef]
- JTG D50-2017; Specifications for Design of Highway Asphalt Pavement. China Communications Press: Beijing, China, 2017.
Disclaimer/Publisher’s Note: The statements, opinions and data contained in all publications are solely those of the individual author(s) and contributor(s) and not of MDPI and/or the editor(s). MDPI and/or the editor(s) disclaim responsibility for any injury to people or property resulting from any ideas, methods, instructions or products referred to in the content. |
© 2024 by the authors. Licensee MDPI, Basel, Switzerland. This article is an open access article distributed under the terms and conditions of the Creative Commons Attribution (CC BY) license (https://creativecommons.org/licenses/by/4.0/).