Article

Effect of Grinding Conditions on Clinker Grinding Efficiency: Ball Size, Mill Rotation Speed, and Feed Rate

1
Department of Civil Engineering, Bursa Uludag University, Nilufer 16059, Bursa, Turkey
2
Department of Mathematics Education, Bursa Uludag University, Nilufer 16059, Bursa, Turkey
*
Author to whom correspondence should be addressed.
Buildings 2024, 14(8), 2356; https://doi.org/10.3390/buildings14082356
Submission received: 23 June 2024 / Revised: 25 July 2024 / Accepted: 27 July 2024 / Published: 31 July 2024

Abstract

:
The production of cement, an essential material in civil engineering, requires a substantial energy input, with a significant portion of this energy consumed during the grinding stage. This study addresses the gap in the literature concerning the collective impact of key parameters, including ball size, feed rate, and mill speed, on grinding efficiency. Nine spherical balls, ranging from 15–65 mm, were utilized in six distinct distributions, alongside varying feed rates and mill speeds. ANOVA, Taguchi, and regression analyses were employed to explore their influence on grinding efficiency and cement properties. The findings revealed that ball size variation significantly affects grinding performance, with smaller diameter balls yielding higher efficiency due to increased abrasion and fine formation. Conversely, elevating mill speed generally diminishes grinding efficiency, particularly at speeds approaching 90% of the critical speed, impacting ball shoulder and foot angles. Moreover, increasing the feed rate affects the grinding performance differently based on ball distribution, with finer distributions experiencing adverse effects. Signal-to-noise ratios facilitated determining the optimal control factor levels to minimize energy consumption. Quadratic regression models exhibited strong predictive capabilities for energy consumption in grinding. Ultimately, the optimal grinding performance was achieved with Bond-type ball distribution No. 6, considering ball size, mill speed, and feed-rate interactions, albeit with considerations regarding grinding time and energy efficiency.

1. Introduction

Approximately 130 kWh of energy is consumed during the production of one ton of cement [1,2,3,4]. It was reported that about one-third of this energy is consumed in the clinker grinding stage [5,6]. The parameters directly influencing the energy consumption in the clinker grinding stage include the type of mill employed, rotational speed, power, feed size, and quantity [7,8,9]. Additionally, the type and dimensions of the grinding media [10,11] play a crucial role in determining the energy consumed. Therefore, optimizing the clinker grinding process in terms of energy consumption can provide significant economic and ecological advantages [12,13]. It was emphasized that the operation of a ball mill during the grinding stage under optimum conditions depends primarily on the correct design, good definition of the mill’s operating parameters, and the correct determination of the effect of the change in these parameters on the mill and other equipment in the circuit during operation [14,15,16,17,18].
To increase grinding efficiency, it is very important to know the mechanisms that take place during grinding. It was reported that the grinding process is generally carried out through three different mechanisms [10,14,19]. These mechanisms are impact or compression due to forces applied normally to the particle surface, fragmentation due to oblique forces, and abrasion due to the forces acting in parallel. The forces generated by these mechanisms exceed the modulus of elasticity of the particles, causing deformation and fracture [20]. Large-diameter balls cause the feed size to decrease as a result of the impact or compression effect caused by falling from the shoulder of the mill during grinding [14,18]. It was emphasized that small-diameter balls cause the particle size of small feeds to decrease even more as a result of the abrasion effect created during the rotation of the mill [18,21].
In ball-milling processes, ball size has been reported to play a critical role in improving circuit performance and grinding efficiency [22,23]. An optimal combination of different ball sizes has been emphasized for effective grinding [10,14]. Magdalinovic et al. [23] suggested that small balls are more successful than large balls in terms of energy efficiency. In a study by Santosh et al. [8], maximum grinding efficiency was reported at higher mill speed (between 39 and 67 rpm) and moderate ball size (23 mm). In a silica ore grinding study conducted by Danha et al. [13], balls with a diameter of 10–50 mm were used. It was found that, when only 10 mm balls were used, large particle size was not reduced, and the grinding process time increased. It was reported that maximum energy efficiency was achieved when 10 and 20 mm balls were used together in fine-grained feeds. Another study on the subject found that, when balls smaller than 8 mm are used in grinding processes, the possibility of the material sticking to the mill linings and forming lumps increases [24].
As noted above, in addition to the ball size parameter, factors such as the amount of material ground and the grinding speed also play an important role in measuring and predicting grinding efficiency [10]. A study by Jayasundara et al. [25] presented two different views on the effect of mill speed on grinding performance. On the one hand, it was stated that higher mill speed can improve grinding performance due to the increase in total impact energy. On the other hand, energy efficiency may decrease at very high speeds because power consumption increases much faster than impact energy with increasing speed. In other words, at low RPM, the energy efficiency is high, but the grinding capacity is low. When the speed is high, the grinding capacity is relatively high, but the energy efficiency is low [25]. In this context, the choice of the optimum speed depends on the current situation. In another study by Fortsch [26], it was emphasized that the optimum mill speed is generally between 65 and 82% of the critical speeds. Deniz et al. [27] found that optimum grinding was achieved at 85% of the critical speed (85.9 rpm) in their study with mill speeds between 55 and 95% of the critical mill-speed value (101 rpm). The results of some studies on this subject are summarized in Table 1.
When the studies on the subject are examined, it is also understood from the literature that grinding efficiency is affected by various parameters [14,19,22,26,30]. A large number of experiments should be carried out to investigate the effect of these parameters on the optimum grinding efficiency. Many modeling and regression studies were carried out to facilitate this laborious and costly process [31]. The experimental design and regression models with the Taguchi method were widely applied for this purpose [31]. With the Taguchi method, it is possible to control variables caused by uncontrollable factors that traditional experimental design does not take into account [32]. In this method, the objective function values are converted into a signal-to-noise (S/N) ratio [33] to measure the performance characteristics of the levels of control factors against these factors. The S/N ratio is defined as the ratio of the desired signal to the undesired random noise value and shows the quality characteristics of the experimental data [34]. Each combination of control factors for the energy consumed is measured in the experimental design, and the S/N ratios are used to optimize the control factors. Low energy consumption in the grinding process is of great importance in terms of greenhouse-gas emissions, cost, and sustainability [2].
In the literature review, many experimental studies were found that focused on the effect of parameters such as ball and feed size, mill speed, and ball shape on grinding efficiency and product properties [18,22,26]. However, the literature addressing the collective influence of varying factors like ball size, feed rate, and mill speed on the efficiency of grinding is scarce. In this context, within the scope of this study, nine spherical balls ranging in size from 15 to 65 mm were used in different ratios to produce cement with six different ball distributions, three different feed rates, and three different mill speeds. The Blaine fineness values of the cements produced at certain speeds and the energy consumed for the target Blaine fineness value were analyzed to investigate the effect of the grinding conditions on grinding efficiency and product properties. In addition, linear and quadratic regressions were developed using Taguchi methods and ANOVA. In this study, the goal is to investigate the interplay between ball distribution, mill speed, and feed amount during the grinding process by analyzing key parameters through both experimental and regression methods. This approach aims to deliver ecological and economic benefits in cement production applications. However, it is important to note that conducting the experiments under laboratory conditions limits the broader applicability of the study’s findings.

2. Materials and Methods

All cement produced within the scope of the study consisted of 96% clinker and 4% gypsum. Some of the chemical properties of the clinker and gypsum supplied by the company are summarized in Table 2. The clinker and gypsum were prepared by sieving through a 3.35 mm sieve according to the Bond Standard before grinding. The materials passing through this sieve were used for the grinding process.
A laboratory-type mill with a capacity of 5 kg and a motor power of 1.5 kW, as shown in Figure 1, was used for clinker grinding. The mill feed (96% clinker + 4% gypsum) was selected as 2, 3 and 4 kg. Balls with nine different diameters in six different size distributions were used in the grinding process. The ball size distributions used in the study are shown in Table 3. Ball size distribution number 6 was selected according to the Bond standard, and the other 5 distributions were selected according to the literature. The critical speed of a ball mill is defined as the rotational speed at which the grinding media stays in place against the mill’s wall throughout a complete revolution. The effect of these parameters on the grinding efficiency was compared with 2 different approaches. In the 1st approach, the Blaine fineness values of cements produced after 4000, 5000, and 6000 cycles were measured. In the 2nd approach, the number of grinding cycles required to achieve the target Blaine fineness of 3700 ± 100 cm2/g was determined. The fineness of the cements produced was determined by an automatic Blaine instrument. Furthermore, for each grinding condition (ball distribution, mass, and speed), the energy consumed by the mill was calculated according to Equation (1).
Eg = (220 × To × A × 1000)/(m × Tg)
where Eg is the grinding energy (kWh/ton), To is the grinding time (hour), A is the amperage, m is the feed quantity (kg) and Tg is the mill factor (fixed value taken from the manufacturer as 4).
The grinding conditions for each ball distribution applied in the study are summarized in Table 4. The ball-fill (J) and void-fill (U) values given in the table were calculated using Equations (2) and (3), respectively [21]. The mill ball-filling ratio and void ratio, which are very important criteria for the operation of the mill, directly affect many situations, such as grinding size, energy consumption, and plate wear. The ratio of the total volume of balls used in grinding to the mill volume is indicated by J.
J = Ball   mass / ball   density Mill   volume × ( 1 0.6 )
U = fc 0.4 × J
The feeding filling rate (fc) was obtained with the Feed   mass / feed   density Mill   volume × ( 1 0.6 ) formula. Thus, fc was calculated as 0.0475, 0.0712, and 0.095 for 2, 3, and 4 kg feeding amounts, respectively.

Design of Experiments with the Taguchi Method

Within the scope of the study, ANOVA and Taguchi methods were applied to determine the optimum combination of grinding parameters. In the Taguchi method, nominal best, largest best, and smallest best methods, depending upon the characteristic type, are used to calculate signal-to-noise (S/N) ratios [32]. The ratio of signal to noise, referred to as S/N, is one of the statistical terms used along with the standard deviation and average value to determine the effect of the Taguchi method on the output of changeable or controllable parameters and uncontrollable parameters. If a high signal/noise is found in the experimental design results, this study can conclude that the deviation is low, and the parameters are meaningful. In this study, the “smallest best”, as shown in Equation (4), which was proposed by Mandal et al. [35], is used as the objective function.
S / N = 10 log ( 1 n   i = 1 n yi 2 )
where ‘yi’ is the data observed in the i-th experiment, and ‘n’ is the number of observations of the experiment.
In this study, the control factors were selected as the ball distribution (BD) used in the grinding process, the mass of material ground (m), and the mill rotation speed (v). The levels of the selected factors are shown in Table 5. To determine the optimum grinding conditions and analyze the effects of the grinding parameters, the most suitable orthogonal array was selected as L18(6^1 3^2). The L18 mixed orthogonal array shown in Table 6 was used to analyze the experimental results.

3. Results and Discussion

3.1. Experimental Results

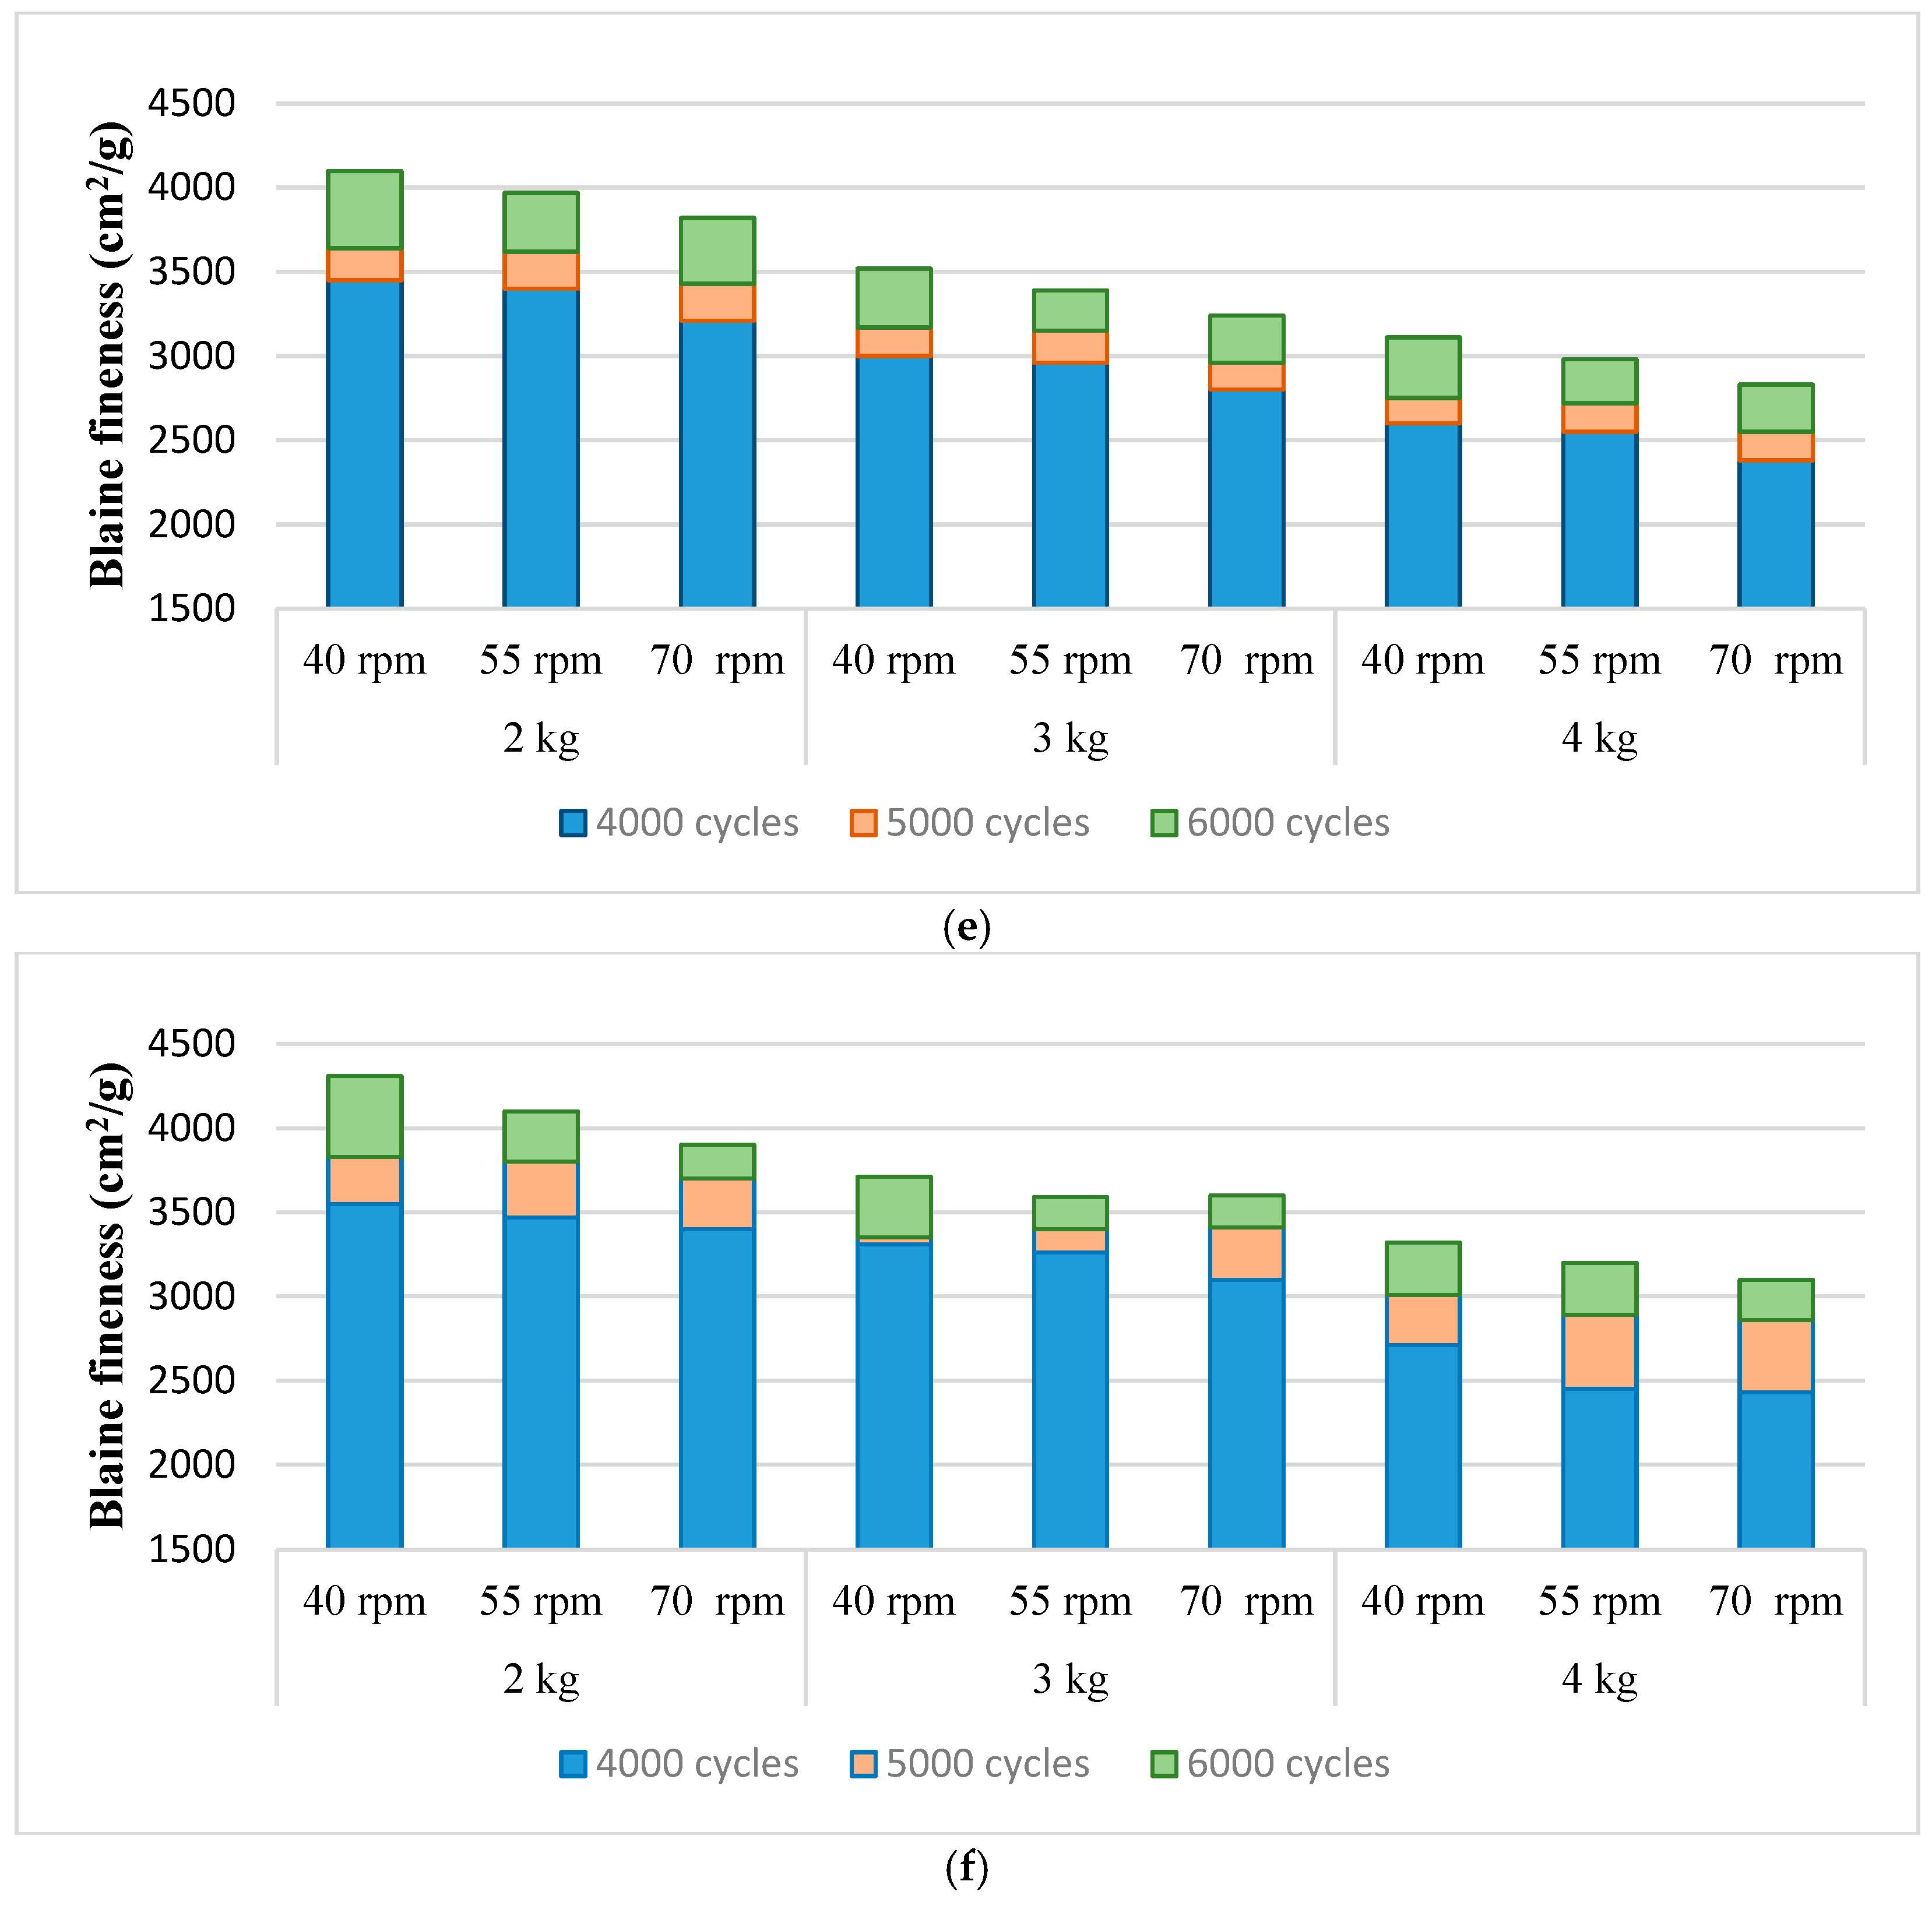
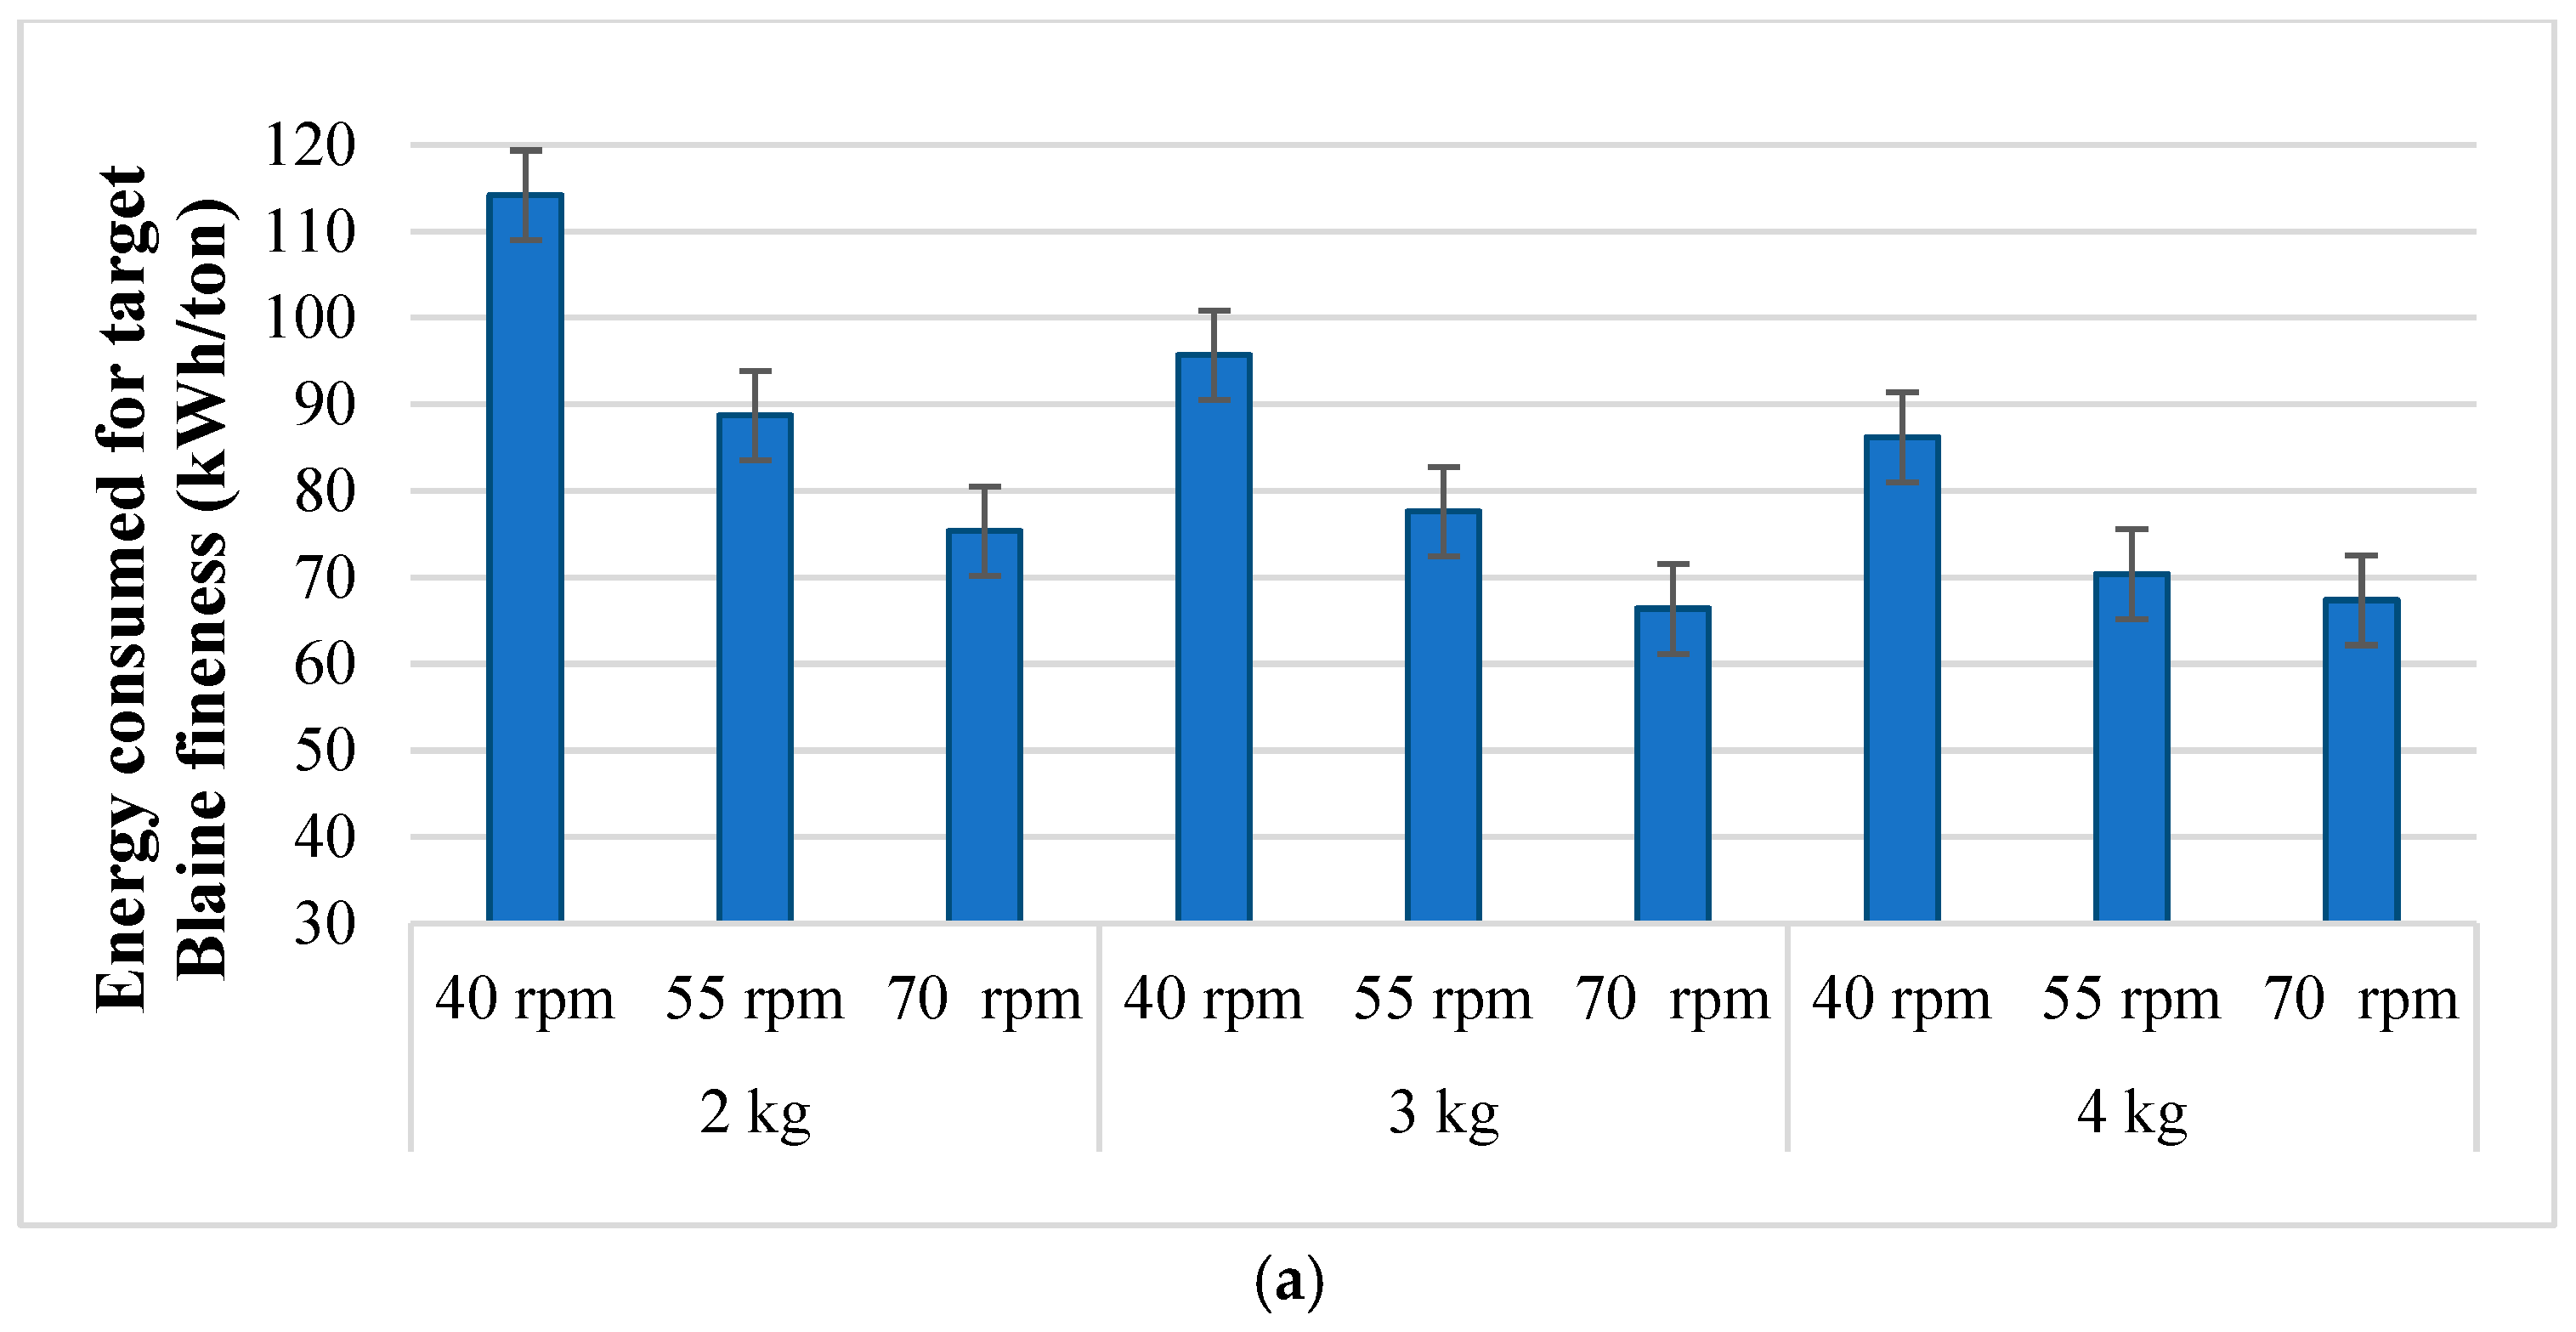
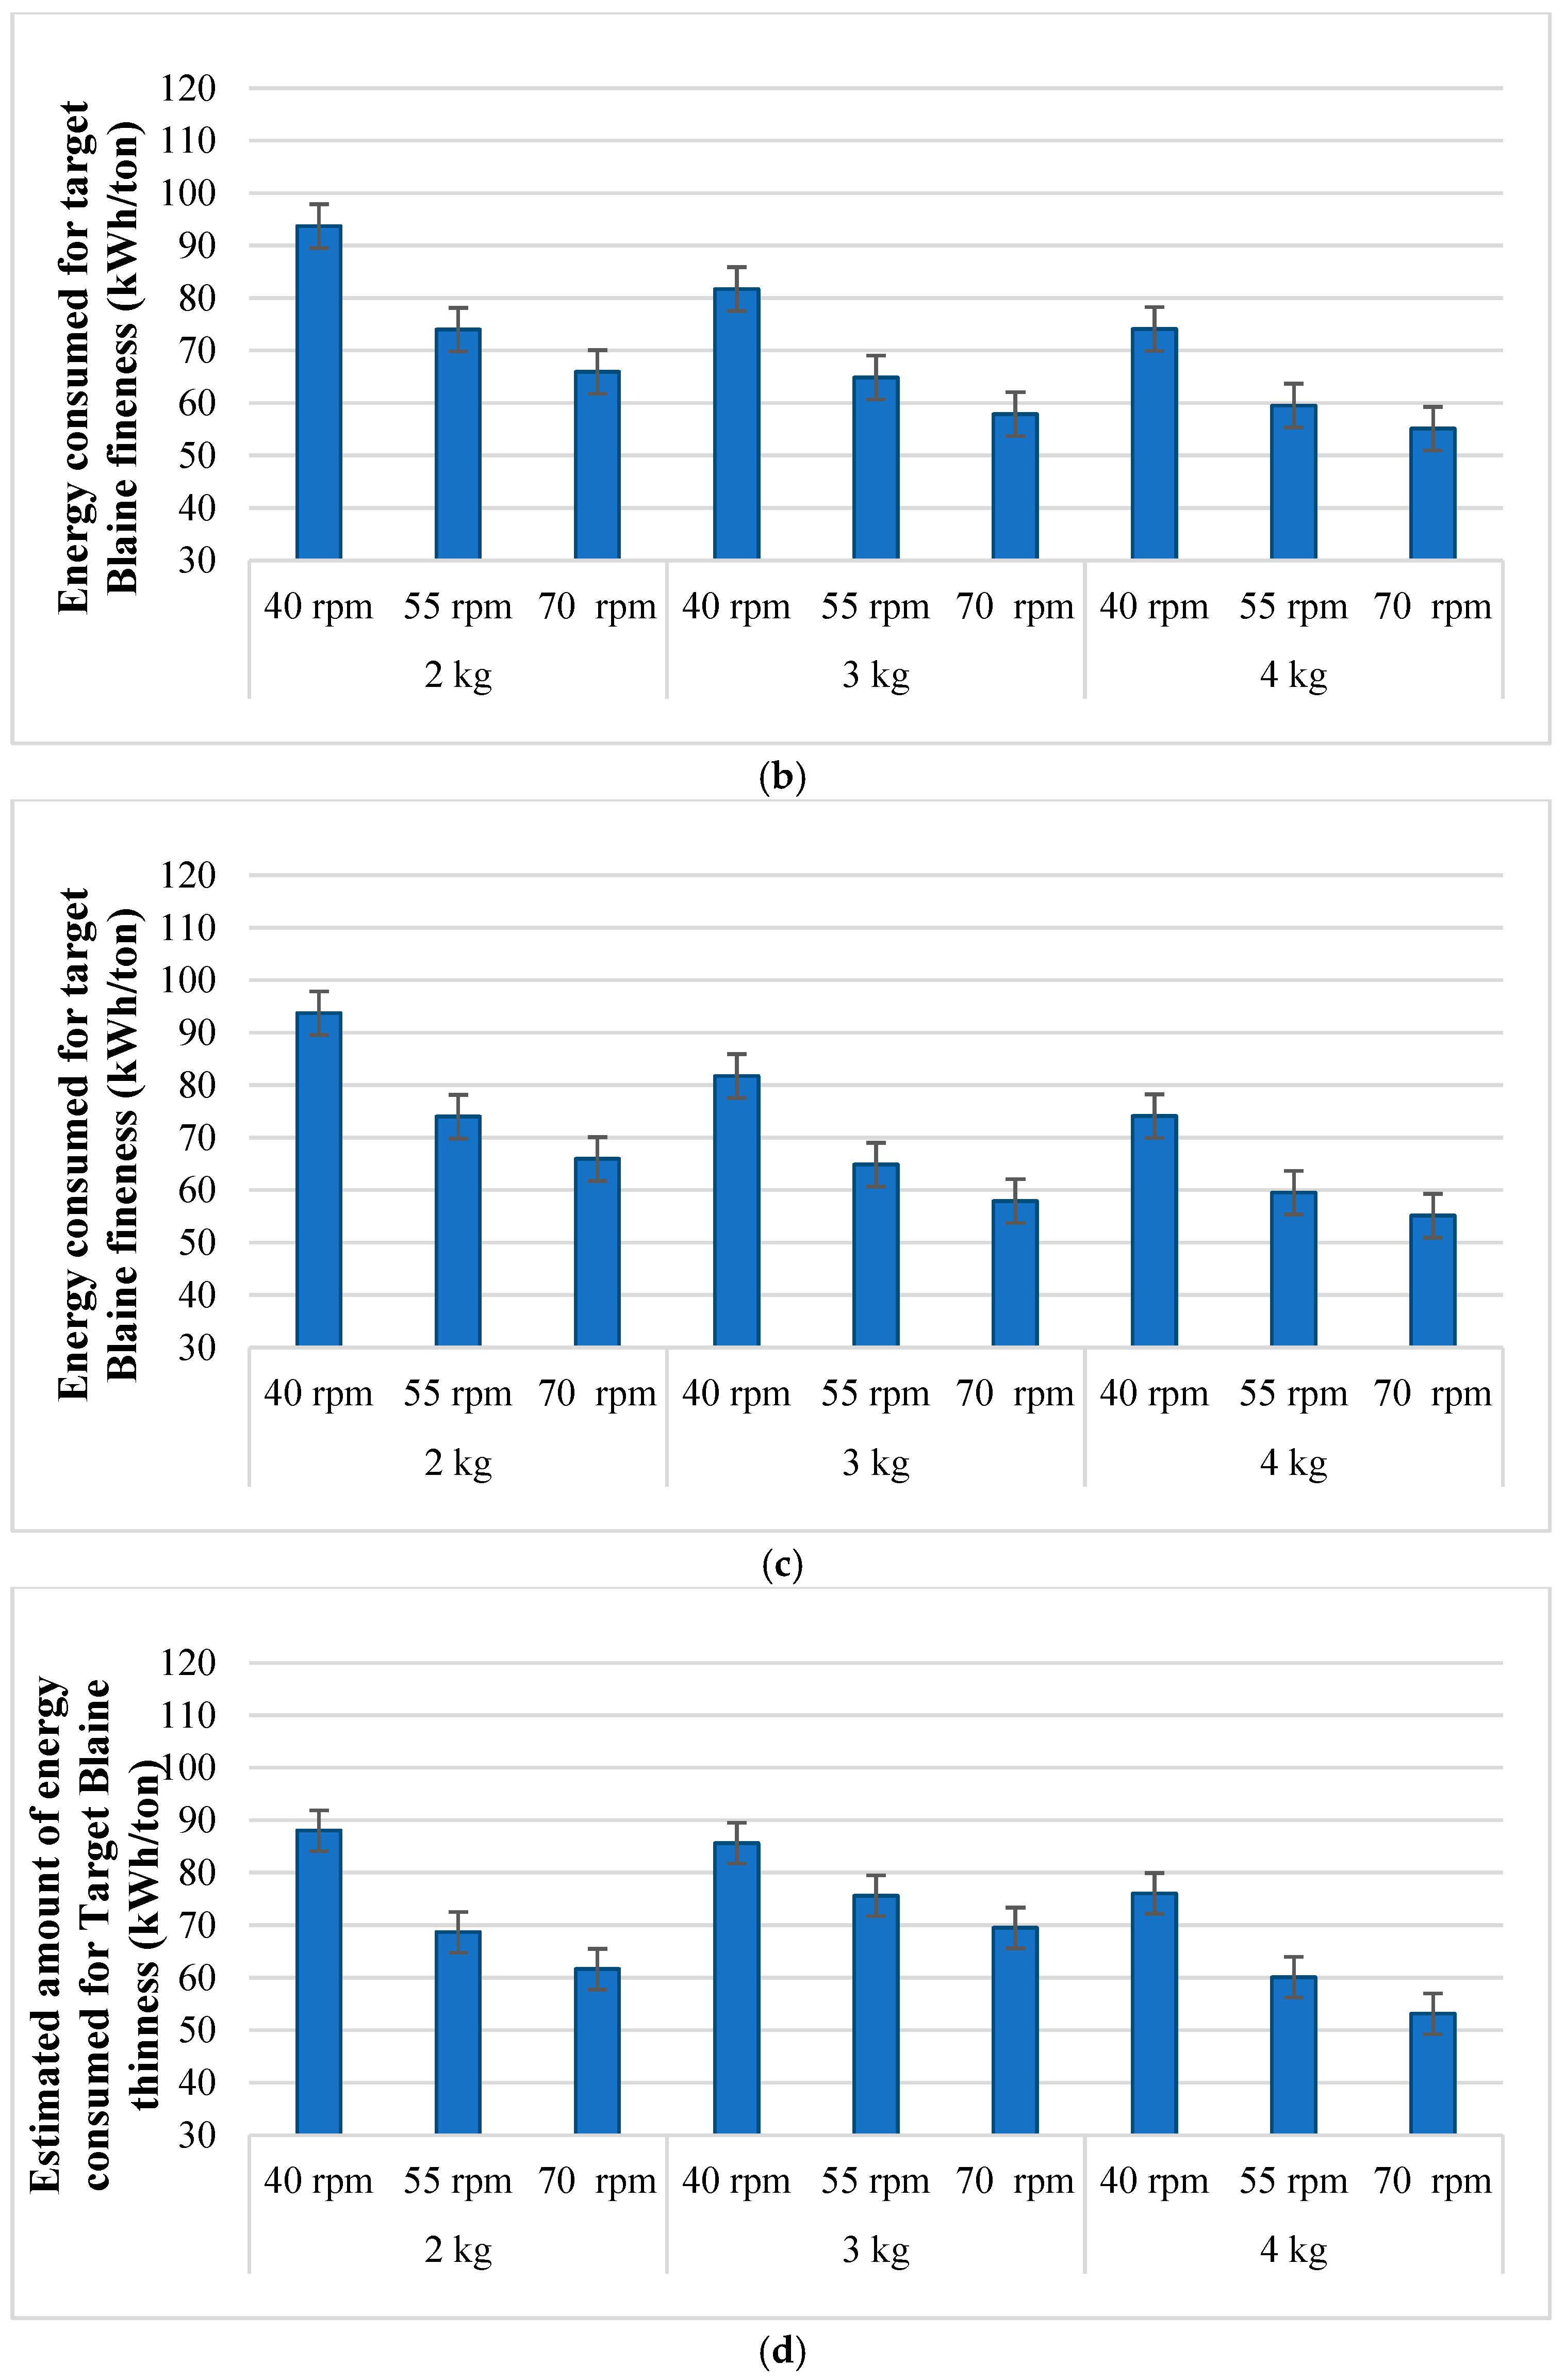
As emphasized before, in this study, the effects of different grinding conditions, such as mill speed, ball distribution, and feed-rate parameters, on grinding efficiency were compared with two different approaches. On the one hand, the Blaine fineness values of the cements produced after grinding at different grinding speeds were measured. On the other hand, the number of grinding cycles required to reach the target Blaine fineness value of 3700 ± 100 cm2/g was determined. To discuss all the results in more detail, the Blaine fineness values of the cements produced after 4000, 5000, and 6000 grinding cycles under different grinding conditions are shown in Figure 2. Also, the amount of energy consumed to reach the target Blaine value is given in Figure 3.

3.2. Evaluation of the Experimental Results

3.2.1. Effect of Ball Size Variation on Grinding Performance

It was emphasized by many researchers that the effect of the ball size variation parameter on the grinding performance is directly related to the ball-filling ratio and the ball roughness [13,14,22,29]. Therefore, in order to discuss the effect of this parameter more clearly, the conditions of ball distribution nos. 1 and 2, which have quite different ball-filling ratios, were studied in detail. From Figure 2, it can be seen that the Blaine fineness of the cements produced with ball distribution no. 1 is 5–25% lower than that of ball distribution no. 2 at 4000 rpm grinding, regardless of the mill speed and feed rate. This decrease was measured between 9 and 14% and 11 and 17% for 5000 and 6000 grinding cycles, respectively. Table 3 shows that the number of balls above 40 mm is the same in ball distributions no. 1 and 2, but the number of balls below 40 mm is higher in ball distribution no. 2. Similarly, Table 3 and Table 4 show that the ball-fill rate and surface-area values are 18% and 24% higher, respectively, in ball distribution no. 2 than in ball distribution no. 1. It was reported by many researchers [7,24,36] that the use of smaller diameter balls in the grinding process results in finer particles. This behavior is because the abrasion effect due to parallel forces is more dominant in small-diameter balls [19]. Abdelhaffez et al. [10] also emphasized that the use of smaller diameter balls increases the grinding performance by increasing the possibility of feed abrasion due to the increase in surface area. The higher grinding performance obtained with the no. 2 ball distribution at the same number of revolutions was due to these behaviors.
The results also showed that the difference between the Blaine fineness values of the cements decreased with the increase in the number of revolutions for all ball distribution conditions. Thus, the effect of the change in ball diameter on the Blaine fineness value decreased with the increase in the number of revolutions (cycles).
When the grinding performance at 4000, 5000, and 6000 cycles were compared for all ball distributions, it was found that the grinding performance increased with the increase in ball-filling ratio and surface area. It was previously emphasized that the impact effect of large-diameter balls causes the feed size to decrease. In contrast, the abrasion effect of small-diameter balls causes the size of small parts to decrease even more [14,21]. In ball distribution no. 6 applied in the study, since the feed was a 3.35 mm sieve product (according to the Bond standard), the effect mechanism caused by small diameter balls was more dominant (See Table 3, 6. ball distribution, pcs). As a result, it was found that the best grinding performance was observed in the no. 6 ball distribution with the highest surface area and ball density.
In terms of energy consumed for the target Blaine fineness (3700 ± 100 cm2/g), the lowest performance (highest energy requirement) in terms of energy consumed was obtained with ball distribution no. 1 with 18–57% and 24–110% lower ball-fill rates and surface-area values, respectively (See Table 3, 1. ball distribution, pcs). The energy consumption for achieving the specified Blaine fineness value followed the order of 1 > 2 > 5 > 3 > 4 > 6 for different ball distributions. It can also be seen from Table 3 and Table 4 that, in ball distribution no. 5, the ball-filling rate value is similar to ball distribution nos. 3 and 4, but the total surface-area value is lower. Table 3 also shows that the smallest diameter balls, of 15 and 20 mm, are not included in the ball distribution number 5. Schnatz (2004) reported that a decrease in ball diameter diversity can have a negative effect on grinding performance (increase in energy consumption).
For some mill-speed and feed-rate conditions, the interaction of the ball distribution was found to change. For example, when grinding at a feed rate of 4 kg and a mill speed of 55 rpm, the energy efficiency of ball distribution no. 1 was as low as 4% compared to ball distribution no. 2 (Figure 3a,b). These cases are discussed in detail in the following sections.

3.2.2. Effect of Mill-Speed Variation on Grinding Performance

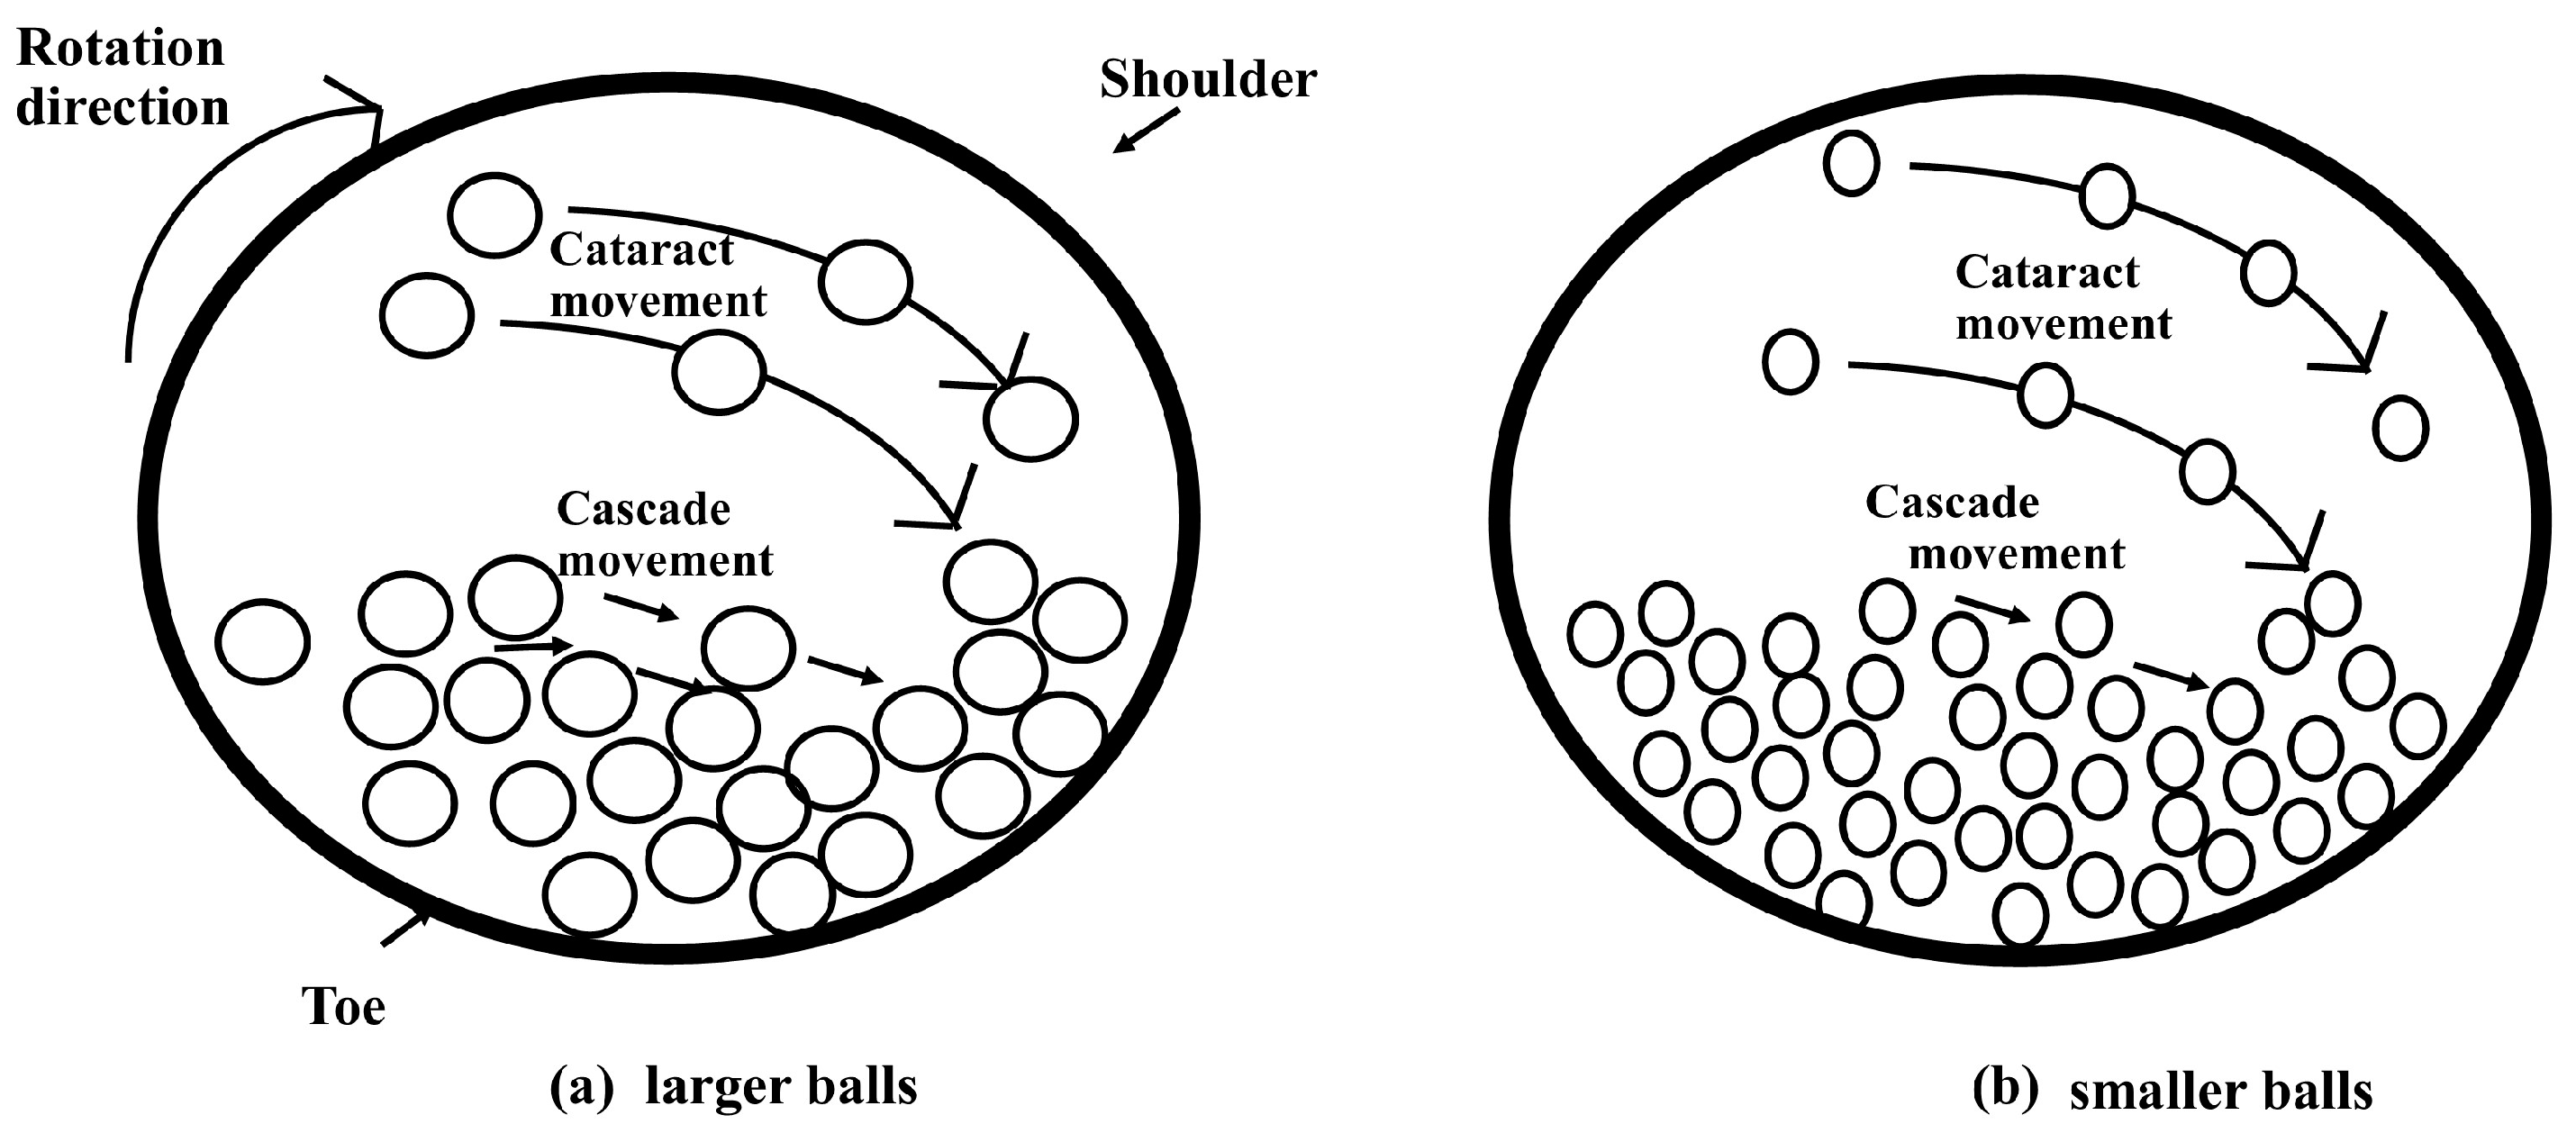
Figure 2 shows that increasing the mill speed from 40 rpm to 55 rpm results in only minor differences in the Blaine fineness of cements, ranging from 1 to 4%, regardless of feed rate, ball distribution, and number of revolutions. At a grinding speed of 70 rpm, compared to 55 rpm, the Blaine fineness of the cements decreased by 5–12%, 4–16%, 5–9%, 3–10%, 6–9%, and 4–10% for ball distributions No. 1, 2, 3, 4, 5, and 6, respectively, after grinding at 4000 cycles. Thus, at 70 rpm, which is 90% of the critical mill speed, the grinding performance decreased. Similar results have been reported by many researchers [14,25,26]. As the rotational speed of the mill increases, the balls rise higher in the mill and fall from that point. They grind the feed at the places where they fall by impact and abrasion. This movement is called “cataract”, and this movement causes the formation of a coarser product [21].
The trend of decrease in the Blaine fineness of the cements produced as a result of increasing the mill speed by 90% of the critical mill speed did not change significantly with the increase in feed rate. The position of the ball at the shoulder and toe parts of the mill significantly affected the grinding performance [14,21]. The toe and shoulder are the specific angular positions where the liner makes contact with the charge and where the charge leaves the liners, respectively [18]. It is believed that increasing the mill speed up to 90% of the critical speed negatively affects the shoulder and toe angles of the balls in the mill, causing a decrease in grinding performance.
Regardless of the feed rate and ball distribution, the energy consumed to achieve the target Blaine fineness decreased as the mill speed increased from 40 rpm to 55 rpm. This decrease was found to be between 10 and 15%, 9 and 15%, 12 and 13%, 3 and 15%, 5 and 8 and 13%, and 11 and 15% for the cases where ball distribution nos. 1, 2, 3, 4, 5 and 6 were applied, respectively. Two different situations affect energy efficiency with the increase of the mill speed. On the one hand, as the mill speed increases, the grinding time to achieve the target Blaine fineness decreases. This has a positive effect on energy efficiency. On the other hand, as the mill speed increases, the number of revolutions (cycles) to achieve the target Blaine fineness may increase due to the negative effect on the grinding performance. This situation negatively affects the energy efficiency. Considering the decrease in energy consumption with the increase in mill speed, it is understood that the parameter of decrease in grinding time is more dominant. With the same ball distribution, the energy efficiency obtained by increasing the mill speed decreased as the feed rate increased (Figure 3). For example, in ball distribution no. 1, when 2 kg of feed were milled, 23% efficiency was achieved when the speed increased to 70 rpm compared to 40 rpm. When 4 kg of feed were milled in the same ball distribution, this ratio decreased to 19%.
It was observed that there was no significant change in energy efficiency with the increase in mill speed from 55 rpm to 70 rpm.

3.2.3. Effect of Feed-Rate Variation on Grinding Performance

Regardless of the mill speed, ball distribution, and the number of revolutions, it was observed that the Blaine fineness of the cements produced decreased with increasing the feed rate. Table 4 also shows that the material-filling ratio and void-filling capacity also increase with the increase in feed rate. It has been reported by Çalkaya [37] that a void-filling ratio greater than one can cause excess material to be found outside the inter-ball gap and reduce the grinding performance due to the damping effect. When the feed amount was 3 kg, the gap-filling ratio values were very close to one in the ball distribution nos. 3, 4, 5, and 6. In the mentioned distributions, contrary to expectations, the effectiveness of particle size reduction in the feed diminishes with greater quantities of feed (corresponding to an increase in the void-filling ratio).
When the feed rate was increased from 2 kg to 4 kg, the Blaine fineness values after 4000 cycles decreased by 18–24%, 3–15%, 27–28%, 26–29%, 26–29%, 25–26%, and 24–29% for ball distribution nos. 1, 2, 3, 4, 5 and 6, respectively. This negative effect was found to be more pronounced in cases where ball distribution nos. 3, 4, and 6 were used, which contain smaller diameter balls. It has been reported that the free fall [29] and abrasion [38] mechanisms of smaller diameter balls with increasing material occupancy may be insufficient to grind a large amount of material grains in the mill.
When analyzing the energy values expended for the target Blaine fineness value, it is understood that the effect of the feed-rate increase on the energy efficiency varies depending on the ball distribution. In cases where ball distribution nos. 1, 3, 5, and 6 were used, it was observed that energy efficiency increased with the increasing feed rate (Figure 3). Looking again at Equation 1, the inverse relationship between grinding-time amperage, and feed rate is evident. Therefore, for the ball distributions in question (1, 3, 5, and 6), considering the decrease in energy consumption with the increasing feed rate, it is understood that the parameter of increasing feed rate is more dominant than grinding time and amperage drawn. The best performance in terms of grinding efficiency with increasing the feed rate was obtained in the case of ball distribution no. 6.

3.3. General Evaluation

Figure 4 illustrates the grinding behavior for various ball sizes, mill speeds, and feed-rate parameters, distinguishing between smaller and larger ball sizes.
As shown in Figure 4, abrasion behavior with cascade movement is dominant in smaller particles. In this way, smaller particle formation can be achieved. In larger particles, the impact effect with cataract movement is dominant. For this reason, the ball distributions numbered 4,5 and 6, which have small ball sizes, performed better. Among these, the Bond-type ball distribution no. 6, with the lowest ball distribution and the highest surface area, was obtained. While an increase in the mill speed up to 55 rpm provided grinding efficiency, a decrease was observed at 70 rpm. Since the suspension time of the balls decreased at this mill speed, the possibility of grinding the feed by crushing may have decreased. It was seen that the feed increase was the most compatible with the Bond-type ball distribution no. 6, which is the most suitable ball distribution.

3.4. Evaluation of Analysis Results

3.4.1. Analysis of Signal-to-Noise (S/N) Ratio

With the experimental design, the energy consumed in grinding for each combination of control factors was measured experimentally. The data obtained were processed using Taguchi techniques, and optimization of the measured grinding factors was achieved by signal-to-noise (S/N) ratios. The lowest value of the energy consumed in grinding is important in terms of the climate crisis and reducing production costs. Therefore, the “lower is better” equation was used to calculate the S/N ratio. S/N ratios and means values for the grinding parameters are shown in Table 7.
The effect of each control factor (BD, m, and v) on the energy consumed in grinding was analyzed by employing an “S/N response table” and a “Means table”. The results of the S/N and means response of the energy spent in grinding are shown in Table 8.
This table, prepared using the Taguchi technique, shows the optimum levels of the control factors for optimum grinding conditions. From these graphs, it is easy to determine the optimum processing parameters of the control factors to minimize the energy consumed in grinding. The best level for each control factor was found according to the highest signal-to-noise ratio and the lowest mean value in the levels of that control factor. Accordingly, the different grinding conditions with the best grinding performance were determined to be Level 6 for Factor A, S/N = −33.76, Level 3 for Factor B, S/N = −33.71, and Level 3 for Factor C, S/N = −33.9). As a result, it was determined that the optimum grinding conditions were at ball distribution number 6, 4 kg feed, and 70 rpm mill speed.

3.4.2. ANOVA Method

In this study, an ANOVA was used to analyze the effects of ball distributions, mass of material ground, and rotational speed applied during grinding on the energy consumed during grinding. The ANOVA results for the energy consumed are shown in Table 9. This analysis was performed at a 5% significance level and 95% confidence interval. The importance of the control factors in the ANOVA was determined by comparing the F-values of each control factor. In addition, if the p-value of each control factor is less than 0.5, it means that the data are significant. The effect ratio in the last column of Table 9 shows the percentage value of each parameter contribution, which indicates the degree of influence on the process performance. According to Table 9, the percentage contributions of ball distribution, mass of milled material, and rotational speed to the energy consumed in grinding were found to be 36.89–28.02, and 30.26, respectively. Therefore, the parameter that most affects the energy consumed in grinding is determined to be ball distribution. The error percentage of the ANOVA model was measured to be 4.82%.

3.4.3. Regression Analysis

Regression analyses are used for modeling and analyzing many variables when there is a relationship between a dependent variable and one or more independent variables [39]. In this study, the dependent variables were selected as the energy consumed in grinding, and the independent variables were selected as ball distribution, mass of material ground, and mill rotation speed. A regression analysis was used to obtain the equations to predict the energy consumed in grinding. In addition, the regression equations were developed separately for each ball distribution. Therefore, whichever ball distribution is chosen, its equation should be used. These prediction equations were made for both linear and quadratic regression models. The prediction equations obtained with the linear regression model of the energy expended are given below (Table 10).
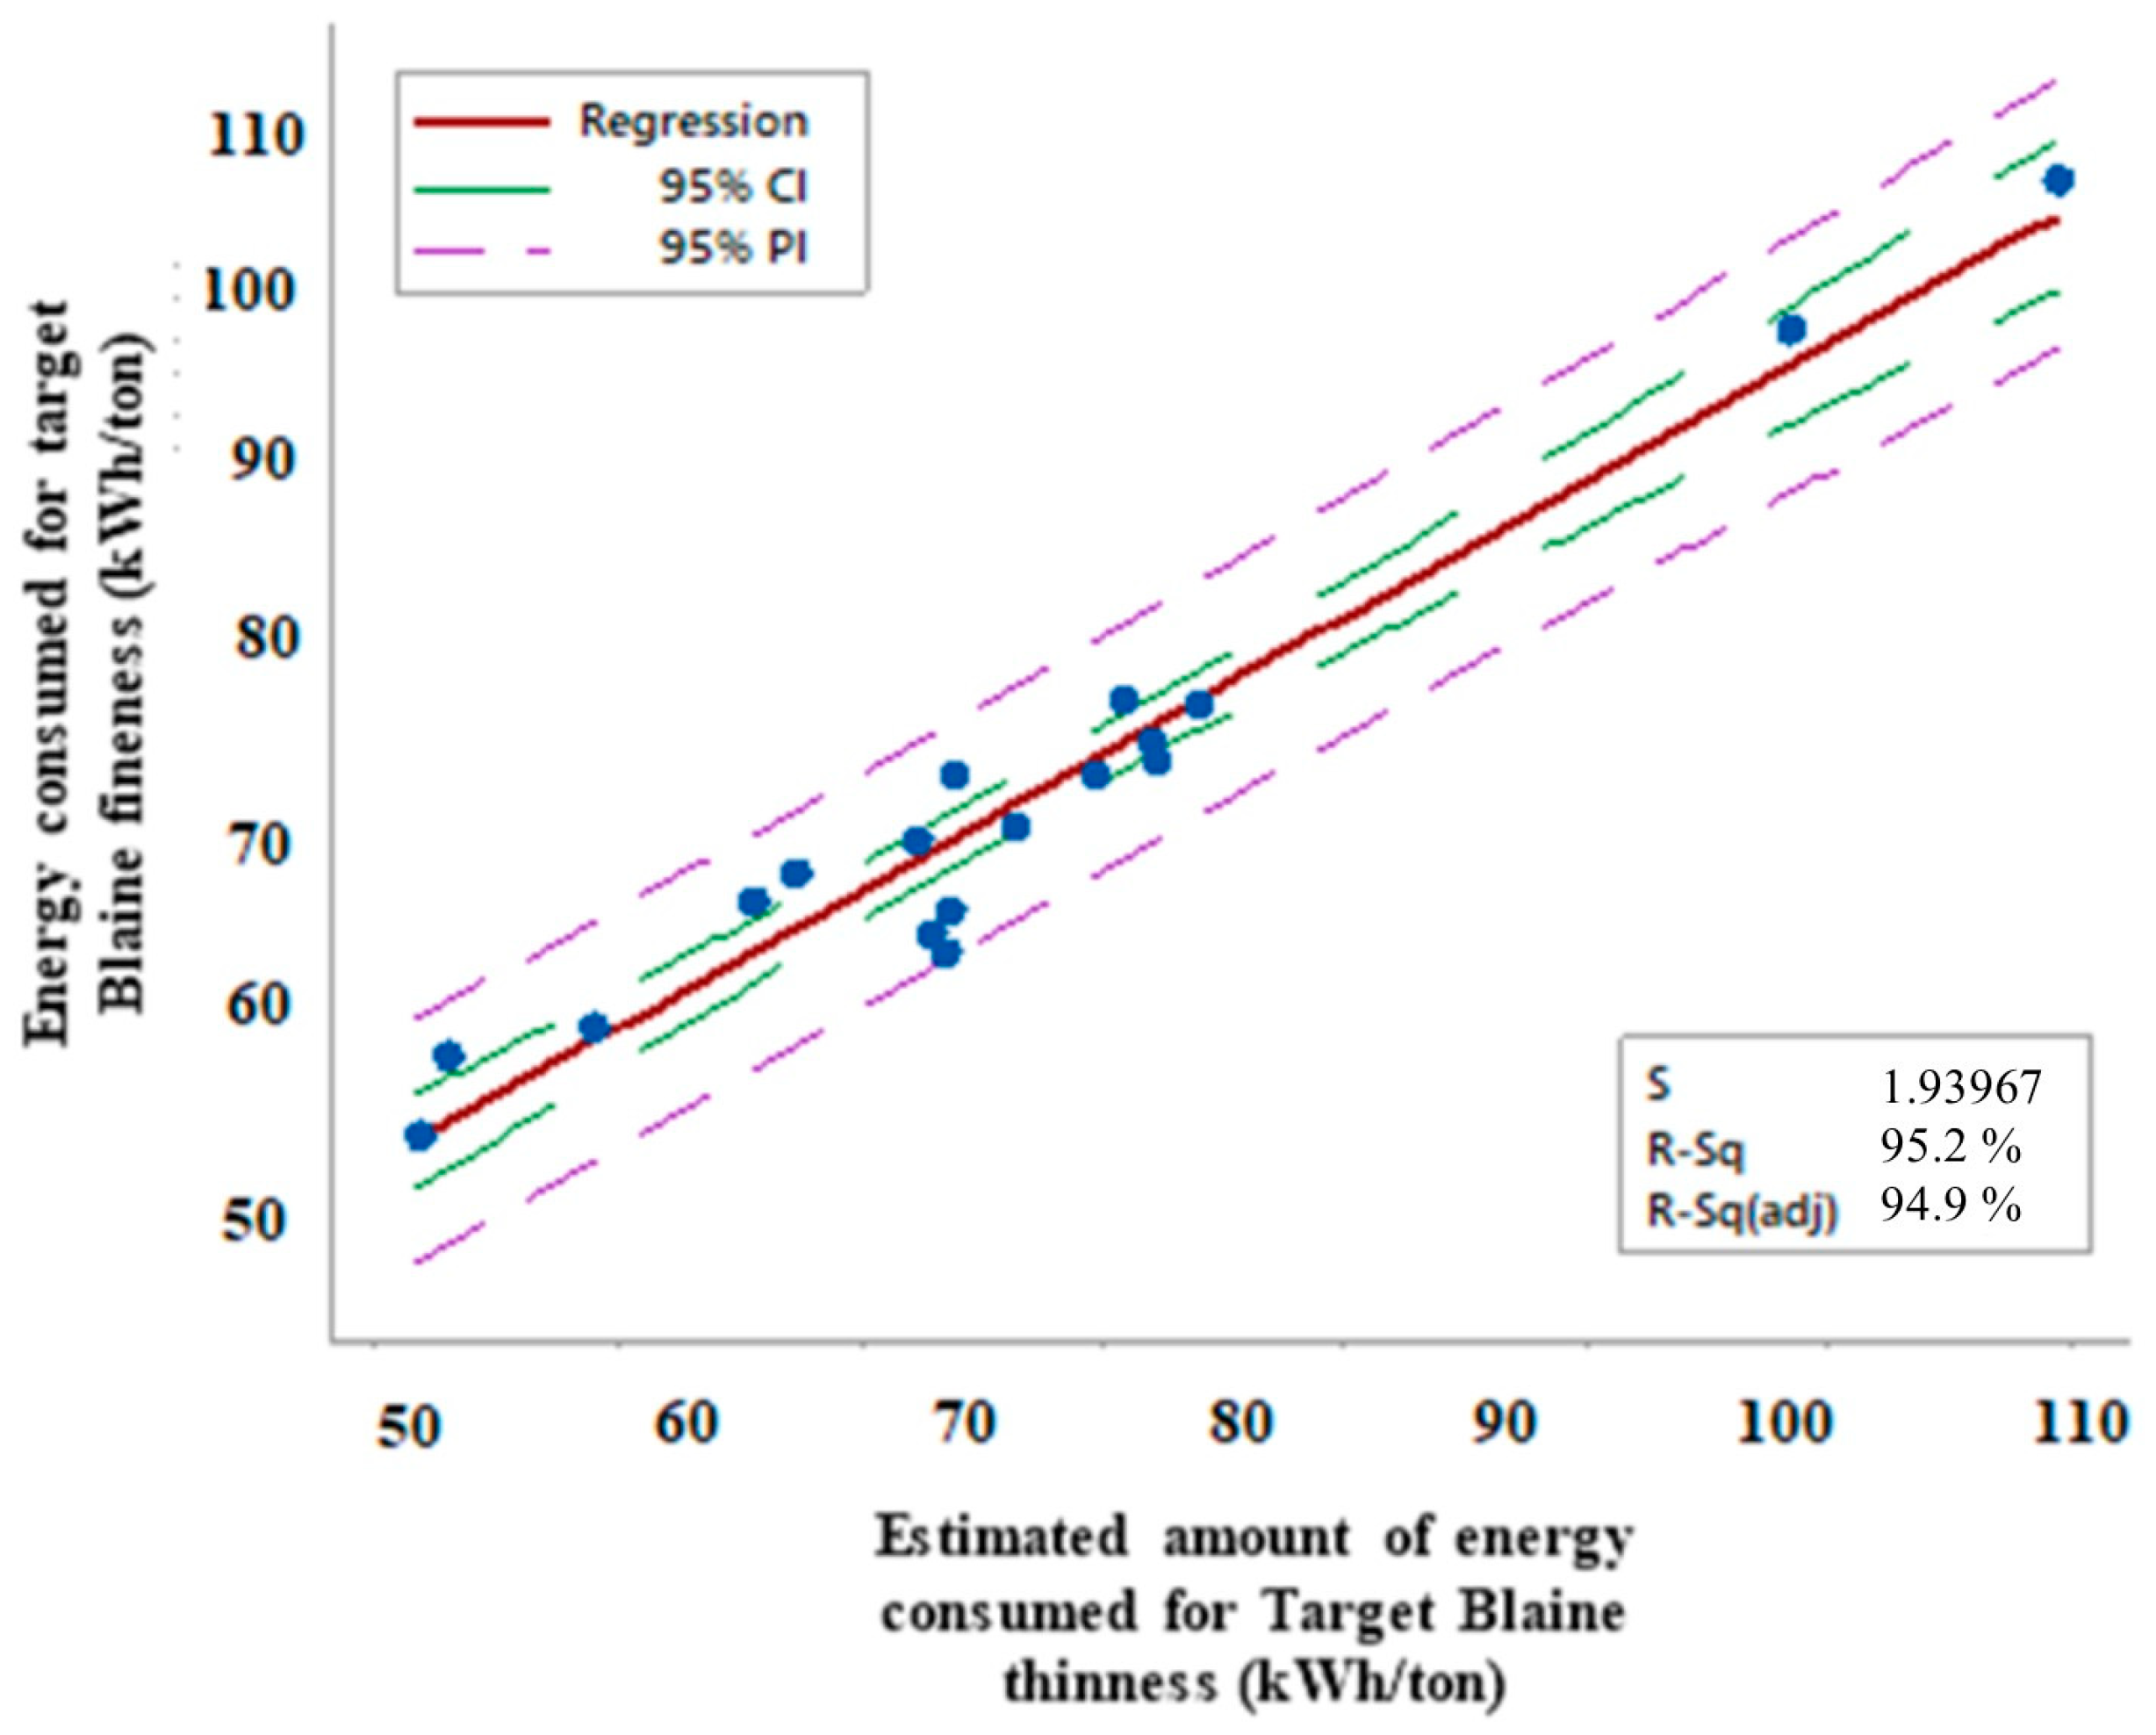
Figure 5 shows the comparison between the actual test results obtained with the linear regression model and the predicted values. The R2 value of the equation obtained with the linear regression model of the energy consumed was found to be 95.18.
The prediction equation for the second-order regression of the energy consumed in grinding is given below:
Energy consumed = 221.2 − 27.6 m − 3.85 v − 3.42 BD + 1.45 m2 + 0.02226 v2 − 0.219 BD × m + 0.0544 BD × v + 0.277 m × v
Figure 6 shows the comparison between the test results and the predicted values obtained with the quadratic regression model. As can be seen from the figure, there is a very good correlation between the predicted values and the test results. The R2 value of the equation obtained with the quadratic regression model for the energy consumed in grinding is calculated to be 96.04%. Therefore, the quadratic regression model provided denser prediction values than the linear regression model. As a result, the quadratic regression model was found to be successful in predicting the energy consumed in grinding.

3.5. Estimation of Optimum Grinding Conditions by Taguchi Method, Linear Regression Equations, and Quadratic Regression Equation and Comparison with Experimental Results

For the Taguchi method and regression equations, verification tests were performed at optimum and random levels of control factors. The results obtained are shown in Table 11.
It is also understood from the results that the predicted values and experimental data are quite close. Kıvak [34] reported that error values should be less than 20% for reliable statistical analysis. Accordingly, it is understood that the data obtained are at an acceptable level. Therefore, the results obtained from the validation tests reflect successful optimization.

4. Conclusions

This study examines how grinding conditions (ball distribution, feed amount, and rotation speed) influence the Blaine fineness of cement as a function of the number of revolutions. Additionally, linear and quadratic regressions were employed to identify the key parameters affecting the process. The goal is to promote more economical and environmentally friendly cement production by applying the findings from these parameters. The results obtained from the study investigating the effect of grinding conditions, such as different ball size distributions, mill speeds, and feed rates, on the clinker grinding efficiency and cement properties are summarized below.
  • Ball size variation has a significant effect on grinding performance. It was observed that smaller diameter balls, especially the Bond type ball distribution no. 6, resulted in higher grinding efficiency and surface area. This is related to the abrasion effect and the formation of fines in the feed. As a result, considering the interactions of ball size, mill speed, and feed rate, the best grinding performance was obtained with Bond-type ball distribution no. 6. This distribution has a high surface area and ball density, but there are important factors to consider in terms of grinding time and energy efficiency;
  • Increasing the mill speed resulted in a general decrease in grinding efficiency, especially increases up to 90% of the critical speed. This adversely affected the shoulder and foot angles of the balls, making it more difficult to crush the particle;
  • An increase in the feed rate increased the material fill rate and void-filling capacity but showed different effects on the grinding performance depending on the ball distribution. At smaller ball distributions, especially in the mixtures numbered 3, 4, and 6, the increase in the material-filling ratio had a negative effect on the grinding performance;
  • To minimize the energy consumed in grinding, the optimum levels of the effective parameters (ball distribution, grinding mass, and mill speed) were determined using the Taguchi method;
  • According to the results of the statistical analysis, it was determined that the most important parameter for energy efficiency was ball distribution, with a contribution of 36.89%;
  • The developed quadratic regression models showed a very good relationship between the measured and predicted values of the energy consumed in grinding with high correlation coefficients;
  • As a result, considering the interactions of ball size, mill speed, and feed rate, the best grinding performance was obtained with Bond-type ball distribution no. 6. This distribution has a high surface area and ball density, but there are important factors to consider in terms of grinding time and energy efficiency.

Author Contributions

Conceptualization, Y.K. and V.K.; Methodology, V.K.; Software, Y.K. and N.M.; Formal analysis, N.M. and H.E.B.; Writing—original draft, Y.K., V.K. and A.M.; Writing—review & editing, Y.K., V.K., A.M., N.M. and H.E.B.; Visualization, A.M.; Supervision, A.M. All authors have read and agreed to the published version of the manuscript.

Funding

This research was funded by the Scientific and Technological Research Council of Turkey (TÜBİTAK) under Grant Number: 222M245. They also recognize the contributions of the Bursa Uludağ University Science and Technology Centre (BAP) under grant identifiers FGA-2022-1151. The primary author extends appreciation to TÜBİTAK for the 2211A scholarship received during their doctoral studies.

Data Availability Statement

Data are contained within the article.

Conflicts of Interest

The authors declare no conflict of interest.

References

  1. Mardani-Aghabaglou, A. Investigation of Cement-Superplasticizer Admixture Compatibility. Ph.D. Thesis, Ege University, Engineering Faculty, Civil Engineering Department, Izmir, Turkey, 2016. NO. 10103689. 290p. Available online: https://tez.yok.gov.tr/UlusalTezMerkezi/ (accessed on 16 May 2024).
  2. Kaya, Y.; Kobya, V.; Mardani, A. Evaluation of fresh state, rheological properties, and compressive strength performance of cementitious system with grinding aids. J. Appl. Polym. Sci. 2024, 141, e55212. [Google Scholar] [CrossRef]
  3. Kobya, V.; Kaya, Y.; Mardani-Aghabaglou, A. Effect of amine and glycol-based grinding aids utilization rate on grinding efficiency and rheological properties of cementitious systems. J. Build. Eng. 2022, 47, 103917. [Google Scholar] [CrossRef]
  4. Yiğit, B.; Salihoğlu, G.; Mardani-Aghabaglou, A.; Salihoğlu, N.K.; Özen, S. Recycling of sewage sludge incineration ashes as construction material. J. Fac. Eng. Archit. Gazi Univ. 2020, 35, 1647–1664. [Google Scholar]
  5. Qian, H.Y.; Kong, Q.G.; Zhang, B.L. The effects of grinding media shapes on the grinding kinetics of cement clinker in ball mill. Powder Technol. 2013, 235, 422–425. [Google Scholar] [CrossRef]
  6. Touil, D.; Belaadi, S.; Frances, C. The specific selection function effect on clinker grinding efficiency in a dry batch ball mill. Int. J. Miner. Process. 2008, 87, 141–145. [Google Scholar] [CrossRef]
  7. Katubilwa, F.M.; Moys, M.H.; Glasser, D.; Hildebrandt, D. An attainable region analysis of the effect of ball size on milling. Powder Technol. 2011, 210, 36–46. [Google Scholar] [CrossRef]
  8. Santosh, T.; Eswaraiah, C.; Soni, R.K.; Kumar, S. Size reduction performance evaluation of HPGR/ball mill and HPGR/stirred mill for PGE bearing chromite ore. Adv. Powder Technol. 2023, 34, 103907. [Google Scholar] [CrossRef]
  9. Santosh, T.; Soni, R.K.; Eswaraiah, C.; Rao, D.S.; Venugopal, R. Optimization of stirred mill parameters for fine grinding of PGE bearing chromite ore. Part. Sci. Technol 2020, 39, 663–675. [Google Scholar]
  10. Abdelhaffez, G.S.; Ahmed, A.A.; Ahmed, H.M. Effect of grinding media on the milling efficiency of a ball mill. Rud.-Geološko-Naft. Zb. 2022, 38, 171–177. [Google Scholar] [CrossRef]
  11. Ipek, H. The effects of grinding media shape on breakage rate. Miner. Eng. 2006, 19, 91–93. [Google Scholar] [CrossRef]
  12. Mardani-Aghabaglou, A.; Özen, S.; Altun, M.G. Durability performance and dimensional stability of polypropylene fiber reinforced concrete. J. Green Build. 2018, 13, 20–41. [Google Scholar] [CrossRef]
  13. Danha, G.; Hlabangana, N.; Muzenda, E. Effect of ball and feed particle size distribution on the milling efficiency of a ball mill: An attainable region approach. S. Afr. J. Chem. Eng. 2018, 25, 79–84. [Google Scholar]
  14. Shahbazi, B.; Jafari, M.; Parian, M.; Rosenkranz, J.; Chelgani, S.C. Study on the impacts of media shapes on the performance of tumbling mills—A review. Miner. Eng. 2020, 157, 106490. [Google Scholar] [CrossRef]
  15. Erdem, A.S. Modelling of Effect of Ball Size on Grinding Model Parameters. Ph.D. Thesis, Hacettepe University, Engineering Faculty, Mining Engineering Department, Ankara, Turkey, 2009. [Google Scholar]
  16. Dong, H.; Moys, M.H. Load behavior and mill power. Int. J. Miner. Process. 2003, 69, 11–28. [Google Scholar] [CrossRef]
  17. Shi, F. Comparison of grinding media—Cylpebs versus balls. Miner. Eng. 2004, 17, 1259–1268. [Google Scholar] [CrossRef]
  18. Lameck, N.S.; Kiangi, K.K.; Moys, M.H. Effects of grinding media shapes on load behaviour and mill power in a dry ball mill. Miner. Eng. 2006, 19, 1357–1361. [Google Scholar] [CrossRef]
  19. Amiri, S.H.; Zare, S. Influence of grinding and classification circuit on the performance of iron ore beneficiation—A plant scale study. Miner. Process. Extr. Metall. Rev. 2021, 42, 143–152. [Google Scholar] [CrossRef]
  20. Sezer, A.; Boz, A.; Tanrinian, N. An investigation into strength and permittivity of compacted sand-clay mixtures by partial replacement of water with lignosulfonate. Acta Phys. Pol. A 2016, 130, 23–27. [Google Scholar] [CrossRef]
  21. Dökme, F.; Güven, O. Bilyalı değirmenlerde hızın performansa olan etkilerinin deneysel olarak incelenmesi. Mühendis Ve Makina 2014, 55, 38–50. [Google Scholar]
  22. Erdem, A.S.; Ergün, Ş.L. The effect of ball size on breakage rate parameter in a pilot scale ball mill. Miner. Eng. 2009, 22, 660–664. [Google Scholar] [CrossRef]
  23. Magdalinovic, N.; Trumic, M.; Trumic, M.; Andric, L. The optimal ball diameter in a mill. Physicochem. Probl. Miner. Process. 2012, 48, 329–339. [Google Scholar]
  24. Schnatz, R. Optimization of continuous ball mills used for finish-grinding of cement by varying the L/D ratio, ball charge filling ratio, ball size and residence time. Int. J. Miner. Process. 2004, 74, S55–S63. [Google Scholar] [CrossRef]
  25. Jayasundara, C.T.; Yang, R.Y.; Yu, A.B.; Rubenstein, J. Effects of disc rotation speed and media loading on particle flow and grinding performance in a horizontal stirred mill. Int. J. Miner. Process. 2010, 96, 27–35. [Google Scholar] [CrossRef]
  26. Fortsch, D.S. Ball charge loading-impact on specific power consumption and capacity. In Proceedings of the IEEE Cement Industry Technical Conference, Phoenix, AZ, USA, 9–14 April 2006; Conference Record. IEEE: New York, NY, USA, 2006; p. 11. [Google Scholar]
  27. Deniz, V. The effect of mill speed on kinetic breakage parameters of clinker and limestone. Cem. Concr. Res. 2004, 34, 1365–1371. [Google Scholar] [CrossRef]
  28. Simba, K.P.; Moys, M.H. Effects of mixtures of grinding media of different shapes on milling kinetics. Miner. Eng. 2014, 61, 40–46. [Google Scholar] [CrossRef]
  29. AmanNejad, M.; Barani, K. Effects of ball size distribution and mill speed and their interactions on ball milling using DEM. Miner. Process. Extr. Metall. Rev. 2021, 42, 374–379. [Google Scholar] [CrossRef]
  30. Göktaş, İ.; Altun, O.; Toprak, N.A.; Altun, D. Element-based ball mill and hydrocyclone modelling for a copper ore grinding circuit. Miner. Eng. 2023, 198, 108090. [Google Scholar] [CrossRef]
  31. Mardani-Aghabaglou, A.; Öztürk, H.T.; Kankal, M.; Ramyar, K. Assessment and prediction of cement paste flow behavior; Marsh-funnel flow time and mini-slump values. Constr. Build. Mater. 2021, 301, 124072. [Google Scholar] [CrossRef]
  32. Aslan, N.; Akçiçek, N. Optimization of clinker grinding using the Taguchi method. Int. J. Eng. Appl. Sci. 2011, 3, 101–108. [Google Scholar]
  33. Nas, E.; Altan Özbek, N. Optimization of the machining parameters in turning of hardened hot work tool steel using cryogenically treated tools. Surf. Rev. Lett. 2020, 27, 1950177. [Google Scholar] [CrossRef]
  34. Kıvak, T. Optimization of surface roughness and flank wear using the Taguchi method in milling of Hadfield steel with PVD and CVD coated inserts. Measurement 2014, 50, 19–28. [Google Scholar] [CrossRef]
  35. Mandal, N.; Doloi, B.; Mondal, B.; Das, R. Optimization of flank wear using Zirconia Toughened Alumina (ZTA) cutting tool: Taguchi method and Regression analysis. Measurement 2011, 44, 2149–2155. [Google Scholar] [CrossRef]
  36. Jankovic, A.; Valery, W.; Davis, E. Cement grinding optimisation. Miner. Eng. 2004, 17, 1075–1081. [Google Scholar] [CrossRef]
  37. Çalkaya, M. Analysıs of Fine Wet Grinding of Zeolite in Ball Mill. Master’s Thesis, Selçuk University, Engineering Faculty, Mining Engineering Department, Konya, Turkey, 2008. [Google Scholar]
  38. Sridhar, C.S.; Sankar, P.S.; Prasad, R.K. Grinding kinetics, modeling, and subsieve morphology of ball mill grinding for cement industry ingredients. Part. Sci. Technol. 2016, 34, 1–8. [Google Scholar] [CrossRef]
  39. Cetin, M.H.; Ozcelik, B.; Kuram, E.; Demirbas, E. Evaluation of vegetable based cutting fluids with extreme pressure and cutting parameters in turning of AISI 304L by Taguchi method. J. Clean. Prod. 2011, 19, 2049–2056. [Google Scholar] [CrossRef]
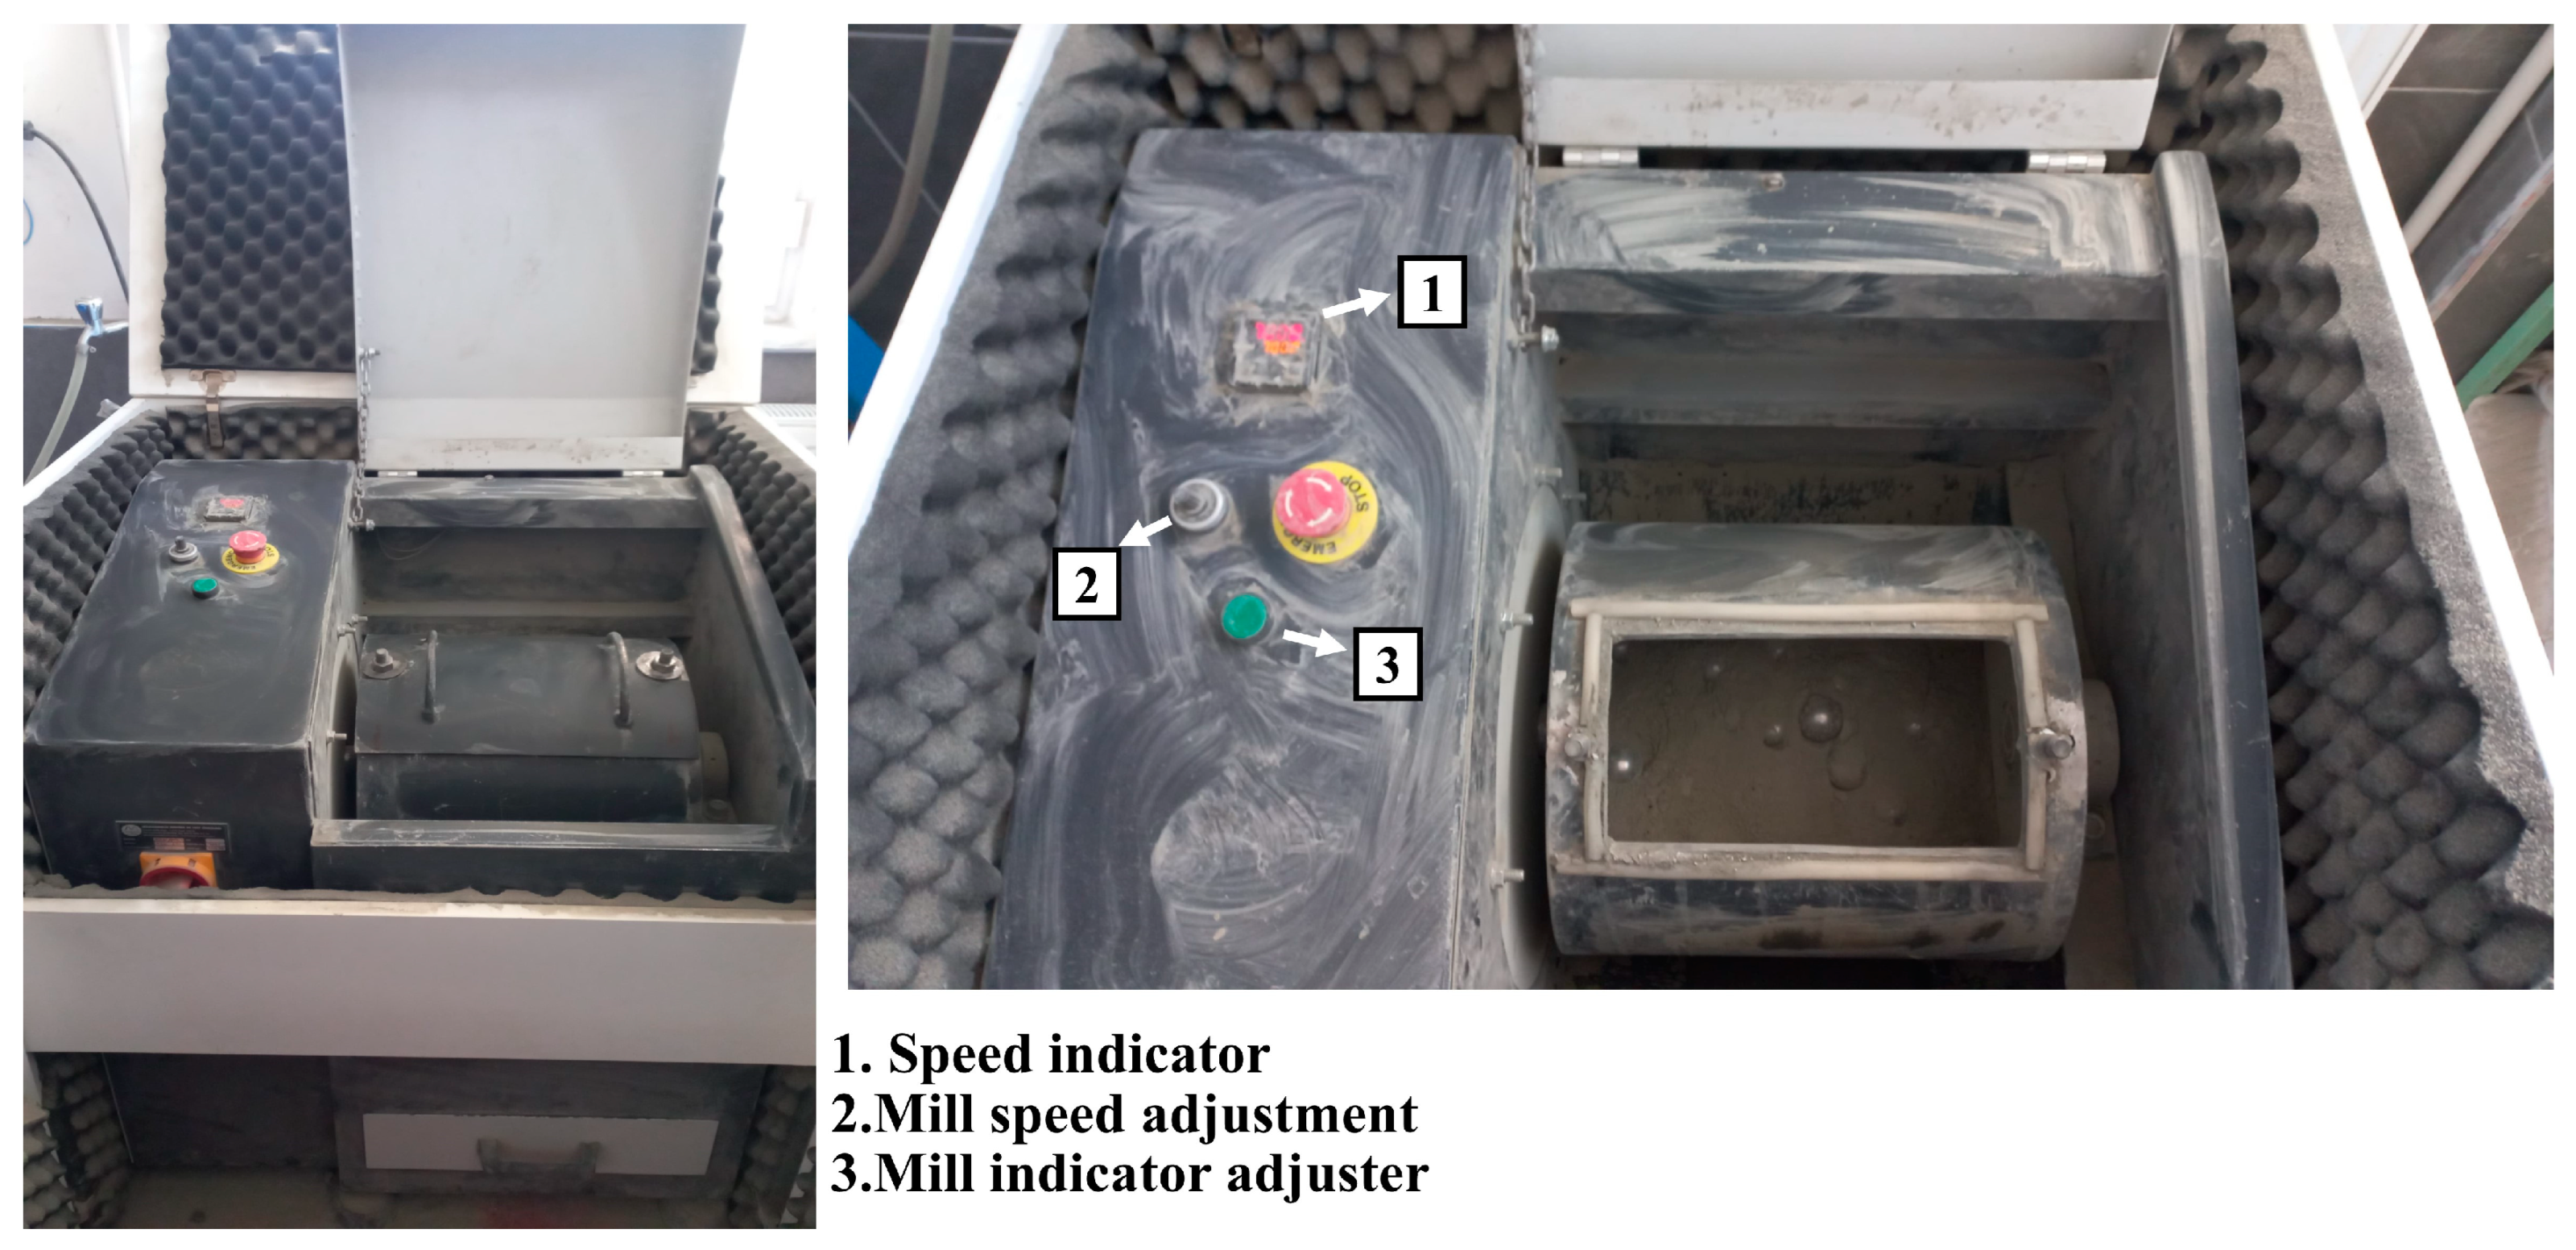
Figure 1. Ball mill used in the study.
Buildings 14 02356 g001
Figure 2. Blaine fineness values of cements produced under different grinding conditions. (a) Ball distribution no. 1, (b) ball distribution no. 2, (c) ball distribution no. 3, (d) ball distribution no. 3, (e) ball distribution no. 5, (f) ball distribution no. 6.
Buildings 14 02356 g002aBuildings 14 02356 g002bBuildings 14 02356 g002c
Figure 3. Amount of energy consumed to achieve the target Blaine fineness value (3700 ± 100 cm2/g) for cements produced under different grinding conditions. (a) Ball distribution no. 1, (b) ball distribution no. 2, (c) ball distribution no. 3, (d) ball distribution no. 3, (e) ball distribution no. 5, (f) ball distribution no. 6.
Buildings 14 02356 g003aBuildings 14 02356 g003bBuildings 14 02356 g003c
Figure 4. Schematic representation of grinding with (a) larger balls and (b) smaller balls.
Buildings 14 02356 g004
Figure 5. Comparison of the linear regression model with experimental results on the energy consumed.
Buildings 14 02356 g005
Figure 6. Comparison of the second-order regression model with experimental results based on the energy consumed.
Buildings 14 02356 g006
Table 1. Summary of some studies on the effect of grinding conditions on grinding efficiency.
Reference[23][28][13][29]
Ball shape and size6, 11, 15 and 20 mm spherical ballsSpherical (40 mm), ellipsoids (40 mm), and cubic (32 mm), mix (total weight of balls kept constant)10 mm, 20 mm, 10 and 20 mm mix16 and 20 mm spherical balls
Feed material properties (size, quantity, type)Quartz (1080–1168 g) and copper waste (792–949 g)Quartz (0.3–1.6 mm size range)Quartz (850–1700 microns and 300–850 microns)
Mill Rotation Speed85% of critical speed75% of critical speed75% of critical speed60, 65, 70, 75, and 80% of critical speed
Results obtainedThe optimum ball diameter depending on the diameter of the particle size of the milled material was related to an equation depending on the milling conditions and milled material propertiesThe optimum ratio of grinding performance was obtained by using 50% spherical and 50% cube ballsFor coarser feeds, a mix of 50 mm, 20 mm, and 10 mm ball diameters tends to break the material faster than other ball combinations. For finer feeds, a binary mix of 20 mm and 10 mm diameter balls leads to a faster breakage rateWhen 60% of the grinding media consists of small balls and 40% of the grinding media consists of large balls, the change in grinding speed is the parameter that most affects grinding efficiency for all mill fills
Table 2. Some chemical properties of clinker and gypsum.
SiO2Al2O3Fe2O3CaOMgOSO3 *Na2OK2OCl *C3SC2SC3AC4AFLoss of Ignition
Clinker21.525.433.3165.381.040.380.480.540.0156.5119.068.7910.070.52
Gypsum4.981.210.8328.940.8339.670.250.19
* According to TS EN 197-1, SO3 ≤ 3.5% and Cl ≤ 0.01.
Table 3. Ball size distribution.
Ball Diameter (mm)Ball Weight (g/pcs)1. Ball Distribution
(pcs)
2. Ball Distribution
(pcs)
3. Ball Distribution
(pcs)
4. Ball Distribution
(pcs))
5. Ball Distribution
(pcs)
6. Ball
Distribution (Bond Type) (pcs)
65860445 3
5551055666
432601212122220
4022577141715
37190389131043
3011061222222267
257051217171710
20303 71
151620405050 97
Total surface area (mm2)263,093325,673433,097457,102427,005551,796
Total weight (g)12,67515,00519,75019,48519,72519,922
Table 4. Grinding conditions applied for each ball distribution.
1. Ball Distribution
(pcs)
2. Ball Distribution
(pcs)
3. Ball Distribution
(pcs)
4. Ball Distribution
(pcs)
5. Ball Distribution
(pcs)
6. Ball
Distribution (Bond Type) (pcs)
Mill volume (m3)0.0223
Ball fill (J)0.1220.1440.1890.1870.1890.191
Void fill (U)For 2 kg feeding amount0.9770.8250.6270.6350.6280.621
For 3 kg feeding amount1.4651.2380.9400.9530.9420.932
For 4 kg feeding amount1.9541.6501.2541.2711.2551.243
Table 5. Grinding parameters and levels.
ParametersSymbolLevel 1Level 2Level 3Level 4Level 5Level 6
Ball DistributionA123456
Mass (kg)B234---
Speed (rpm)C405570---
Table 6. Taguchi L18(6^1 3^2) orthogonal layout.
Experiment No.Factor AFactor BFactor C
1111
2122
3133
4211
5222
6233
7312
8323
9331
10413
11421
12432
13512
14523
15531
16613
17621
18632
Table 7. Experimental results, S/N ratios, and Means values.
Experiment No.Control FactorsEnergy Consumed (kWh/ton)S/N Ratio for Energy ConsumedMeans for Energy Consumed
Ball Distribution
(BD)
Feed Mass
(m)
Mill Speed
(v)
1124076.12−37.630076.12
2135556.9−35.102256.9
3147052.41−34.388352.41
4224070.63−36.979870.63
5235548.58−33.729248.58
6247049.68−33.923649.68
7325554.26−34.689654.26
8337045.03−33.070045.03
9344049.41−33.876349.41
10427047.91−33.608547.91
11434057.08−35.129757.08
12445544.07−32.882944.07
13525554.85−34.783554.85
14537050.83−34.122450.83
15544055.52−34.889055.52
16627051.92−34.306751.92
17634054.37−34.707254.37
18645541.09−32.274741.09
Table 8. Response table for S/N and significance for energy consumed in grinding.
Response Table for Signal-to-Noise RatiosResponse Table for Means
LevelBDmvLevelBDmv
1−35.71−35.33−35.54161.8159.2860.52
2−34.88−34.31−33.91256.3052.1349.96
3−33.88−33.71−33.9349.5748.7049.63
4−33.87 449.69
5−34.60 553.73
6−33.76 649.13
Delta1.941.631.63Delta12.6810.5910.89
Rank132Rank132
Table 9. ANOVA results for energy consumed.
SourceDegree of Freedom (DoF)The Sum of Squares (SS)Mean Square (MS)F-Valuep-ValueImpact Rates (%)
BD5460.64230.3230.610.00017836.89
m2349.93174.9610.040.00046428.02
v2377.9175.5823.250.00270230.26
Error860.207.53 4.82
Total171248.67 100.00
Table 10. Regression equations according to ball distributions.
BD
1energy consumed=97.66 − 5.29 m − 0.3631 v
2energy consumed=92.14 − 5.29 m − 0.3631 v
3energy consumed=85.41 − 5.29 m − 0.3631 v
4energy consumed=85.53 − 5.29 m − 0.3631 v
5energy consumed=89.58 − 5.29 m − 0.3631 v
6energy consumed=84.97 − 5.29 m − 0.3631 v
Table 11. Comparison of experimental results and regression predictions.
Taguchi MethodsLinear RegressionQuadratic Regression
Experimental ResultPredictionError (%)Experimental ResultPredictionError (%)Experimental ResultPredictionError (%)
A6B3C3 (The best)49.3752.346.0249.3750.563.0249.3749.260.23
A3B2C3 (Random)57.9061.045.4257.9059.062.0157.9045.120.20
Disclaimer/Publisher’s Note: The statements, opinions and data contained in all publications are solely those of the individual author(s) and contributor(s) and not of MDPI and/or the editor(s). MDPI and/or the editor(s) disclaim responsibility for any injury to people or property resulting from any ideas, methods, instructions or products referred to in the content.