Article

Comparative Study of SFPE and Steering Modes in Pathfinder to Optimise Evacuation Routes

Faculty of Safety Engineering, VSB Technical University of Ostrava, Lumírova 630/13, Výškovice, 700 30 Ostrava, Czech Republic
*
Author to whom correspondence should be addressed.
Buildings 2024, 14(8), 2361; https://doi.org/10.3390/buildings14082361
Submission received: 21 June 2024 / Revised: 25 July 2024 / Accepted: 29 July 2024 / Published: 31 July 2024
(This article belongs to the Section Construction Management, and Computers & Digitization)

Abstract

:
This paper investigates the possibilities of using an agent-based evacuation model to analyse the formation of queues at the exits of enclosed spaces and the evacuation process of people. The aim is to investigate how the density of people in a crowd affects the safe movement of people and how the width, number, and location of exits affect evacuation time. The analysis was carried out using the Pathfinder evacuation model, which provides two modes to simulate the movement of people: steering and SFPE. An enclosed space of 20 m × 30 m was investigated. First, the differences between the modes of the evacuation model to simulate the movement of people were compared. Then, the steering mode with limited door flow was set and the effect of the width, number, and location of the exits with a total width of 4 m on the evacuation time was investigated. The results of this study highlight differences in the simulation of the movement of people according to the different modes and provide valuable information for the design of safe escape routes. Proper design of escape routes can prevent an adverse situation that could arise when evacuating a large number of people.

1. Introduction

Effective evacuation of people from enclosed spaces, such as buildings, stadiums, or transportation hubs, is a key element in ensuring the safety of people in the event of emergencies such as fires, terrorist attacks, or natural disasters. In these situations, it is essential to ensure that people leave quickly and efficiently to a safe place and minimise the risks associated with panic, injuries, or even loss of life [1,2]. Therefore, analysis of the evacuation process is an important tool for developing evacuation plans that can significantly improve preparedness for emergency events [3,4,5].
One of the key problems in the evacuation of people is the formation of queues at exits, which can significantly slow the movement of people and increase the risk of panic and injury. Queues at exits form mainly due to the limited capacity of escape routes and the non-uniform distribution of people in the space [6,7]. Studies show that effective crowd management and optimisation of evacuation routes can significantly reduce the risk of congestion and improve evacuation safety [8,9,10].
The literature shows that not only technical solutions, such as the design of escape routes and their capacity, but also behavioural aspects, such as people’s behaviour under stress and their decision-making processes, are crucial in evacuation. Studies show that people tend to follow others, which can cause congestion on certain routes and exits, while others remain unused [11,12,13,14]. Another important factor to consider is the evacuation process itself. Several studies suggest that even short delays at exits can significantly increase evacuation time and risk to people inside the building [3,15,16]. Therefore, it is important to consider both static factors, such as building layout, and dynamic factors, such as the movement of people and their interaction.
Several engineering methods, ranging from simplified calculations to mathematical modelling (evacuation models), can be used to verify the design of exit routes, their capacity, and the evacuation process. Their selection depends on the complexity of the area, the number of evacuees, and other factors. Evacuation models [17,18,19] appear to be very important, as they allow simulation of movement of people in real time. They help identify critical locations in terms of people density, design optimal evacuation routes, test different evacuation scenarios, and increase people’s safety during evacuation [20,21,22].
There are several approaches to modelling the movement of people during an evacuation, each with its specific methods and applications. Agent-based modelling simulates the behaviour of individuals and their interactions, which is crucial to understanding the dynamics of the crowd and identifying critical places during evacuation [6,8]. This approach allows for detailed observation of how people react to different situations and the behaviour of others [9,23]. Microscopic models, such as agent-based models, focus on detailed simulation of individuals, but often use rules based on physical and social forces to describe their movements [24]. Cellular automata-based methods, which are a type of discrete simulation, are used to model the movement and stopping of people under various conditions [25]. Network models use graph theory to analyse movement in complex spatial networks, which is useful for optimising evacuation routes and identifying potential bottlenecks [7,26,27]. Macroscopic models focus on the total flow of a crowd and provide an overview of general patterns of movement, but do not allow detailed analysis of individual behaviour [28]. Continuum models use differential equations to describe the movement of the crowd as a fluid, allowing the flow to be modelled at the macroscopic level [29]. For our case study, agent-based modelling is most appropriate, as it provides a detailed view of individual behaviour and interactions. This is crucial to accurately analyse and predict the movement of people during evacuations [3,8,9,30].
This paper investigates the possibilities of using an agent-based evacuation model (Pathfinder) to analyse the formation of queues at the exits of enclosed spaces and the evacuation process of people. It highlights the differences in the simulation of movement of people according to the different modes of the Pathfinder evacuation model. It evaluates how the density of people in a crowd affects the safe movement of people and how the width, number, and location of exits affect evacuation time. The Level of Service (LoS) method was used to assess the safe/critical level of density of people during evacuations. This method has been described in several publications [31,32,33] and allows quantification of the safety and efficiency of movement of people according to the density of people.
This introductory section is followed by Section 2, which first describes the Pathfinder evacuation model and its modes to simulate the movement of people, and also briefly describes the Level of Service (LoS) method for assessing the safe level of density of people. This section concludes with a description of the three substudies to which the above modes and the LoS method were applied. Section 3 comments on the differences in the simulation of movement of people according to the different modes of the Pathfinder evacuation model and summarises the results of the analysis of the effect of the width, number, and location of exits on evacuation times. Section 4 discusses the differences in visualisation of the movement of people according to the modes of the Pathfinder evacuation model. Finally, Section 5 presents the conclusions and suggestions for future directions.

2. Methods

2.1. The Pathfinder Evacuation Model

For the analysis of evacuation of people, the Pathfinder evacuation model has been used to model evacuation and movement of people from buildings and other environments [34]. It is an agent-based simulation software. This means that each person in the Pathfinder evacuation model is called an agent, which has its own consciousness and makes decisions about its movement depending on its environment. The development and regular updates of this evacuation model are provided by Thunderhead Engineering. Pathfinder version 2023.3 has been used for simulations.
The Pathfinder evacuation model provides two basic modes for simulating the movement of agents (people) during an evacuation: the Society of Fire Protection Engineers (SFPE) mode and the steering mode. The application of these two modes has been evaluated in case studies that focus on the progress of evacuation of people by Ahmed et al. [35] and Li et al. [36], who also considered the effect of fire suppression system failures. Following the modes presented to simulate the movement of agents, the current density of agents in space has a major influence on safe movement. If the density of agents is higher than 5 agents per 1 m2, the comfortable movement of agents is disrupted, and agents can be injured. Therefore, it is necessary to monitor the safe level of density of agents during evacuation, which is evaluated in the Pathfinder evacuation model using, among others, the Level of Service (LoS) method described by Fruin [31].

2.1.1. SFPE Mode

The SFPE mode simulates the movement of agents in the building during evacuation as a flow and is based on a set of assumptions and hand calculations described in the SFPE publications [37,38]. The selection of evacuation route in the SFPE mode is based on the length of the walking route. The agents choose the shortest route to the exit. The calculations described in the SFPE publications [37,38] have been used in a study by Ronchi [39] and Mehmood et al. [40].
The SFPE mode considers the movement speed of the agents (v) and their flow through the door (F). During the simulation, the evacuation model monitors the density (D) of the evacuated space and then automatically adjusts the movement speed based on the density. Therefore, the movement speed depends on the density of the agents (D), the maximum speed of the agent (vmax), and the type of terrain on which it is moving.
D = n p e r s A r o o m A b l a y e r
v = v m a x × v f D × v f t
where
v f D = 1                                                                                                                           D < 0.54   pers / m 2 max v f m i n × 1 0.85 1 a × D                 D 0.54   pers / m 2
v f t = k 1.4
where D is the density of agents in the current room (pers/m2); npers is the number of agents in the enclosed space (pers); Aroom is the area of the space (m2); Ablayer is the area of the boundary layer (m2), which is calculated by multiplying the total length of the boundary edges in the boundary layer space (BL) set in the simulation parameters for SFPE mode; v is the agent’s movement speed (m/s); vmax is the agent’s maximum speed set in the user interface as speed (m/s); vf(D) is the fraction of speed as a function of density (m/s); vft is the fraction of speed dependent on the type of terrain the agent is traversing (m/s); vf,min is the fraction of the minimum speed (m/s) defined in the simulation parameters (default setting = 0.15); a is a constant of 0.266 m2/pers; and k is a speed factor (m/s) whose value depends on the type of terrain. For flat terrain (corridor, alley, rooms) and ramps, the value of k is equal to 1.40 m/s [34,37,38].
In the Pathfinder evacuation model, we can select two options for agents that flow through the door at high density: (a) use a calculated specific flow (Fc) and (b) always use maximum specific flow. If option (a) is selected, the density in the enclosed space is calculated according to Equation (1) above. Otherwise, if option (b) is selected, the density in the enclosed space is set at 1.88 pers/m2 to ensure a maximum flow of agents through the door of 1.32 pers/s [34].
F c = F s × W E
where
F s = v × D = 0.85   k × D                                                     D < 0.54   pers / m 2 v × D = ( 1 a × D ) × k × D                   D 0.54   pers / m 2
W E = W 2 × B L
where Fc is the calculated flow of agents through the door (pers/s); Fs is the specific flow (pers/s/m) according to Equation (6), which can be different for each door; WE is the effective or actual width of the door (m) according to Equation (7); a is a constant of 0.266 m2/pers; D is the density of agents in the enclosed space (pers/m2); k is the speed factor (m/s) whose value depends on the type of terrain; W is the actual width of the door (m); and BL is the boundary layer defined in the simulation parameters (default setting = 0.15 m) [34,37,38].

2.1.2. Steering Mode

The principle of the steering mode was first described by Reynolds [41] and subsequently developed and specified by Amor [42]. The movement of agents is controlled to avoid obstacles and collisions between them. The evacuation strategy in this mode combines route planning and obstacle avoidance and avoidance of each other. The route is determined based on two factors: the distance to the nearest exit and the distance between evacuees. The steering mode focusses on evacuating agents from an enclosed space as quickly as possible. It also considers other people in the vicinity.
The maximum speed of the agents (ύmax) depends on the type of terrain they are moving on, the maximum speed vmax specified as speed in the user interface, and their density (D) in the enclosed space. Pathfinder estimates density based on the distance between the closest agents and the average relationship between longitudinal and lateral spacing described in the publication [31]. The spacing was investigated using a series of photographs. In the Pathfinder evacuation model, the curves in Figure 1 are treated as contours, and each is estimated as an ellipse. Equation (2) is used to calculate the speed v (in Section 2.1.1). The speed v becomes the speed ύmax, which is used by the Pathfinder evacuation model data simulator to calculate the desired speed vector [34].
The speeds vf(D) and vft (in Section 2.1.1), which are part of the calculation of the maximum speed ύmax, can be left in the original SFPE settings in the agent profile or can be defined as linear piecewise functions. The speed vf (D) is the fraction of speed as a function of density (m/s). The speed vft is the fraction of velocity that depends on the type of terrain on which the agent moves (m/s) (in Section 2.1.1) [34].
Another important parameter in the steering mode is acceleration (a). Acceleration of the agent is divided into several components, depending on the desired speed vector calculated by the steering system.
a f m a x = v m a x t a c c e l
a b m a x = 2 × a f m a x
a r m a x = 1.5 × a f m a x
where afmax is the forward tangential component of acceleration (m/s2), vmax is the maximum speed of the agent entered in the user interface as speed (m/s), taccel is the acceleration time (agent profile parameter) (s), abmax is the forward tangential component of acceleration (m/s2), and armax is the radial component of acceleration (m/s2) [34].
The flow of agents through the door in steering mode is not restricted, so evacuation proceeds smoothly without additional unnecessary delays. However, limiting the flow of agents through the door can be set in two ways:
  • Using the simulation parameter “Limit Door Flow Rate” (“Boundary Layer”, “Specific Flow”);
  • Using the door parameter “Flow Rate”.
The main differences between the SFPE mode and the steering mode when setting the flow through the door are as follows:
  • The door flow limit can only be set as a fixed value in steering mode. It cannot be based on the density in the enclosed space as in the SFPE mode [34].
  • In steering mode, the actual flow rate achieved is often less than the set limit. This is due to the acceleration parameter and the avoidance agents in the model [34].
  • Agents passing through a flow-limited door may experience a slight deceleration at the threshold of the door in steering mode [34].

2.1.3. Level of Service (LoS)

At the same time, this study investigated how the density of agents affects their fluid and safe movement. In general, a critical density value is reached when the density of the crowd is greater than 5 people per 1 m². Once this density value is reached, the comfortable movement of the agents is interrupted and injuries can occur [43].
One way to assess the safe level of density in an enclosed space is to use the so-called “Level of Service” (LoS). LoS assesses the quality of a walk using a simplified scale denoted by letters A to F. There are several methods to determine LoS [31,32,33]. In engineering practice, the most widely used method is the one described by Fruin [31], which distinguishes different levels for walkways, stairways, and queues. This method is also used by the Pathfinder evacuation model. In this study, data from Fruin’s method were used to assess the quality of walking in queues. These data are presented in Table 1.

2.2. Case Study

This study aimed to investigate the possibilities of using an agent-based evacuation model (Pathfinder version 2023.3) to analyse the formation of queues at the exits of enclosed spaces and the evacuation process of people. Attention was paid to the differences in the simulation of movement of agents according to the different modes of the Pathfinder evacuation model (in Section 2.1). In addition, we evaluated how the width, number, and location of the exits affect the evacuation time. We used the LoS method (in Section 2.1.3) to identify critical places in terms of density of agents.

2.2.1. Analysis of Modes of the Pathfinder Evacuation Model

First, in the study, we analysed the differences in the simulation of the movement of agents according to the different modes of the Pathfinder evacuation model. The main objective was to find the most suitable mode for the subsequent analysis of the evacuation of people. Then, this mode was used to investigate how the width, number, and location of the exits affect the evacuation time.
Within the SFPE mode, the difference was investigated when changing the setting of the parameter “Flow Rates at High Density”:
  • SFPE mode 1: “Use a Calculated Specific Flow”—calculated as a function of the density of agents in the bounded space;
  • SFPE mode 2: “Always Use Max Specific Flow”—provides for the flow of agents through the door (1.32 pers/s/m) at the optimal density (1.88 pers/m2).
Within the steering mode, the difference was investigated when we set only “Collision Handling” and when we set “Collision Handling” and “Limit Door Flow Rate”:
  • Steering mode 1: considered only with “Collision Handling”;
  • Steering mode 2: considered with “Collision Handling” and “Limit Door Flow Rate” with “Boundary Layer” of 0.15 m and “Specific Flow” of 1.32 pers/s/m.
For this study, an enclosed space was created with an area of 600 m2 (30 m × 20 m) with three exits, each 1.5 m wide, as shown in Figure 2. First, the width of each exit was reduced to 1.0 m and then increased to 2.0 m. The number of exits was then reduced to two exits with a width of 1.5 m and then increased to four exits of the same width. In all cases, that is, varying the width and number of exits, different densities of agents were successively placed in the enclosed space, ranging from 1.5 pers/m2 to 5.5 pers/m2. This range of densities was chosen to include the three worst levels according to the Level of Service (LoS) method.
All agents had default agent parameters and behaviours set in all simulation processes. They moved at a constant speed of 1.19 m/s, with a constant acceleration time of 1.1 s. Their arm width was set at a constant value of 45.58 cm and their height at 1.83 m.

2.2.2. Analysis of Two Selected Modes of the Pathfinder Evacuation Model

The differences in the simulation of movement of agents were then re-analysed according to different modes of the Pathfinder evacuation model (in Section 2.1). For this study, the selection of modes was narrowed down and the differences in the simulation of movement of agents were analysed according to the two selected modes, referred to as SFPE mode 1 and Steering mode 2 in the previous substudy (in Section 2.2.1). The selection of these modes was based on the evacuation time, with SFPE mode 1 and Steering mode 2 having a longer evacuation time than SFPE mode 2 and Steering mode 1. The evacuation time determined using the Pathfinder evacuation model can be considered an important parameter in practice in the design of fire protection systems for enclosed spaces that are installed to ensure the safety of people.
Two enclosed spaces were created for this study. First, with an area of 100 m2 (10 m × 10 m), and second, with an area of 1600 m2 (40 m × 40 m). For both enclosed spaces, three exits were created again, each 1.5 m wide, and their layout was the same as for the 600 m2 room (in Figure 2). Different densities of agents, as in the previous case, were successively placed in both enclosed spaces, ranging from 1.5 pers/m2 to 5.5 pers/m2. This range of densities was chosen to include the three worst levels according to the Level of Service (LoS) method.
All agents, as in the previous case, had default agent parameters and behaviours set in all simulation processes.

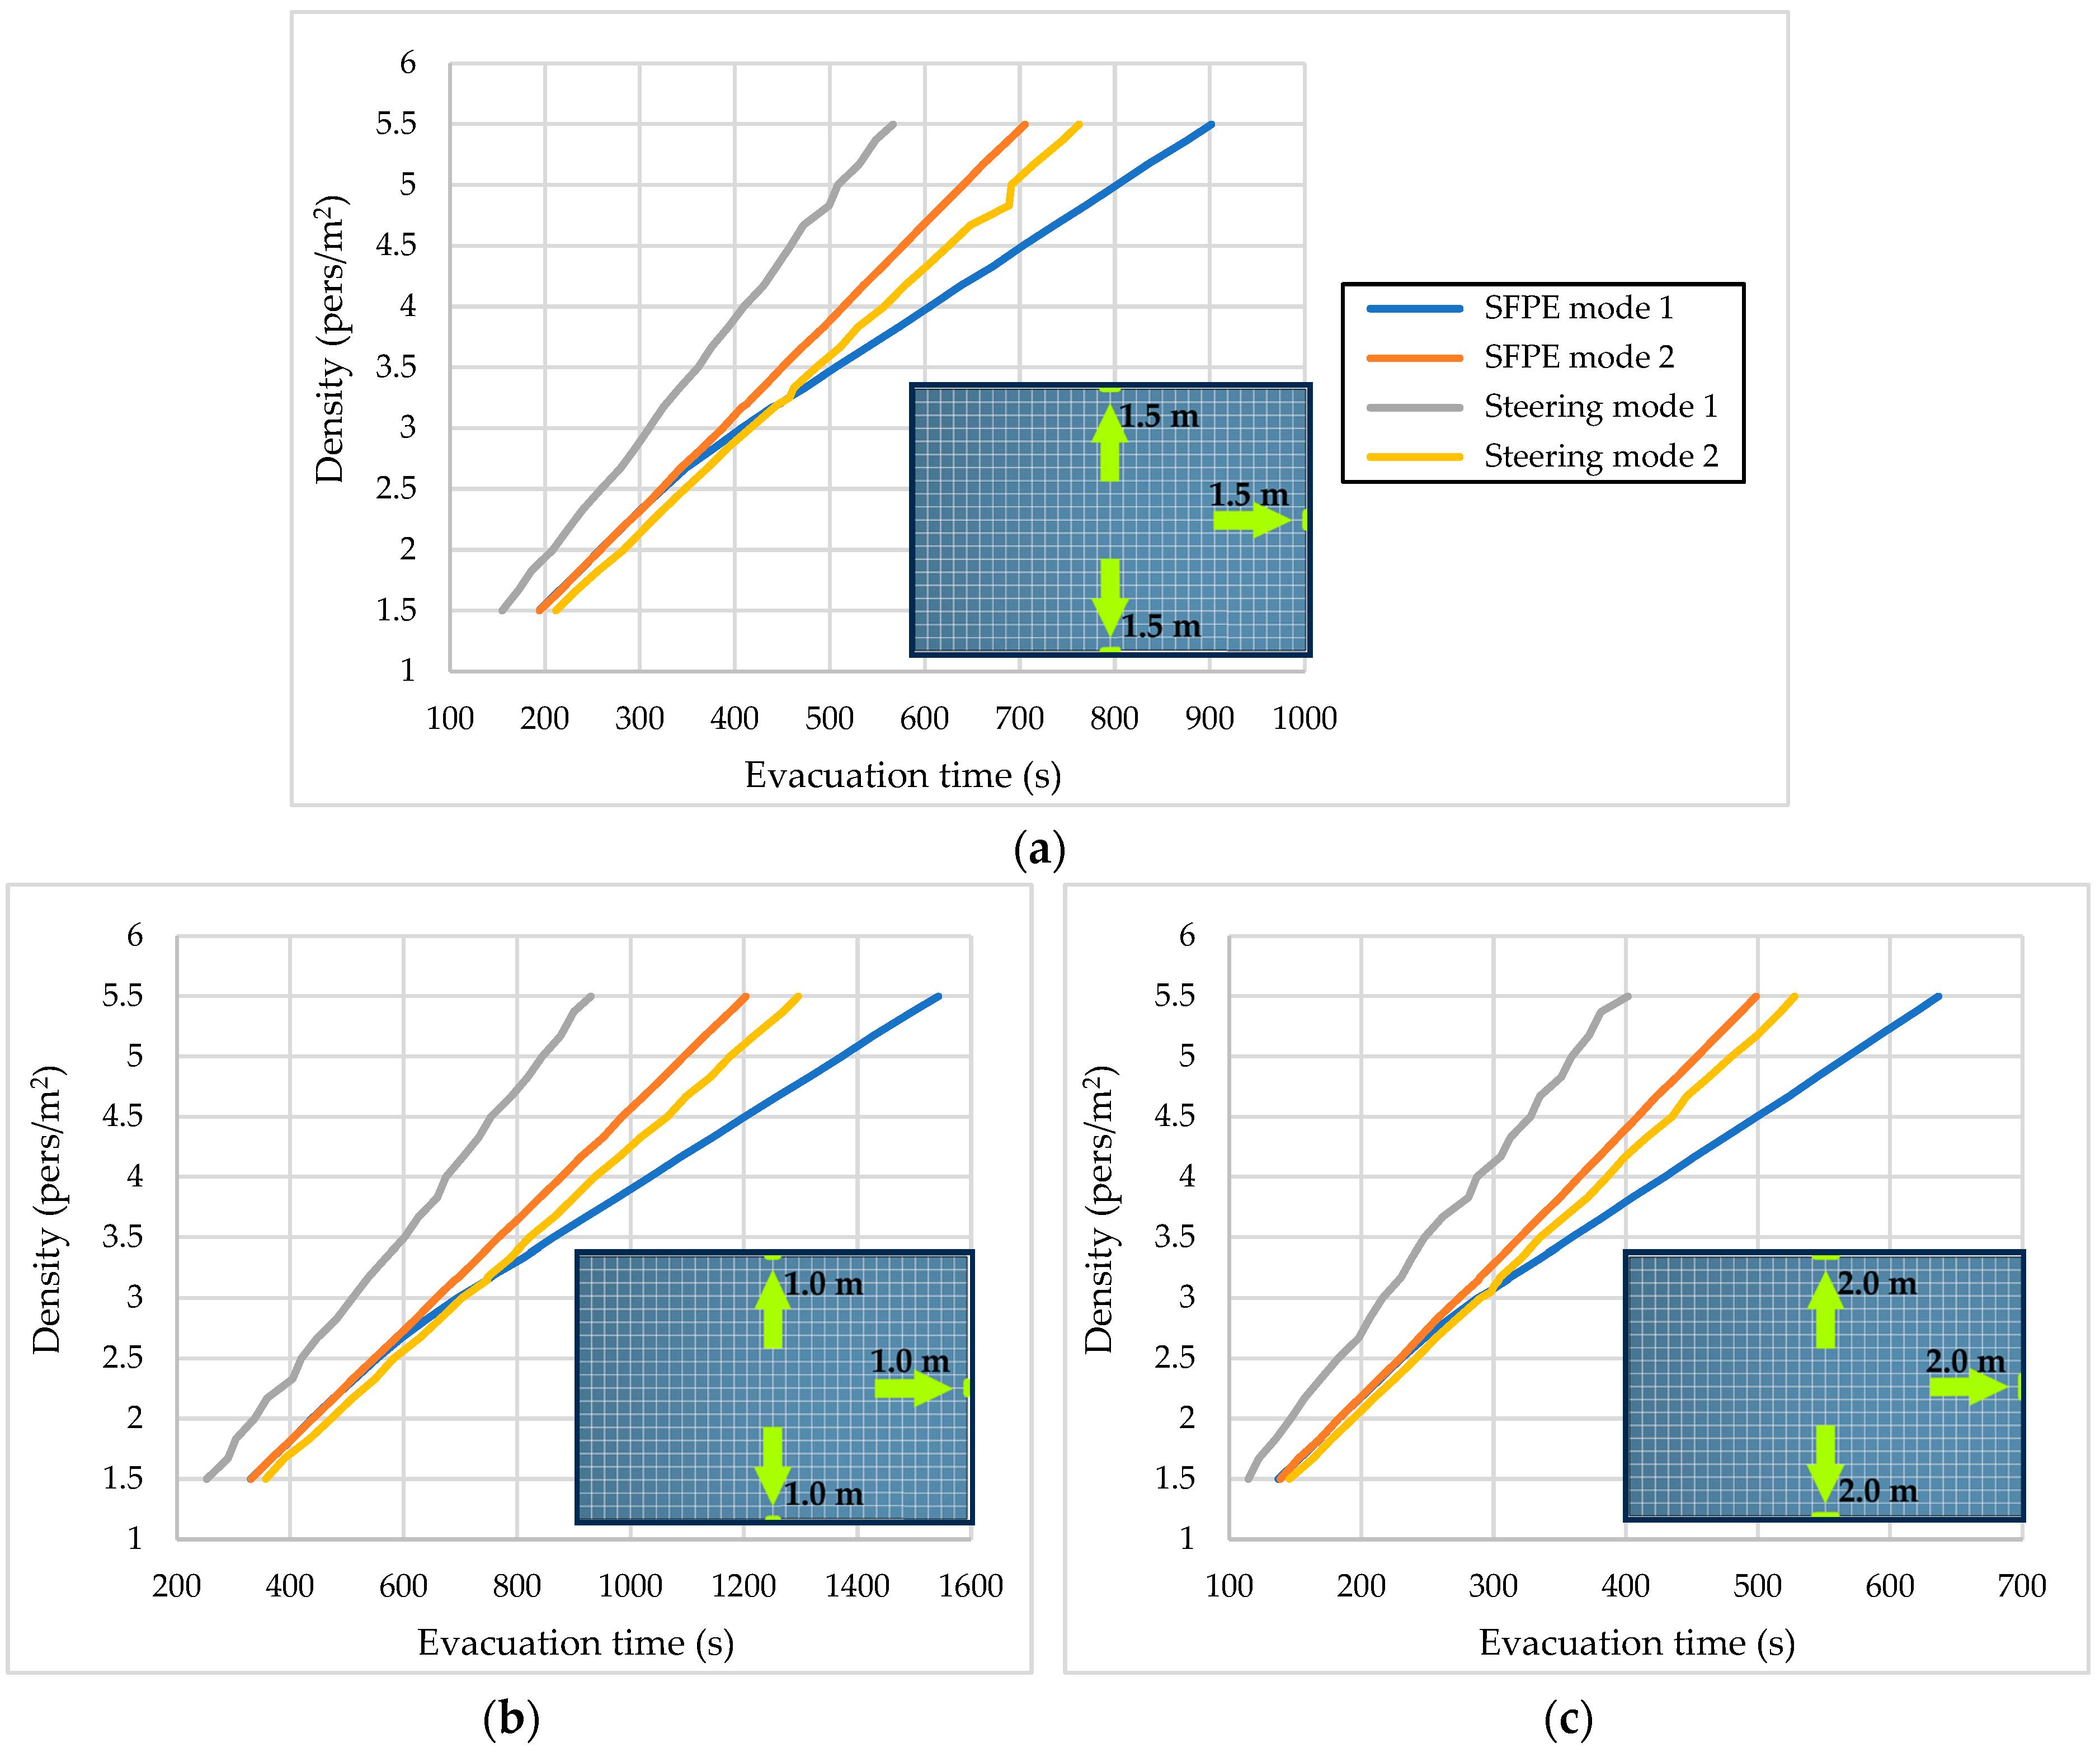
2.2.3. Effect of Width, Number, and Location of Exits on Evacuation Time

The final part of the study focused on evaluating how the width, number, and location of the exits affect the evacuation time. For this analysis, only Steering mode 2 was set in the Pathfinder evacuation model (in Section 2.2.1). This mode was chosen so that agents avoid walls and each other (steering mode) and because the flow of agents through doors can be set (SFPE mode). In addition, Steering mode 2 provides a better visual representation of the movement of agents towards the exits and a representation of the formation of queues at the exits (in Section 4).
In the study, an enclosed space was reused with an area of 600 m2 (30 m × 20 m). The exits from this area were designed so that the total width of the escape of people (the sum of the widths of all exits from the enclosed space) was 4.0 m. When designing one exit, its width was 4.0 m; when designing two exits, the width of each was 2.0 m (in Figure 3a,b); when designing three exits, the width of each was 1.33 m (location of the exit in Figure 2); and when designing four exits, the width of each was 1.0 m (in Figure 3c–e). In addition to the effect of width and number of exits, the effect of exit location was also investigated when designing two exits and when designing four exits (in Figure 3).
Different densities of agents, as in the previous case, were successively placed in an enclosed space, ranging from 1.5 pers/m2 to 5.5 pers/m2. This range of densities was chosen to include the three worst levels according to the Level of Service (LoS) method. All agents, as in the previous case, had default agent parameters and behaviours set in all simulation processes.

3. Results

3.1. Analysis of Modes of the Pathfinder Evacuation Model

First, the differences in the simulation of the movement according to the different modes of the Pathfinder evacuation model were investigated. Figure 4a shows the dependence of the evacuation time on the density of agents in the enclosed space in the range of densities from 1.5 to 5.5 pers/m2 (in Section 2.2.1). Figure 4 shows that changing the mode to simulate the movement of agents affects the progress of the evacuation, particularly the evacuation time. The largest difference in evacuation time can be observed between Steering mode 1 (only “Collision Handling”) and SFPE mode 1 (“Use a Calculated Specific Flow”). The shorter evacuation time in Steering mode 1 can be explained by the fact that in this mode the flow of agents through the door, which was defined in the other modes (also in Steering mode 2), was not specified. This fact can be observed in all of the cases studied (in Figure 4b–e).
It can be seen in Figure 4 that the curves representing SFPE mode 1 and SFPE mode 2 overlap to densities of 2.5 pers/m2 to 2.8 pers/m2 in all of the cases examined. At higher densities that exceed the density of 2.5 pers/m2 (2.8 pers/m2), the curves diverge and a longer evacuation time can be observed when setting SFPE mode 1 (‘Use a Calculated Specific Flow’).
Furthermore, attention was focused on the curves representing SFPE mode 1 and Steering mode 2. When following the course of these two curves in Figure 4, it is noticeable that the intersection of both curves occurs approximately at a density of 3.0 pers/m2 to 3.2 pers/m2. Up to the point of intersection, the evacuation time is longer when setting Steering mode 2, but the difference is not very large, on the order of tens of seconds at most. On the other hand, at higher densities, after the intersection of these curves, the evacuation time is longer at SFPE mode 1, and the difference increases with increasing density, reaching more than 100 seconds at a density of 5.5 pers/m2. The intersection in the above density range is due to mathematical calculations that are set up in the Pathfinder evacuation model and performed using the evacuation model data simulator.

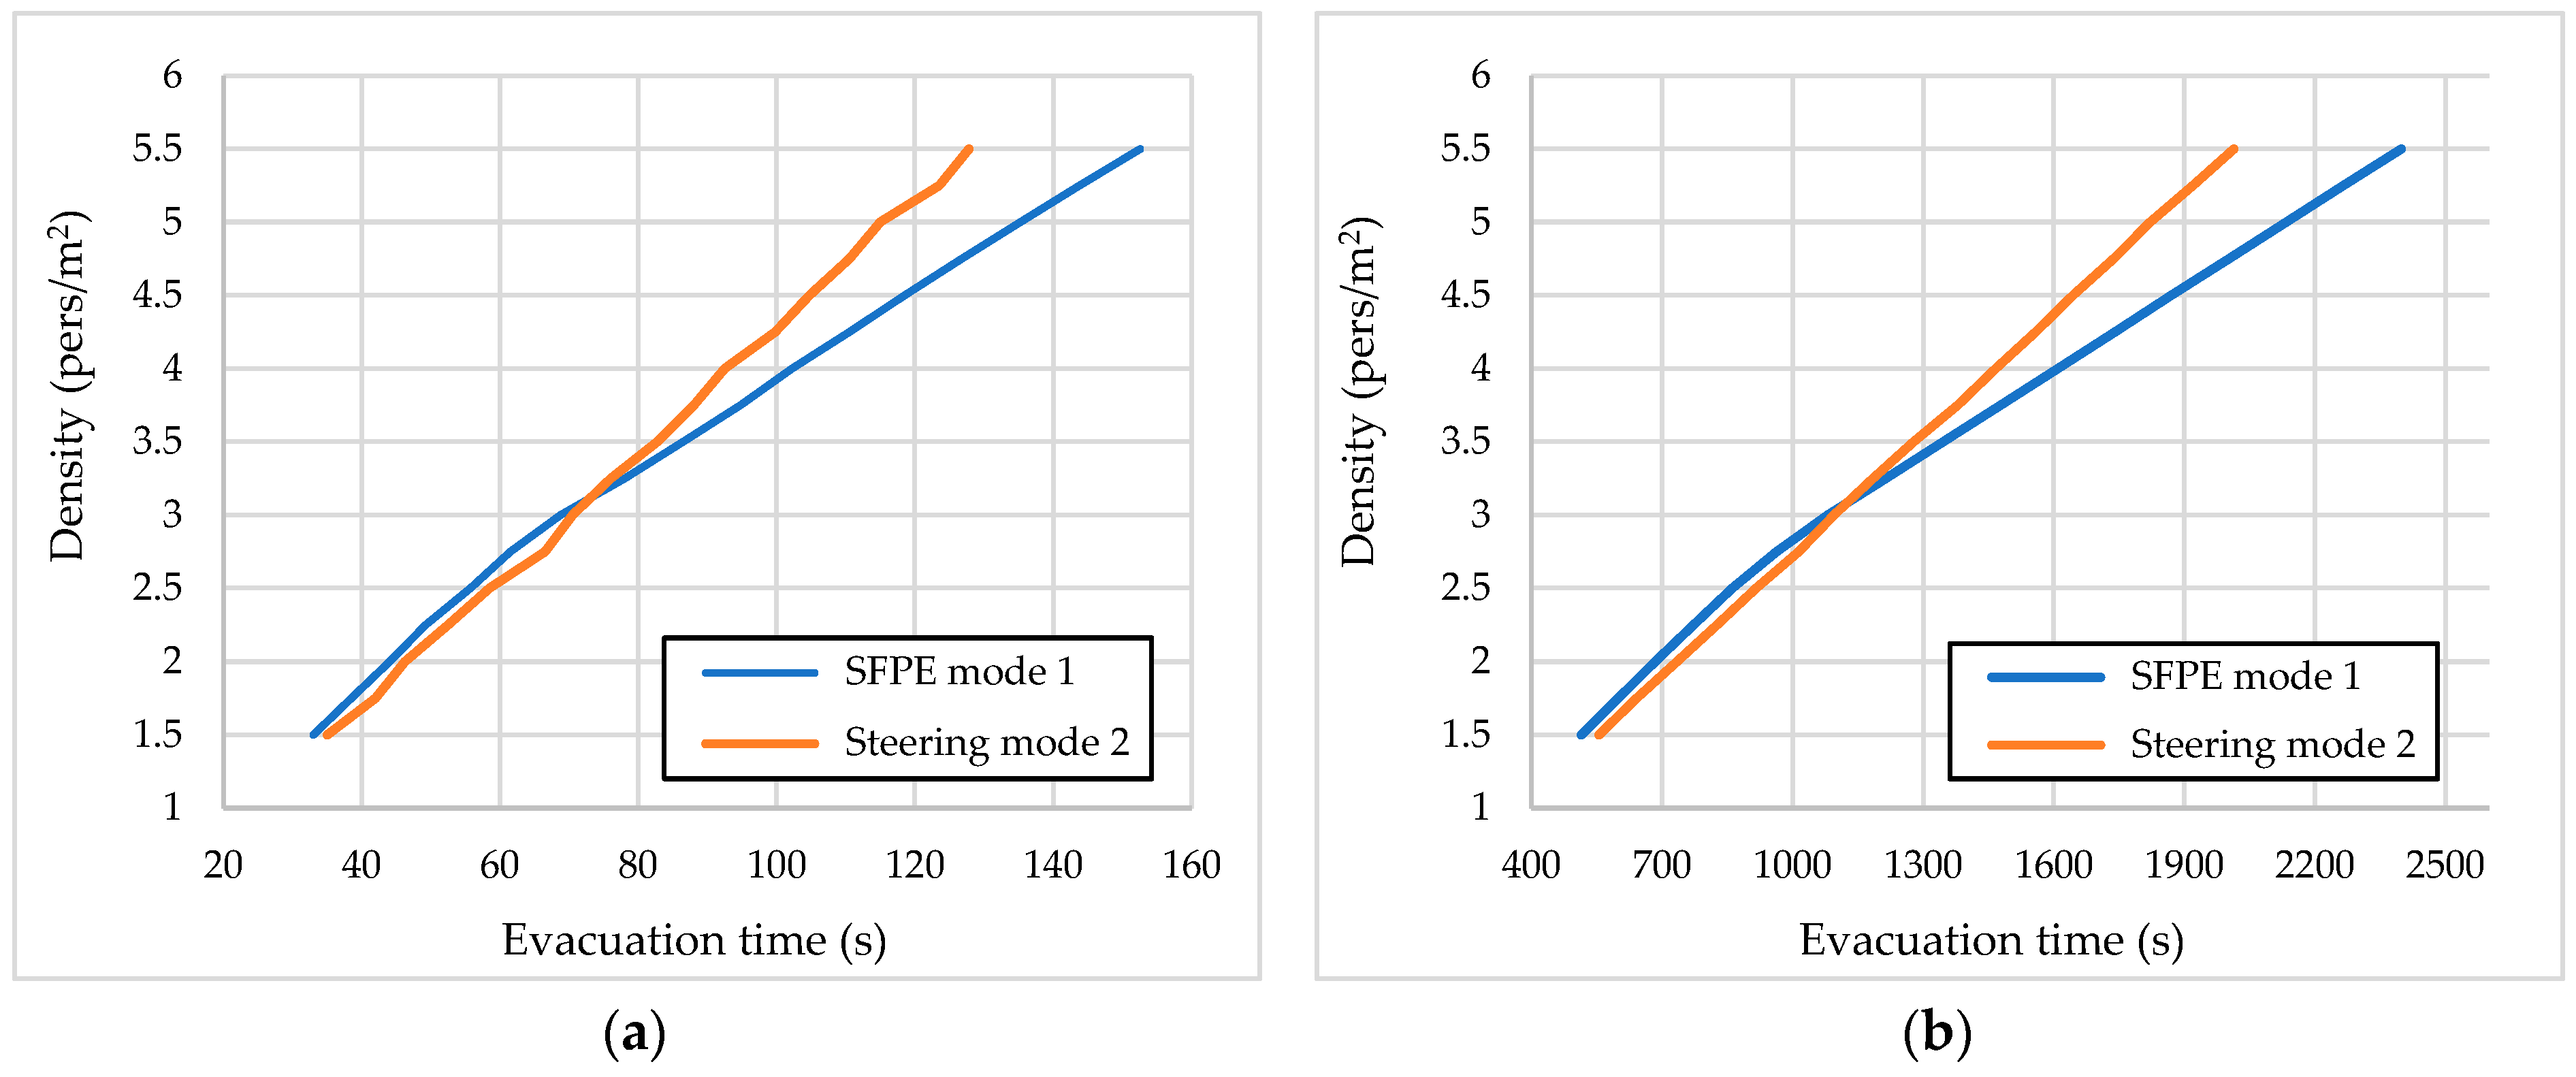
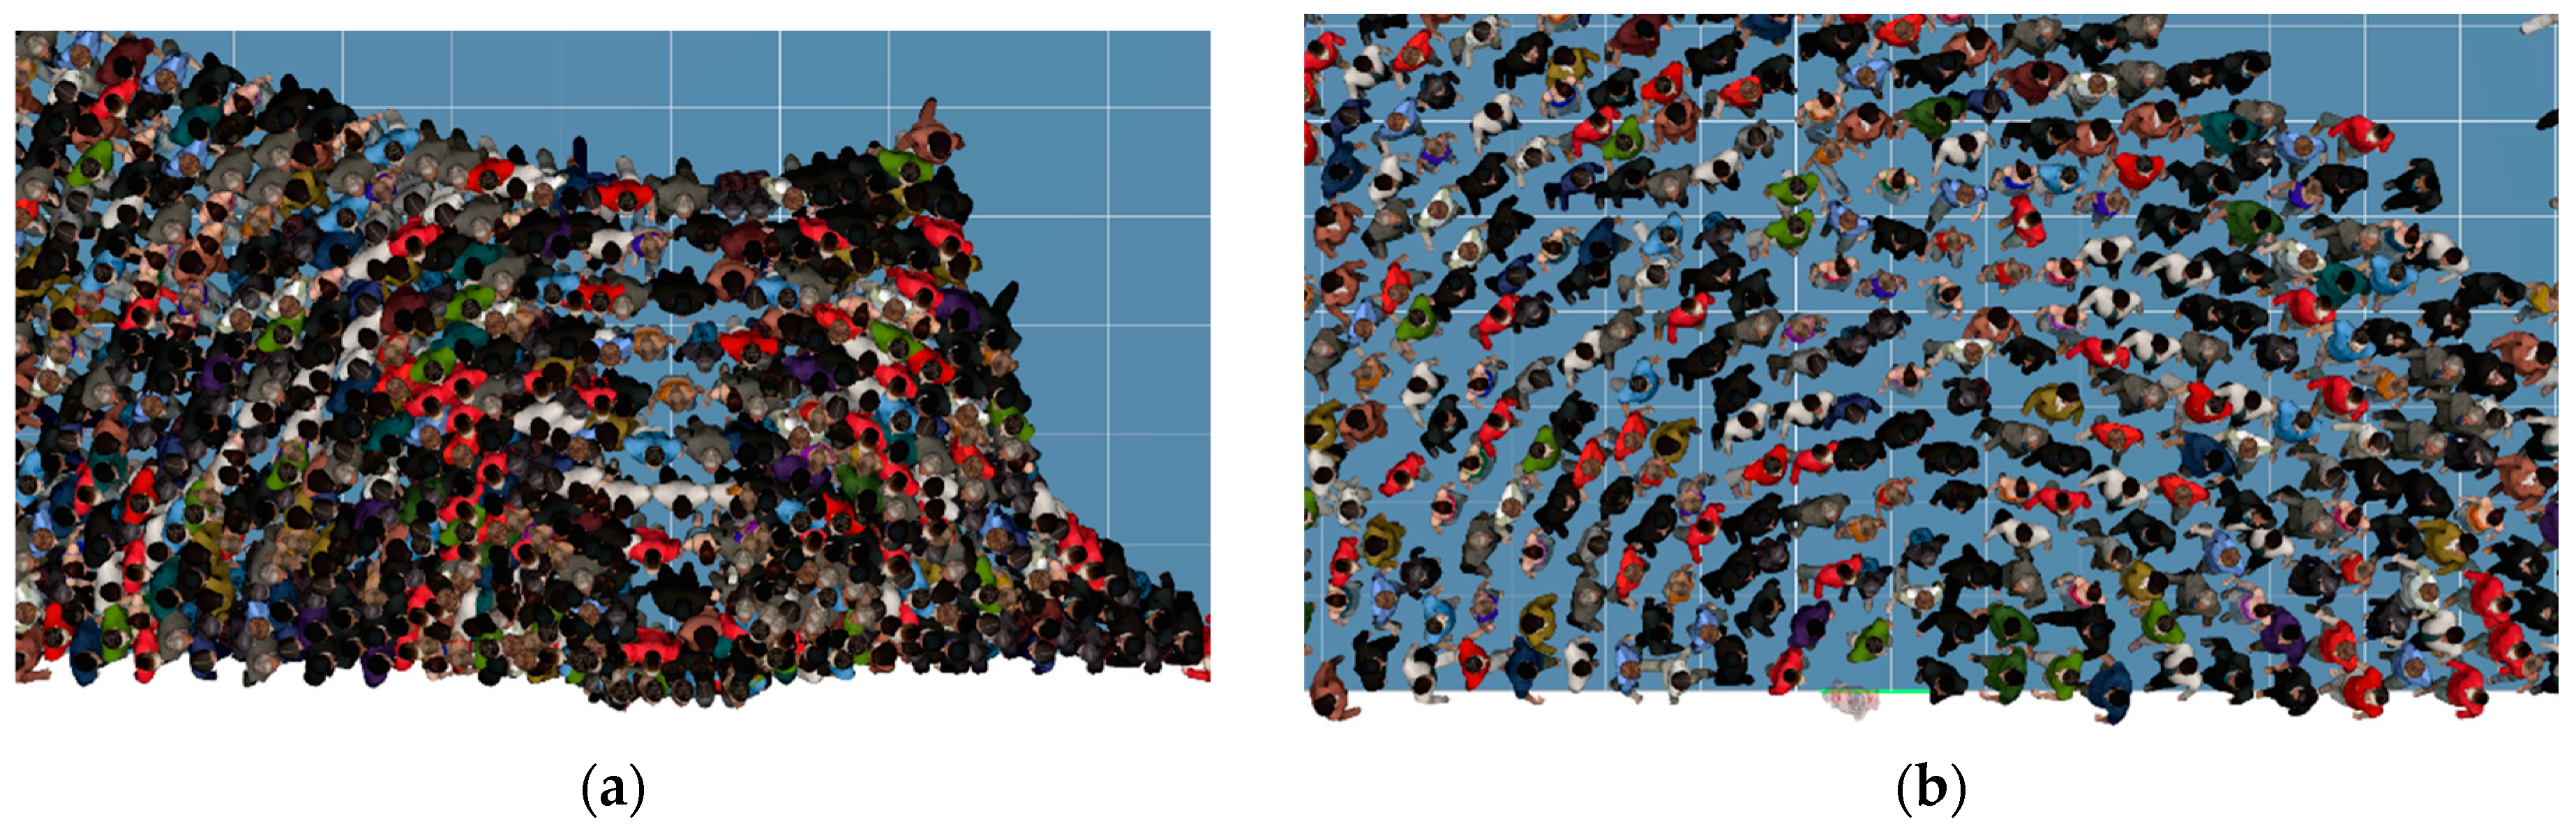
3.2. Analysis of Two Selected Modes of the Pathfinder Evacuation Model

Furthermore, the differences in the simulation of the movement of agents were investigated by narrowing down to two selected modes, namely SFPE mode 1 and Steering mode 2. The selection of these modes was based on the evacuation time, which was longer than that of SFPE mode 2 and Steering mode 1. The longer evacuation time determined by SFPE mode 1 and Steering mode 2 may be an important parameter in practice in the design of fire protection systems for enclosed spaces that are installed to ensure the safety of people (e.g., the ventilation of escape routes). If we consider a longer evacuation time, we can assume that we are on the safe side.
This part of the study was to verify whether the course of both curves (SFPE mode 1 and Steering mode 2 curves) will be similar (or the same) as in the previous case (in Figure 4). The aim of study was then to verify whether the intersection of the curves occurs in the same range of densities (from 3.0 pers/m2 to 3.2 pers/m2). The verification was carried out for a reduced enclosed space with an area of 100 m2 and three exits with a width of 1.5 m and an enlarged enclosed space with an area of 1600 m2 also with a width of 1.5 m. As can be seen in Figure 5, in both cases, the above facts regarding the SFPE mode 1 and Steering mode 2 curves were confirmed. In the case of a smaller enclosed space (in Figure 5a), the difference in the evacuation time until the intersection of the curves is only on the order of seconds, and at a density of 5.5 pers/m2, the difference is greater than 20 s. The same applies to the larger room (in Figure 5b); the difference in evacuation time until the intersection of the curves is tens of seconds, and at a density of 5.5 pers/m2, the difference is greater than 300 s.

3.3. Effect of Width, Number, and Location of Exits on Evacuation Time

Evacuation time is significantly affected by the parameters of the exits, such as their width and number. This aspect was studied in an enclosed space with an area of 600 m2, in which agents were successively placed from a density of 1.5 pers/m2 to 5.5 pers/m2, in Figure 6. Steering mode 2 was set to simulate the movement of agents because it provides better visualisation of 3D results than SFPE mode 1, especially the visualisation of the formation of queues at the door.
Figure 6 shows that larger exits allow faster evacuation and reduce overall evacuation time. However, if several narrower exits are used while maintaining the same overall width as one wider exit, the evacuation time will be longer. On the basis of these facts, it is evident that the flow of agents through doors is analogous to the discharge coefficients for fluid flow through a throat. It is important to note that, in practice, it is not possible to design for only one exit from an enclosed space. From the point of view of ensuring the safety of people, it is advisable to design multiple escape directions (multiple exits), as any of the exits can be blocked. As can be seen from the curves in Figure 6, the location of the exits does not have a significant effect on the evacuation of people.
The dependence of the evacuation time on the width and number of exits is also shown in Figure 4. Shorter evacuation times from an enclosed space are observed in Figure 4 when this space leads to three exits with a width of 2.0 m (Figure 4c) or four exits with a width of 1.5 m (Figure 4e). In contrast, the longest evacuation time is recorded when three exits with a width of 1.0 m lead out of the enclosed space (Figure 4b).

4. Discussion

This paper investigated the possibilities of using an agent-based evacuation model to analyse the formation of queues at the exits of enclosed spaces and the evacuation process of people. The aim was to investigate differences in the simulation of the movement of people according to the different modes of the Pathfinder evacuation model. The study also investigated how the density of people in the crowd affects the safe movement of people and how the width, number, and location of exits from the enclosed space affect the evacuation time.
The evacuation time curves in Figure 4, Figure 5 and Figure 6 show the evacuation of agents from the enclosed space. It can be seen from Figure 4 and Figure 5 that the change in the mode of simulation of the movement of agents influenced the evacuation time. The longest evacuation time was observed when the mode settings were SFPE mode 1 and Steering mode 2. Furthermore, it can be seen from Figure 6 that the width and number of exits affect the total evacuation time, while the location of the exits does not have a significant effect on the evacuation time.
Visualisation of 3D results is a practical tool for monitoring and verifying agent behaviour in the model. Visualisations of the 3D results with evacuation time curves provide valuable information to assist in the design of compliant and safe exit routes, particularly exits from enclosed spaces. In Figure 7 and Figure 8, only the situations for SFPE mode 1 and Steering mode 2 are shown (SFPE mode 2 and Steering mode 1 have very similar visual representations of the 3D results).
When we set SFPE mode 1 (in Figure 7a), the agents take the shortest path to the exits and are divided into groups in a few tens of seconds. The highest density of agents (more than 5.38 pers/m2 − level F) is by individual exits, with the density decreasing with distance to below 1.0 pers/m2 (level A). Queues form at the exits, with several agents overlapping each other (in Figure 7c). At the interface at these exits, only a few agents are visible; in fact, there are several hundred agents in this enclosed space.
When we set Steering mode 2 (in Figure 7b), the agents move along the fastest route to the exits of the enclosed space, considering the other agents. The visual division into groups occurs later than in SFPE mode 1, and semicircles are formed around the exit (in Figure 7d), which are maintained until the end of the evacuation. Higher agent densities (above 3.6 pers/m2) appear randomly in the formed semicircle.
Figure 8 shows more detailed views of queue formation by exits in SFPE mode 1 (in Figure 8a) and in Steering mode 2 (in Figure 8b). As can be seen, in SFPE mode 1, the agents push each other, no minimum distance is observed between them, and the agents even overlap each other. In Steering mode 2, the agents are arranged in a semicircle, maintaining a certain distance between them, and gradually leaving the enclosed space.
The evacuation time is shown for each mode and density in Figure 4. For SFPE mode 1 (Figure 8a), the evacuation time, depending on the density of agents, ranged from 194.03 s (with a density of 1.5 pers/m2) to 901.53 s (with a density of 5.5 pers/m2). For Steering mode 2 (Figure 8b), the evacuation time ranged from 211.53 s (with a density of 1.5 pers/m2) to 762.28 s (with a density of 5.5 pers/m2).

5. Conclusions

This paper investigates the possibilities of using an agent-based evacuation model to analyse the formation of queues at the exits of enclosed spaces and the evacuation process of people. The aim was mainly to highlight the differences in the simulation of the movement of people according to the different modes of the Pathfinder evacuation model. The study investigated how the density of people in a crowd affects the safe movement of people and how the width, number, and location of exits affect the evacuation time. In the evacuation model, an enclosed space of 20 m × 30 m was examined, in which the density of people was successively placed, ranging from 1.5 pers/m2 to 5.5 pers/m2. All agents (people) had default agent parameters and behaviours set in all simulation processes.
From a safety perspective, SFPE mode 1 (‘Use a Calculated Specific Flow’) and Steering mode 2 (‘Collision Handling’ and ‘Limit Door Flow Rate’) appear to be appropriate. Both modes result in longer evacuation times than SFPE mode 2 (‘Always Use Max Specific Flow’) and Steering mode 1 (only ‘Collision Handling’). The longer evacuation time determined by SFPE mode 1 and Steering mode 2 may be an important parameter in practice in the design of fire protection systems for enclosed spaces that are installed to ensure the safety of people. Regarding the visual representation of 3D results, Steering mode 2 seems to be the more acceptable of the above modes because there is no overlapping of people. However, it needs to be noted that neither representation of the 3D results in the above modes corresponds to the situation that would occur in the real world.
Both the width and the number of exits affect the evacuation time, while the location of the exits does not have a significant effect on the evacuation of people. In practice, it is advisable to place more exits with greater width in enclosed spaces to ensure greater flow of people through the doors. With a larger exit width, throughput is better than using more exits with a smaller width. This is an analogy to the discharge coefficients for fluid flow through a throat. In addition, it is important to note that in practice it is not possible to design only one exit from an enclosed space. From the point of view of ensuring the safety of people, it is advisable to design multiple escape directions (multiple exits), as any of the exits can be blocked. This measure can prevent an adverse situation that could arise when evacuating a large number of people from an enclosed space.
This study aimed only to investigate differences in the simulated movement of people according to the different modes of the Pathfinder evacuation model. This is a simplified study. In all simulations, the default parameter settings of each agent were considered. No changes were made to the speed of movement or decision parameters that would affect the evacuation process. People with disabilities were not included in the individual simulations. Iterations were not considered in individual simulation processes. The issue of iterations and sensitivity analysis was the subject of a previous study [44]. To achieve relevant results, it would be advisable to carry out iterations and include people with disabilities in the simulations and make further adjustments (changes in speed of movement and decision process settings). This could be the subject of further study.

Author Contributions

Conceptualisation, A.S. and P.K.; methodology, A.S. and P.K.; software, A.S. and P.K.; validation, A.S. and P.K.; formal analysis, A.S. and P.K.; investigation, A.S. and P.K.; resources, A.S.; data curation, A.S.; writing—original draft preparation, A.S.; writing—review and editing, A.S. and P.K.; visualisation, A.S.; supervision, P.K.; project administration, P.K.; funding acquisition, P.K. All authors have read and agreed to the published version of the manuscript.

Funding

This article has been produced with the financial support of the European Union under the REFRESH—Research Excellence for REgion Sustainability and High-tech Industries project number CZ.10.03.01/00/22_003/0000048 via the Operational Programme Just Transition.

Data Availability Statement

Data are contained within the article.

Conflicts of Interest

The authors declare no conflicts of interest.

References

  1. Kuligowski, E. Evacuation decision-making and behavior in wildfires: Past research, current challenges and a future research agenda. Fire Saf. J. 2021, 20, 103129. [Google Scholar] [CrossRef]
  2. Shan, S.; Guo, X.; Wei, Z.; Sun, W.; Zheng, H.; Pan, H.; Lin, J. Simulation analysis of evacuation processes in a subway station based on multi-disaster coupling scenarios. Int. J. Disaster Risk Reduct. 2023, 96, 103998. [Google Scholar] [CrossRef]
  3. Ronchi, E.; Nilsson, D. Fire evacuation in high-rise buildings: A review of human behaviour and modelling research. Fire Sci. Rev. 2013, 2, 7. [Google Scholar] [CrossRef]
  4. Ternero, R.; Sepúlveda, J.; Alfaro, M.; Fuertes, G.; Vargas, M.; Sepúlveda-Rojas, J.P.; Soto-Jancidakis, L. Analysis of Pedestrian Behavior for the Optimization of Evacuation Plans in Tall Buildings: Case Study Santiago, Chile. Buildings 2023, 13, 2907. [Google Scholar] [CrossRef]
  5. Li, W.; Zhu, J.; Li, H.; Wu, Q.; Zhang, L. A Game Theory Based on Monte Carlo Analysis for Optimizing Evacuation Routing in Complex Scenes. Math. Probl. Eng. 2015, 2015, 292093. [Google Scholar] [CrossRef]
  6. Helbing, D.; Farkas, I.; Vicsek, T. Simulating dynamical features of escape panic. Nature 2000, 407, 487–490. [Google Scholar] [CrossRef] [PubMed]
  7. Fang, Z.; Song, W.; Wu, H. A Multi-Grid Model for Evacuation Coupling With the Effects of Fire Products. In Pedestrian and Evacuation Dynamics; Peacock, R., Kuligowski, E., Averill, J., Eds.; Springer: Boston, MA, USA, 2011; pp. 349–359. [Google Scholar] [CrossRef]
  8. Lovreglio, R.; Ronchi, E.; Nilsson, D. An Evacuation Decision Model based on perceived risk, social influence and behavioural uncertainty. Simul. Model. Pract. Theory 2016, 66, 226–242. [Google Scholar] [CrossRef]
  9. Kasereka, S.; Kasoro, N.; Kyamakya, K.; Goufo, E.F.D.; Chikki, A.P.; Yengo, M.V. Agent-Based Modelling and Simulation for evacuation of people from a building in case of fire. Procedia Comput. Sci. 2018, 130, 10–17. [Google Scholar] [CrossRef]
  10. Li, X.; Chen, R.; Zhu, Y.; Jim, C.Y. Emergency fire evacuation simulation of underground commercial street. Simul. Model. Pract. Theory 2024, 134, 102929. [Google Scholar] [CrossRef]
  11. Haghani, M.; Sarvi, M. Following the crowd or avoiding it? Empirical investigation of imitative behaviour in emergency escape of human crowds. Anim. Behav. 2017, 124, 47–56. [Google Scholar] [CrossRef]
  12. Moussaïd, M.; Perozo, N.; Garnier, S.; Helbing, D.; Theraulaz, G. The Walking Behaviour of Pedestrian Social Groups and Its Impact on Crowd Dynamics. PLoS ONE 2010, 5, e10047. [Google Scholar] [CrossRef] [PubMed]
  13. Nilsson, D.; Johansson, A. Social influence during the initial phase of a fire evacuation—Analysis of evacuation experiments in a cinema theatre. Fire Saf. J. 2009, 44, 71–79. [Google Scholar] [CrossRef]
  14. Lovreglio, R.; Fonzone, A.; dell’Olio, L.; Borri, D.; Ibeas, A. The Role of Herding Behaviour in Exit Choice during Evacuation. Procedia-Soc. Behav. Sci. 2014, 160, 390–399. [Google Scholar] [CrossRef]
  15. Helbing, D.; Johansson, A. Pedestrian, Crowd and Evacuation Dynamics. In Encyclopedia of Complexity and Systems Science; Meyers, R., Ed.; Springer: New York, NY, USA, 2009; pp. 6476–6495. [Google Scholar] [CrossRef]
  16. Heliövaara, S.; Kuusinen, J.M.; Rinne, T.; Korhonen, T.; Ehtamo, H. Pedestrian behavior and exit selection in evacuation of a corridor—An experimental study. Saf. Sci. 2012, 50, 221–227. [Google Scholar] [CrossRef]
  17. Gwynne, S.; Galea, E.R.; Owen, M.; Lawrence, P.J.; Filippidis, L. A review of the methodologies used in the computer simulation of evacuation from the built environment. Build. Environ. 1999, 34, 741–749. [Google Scholar] [CrossRef]
  18. Kuligowski, E.D. Computer Evacuation Models for Buildings. In SFPE Handbook of Fire Protection Engineering, 5th ed.; Hurley, M.J., Ed.; Springer: New York, NY, USA, 2016; p. 3493. [Google Scholar]
  19. Lovreglio, R.; Ronchi, E.; Kinsey, M.J. An Online Survey of Pedestrian Evacuation Model Usage and Users. Fire Technol. 2020, 56, 1133–1153. [Google Scholar] [CrossRef]
  20. Kholshchevnikov, V.V.; Samoshin, D.A.; Parfyonenko, A.P.; Belosokhov, I.P. Study of children evacuation from pre-school education institutions. Fire Mater. 2012, 36, 349–366. [Google Scholar] [CrossRef]
  21. Capote, J.; Alvear, D.; Abreu, O.; Cuesta, A.; Alonso, V. A Stochastic Approach for Simulating Human Behaviour During Evacuation Process in Passenger Trains. Fire Technol. 2012, 48, 911–925. [Google Scholar] [CrossRef]
  22. Ronchi, E. Evacuation Modelling in Road Tunnel Fires. Ph.D. Thesis, Department of Roads and Transportation, Faculty of Engineering, Polytechnic University of Bari, Bari, Italy, 2012. Available online: https://lucris.lub.lu.se/ws/portalfiles/portal/5519346/4001478.pdf (accessed on 13 June 2024).
  23. Bonabeau, E. Agent-based modeling: Methods and techniques for simulating human systems. Proc. Natl. Acad. Sci. USA 2002, 99, 7280–7287. [Google Scholar] [CrossRef]
  24. Helbing, D.; Molnár, P. Social force model for pedestrian dynamics. Phys. Rev. E 1995, 51, 4282. [Google Scholar] [CrossRef]
  25. Kirchner, A.; Schadschneider, A. Simulation of evacuation processes using a bionics-inspired cellular automaton model for pedestrian dynamics. Phys. A Stat. Mech. Its Appl. 2002, 312, 260–276. [Google Scholar] [CrossRef]
  26. Schadschneider, A.; Klingsch, W.; Klüpfel, H.; Kretz, T.; Rogsch, C.; Seyfried, A. Evacuation dynamics: Empirical results, modeling and applications. In Encyclopedia of Complexity and Systems Science; Meyers, R., Ed.; Springer: New York, NY, USA, 2009; pp. 3142–3176. [Google Scholar] [CrossRef]
  27. Zhang, J.; Klingsch, W.; Schadschneider, A.; Seyfried, A. Transitions in pedestrian fundamental diagrams of straight corridors and T-junctions. J. Stat. Mech. Theory Exp. 2011, 2011, P06004. [Google Scholar] [CrossRef]
  28. Twarogowska, M.; Goatin, P.; Duvigneau, R. Comparative Study of Macroscopic Pedestrian Models. Transp. Res. Procedia 2014, 2, 477–485. [Google Scholar] [CrossRef]
  29. Hughes, R.L. A continuum theory for the flow of pedestrians. Transp. Res. Part B Methodol. 2002, 36, 507–535. [Google Scholar] [CrossRef]
  30. Epstein, J.M. Agent-based computational models and generative social science. Complexity 1999, 4, 41–60. [Google Scholar] [CrossRef]
  31. Fruin, J.J.; Strakosch, G.R. Pedestrian Planning and Design; Elevator World, Inc.: Mobile, AL, USA, 1987. [Google Scholar]
  32. Wachs, M.; Samuels, J.M.; Skinner, R.E. Highway Capacity Manual; Transportation Research Board: Washington, DC, USA, 2000. [Google Scholar]
  33. Brillon, W. Handbuch für die Bemessung von Straßenverkehrsanlagen; Forschungsgesellschaft für Straßen-und Verkehrswesen: Cologne, Germany, 2009. [Google Scholar]
  34. Pathfinder|Thunderhead Engineering. Available online: https://www.thunderheadeng.com/ (accessed on 13 June 2024).
  35. Ahmed, S.; Mehmood, S.; Kristensen, A.S. Critical Analysis of Computer-based Evacuation Simulation of an Education Institution. In Proceedings of the 11th International Conference on Computer Modeling and Simulation (ICCMS), North Rockhampton, QLD, Australia, 16–19 January 2019; pp. 26–30. [Google Scholar] [CrossRef]
  36. Li, M.X.; Zhu, S.B.; Wang, J.H.; Zhou, Z. Research on Fire Safety Evacuation in a University Library in Nanjing. Procedia Eng. 2018, 211, 372–378. [Google Scholar] [CrossRef]
  37. Society of Fire Protection Engineers. SFPE Engineering Guide: Human Behavior in Fire, 2nd ed.; Springer: Cham, Switzerland, 2018; p. 159. [Google Scholar] [CrossRef]
  38. Gwynne, S.M.V.; Rosenbaum, E.R. Employing the Hydraulic Model in Assessing Emergency Movement. In SFPE Handbook of Fire Protection Engineering, 5th ed.; Hurley, M.J., Ed.; Springer: New York, NY, USA, 2016; p. 3493. [Google Scholar] [CrossRef]
  39. Ronchi, E. Testing the predistice capabilities of evacuation models for tunnel fire safety analysis. Saf. Sci. 2013, 59, 141–153. [Google Scholar] [CrossRef]
  40. Mehmood, S.; Ahmed, S.; Kristensen, A.S. Application of Integrates Model of Evacuation Pschology in an Agent-based Simulation. In Proceedings of the 11th International Conference on Computer Modeling and Simulation (ICCMS), North Rockhampton, QLD, Australia, 16–19 January 2019; pp. 70–74. [Google Scholar] [CrossRef]
  41. Reynolds, C.W. Steering Behaviors for Autonomous Characters; Sony Computer Entertainment America: Foster City, CA, USA, 1999. [Google Scholar]
  42. Amor, H.B.; Obst, O.; Murray, J. Fast, Neat and under Control: Inverse Steering Behaviors for Physical Autonomous Agents; Institute for Computer Science, University of Koblenz: Koblenz, Germany, 2003. [Google Scholar]
  43. Still, G.K. Introduction to Crowd Science; CRC Press: Boca Raton, FL, USA, 2014. [Google Scholar]
  44. Snohová, A.; Kučera, P.; Pokorny, J.; Bernatik, A. Monte Carlo Analysis for Evacuation in Multipurpose Event Spaces. Fire 2024, 7, 178. [Google Scholar] [CrossRef]
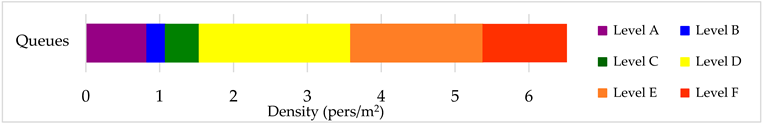
Figure 1. Average longitudinal and lateral spacing of pedestrians in a traffic stream [34].
Buildings 14 02361 g001
Figure 2. Enclosed space with an area of 600 m2 with three exits with a width of 1.5 m.
Buildings 14 02361 g002
Figure 3. Enclosed space with an area of 600 m2: (a) two exits of 2.0 m width on the opposite side; (b) two exits of 2.0 m width on one side; (c) four exits of 1.0 m width, each on one side of the space; (d) two exits of 1.0 m width on one side and two exits of 1.0 m width on the opposite side; (e) four exits of 1.0 m width on one side.
Buildings 14 02361 g003
Figure 4. Dependence of the evacuation time on the density of agents for different modes of the Pathfinder evacuation model: (a) an enclosed space with three exits with a width of 1.5 m; (b) an enclosed space with three exits with a width of 1.0 m; (c) an enclosed space with three exits with a width of 2.0 m; (d) an enclosed space with two exits with a width of 1.5 m; (e) an enclosed space with four exits with a width of 1.5 m.
Buildings 14 02361 g004aBuildings 14 02361 g004b
Figure 5. Dependence of the evacuation time on the density of agents for two selected modes of the Pathfinder evacuation model: (a) an enclosed space with an area of 100 m2 with three exits with a width of 1.5 m; (b) an enclosed space with an area of 1600 m2 with three exits with a width of 1.5 m.
Buildings 14 02361 g005
Figure 6. Dependence of evacuation time on the density of agents for Steering mode 2 of the Pathfinder evacuation model and the effect of the width, number, and location of exits on evacuation time. Blue solid curve—one exit of 4.0 m width; orange solid curve—two exits of 2.0 m width on the opposite side; blue dashed curve—two exits of 2.0 m width on one side; grey solid curve—three exits of 1.5 m width on different sides; yellow solid curve—four exits of 1.0 m width on different sides; red dashed curve—two exits of 1.0 m width on one side and two exits of 1.0 m width on the opposite side; green dashed curve—four exits of 1.0 m width on one side.
Buildings 14 02361 g006
Figure 7. The course of evacuation and the formation of queues at exits: (a) SFPE mode 1, time 30 s; (b) Steering mode 2, time 30 s; (c) SFPE mode 1, time 300 s; (d) Steering mode 2, time 300 s. Note: the Level of Service method shows the different levels of quality of movement and is evaluated based on the density of people (in Section 2.1.3).
Buildings 14 02361 g007
Figure 8. Situation at the exit of the enclosed space: (a) SFPE mode 1, time 30 s; (b) Steering mode 2, time 250 s.
Buildings 14 02361 g008
Table 1. Level of Service (LoS) according to Fruin (pers/m2) [31].
LevelsQueues (pers/m2)Qualitative Description of the Levels
minmax
A0.00.828Very comfortable walking, with plenty of space to overtake.
B0.8281.076Comfortable walking, moderate traffic, occasionally slowing down.
C1.0761.538Slightly uncomfortable walking, heavy traffic, need to avoid people.
D1.5383.588Uncomfortable walking, crowded, difficult to overtake.
E3.5885.382Very uncomfortable walking, crowds, need to push through.
F5.382Unbearable walking, chaos, impossible to move.
Buildings 14 02361 i001
Disclaimer/Publisher’s Note: The statements, opinions and data contained in all publications are solely those of the individual author(s) and contributor(s) and not of MDPI and/or the editor(s). MDPI and/or the editor(s) disclaim responsibility for any injury to people or property resulting from any ideas, methods, instructions or products referred to in the content.

