Article

Wind Tunnel Test Research on the Aerodynamic Behavior of Concrete-Filled Double-Skin Steel (CFDST) Wind Turbine Towers

1
College of Civil Engineering, Fuzhou University, Fuzhou 350116, China
2
Key Laboratory of Fluid and Power Machinery (Xihua University), Ministry of Education, Chengdu 610039, China
3
Faculty of Construction and Environment, The Hong Kong Polytechnic University, Hong Kong 999077, China
*
Author to whom correspondence should be addressed.
Buildings 2024, 14(8), 2372; https://doi.org/10.3390/buildings14082372
Submission received: 8 July 2024 / Revised: 29 July 2024 / Accepted: 30 July 2024 / Published: 1 August 2024

Abstract

:
To explore the potential application of concrete-filled double-skin steel tubular (CFDST) structures in wind turbine towers, this study carried out wind tunnel tests to explore the aerodynamic behavior of CFDST tower-based wind turbine systems. Two scaled models including traditional steel tower-based and CFDST tower-based wind turbine systems were designed and tested in the field of typhoons. Then, the vibration characteristics in both the downwind and crosswind directions were systematically investigated, in terms of acceleration and displacement response, motion trajectory, dynamic characteristics, etc. The findings demonstrate that CFDST structures can have significantly improved performance against both blade harmonic excitation and external environmental excitation. Compared to traditional steel towers, CFDST towers exhibit a substantial reduction in aerodynamic response. In particular, the reduction in the RMS value can be over five times in the resonance case and 457.69% in the non-resonance case. The CFDST towers predominantly exhibited converged motion trajectory and concentrated on lower vibration modes. The energy dissipation capability was remarkably enhanced, with the damping ratio increasing up to 40.98%. Overall, it was experimentally demonstrated that CFDST towers can efficiently address the dynamic problems of large-scale wind turbine towers in engineering.

1. Introduction

Among various types of energy, wind energy has been developed globally due to its renewable and eco-friendly features. With the advancement in the wind industry, the dimensions of wind turbine towers are progressively expanding to over 100 m in height. For instance, the world’s largest wind turbine case, with a wind turbine capacity of 16 multi-megawatts and a tower structure of 154 m in height, was established in Fujian, China, in 2023. For the highly flexible and slender tower, wind-induced vibration can lead to a series of dynamic problems, including fatigue crack and failure, aero-instability and plastic buckling, and even overall collapse [1]. It is indicated that structural failure is the third most frequent cause of catastrophic wind turbine accidents, accounting for 9.7% among various types of incidents (after blade failure and fire accidents) [2]. Additionally, the adverse vibration of wind turbine towers may result in lower efficiency and power generation. Thus, the aerodynamic behavior of wind turbine towers should be investigated deeply to identify dynamic characteristics and ensure structural safety.
Over the last few decades, scholars worldwide have conducted extensive research to make steel wind turbine towers more efficient and resilient. Wang et al. [3] established a mixed flexible–rigid theoretical model of horizontal axis wind turbines and accurately predicted the dynamic responses of both steel towers and rotors. Wei et al. [4] conducted tests under combined compression–bending–torsion loads, revealing failure modes, load–displacement relationships, ultimate strengths, and deformation characteristics. Lee et al. [5] proposed a practical buckling assessment method for a time-domain structural analysis based on response analysis and pseudo-spectrum stress synthesis. Then, they applied this method to evaluate the buckling and ultimate strength of a 15 MW floating offshore wind turbine (FOWT) platform. Abhinav and Saha [6] evaluated the stochastic dynamic response of a 5 MW offshore fixed-based wind turbine under three types of soil conditions. The results indicated that the dynamic response primarily depends on the stiffness of the soli. Bottasso et al. [7] proposed an integrated aero-structural optimization method for wind turbines, which determines structural and aerodynamic design characteristics to achieve the lowest energy cost for a given wind turbine configuration. Jin et al. [8] introduced a new control method that simultaneously considers both fatigue load and wind turbine (WT) output power, in order to enlarge the service lifespan of wind turbines.
However, with the prevalent application of steel tower structures in engineering, some issues such as insufficient stiffness, corrosion damage, fatigue cracking, and high maintenance costs have become increasingly apparent [9]. It is demonstrated that the traditional steel tower structure is no longer the optimal type to support large-scale multi-megawatt wind turbines. Thus, various types of wind turbine towers have been developed and optimized further. Kim et al. [10] proposed a conceptual model for concrete offshore wind turbines suitable for weak soils and demonstrated its sufficient mechanical performance to withstand external loads. Jennifer et al. [11] studied the behavior of prestressed concrete wind turbine towers with circular cross-sections, addressing the stress concentration issue in the tower structure. More design optimization work on novel wind turbine supporting structures has been performed, such as the optimization of prestressed concrete towers [12], the improvement of segmented concrete towers [13], and the upgrade of conical concrete support structures [14].
To reduce the self-weight of the tower and improve the efficiency of concrete usage, the CFDST wind turbine tower was proposed, featuring a light weight, large bending stiffness, ease of construction, and excellent seismic and fire resistance [15]. A series of comprehensive investigations have been complemented, with topics including the load transfer mechanism [16], axial compression performance [17], eccentric compression performance [18], torsion performance [19,20], shear performance [21], compressive–flexural failure mechanism [22], etc. Additionally, CFDST towers in extreme conditions have been systematically studied, considering aspects such as the long-term, seismic, and impact performance [23,24,25,26,27]. These studies have demonstrated that the CFDST structure can meet the requirement for taller and more flexible towers, full of potential applications in engineering.
Based on the literature review, various types of wind turbine towers have been developed as the size of wind turbines has increased. Among them, the static performance of CFDST towers against various loading conditions has been proven to be excellent and efficient. However, few studies have considered the dynamic behavior of CFDST-based towers to understand the nonlinear vibration characteristics due to the complexity involved. An experimental study that could provide a better schematic for the real behavior of the towers is still lacking. Resultantly, numerical and theoretical models cannot be validated and modified further due to the lack of fundamental data. Furthermore, a wind-resistant design method for CFDST towers has not yet been provided.
To explore the aerodynamic behavior of CFDST wind turbine towers, this study carried out a series of wind tunnel tests with traditional steel wind turbine towers as the comparison group. Two types of scaled wind turbine systems were designed and tested in the field of typhoons. Then, the vibration characteristics in both the downwind and crosswind directions were systematically investigated, in terms of acceleration and displacement response, motion trajectory, dynamic characteristics, etc. The aerodynamic performance of the CFDST tower-based wind turbine system can be identified and demonstrated with many potential applications to support large-scale multi-megawatt wind turbines.

2. Experimental Design and Tests

In the wind tunnel experiments, the NREL5MW OC3 Monopile (National Renewable Energy Laboratory, Oak Ridge, TN, USA) wind turbine tower proposed by the National Renewable Energy Laboratory in the USA was used as a prototype [28]. The scale similarity in tests can be identified based on the principles of geometric similarity, kinematic similarity, and dynamic similarity. Two models including the CFDST and steel tubular towers were designed and tested in a typhoon wind field.

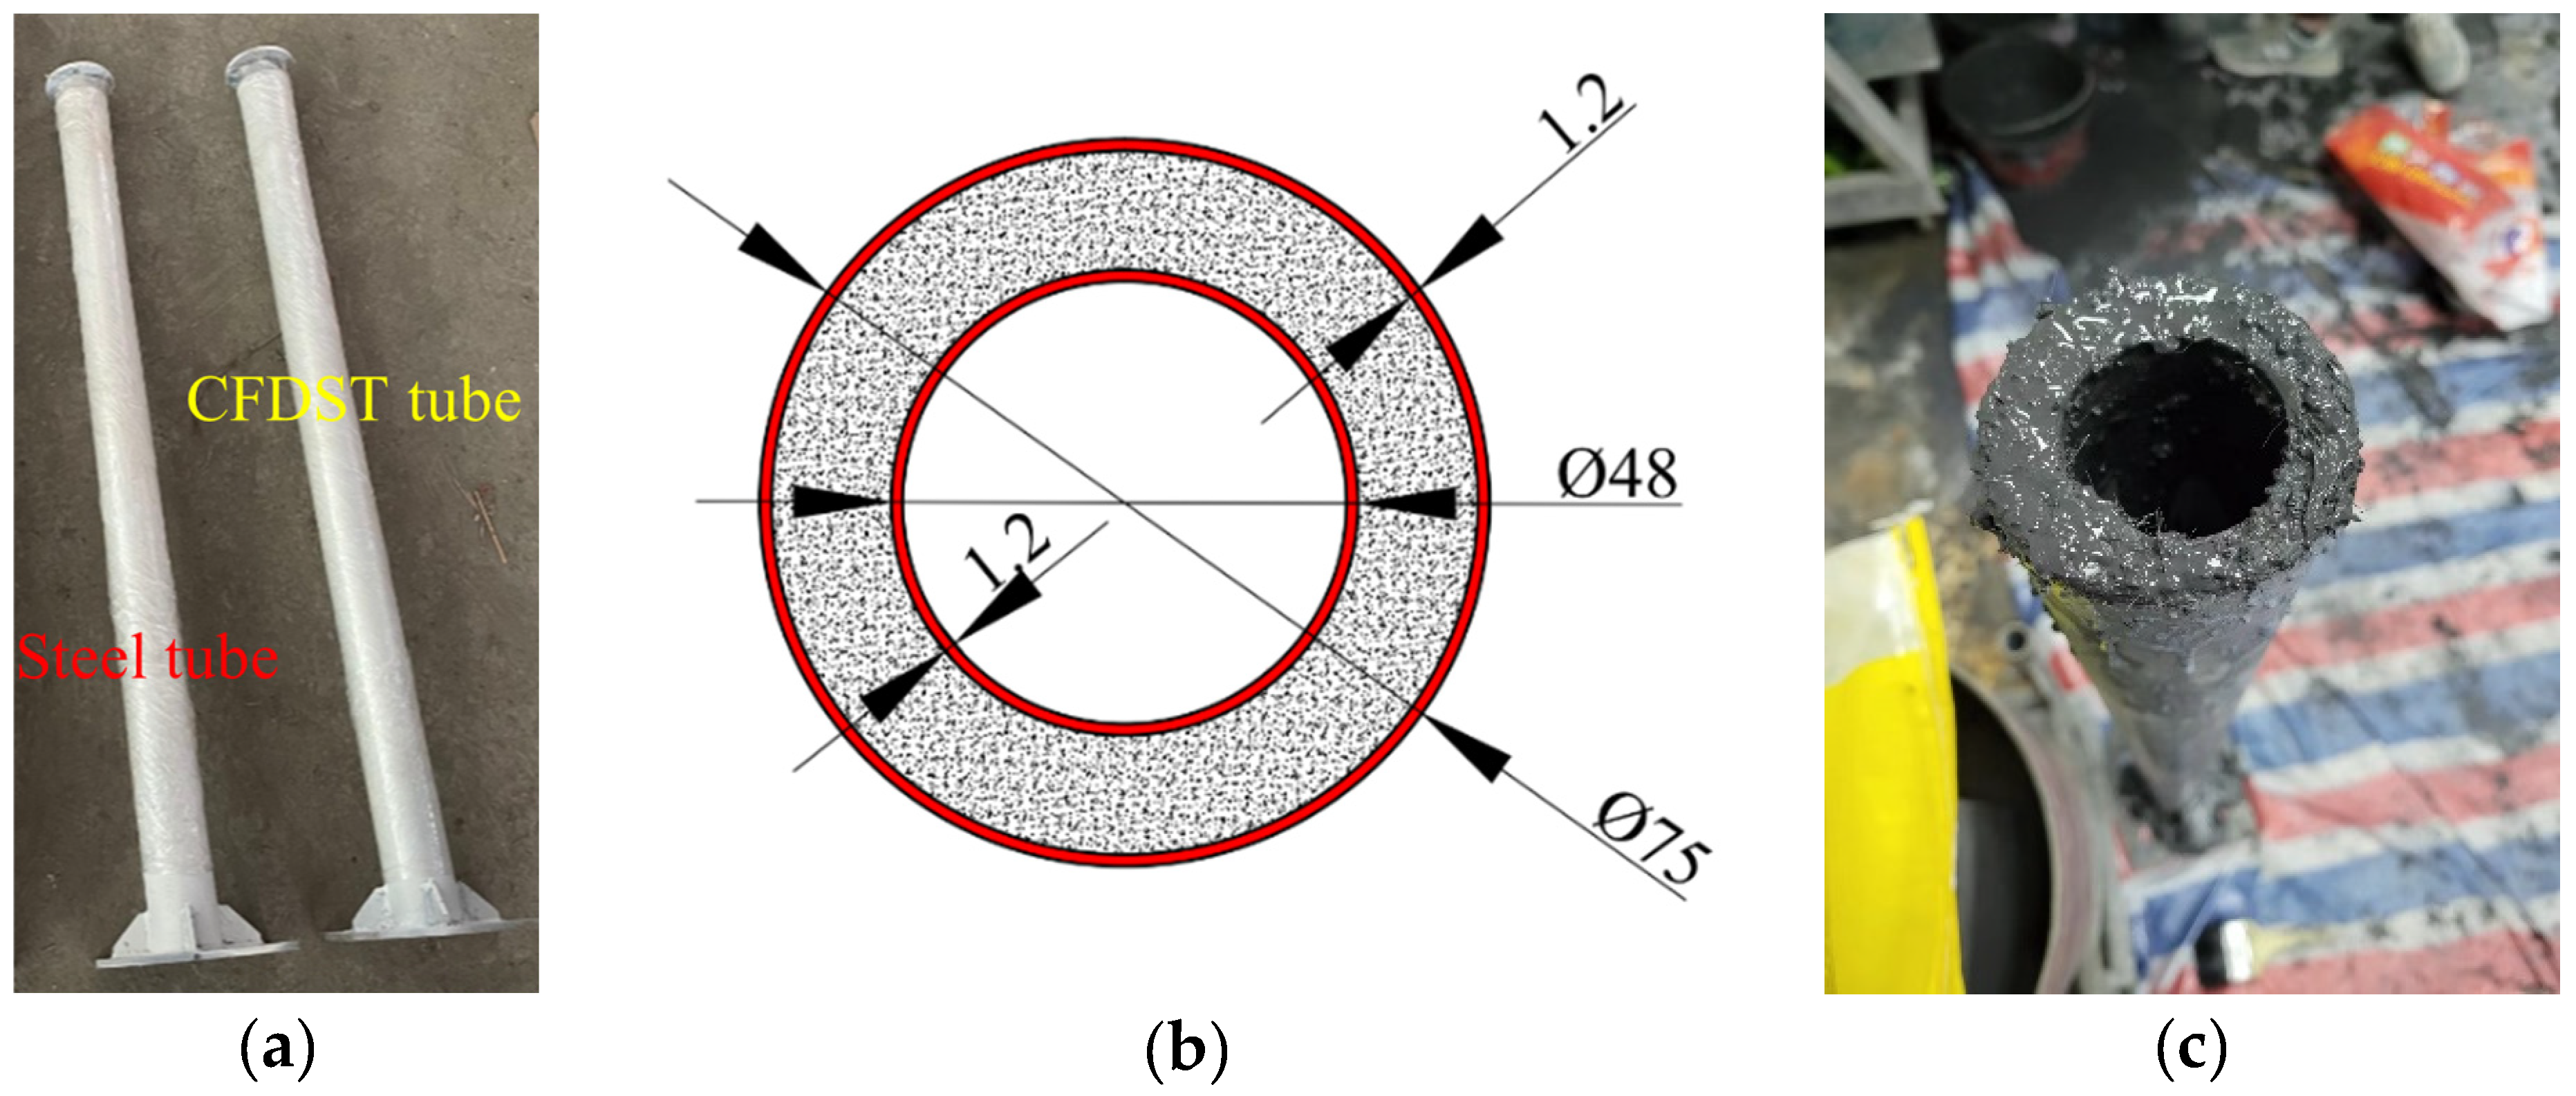
2.1. Experimental Model Design

2.1.1. Similarity Criteria

The relevant performance of the scaled model experiments is significantly influenced by the selected similarity criterion. Since the aerodynamics and wake characteristics of the wind turbine system including the tower and blade components can greatly affect the power generation and dynamic response, some critical similarity should be attached with great importance.
(1)
Geometric Similarity
In geometric similarity, all the lengths between the model and the prototype maintain a constant ratio, and the corresponding angles are equal. The detailed parameters include the tower height, hub height, hub diameter, rotor diameter, etc. The specific geometric similarity is as follows:
λ l = l m / l p
λ A = A m / A p = l m 2 / l p 2 = λ l 2
λ v = V m / V p = l m 3 / l p 3 = λ l 3
where λl is the length similarity ratio, λA is the area similarity ratio, λV is the volume similarity ratio, l is the linear length, A is the area, V is the volume, the subscript m denotes the scaled model, and the subscript p denotes the full-scale prototype.
(2)
Kinematic similarity
In order to keep the lift coefficient of blades matched and the same working condition for the scaled model and prototype, the aerodynamic kinematics of blades should be maintained [29]. As a critical parameter, the tip speed ratio (TSR) cannot be changed when scaling to wind tunnel dimensions as follows:
T S R = Ω m R m u m = Ω p R p u p
where TSR is the tip speed ratio, Ω is the rotor speed, R is the rotor radius, namely blade length, and u is the incoming flow velocity.
(3)
Dynamic Similarity
Dut to the strong fluid–solid interaction between the slender tower and flow, the vibration response of the tower structure is closely associated with the fluid motion. Since the vortex shedding around the tubular wind turbine tower is periodic, the Strouhal number which characterizes periodic unsteady flow needs to be consistent, as follows:
S t = f m D m u m = f p D p u p
where St is the Strouhal number, f is the vortex shedding frequency, and D is the projected width normal to the flow direction, namely the tube diameter herein. The Strouhal number is dependent on the Reynolds number. The Reynolds number for the flow around the wind turbine tower is mostly at the order of 106, and St is selected as 0.2 [30].
For flexible wind turbine towers, the bending stiffness of tower structures has an obvious influence on the vibration of the wind turbine system. Thus, the Cauchy number, which is denoted as the ratio of the solid elastic restoring force to the fluid disturbing force in bending, should be the same, as follows:
C a = ρ m u m 2 E e q , m = ρ p u p 2 E e q , p
where Ca is the Cauchy number, ρ is the material density, and Eeq represents the equivalent elastic modulus. For bending vibration, Eeq = EI/l4, where E is the material elastic modulus, and I is the moment of inertia of the cross-section. For the onshore wind turbine system without the hydraulic problem, the Froude number can be neglected.
Based on the comprehensive analysis mentioned above, the wind tunnel test was designed following some significant similarity criteria. Consequently, the scale factors of the main parameters could be identified, as listed in Table 1. After the evaluation of possible combinations for the scales, a good compromise was found, namely the geometrical similarity factor λl = 1/67 and the wind speed similarity factor λu = 1/2. Once the length and velocity scales were given, the scales of the principal physical quantities could be obtained.

2.1.2. Experimental Design

In the prototype, the hub height of the tapered steel tower is 90 m. The diameter of the tower tube varies with the height, with the largest diameter of 6 m at the bottom and the smallest diameter of 3.87 m at the top. The cut-in wind speed, operated wind speed, and cut-out wind speed are 3 m/s, 11 m/s, and 25 m/s, respectively. The tip speed ratio TSR = 4–6 with the incoming wind speed varying from 3 m/s to 25 m/s. The blade is designed and fabricated based on the B-Splines CAD definition [30]. Table 2 specifies the details of the primary parameters of the wind turbine, and Table 3 lists the details of the two types of tower specimens. Herein, D0 and t0 denote the outer diameter and wall thickness of the outer circular steel tube, respectively, while Di and ti denote the outer diameter and wall thickness of the inner circular steel tube. Resultantly, the hollow ratio χ can be calculated as χ = Di/(D0 − 2t0). The fabricated steel tubular and CFDST towers are shown in Figure 1.

2.1.3. Material Design

Q355 steel is selected for the tower tube specimen. After the tensile testing of steel samples, the mechanical properties can be obtained. The yield strength of Q355 steel is 392 MPa, and its ultimate strength is 531 MPa. The Young’s modulus is 2.06 × 10⁵ MPa, and the elongation is 22%. In order to improve the fatigue performance of the CFDST tower under cyclic load (e.g., wind load), Engineering Cementitious Composites (ECCs) are used rather than traditional concrete. The greatest advantages of ECC material are tensile strain hardening and multiple micro-cracks. Table 4 summarizes the mix proportions of ECCs. According to the results of the material property test, the compressive strength and tensile strength of ECCs are 33.1 MPa and 2.5 MPa, respectively. The elastic modulus and ultimate tensile strain are 1.68 × 10⁵ MPa and 3.25%, respectively.

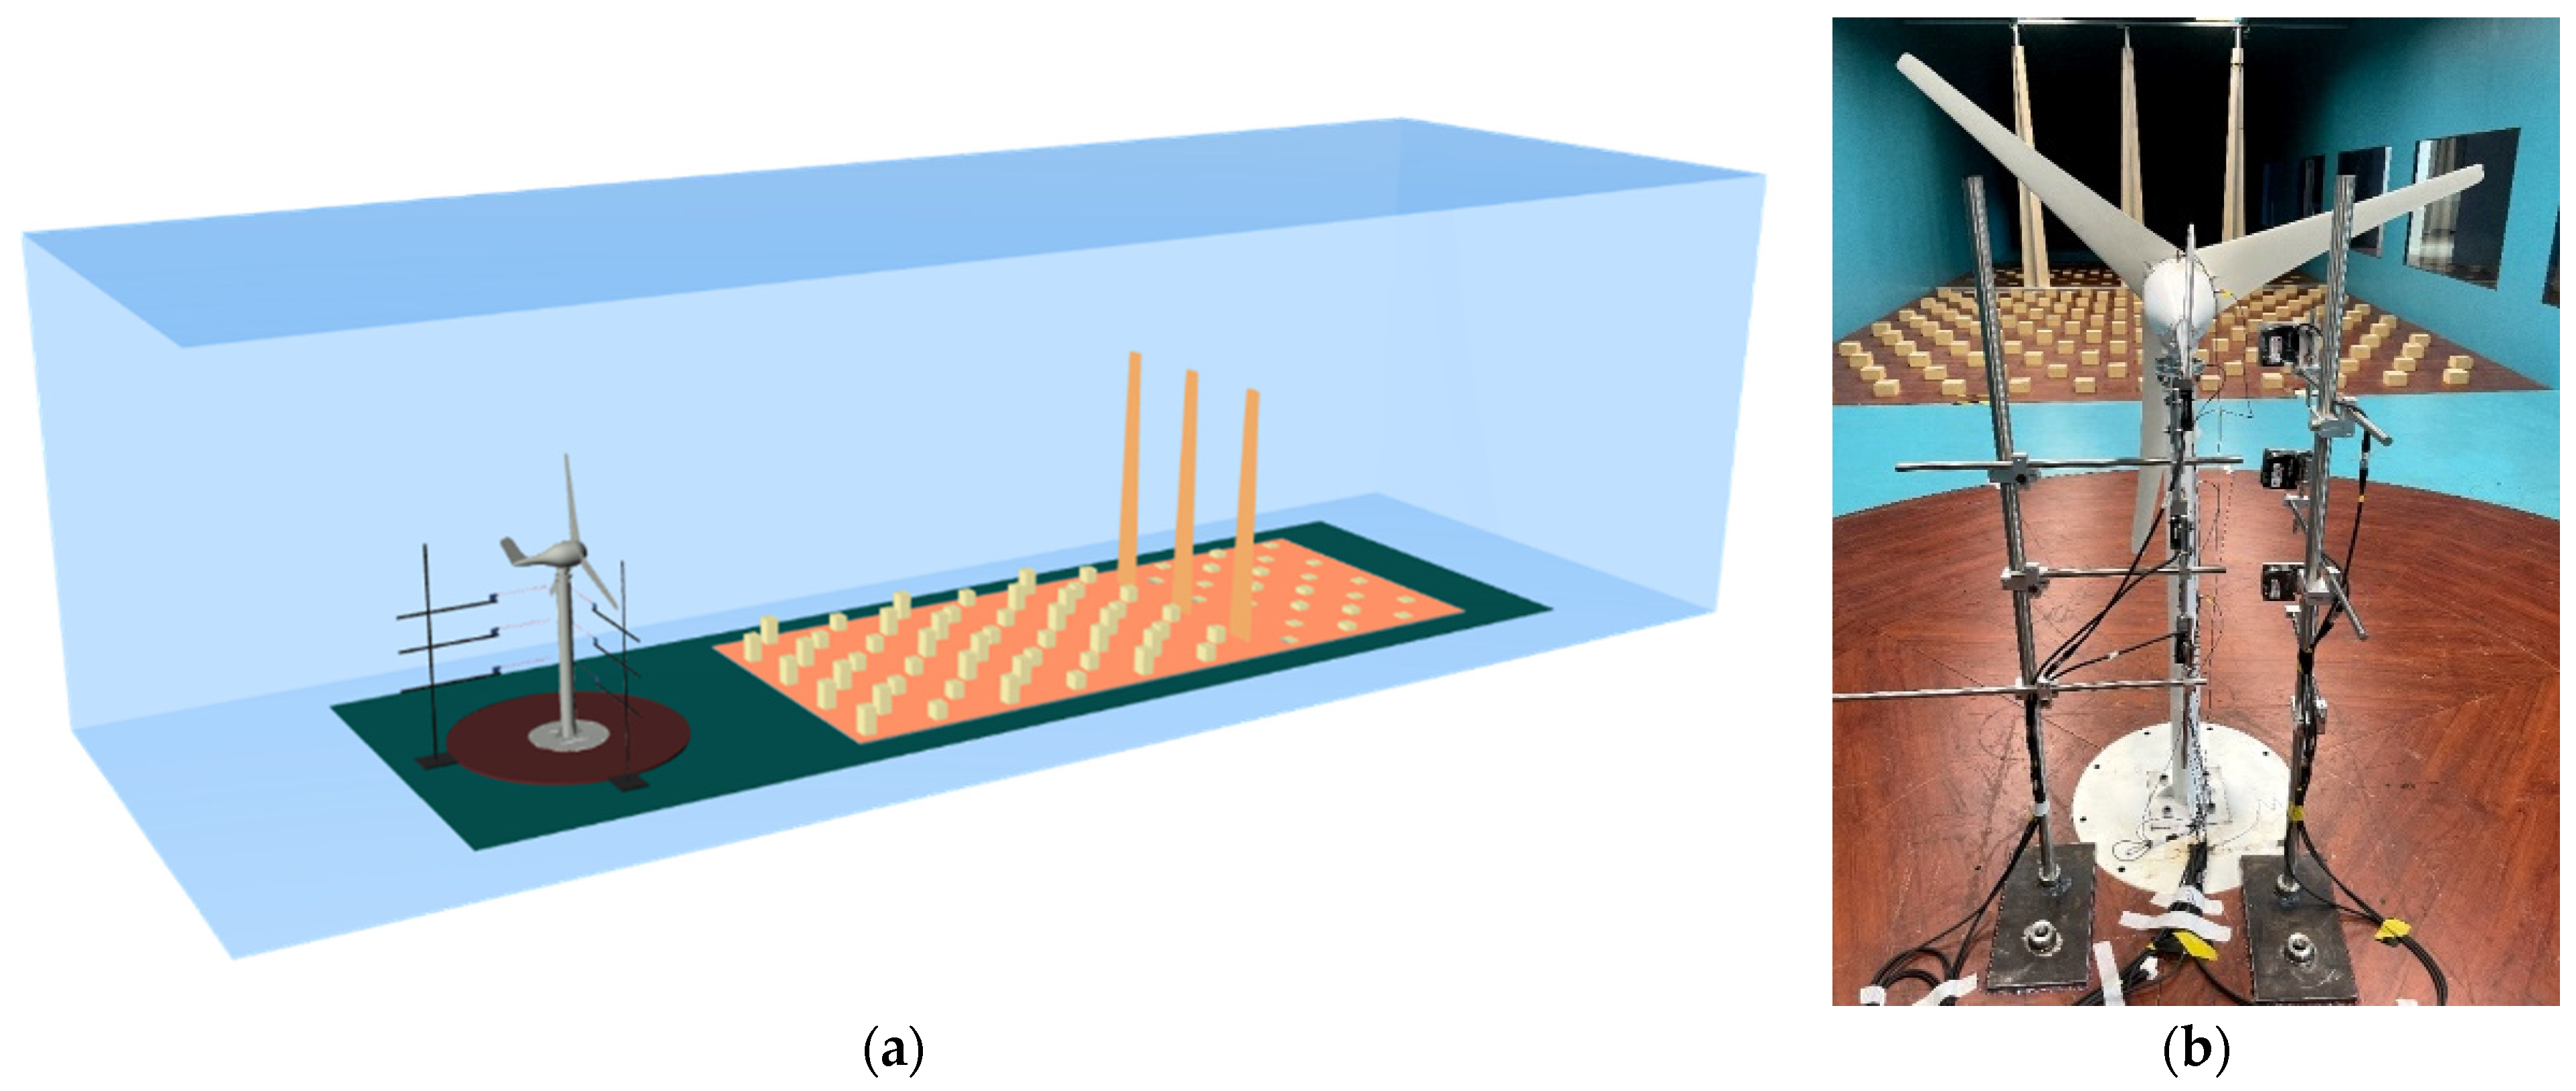
2.2. Experimental Setup and Design

2.2.1. Wind Tunnel Laboratory

The wind tunnel experiment was conducted in the XMUT-WT wind tunnel laboratory in Xiamen University of Technology. The experiment was conducted in the low-speed test section, with the 6 × 3.6 × 25 m test section. The maximum wind speed can reach 25 m/s. The rough elements with the section of 50 mm × 50 mm were controlled by a microcontroller and server system and maneuvered by a motor drive system. The rough elements can be lifted up to 200 mm. Three downwind triangular spires and a large number of rough elements were arranged in the upstream of the test section to generate turbulence. By optimizing their scale and positions, the required atmospheric boundary layer wind speed profile and turbulence profile could be reproduced successfully. Figure 2 shows the layout of triangular spires and roughness elements in the wind tunnel laboratory.

2.2.2. Measurement

In this wind tunnel test, displacement and acceleration are measured by using laser displacement sensors (i.e., LK-G400 (Keyence, Osaka, Japan)) and accelerometers (i.e., LC0408TA (Lance, Qingdao, China)), respectively. The measuring range of laser displacement sensors can reach up to 400 mm, and their sampling frequency is 2 kHz. The weight of the accelerometers is 2.8 mg. Their measuring range and sampling frequency are 2 × 10⁴ g and 1.8 kHz, respectively. The laser displacement sensors and accelerometers are uniformly distributed at different heights, namely H/2, 3H/4, and H. In total, six measurement points are arranged in two orthogonal directions, as illustrated in Figure 3. It should be noted that the measuring points of the displacement response are signed as Point A–Point F, and the measuring points of the acceleration response are signed as Point P1–Point P6.

2.2.3. Typhoon Field

The empirical power law is used in Load Code for The Design of Building Structures (GB 50009-2012) in China to specify wind speed profiles and turbulence profiles [31]. The formulas describing the wind speed profile and turbulence profile are expressed as follows:
U U r = z z r α
I u I r = z z r d
where U is the wind speed at height z, Ur is the wind speed at reference height zr, α is the power law coefficient affecting the wind speed profile shape, Iu is the turbulence intensity at height z, Ir is the turbulence intensity at reference height zr, and d is the power law coefficient affecting the turbulence intensity profile shape.
For wind turbines typically erected in coastal areas, the Chinese code (GB 50009-2012) recommends the coefficients α = 0.12 and d = −0.12 for coastal terrains. However, under typhoon cases, coefficients α and d should be adjusted accordingly, with the consideration of their more complex vortex structures. In this study, the modified coefficients α = 0.19 and d = −0.23 are selected for typhoons based on the previous investigation [32]. Figure 4 compares the wind speed and turbulence intensity profiles simulated in the wind tunnel with theoretical values. It can be obviously found that the typhoon field in wind tunnel tests is matched with the desired type. In this study, the reference height zr is the wind turbine hub height (i.e., zr = 1.3 m), and the turbulence intensity Iu is 15.9% at this reference height.

2.2.4. Test Cases

The wind turbine generally operates between the cut-in wind speed and cut-out wind speed, namely ranging from 3 m/s to 25 m/s. The scale of wind speed is selected as 1/2. Then, the wind speed in wind tunnel tests is set within the range of 4–9 m/s, corresponding to the 8–18 m/s in engineering. To deeply reveal the mechanism of the vortex-induced vibration of the wind turbine system, six levels of wind speeds are designed, with the wind speed linearly increasing by 1 m/s. The wind turbine system is under both wind-induced excitation and blade rotational harmonic excitation (i.e., 1P and 3P loading). Thus, 1P loading is caused by the rotor’s mass and aerodynamic asymmetries, with its forcing frequency equaling the rotor’s rotational frequency. Then, 3P loading is caused by the blade shadowing effect, which is three times the frequency of 1P. In total, both steel tower-based and CFDST tower-based wind turbine systems are tested in the typhoon field, with six levels of wind speeds. Table 5 lists all the loading conditions, including the tower type, wind speed, rotor speed, and Reynolds number. It should be noted that the diameter of the tube is selected as the characteristic length (i.e., 0.075 m) for calculating the Reynolds number.

3. Results and Discussion

The signals of acceleration and displacement responses at different measuring points can be obtained and further analyzed. The acceleration and displacement can be identified in statistics. The convergence of the vibration response can be evaluated based on the trajectory of displacement and phase. The dynamic characteristics including frequency and damping ratios would be further extracted to reveal the energy dissipation capacity.

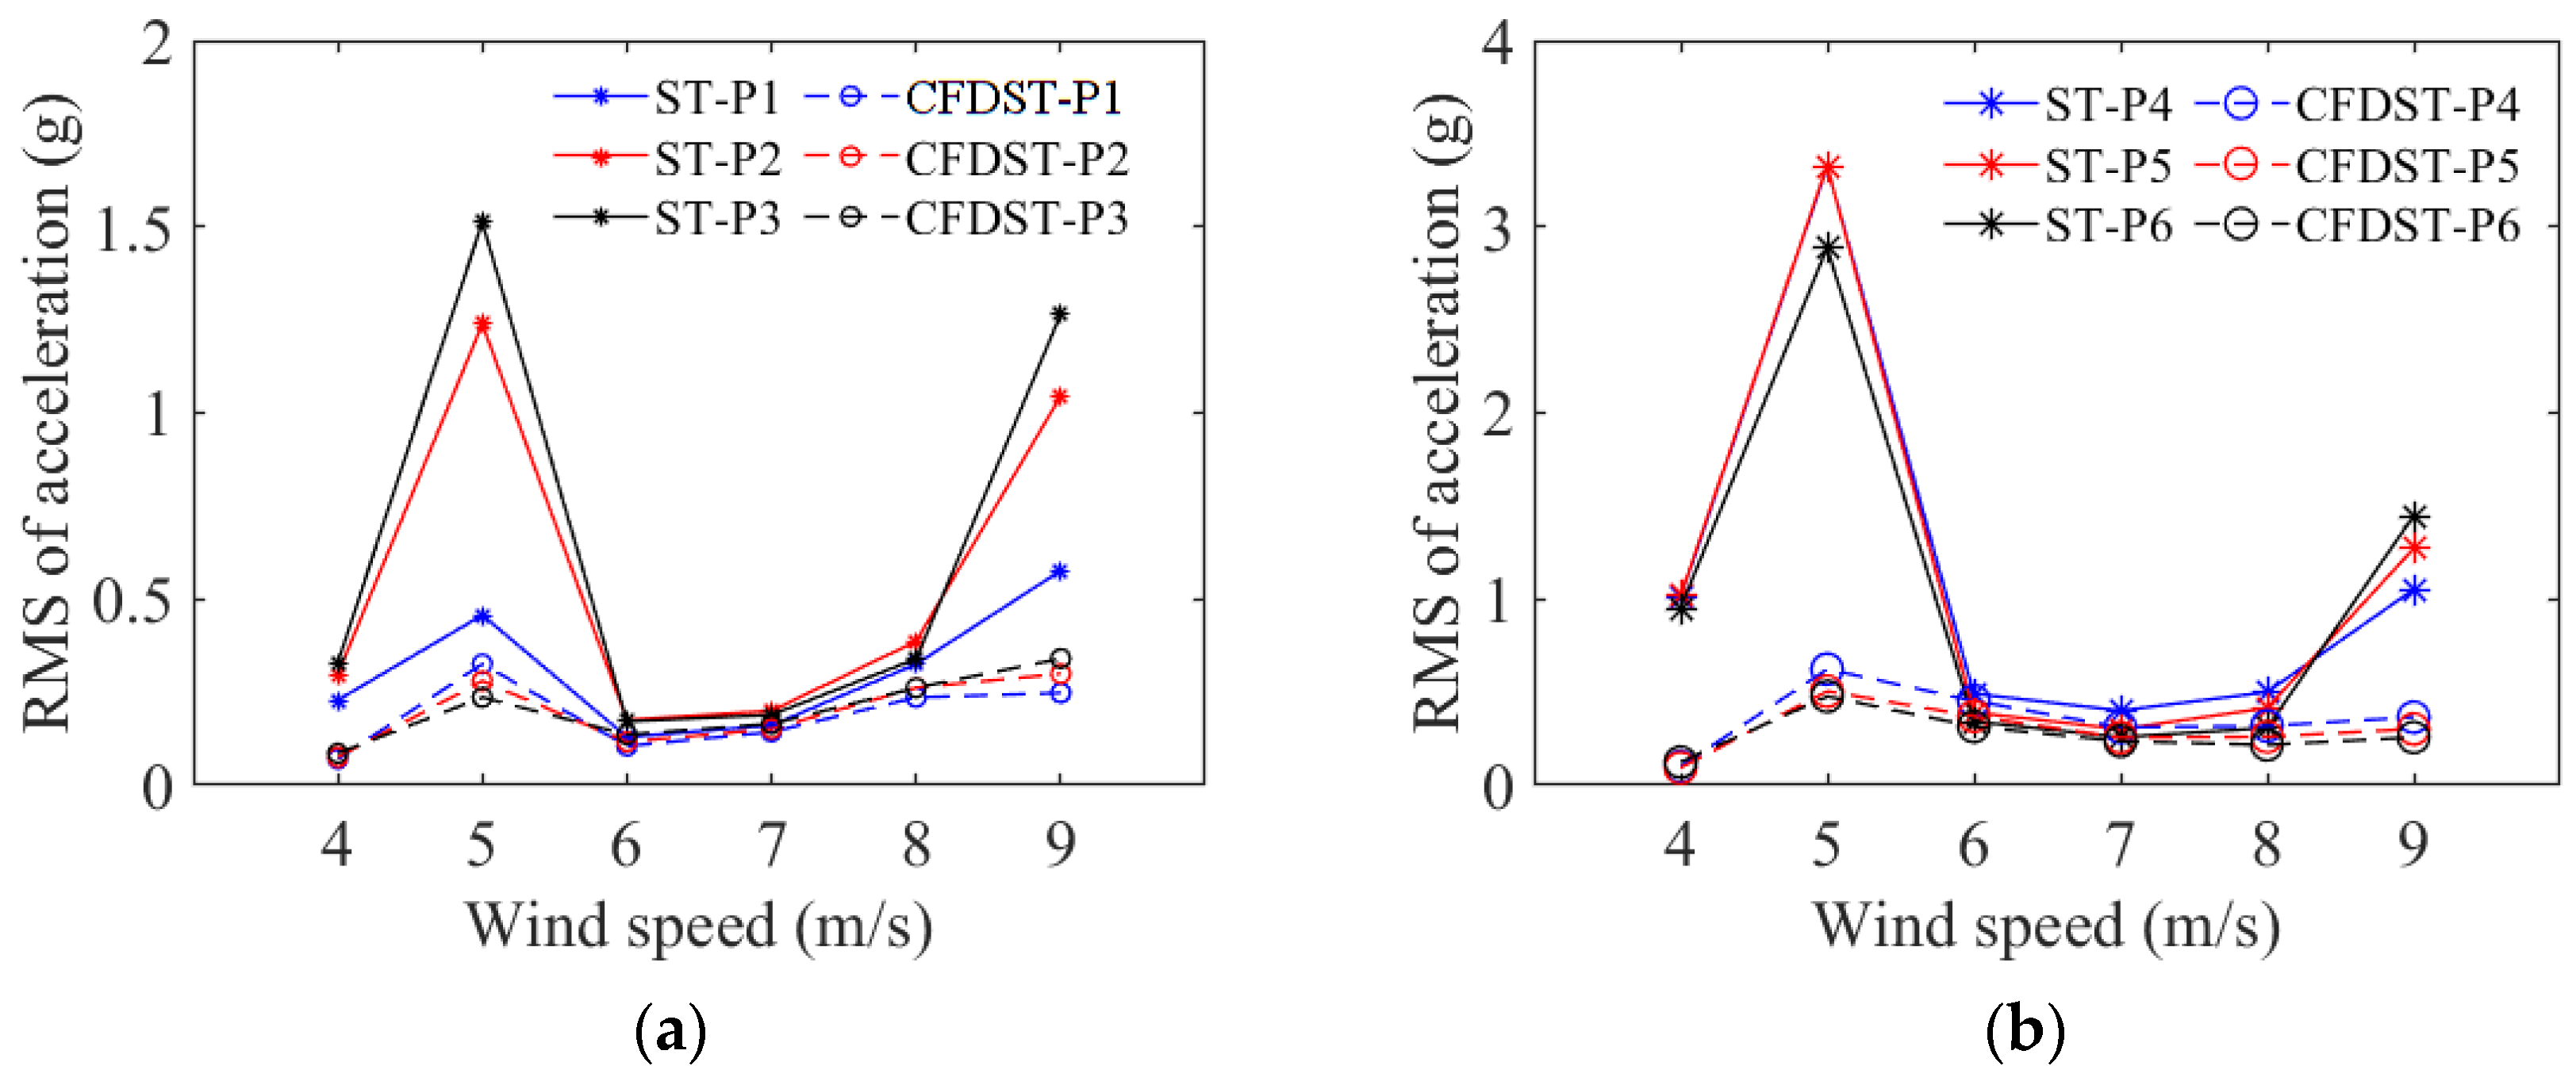
3.1. Acceleration Analysis

3.1.1. RMS Value Analysis

The root mean square (RMS) is a significant parameter that reflects the magnitude of deviation from the equilibrium position of structural vibrations. The RMS values of acceleration responses against wind speeds are shown in Figure 5. It can be observed that the amplitude of both towers initially increases sharply and then decreases rapidly, within the wind speed range of 4–6 m/s. Specifically, the RMS values of the steel tower (ST) are 1.01 g, 3.32 g, and 0.49 g at P4 at wind speeds of 4 m/s, 5 m/s, and 6 m/s, respectively. For the slender towers, with the shedding frequency of the alternating vortices surrounding towers approaching the fundamental frequency of the towers, the lock-in phenomenon would occur with high amplitude vibrations of the bluff body. In this study, the frequency of vortex shedding on both sides of the tower is 12.66 Hz at a wind speed of 5 m/s, which is close to the natural frequency of the towers (i.e., 11.74 Hz for the steel tower and 12.22 Hz for the CFDST tower). Therefore, vortex-induced resonance occurs at a wind speed of 5 m/s.
After the resonance, the gradual increasing trend appears with the wind speed increasing from 7 m/s to 9 m/s. For instance, in Figure 5b, the RMS values of the steel tower are 0.40 g, 0.50 g, and 1.05 g at P4 at wind speeds of 7 m/s, 8 m/s, and 9 m/s, respectively. As the wind speed increases, the aerodynamic drag force becomes larger, and the dynamic response becomes more significant. Combining Figure 5a,b, it can be seen that the vibration amplitudes in the crosswind direction are greater than those in the downwind direction in the same condition. For instance, the RMS values of the steel tower are 3.32 g, 0.40 g, and 1.05 g, respectively at P4 at the wind speeds of 5 m/s, 7 m/s, and 9 m/s, which are 621.7%, 150.0%, and 81.0% larger than those at P3 (i.e., 0.46 g, 0.16 g, and 0.58 g). This indicates that the crosswind direction wake excitation effect is much stronger than the downwind drag effect. Therefore, in tower design calculations, special consideration should be given to damage in the crosswind direction to ensure sustainable performance.
Overall, the vibration of the CFDST tower is significantly less than that of the steel tower. Specifically, the average reduction in the RMS value in the acceleration response can exceed five times in resonance and 48.98% in non-resonance. This is due to the increasing structural stiffness by 20% and the weak nonlinear vibration of the CFDST tower. Especially in resonance, the RMS values of the CFDST tower reduce significantly compared with the steel tower, decreasing by 435.5%, 502.1%, and 552.9% at P4, P5, and P6, respectively. In non-resonant conditions, the attenuation trend is slightly less pronounced. The maximum reduction occurs at a wind speed of 9 m/s, with a reduction of 457.69% at P5. In contrast, the attenuation effect is slightly less pronounced under non-resonant conditions. This demonstrates that the CFDST tower has superior performance against vortex shedding forces.

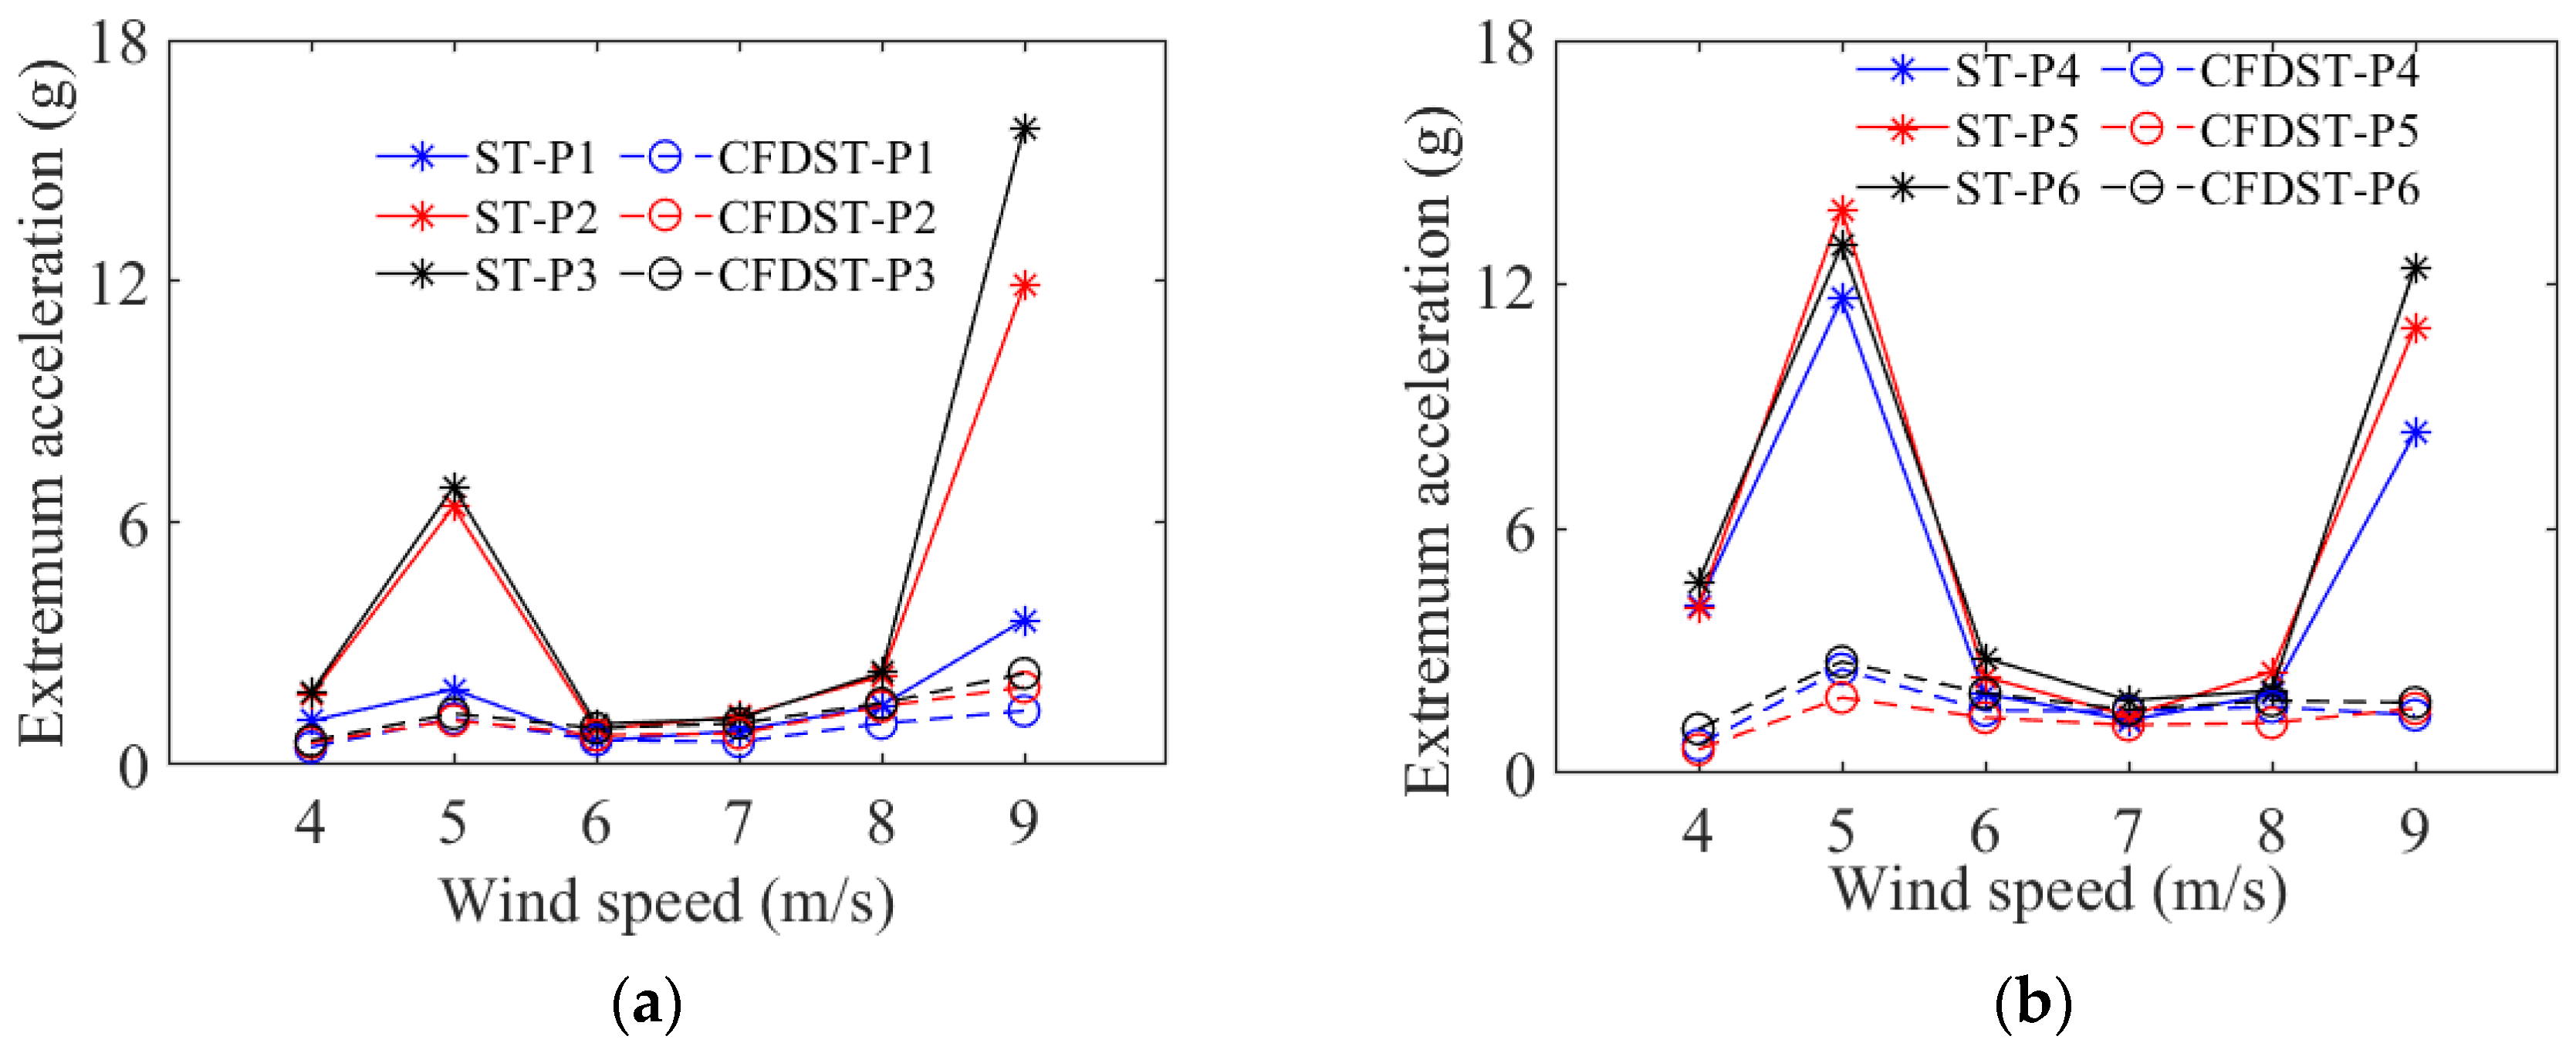
3.1.2. Extremum Acceleration Analysis

Figure 6 presents the extremum acceleration values varying with different wind speeds. The results indicate that the extremum acceleration values of the CFDST tower are generally lower than those of the steel tower. For instance, at a wind speed of 4 m/s, the extremum acceleration of the steel tower is 4.13 g at P4, while it reduces to 0.70 g for the CFDST tower, with a reduction of 83.05%. Similarly, the extremum acceleration of the steel tower is 1.09 g at P1, while its value in the CFDST tower is only 0.44 g, with a reduction of 59.63%. This demonstrates that the CFDST tower effectively reduces the extremum acceleration in both the crosswind and downwind directions, enabling the possibility to enhance the safety of the wind turbine structural system.

3.2. Displacement Analysis

3.2.1. Displacement Box Plot

Figure 7 displays the box plots of displacements varying with different wind speeds. An outlier coefficient of 1.5 was selected. The upper edge of the box represents the 75th percentile displacement, the lower edge represents the 25th percentile displacement, and the central black line indicates the mean value. It can be found that the whisker length and the number of outliers on the right side of the steel tower are significantly larger than those of the CFDST tower, indicating a larger extreme response of the steel tower.
The box length for the steel tower is remarkably longer than that for the CFDST tower. For instance, at a wind speed of 5 m/s, the steel tower box spans from −1.75 to 1.75 in the crosswind direction, while the CFDST tower box spans from −0.25 to 0.25. This indicates that the displacement of the steel tower is more dispersed compared to the CFDST tower. In the CFDST tower, infilled concrete can effectively improve the stability of the specimen, partially compensating for the shortcomings of traditional steel towers.

3.2.2. Displacement Distribution Analysis

Considering the significant impact of resonance on the displacement of both types of towers, we further analyzed the vibration displacement data at the resonant wind speed of 5 m/s. Figure 8 illustrates the probability density distribution of the displacements for CFDST and steel towers at all wind speeds. The results show that both of these towers follow a Gaussian distribution. The displacement distribution of the CFDST tower exhibits a slender shape, with a kurtosis of 1.00 in the downwind direction and 3.35 in the crosswind direction. Nevertheless, the displacement distribution of the steel tower displays a broad shape, with kurtosis values of −0.30 and 0.32 in the downwind and crosswind directions, respectively. This indicates that the data distribution of the CFDST tower is featured with less tail dispersion, which is beneficial for the stability and service life of the tower.

3.3. Trajectory Analysis

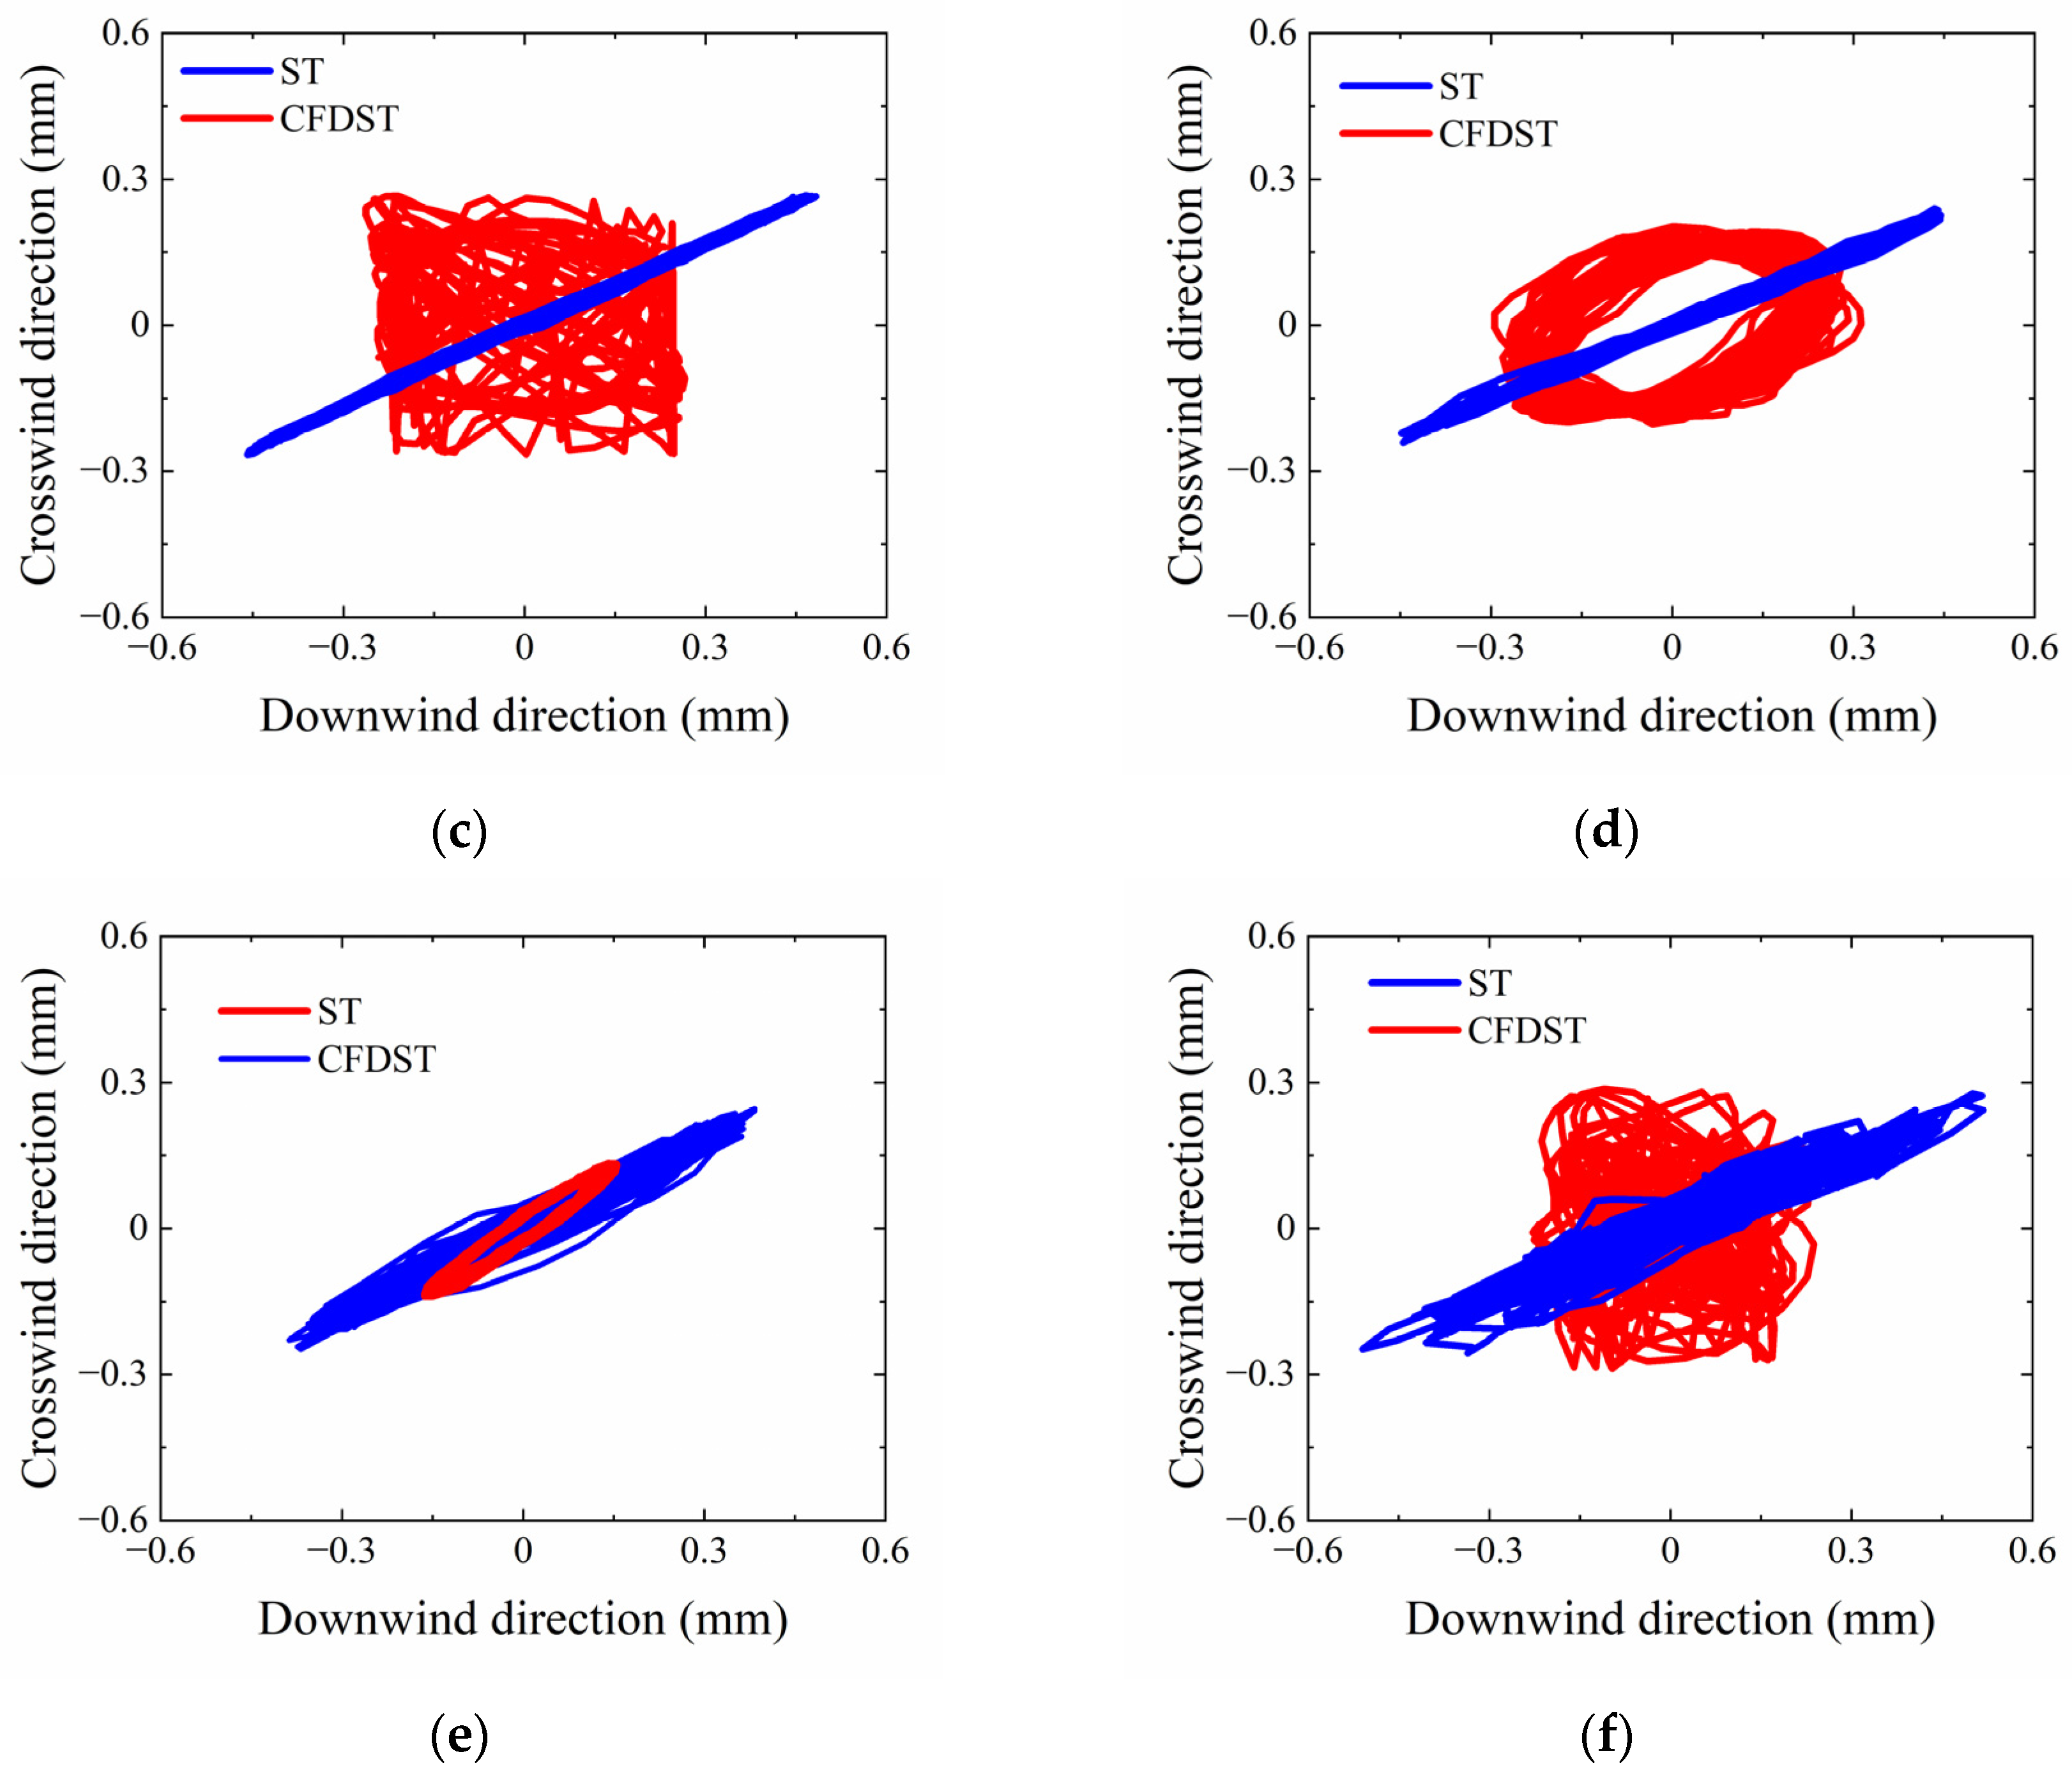
3.3.1. Displacement Trajectory Analysis

The displacement trajectory diagrams at Point A and Point D are depicted in Figure 9. As a multimodal vibration system, the downwind and crosswind vibrations of the tower exhibit multiple modal frequencies, leading to an unstable phase difference between the two directions. Consequently, the vibration of the tower does not have a stable motion trajectory [33]. It can be observed that when the vortex-induced resonance occurs at a wind speed of 5 m/s, the trajectories of both of these towers exhibit an elliptical shape, as shown in Figure 9b. This phenomenon can be explained by the fact that the crosswind and downwind frequencies are matched with the natural frequency of the tower during the vortex-induced resonance, resulting in regular vibration trajectory with large displacement responses, similar to the cases investigated by Kheirkhah et al. [34]. In non-resonance, the displacement trajectories of the steel tower turn out the diagonal pattern, determined by the phase difference between the transverse and longitudinal vibrations, as illustrated in Figure 9b–f. For the CFDST tower, the displacement trajectory becomes irregular, displaying either an elliptical shape or random patterns. In resonance, the range of the displacement trajectory of the CFDST tower is 303.0% smaller than that of the steel tower in the downwind direction, while the gap slightly expands to 308.9% in the crosswind direction.

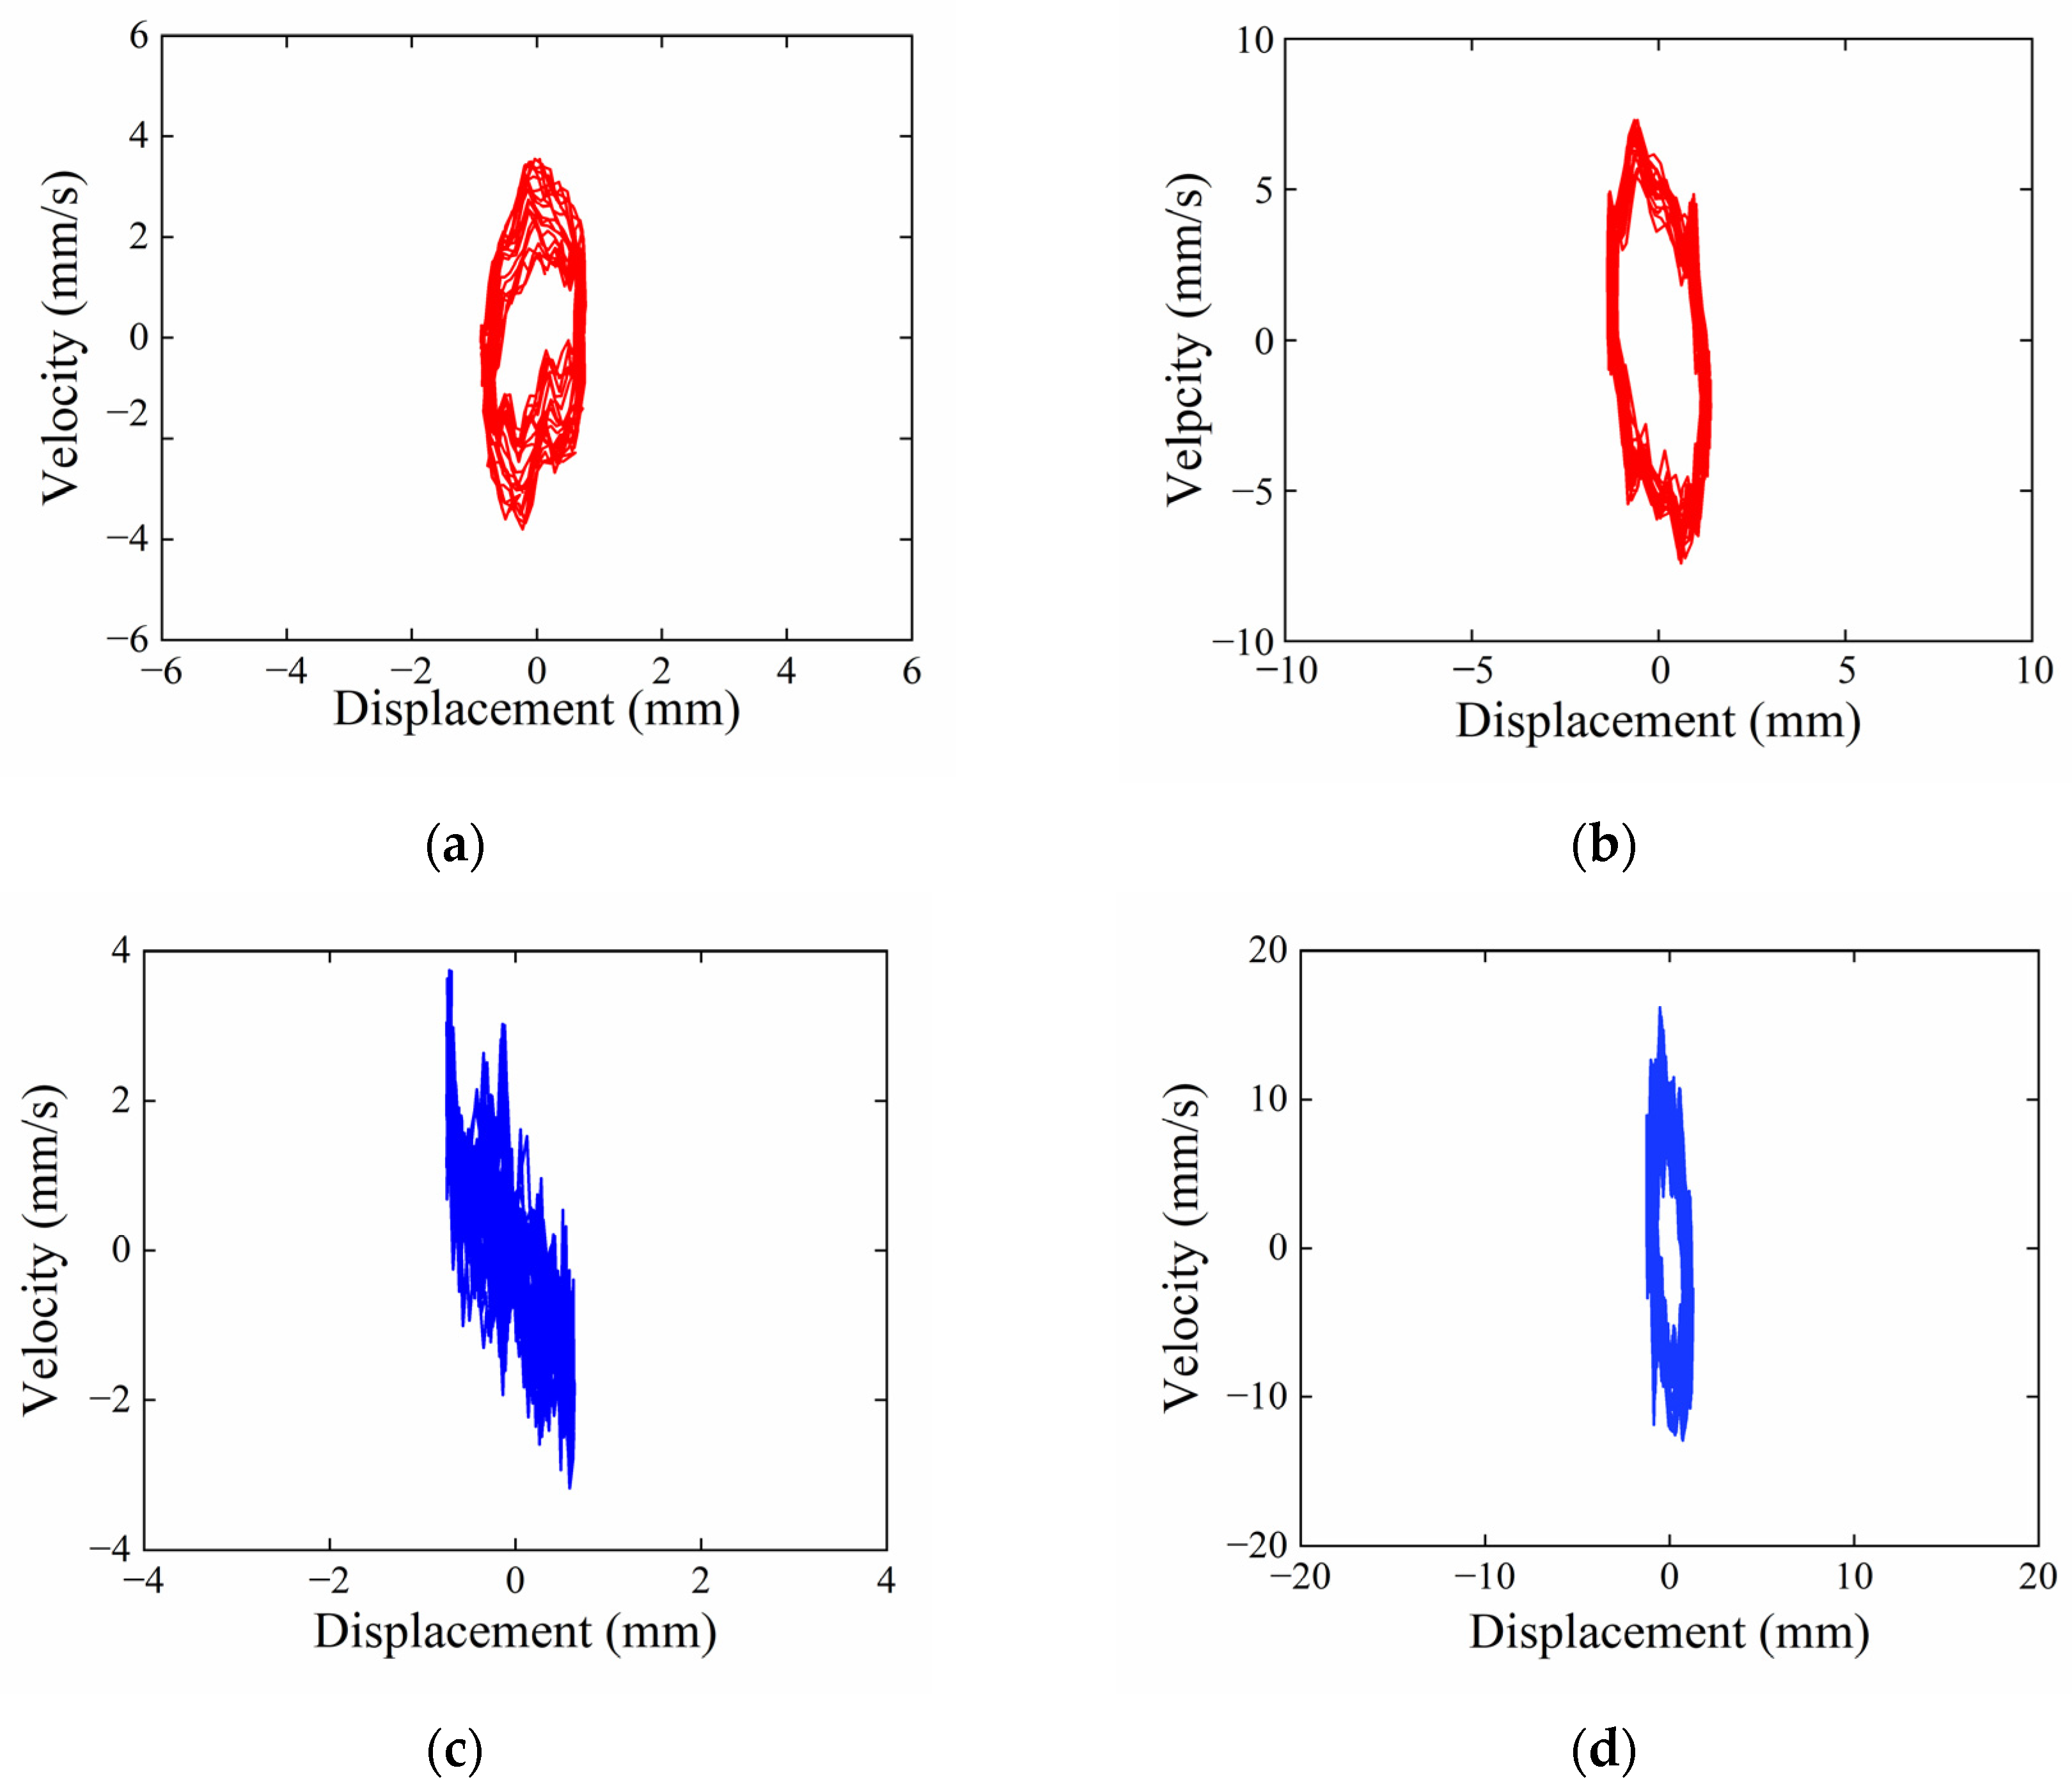
3.3.2. Phase Trajectory Analysis

Phase trajectories provide a direct and accurate reflection of the stability of the system, equilibrium state, and steady-state accuracy. They illustrate how vibrations of the system evolve and reveal critical characteristics such as stable points, periodic orbits, and other significant features. This would benefit the understanding of the dynamic behavior of the structural system, including its stability, periodicity, and chaotic nature. To study the structural stability, experimental data at a specific resonant wind speed were processed. Initial conditions at a resonance moment t0 were set, and displacement and velocity data over this period were used to plot phase trajectories for CFDST and ST towers in both the transverse and downwind directions, shown in Figure 10.
It can be observed that the phase trajectory of the CFDST tower corresponds to the solution of the vibration differential equation with complex roots, forming a short-axis ellipse. When the phase trajectory approaches an elliptical shape, it generally indicates that the system exhibits stable periodic motion, periodically varying around a stable point or stable periodic orbit in phase space, with possible oscillations or variations in amplitude. This suggests that the vibration of the tower remains stable and predictable.
In contrast, the phase trajectory of the ST tower in the downwind direction is nearly elliptical. However, during transverse vortex-induced resonance, the phase trajectory becomes highly chaotic. When the phase trajectory appears disordered and lacks a clear pattern, it indicates that the motion of the tower is in a chaotic state. Chaos implies that the evolution of the system in phase space is characterized by high uncertainty and complexity, making it impossible to accurately predict the future behavior of the system [29]. The chaos and disorder in the phase trajectory reflect the nonlinear dynamics and extreme sensitivity to initial conditions, where even small changes can lead to significantly different behavioral trajectories.

3.4. Dynamic Characteristics

3.4.1. Frequency Analysis

Figure 11 illustrates the acceleration power spectra varying with wind speeds. The spectra show numerous frequency components at each wind speed, obviously indicating multimodal vibrations. For instance, in the downwind direction, the dominant energy extremum shifts from 11.70 Hz at a speed of 5 m/s to dual extremums (i.e., 16.60 Hz and 48.91 Hz) at a wind speed of 7 m/s. This is attributed to the inherent characteristics of flexible structures with multi-frequencies and vibration modes.
At a wind speed of 5 m/s, both of these towers exhibit significant resonance, with the first structural frequency (i.e., 11.74 Hz for steel tower and 12.22 Hz for CFDST tower) almost equaling the 1P frequency of blade rotation (i.e., 11.56 Hz). As the blade rotational speed increases, harmonic excitation from blade rotation also intensifies. At a wind speed of 7 m/s, both the steel tower and CFDST tower in the downwind direction are dominated by the 3P frequency of blade rotation (i.e., 49.26 Hz), with the occurrence of higher-order vibration frequency (i.e., 48.91 Hz). However, these towers in the crosswind direction are still dominated by the 1P frequency (i.e., 16.42 Hz), with more energy concentrating at lower-order vibration frequency (i.e., 16.57 Hz). A similar trend exists in the wind speed of 9 m/s as well. These towers in both the downwind direction and crosswind direction are controlled by the 3P frequency of blade rotation (i.e., 68.34 Hz), with their higher-order vibration frequency excited (i.e., 68.47–68.49 Hz). It is indicated that the coupling effects of blades and nacelles in the wind turbine system cannot be neglected in the design of various wind turbine towers.

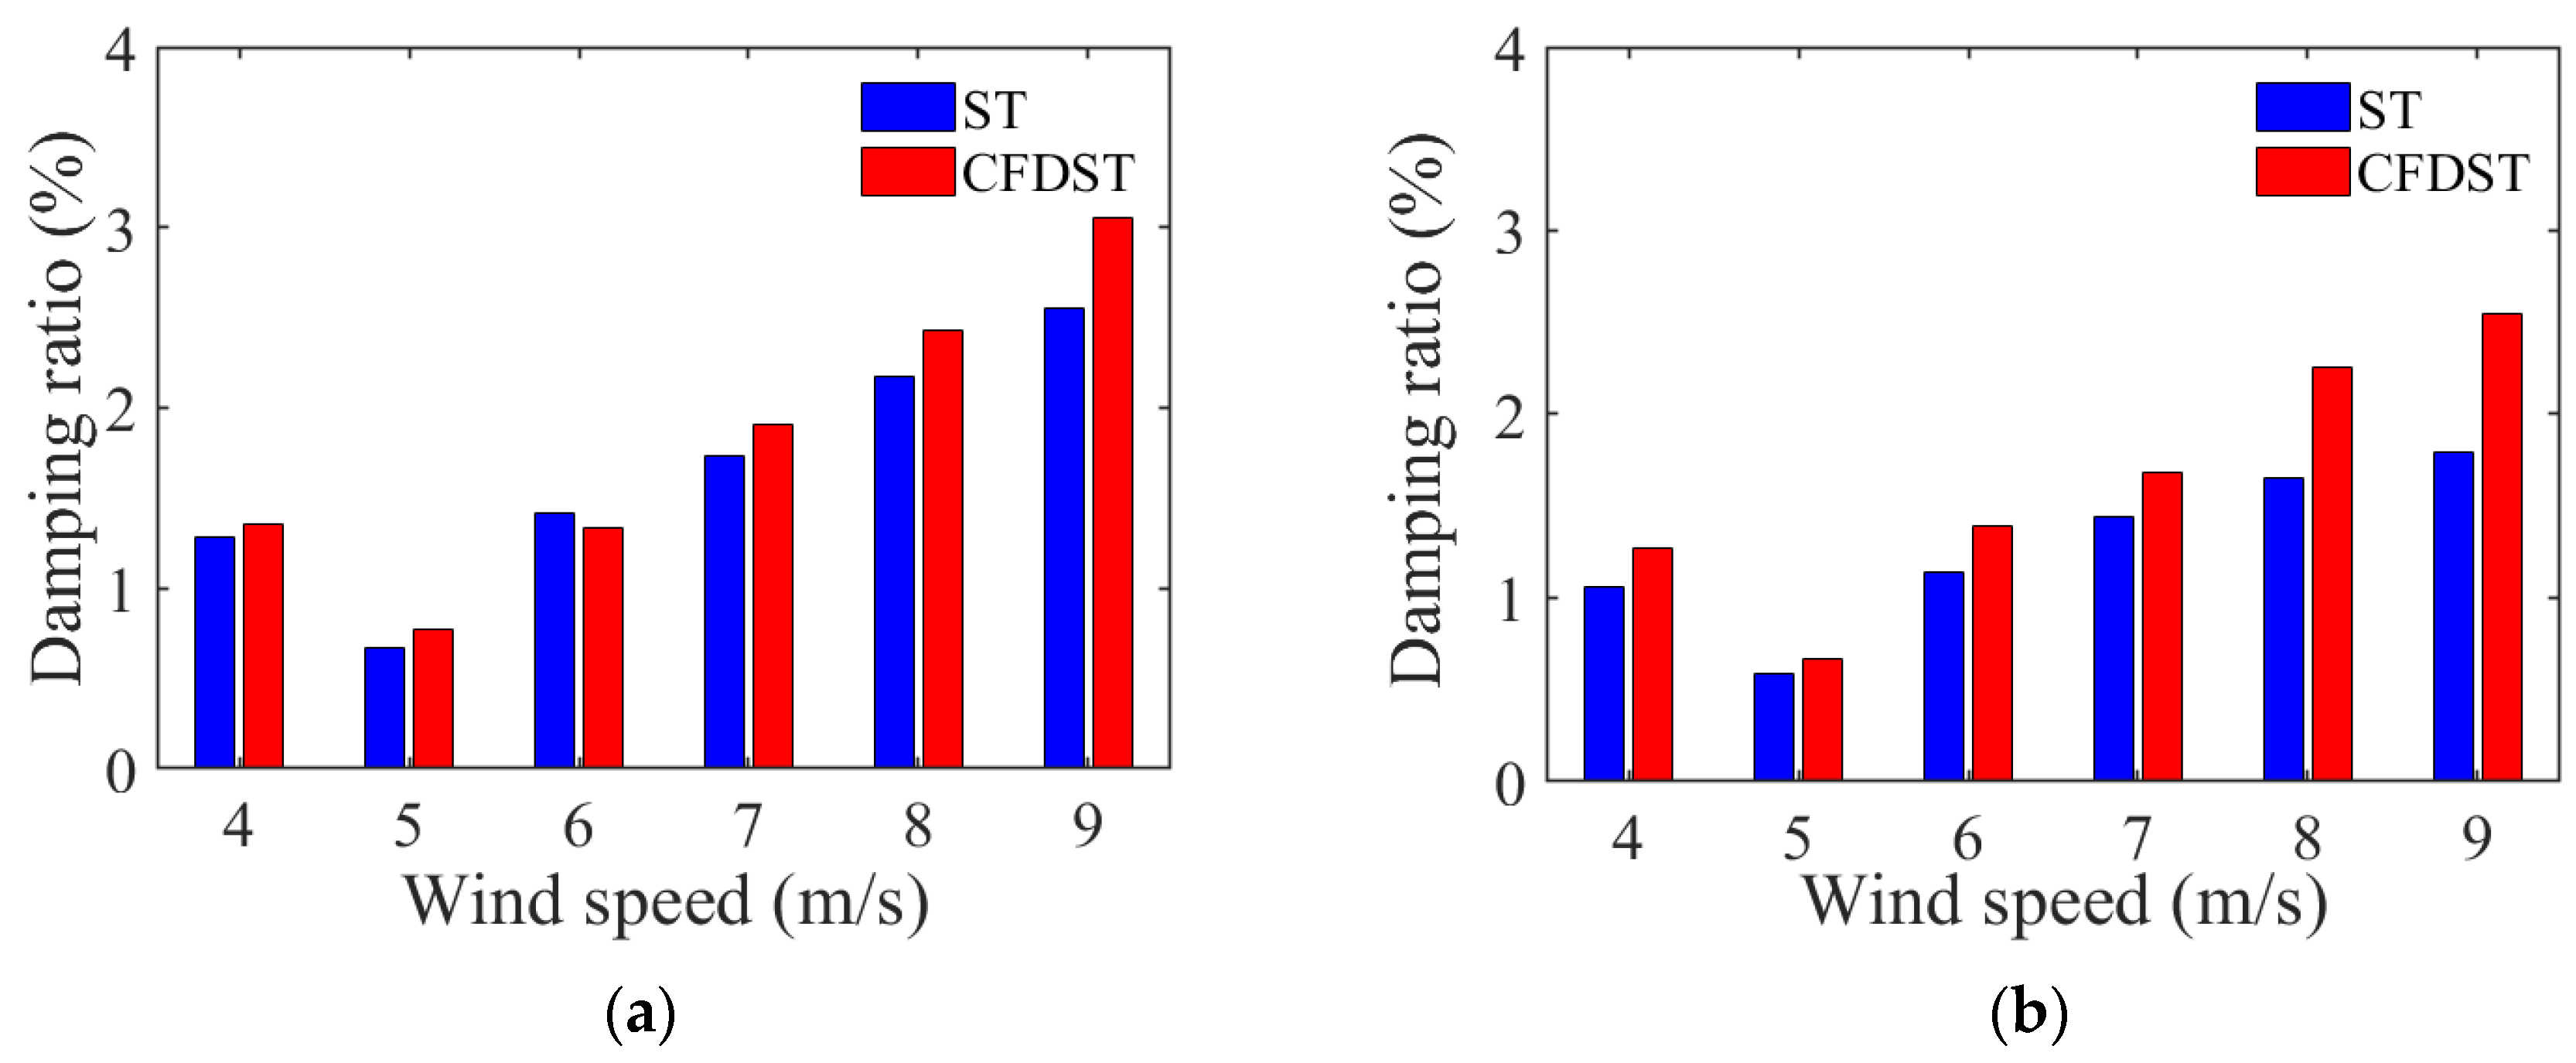
3.4.2. Damping Ratio Analysis

The random decrement technique was applied to analyze the signal of acceleration responses, and the damping ratios under different wind speed conditions can be extracted, as shown in Figure 12. It is obvious that the damping ratios of these two towers exhibit a similar trend of initial decrease and then increase, varying with wind speeds. This phenomenon may be attributed to the fluid–solid interaction between flows and structures, where parametric excitation causes the damping ratio to vary with time. The minimum damping ratio occurs at a wind speed of 5 m/s, due to the appearance of the negative aerodynamic damping ratio. Then, the maximum damping ratio occurs at a wind speed of 9 m/s, which is associated with the larger wind loads and stronger fluid–solid interaction.
In general, the damping ratios of the CFDST tower are larger than those of the steel tower. For example, with the wind speed increasing from 7 m/s to 9 m/s, the damping ratios of the steel tower in the crosswind direction are 1.39%, 1.62%, and 1.83%, respectively. However, the corresponding damping ratios for the CFDST tower rise up to 1.65%, 2.26%, and 2.58%, respectively, with the resultant increases of 18.71%, 39.51%, and 40.98%. This suggests that the CFDST tower with larger damping ratios would benefit the external energy dissipation and enhance the structural stability.

4. Conclusions and Future Work

This study investigated the dynamic characteristics of CFDST- and steel tower-based wind turbine systems in a typhoon wind field through physical model tests. The scaled wind tunnel tests were designed and complemented in different wind speeds. Consequently, the aerodynamic behavior was systematically analyzed, in terms of acceleration and displacement response, the trajectory of displacement and phase, and dynamic characteristics. The main conclusions are as follows:
  • Due to the increasing stiffness of the CFDST tower up to 20% compared with the traditional steel tower, the aerodynamic responses of the CFDST tower reduce significantly. Specifically, the reduction in the RMS value in the acceleration response can exceed 552.9% in resonance and can be up to 457.69% in non-resonance. The vibration spectrum analysis shows that the first mode plays a dominant role in vibration modes for the CFDST tower, whereas higher-order vibration modes exist and interact in the steel tower.
  • In resonance, the range of the displacement trajectory of the CFDST tower is 303.0% smaller than that of the steel tower in the downwind direction, while the gap slightly expands to 308.9% in the downwind direction. The traditional steel tower has chaotic phase trajectories in the crosswind direction, indicating more unstable and complex dynamic responses. In contrast, the phase trajectories of the CFDST tower tend toward elliptical shapes with much more stability.
  • Under external environmental and blade harmonic excitations, the 1P frequency dominates the acceleration power spectral density at low wind speeds (i.e., 4 m/s and 5 m/s). As wind speeds increase (i.e., 6–9 m/s), the 3P frequency energy becomes dominant, highlighting the significance of the coupling effects of blades and nacelles in the wind turbine system.
  • The damping ratios of both of these towers follow a similar trend, varying with different wind speeds. The damping ratios of the CFDST tower are generally larger than those of the steel tower. It is demonstrated that the CFDST tower possesses superior energy dissipation capacity, with the improvement in the damping ratio being up to 40.98%.
Overall, the aerodynamic responses of the CFDST-based wind turbine system reduce significantly, with obvious improvement in the energy dissipation capacity and structural stability. The design optimization of the CFDST tower will be carried out in the future.

Author Contributions

Methodology, D.L.; Formal analysis, C.S.; Investigation, S.F.; Data curation, S.F.; Writing—original draft, Y.S. and C.S.; Writing—review & editing, H.W.; Supervision, H.W.; Funding acquisition, D.L. All authors have read and agreed to the published version of the manuscript.

Funding

This study was financially supported by the National Natural Science Foundation of China (Grant No. 52108121), the Open Research Subject of Key Laboratory of Fluid and Power Machinery (Xihua University), Ministry of Education (Grant No. LTDL-2023019), and the Tianjin University-Fuzhou University Independent Innovation Project (Grant No. TF-2024-9).

Data Availability Statement

Data are contained within the article.

Conflicts of Interest

The authors declare no conflict of interest.

References

  1. Zhang, M.; Liu, B.; Gao, C.Q.; Hossain, M.N.; Zhao, G.F. Wind-Induced Response Analysis and Fatigue Reliability Study of a Steel-Concrete Composite Wind Turbine Tower. Buildings 2024, 14, 1740. [Google Scholar] [CrossRef]
  2. You, F.; Shaik, S.; Rokonuzzaman, M.; Rahman, K.S.; Tan, W.S. Fire Risk Assessments and Fire Protection Measures for Wind Turbines: A Review. Heliyon 2023, 9, 19664. [Google Scholar] [CrossRef] [PubMed]
  3. Wang, J.H.; Qin, D.T.; Lim, T.C. Dynamic Analysis of Horizontal Axis Wind Turbine by Thin-Walled Beam Theory. J. Sound Vib. 2010, 329, 3565–3586. [Google Scholar] [CrossRef]
  4. Wei, R.; Zhou, X.H.; Gao, Y.; Deng, R.; Wang, Y.H.; Zhou, X.H.; Yu, J.; Chao, Y.Q. Compressive Behavior of Stiffened Steel Tubes for Wind turbine Towers. Thin Walled Struct. 2023, 183, 110372. [Google Scholar]
  5. Lee, H.; Moon, W.; Lee, M.; Song, K.; Shen, Z.R.; Kyoung, J.; Baquet, A.; Kim, J.; Han, I.K.; Park, S.; et al. Time-Domain Response-Based Structural Analysis on a Floating Offshore Wind Turbine. J. Mar. Sci. Appl. 2023, 22, 75–83. [Google Scholar] [CrossRef]
  6. Abhinav, K.A.; Saha, N. Dynamic Analysis of Monopile Supported Offshore Wind Turbines. Proc. Inst. Civ. Eng. Geotech. Eng. 2017, 170, 428–444. [Google Scholar] [CrossRef]
  7. Bottasso, C.L.; Bortolotti, P.; Croce, A.; Gualdoni, F. Integrated Aero-Structural Optimization of Wind Turbines. Multibody Syst. Dyn. 2016, 38, 317–344. [Google Scholar] [CrossRef]
  8. Jin, X.K.; Tan, W.; Zou, Y.R.; Wang, Z.J. Active Disturbance Rejection Control for Wind Turbine Fatigue Load. Energies 2022, 15, 6178. [Google Scholar] [CrossRef]
  9. Li, M.; Li, H.; Wen, Y. Design and Performance Study of a Six-Leg Lattice Tower for Wind Turbines. Buildings 2024, 14, 965. [Google Scholar] [CrossRef]
  10. Kim, B.J.; Plodpradit, P.; Kim, K.D.; Kim, H.G. Three-dimensional Analysis of Prestressed Concrete Offshore Wind Turbine Structure Under Environmental and 5-MW Turbine Loads. J. Shipp. Ocean. Eng. 2018, 4, 625–637. [Google Scholar] [CrossRef]
  11. De Lana, J.A.; de Lana, J.A.; Magalha, P.A.A.; Magalhaes, C.A.; Magalhaes, A.; De Andrade, A.C.; Ribeiro, M.S.D. Behavior Study of Prestressed Concrete Wind-Turbine Tower in Circular Cross-Section. Eng. Struct. 2021, 17, 625–637. [Google Scholar] [CrossRef]
  12. Ma, H.W.; Meng, R. Optimization Design of Prestressed Concrete Wind-Turbine Tower. Sci. China Technol. Sci. 2014, 57, 414–422. [Google Scholar] [CrossRef]
  13. Yue, Y.C.; Tian, J.J.; Mu, Q.Y.; Chen, T.B.; Peng, L.; Lu, X.; Liu, J. Feasibility of Segmented Concrete in Wind Turbine Tower: Numerical Studies on its Mechanical Performance. Int. J. Damage Mech. 2021, 30, 518–536. [Google Scholar] [CrossRef]
  14. Kim, H.G.; Kim, B.J. Design Optimization of Conical Concrete Support Structure for Offshore Wind Turbine. Energies 2020, 13, 4876. [Google Scholar] [CrossRef]
  15. Zhang, Z.H.; Liu, Y.; Zhang, Y.; Zhou, M.; Chen, J. Time Interval of Multiple Crossings of the Wiener Process and a Fixed Threshold in Engineering. Mech. Syst. Signal Process. 2020, 135, 106389. [Google Scholar] [CrossRef]
  16. Yang, Y.F.; Bie, X.M.; Hou, C.; Han, L.H. Analytical Behaviour and Design of Square CFDST Subjected to Local Bearing Force. J. Constr. Steel Res. 2019, 159, 198–214. [Google Scholar] [CrossRef]
  17. Deng, R.; Zhou, X.H.; Deng, X.W.; Ke, K.; Bai, J.L.; Wang, Y.H. Compressive Behaviour of Tapered Concrete-Filled Double Skin Steel Tubular Stub Columns. J. Constr. Steel Res. 2021, 184, 106771. [Google Scholar] [CrossRef]
  18. Ci, J.C.; Ahmed, M.; Jia, H.; Chen, S.C.; Zhou, D.X.; Hou, L.Q. Testing and Strength Prediction of Eccentrically-Loaded Circular Concrete-Filled Double Steel Tubular Stub-Columns. J. Constr. Steel Res. 2021, 186, 106881. [Google Scholar] [CrossRef]
  19. Huang, H.; Han, L.H.; Zhao, X.L. Investigation on Concrete Filled Double Skin Steel Tubes (CFDSTs) under Pure Torsion. J. Constr. Steel Res. 2013, 90, 221–234. [Google Scholar] [CrossRef]
  20. Wang, Y.H.; Lu, G.B.; Zhou, X.H. Experimental Study of The Cyclic Behavior of Concrete-Filled Double Skin Steel Tube Columns Subjected to Pure Torsion. Thin Walled Struct. 2018, 122, 425–438. [Google Scholar] [CrossRef]
  21. Duan, L.X.; Wang, W.D.; Xian, W.; Shi, Y.L. Shear Response of Circular-In-Square CFDST Members: Experimental Investigation and Finite Element Analysis. J. Constr. Steel Res. 2022, 190, 107160. [Google Scholar] [CrossRef]
  22. Wang, J.T.; Liu, X.H.; Sun, Q.; Li, Y.W. Compressive-Flexural Failure Mechanism and Bearing Capacity Calculation of Over-Ranging Tapered CFDST Members for Support Structures of Offshore Wind Turbines. J. Mar. Sci. Eng. 2023, 11, 1621. [Google Scholar] [CrossRef]
  23. Zhang, Z.H.; Liu, Y.; Wang, L.; Li, W.B.; Ma, G. Probability Analysis of Duration of Stochastic Process Exceeding Fixed Threshold and its Application on Structural Cumulative Damage and Fatigue Reliability Evaluation. ASCE–ASME J. Risk Uncertain. Eng. Syst. Part A Civ. Eng. 2024, 10, 11081621. [Google Scholar] [CrossRef]
  24. Han, L.H.; Li, Y.J.; Liao, F.Y. Concrete-Filled Double Skin Steel Tubular (CFDST) Columns Subjected to Long-Term Sustained Loading. Thin Walled Struct. 2011, 49, 1534–1543. [Google Scholar] [CrossRef]
  25. Zhao, H.; Wang, R.; Hou, C.C.; Lam, D. Performance of Circular CFDST Members with External Stainless Steel Tube under Transverse Impact Loading. Thin Walled Struct. 2019, 145, 106380. [Google Scholar] [CrossRef]
  26. Jin, K.Y.; Wang, Y.H.; Zhou, X.H.; Deng, R.; Hu, C.; Wen, H. Behavior of Super-Sized Thin-Walled CFDST Columns for Wind Turbine Towers Subjected to Combined Loads: Experiment. Eng. Struct. 2024, 303, 117458. [Google Scholar] [CrossRef]
  27. Duan, L.X.; Wang, W.D.; Zheng, L.; Shi, Y.L. Dynamic Response Analysis of Monopile CFDST Wind Turbine Tower System under Wind-Wave-Seismic Coupling Action. Thin Walled Struct. 2024, 202, 112089. [Google Scholar] [CrossRef]
  28. Jonkman, J.M.; Butterfield, S.; Musial, W.; Scott, G. Definition of a 5MW Reference Wind Turbine for Offshore System Development; Technical Reports NREL/TP-500-38060; Office of Energy Efficiency & Renewable Energy: Oak Ridge, TN, USA, 2009. [Google Scholar]
  29. Chen, C.; Zhou, J.W.; Li, F.M.; Gong, D.H. Nonlinear Vortex-Induced Vibration of Wind Turbine Towers: Theory and Experimental Validation. Mech. Syst. Signal Process. 2023, 204, 1100772. [Google Scholar] [CrossRef]
  30. Bayati, I.; Belloli, M.; Bernini, L.; Zasso, A. Aerodynamic Design Methodology for Wind Tunnel Tests of Wind Turbine Rotors. J. Wind. Eng. Ind. Aerodyn. 2017, 167, 217–227. [Google Scholar] [CrossRef]
  31. National Standards Committee. Load Code for the Design of Building Structures. In China National Standard (CNS); National Standards Committee: Beijing, China, 2012. [Google Scholar]
  32. He, J.Y.; He, Y.C.; Li, Q.S.; Chan, P.W.; Zhang, L.; Yang, H.L.; Li, L. Observational Study of Wind Characteristics, Wind Speed and Turbulence Profiles During Super Typhoon Mangkhut. J. Wind. Eng. Ind. Aerodyn. 2020, 206, 104362. [Google Scholar] [CrossRef]
  33. Chen, W.L.; Zhang, Q.Q.; Li, H.; Hu, H. An Experimental Investigation on Vortex Induced Vibration of a Flexible Inclined Cable under a Shear Flow. J. Fluids Struct. 2015, 54, 297–311. [Google Scholar] [CrossRef]
  34. Kheirkhah, S.; Yarusevych, S.; Narasimhan, S. Orbiting Response in Vortex-Induced Vibrations of a Two-Degree-Of-Freedom Pivoted Circular Cylinder. J. Fluids Struct. 2011, 28, 343–358. [Google Scholar] [CrossRef]
Figure 1. Steel tubular and CFDST towers. (a) Fabricated specimens. (b) Schematic of CFDST tower section. (c) Photograph of CFDST tower section.
Buildings 14 02372 g001
Figure 2. Layout of triangular spires and roughness elements in wind tunnel laboratory. (a) Schematic diagram. (b) Photograph in physics.
Buildings 14 02372 g002
Figure 3. Layout of measurement points in two orthogonal directions. (a) Crosswind direction (Point D–F for displacement measurement, Point P4–P6 for acceleration measurement). (b) Downwind direction (Point A–C for displacement measurement, Point P1–P3 for acceleration measurement). (c) Photograph in physics.
Buildings 14 02372 g003
Figure 4. Comparison of wind field between wind tunnel test and theory. (a) Wind speed profile. (b) Turbulence profile.
Buildings 14 02372 g004
Figure 5. RMS of acceleration varying with wind speeds. (a) in downwind direction. (b) in crosswind direction.
Buildings 14 02372 g005
Figure 6. Extremum acceleration varying with wind speeds. (a) in downwind direction. (b) in crosswind direction.
Buildings 14 02372 g006
Figure 7. Displacement box plot. (a) in downwind direction. (b) in crosswind direction.
Buildings 14 02372 g007
Figure 8. Probability density function of displacement responses. (a) CFDST in downwind direction. (b) CFDST in crosswind direction. (c) ST in downwind direction. (d) ST in crosswind direction.
Buildings 14 02372 g008aBuildings 14 02372 g008b
Figure 9. Displacement trajectory diagram in different wind speed cases. (a) 4 m/s. (b) 5 m/s. (c) 6 m/s. (d) 7 m/s. (e) 8 m/s. (f) 9 m/s.
Buildings 14 02372 g009aBuildings 14 02372 g009b
Figure 10. Phase trajectory diagram. (a) CFDST in downwind direction. (b) CFDST crosswind direction. (c) ST in downwind direction. (d) ST in crosswind direction.
Buildings 14 02372 g010
Figure 11. Acceleration power spectra varying with wind speeds. (a) 5 m/s in downwind direction. (b) 5 m/s in crosswind direction. (c) 7 m/s in downwind direction. (d) 7 m/s in crosswind direction. (e) 9 m/s in downwind direction. (f) 9 m/s in crosswind direction.
Buildings 14 02372 g011
Figure 12. Damping ratios in different orders varying with wind speeds. (a) in downwind direction. (b) in crosswind direction.
Buildings 14 02372 g012
Table 1. Basic parameter similarity relationships.
Scale ParameterDimensionSimilarity FactorValue
Length lL λ l 1/67
Area AL2 λ l 2 1/4489
Volume VL3 λ l 3 1/300,763
Velocity uLT−1 λ u 1/2
Angular velocity ωT−1 λ u λ l 1 33.5
Acceleration aLT−2 λ u 2 λ l 1 16.75
Time tT λ u 1 λ l 1/33.5
Frequency fT−1 λ u λ l 1 33.5
Equivalent elastic modulus EI/L4L−1MT−2 λ u 2 1/4
Stiffness EIL3MT−2 λ u 2 λ l 4 1/80,604,484
Thrust FLMT−2 λ u 2 λ l 2 1/17,956
Bending moment ML2MT−2 λ u 2 λ l 3 1/1,203,052
Power PL2MT−3 λ u 3 λ l 2 1/35,912
Rotor speed ΩT−1 λ u λ l 1 33.5
Table 2. Wind turbine specifications.
ComponentParameter (Unit)ModelPrototypeSimilar Ratio
TowerDiameter (m)0.07551/67
Frequency (Hz)11.400.3233.6
Wind turbineWheel height (m)1.34901/67
Number of leaves331
Blade diameter (m)1.81261/50
Rated power (W)1005 × 1061/20,000
Rotor speed (RPM)6901353.16
Cut-in air speed (m/s)1.531/2
Cut-out air speed (m/s)12.5251/2
Table 3. Design of steel and CFDST tower specimens.
Tower
Type
Do × to
(mm × m)
Di × ti
(mm × mm)
fcu
(MPa)
fyo
(MPa)
fyi
(MPa)
L
(mm)
χDo/to
ST75 × 1.2--355-1100-62.5
CFDST75 × 1.248 × 1.24035535511000.6662.5
Table 4. Mix proportions of ECC.
Water–Cement RatioCement
(kg)
Water (kg)Fly Ash
(kg)
Silica Fume
(kg)
S95 Slag Powder
(kg)
Water Reducer Admixtures
(kg)
PVA Fiber (%)
0.286613703317663312.82
Table 5. Loading conditions.
No.Tower TypeWind Speed
u (m/s)
Rotor Speed
Ω (Hz)
Reynolds Number
Re (×104)
1CFDST48.672.0
2ST48.672.0
3CFDST511.562.5
4ST511.562.5
5CFDST613.553.0
6ST613.553.0
7CFDST716.423.5
8ST716.423.5
9CFDST819.564.0
10ST819.564.0
11CFDST922.784.5
12ST922.784.5
Disclaimer/Publisher’s Note: The statements, opinions and data contained in all publications are solely those of the individual author(s) and contributor(s) and not of MDPI and/or the editor(s). MDPI and/or the editor(s) disclaim responsibility for any injury to people or property resulting from any ideas, methods, instructions or products referred to in the content.

