Abstract
As urbanization accelerates and population structures change, healthcare buildings are becoming increasingly crowded. Predicting functional area demand is crucial to adapting to this trend and providing high-quality services. This paper introduces an innovative multi-stage method to forecast unbuilt projects using operational data from hospital information systems and building design models to automatically calculate spatial demands. The study’s main findings demonstrate that our method successfully outputs regional demand data, supporting hospital design validation and operational decision-making. Through processing and analyzing log data, this research identified the dynamic characteristics of user activities in hospital buildings and converted them into a time series data format. This method has iterative self-validation and self-optimization features and can maintain flexibility in different scenarios and frequently changing design drawings. This method will provide technical support for a wide range of hospital building stakeholders and has the potential to be applied to more types of buildings. These findings will contribute to various fields, including medical facility planning, design, and public health.
1. Introduction
With continuous urbanization, changing social population structures, and increasing emphasis on health, healthcare building spaces are becoming scarce, leading to overcrowded outpatient halls [1]. This negatively impacts patient satisfaction [2], medical service efficiency [3], and safety [4]. To address this issue, many large healthcare centers have adopted reconstruction and expansion measures to enhance infrastructure support for services [5]. Unfortunately, real-world evidence shows many failures in reconstruction spaces [6], resulting in the phenomenon of “crowded places remain crowded, while newly built places are deserted” [7,8]. The reasons for this phenomenon are complex. Hospital buildings are characterized by dense populations and complex processes, which distinguish them from other types of buildings and make them considered the most complex building type [9]. Compared to office buildings, shopping malls, and other public buildings, hospital buildings have higher population densities, and the scale effect brought by large-scale per capita gatherings impacts activity efficiency [10]. Compared to other high-density public buildings, such as airports and train stations, the internal processes of hospitals are extremely complex. Patients often need to obtain information and guidance for the next step after completing previous processes [11]. First, an understanding of user activities within healthcare buildings is lacking. The inherent complexity of medical processes [12] means healthcare buildings can accommodate many patients, and the time a single patient stays is longer than in most public buildings [13]. These factors result in diverse and numerous activities within healthcare buildings. Therefore, efficient and high-precision activity modeling methods are needed to understand patient activity patterns. Second, there is a lack of spatial demand prediction methods for healthcare building design plans. Although large healthcare centers have advanced information management systems and vast operational databases, these data are difficult to apply directly to architectural analysis. There is an information gap between the numerous names of medical activities and the complex functional areas of healthcare buildings [14], making direct transformation and identification difficult. Therefore, a data interface linking activity data with spatial data is needed, greatly enhancing computational efficiency and result quality.
Existing spatial demand prediction methods are mainly for built spaces [15]. They use integrated models combining computer simulation and augmented reality to simulate building scenarios [16], image processing of surveillance camera video combined with facial recognition to calculate spatial demands [17], or approximate spatial demands by counting device connections to indoor wireless network nodes [18]. However, these methods have high implementation costs and risks to their effectiveness. First, simulation-based modeling requires high-precision physical environment parameters and extensive modeling work [19]. This makes it difficult to maintain flexibility in continuously revised design schemes, as each modification requires significant adaptation time, hindering response to frequently changing design scenarios. Second, vision-based methods can only be deployed in built environments and cannot address design stage issues [15]. They are also significantly affected by device compatibility, cost, and coverage [20]. Third, wireless network-based methods also rely on built environments. Additionally, the invisibility and uncertainty of network coverage can cause significant statistical errors [21], affecting the reliability of the results.
Research on building spatial demand prediction currently faces the following challenges: (1) Spatial demand prediction for unbuilt spaces requires adaptability to flexible design schemes and frequent changes. (2) The complexity of user activities in healthcare buildings necessitates faster and more accurate activity modeling methods. (3) Direct data interfaces are needed to bridge the information gap between activities and spaces. (4) Flexible and lightweight approaches are required to meet the demands of various special scenarios, ensuring adaptability and robustness.
The structure of this paper is as follows: Section 2 reviews key studies and literature to identify the shortcomings of existing methods and their main challenges. Section 3 provides a detailed introduction to the fundamentals, principles, and operation of the relevant technical methods. Section 4 introduces a case study using real-world hospital operation data to demonstrate the methods’ effectiveness and efficiency. Section 5 presents and analyzes the case study results in phases. Section 6 reviews each stage of the method, explaining how it addresses current technical challenges and demonstrates advancements. Section 7 summarizes the study, analyzes its limitations, and proposes future research directions.
2. Literature Review
2.1. User Activities in Healthcare Buildings
User activities in buildings are categorized into three types: necessary activities, optional activities, and social activities [22]. Necessary activities are functional tasks to achieve a purpose within the building and are usually not influenced by the environment [23]. Optional activities occur only when conditions are favorable, typically in function-oriented spaces [24]. Social activities rely on the participation of others [25]. They aim to fulfill social interaction needs and do not affect achieving the primary purpose. In the context of healthcare buildings, essential activities mainly include medical consultations, examinations and tests, and emergency and urgent care. Patients and their families resting and relaxing in waiting areas, lounges, or green spaces are considered optional activities. Social activities encompass patient and family visits, peer interactions, and patient-provider communication. Healthcare building design mainly focuses on patients and medical staff, with a significant disparity in their quantity ratio [1]. At the same time, healthcare building design has shifted from focusing on sustainable medical functions to “patient-centered” services with the continuous iteration of medical concepts [23]. This research aims to analyze user activities to predict spatial demands and guide building design plans, focusing on the necessary activities of patients.
Patient activities in healthcare buildings are extremely complex. This complexity arises from the interplay and interaction of various factors, including patient types, medical processes, resource allocation, and time dynamics. Typically, healthcare organizations intensively use Health Information Systems (HISs) to store process execution data, which serve as valuable information sources for recording patient activities [26]. During the execution of a process, several entries in the HISs are recorded (e.g., when a patient was registered or was subject to a clinical examination by a physician). The entries in the databases of these HISs can be leveraged to generate an event log describing the sequence of activities that were performed, when they were executed, by whom, and for whom (e.g., for which specific patient) [27], thereby accurately reflecting how a process is executed in reality. Process mining techniques have proven to be valuable in addressing process-related issues. Process mining is a set of techniques used in many domains, including healthcare, to retrieve valuable insights from an event log [28].
In existing research, the application of process mining in healthcare is primarily used for exploring clinical pathway process variations [29], modeling disease trajectories [30], identifying deviations in care pathways [31], identifying bottlenecks in medical processes [32], and analyzing the collaboration of doctors and healthcare professionals [33]. It can be observed that the detailed information about patient activities obtained from process mining remains confined to the study of process-related issues and has not been extended to link with architectural spaces [34].
Moreover, existing research on medical processes often focuses on patient activity modeling and process optimization, such as optimizing medication processes and developing optimal treatment decision frameworks [35]. However, key issues remain. The applicability of static activity models in healthcare building scenarios needs further verification [36]. Studies that only optimize processes overlook critical spatial resources, losing the service system’s integrity. Therefore, we need to model patient activities over time and verify the dynamic nature of activity patterns to better understand real patient activities in healthcare buildings. Additionally, we must consider space as a resource, incorporating spatial information into the study to complete the activity-space mapping process.
2.2. Healthcare Buildings Spatial Demand
Predicting building space demands is crucial for design and resource optimization [37]. Due to the high costs and significant workload associated with building renovations, predicting space demands for unbuilt design schemes has greater value [38]. However, some existing methods rely on deploying relevant technical frameworks and necessary equipment in built environments [20]. For example, spatial demand statistics based on wireless radio frequency networks [21] and spatial occupancy calculation algorithms based on computer vision [17]. To better realize the value of prediction, we must develop methods for unbuilt design schemes in the design stage.
Simulation modeling is a common method for predicting spatial usage requirements for unconstructed buildings [37]. By using simulation modeling to forecast spatial usage needs, designers can gain forward-looking design support, pre-identify potential design issues, and avoid major future modifications [37]. However, the application of simulation modeling in spatial demand prediction also faces significant challenges and limitations. On the one hand, creating high-precision simulation models requires substantial computational resources and technical knowledge [39]. It also involves a complex process of model validation and calibration, which similarly demands extensive real-world data and expert judgment. On the other hand, although commercial simulation platforms provide convenience for model construction and operation, their preset frameworks may limit user flexibility and the ability to customize for specific needs [40].
Existing research also emphasizes the importance of accurate demand prediction for different types of buildings [41]. In healthcare buildings, functional area layout directly impacts medical activity efficiency, affecting patient visit efficiency, effectiveness, and satisfaction [2,3]. As the most complex type of public building, the spatial demand within healthcare buildings is influenced by medical processes, the needs of specialized equipment, and the complexity of obstacles [6], presenting significant challenges. We need realistic and accurate patient activity models for more reasonable and meaningful predictions.
2.3. Architectural Ontology
Architectural ontology is a foundational framework for modeling and understanding complex building systems and environments, primarily including concepts such as architectural entities, environmental elements, abstract concepts, architectural attributes, and architectural systems [42]. These concepts structure and categorize architecture knowledge for statistical analysis and output [43]. Architectural ontology provides a common language for precise architectural modeling, enhancing the understanding of architectural entities, components, and their interactions, thus improving integration and coordination between building users and systems [44]. Architectural ontology plays an important role in describing, deconstructing, optimizing, and reasoning within architectural systems [45].
Based on architectural ontology, we can map relationships between architectural elements and abstract concepts, including building users, user activities, and building spaces [46]. Architectural ontology contextualizes data related to building spaces and user activities [44], bridging the semantic gap between activity models and specific architectural components, and determining the “support-utilization” relationship between spaces and activities [47]. Research based on architectural ontology emphasizes understanding factors such as user activities, goals, methods, resources, time, location, and stakeholders, demonstrating its capability to capture the complex connections between spaces and activities [47,48].
Architectural ontology provides a strong theoretical foundation for our research. However, for complex user activity and environmental models, we need to explore implementation paths based on architectural ontology to achieve efficient and lightweight spatial demand prediction. This will help adapt to more complex research scenarios and further leverage the theoretical value of architectural ontology.
3. Methodology
This research proposes a multi-stage method for predicting spatial demands in healthcare buildings using multidimensional log data from the hospital information system (HIS). The conceptual flowchart of this method is shown in Figure 1. The first stage describes the process of processing raw logs from the HIS system into time series sub-logs, including data filtering, cleaning, structuring, and segmentation. The second stage outlines the secondary development of process mining algorithms to balance simplicity and generality, as well as the validation process of the output activity model using the original log data. The third stage discusses the process of automatically constructing the mapping relationship between activities and spaces based on the building information platform. Additionally, a detailed description of the information interaction and transmission processes between each stage was provided, including the iterative process between the first and second stages and the integration process between the second and third stages.
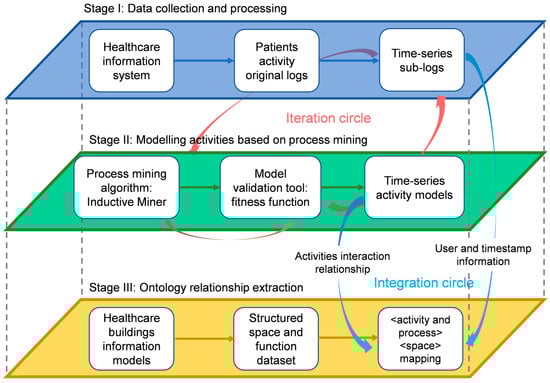
Figure 1.
Conceptual flowchart of multi-stages method.
3.1. Data Collection and Processing
The dataset is derived from patient activity-related data generated by the HIS during daily operations. The data include records of registration, consultation, surgery, examination, and payment, typically distributed across multiple database tables. Since these log tables come from different information management systems, their statistical dimensions differ. The key dimensions required for process mining include personnel, timestamps, and activities: personnel distinguish the participants in activities, timestamps identify the specific times activities occur, and activities are described and distinguished by their names [49]. Therefore, only tables with these three key dimensions will be included in our study. To integrate multiple tables and generate a unified log, personnel and timestamps are used as index keys across different tables to compile activity names from various forms.
Since the datasets are stored in databases, they inevitably exhibit issues such as structural anomalies, misalignment, missing values, and errors [50]. To address these issues, we cleaned the data, corrected structural anomalies, and obtained a complete log file.
Next, to capture patient activity dynamics, time series segmentation is performed on the complete log file. To uniformly process the data, date information is discarded and only specific activity times are retained. The study time range is defined based on the regular operating time window of the hospital, which is the time period with the most comprehensive and frequent crowd activities [51], and ignores activities outside this time range. The logs are segmented into hourly sub-logs, each containing activities within the same hour on different dates. This approach better accommodates dynamic activity models and provides high-quality data for process mining and activity dynamics verification [52].
All data processing is implemented using a time series segmentation algorithm developed in Python 3.8. For algorithm details, see Figure 2. Each activity in the log is added to the sub-log indexed by its time range. When the log indices of two adjacent activities differ, the action linking the two activities is considered to span sub-logs. These actions may include wayfinding, movement, and waiting. Handling actions that span sub-logs is a main challenge during time series segmentation, as it’s difficult to determine which sub-log a cross-log action should be placed in. The integrity of activities within sub-logs must be ensured to avoid data and information loss during segmentation. The advantage of large-scale datasets was leveraged by compiling the duration sets of all action types formed by adjacent activities in the dataset. The shortest duration of each action type is regarded as the necessary, irreducible duration. Based on this, the following Identification-Evaluation-Insertion framework is used to handle activities that span across sub-logs:
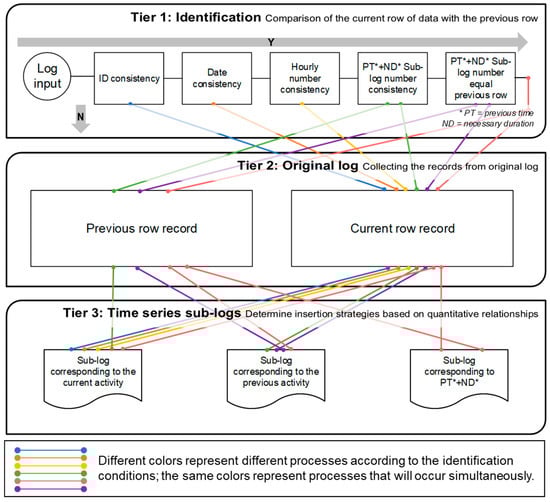
Figure 2.
Principle of the log data time series segmentation algorithm.
- Identification: Identify cross-log actions through the first three steps of the time series segmentation algorithm, including consistency checks of the anonymized ID, date, and sub-log index between log rows.
- Evaluation: If identified, add the activity timestamp of the previous row to the necessary duration and determine the sub-log index.
- Insertion: Determine the strategy for inserting activities into logs based on the sub-log index.
The insertion strategy is determined based on data relationships. If the previous activity’s end time plus the necessary duration equals the current log’s sub-log index, add the log records to both sub-logs. If the previous activity’s end time plus the necessary duration equals the previous log’s sub-log index, it indicates the action ended in the previous period. Thus, both log entries should be added to the previous row’s sub-log, while the current log entry should only be added to the current row’s sub-log. If the previous activity’s end time plus the necessary duration does not match either the current or previous log’s sub-log index, add two log entries to both sub-logs, and add the current log entry to its sub-log. By using this method, large and complex logs can be transformed into multiple time series sub-logs, laying a solid foundation for in-depth data analysis and research.
3.2. Fitness-Based Iterative Logic of the Process Mining Algorithm
Time series sub-logs of patient activities have been collected. Since these data are sourced from real operational records, the recorded activity types are vast and complex. From a building layout design and evaluation perspective, high-frequency behaviors significantly impact user comfort and satisfaction [53]. Low-frequency and special behaviors are usually due to temporary accessibility restrictions [54], specific needs, or a lack of proper education and guidance [55]. Therefore, to ensure the efficiency of subsequent calculations and analyses, representative patient behavior patterns should be retained, and a concise and comprehensive behavior model is needed to support our research.
This study proposes a new method called the Fitness-based Iterative Logic of Process Mining Algorithm (FILPMA), aimed at extracting concise and fitting behavior data. The basic operational logic is shown in Figure 3. Multiple time series segmented sub-logs were sorted by time and converted into the XES log format recognizable by process mining algorithms [56]. These log files recorded data in three dimensions: anonymized ID, timestamp, and activity, as shown in Table 1.
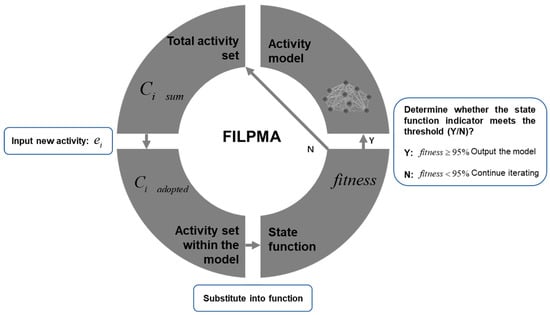
Figure 3.
Fitness-based iterative logic of process mining algorithm (FILPMA).

Table 1.
XES log file format.
FILPMA extracts key paths from each sub-log, attempting to find a balance between simplicity and fit to determine optimal fitness. In the activity model, activities are defined as places, representing patient medical activities at specific space points, such as registration, consultation, imaging examination, etc. Actions between activities are defined as transitions between places, including necessary steps such as wayfinding, movement, and waiting between activities [57], for example, from registration to consultation, from examination to consultation, and from consultation to pharmacy. The diversity of activities significantly impacts the model’s complexity, with incremental fitness decreasing as the number of activities in the model increases. When the fitness reaches 95%, the iteration will stop to ensure the statistical integrity of the behavior model [58].
PM4Py is an open-source process mining tool based on Python [56], including various algorithms such as process discovery, conformance checking, and process enhancement, suitable for managing complex process scenarios. This study applies the Inductive Miner algorithm from PM4Py, known for its high reliability and excellent capability to handle noise and low-frequency activities [59], to obtain the process model generated by each iteration of FILPMA. Then, an alignment-based technique is used to compare each process model with the event log. This process will review the original log data and individually check whether the connections between the log data can be correctly expressed in the model [60]. The aim is to verify the completeness of the modeling by using the ratio of the original log data presented in the model, which serves as a criterion for terminating the FILPMA iterative process, and is calculated and compared in each iteration. The fitness metric calculated using Equation (1) represents the alignment of the event log sequence relative to the process model sequence, measuring the similarity between the activity sequences in the event log and those allowed in the process model. is defined as 1 minus the ratio of the total cost of inserting or skipping activities to the total cost of treating all events as inserted activities [61], where and represent the cost functions for skipping and inserting activities, respectively. represents the event sequence of case , all inserted events are denoted by , denotes the function linking events to the log, and skipped activities are marked as . Therefore, ranges from 0 to 1, with higher values indicating closer alignment between the process model and the log.
3.3. Activity Dynamics Analysis
From the log files, a time series of patient activity models was obtained. Each sub-model carries key information, including the activities, the links between them, and the iteration count when each activity was included in the model activity set. This information represents the importance of activities in the sub-models. To verify if the activity model exhibits dynamics, all sub-models in the set are compared. If the patient activity model is robust over time, the differences in activity types and the iteration counts across sub-models should be small. Conversely, significant differences would prove the existence of dynamics in the patient activity model over time. To more intuitively display and compare the presence and importance of different activity types over time, an activity-time matrix was constructed, and matrix visualization was used for numerical and visual judgment [62]. As shown in Figure 4, the characteristics of activity types in different time series sub-models can be analyzed:
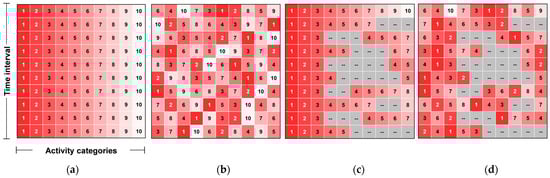
Figure 4.
Schematic diagram of dynamic characteristics in activity-time matrix. (a) No dynamics; (b) Activity sequence dynamics; (c) Activity type dynamics; (d) Dual dynamics of activity type and sequence.
- Activities included in the model are colored in the matrix, while activities not included are gray. Therefore, the color change of the same activity in different sub-models can determine the dynamics of a single activity type over different periods.
- Higher-importance activity types in sub-models are assigned darker colors. If the same activity has the same color over different periods, it indicates the absence of dynamics. Conversely, different colors indicate dynamics.
- Dynamics can exist both in activity types and their sequence. If the matrix visualization shows color types and variation degrees that do not conform to a pattern of no dynamics, it indicates the existence of dual dynamics in activity types and sequences.
3.4. Information Extraction Based on Architectural Ontology
According to the medical process design scheme, each patient activity is assigned a corresponding functional space [6]. The set of functional spaces involved in all patient activities is denoted as , with a quantity of . The mapping process from activities to spaces is denoted as , which is knowledge-based and natural, such as mapping the medication pickup activity to the pharmacy. Based on the set of activity pairs and , the space demand point pair set can be obtained, along with the number of space points in the set . Starting from the building and entity definition , represents the building, represents the floor plan, which includes functional spaces and traffic spaces , and represents the set of vertical transportation tools within , which may include elevators, escalators, stairs, ramps, etc.
In a complete BIM model, spaces formed by the combination of building components are assigned individual attribute information, such as dimensions, area, material, functional use, etc. [63]. Among these attributes, functional use is inferred and summarized by designers based on their knowledge, design experience, and successful practice cases [64]. The number of spaces with different functional uses should be directly related to the space demand required by various activities. Therefore, the connection between space and its functional use information will become an ideal “key” for linking spaces and activities. The IFC format files of BIM have good compatibility and extensibility, enabling automated calculation of the ontological relationship between space and activities based on information extraction [65], which will also become the knowledge foundation for establishing the mapping network.
This tool is based on the secondary development and application of the BIM model on the Autodesk Revit platform, which is the most widely used basic modeling software in the BIM series [66]. The working principle of the plugin and the process of data flow are shown in Figure 5. The preprocessing of the BIM model mainly involves using Revit’s “room tag” feature to label functional spaces, traffic spaces, and vertical transportation facilities within the building, while adding category attributes to “rooms” to distinguish the three types of spaces, facilitating subsequent plugins to extract spatial information as needed. The three types of space category attributes are labeled as , and . The preprocessing operation on the BIM model is denoted as . To overcome data interoperability issues between Revit and other platforms, enable automated analysis of the adaptability between spatial layout and patient activities, and provide many application extension possibilities, a Revit-based plugin was developed. This plugin automates the extraction of relevant information from IFC format BIM models. The plugin was developed using the C# programming language on the Visual Studio platform. The operation process of extracting information using the plugin is denoted as , therefore, . Notably, during the C# coding stage, the robustness against BIM 3D modeling errors was not considered. Specifically, the plugin does not account for controlling potential errors in IFC files, such as unclosed walls and columns or excessive wall overlaps. These flaws are not intentional by the modeler; errors in information extraction due to modeling errors can be manually corrected.
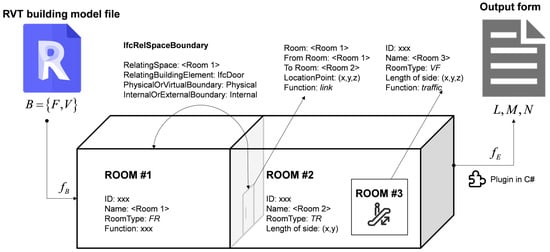
Figure 5.
Storage format and processing of building information.
3.5. Data Integration Based on the Mapping Network
This research uses ontological thinking to define and analyze the coupling of space and process, as well as the impact of this coupling on user behavior. An ontology is an explicit specification of a conceptualization [67], including the definition of concepts and their relationships. Together, they form a structural interpretation of objective entities within a specific domain [68]. The key utility of ontology is its deconstructive interpretation of relevant knowledge to improve communication between humans or between humans and computers [68]. A typical example is the application of ontology in the field of construction engineering. By representing the specialized knowledge in this field using ontology, it can be stored and analyzed through computer modeling, enabling compatibility between computer modeling and automatic identification [44,47].
User activities in the hospital service system are represented as a <user><activity and process><space> (UAS) tuple:
- User: The subject of user activity, identified individually by an anonymized ID.
- Activity and process: The specific content of user activities and the sequence of multiple activities.
- Space: The space required for the activities.
The user-activity mapping relationship has been detailed in the visit logs. Based on this mapping relationship, process mining processes were performed to achieve efficient and concise activity modeling. To complete the user-activity-space mapping, the attributes of the activity-space mapping need to be defined. Space and facility requirements are used to match user activities with spaces, while medical behavior space requirements describe the matching relationship between medical behaviors and hospital functional spaces. The complete mapping relationship network is shown in Figure 6.
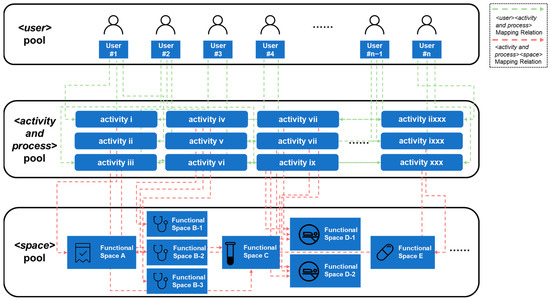
Figure 6.
Schematic diagram of user-activity-space mapping network.
Through the integrated application of process mining technology and ontology-based BIM information extraction, a two-stage mapping relationship between user-behavior and behavior-space can be achieved. These two mapping relationships are automatically achieved by inputting visit logs and BIM models, thus making the entire process automated. The <user> pool provides frequency and timestamp information for the prediction, the <activity and process> pool provides activity type information, and the <space> pool provides endpoint coordinates and floor attributes of functional spaces for the prediction process. Through the <user><event and process> mapping process based on process mining and the <activity and process><space> mapping process based on ontology, various types of information can be identified, integrated, and transformed.
4. Case Study
In this research, we conducted a case study to evaluate the practical value of our method. The case involves a hospital in Shanghai, China, with over 100 years of history and significant influence, which is planning to build a comprehensive building on its new campus. The new campus construction is expected to be completed within five years, aiming to distribute high-quality medical resources and alleviate the existing operational pressure. Since no new departments will be added on the new campus, the patient log data from the old campus has direct guidance for the design of the new campus [1]. Using data from the old campus, the layout plan of the new campus is aimed at being validated, and reliable data support is provided for the performance of the new campus’s spatial design in meeting the needs of the old campus’s patients.
In the current design plan, the comprehensive building on the new campus consists of 9 floors, with the 1st and 2nd floors designated as outpatient areas and the remaining floors as inpatient wards. The outpatient area focuses on three departments: obstetrics, Chinese medicine, and rehabilitation surgery. The design floor plan for the case project is shown in Figure 7.
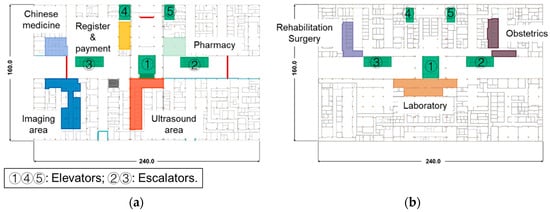
Figure 7.
Floor plans and functional area definitions of the case building. (a) 1st floor plan; (b) 2nd floor plan.
The HIS system of this hospital contains comprehensive electronic health records of patients, ensuring the transparency and traceability of the medical services received by patients in the hospital [69]. It also provides a basis for the hospital’s financial and operational management, making it an ideal dataset for modeling patient activities [70]. By accessing the HIS system, all outpatient records from these three departments from November 1 to 15, 2021, including registration, consultation, surgery, imaging examination, and payment, totaling 104,783 records, were collected. Descriptive statistics on this dataset were conducted. As shown in Figure 8, the number of activities, when sorted in a time series, exhibits significant dynamic characteristics and patterns of change, which fully align with the regular operational patterns of a hospital [71].
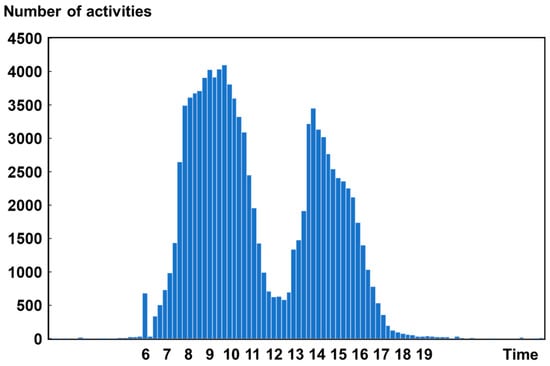
Figure 8.
Trends in the number of activities over time of the case dataset.
5. Results
In this section, the stages of the methodology were tested and validated using the case study, and the output results were analyzed from a practical demand perspective.
5.1. User Time Series Activity Model
By accessing the HIS system of the case hospital, the electronic health records of all patients from three departments were downloaded. Using scripts written in Python 3.8, the dataset was first cleaned, identifying and handling missing values and significant error records in the dataset. Since each electronic health form includes at least an anonymous ID representing patient identity and a timestamp representing time information, these become the ideal keys for linking different forms. This resulted in a complete and practical dataset, providing high-quality data input for subsequent process mining.
The FILPMA was used to identify concise and highly fitting activity models. The study’s time window was set to the regular hospital outpatient operating hours from 8 AM to 5 PM, a total of 9 h. Thus, the original log segmentation algorithm was run with a step size of 1 h, resulting in 9 sub-logs. The different time interval sub-logs are imported individually into the iterative mining logic to construct the corresponding activity models. According to our definition of FILPMA, a new type of activity is included in the model with each iteration, so the number of iterations is equal to the number of activity types in the model. As the iterations proceed, the number of activities increases, and the fit index also changes. This helped determine the most concise behavior model with a fitness exceeding 95% for each sub-log. The relationship between iteration counts and fitness metrics is shown in Figure 9. The behavior models of each sub-log, shown in Figure 10 as directed networks, reveal the uniformity and dispersion of patient behaviors over different time intervals.
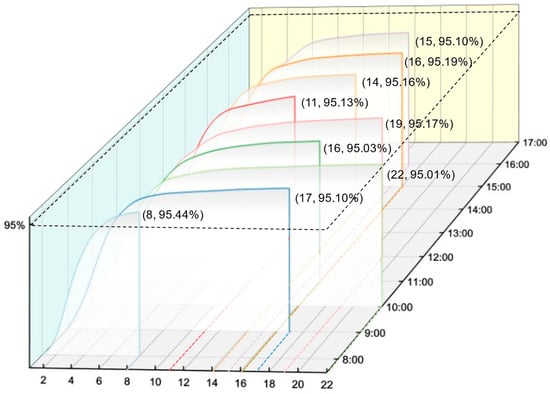
Figure 9.
Relationship between sub-model iteration count and fitness.
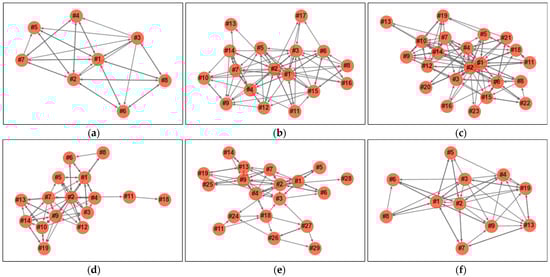
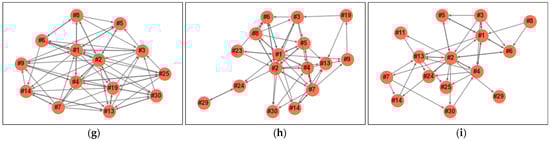
Figure 10.
Patient activity sub-models for different time intervals. (a) 8 AM–9 AM; (b) 9 AM–10 AM; (c) 10 AM–11 AM; (d) 11 AM–12 AM; (e) 12 AM–13 PM; (f) 13 PM–14 PM; (g) 14 PM–15 PM; (h) 15 PM–16 PM; (i) 16 PM–17 PM.
In the patient behavior sub-models, the proportion of behavior types relative to the total number of behavior types varied between 3.08% and 8.49%. The data corroborate the Pareto effect in large process datasets [72], where a smaller proportion indicates more uniform patient behavior during that period, while a larger proportion reflects the diversity of behavior types [73]. This further proves the necessity of introducing process mining in the analysis of medical buildings, as it will help us significantly reduce computational complexity while obtaining important data results [60]. Through this analysis, the patterns and changes in patient behavior would be better understood, providing a scientific basis for improving medical processes and resource allocation.
5.2. Activity Dynamics and Characteristics
To visually assess the activity dynamics in the case study, a statistical analysis of the activity types and their frequency rankings within the time series sub-models was conducted. For ease of observation, we statistically analyzed and encoded the activities appearing in each time series sub-model. There are 30 activities, with their codes and corresponding names listed in Table 2, forming the activity-time range matrix shown in Figure 11.
Table 2.
Activity type coding.
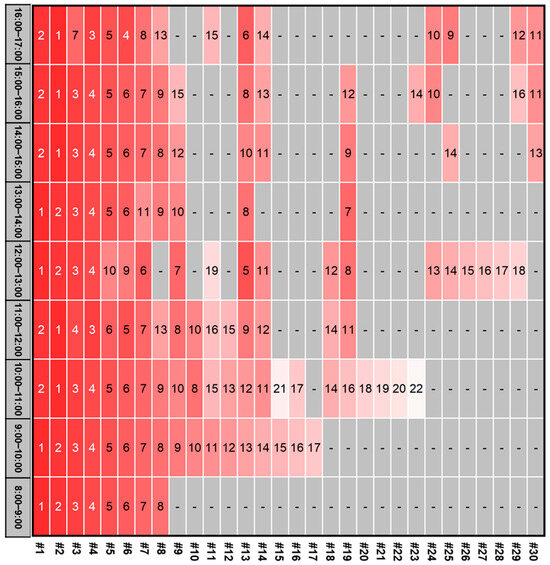
Figure 11.
Activity-time interval matrix of case building.
Observing the matrix, it is evident that the activities in the case study exhibit dual dynamics in type and sequence. The iteration count for each sub-model differs, indicating significant variations in the number of activities included in each sub-model. This reveals that the types of activities frequently switch between convergence and divergence during a day of hospital operations, displaying significant characteristics. For example, between 8–9 AM and 1–2 PM, which are the first time slots of the hospital’s morning and post-lunch operations, the types of patient processes are more homogenized, mostly consisting of registration, consultations, and other activities at the beginning of the medical process. As time progresses, the types of activities in the sub-models gradually diverge, with more examination items gradually emerging. Additionally, at 8:00 AM, the hospital’s starting time, many patients focus on activities like medication pickup, registration, and consultation, which do not require prior activities. As time progresses, various activities dependent on doctor recommendations and prescriptions, such as imaging examinations and blood tests, gradually emerge, causing dynamic changes in activity types and sequences [71]. Additionally, these changes are influenced by the schedules of popular doctors and the reception times for specific examinations [74].
5.3. Activity-Space Mapping Relationship
To obtain designers’ functional setup plans for different functional areas within the building and model them in a computer-recognizable data structure, the “one-to-several” relationship between activity data and space data needs to be resolved. For example, the <registration> and <payment> activities correspond to the same functional space <register & payment>, while the <consultation (rehabilitation surgery)> activity corresponds to 7 rehabilitation surgery doctor offices. Therefore, the activity-space correspondence needs to be exported in a mapping relationship form that the computer can automatically construct and recognize.
The RVT format model file of the case project was opened in Revit 2022 and our plugin was loaded in the external plugin management options to export the model data. The exported results are shown in Table 3. Since this study focuses only on functional space areas, the table includes only data for spaces of the specified type.
Table 3.
Activity-space mapping relationship.
The table clearly shows the inclusion relationship between functional areas and related rooms, allowing precise location of each room through coordinates and determining the area range based on the locations of different functional rooms within the same area. Additionally, based on the Function tab, the activity frequency in the time series activity sub-models can be mapped to the demand for functional areas. By fully utilizing the timestamp information from the log data and the activity type information from the activity models, the dynamics are preserved through data integration and time series data structures. This adds a time dimension to spatial demand prediction, making the output data more valuable.
5.4. Spatial Demand
To more intuitively support hospital designers and managers, the data were visualized using a timeline format, showing spatial demand variations across different areas over time through color changes, as illustrated in Figure 12. Additionally, the hourly demand data for each area can be obtained. Since the case dataset spans 15 days, calculating the mean provides convincing hourly demand data.
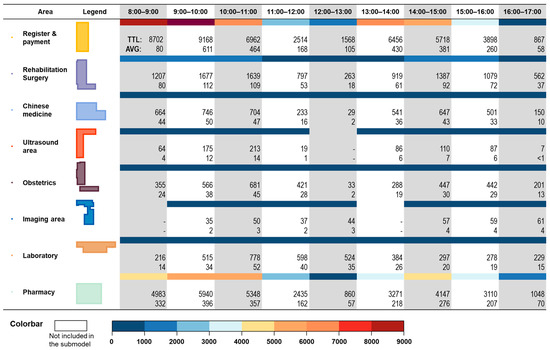
Figure 12.
Spatial demand quantity in time series.
The data show that public areas, such as the <register & payment> area and the <pharmacy> area, have significantly higher demand than various departments and examination areas. This is because almost all patient visits involve these two areas, which confirms that in medical building design, the registration and payment area and pharmacy area are usually designed with more service windows and closer to entrances to reduce user wayfinding time [75]. Hourly time series data provide designers with more robust design verification support. Designs based on total demand and averages may struggle to handle extreme situations during peak demand periods. Therefore, designers should validate and optimize their designs based on peak demand to ensure patient needs are met during peak times. By outputting data in a fine-grained matrix format, flexibility in the results is maintained, enabling various dimensions and levels of data analysis based on different scenarios, thereby maximizing value.
6. Discussion
This research proposes a systematic multi-stage method to address various challenges faced in predicting demand for different areas in healthcare buildings, achieving an efficient and automated extraction process, and delivering practical results. Through the systematic adaptation and implementation of the case project, this method has demonstrated its effectiveness.
To address the complexity of user behavior in medical buildings, this research used data from hospital operations to mine activity models of building users. This data-driven method preserves potential information and activity patterns in real data, avoiding the negative impacts of empirical cognitive limitations and individual biases [76]. Additionally, the FILPMA method can segment datasets by time series, ensuring information integrity while sequentially mining behavior models over different periods to verify the activity dynamics. Third, this method can handle rare records and noise in real data, find the optimal balance between model completeness and simplicity, and adaptively output applicable activity models based on dataset characteristics.
In bridging the information gap between behavior data and space data, this study uses architectural ontology thinking, integrating the distinct functionalities of various areas in healthcare buildings to align activity data with spatial demand data. Revit was applied as the building information platform and developed a plugin in C# to automate the identification and output of various area attributes (including names, coordinates, dimensions, and functions) in the building model, simplifying the process for designers to obtain functional layout plans and providing key technical support for data conversion.
In handling behavior dynamics, timestamps in the log data were utilized for statistical analysis, adding a time series dimension to the data. The timestamp information in the log dataset provides a basis for time series analysis, and research has confirmed the existence of activity dynamics [71]. More granular time series data will help capture more detailed information in building operations, aiding designers and building managers in gaining a deeper understanding of design plans, thereby greatly enhancing the practicality of the results.
This method is data-driven, requiring only log data and building information models as input conditions to produce results through an automated process. Therefore, it can demonstrate strong adaptability to frequent design changes. When design plans face validation and decision-making issues, this method can convert graphical drawings into data-driven output results, providing more direct technical support for stakeholders like hospital managers, designers, and operation managers. Additionally, it can provide feasibility validation for new ideas. For areas with high spatial demand, process-level improvements such as online appointment registration can be considered to fundamentally reduce demand [77]. Distributed layout methods can also be considered to achieve demand diversion [78], such as setting up pharmacies on multiple floors based on the needs of different departments. When the building information model is updated, this method will promptly assist in validating the effectiveness of the new design.
This method has the ability to self-validate and optimize the output results. Among the three stages of this method, there is an iterative process of process mining algorithms between stage 1 and stage 2, which will continuously utilize the log data to calculate the activity model and then validate the reliability of the model by using the computed fitness metrics of the activity model with the log data. In our case, the iteration termination threshold was set at 95% to obtain statistical comprehensiveness and to obtain relatively concise models to reduce computational complexity in highly complex medical processes. The iterative termination threshold can be adapted to generalize the method to application scenarios and practice problems. Between the second and the third stages is the automated process of constructing the relationship network and mapping matching based on the activity model and the building information platform. The robustness of this part can be guaranteed for the vast majority of the time, but it will be affected by the reliability of the building information model, which will face objective impacts such as accidental errors in the designers’ manual modeling [79]. This is not the intention of the designers, and the errors and outputs can be identified and then corrected manually.
The method has been successfully deployed in a case study of complex healthcare buildings and has generated valuable data for design and operation. The relationships between processes may be dependent, disordered, and repetitive, which is more uncertain than events with strict schedules like boarding a plane or catching a train. At the same time, the flow within the outpatient complex accounts for a large percent of the entire hospital flow, making it a key healthcare building type for space requirement studies [80]. Fortunately, hospitals are public buildings with highly developed information management systems. Key indoor processes typically generate relevant data records in the system, enabling the possibility of modeling complex activities through data mining. Therefore, this method will have the potential to be valuable in other building types but will need to face the challenge of modeling activities with high accuracy, and obtaining structured data on user activities in other types of public buildings may require further equipment deployment or policy support [81].
7. Conclusions
Predicting spatial demand in healthcare buildings is highly valuable for design and operation. It serves as an important technical support in decision-making processes and positively impacts patient satisfaction and treatment efficiency. Current methods face challenges such as the complexity of user activities, the disconnection between activity data and space data, the high costs of supporting facilities, and technical difficulties. This study developed a forward-looking and automated multi-stage method. The method integrates innovative applications of process mining algorithms and secondary development of building information software, using data-driven methods and evidence-based design thinking to ensure the reliability of results from the perspective of source data. We applied the method using large-scale data from real cases, demonstrating its good adaptability and stability through the deployment of the method. This will provide significant technical support for designers and managers, promoting building management towards greater automation and intelligence.
This research still has some shortcomings and limitations. First, due to the difficulty of obtaining actual hospital operation data and the large volume of data, this study used 15 days of operation data from one hospital as a case. This might make the results influenced by its characteristics difficult to directly apply to other healthcare buildings. Nevertheless, we still believe that the data have proven the method’s capability and efficiency. While the output results may not be widely generalizable, the method itself can adapt to more application scenarios and practical projects. Secondly, to ensure the method’s flexibility and allow for expansion with continuous technological iteration, this method is developed primarily based on code interfaces, integrating the two mainstream programming languages, Python and C#. This increases the understanding and usage threshold. In the future, we will try to adopt windowed and graphical user interfaces to make the method more accessible and easier to apply.
This method has strong potential for future, in-depth research. On one hand, it can achieve more efficient and accurate data prediction through the continued optimization of existing methods, such as finer time and space granularity. On the other hand, it can achieve more functionalities through integration with other technologies, such as combining with indoor positioning technology or indoor navigation algorithms to realize real-time location prediction of building users, and combining with optimization algorithms to achieve the automatic optimization process of design plans.
Author Contributions
Conceptualization, Y.L. and H.C.; methodology, Y.L. and H.C.; software, H.C.; formal analysis, H.C. and Y.Z.; investigation, Y.Z.; resources, Y.L.; data curation, Y.S.; writing—original draft preparation, H.C.; writing—review and editing, Y.L. and Y.Z.; visualization, Y.S.; supervision, Y.L. and Y.Z.; project administration, Y.L. All authors have read and agreed to the published version of the manuscript.
Funding
This research was funded by The Fundamental Research Funds for the Central Universities, Zhongnan University of Economics and Law, grant number 31514110509.
Data Availability Statement
Data will be available on request.
Conflicts of Interest
The authors declare no conflicts of interest.
References
- Mead, M.; Ibrahim, A.M. Strategies to evaluate the quality of hospital design with clinical data. J. Hosp. Med. 2023, 18, 538–543. [Google Scholar] [CrossRef] [PubMed]
- King, D.M.; Vakkalanka, J.P.; Junker, C.; Harland, K.K.; Nugent, A.S. Emergency Department Overcrowding Lowers Patient Satisfaction Scores. Acad. Emerg. Med. 2021, 28, 363–366. [Google Scholar] [CrossRef] [PubMed]
- Ferreira, D.; Marques, R.C. Identifying congestion levels, sources and determinants on intensive care units: The Portuguese case. Health Care Manag. Sci. 2018, 21, 348–375. [Google Scholar] [CrossRef] [PubMed]
- Gorski, J.K.; Arnold, T.S.; Usiak, H.; Showalter, C.D. Crowding is the strongest predictor of left without being seen risk in a pediatric emergency department. Am. J. Emerg. Med. 2021, 48, 73–78. [Google Scholar] [CrossRef]
- Carrier, E.R.; Dowling, M.; Berenson, R.A. Hospitals’ Geographic Expansion in Quest of Well-Insured Patients: Will the Outcome Be Better Care, More Cost, Or Both? Health Aff. 2012, 31, 827–835. [Google Scholar] [CrossRef]
- Cubukcuoglu, C.; Nourian, P.; Tasgetiren, M.F.; Sariyildiz, I.S.; Azadi, S. Hospital layout design renovation as a Quadratic Assignment Problem with geodesic distances. J. Build. Eng. 2021, 44, 102952. [Google Scholar] [CrossRef]
- Bazzoli, G.J.; Gerland, A.; May, J. Construction Activity in U.S. Hospitals. Health Aff. 2006, 25, 783–791. [Google Scholar] [CrossRef] [PubMed][Green Version]
- Zhang, Z.; Měchurová, K.; Resch, B.; Amegbor, P.; Sabel, C.E. Assessing the association between overcrowding and human physiological stress response in different urban contexts: A case study in Salzburg, Austria. Int. J. Health Geogr. 2023, 22, 15. [Google Scholar] [CrossRef] [PubMed]
- Hartmann, S.; Gossmann, D.; Kalmuk, S.; Klemt-Albert, K. Optimizing Interfaces of Construction Processes by Digitalization Using the Example of Hospital Construction in Germany. Buildings 2023, 13, 1421. [Google Scholar] [CrossRef]
- Schaumann, D.; Breslav, S.; Goldstein, R.; Khan, A.; Kalay, Y.E. Simulating use scenarios in hospitals using multi-agent narratives. J. Build. Perform. Simul. 2017, 10, 636–652. [Google Scholar] [CrossRef]
- Grimaz, S.; Ruzzene, E.; Zorzini, F. Situational assessment of hospital facilities for modernization purposes and resilience improvement. Int. J. Disaster Risk Reduct. 2021, 66, 102594. [Google Scholar] [CrossRef]
- Liu, C.; Li, H.; Zhang, S.; Cheng, L.; Zeng, Q. Cross-Department Collaborative Healthcare Process Model Discovery from Event Logs. IEEE Trans. Autom. Sci. Eng. 2023, 20, 2115–2125. [Google Scholar] [CrossRef]
- Domingo, N. Assessment of the Impact of Complex Healthcare Features on Construction Waste Generation. Buildings 2015, 5, 860. [Google Scholar] [CrossRef]
- Rubio, A.; Vidal-Abarca, E.; Serrano-Mendizábal, M. How to assist the students while learning from text? Effects of inserting adjunct questions on text processing. Instr. Sci. 2022, 50, 749–770. [Google Scholar] [CrossRef]
- Liang, Y.; Huang, G.; Zhao, Z. Joint demand prediction for multimodal systems: A multi-task multi-relational spatiotemporal graph neural network approach. Transp. Res. Part C Emerg. Technol. 2022, 140, 103731. [Google Scholar] [CrossRef]
- Shouman, B.; Othman, A.A.E.; Marzouk, M. Enhancing users involvement in architectural design using mobile augmented reality. Eng. Constr. Archit. Manag. 2022, 29, 2514–2534. [Google Scholar] [CrossRef]
- Jung, S.-U.; Nixon, M.S. On Using Gait to Enhance Frontal Face Extraction. IEEE Trans. Inf. Forensics Secur. 2012, 7, 1802–1811. [Google Scholar] [CrossRef]
- Castañón, M.; Salazar, A.S.; Aguilar, L.; Gaxiola-Pacheco, C.; Licea, G. A Novel Hybrid Intelligent Indoor Location Method for Mobile Devices by Zones Using Wi-Fi Signals. Sensors 2015, 15, 30142–30164. [Google Scholar] [CrossRef] [PubMed]
- Hunt, R.J.; White, J.T.; Duncan, L.L.; Haugh, C.J.; Doherty, J. Evaluating Lower Computational Burden Approaches for Calibration of Large Environmental Models. Groundwater 2021, 59, 788–798. [Google Scholar] [CrossRef]
- Sung, C.-S.; Park, J.Y. Design of an intelligent video surveillance system for crime prevention: Applying deep learning technology. Multimed. Tools Appl. 2021, 80, 34297–34309. [Google Scholar] [CrossRef]
- Yang, W.; Zhang, J.; Song, H.; Zhang, J. Partition-Based Analytic Evaluation of Building Wireless Performance. IEEE Trans. Veh. Technol. 2021, 70, 9036–9049. [Google Scholar] [CrossRef]
- Gehl, J. Life Between Buildings: Using Public Space; Island Press: Washington, DC, USA, 2011. [Google Scholar] [CrossRef]
- Dorrah, D.H.; Marzouk, M. Integrated multi-objective optimization and agent-based building occupancy modeling for space layout planning. J. Build. Eng. 2021, 34, 101902. [Google Scholar] [CrossRef]
- Chen, F.; Chen, Y. Urban Metabolism and Spontaneous Architectural Growth: A Sustainable Strategy Featuring Participatory Co-Construction by Multiple Stakeholders. Buildings 2022, 12, 352. [Google Scholar] [CrossRef]
- Fatourehchi, D.; Zarghami, E. Social sustainability assessment framework for managing sustainable construction in residential buildings. J. Build. Eng. 2020, 32, 101761. [Google Scholar] [CrossRef]
- Munoz-Gama, J.; Martin, N.; Fernandez-Llatas, C.; Johnson, O.A.; Sepúlveda, M.; Helm, E.; Galvez-Yanjari, V.; Rojas, E.; Martinez-Millana, A.; Aloini, D.; et al. Process mining for healthcare: Characteristics and challenges. J. Biomed. Inform. 2022, 127, 103994. [Google Scholar] [CrossRef] [PubMed]
- van der Aalst, W. Data Science in Action BT—Process Mining: Data Science in Action; van der Aalst, W., Ed.; Springer: Berlin/Heidelberg, Germany, 2016; pp. 3–23. [Google Scholar] [CrossRef]
- Huang, Z.; Dong, W.; Ji, L.; Yin, L.; Duan, H. On local anomaly detection and analysis for clinical pathways. Artif. Intell. Med. 2015, 65, 167–177. [Google Scholar] [CrossRef] [PubMed]
- Jans, M.; Laghmouch, M. Process Mining for Detailed Process Analysis BT—Advanced Digital Auditing: Theory and Practice of Auditing Complex Information Systems and Technologies; Berghout, E., Fijneman, R., Hendriks, L., de Boer, M., Butijn, B.-J., Eds.; Springer International Publishing: Cham, Switzerland, 2023; pp. 237–256. [Google Scholar] [CrossRef]
- Jensen, A.B.; Moseley, P.L.; Oprea, T.I.; Ellesøe, S.G.; Eriksson, R.; Schmock, H.; Jensen, P.B.; Jensen, L.J.; Brunak, S. Temporal disease trajectories condensed from population-wide registry data covering 6.2 million patients. Nat. Commun. 2014, 5, 4022. [Google Scholar] [CrossRef] [PubMed]
- Xu, H.; Pang, J.; Yang, X.; Ma, L.; Mao, H.; Zhao, D. Applying clinical guidelines to conformance checking for diagnosis and treatment: A case study of ischemic stroke. In Proceedings of the 2020 IEEE International Conference on Bioinformatics and Biomedicine (BIBM), Seoul, Republic of Korea, 16–19 December 2020; pp. 2125–2130. [Google Scholar] [CrossRef]
- Rojas, E.; Cifuentes, A.; Burattin, A.; Munoz-Gama, J.; Sepúlveda, M.; Capurro, D. Performance Analysis of Emergency Room Episodes Through Process Mining. Int. J. Environ. Res. Public Health 2019, 16, 1274. [Google Scholar] [CrossRef]
- Mans, R.S.; van der Aalst, W.M.P.; Vanwersch, R.J.B. Process Mining in Healthcare: Evaluating and Exploiting Operational Healthcare Processes; Springer: Cham, Switzerland, 2015. [Google Scholar] [CrossRef]
- Liu, S.; Brandeau, M.L.; Goldhaber-Fiebert, J.D. Optimizing patient treatment decisions in an era of rapid technological advances: The case of hepatitis C treatment. Health Care Manag. Sci. 2017, 20, 16–32. [Google Scholar] [CrossRef][Green Version]
- Zhao, Y.; Mourshed, M. Patients’ Perspectives on the Design of Hospital Outpatient Areas. Buildings 2017, 7, 117. [Google Scholar] [CrossRef]
- Mills, T.; Lawton, R.; Sheard, L. Improving Patient Experience in Hospital Settings: Assessing the Role of Toolkits and Action Research Through a Process Evaluation of a Complex Intervention. Qual. Health Res. 2019, 29, 2108–2118. [Google Scholar] [CrossRef]
- Ma, J.H.; Erdogmus, E.; Cha, S.H. Integration of a choice modeling approach with immersive virtual environments for accurate space utilization prediction. J. Build. Eng. 2023, 76, 107126. [Google Scholar] [CrossRef]
- Ma, S.; Guo, S.; Wang, K.; Guo, M. Service Demand Prediction with Incomplete Historical Data. In Proceedings of the 2019 IEEE 39th International Conference on Distributed Computing Systems (ICDCS), Dallas, TX, USA, 7–10 July 2019; pp. 912–922. [Google Scholar] [CrossRef]
- Han, P.; Chen, K.; Liu, D.; You, Y.; Wang, J. A high precision computing method for heat transfer in the process of oil-water displacement. J. Hydrodyn. 2021, 33, 958–969. [Google Scholar] [CrossRef]
- Osorio-Sandoval, C.A.; Tizani, W.; Pereira, E.; Ninić, J.; Koch, C. Framework for BIM-Based Simulation of Construction Operations Implemented in a Game Engine. Buildings 2022, 12, 1199. [Google Scholar] [CrossRef]
- Roach, C.; Hyndman, R.; Taieb, S.B. Non-linear mixed-effects models for time series forecasting of smart meter demand. J. Forecast. 2021, 40, 1118–1130. [Google Scholar] [CrossRef]
- El-Diarby, T.E. Domain Ontology for Construction Knowledge. J. Constr. Eng. Manag. 2013, 139, 768–784. [Google Scholar] [CrossRef]
- Botao, Z.; Heng, L.; Hanbin, L.; Jingyang, Z.; Weili, F.; Xuejiao, X. Ontology-Based Semantic Modeling of Knowledge in Construction: Classification and Identification of Hazards Implied in Images. J. Constr. Eng. Manag. 2020, 146, 4020013. [Google Scholar] [CrossRef]
- Yin, M.; Tang, L.; Webster, C.; Xu, S.; Li, X.; Ying, H. An ontology-aided, natural language-based approach for multi-constraint BIM model querying. J. Build. Eng. 2023, 76, 107066. [Google Scholar] [CrossRef]
- Hervé, P.; Andreas, W.; Olaf, E.-R. Ontology-Based Expert System for Automated Monitoring of Building Energy Systems. J. Comput. Civ. Eng. 2023, 37, 4022054. [Google Scholar] [CrossRef]
- Kang, D.; Lee, J.; Choi, S.; Kim, K. An ontology-based Enterprise Architecture. Expert Syst. Appl. 2010, 37, 1456–1464. [Google Scholar] [CrossRef]
- Wan, K.T.; Martin, F. Ontology for Representing Building Users’ Activities in Space-Use Analysis. J. Constr. Eng. Manag. 2014, 140, 4014035. [Google Scholar] [CrossRef]
- Zhou, Z.; Miang, G.Y.; Lijun, S. Overview and Analysis of Ontology Studies Supporting Development of the Construction Industry. J. Comput. Civ. Eng. 2016, 30, 4016026. [Google Scholar] [CrossRef]
- van der Aalst, W. Process Mining: Overview and Opportunities. ACM Trans. Manag. Inf. Syst. 2012, 3, 1–17. [Google Scholar] [CrossRef]
- Shaheen, N.A.; Manezhi, B.; Thomas, A.; AlKelya, M. Reducing defects in the datasets of clinical research studies: Conformance with data quality metrics. BMC Med. Res. Methodol. 2019, 19, 98. [Google Scholar] [CrossRef]
- Tian, Z.; Zhang, X.; Shi, X.; Han, Y. Mining operation hours on time-series energy data to identify unnecessary building energy consumption. J. Build. Eng. 2023, 63, 105509. [Google Scholar] [CrossRef]
- Bayomie, D.; Pfahlsberger, L.; Revoredo, K.; Mendling, J. Space-Time Cube Operations in Process Mining BT—The Practice of Enterprise Modeling; Grabis, J., Bork, D., Eds.; Springer International Publishing: Cham, Switzerland, 2020; pp. 405–414. [Google Scholar]
- Day, J.K.; O’Brien, W. Oh behave! Survey stories and lessons learned from building occupants in high-performance buildings. Energy Res. Soc. Sci. 2017, 31, 11–20. [Google Scholar] [CrossRef]
- Kumar, M.; Khan, S. Using post-occupancy evaluation as a methodological approach to assess residential hostels in CFTI. Archnet-IJAR Int. J. Archit. Res. 2023, 17, 343–357. [Google Scholar] [CrossRef]
- Hongling, G.; Yantao, Y.; Qinghua, D.; Martin, S. Image-and-Skeleton-Based Parameterized Approach to Real-Time Identification of Construction Workers’ Unsafe Behaviors. J. Constr. Eng. Manag. 2018, 144, 4018042. [Google Scholar] [CrossRef]
- Berti, A.; van Zelst, S.; Schuster, D. PM4Py: A process mining library for Python[Formula presented]. Softw. Impacts 2023, 17, 100556. [Google Scholar] [CrossRef]
- Diaz, M. Petri Nets: Fundamental Models, Verification and Applications; John Wiley & Sons: Hoboken, NJ, USA, 2013. [Google Scholar]
- van der Aalst, W.M.P. Process Mining: On the Balance Between Underfitting and Overfitting. In Proceedings of the ECML-PKDD Workshop on Induction of Process Models (IPM08); Bridewell, W., Calders, T., de Medeiros, A.K., Kramer, S., Pechenizkiy, M., Todorovski, L., Eds.; University of Antwerp: Antwerpen, Belgium, 2008; pp. 1–2. [Google Scholar]
- Leemans, S.J.J.; Fahland, D.; van der Aalst, W.M.P. Scalable process discovery and conformance checking. Softw. Syst. Model. 2018, 17, 599–631. [Google Scholar] [CrossRef]
- Van Der Aalst, W. Process mining. Commun. ACM 2012, 55, 76–83. [Google Scholar] [CrossRef]
- Adriansyah, A.; Van Dongen, B.F.; Van Der Aalst, W.M.P. Conformance Checking using Cost-Based Fitness Analysis. In Proceedings of the 2011 IEEE 15th International Enterprise Distributed Object Computing Conference, Helsinki, Finland, 29 August–2 September 2011; pp. 55–64. [Google Scholar] [CrossRef]
- Guest, M.; Zito, M.; Hulleman, J.; Bertamini, M. On the usefulness of graph-theoretic properties in the study of perceived numerosity. Behav. Res. Methods 2022, 54, 2381–2397. [Google Scholar] [CrossRef] [PubMed]
- Sampaio, A.Z.; Sequeira, P.; Gomes, A.M.; Sanchez-Lite, A. BIM Methodology in Structural Design: A Practical Case of Collaboration, Coordination, and Integration. Buildings 2023, 13, 31. [Google Scholar] [CrossRef]
- Liu, A.; Lu, S. Functional design framework for innovative design thinking in product development. CIRP J. Manuf. Sci. Technol. 2020, 30, 105–117. [Google Scholar] [CrossRef]
- Xiaozhi, D.; Yunxiao, G.; Nan, Y.; Fengshuang, Y. IFC File Content Compression Based on Reference Relationships. J. Comput. Civ. Eng. 2020, 34, 4020012. [Google Scholar] [CrossRef]
- Reza, H.M.; Mojtaba, M.; Ali, A.; Igor, M.; Mehrdad, A. Analysis of Citation Networks in Building Information Modeling Research. J. Constr. Eng. Manag. 2018, 144, 4018064. [Google Scholar] [CrossRef]
- Gruber, T.R. Toward principles for the design of ontologies used for knowledge sharing? Int. J. Hum. Comput. Stud. 1995, 43, 907–928. [Google Scholar] [CrossRef]
- Uschold, M. Knowledge level modelling: Concepts and terminology. Knowl. Eng. Rev. 1998, 13, 5–29. [Google Scholar] [CrossRef]
- Handayani, P.W.; Hidayanto, A.N.; Budi, I. User acceptance factors of hospital information systems and related technologies: Systematic review. Inform. Health Soc. Care 2018, 43, 401–426. [Google Scholar] [CrossRef]
- Bertsimas, D.; Pauphilet, J.; Stevens, J.; Tandon, M. Predicting Inpatient Flow at a Major Hospital Using Interpretable Analytics. Manuf. Serv. Oper. Manag. 2021, 24, 2809–2824. [Google Scholar] [CrossRef]
- Ruben, M.D.; Francey, L.J.; Guo, Y.; Wu, G.; Cooper, E.B.; Shah, A.S.; Hogenesch, J.B.; Smith, D.F. A large-scale study reveals 24-h operational rhythms in hospital treatment. Proc. Natl. Acad. Sci. USA 2019, 116, 20953–20958. [Google Scholar] [CrossRef] [PubMed]
- van der Aalst, W.M.P. Extracting Event Data from Databases to Unleash Process Mining BT—BPM—Driving Innovation in a Digital World; vom Brocke, J., Schmiedel, T., Eds.; Springer International Publishing: Cham, Switzerland, 2015; pp. 105–128. [Google Scholar] [CrossRef]
- Bartolucci, F.; Donni, P.L.; Mira, A. Temporal analysis of hospital network data by hierarchical Bayesian p2 models with covariates. J. R. Stat. Soc. Ser. A Stat. Soc. 2023, 186, 422–440. [Google Scholar] [CrossRef]
- Di Vincenzo, F. Exploring the networking behaviors of hospital organizations. BMC Health Serv. Res. 2018, 18, 1–10. [Google Scholar] [CrossRef] [PubMed]
- Guo, W.; He, Y. Optimized Wayfinding Signage Positioning in Hospital Built Environment through Medical Data and Flows Simulations. Buildings 2022, 12, 1426. [Google Scholar] [CrossRef]
- Chen, Z.; Kuhn, D.; Wiesemann, W. Technical Note—Data-Driven Chance Constrained Programs over Wasserstein Balls. Oper. Res. 2022, 72, 410–424. [Google Scholar] [CrossRef]
- Liu, N.; Ziya, S. Panel Size and Overbooking Decisions for Appointment-Based Services under Patient No-Shows. Prod. Oper. Manag. 2014, 23, 2209–2223. [Google Scholar] [CrossRef]
- Pham, C.; Tran, N.H.; Ren, S.; Hong, C.S.; Nguyen, K.K.; Cheriet, M. A distributed approach to emergency demand response in geo-distributed mixed-use buildings. J. Build. Eng. 2018, 19, 506–518. [Google Scholar] [CrossRef]
- Fitz, D.V.; Saleeb, N. Examining the quality and management of non-geometric building information modelling data at project hand-over. Archit. Eng. Des. Manag. 2019, 15, 297–310. [Google Scholar] [CrossRef]
- Zhang, M.; Yang, N. Spatial distribution of patient traffic volume in outpatient buildings of large general hospitals in China. J. Asian Archit. Build. Eng. 2023, 22, 1146–1169. [Google Scholar] [CrossRef]
- van den Heuvel, R.; Lévy, P.; Vos, S.; Hummels, C. Exploring Public Playgrounds through A Data-Enabled Design Approach. In Proceedings of the DIS’ 20 Companion: Companion Publication of the 2020 ACM Designing Interactive Systems Conference, Association for Computing Machinery, New York, NY, USA, 6–10 July 2020; pp. 1–6. [Google Scholar] [CrossRef]


Disclaimer/Publisher’s Note: The statements, opinions and data contained in all publications are solely those of the individual author(s) and contributor(s) and not of MDPI and/or the editor(s). MDPI and/or the editor(s) disclaim responsibility for any injury to people or property resulting from any ideas, methods, instructions or products referred to in the content. |
© 2024 by the authors. Licensee MDPI, Basel, Switzerland. This article is an open access article distributed under the terms and conditions of the Creative Commons Attribution (CC BY) license (https://creativecommons.org/licenses/by/4.0/).