Article

Identification of Damage Modes and Critical States for FRP/Steel-Concrete Composite Beams Based on Acoustic Emission Signal Analysis

1
School of Civil Engineering, Shandong Jianzhu University, Jinan 250101, China
2
Key Laboratory of Building Structural Retrofitting and Underground Space Engineering, Shandong Jianzhu University, Ministry of Education, Jinan 250101, China
3
School of Infrastructure Engineering, Dalian University of Technology, Dalian 116024, China
*
Author to whom correspondence should be addressed.
Buildings 2024, 14(8), 2378; https://doi.org/10.3390/buildings14082378
Submission received: 8 July 2024 / Revised: 24 July 2024 / Accepted: 29 July 2024 / Published: 1 August 2024
(This article belongs to the Section Building Materials, and Repair & Renovation)

Abstract

:
This paper applied the prevalent acoustic emission (AE) technology to identify the damage modes and critical conditions for FRP/steel-concrete composite beams during the failure process. AE signals generated by the structural damages were classified efficiently by using a novel self-adaptive real-time clustering (SARTC) method; damage modes corresponding to each clustering category were recognized and analyzed, and the dominant damage type at different stages was obtained by comparing the AE activities and feature values. By conducting the AE intensity analysis, the dynamic evolutionary mechanisms and critical conditions of composite beams were identified; the increase in intensity value from 0.2 to 0.3 reflects the process from critical yielding to major fracture. By establishing the non-linear fitting model between local response and cumulative AE energy, the instantaneous status at arbitrary local position of the composite beam can be inverted and predicted quantitatively by independent AE testing.

1. Introduction

The fiber reinforced polymer (FRP) composite exhibits outstanding corrosion resistance, high tensile strength, and temperature resistance [1]. The use of FRP materials to improve the performance of traditional reinforced concrete structures presents prevailing results. For example, Xian et al. [2] and Guo et al. [3] proposed the novel glass fiber and carbon/glass hybrid polypropylene bars as an alternative for traditional steel bars. Li et al. [4] and Huang et al. [5] proposed the innovative FRP/steel-concrete composite beam structure which accords with the trend of high performance, visual aesthetics, and environmental friendliness, and researched the design theory, flexural capacity, and fatigue behavior of the composite beam. Li et al. [6] and Du et al. [7] constructed FRP/steel-concrete composite beams with different section forms, shear connection modes, and steel volume fractions, to investigate the corresponding structural performance, damage process, and failure characteristics.
However, compared with common composite structures, the novel FRP/steel-concrete composite structure showed a multi-mode coupling and invisible failure mechanism; it is difficult to accurately reveal the damage mechanisms and failure modes by conducting the mechanical performance analysis with routine inspections (such as deformation, strain, and cracking). Therefore, it is necessary to develop new methods to evaluate the damage state and identify the damage modes from a microscopic point of view, so as to provide theoretical support and promote the application of the FRP/steel-concrete composite structure in large-scale and safety-critical structures.
The acoustic emission (AE) technique is a promising elastic waves-based non-destructive testing approach for condition assessment and diagnosis of raw materials or structures. AE in materials originated when microcracking was activated and part of the strain energy was dissipated as mechanical stress waves, which spread concentrically around the crack tip vicinity [8]. This released energy can be detected with suitable sensors, and the recorded stress waves from the material were then converted into an electrical signal, called the AE signal. AE signals and typical characteristic features contain useful information about the damage initiation, fracture mechanisms, and damage modes [9]. Given its superiorities such as real-time, far testing range, high sensitivity, and sensitivity to any process or mechanism that generates AE signals, the AE technique has been extensively applied in civil engineering structures (e.g., rock structures [10], reinforced concrete structures [11], and composite structures [12]), for non-destructive SHM, damage diagnosis, and recognition purpose.
From the perspective of damage pattern recognition, Qiu et al. [13] calculated the derivative indexes based on original AE features, which are called RA and AR, and the RA–AF correlation analysis was conducted to elucidate the fracturing modes and failure patterns of asphalt mixtures. Yang et al. [14] applied the Gaussian mixture model to discriminate the cracking modes that compensated the deficiency of conventional RA–AF analysis, which depended on empirical parameters. Gutkin et al. [15] introduced the K-means clustering and self-organizing neural network (SOM) clustering to identify the characteristics of AE signals corresponding to different damage categories of FRP laminated plates. Furthermore, Sayar et al. [16] discussed the damage modes of laminated carbon/epoxy composite and Li et al. [17] discussed the damage modes of GFRP-concrete-filled steel tubular columns by the Fuzzy-C mean (FCM) clustering method, and the typical waveforms of different damage modes were analyzed by time-frequency multiscale analysis.
According to the current literatures, theoretical and practical researches have proved that clustering analysis was an effective way of characteristic recognition for AE signals. Whereas, existing clustering methods require the whole dataset and the number of clustering categories needs to be determined in advance, which are not always available especially for time-driven long-term monitoring data [18]. In addition, the computational complexity and memory demand of traditional clustering algorithms increased exponentially with the increase in sample size. Mansouri et al. [19] developed a hybrid algorithm based on the K-means algorithm and the evolutionary mutation operator, to improve the clustering accuracy and computing efficiency. Liu et al. [20] proposed the Pearson correlation coefficient for AE feature selection to mitigate the computing burden when using k-means++ cluster analysis for damage identification. And Zang et al. [21] proposed a kernel-based intuitionistic FCM clustering using improved multi-objective artificial immune algorithm, which has the advantage of faster convergence and escaping from local optima. These modifications reduced the computing afford and guaranteed the clustering confidence to some extent, but still cannot provide a prognosis for the optimal clustering number, and cannot satisfy the real-time clustering for explosive AE data generated by transient structural failure. Aiming at the aforementioned shortcomings, the authors [22] put forward a novel self-adaptive real-time clustering (SARTC) strategy that can satisfy the real-time clustering demand of explosive dataset and adaptively determine the optimal clustering number synchronously. In this paper, the novel SARTC strategy was applied to real-time and adaptive damage identification for FRP/steel-concrete composite beams.
With regard to damage monitoring and condition recognition, the variation and fluctuation rhythms of typical AE features during the damage process were generally discussed [23]. Yun et al. [24] discussed the AE characteristics of amplitude versus frequency, and amplitude versus duration, to differentiate damage conditions of reinforced concrete (RC) beams strengthened in flexure with carbon fiber reinforced polymer (CFRP) sheets. Sagar et al. [25] conducted b-value analysis and combined it with structural mechanical strain and deflection response. Qin et al. [26] combined the AE statistical parameters with b-value analysis to qualitatively characterize the interfacial cracking process and yielding stage. Additionally, the improved b-values (Ib-values) [27], load/calm ratios and Felicity ratio [28], Sentry function [29], and AE signal intensity analysis [30,31] have been applied for damage analysis and identification of concrete or composite structures. However, most existing researches focused on damage process tracing, major damage discern, and critical warning in a qualitative way; quantitative degree assessment and condition recognition methods were still insufficient. To overcome the above deficiency, in this paper, the AE intensity analysis and energy fitting analysis were proposed for damage inversion and evaluation, so as to provide a quantitative strategy to trace the damage evolutionary mechanisms, evaluate the damage severity, and identify critical conditions from the perspective of both overall integrity and local response.
The contribution of this paper is two-fold. Firstly, the novel SARTC strategy is proposed to classify the explosive AE data originated from the FRP/steel-concrete composite beams adaptively and real-timely, and the corresponding damage modes are identified. Secondly, the novel strategy is established for damage degree evaluation and critical condition recognition from the perspective of overall integrity and local response quantitatively by conducting the AE intensity analysis and energy fitting. The paper is structured as follows: Section 2 describes the experimental procedures, including the design and manufacture of composite beams, the test scheme, and AE monitoring facilities. Section 3 provides a brief introduction about the novel SARTC strategy and AE intensity analysis. In Section 4, the application of SARTC strategy for AE signal clustering and damage modes recognition is presented. In Section 5, the quantitative condition assessment for FRP/steel-concrete composite beams is elaborated via combining the AE intensity analysis and energy fitting analysis. Finally, the conclusion and limitation of the research are summarized in Section 6.

2. Experimental Procedures

2.1. Fabrication of the Fiber Reinforced Polymer (FRP)/Steel-Concrete Beam

Two kinds of hat-shaped FRP/steel-concrete beams were designed and fabricated with different thicknesses of steel plate, 0 mm and 2 mm, respectively, as shown in Figure 1. The unidirectional LT400 (400 g/m2) sheets were selected for fiber strengthening with the stacking sequence of [(0°/90°)2, (0°), (0°/90°), (0°), (0°/90°), (0°), (0°/90°)]S, where the subscript “S” means symmetrical stacking. The concrete slab with thickness of 50 mm was poured on top of the FRP cover plate; the distributed shear bolts and coarse aggregates were used to assure the conjunction of the FRP/steel laminate and concrete slab. Table 1 provides the raw material properties. Detailed design and construction about the FRP/steel-concrete beams were presented in Reference [32]. Table 2 provides the details of test specimens; the codes GS0 and GS2 were adopted to represent the two different beams, where G means GFRP, S0 and S2 refer to steel plate and its thickness. Notably, the specimen GS0 is FRP-concrete beam without embedded steel sheet essentially.

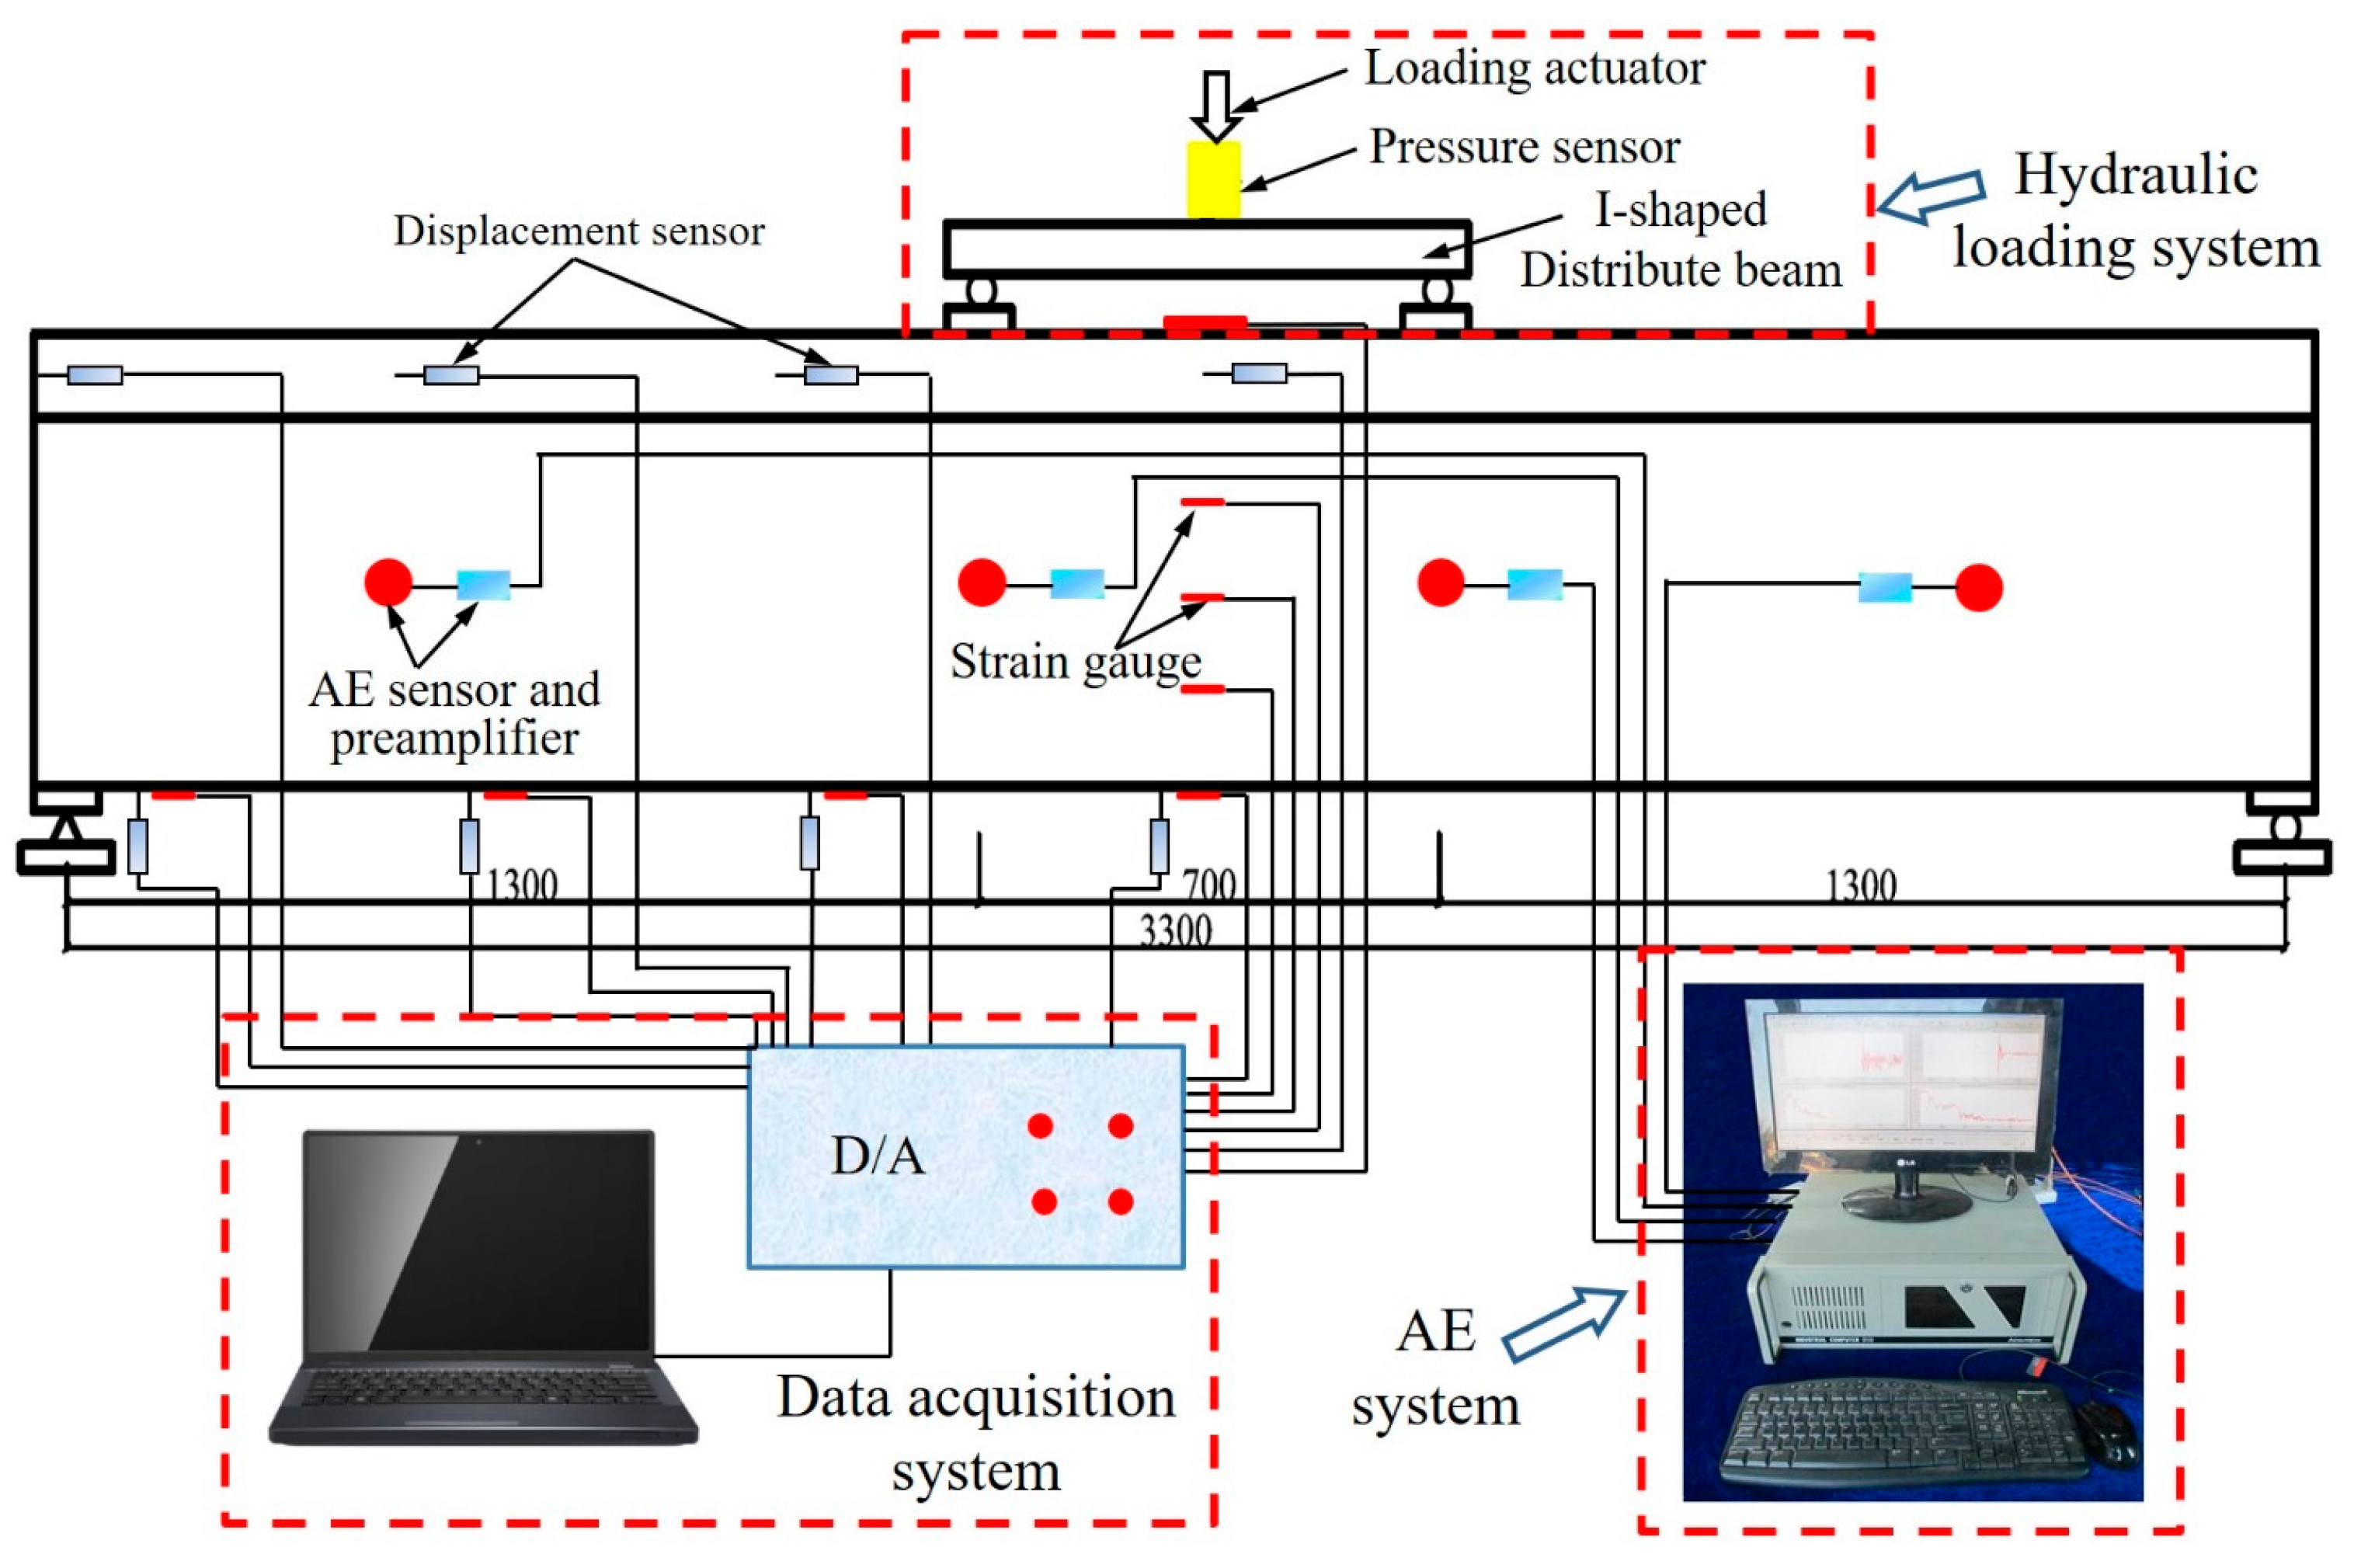
2.2. Test Equipment and Loading Protocol

The experimental schematic and installed test equipment, shown in Figure 2 and Figure 3, consisted of the hydraulic loading system, the data acquisition system, and the AE monitoring system. An I-shaped steel beam was positioned beneath the loading actuator to transfer the applied load to two loading points, to produce a four-point bending device with the central section of 700 mm under pure bending.
Each specimen was instrumented with data acquisition system to monitor the applied loads, deflection, and local strains. An eight-channel MISTRAS 2001 data acquisition system with Windows-based operation program from the American Physical Acoustics Corp. (Princeton, NJ, USA) was used to record AE signals. Four R-15a sensors (tagged 1, 3, 5, 7 in Figure 3) and four broadband AE sensors (tagged 2, 4, 6, 8 in Figure 3) were symmetrically surface-mounted on both sides of the test beams to ensure that all damage signals were caught effectively (see Figure 3). The pencil lead break calibration was conducted before the formal test to ensure that all AE transducers were coupled properly. Table 3 shows the salient data acquisition features of the AE system.
The four-point bending program was divided into two phases: non-destructive bending test and bending failure test. The non-destructive bending test adopted a cyclic loading program to check the stability of elastic deformation, and verify the effectiveness of the AE facilities. The bending failure test adopted a monotonic loading program to explore the mechanical properties, damage evolution, failure mode, and critical conditions by incorporating the AE monitoring.

3. Data Processing Method

3.1. Determination of Clustering Parameters

To guarantee the clustering accuracy and improve the efficiency, typical features instead of all data features were generally selected for clustering analysis, that is called feature selection (FS). During the past decades, various criteria have been proposed for FS purpose, such as the maximum variance criterion [33], Laplacian score (LS) [34], Shannon’s Entropy [35], and the combination of Laplacian score and Shannon mutual information (LS–MI) [22]. In this paper, the LS–MI method proposed by Du et al. [22] which can extract representative candidate features and weaken redundant information simultaneously was adopted to select feasible AE features for further clustering analysis. A brief introduction about the LS–MI method is described as follows:
Let Lr denote the Laplacian score of the r-th feature, and fri denote the i-th sample of the r-th feature fr. Nodes i and j are the arbitrary samples of the r-th feature fr.
  • Define a k-order adjacent relationship. Calculate the distance between arbitrary samples i and j; if i and j are “close enough”, then this is regarded as connected.
  • Construct the weight matrix W. If i and j are connected, then the weighted value Wij is calculated by Equation (1); otherwise, Wij = 0:
W i j = e f r i f r j 2 t
  • Calculate the Lr of the r-th feature. Laplacian score Lr is calculated by the ratio of the sum of the adjacent matrix and corresponding variance, as shown in Equation (2). The small Lr value implies the stronger cluster representation ability:
L r = i j ( f r i f r j ) 2 W i j var ( f r )
By repeating steps (1)–(3), the “K” features that best represent the intrinsic structure of the datasets can be determined. To eliminate redundancies among the “K” features, the Shannon mutual information entropy was utilized in steps (4)–(6):
  • Calculate the mutual information entropy Ixy. The mutual information entropy Ixy of arbitrary features x and y is defined in terms of their probabilistic density functions p(x), p(y), and p(x,y), as shown in Equation (3):
I x y = i , j p ( x i , y j ) log p ( x i , y j ) p ( x i ) p ( y j )
  • Eliminate redundancy. Normalize the Ixy by the self-information entropy Ixx (NIxy = Ixy/Ixx). For a given threshold ε, NIxy > ε means that x and y are highly dependent; thus, x or y should be discarded based upon their Lr value.
  • Determine the best cluster features. By repeating step (5), all redundancy among two arbitrary variables can be eliminated; only “K’” typical features that have high representative power and low information redundancy are retained eventually.

3.2. The Self-Adaptive Real-Time Clustering (SARTC) Strategy

The self-adaptive real-time clustering (SARTC) strategy that broke the limitation of repeat iteration and introduced parameters R and C to control the splitting and merging between classes promoted the clustering efficiency and determined the clustering number adaptively. The mean steps of the SARTC strategy are as follows:
  • Determine parameters R and C. The parameter R controls the splitting between classes, while parameter C controls the merging between classes. The parameter R can be determined as the average distance between all samples, while parameter C can be valued as 0.8~2.0 R upon data structure.
  • Cluster each sample. Construct the first cluster and center by the first sample. For the subsequent samples x(i), construct the distance vector d = [d1, d2, …] as the distance of x(i) to each cluster center C(j). If dj min < R, put the x(i) to the j-th cluster, and update the cluster numbers and centers based on Equations (4) and (5):
n ( j ) = n ( j ) · prior + 1
New   C ( j ) = C ( j ) + 1 n ( j ) * ( x ( i ) C ( j ) )
where n(j) and n(j)-prior represent the sample number, New C(j) and C(j) represent the cluster center, and x(i) represents the r-th characteristic vector.
For arbitrary sample x(i), if dj min > R, then the x(i) should be regarded as a separate cluster, and the corresponding cluster number and center should be updated simultaneously.
  • Inter-class merging. If the distance of two arbitrary centers is D(i, j) < C, then clusters i and j should be merged together, and the corresponding cluster number and center can be updated according to Equations (6) and (7):
n(New) = n(i) + n(j)
New   C ( j ) = n ( i ) n ( i ) + n ( j ) * C ( i ) + n ( i ) n ( i ) + n ( j ) * C ( j )
  • Update the clustering outcomes. All data matrices are supposed to be re-clustered based on the adjacent criterion after the merging operation, so as to guarantee a higher precision.
  • Visualization of the clustering outcomes. Two-dimensional correlativity scatter chart or three-dimensional histogram are supposed to visualize the clustering boundaries and centers.

3.3. The Acoustic Emission (AE) Intensity Analysis

The AE intensity analysis was conducted based on two parameters: historic index (H(t)) and severity (Sr), and the calculated parameters during the loading process were commonly plotted on an intensity analysis chart to evaluate the structural integrity and the degradation degree.
The H(t) was defined as the average signal strength of the last certain number of AE signals to the average strength of all signals, which indicates the sudden changes in signal strength throughout the damage process, as shown in Equation (8):
H ( t ) = N N K i = K + 1 i = N S o i / i = 1 i = N S o i
where N is the number of AE signals up to time t, while SOi represents the strength of the i-th signal, and K is an empirically derived factor that can be presumed based on the total AE number.
Damage severity (Sr) weighs the average signal strength of the J events with the maximum algebraic values at a certain period of monitoring, and is calculated using Equation (9). The rapid increase in Sr is typically associated with the occurrence of significant damages:
S r = 1 J i = 1 k S O i
where J is an empirically derived constant that depends on the material and, in this study, is set equal to 100.

4. Damage Modes Identification Based on the Self-Adaptive Real-Time Clustering (SARTC) Strategy

4.1. Acoustic Emission (AE) Feature Selection

All AE signals were recorded during the loading process of the tested beams, and the most commonly used AE features, namely, amplitude, energy, rise time, ring count, duration, signal strength, and peak frequency were experientially extracted for clustering analysis. The Laplace scores Lr and normalized mutual information entropy Ixy of each tested beam were calculated by using the proposed LS–MI method. Table 4 provided the Lr value and corresponding ranks in ascending order, unambiguously, there are no significant differences in Lr value and ranking between the two specimens. By presuming a correlation threshold of ε = 0.3, the top three “good features”, namely, ring count, amplitude and peak frequency, that have strong representative power and less information redundancy were elected for further clustering.

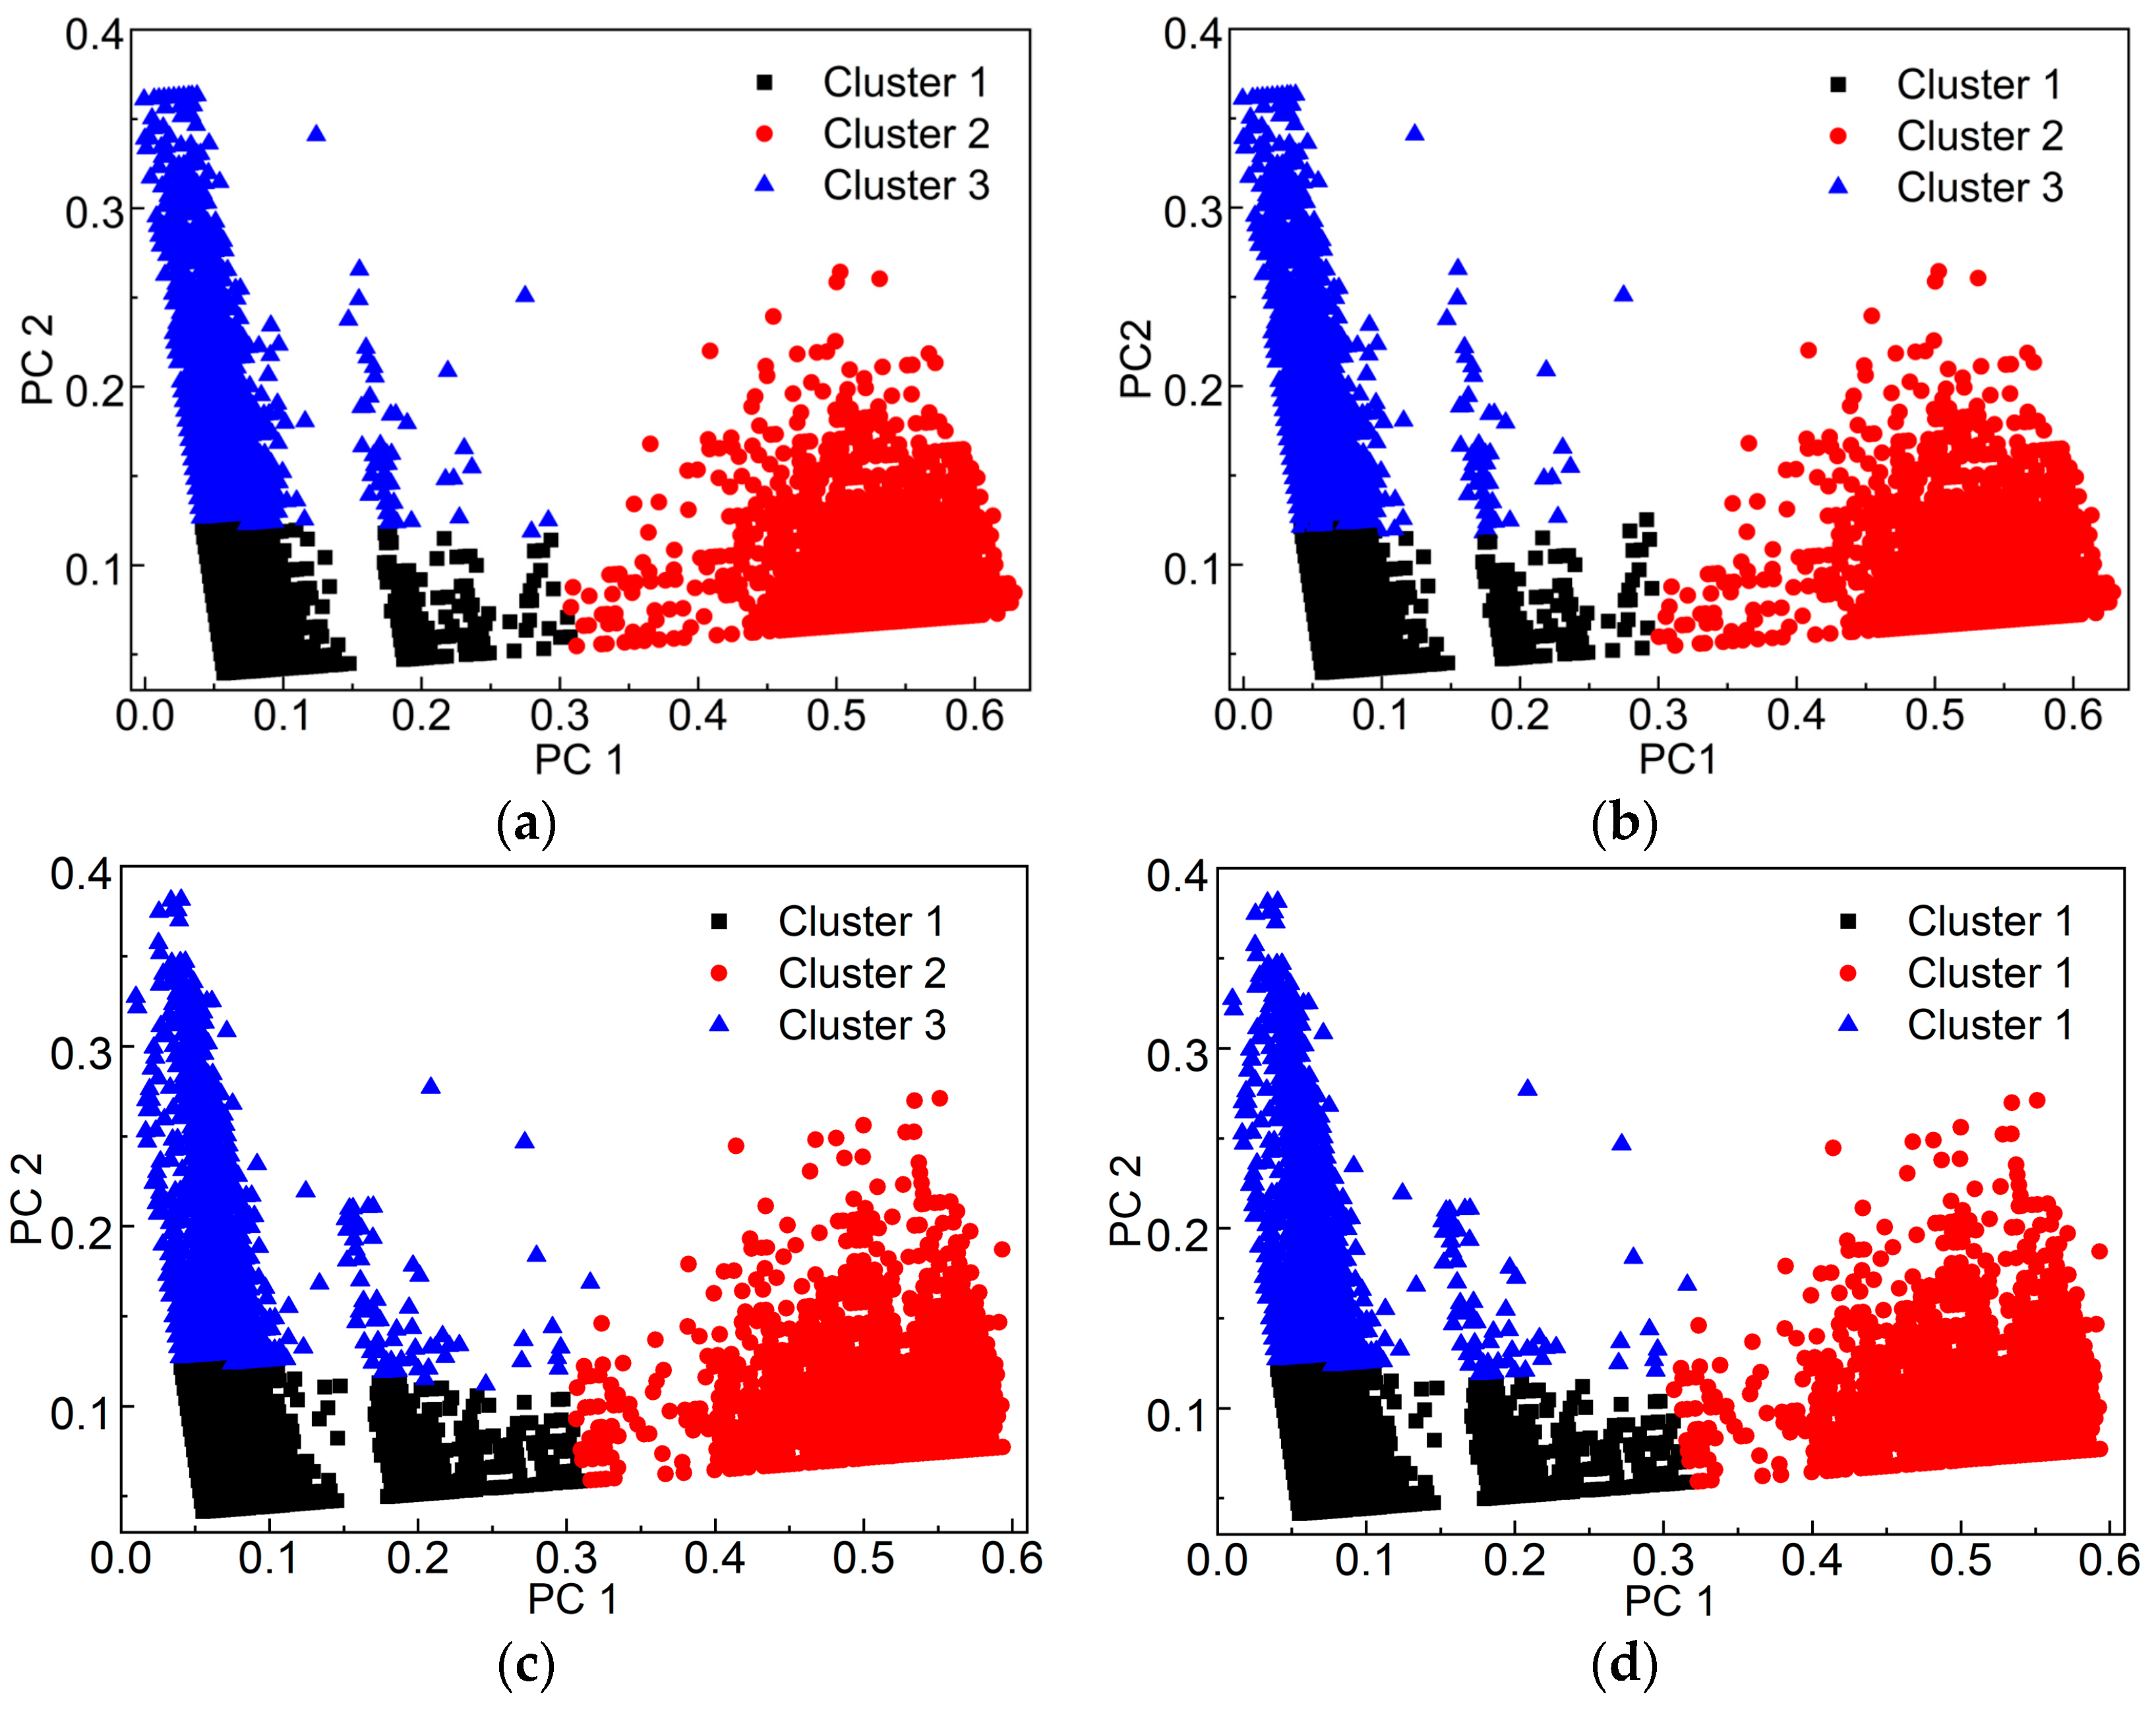
4.2. Real-Time Clustering and Validity Analysis

The proposed SARTC strategy was conducted to cluster AE signals in time sequence by using the selected “good features” (ring count, amplitude, and peak frequency) as initial input; all AE signals were classified into three independent clusters adaptively. To validate the clustering reliability, two well-known validity indexes [36], the DB (Davies-Bouldin) index and XB (Xie-Beni) index were utilized to the determine the cluster numbers. As shown in Figure 4, both the DB index and XB index of all specimens obtained local minimum when the cluster number was three, which indicated that the best cluster number should be three.
To validate the clustering accuracy, the clustering results of SARTC strategy were compared with the K-means algorithm, which was widely used and highly recognized in data mining. As shown in Table 5 and Figure 5, there were no unacceptable differences between the two methods in terms of the signal number and spatial distribution of each cluster for both GS0 and GS2; therefore, the clustering results of the SARTC method were regarded as effective.

4.3. Damage Modes Analysis for Fiber Reinforced Polymer (FRP)/Steel-Concrete Composite Beams

Table 6 and Table 7 provided the statistical average value of typical AE features for the three clusters. Figure 6 and Figure 7 provided the fluctuation of cumulative AE response versus time for the three different clusters, the tagged “Elastic Stage” and “Plastic Stage” were discriminated by the red dashed line based on the damage evolution of the composite beams reported in Reference [32].
Table 6 and Figure 6 provided the clustering results for specimen GS0 (without embedded steel sheet). Cluster 1 initiated at the lateral load was about 60 kN, and distributed continuously during the subsequent loading process; when damaged into the plastic stage, the AE number of Cluster 1 increased exponentially, occupying about 70% of the total signals, but the AE feature values such as the amplitudes, energy and ring count were all in a low level, accounting for no more than 10% of the total energy dissipation. In addition, the peak frequency of Cluster 1 was distributed between 0 and 200 kHz. According to the above phenomena, Cluster 1 manifested consistent AE characteristics with micro-damages [20,37], such as FRP matrix cracking, interfacial slipping, and initial cracking. Cluster 2 mainly occurred during the plastic stage with the least signal number and relatively lower signal strength, but the peak frequency was significantly higher than the other two clusters (distributed between 320 and 500 kHz), which coincided with the AE signals caused by fiber peeling, breaking and pulling-out [16,38]. Cluster 3 mainly occurred during the plastic stage and increased sharply during the post-plastic stage (after the knee point in Figure 6) with moderate signal number but highest feature values and energy contribution (accounting for 90.24% of energy dissipation), whereas the average frequency was just 38.44 kHz, which showed a typical characteristic of high intensity and low frequency. According to the relative signatures reported by Lai et al. [39], Cluster 3 was related to macroscopic damages of concrete such as inter-penetrating of existing cracks and crushing of surface concrete; the corresponding damage modes were shown in Figure 8a.
With regard to the damage modes of specimen GS2 (with 2 mm steel sheet embedded), Table 7 and Figure 7 provided the clustering results. By comparing with GS0, the damage signals caused by the steel buckling and void growth increased significantly (with an AE amplitude of 40~60 dB, and peak frequency of 100~200 kHz), resulting in the average frequency of Cluster 1 to increase by up to 46.70 kHz. Cluster 2 showed similar AE feature value and energy contribution to Cluster 2 of GS0, which was linked to FRP damages, such as fiber peeling, breaking and pulling-out, as shown in Figure 8b. Cluster 3 showed similar AE amplitude, frequency, and energy ratio to GS0, but the AE duration and energy value were relatively low, which was due to the fact that the embedded steel plate balanced the local stress of the pure FRP laminates in composite beam, resulting in decreasing the energy release rate and slowing down the development of plastic damages (see Figure 7 with prolonged plastic stage).
Furthermore, the damage evolution mechanisms of the two kinds of composite beams were compared and elaborated below: During the elastic stage, more damage signals were generated by specimen GS0, while only a small amount of damage signals was recorded for specimen GS2, which indicated that micro FRP matrix damages of GS2 were constrained effectively by embedding the steel plate. During the plastic stages, more damages occurred, accompanied by a significant increase in AE activities of both specimens. In this stage, the cumulative trend of Cluster 2 showed distinct discrepancy, namely, the GS2 continually increased while the GS0 showed no obvious increase after the knee point (see the red lines in Figure 6 and Figure 7), which indicated that the pure FRP laminates of GS0 failed prematurely while the FRP/steel laminates of GS2 worked well until the ultimate failure. After damage into the post-plastic stage (after the knee point), the signal number of Cluster 3 of both specimens increased rapidly (see the blue lines in Figure 6 and Figure 7), which proved that the macroscopic damages such as cracking penetration and concrete collapse gradually become dominated, which has a great impact on structural performances. In addition, by referring to Reference [40], the cracking morphology was classified by defining two parameters, RA and AF. A shorter duration and lower energy value of specimen GS2 resulted in higher RA and AF values, which implied that shear cracking and tensile cracking occurred synchronously during the post-plastic stage, whereas the most dominated damages of GS0 were shearing cracking (manifested by lower AF value and higher RA value).

5. Damage Condition Evaluation

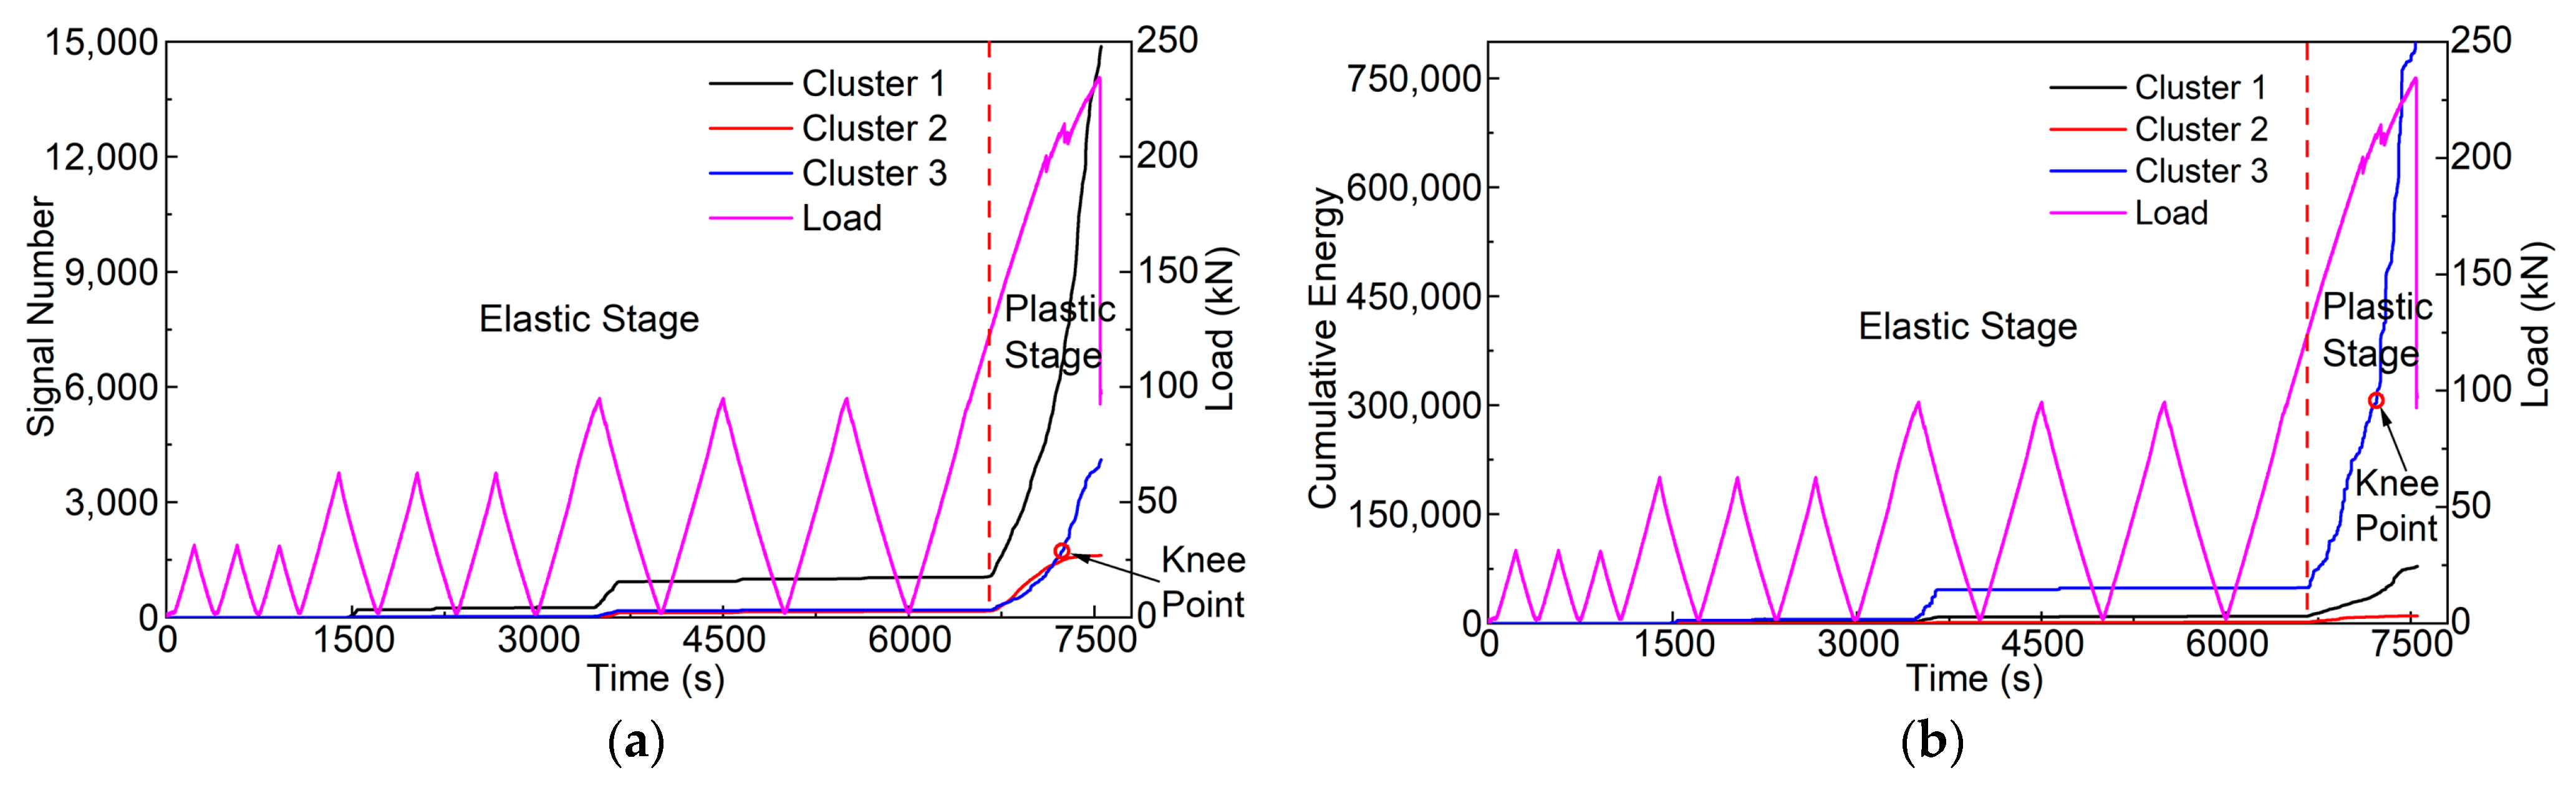
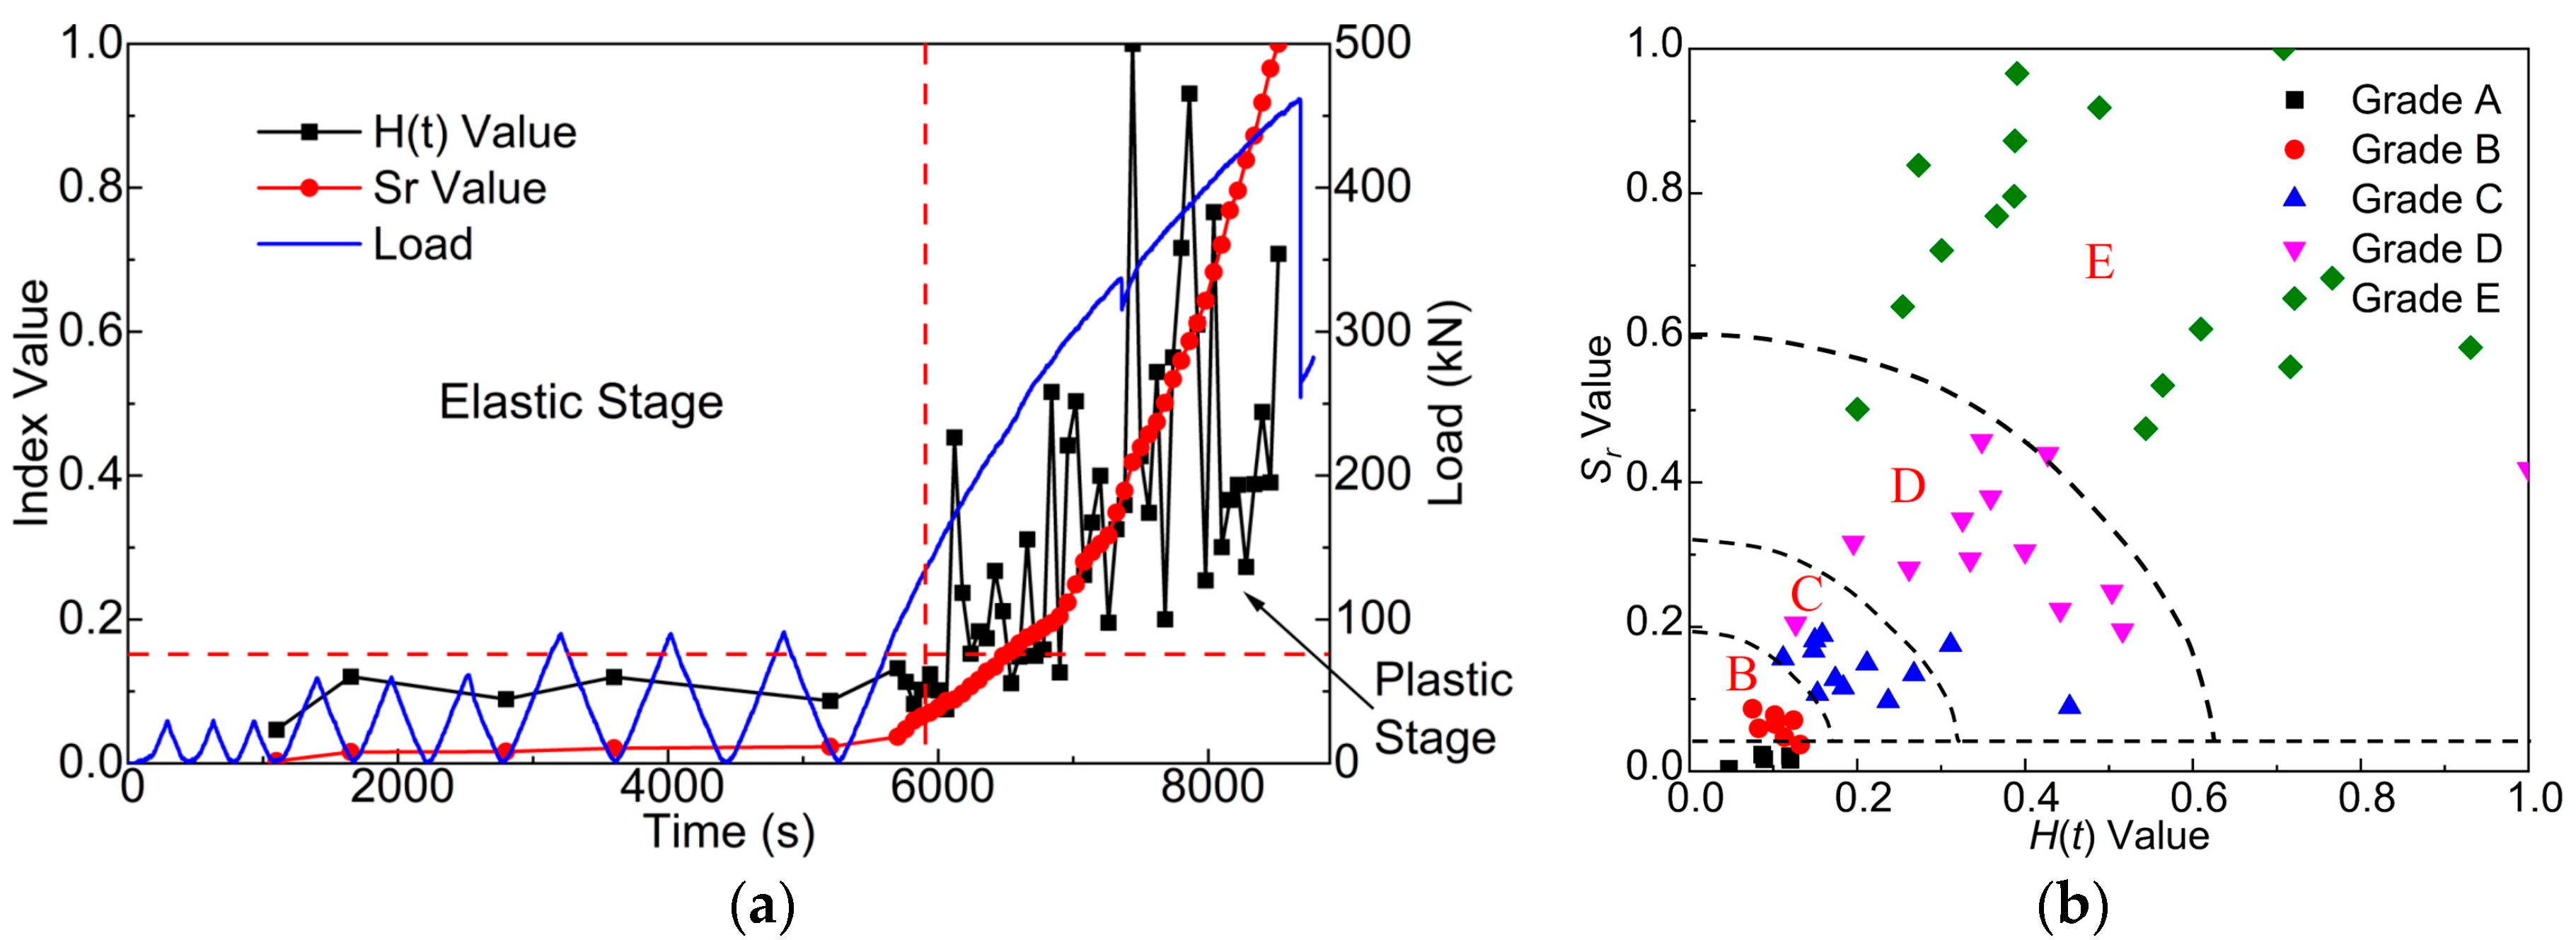
5.1. Overall Condition Evaluation Based on Acoustic Emission (AE) Intensity Analysis

The normalized historic index (H(t)) and severity (Sr) index were calculated based on the principle of AE intensity analysis. Figure 9 and Figure 10 provided the fluctuation of index value versus time and the constructed intensity analysis chart, where the damage severity of composite beams was divided into five grades, namely, A, B, C, D, and E, corresponding to five damage degrees, namely, micro-damage or no damage, minor damage, moderate damage, large damage, and major damage. By referring to the safety criteria in China Standard for Appraisal of Reliability of Civil Buildings (GB 50292-2015) [41], hereinafter referred to as China Appraisal Standard, the safety performance of components was divided into four grades, as described in Table 8.
As shown in Figure 9 and Figure 10, Grades A and B correspond to the elastic stage with lower H(t) and Sr values (no more than 0.2), concomitant with the occurrence of micro local damages which has no obvious effect on structural security. According to the China Appraisal Standard, when the mid-span deflection of mean girders exceeded 1/200 of the simply supported span (l0), it should be rated as cu or du grade by referring to the actual damage morphology. In this research, the mid-span deflection of 16.5 mm (l0/200) corresponds to the lateral loads of 96 kN and 205 kN for GS0 and GS2, respectively, which was coincident with Grade C with the index value between 0.2 and 0.3, and proved to be a good indicator of the critical yielding process. Thereafter, the Sr value increased exponentially, while the H(t) value showed an upward trend of concussion, distributed at Grades D and E, that well reflected the continuous development of major fracture, such as the FRP fracture and cracking penetration. Furthermore, during the post-plastic stage, both the H(t) and Sr values exhibited a sharp increase with the Sr value higher than 0.6, which was regarded as the precursor of critical failure.
All in all, the combination AE intensity analysis with safety criteria of China Appraisal Standard well elucidated the damage evolution of the FRP/steel-concrete composite beams from light to severe, from local to whole, and promoted the recognition of critical conditions. When H(t) and Sr values were less than 0.2, only slight damages occurred, this has no obvious effect on structural performances. When the H(t) and Sr values were between 0.2 and 0.3, this indicated that the composite beams were in a critical state of yielding with certain damages; therefore, appropriate reinforcement measures should be taken. When the H(t) or Sr values surpass 0.3, this indicated that major fracture occurred which affects the structural safety and applicability; therefore, comprehensive assessment and repairment should be taken immediately.

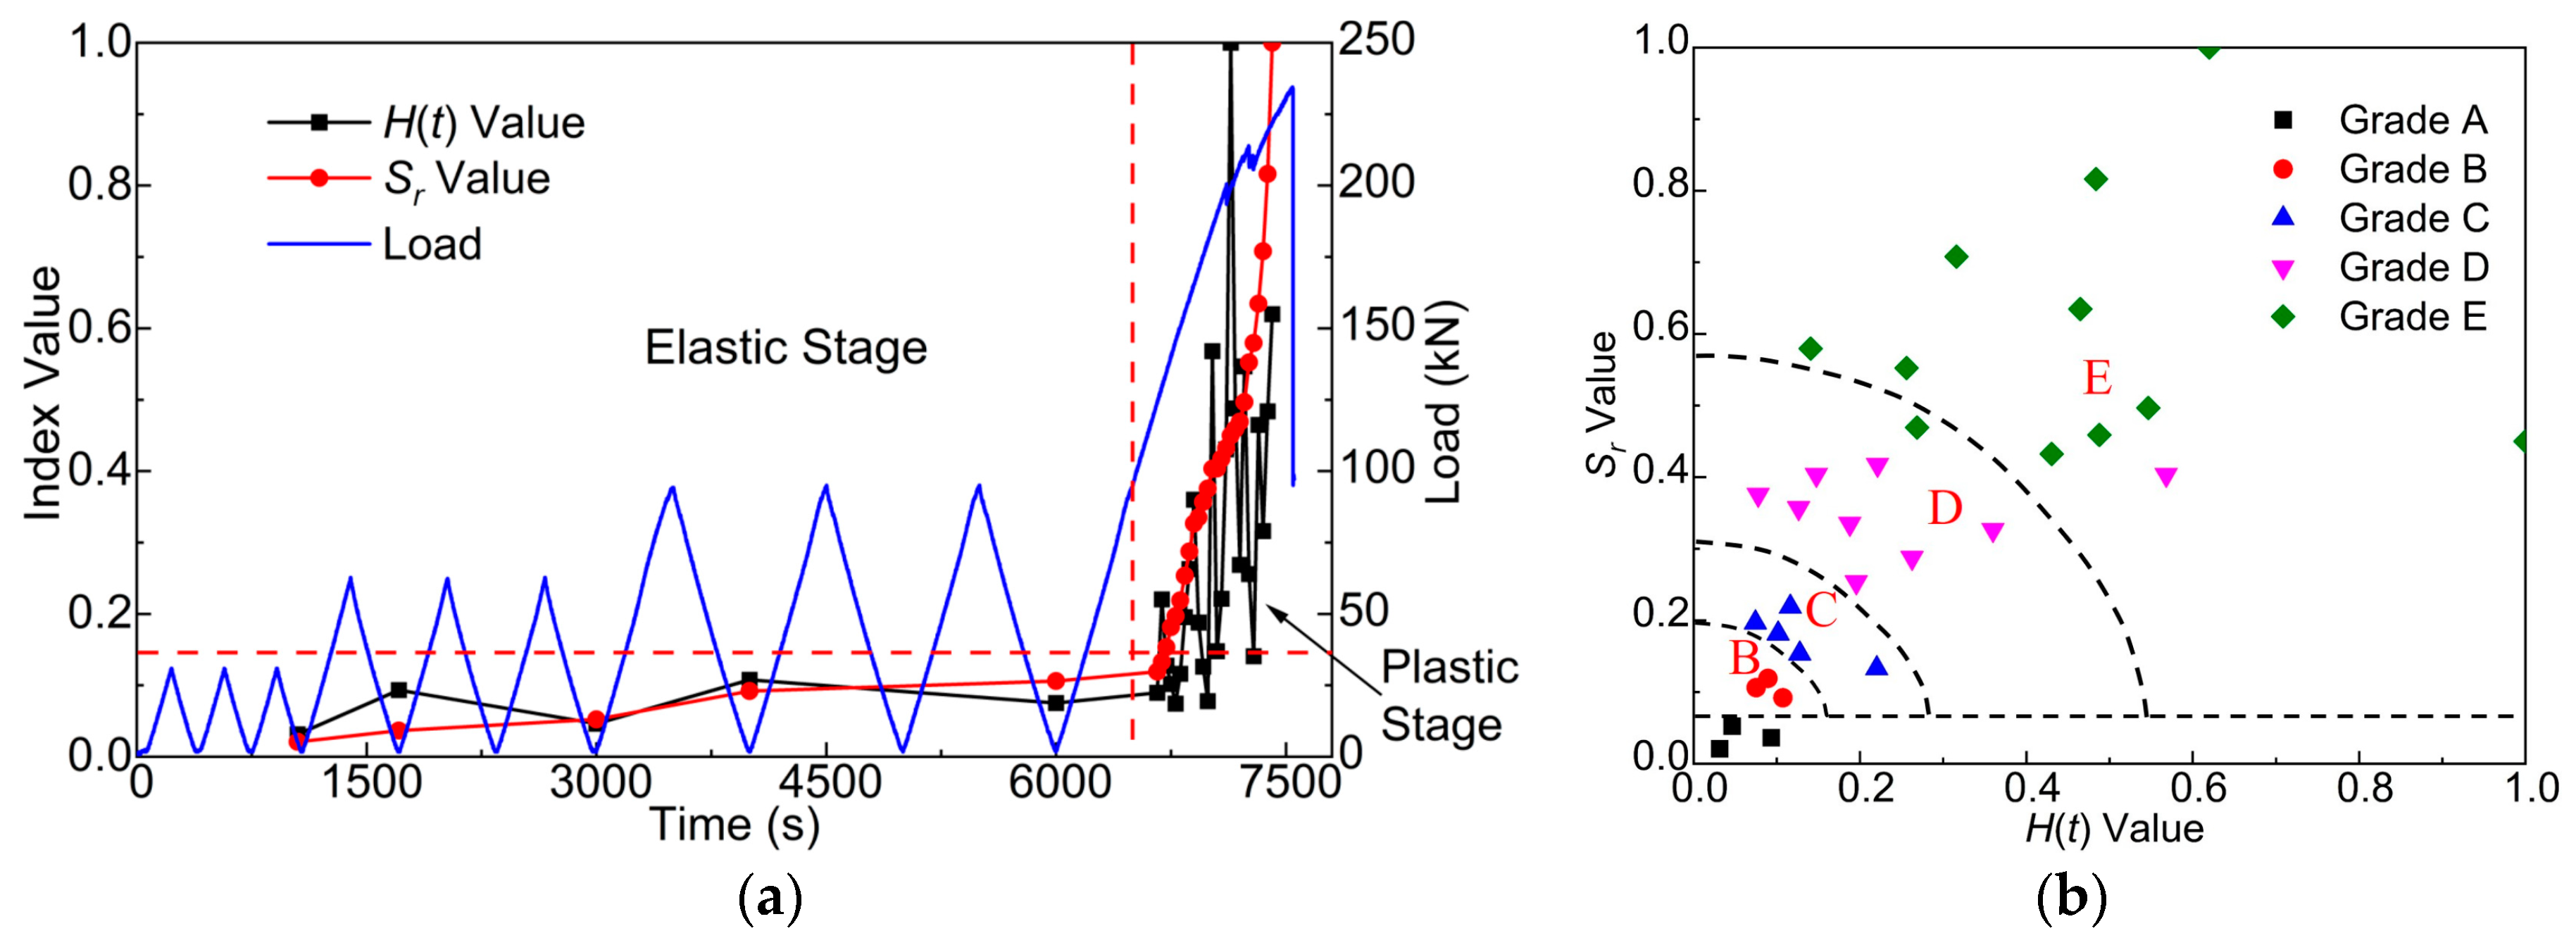
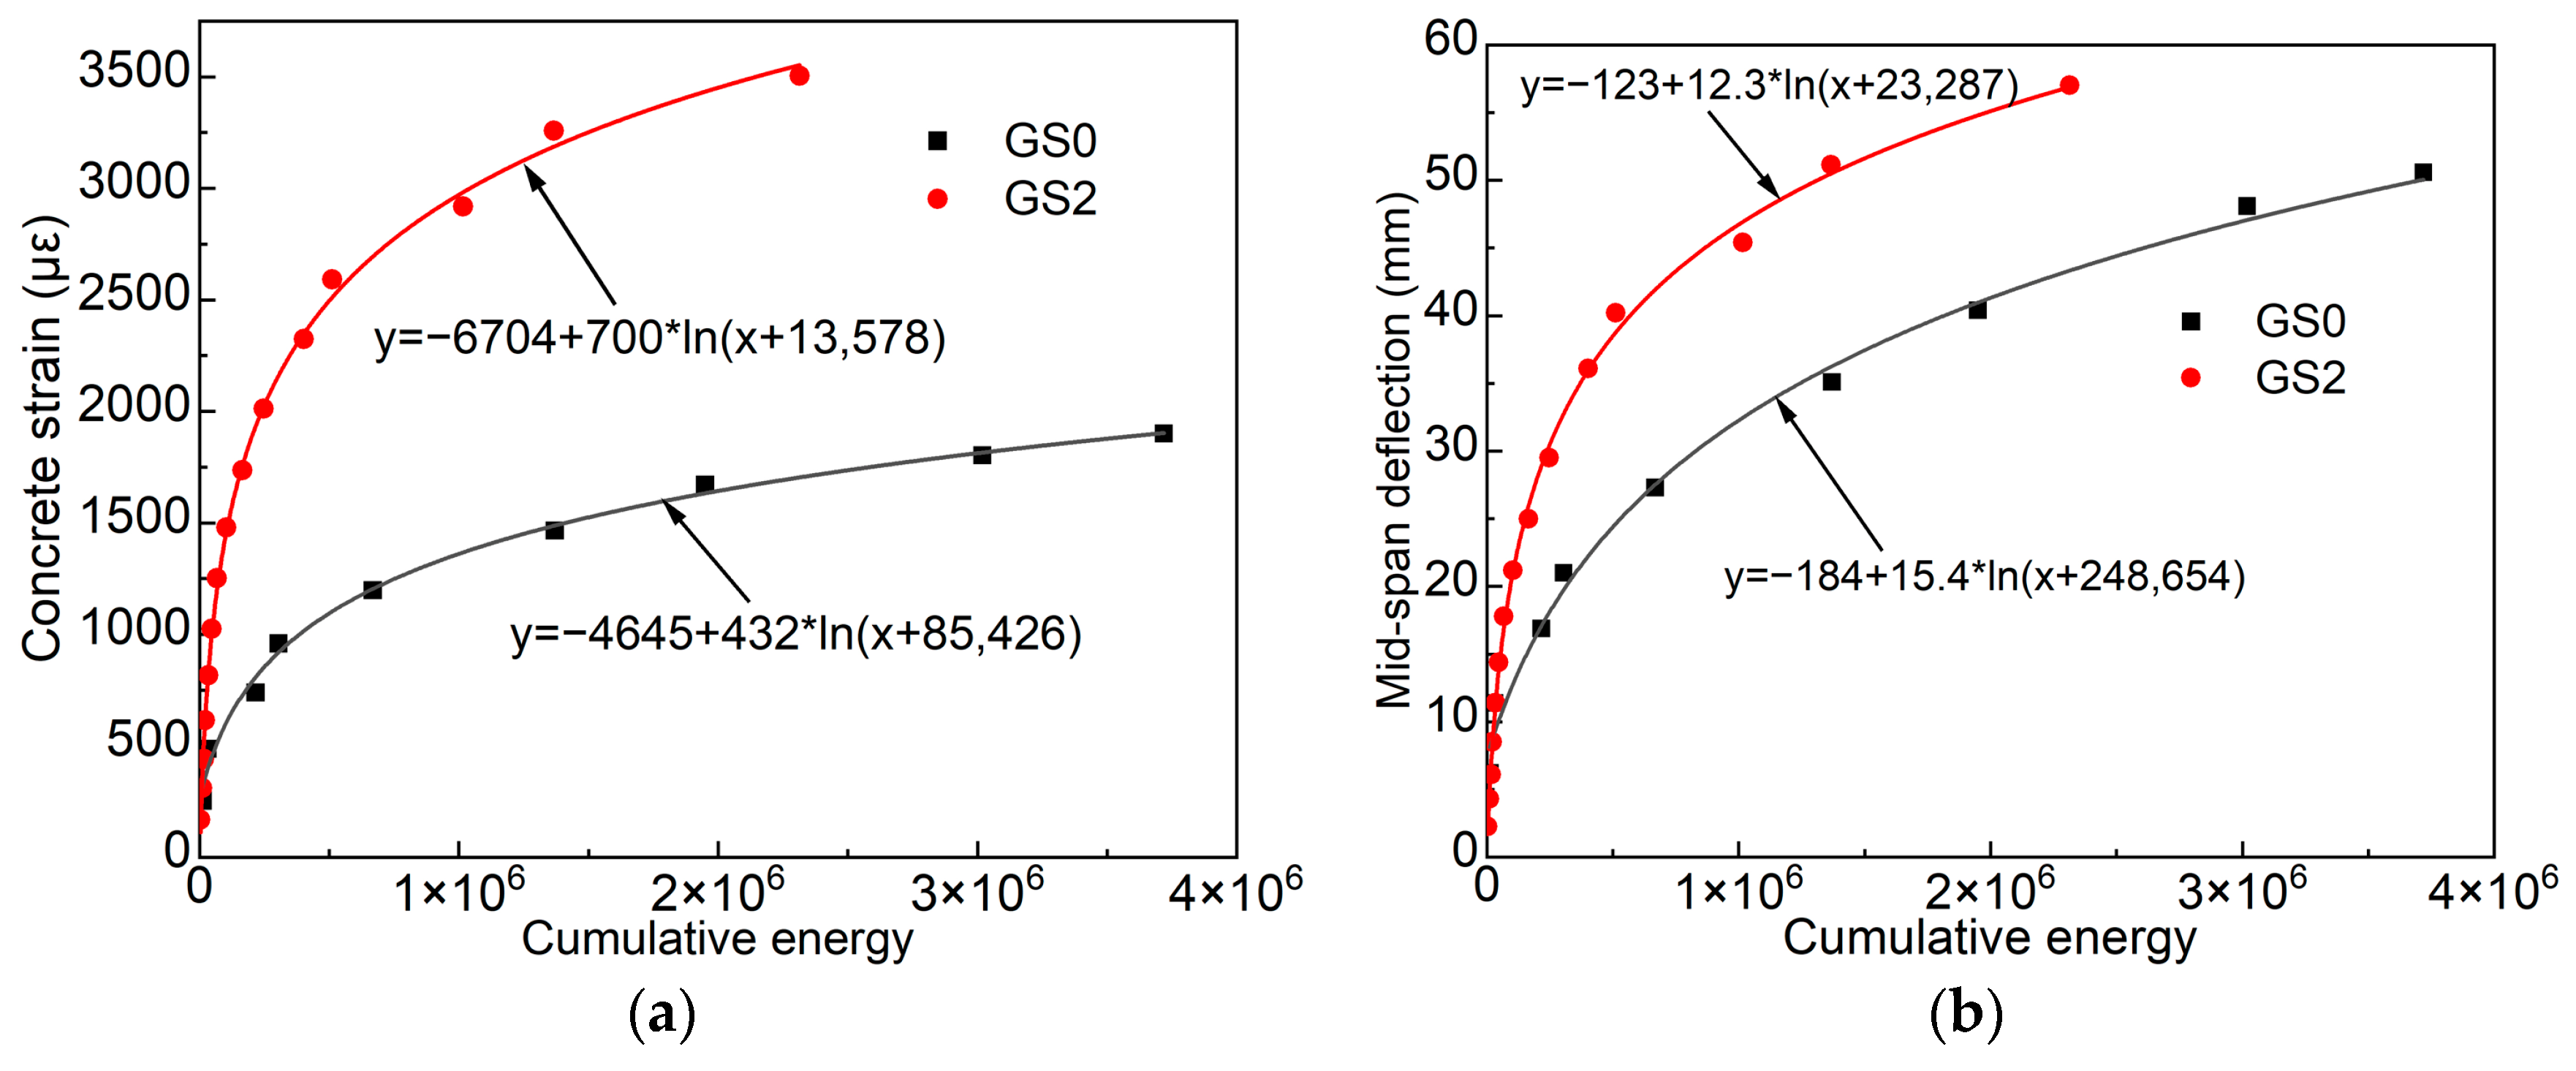
5.2. Local Quantitative Evaluation Based on Acoustic Emission (AE) Energy Fitting

Local responses such as strain and deflection contain useful information about structural performance; however, not all local responses are securable due to the harsh testing environment and limited sensor numbers. Therefore, this study created a non-linear logarithmic model to invert the local strain and deflection of the composite beams based on the accessible cumulative AE energy values. As shown in Figure 11, the local strain and deflection showed favorable correlation (correlation coefficients higher than 0.99) to cumulative AE energy for all specimens. Based on the non-linear model, a period of cumulative AE energy is the sole pre-requisite to identify the instantaneous status and predict the evolutionary trends.
In addition, the novel method is irrespective of the sensor arrangement; theoretically, all damage information within the range of wave propagation can be obtained through single AE monitoring, profited by the characteristic of long propagation distance of ultrasonic waves. In practical engineering applications, the sparse measurement points arranged on the key parts of the structure will satisfy the inversion and evaluation of arbitrary local responses (strain, deformation, etc.), and further prompt the precise quantification and prediction of the structural condition.

6. Conclusions

In this study, the prevalent AE technique was successfully applied to damage monitoring and evaluation of the novel FRP/steel-concrete composite beams. The failure modes and mechanisms were identified and discussed by conducting the self-adaptive real-time clustering (SARTC) method. The evolutionary mechanisms and critical conditions of composite beams were recognized and evaluated from a quantitative view by conducting the AE intensity analysis and energy fitting analysis. Conclusions are drawn as follows:
(1) Acoustic emission signals originated from the damage process of the FRP/steel-concrete composite beams were classified into three representative clusters adaptively and real-timely; damage categories of each cluster can be identified by analyzing the differences of typical AE feature values and the actual damage morphology, which were conducive to reveal the damage mechanisms and dominant damage types at different stages of the FRP/steel-concrete composite beams.
(2) The embeddedness of steel plate caused significant influence on structural damage mechanisms; the composite beam without embedded steel plate occurred more shear damages during the plastic stage, while substantial shear damages and tensile damages co-occurred after embedding the steel plate in composite beam.
(3) A quantitative method to evaluate the overall damage degree and provide critical state warning was proposed by conducting the AE intensity analysis, for example, the H(t) and Sr values between 0.2 and 0.3 corresponded to the structural yielding process, while the sudden increase in H(t) value to higher than 0.3 indicated the occurrence of major fracture, and the intensity values exceeding 0.6 were the precursor of critical failure.
(4) By establishing the non-linear logarithmic model between the local response and the cumulative AE energy of the composite beams, it is possible to identify the instantaneous status at arbitrary local position and predict the evolution trends based on a certain period of AE monitoring.
However, there are still shortcomings and deficiencies that should be researched further. Firstly, the AE responses exhibit obvious changes after embedding the steel plate in composite beams, and further detailed differences of AE responses of pure FRP laminate and FRP/steel laminates should be researched to promote the reliability of the damage modes identification. In addition, the construction of the intensity analysis chart was empirical to some extent and further acceptable and standard methods to establish the intensity analysis chart are still needed.

Author Contributions

Methodology, writing—review and editing, supervision, and funding acquisition, F.D.; validation, formal analysis, and writing—original draft, D.Y.; software and supervision, D.L. All authors have read and agreed to the published version of the manuscript.

Funding

This study was funded by the National Natural Science Foundation of China (No. 52308317), and the Major Scientific and Technological Innovation Projects of Shandong Province (No. 2021CXGC011204).

Data Availability Statement

The data presented in this study are available upon request from the corresponding author. The data are not publicly available due to privacy.

Acknowledgments

The tests in the study were organized by the Key Laboratory of Building Structural Retrofitting and Underground Space Engineering, Shandong Jianzhu University, Ministry of Education.

Conflicts of Interest

The authors declare no conflict of interest.

References

  1. Zhang, C.T.; Li, Y.Y.; Wu, J.J. Mechanical Properties of Fiber-Reinforced Polymer (FRP) Composites at Elevated Temperatures. Buildings 2023, 13, 67. [Google Scholar] [CrossRef]
  2. Xian, G.J.; Zhou, P.; Bai, Y.B.; Wang, J.Q.; Li, C.G.; Dong, S.C.; Guo, R.; Li, J.H.; Du, H.Q.; Zhong, J. Design, preparation and mechanical properties of novel glass fiber reinforced polypropylene bending bars. Constr. Build. Mater. 2024, 429, 136455. [Google Scholar] [CrossRef]
  3. Guo, R.; Xian, G.J.; Li, C.G.; Hong, B. Effect of fiber hybrid mode on the tension-tension fatigue performance for the pultruded carbon/glass fiber reinforced polymer composite rod. Eng. Fract. Mech. 2022, 260, 108208. [Google Scholar] [CrossRef]
  4. Li, Y.Y. Experimental Investigation, Analysis and Design Methods for FRP/Steel-Concrete Composite Beam-Column Bridges Systems. Ph.D. Thesis, Dalian University of Technology, Dalian, China, 2023. [Google Scholar]
  5. Huang, H.; Wang, W.W.; Dai, J.G.; Brigham, J.C. Fatigue Behavior of Reinforced Concrete Beams Strengthened with Externally Bonded Prestressed CFRP Sheets. J. Compos. Constr. 2017, 21, 4016108. [Google Scholar] [CrossRef]
  6. Li, Y.Y.; Chen, J.; Shi, S.Y.; Hu, L.Y.; Xu, X. Study of the design and flexural performance of an innovative Fiber Reinforced Polymer/steel-concrete composite beam. Adv. Struct. Eng. 2023, 26, 121–136. [Google Scholar] [CrossRef]
  7. Du, Y.; Gao, D.; Chen, Z.; Deng, X.; Qian, K. Experimental study on the flexural behavior of square high-strength concrete-filled steel tube beams with different CFRP wrapping schemes. Compos. Struct. 2023, 304, 116325. [Google Scholar] [CrossRef]
  8. Kudus, S.A.; Bunnori, N.M.; Mustaffa, N.K.; Jamadin, A. Investigation on Acoustic Emission Parameters due to Fatigue Damage of Concrete Beams with Variable Notched Depth. Int. J. Concr. Struct. Mater. 2022, 16, 29. [Google Scholar] [CrossRef]
  9. Qiu, X.; Xu, J.; Xu, W.; Yang, Q.; Wang, F.; Yuan, J. Diagnosis of damage evolution process for asphalt mixtures using pattern recognition with acoustic emission signals. Constr. Build. Mater. 2021, 280, 122536. [Google Scholar] [CrossRef]
  10. Tang, W.; Lin, H.; Chen, Y.; Feng, J.; Hu, H. Mechanical Characteristics and Acoustic Emission Characteristics of Mortar-Rock Binary Medium. Buildings 2022, 12, 665. [Google Scholar] [CrossRef]
  11. Xu, Y.; Wang, H.; Li, M.; Li, P.; Zhao, P.; Ji, A.; Liu, L.; Liu, Y. Evaluation Method for the Bearing Capacity of Reinforced Concrete Beams Based on the Kaiser Effect. Buildings 2023, 13, 2003. [Google Scholar] [CrossRef]
  12. Wang, Y.; Chen, G.; Wang, Y.; Han, B.; Wan, B.; Hao, Q.; Bai, Y. Tensile strain and damage self-sensing of flax FRP laminates using carbon nanofiber conductive network coupled with acoustic emission. Compos. Struct. 2022, 290, 115549. [Google Scholar] [CrossRef]
  13. Qiu, J.; Yang, Q.; Qiu, X.; Xiao, S.L.; He, L.Y.; Hu, G.H. Use of acoustic emission for exploring characteristics and behaviors of mixed-mode fracture process of asphalt mixtures. Mater. Struct. 2022, 55, 199. [Google Scholar] [CrossRef]
  14. Yang, S.; Gao, Y.; Liu, X.; Wang, G.; Song, L.; Bao, C. Evolution of the Fracture Characteristics in a Rockburst under Different Stress Gradients. Buildings 2022, 12, 1927. [Google Scholar] [CrossRef]
  15. Gutkin, R.; Green, C.J.; Vangrattanachai, S.; Pinho, S.T.; Robinson, P.; Curtis, P.T. On acoustic emission for failure investigation in CFRP: Pattern recognition and peak frequency analyses. Mech. Syst. Signal Process. 2011, 25, 1393–1407. [Google Scholar] [CrossRef]
  16. Sayar, H.; Azadi, M.; Ghasemi-Ghalebahman, A.; Jafari, S.M. Clustering effect on damage mechanisms in open-hole laminated carbon/epoxy composite under constant tensile loading rate, using acoustic emission. Compos. Struct. 2018, 204, 1–11. [Google Scholar] [CrossRef]
  17. Li, D.; Du, F.; Chen, Z.; Wang, Y. Identification of failure mechanisms for CFRP-confined circular concrete-filled steel tubular columns through acoustic emission signals. Smart. Struct. Syst. 2016, 18, 525–540. [Google Scholar] [CrossRef]
  18. Ding, Y.; Nie, M.; Xu, Y.; Miao, H. A Classification Method of Earthquake Ground Motion Records Based on the Results of K-Means Clustering Analysis. Buildings 2024, 14, 1831. [Google Scholar] [CrossRef]
  19. Mansouri, T.; Ravasan, A.Z.; Gholamian, M.R. A Novel Hybrid Algorithm Based on K-Means and Evolutionary Computations for Real Time Clustering. Int. J. Data. Warehous. Min. 2014, 10, 1–14. [Google Scholar] [CrossRef]
  20. Liu, Y.; Zhang, L.; Li, Z.; Chen, Z.; Huang, K.; Guo, L. Investigation on damage evolution of open-hole plain woven composites under tensile load by acoustic emission signal analysis. Compos. Struct. 2023, 305, 116481. [Google Scholar] [CrossRef]
  21. Zang, W.; Wang, Z.; Jiang, D.; Liu, X. A Kernel-Based Intuitionistic Fuzzy C-Means Clustering Using Improved Multi-Objective Immune Algorithm. IEEE Access 2019, 7, 84565–84579. [Google Scholar] [CrossRef]
  22. Du, F.; Li, X.; Li, D.; Shen, W. Self-adaptive real-time clustering analysis and damage pattern recognition for steel tube confined reinforced concrete structures through acoustic emission signals. Struct. Control Health Monit. 2022, 29, e3071. [Google Scholar] [CrossRef]
  23. Tsangouri, E.; Aggelis, D.G. A review of acoustic emission as indicator of reinforcement effectiveness in concrete and cementitious composites. Constr. Build. Mater. 2019, 224, 198–205. [Google Scholar] [CrossRef]
  24. Yun, H.; Choi, W.; Seo, S. Acoustic emission activities and damage evaluation of reinforced concrete beams strengthened with CFRP sheets. NDTE Int. 2010, 43, 615–628. [Google Scholar] [CrossRef]
  25. Sagar, R.V.; Prasad, B.; Kumar, S.S. An experimental study on cracking evolution in concrete and cement mortar by the b-value analysis of acoustic emission technique. Cem. Concr. Res. 2012, 42, 1094–1104. [Google Scholar] [CrossRef]
  26. Qin, L.; Guo, C.C.; Sun, W.; Chu, X.X.; Ji, T.G.; Guan, H. Identification of damage mechanisms of polymer-concrete in direct shearing tests by acoustic emission. Constr. Build. Mater. 2022, 351, 128813. [Google Scholar] [CrossRef]
  27. Gong, Y.; Wu, S.; Ning, C.; Hu, X.; Yi, Z.; Du, H. Shear Performance and Damage Characterization of Prefabricated Basalt Fiber Reactive Powder Concrete Capping Beam Formwork Structure. Buildings 2024, 14, 1701. [Google Scholar] [CrossRef]
  28. Tsangouri, E.; Remy, O.; Boulpaep, F.; Verbruggen, S.; Livitsanos, G.; Aggelis, D.G. Structural health assessment of prefabricated concrete elements using Acoustic Emission: Towards an optimized damage sensing tool. Constr. Build. Mater. 2019, 206, 261–269. [Google Scholar] [CrossRef]
  29. Barile, C.; Casavola, C.; Pappalettera, G.; Vimalathithan, P.K. Damage characterization in composite materials using acoustic emission signal-based and parameter-based data. Compos. Part B Eng. 2019, 178, 107469. [Google Scholar] [CrossRef]
  30. Wu, G.M.; Han, R.Q.; Li, S.L.; Guo, P. Quantitative damage analysis of brick masonry under uniaxial compression and shear using acoustic emission technology. Struct. Control Health Monit. 2022, 29, e3130. [Google Scholar] [CrossRef]
  31. Abouhussien, A.A.; Hassan, A. The Use of Acoustic Emission Intensity Analysis for the Assessment of Cover Crack Growth in Corroded Concrete Structures. J. Nondestr. Eval. 2016, 35, 52. [Google Scholar] [CrossRef]
  32. Du, F.; Li, D.; Li, Y. Fracture Mechanism and Damage Evaluation of FRP/Steel-Concrete Hybrid Girder Using Acoustic Emission Technique. J. Mater. Civ. Eng. 2019, 31, 4019111. [Google Scholar] [CrossRef]
  33. Zhao, Z.; Zhang, R.W.; Cox, J.; Duling, D.; Sarle, W. Massively parallel feature selection: An approach based on variance preservation. Mach. Learn. 2013, 92, 195–220. [Google Scholar] [CrossRef]
  34. Huang, R.; Jiang, W.; Sun, G. Manifold-based constraint Laplacian score for multi-label feature selection. Pattern Recognit. Lett. 2018, 112, 346–352. [Google Scholar] [CrossRef]
  35. Murtaza, M.; Sharif, M.; Yasmin, M.; Fayyaz, M.; Kadry, S.; Lee, M.Y. Clothes Retrieval Using M-AlexNet with Mish Function and Feature Selection Using Joint Shannon’s Entropy Pearson’s Correlation Coefficient. IEEE Access 2022, 10, 115469–115490. [Google Scholar] [CrossRef]
  36. Moshtaghi, M.; Bezdek, J.C.; Erfani, S.M.; Leckie, C.; Bailey, J. Online cluster validity indices for performance monitoring of streaming data clustering. Int. J. Intell. Syst. 2019, 34, 541–563. [Google Scholar] [CrossRef]
  37. Zhao, W.; Lei, Y.; Yin, P.; Wang, Z.; Zhu, B. Investigation on acoustic emission characteristics and time-space evolution mechanism of interface bond failure of concrete-filled steel tube. J. Build. Struct. 2021, 42, 200–209. [Google Scholar]
  38. Li, L.; Lomov, S.V.; Yan, X.; Carvelli, V. Cluster analysis of acoustic emission signals for 2D and 3D woven glass/epoxy composites. Compos. Struct. 2014, 116, 286–299. [Google Scholar] [CrossRef]
  39. Lai, Y.S.; Xiong, Y.; Cheng, L.F. Frequency band energy characteristics of acoustic emission signals In damage process of concrete under uniaxial compression. J. Vib. Shock 2014, 32, 12–19. [Google Scholar]
  40. Alver, N.; Tanarslan, H.; Tayfur, S. Monitoring fracture processes of CFRP-strengthened RC beam by acoustic emission. J. Infrastruct. Syst. 2016, 23, B4016002. [Google Scholar] [CrossRef]
  41. GB50292-2015; Standard for Appraisal of Reliability of Civil Buildings. China Architecture Publishing and Media Co., Ltd.: Beijing, China, 2015.
Figure 1. Design and construction of composite beams. (a) Details of section shape, dimensions, and shear interface. (b) Photographs of composite beams.
Buildings 14 02378 g001
Figure 2. Experimental schematic and sensor arrangement (units in mm).
Buildings 14 02378 g002
Figure 3. Installed test equipment.
Buildings 14 02378 g003
Figure 4. Cluster validity analysis for composite beams.
Buildings 14 02378 g004
Figure 5. Comparison of the SARTC and K-means. (a) Cluster results of SARTC for GS0. (b) Cluster results of K-means for GS0. (c) Cluster results of SARTC for GS2. (d) Cluster results of K-means for GS2.
Buildings 14 02378 g005
Figure 6. Fluctuation of cumulative AE response versus time for specimen GS0. (a) Cumulative signal number of each cluster. (b) Cumulative energy of each cluster.
Buildings 14 02378 g006
Figure 7. Fluctuation of cumulative AE response versus time for specimen GS2. (a) Cumulative signal number of each cluster. (b) Cumulative energy of each cluster.
Buildings 14 02378 g007
Figure 8. Damage patterns of FRP/steel-concrete composite beams. (a) Penetration of concrete cracks. (b) Fracturing of FRP/steel laminate and crushing of concrete.
Buildings 14 02378 g008
Figure 9. The intensity analysis charts for GS0. (a) History curve of index value. (b) Intensity analysis chart.
Buildings 14 02378 g009
Figure 10. The intensity analysis charts for GS2. (a) History curve of index value. (b) Intensity analysis chart.
Buildings 14 02378 g010
Figure 11. The non-linear logarithmic for local damages. (a) Logarithmic fitting of strain response. (b) Logarithmic fitting of deflection response.
Buildings 14 02378 g011
Table 1. Details of materials.
MaterialYield Strength (MPa)Tensile Strength (MPa)Compression Strength (MPa)Elastic Modulus (GPa)Thickness (mm)Elongation (%)
Steel plate236.4355.72100 or 210.9
U-type laminate192.814.8191.9
Concrete63.537.250
Table 2. Detailed information of test specimens.
Specimen NameplateSteel PlateConcreteSupporting SpanTop Loading Span
GS00C503300 mm700 mm
GS22 mmC503300 mm700 mm
Table 3. DAQ features of the AE system.
Sensor TypeSensitive BandwidthThresholdSampling RatePDT (μs)HDT (μs)HLT (μs)
R-15a50–250 kHz40 dB3 MSPS3008001000
WD100–400 kHz40 dB3 MSPS3008001000
Table 4. Laplacian score and ranks of composite beams.
Specimen NameplateAttributes
Ranks
Rise
Time
Ring
Count
EnergyDurationAmplitudeSignal StrengthPeak Frequency
GS0Lr Value0.52420.48691.01420.58960.02071.01440.0003
Ranks4365271
GS2Lr Value0.59080.55741.14710.68810.01371.14700.0005
Ranks4375261
Is or not retainedNoYesNoNoYesNoYes
Table 5. Comparison of the clustering results for different clustering methods.
Specimen NameplateControlling ParameterClustering MethodCluster 1Cluster 2Cluster 3
GS0R = 0.3 and C = 1.3 RSARTC 14,78516104193
K = 3K-means13,58916135386
GS2R = 0.2 and C = 1.5 RSARTC 14,81716034821
K = 3K-means13,70716145920
Table 6. Statistical analysis of AE features for specimen GS0.
Average Value of AE FeaturesDuration (μs)Ring CountEnergyAmplitude (dB)Peak Frequency (kHz)Signal NumberEnergy Contribution Ratio (%)
Cluster 1529.907.475.3045.1134.9914,7858.65
Cluster 2107.646.196.2546.82408.7316101.11
Cluster 33149.9858.74195.0464.6438.44419390.24
Table 7. Statistical analysis of AE features for specimen GS2.
Average Value of AE FeaturesDuration (μs)Ring CountEnergyAmplitude (dB)Peak Frequency (kHz)Signal NumberEnergy Contribution Ratio (%)
Cluster 1479.577.643.0644.7746.7014,8179.53
Cluster 298.526.114.7947.35410.5116031.61
Cluster 31921.751.7587.6763.1142.35482188.86
Table 8. Standard for appraisal of components safety.
GradesAppraisal CriterionDisposal Requirement
auThe safety meets the requirements of au level and has sufficient bearing capacityNo need to take any measures
buThe safety is slightly lower than the requirement of au level, and the loading capacity was not affected significantlyAppropriate measures can be taken
cuThe safety cannot meet the requirements of au level, which significantly affects the bearing capacityAppropriate measures should be taken
duThe safety cannot meet the requirements of au level, which has seriously affected the bearing capacityReliable measures should be taken immediately
Specific requirements of “au level” were stipulated in terms of cracking, deformation, bearing capacity, etc.; for details, see the China Appraisal Standard [41].
Disclaimer/Publisher’s Note: The statements, opinions and data contained in all publications are solely those of the individual author(s) and contributor(s) and not of MDPI and/or the editor(s). MDPI and/or the editor(s) disclaim responsibility for any injury to people or property resulting from any ideas, methods, instructions or products referred to in the content.

