Article

Construction Mechanical Characteristics and Monitoring Analysis of the Existing Subway over the Newly Built Long Foundation Pit

1
School of Architectural Engineering, Shenyang University, Shenyang 110044, China
2
Highway Engineering Quality Testing Center, Liaoning Provincial College of Communications, Shenyang 110122, China
*
Author to whom correspondence should be addressed.
Buildings 2024, 14(8), 2385; https://doi.org/10.3390/buildings14082385
Submission received: 6 July 2024 / Revised: 25 July 2024 / Accepted: 31 July 2024 / Published: 2 August 2024
(This article belongs to the Section Building Energy, Physics, Environment, and Systems)

Abstract

:
In view of the safety of the construction of the long foundation pit of the new upper span to the existing subway under urban complex environment conditions, combined with the construction of the intersection section of the first line of the existing subway across the north–south Expressway in Shenyang, the mechanical properties during construction were studied by means of numerical simulation and on-site monitoring. The results showed that the general deformation characteristic of the existing metro tunnel was “uplift first, then restrain”. The local deformation characteristic was an unloading rebound in the cross region, and a compression deformation occurs outside the cross region. The index could be controlled in the range of the control value of the existing line protection by adopting the measures consisting of an uplift pile + capping beam balance, reinforcing the surrounding soil, the excavation of the foundation pit in sections, and the comprehensive construction.

1. Introduction

With the rapid economic development in China, the urban expressway network has expanded to the underground. However, due to the existing dense traffic wiring network in central cities, the problems resulting from the intersection of the new tunnels with the existing ones have become increasingly prominent. Generally, the buried depth of urban road networks is relatively shallow, and the construction methods are more complex than those of deep tunnels. The excavation above existing tunnels is a complex and comprehensive issue, making the safety of new and existing structures as well as the surrounding environment particularly prominent [1,2,3,4]. Currently, the research conducted by relevant scholars on the mechanical characteristics of new foundation pits spanning existing subways is mainly carried out through theoretical analysis, test models, numerical calculations, and on-site monitoring.
Under the increasingly complex situation of underground transportation networks in various countries, various complex conditions are often encountered during the construction process of an existing subway tunnel on a new foundation pit, and simplifications and hypotheses are often required in the process of a theoretical analysis [5,6,7,8]. Facing the current complex and changeable construction site environment, the reliability of the theoretical analysis formula needs to be verified repeatedly by more practical engineering, and the theoretical analysis method has high requirements for users, so its practicability needs to be improved.
Similar to theoretical analysis, although test models can obtain accurate data, their costs are high. Moreover, test models may not be able to simulate complex construction conditions and are affected by the reduction in model scale. Compared with the actual project, it is also necessary to deeply study the change in the size effect on the influence of various factors in the construction process of the existing subway tunnel on the new foundation pit, and there are certain difficulties in the quantitative analysis of the problem [9,10].
For practical engineering problems, the use of a single research method is often unilateral, which requires researchers to mutually combine and modify various methods. Relying on powerful computer instances, numerical simulation can simulate as many complex construction conditions as possible and analyze the entire construction process simultaneously. If combined with the field measured data and the appropriate constitutive model, boundary conditions, and other calculation parameters are adopted, the research progress can be effectively promoted, and the construction scheme can be optimized [11]. Additionally, in the study of Zhang et al. [12], it was found that automated field monitoring was affected by multiple factors, and its monitoring value may have large errors. Therefore, in the actual monitoring process, it is necessary to regularly conduct manual monitoring and constantly correct the errors in the automatic monitoring process to combine it with numerical simulations and improve the accuracy of numerical simulations in the analysis of practical problems.
Scholars worldwide have a certain foundation for the research on the mechanical characteristics of an existing subway across a deep foundation pit [13,14,15,16]. However, the excavation of a long foundation pit has a broader impact on the existing subway. Due to its wide construction scope, it may encounter different geological conditions and changes in surrounding buildings, resulting in increased construction difficulty. Based on the construction process of an expressway spanning an existing subway tunnel in Shenyang, China, this paper establishes a finite element model to analyze the construction measures, surrounding environment, and the safety of the existing structure of a new shallow-buried highway tunnel and carries out a tracking and monitoring analysis of the construction of the existing subway tunnel. The results can be used as a reference for similar projects.

2. Project Overview

2.1. Project Introduction

The new tunnel of the project traverses the shield section of the existing metro Line 1 at the position of mileage K4 + 390.994~K4 + 418.894. The inner diameter of the shield tunnel is 5.4 m, the outer diameter is 6.0 m, the thickness of the segments is 300 mm, the width of the ring is 1.2 m, and the top elevation of the shield tunnel is 38.764 m~39.459 m, with the thickness of the soil cover being approximately 10.14 m. The newly built tunnel is oblique to the tunnel of Metro Line 1, and the oblique angles are 61.6° on the upbound line and 60.1° on the downbound line, respectively (Figure 1). The cross-sectional structure of the main line of the new tunnel is a single-layer double-span box-type structure, and the open-cut construction method was adopted. The nearest distance between the excavation face at the bottom of the foundation pit and the tunnel top at the interval is 2.483 m. The foundation pit width of the new tunnel is 20.5 m in the intersecting segments, and the excavation depth is 7.26–7.37 m.

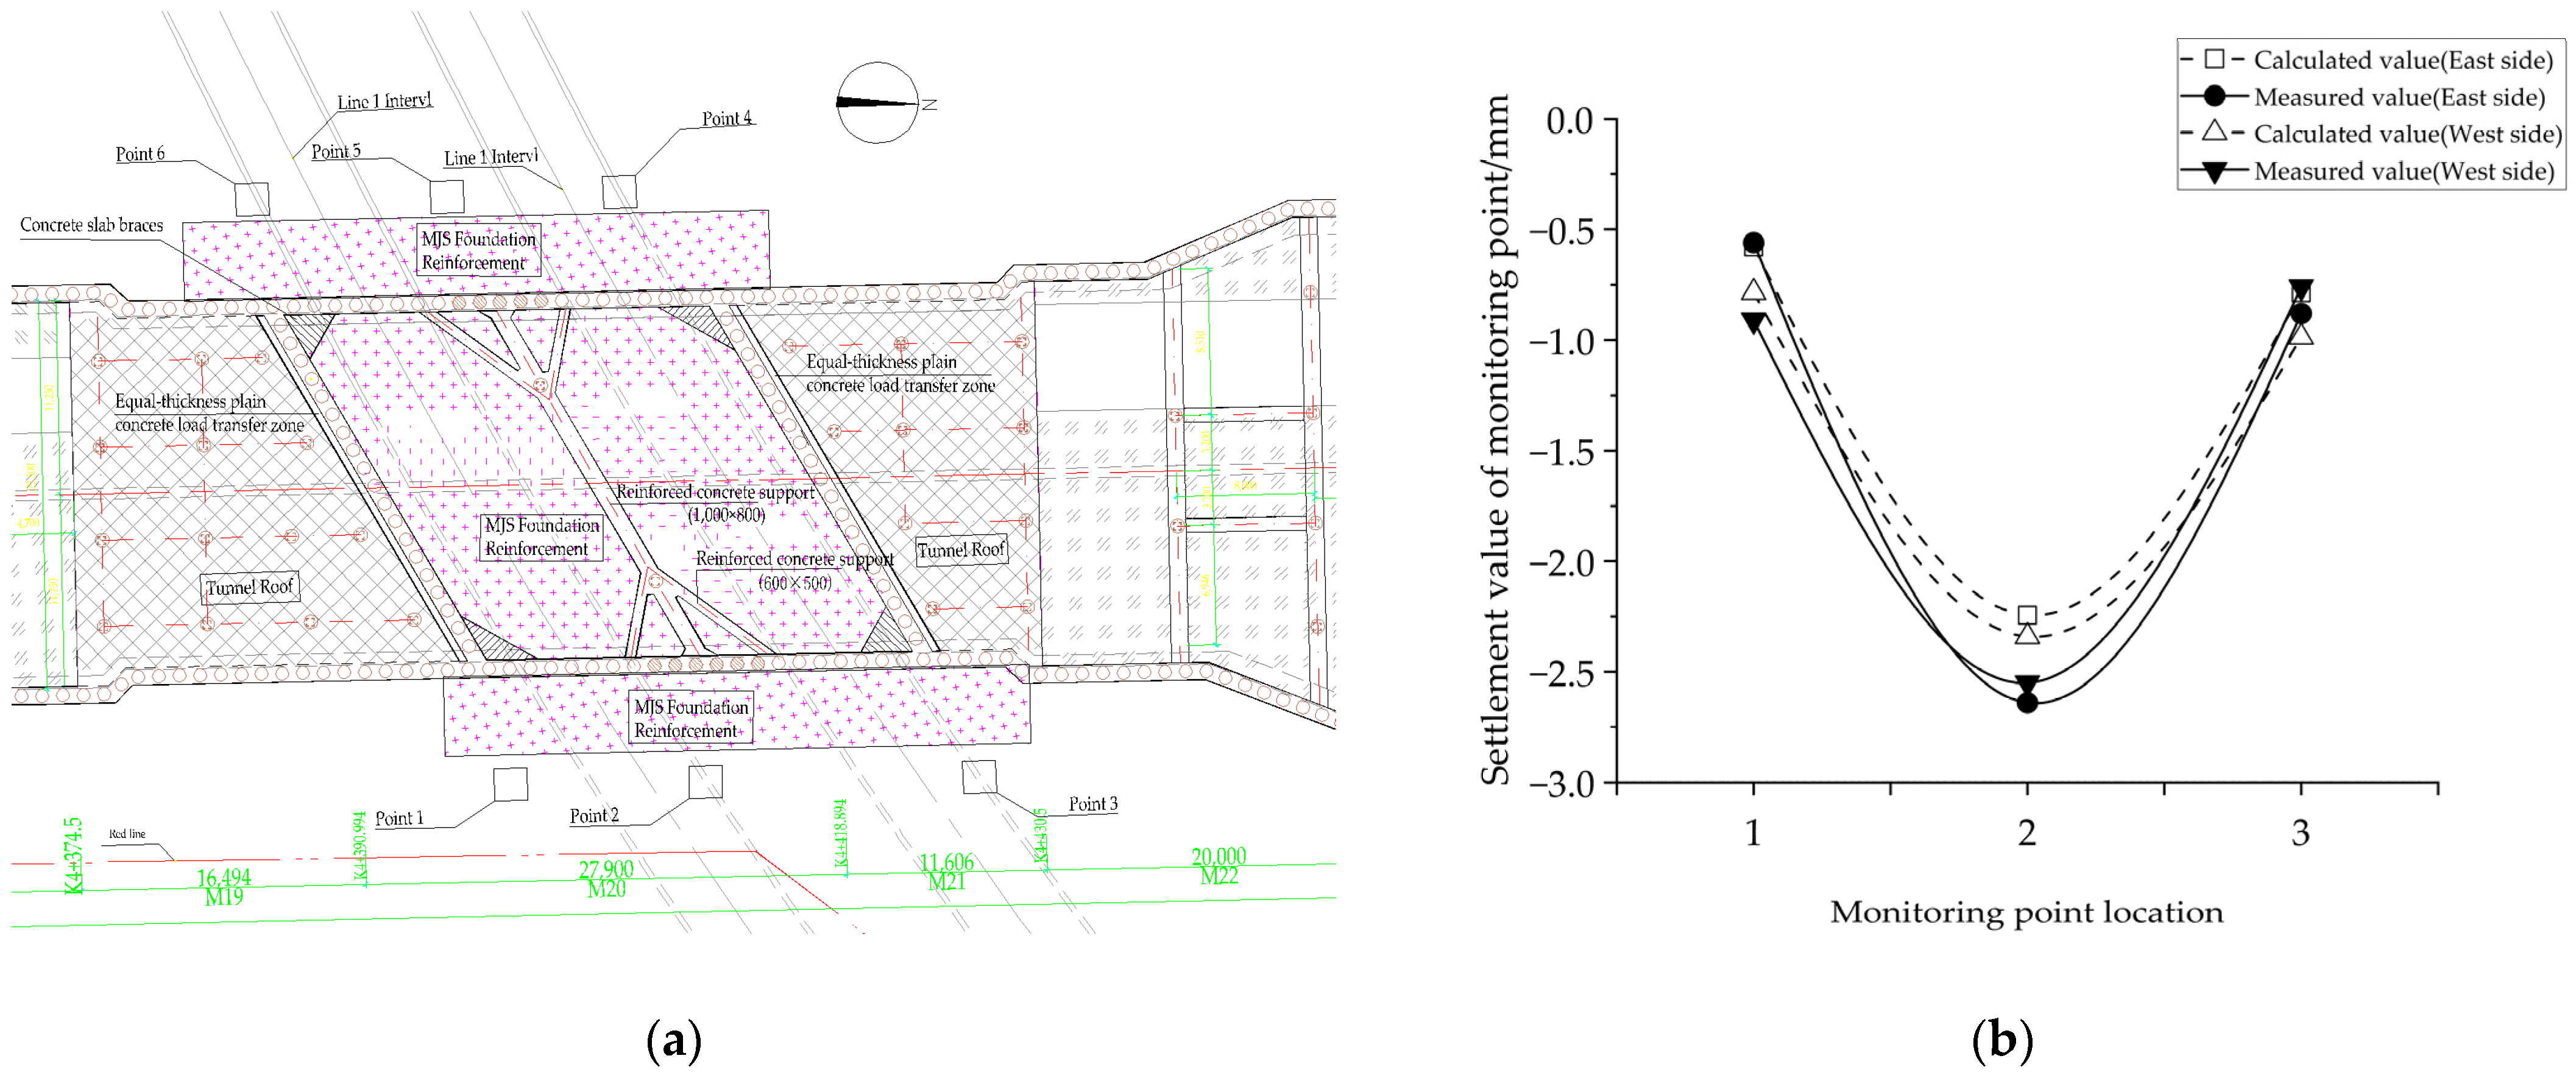
2.2. Crossing Section Construction Plan

In order to reduce the impact of stratigraphic deformation on Metro Line 1 and ensure the safety of the metro tunnel, the soil around the intersecting segments was reinforced by the Metro Jet System (MJS). The MJS construction method, also known as all-round high-pressure jet grouting method, uses high-pressure water, high-pressure air, and high-pressure cement slurry media, through the unique porous pipe and front end of the device, to cut and destroy the surrounding soil with a high-pressure jet. A series of processes such as pressurized conveying, spraying, cutting formation, mixing, mud discharge, mud concentration, and mud transport of hardened material were monitored as objects, which is a construction method that can carry out horizontal, vertical, inclined, and 360° all-round foundation reinforcement. A scope of 4.6m wide in the east and west directions outside the pit of the enclosure structure and 5.331–5.387 m below the foundation pit bottom was mainly strengthened by the reinforcement of entire basal soil, and the reinforcement depth was 5.36 m below the tunnel floor (Figure 2 and Figure 3).
In order to verify the accuracy of the numerical simulation calculation, the surface settlement monitoring points were arranged in the construction section of the intersection points, and the monitoring points were arranged as shown in Figure 2a. The settlement value of the surrounding surface monitoring point under the most unfavorable working condition 5 was compared with the simulated value and monitoring data, and the comparison results are shown in Figure 2b. It can be seen from Figure 2b that the change rule of the numerical simulation during excavation was basically the same as that of the monitored value, and the calculated maximum value was 2.34 mm, while the measured value was 2.55 mm, the difference between the calculated result and the measured value was less than 10%. It can be seen that the numerical model adopted in this paper had a certain accuracy and could be applied to the subsequent analysis.
The intersecting segments adopted the comprehensive construction scheme of “uplift pile + capping beam balance, strengthening the surrounding soil, foundation pit excavation by strip, the bottom plate was poured in layering, and dewatering around the foundation pit”. The main construction processes were as follows (Figure 4): construction of uplift piles on the existing subway section of the upper span → the reinforcement of the inner and outer strata of the foundation pit → the construction of the enclosure piles on both sides of the foundation pit → the construction of the foundation pit of the upper-span subway section and the construction of the dewatering → capping beam construction → the construction of the first concrete support and excavation of the first support subsoil → the symmetrical excavation of the second layer of earthwork → the symmetrical pouring of the lower concrete floor in blocks → the overall pouring of the upper floor → the main structure construction → backfill, pavement restoration.

3. Finite Element Model of the Construction of an Existing Metro Open-Cut Expressway Tunnel on the Upper Span

3.1. Selection of Stratum and Structural Parameters

The terrain of this section was relatively flat, and the surface elevation ranged from 46.50 to 50.33 m. The strata from top to bottom were: (1) miscellaneous fill, (2) silty clay, (3) medium and coarse sand, (4) gravel sand, (5) round gravel. According to the excavation depth, the sand layer was the main stratum in the construction area of this section. The surrounding soil mass of the intersecting segments was reinforced by the Metro Jet System (MJS) [17]. The reinforced area mainly involved the enclosure structure. The method of reinforcing the entire basal soil was adopted for the 4.6 m wide area outside the pit in the east and west directions and 5.331–5.387 m below the foundation pit bottom. The reinforcement depth was 5.36 m below the tunnel floor. The formation parameters used in this analysis are shown in Table 1.
In the newly built tunnel, the foundation pit support adopted bored piles with a diameter of 800 mm and a spacing of 1200 mm + net spray concrete. The pile length ranged from 9.03 m to 12.913 m. The support employed the internal support system. The size of the first concrete support at the top of the foundation pit was 1000 mm × 800 mm. When the excavation reached a depth of 3.5 m, 16 steel pipe supports with a diameter of 609 mm were set. The thicknesses of the structural bottom plate and side wall were 900 mm and 800 mm, respectively. The specific structural parameters are shown in Table 2.

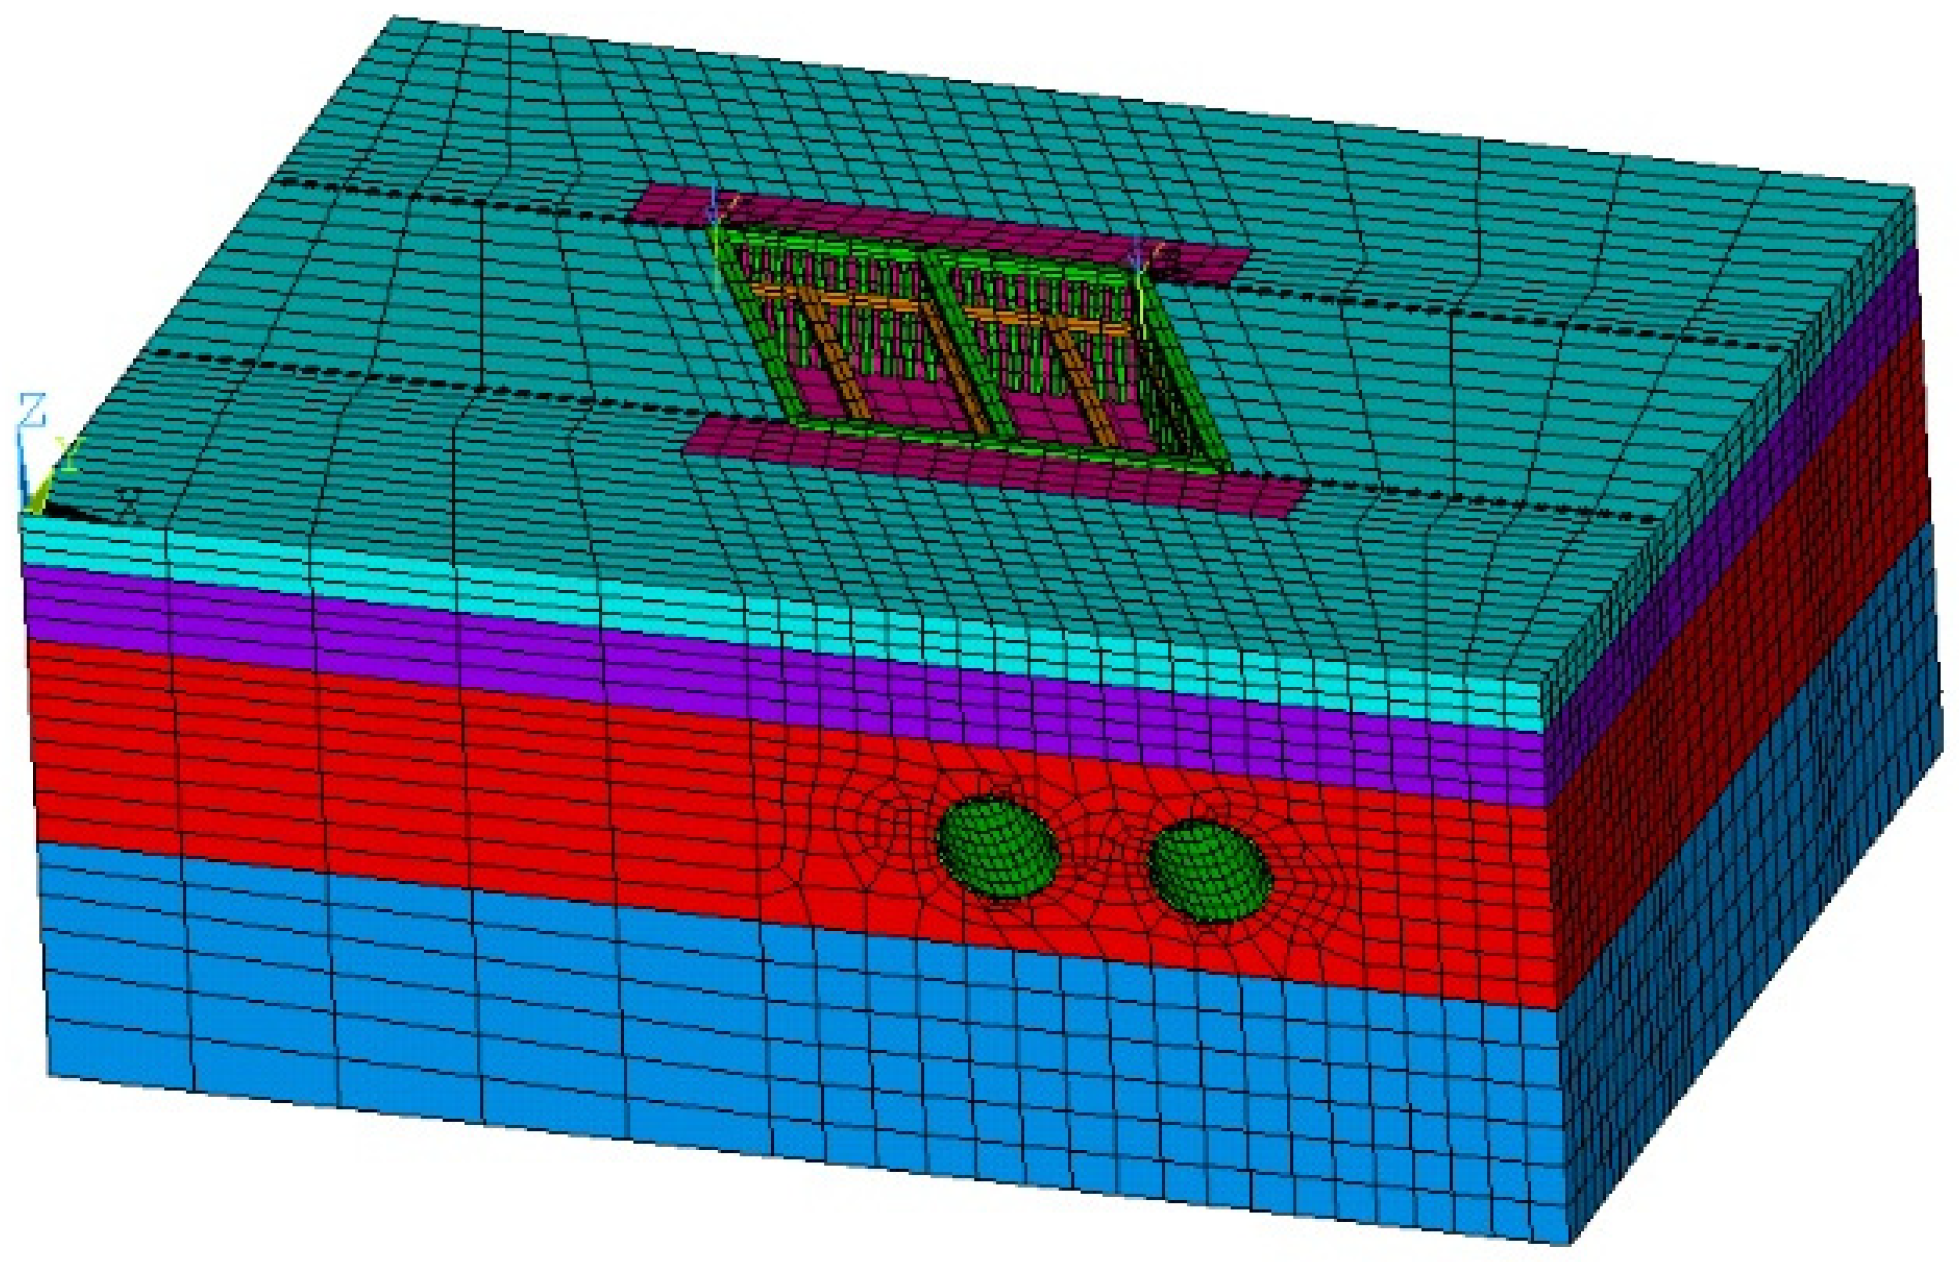
3.2. Stratigraphic Model

The Drucker–Prager criterion (referred to as D-P criterion) was selected as the formation constitutive model for this analysis [18,19,20]. The yield criterion is an approximation of the Mohr–Coulomb criterion and was developed based on the von Mises strength criterion to consider the effects of the average principal stress on the shear strength of the soil. Since the yield surface of the D-P criterion is a circle in the plane and the yield surface of the D-P criterion does not change with the gradual yield of the material, there is no reinforcement criterion, and the convergence of the calculation is relatively easy to be guaranteed. The D-P criterion can be expressed as:
δ e = 3 β δ m + 1 2 S T M S = δ y
where S is the deviatoric stress; δ m = 1 3 ( δ x + δ y + δ z ) is the average stress; M is the matrix of constant coefficients.
The expressions for material constant β and yield strength δ y are as follows:
β = 2 sin ϕ 3 ( 3 sin ϕ )
δ y = 6 cos ϕ 3 ( 3 sin ϕ )
where ϕ is the internal friction of the material; c is the cohesive force of the material.
The parameter was input through the TBDATA command in ANSYS11. Other structural materials such as the steel support, steel curb girder, and reinforced concrete adopted a linear elastic constitutive relation.

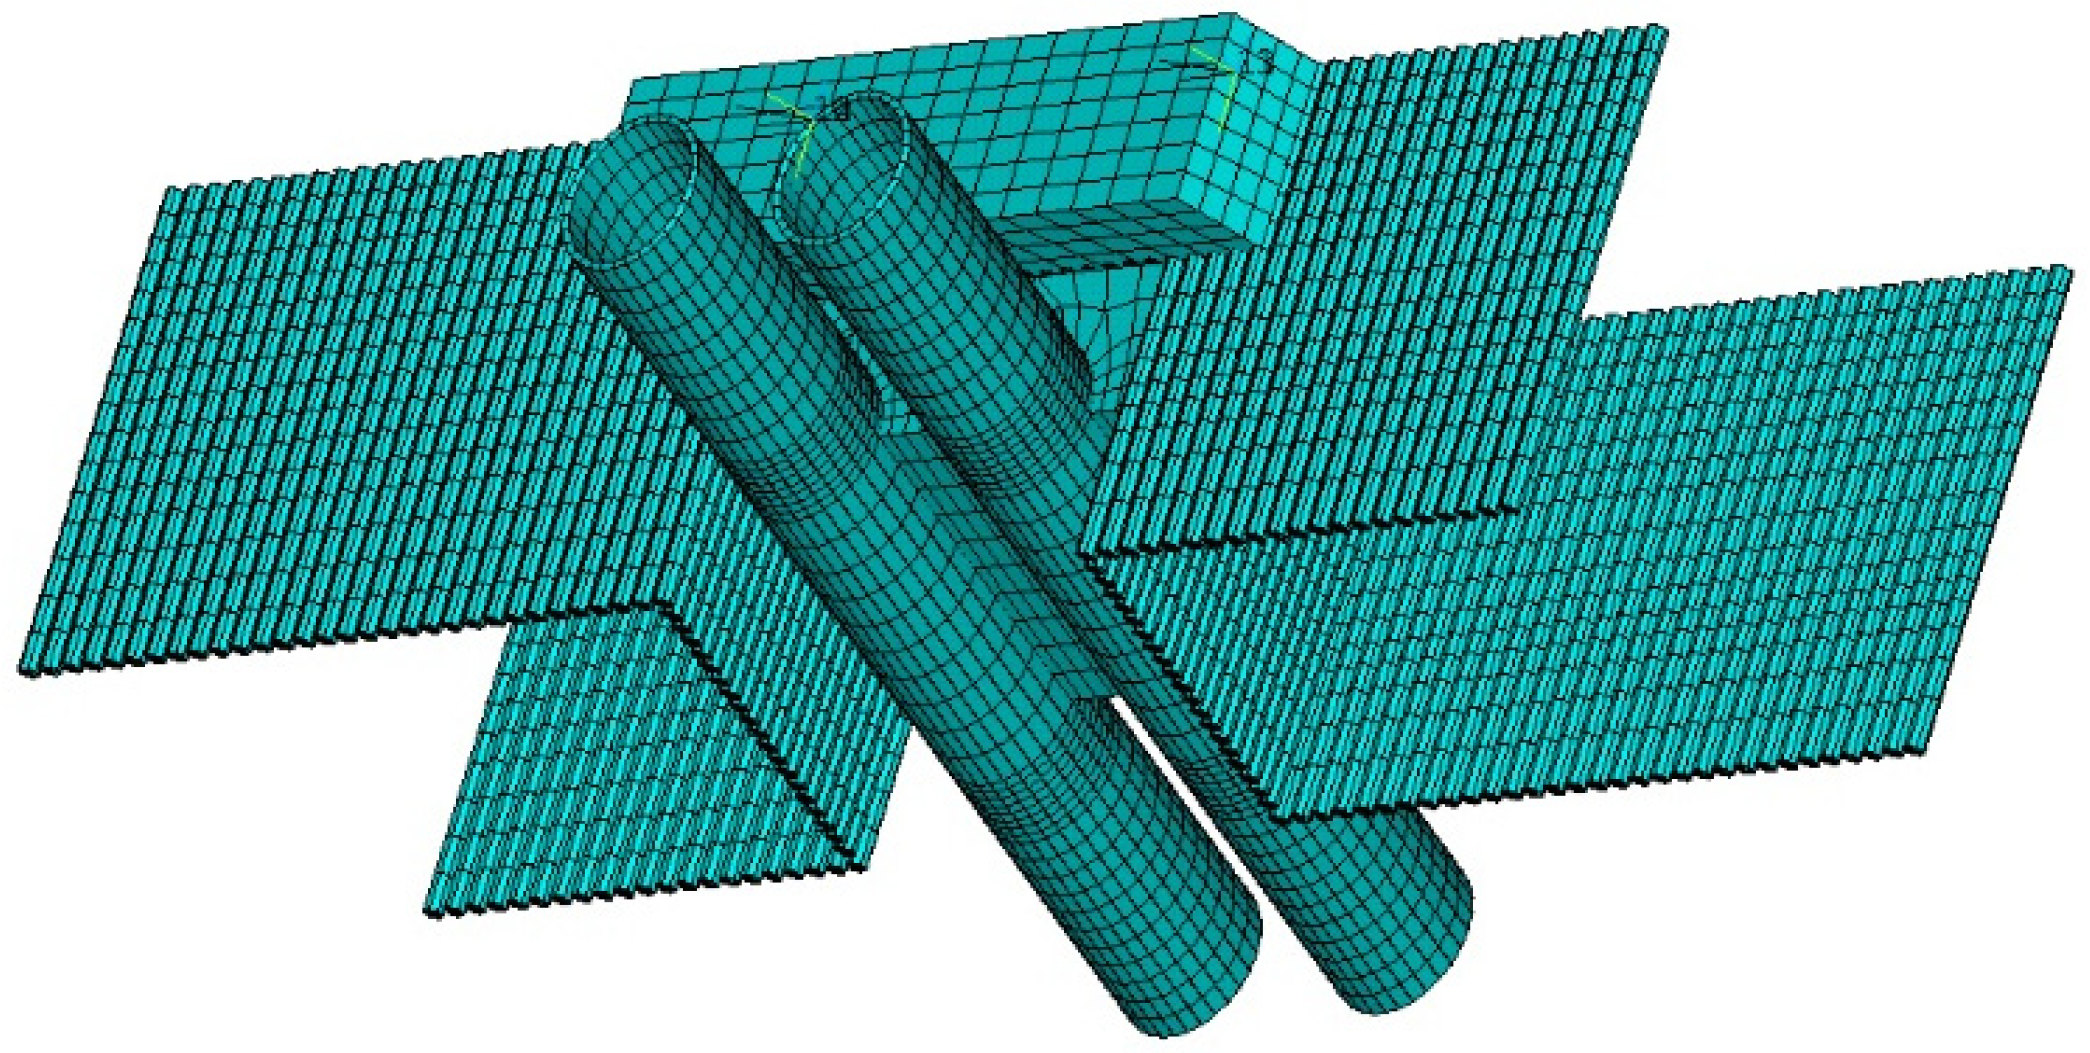
3.3. Finite Element Model

According to the Saint-Venant principle, when the analysis boundary area exceeds the excavation area by more than 3 times, the stress change is within the acceptable range [21,22]. Therefore, the calculation scale of this analysis was determined as 90 m in the X direction, 35 m in the Y direction, and 60 m in the Z direction. In addition, since the project adopted dewatering construction, the influence of water seepage on the intersecting segments construction and the formation creep effect were not considered in the finite element model [23,24,25,26,27,28].
The isotropic plate element shell63 was utilized to simulate the existing shield lining structure and new structure, the beam element beam188 was used to simulate the foundation pit’s retaining pile and concrete support, and the solid element SOLID45 was used to simulate the soil and reinforced soil. In the calculation model, the envelope structure and the formation were modeled separately and shared nodes.
The top surface of the model boundary was a free boundary, and the other surfaces were set as normal constraints; the finite element model established according to this idea is shown in Figure 5, and Figure 6 is the model of the existing tunnel structure, pit enclosure structure, and reinforcement area in the model. In the analysis process, the excavation and backfilling of the new upper-span subway pit, as well as the secondary structure of the construction, was simulated using ANSYS11’s unit birth and death method. In this analysis, the “life and death” function of the software is employed to simulate the tunnel construction process. In ANSYS, the life and death function of the element is realized through modifying the stiffness of the element. To simulate the excavation process, the element stiffness was multiplied by a small coefficient. Similarly, when the element was “alive”, such as the newly constructed envelope, etc., it was also accomplished by modifying the stiffness coefficient.
From the perspective of representing the construction characteristics of the project and reducing the calculation amount, the construction analysis conditions were determined as follows: working condition 1—original ground stress analysis; working condition 2—stratum reinforcement and construction envelope; working condition 3—foundation pit capping beam, first support construction, and first layer soil excavation; working condition 4—excavation on both sides of the second layer, steel pipe bracing, and curb girder surrounding construction; working condition 5—the second layer of core soil excavation; working condition 6—removal of support and construction of structure; working condition 7—remove the first support and backfill the soil.

4. Analysis of Finite Element Results for the Construction of the Existing Metro Open-Cut Expressway Tunnel on the Upper Span

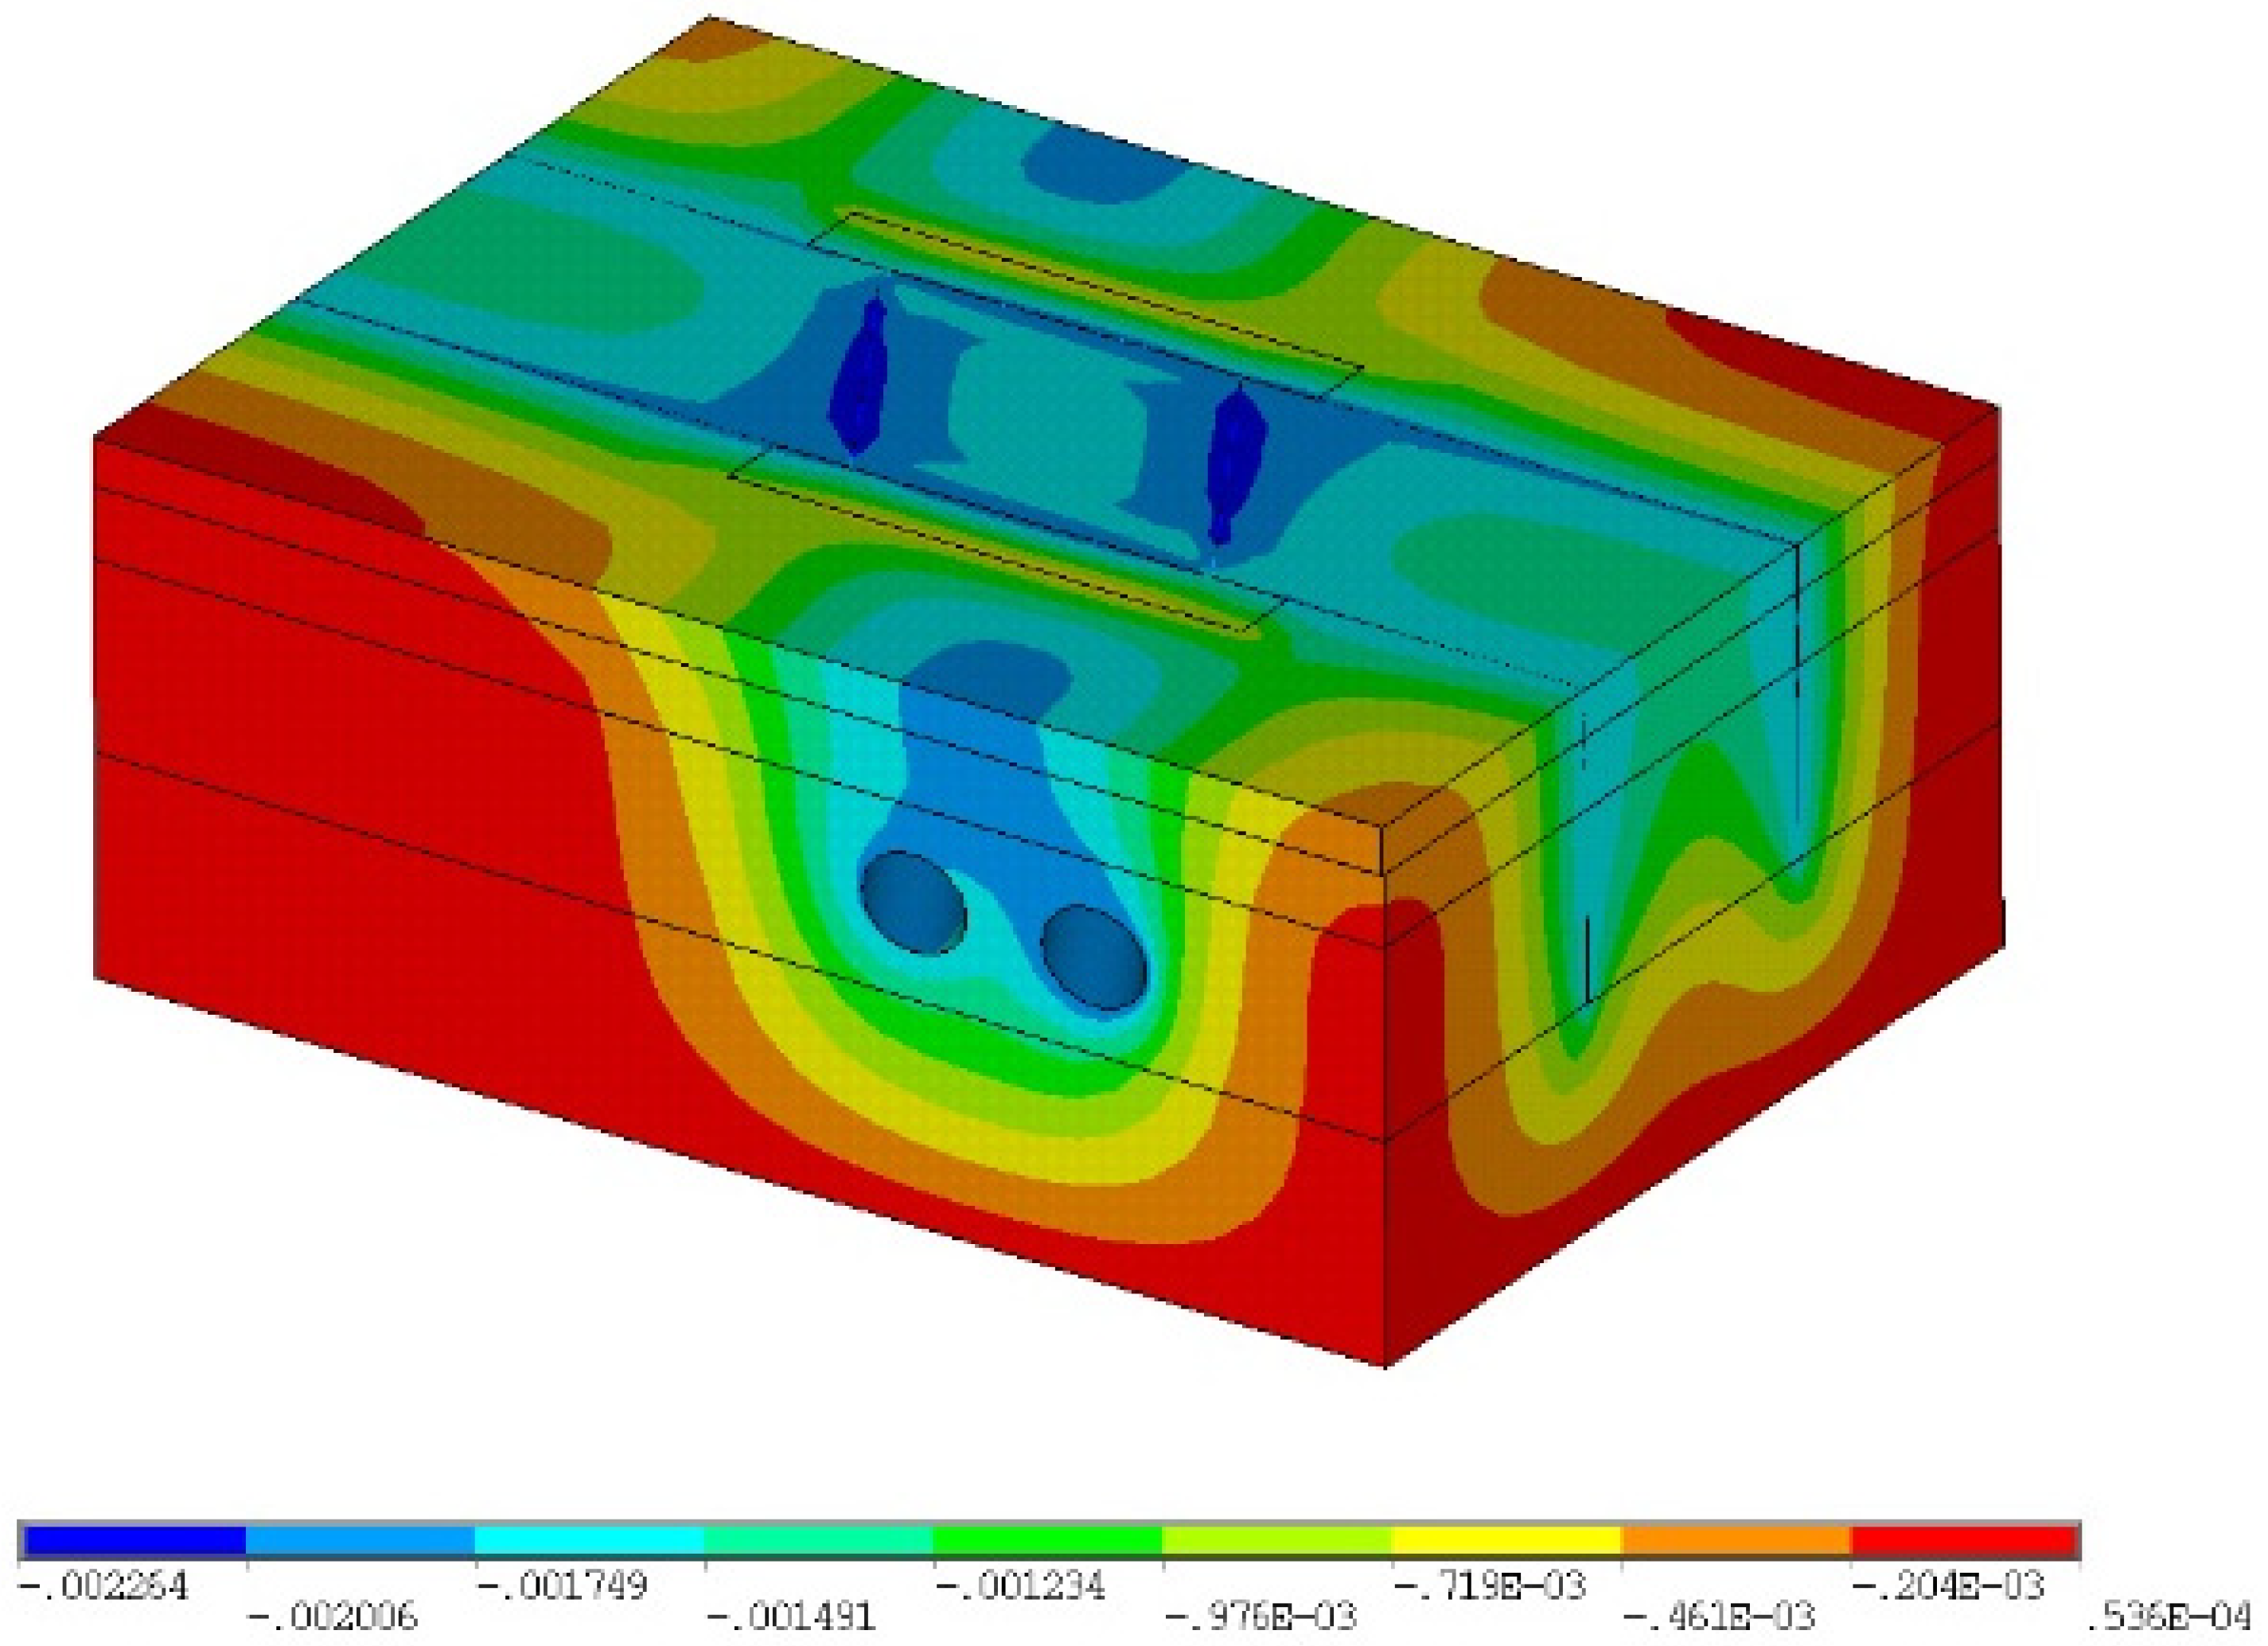
4.1. Stratigraphic Deformation Analysis in the Zone of Influence

Figure 7 shows the stratum deformation map after the completion of the envelope structure and MJS stratum reinforcement in the affected area. It can be seen that when the stratum reinforcement was performed, the stratum around the reinforcement was disturbed, the stratum around the construction was settled, and the maximum deformation point of the stratum was evenly distributed near the construction site of the envelope structure. At the same time, there was also some subsidence area above the existing subway tunnel, but its subsidence value was small. Figure 8 shows the stratum deformation diagram when the upper-span foundation pit is excavated to the bottom, that is, under the most unfavorable working condition 5. As can be seen from Figure 8, under this working condition, due to excavation unloading of the foundation pit, uplift appeared at the bottom of foundation pit, and the uplift value was 5.468 mm. Settlement occurred around the excavation area of the upper-span foundation pit, and it can be seen that the settlement area was mainly concentrated in the areas on both sides of the construction section of the upper-span tunnel, with a maximum settlement value of −2.675 mm. The main reasons were the construction of the upper-span expressway envelope structure, so the inner and outer strata were “isolated”. In addition, there was a local settlement area above the existing subway tunnel, and the maximum settlement value in that area was −2.1 mm.
Figure 9 shows the vertical stratum deformation map outside the excavation area, which accords with Peck’s normal distribution curve. The deformation range was mainly concentrated within 30 m above the existing shield tunnel, and the vertical deformation was the largest position above the left line. Figure 10 shows the maximum displacement curve of the stratum under different working conditions. As can be seen from Figure 10, the maximum deformation of the stratum changed from the initial subsidence to the uplift with the unloading rebound caused by earthwork excavation in the cross area. As the excavation continued, the amount of uplift increased with the increase in unloading, and the uplift reached its peak when the second layer of earthwork was excavated to the bottom. With the construction of the permanent structure, the stratum began to be compressed and its uplift value began to decrease. Finally, with the completion of the structural construction and the re-compression of the inner layer in the cross-area of the backfill construction, its value was further reduced and finally stabilized at about 1.5 mm.

4.2. Deformation Analysis of Existing Metro Tunnel

4.2.1. Vertical Deformation of Tunnel Structure

The deformation of the existing subway shield tunnel under various working conditions during excavation is shown in Figure 11. It can be seen that the deformation characteristics of the shield tunnel were first uplifted and then suppressed. With the progress of the excavation process, the left and right lines of the existing tunnel gradually rose. When the foundation pit was excavated all the way, the upward floating of the track reached its maximum. The upward floating of the left line was 1.54 mm, and the upward floating of the right line tunnel was 1.26 mm, both of which were lower than the control value of the existing tunnel bulge.
Before the excavation of the intersecting segments foundation pit, the existing subway tunnel was in an equilibrium state. Therefore, with the unloading of the top of the existing tunnel, the existing tunnel floated up and sustained a local deformation due to the constraint change. The ratio of the displacement change value △h1 at the top of the existing subway tunnel to △h2 at the bottom of the tunnel was used to represent the deformation of the existing subway tunnel (Figure 12). It can be seen that △h1/△h2 > 1 indicates that vertical tensile deformation occurs when the roof of the existing tunnel is unloaded; △h1/△h2 = 1 indicates that no local deformation occurs in the existing tunnel and the deformation only floats up as a whole; and △h1/△h2 < 1 indicates that the existing tunnel has a compressive deformation.
Figure 13 shows the curve diagram of the longitudinal ratio △h1/△h2 of the existing tunnel under working condition 5. It can be seen that △h1/△h2 > 1 in the range of intersecting segments and △h1/△h2 < 1 outside the cross area, indicating that the existing tunnel in the intersecting segments was accompanied by a vertical tensile local deformation in addition to the overall upward floating, while the transverse elliptical local deformation occurred outside the intersecting segments. The deformation curve at the bottom of the existing tunnel under various working conditions is shown in Figure 14. The left and right lines of the tunnel did not deform during the stratum reinforcement and the construction of the retaining pile. However, with the progress of the excavation process, the left and right lines appeared to float and have local deformation. When the foundation pit was excavated all the way, the floating deformation of the left and right lines reached a maximum. Among them, the floating deformation of the left line was 1.55 mm, the floating deformation of the right line tunnel was 1.44 mm, and the floating deformation of the left side was slightly larger than that of the right line, but both were smaller than the control value of the existing line. Subsequently, with the construction of the secondary structure and backfill construction, the floating deformation of the left and right lines decreased to a certain extent. Finally, the floating deformation of the left line was 0.61 mm, and the floating deformation of the right line was 0.60 mm, which was less than the control value of the deformation of the existing tunnel structure of urban rail transit.

4.2.2. Stress Distribution of Tunnel Structure
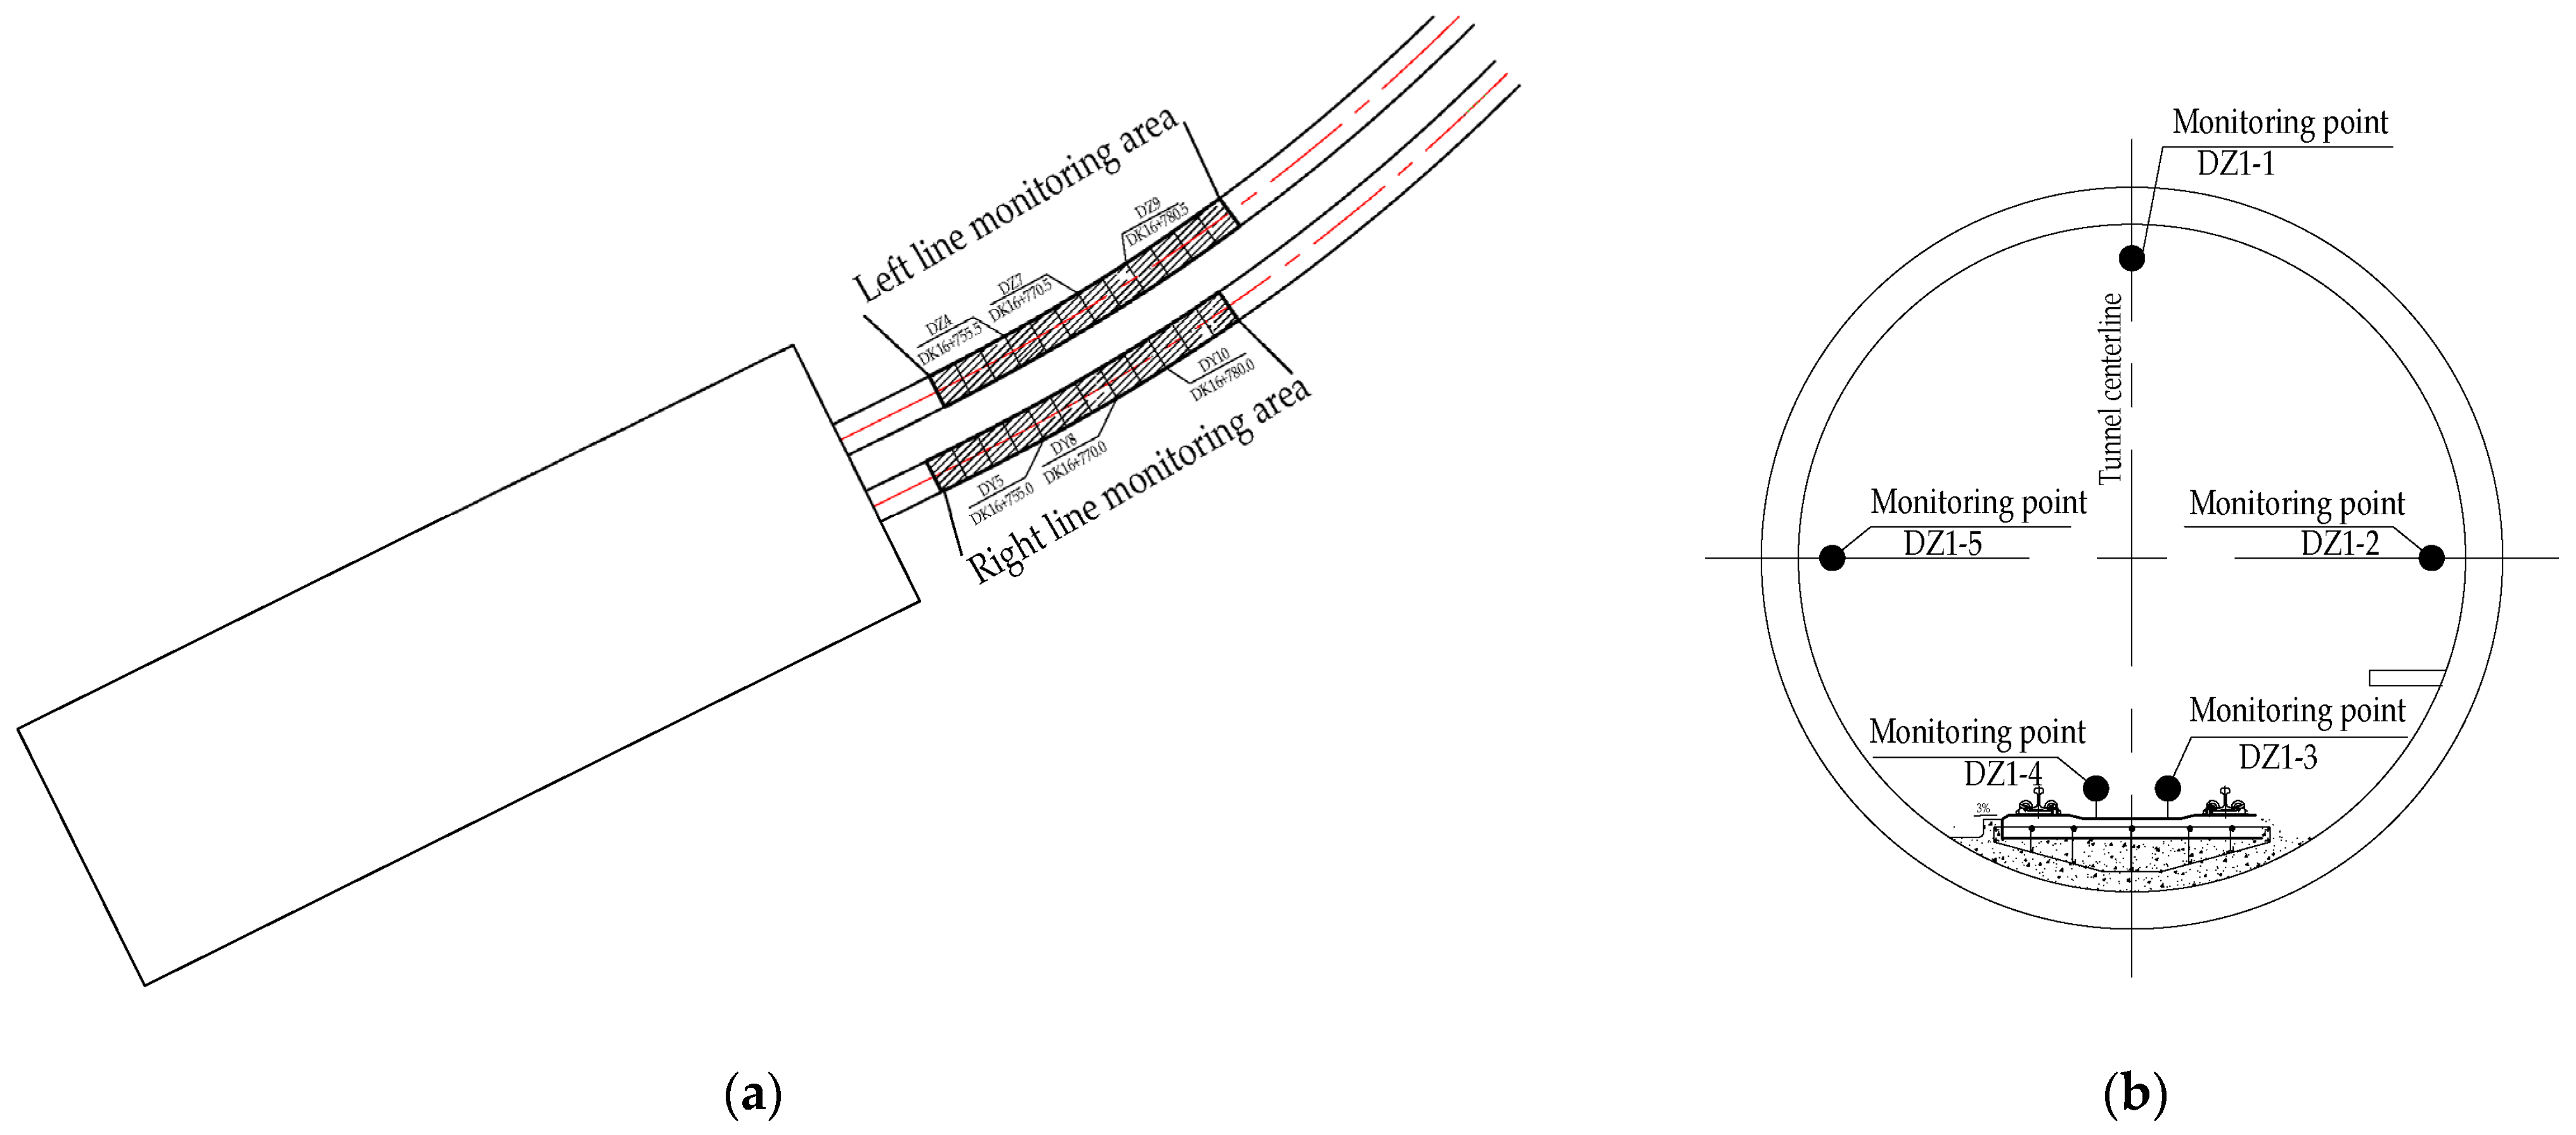
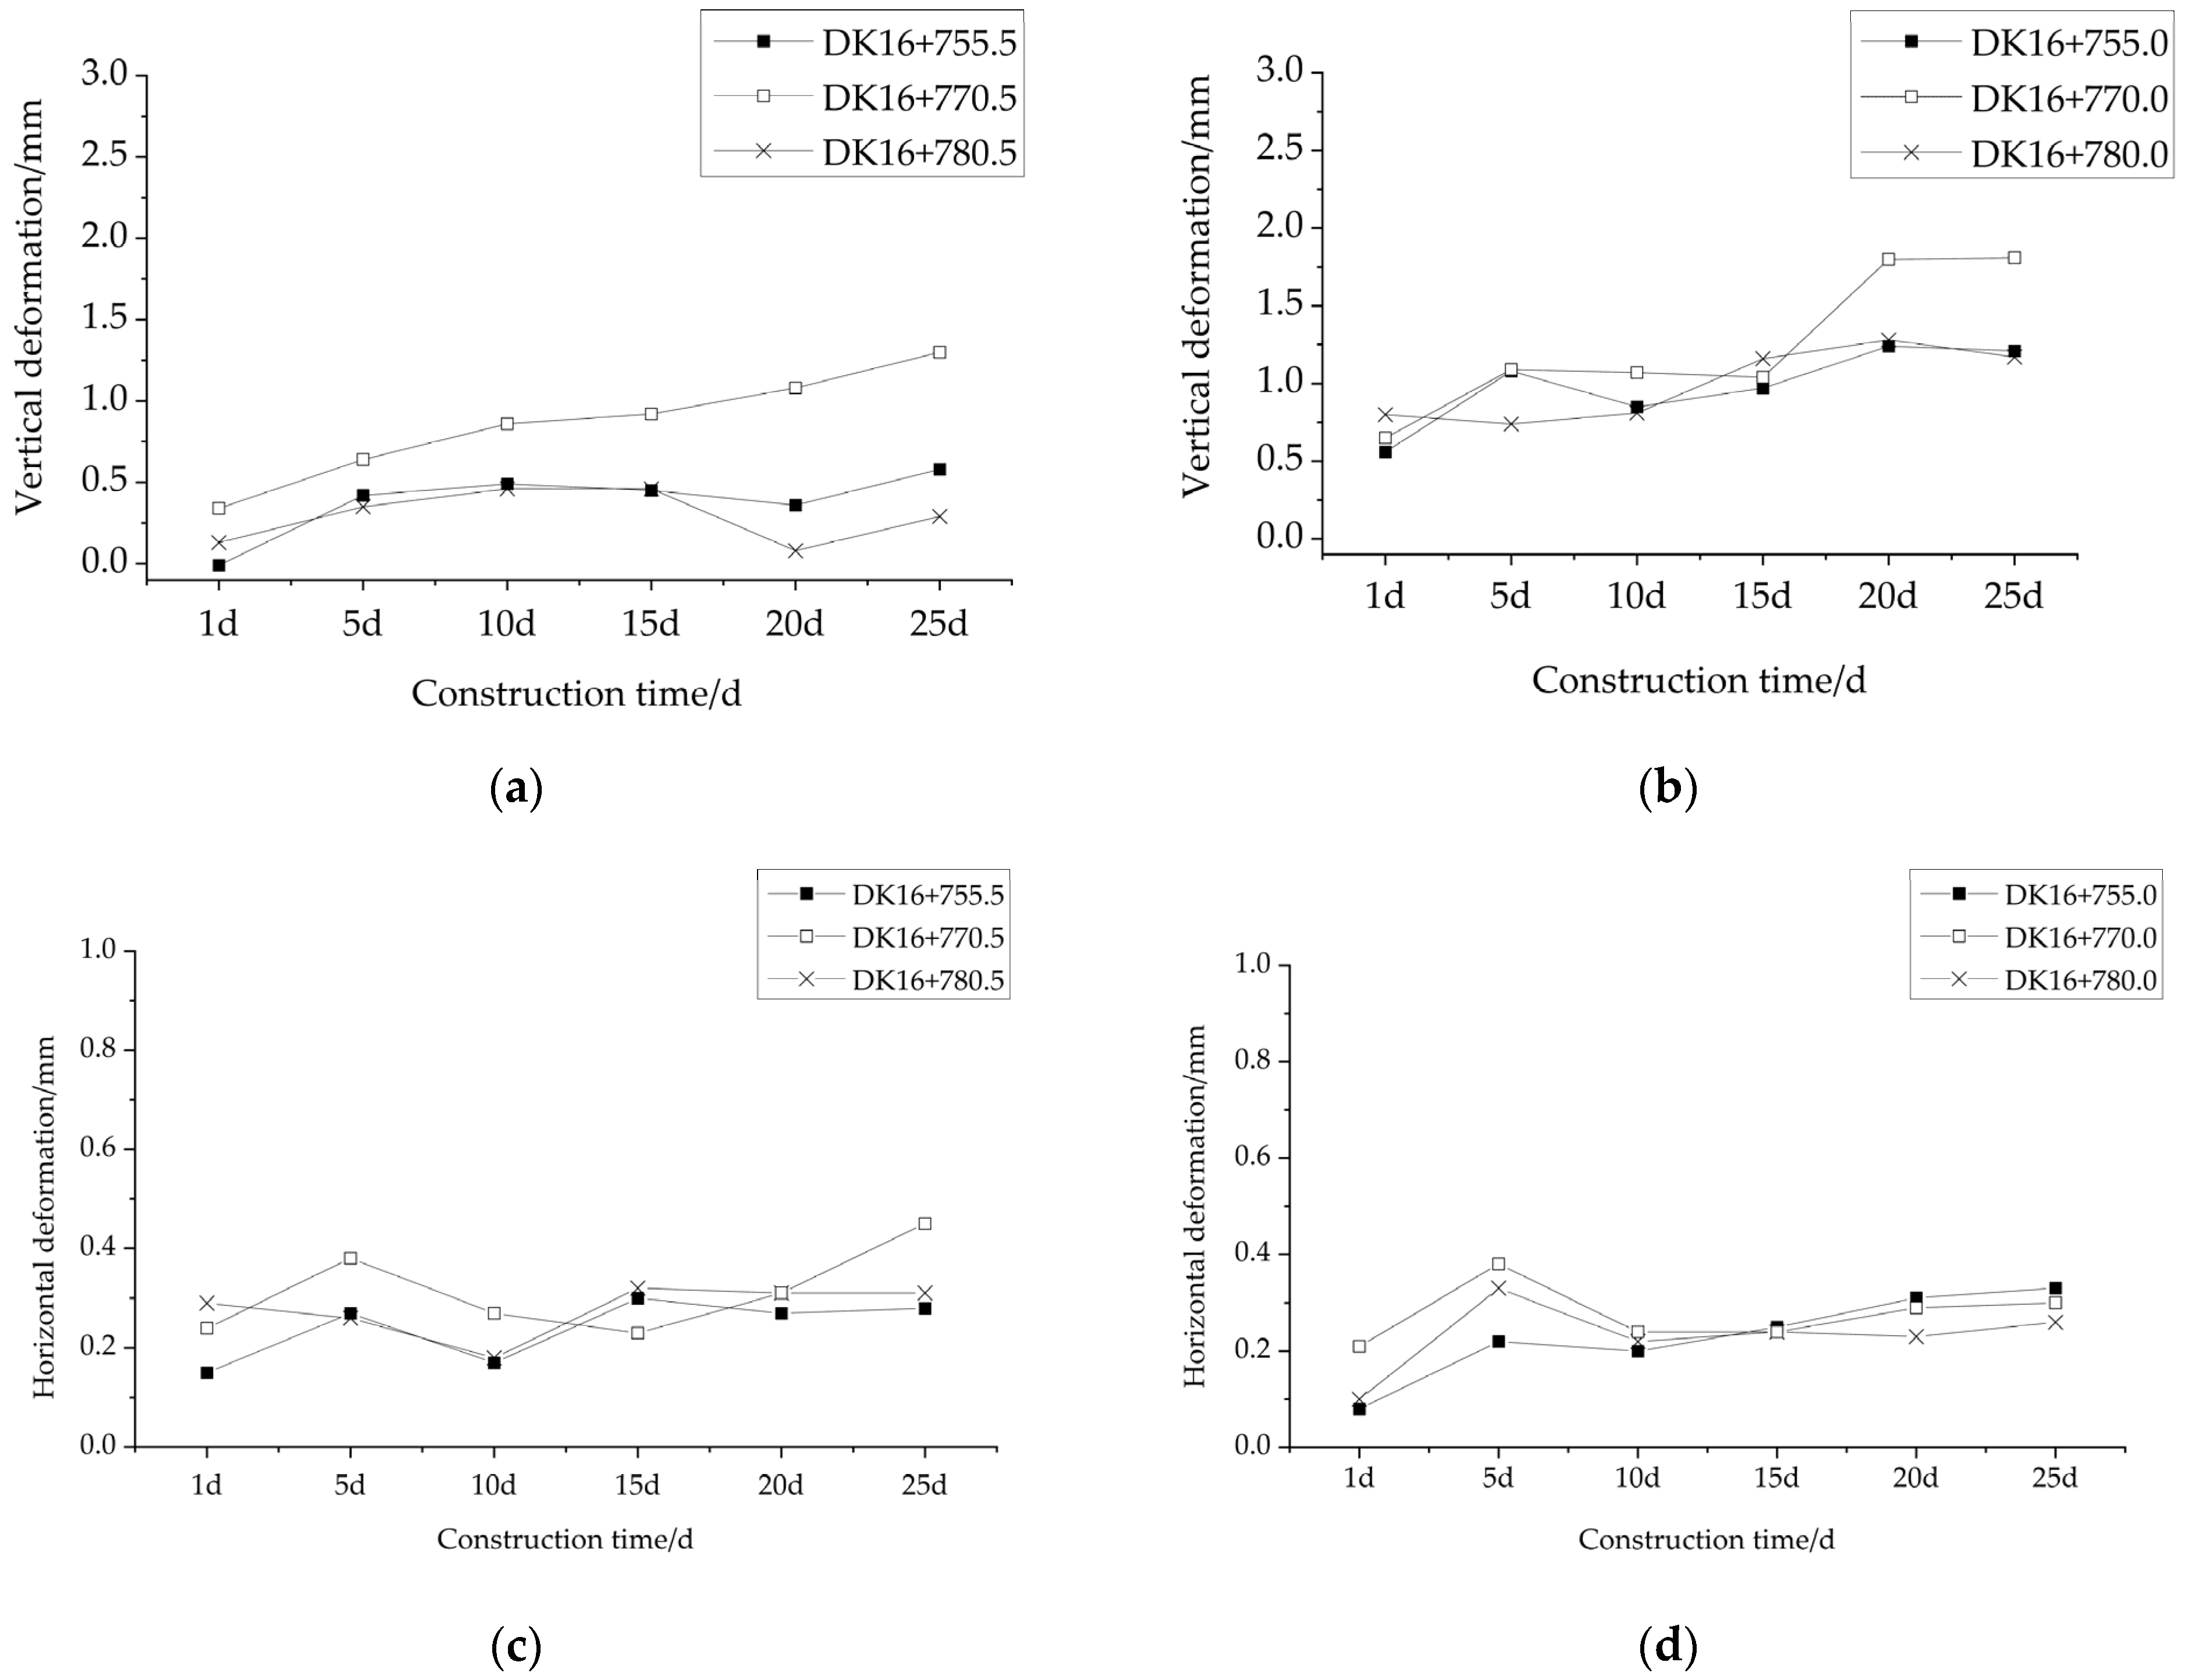
In the process of excavation, the first main stress diagram of the metro shield tunnel was created (Figure 15). It can be seen that the maximum principal stress value of the existing shield tunnel gradually increased with the progress of the excavation process, which was similar to the deformation process of the existing subway tunnel. The maximum principal stress of intersecting segments when excavated to the bottom was 2.42 MPa. Subsequently, with the structural construction and filling construction, the final principal stress gradually decreased to 1.84 MPa, which was less than the tensile strength of C50 concrete in the existing tunnel. It showed that the construction process was safe.

5. Field Monitoring

In order to ensure the construction safety and verify the accuracy of the analysis, on-site monitoring was carried out during the construction process, mainly for the existing lines, horizontal deformation, vertical deformation, and other indicators. The monitoring area and the arrangement of the internal measuring points of the existing cable are presented in Figure 16.
Figure 17 shows the vertical and horizontal displacement trends of the left and right lines in the main construction process of the intersection section of the existing subway shield tunnel. The monitoring range of the left and right lines is shown in Figure 16. In Figure 17, only the data of measuring point DZ/Yi-1 at the top of the left and right lines subway tunnel as shown in Figure 16b were collected (“Z” represents the left line, “Y” represents the right line, and “i” represents different positions in the monitoring section). As can be seen from Figure 17, the changes in the left and right lines in the construction process were generally stable, similar to the analysis process. In the formal excavation stage, due to the large excavation area, the vertical displacement of the structure in the tunnel obviously changed, and the vertical displacement of the two subway lines showed an overall upward trend. The maximum cumulative vertical displacement of the left line was 1.35 mm, and the maximum cumulative displacement of the right line was 1.28 mm, but the daily variation in the monitoring points was less than ±1 mm.
The main construction process of the intersecting segments took 35 days to complete the structural pouring. Through continuous monitoring and data analysis, it can be observed that the structural displacement in the subway tunnel changed gently after the road surface was restored to traffic. Finally, the maximum cumulative vertical displacement of the left line was 1.21 mm, and that of the right line was 1.23 mm, both of which did not exceed the alarm value. The daily change rate was also within the control value range, and no other abnormal conditions occurred, indicating that the structure of the subway tunnel was stable during construction.

6. Conclusions

A finite element analysis was conducted for the construction process of an open-cut tunnel crossing an existing subway section under complex environmental conditions, and tracking monitoring was carried out on the existing tunnel. The deformation of the surrounding strata and the existing line and the change law of the force of the existing line under the comprehensive construction scheme of “uplift piles + capping beam balance, reinforcement of the surrounding soil, excavation of the foundation pit in strips, layered pouring of the bottom slab, and dewatering around the foundation pit” were studied. The main conclusions are as follows:
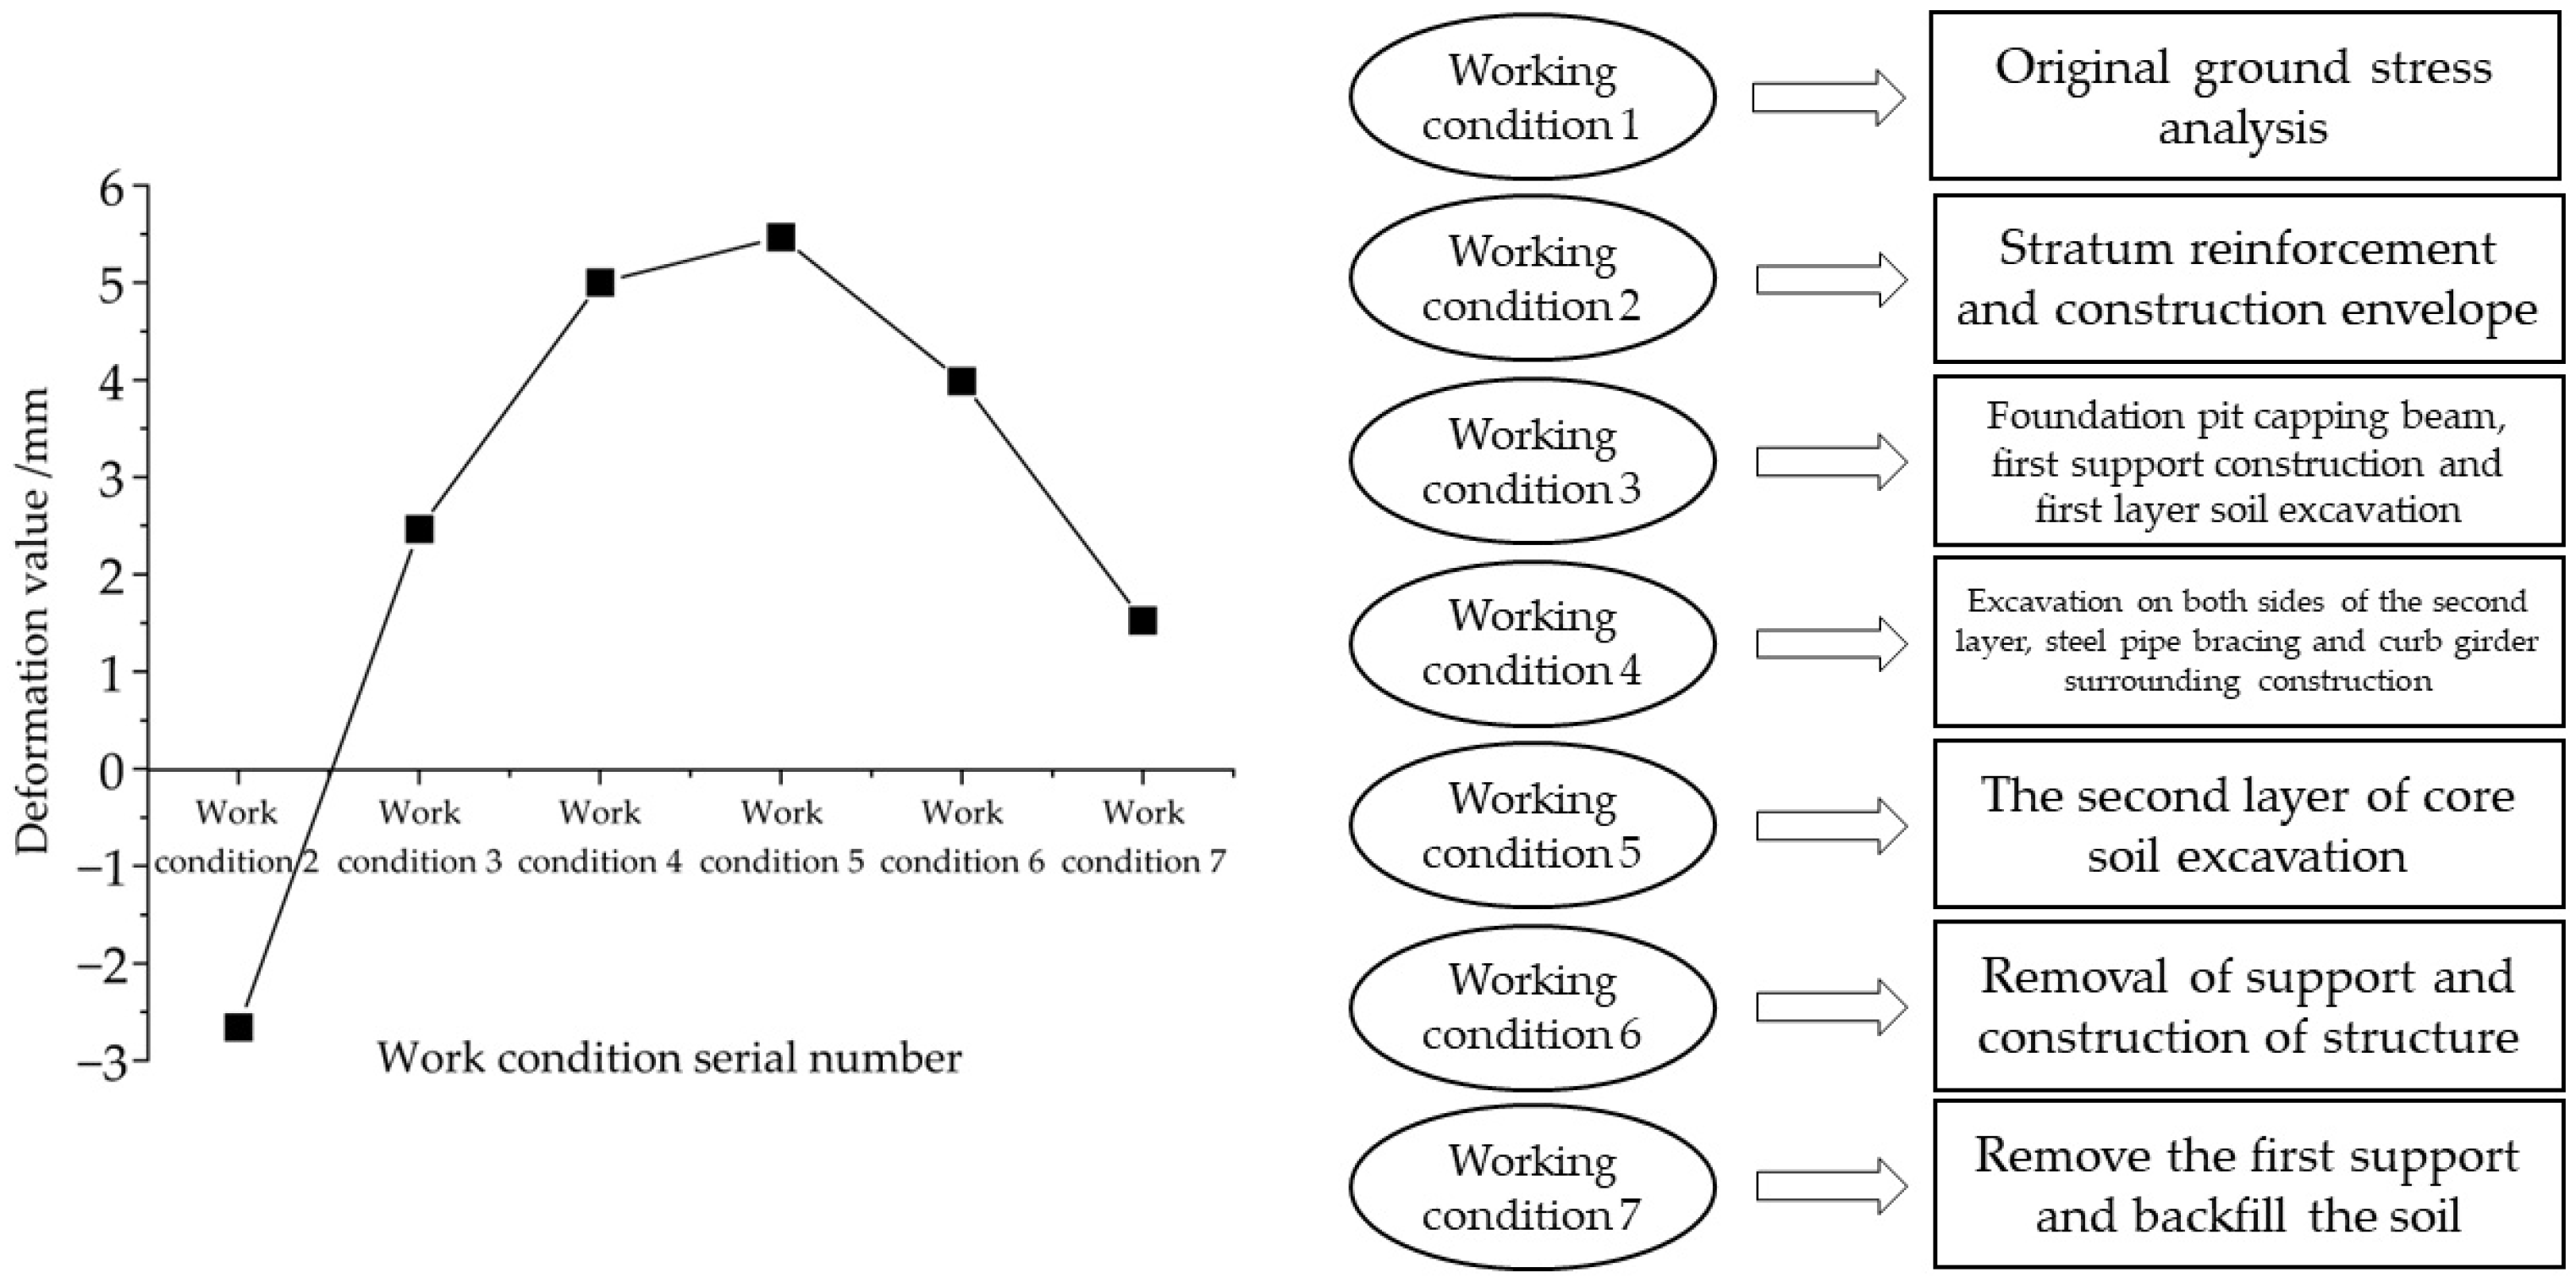
  • In this paper, ANSYS finite element analysis software was employed to numerically simulate the construction process, and the surface settlement of the cross-construction section was calculated and compared with the monitoring value of the actual project. The results demonstrated that the settlement value of the surrounding surface monitoring point under the most unfavorable working condition 5, the variation law of the simulated value, and the monitoring data were essentially the same during the excavation process. Furthermore, the error between the calculated results and the measured values was less than 10%, which validates the accuracy of the numerical model, provides rational support for the subsequent analysis, and holds a certain reference value for scholars in related fields.
  • During the construction of intersecting sections, the existing subway lines floated collectively. Nevertheless, from the start of the excavation until the final resumption of traffic, the displacement of the tunnel structure of the existing subway line experienced minor fluctuations and maintained a stable change. The cumulative displacement and the rate of change remained within the control value range for the protection of the existing subway line.
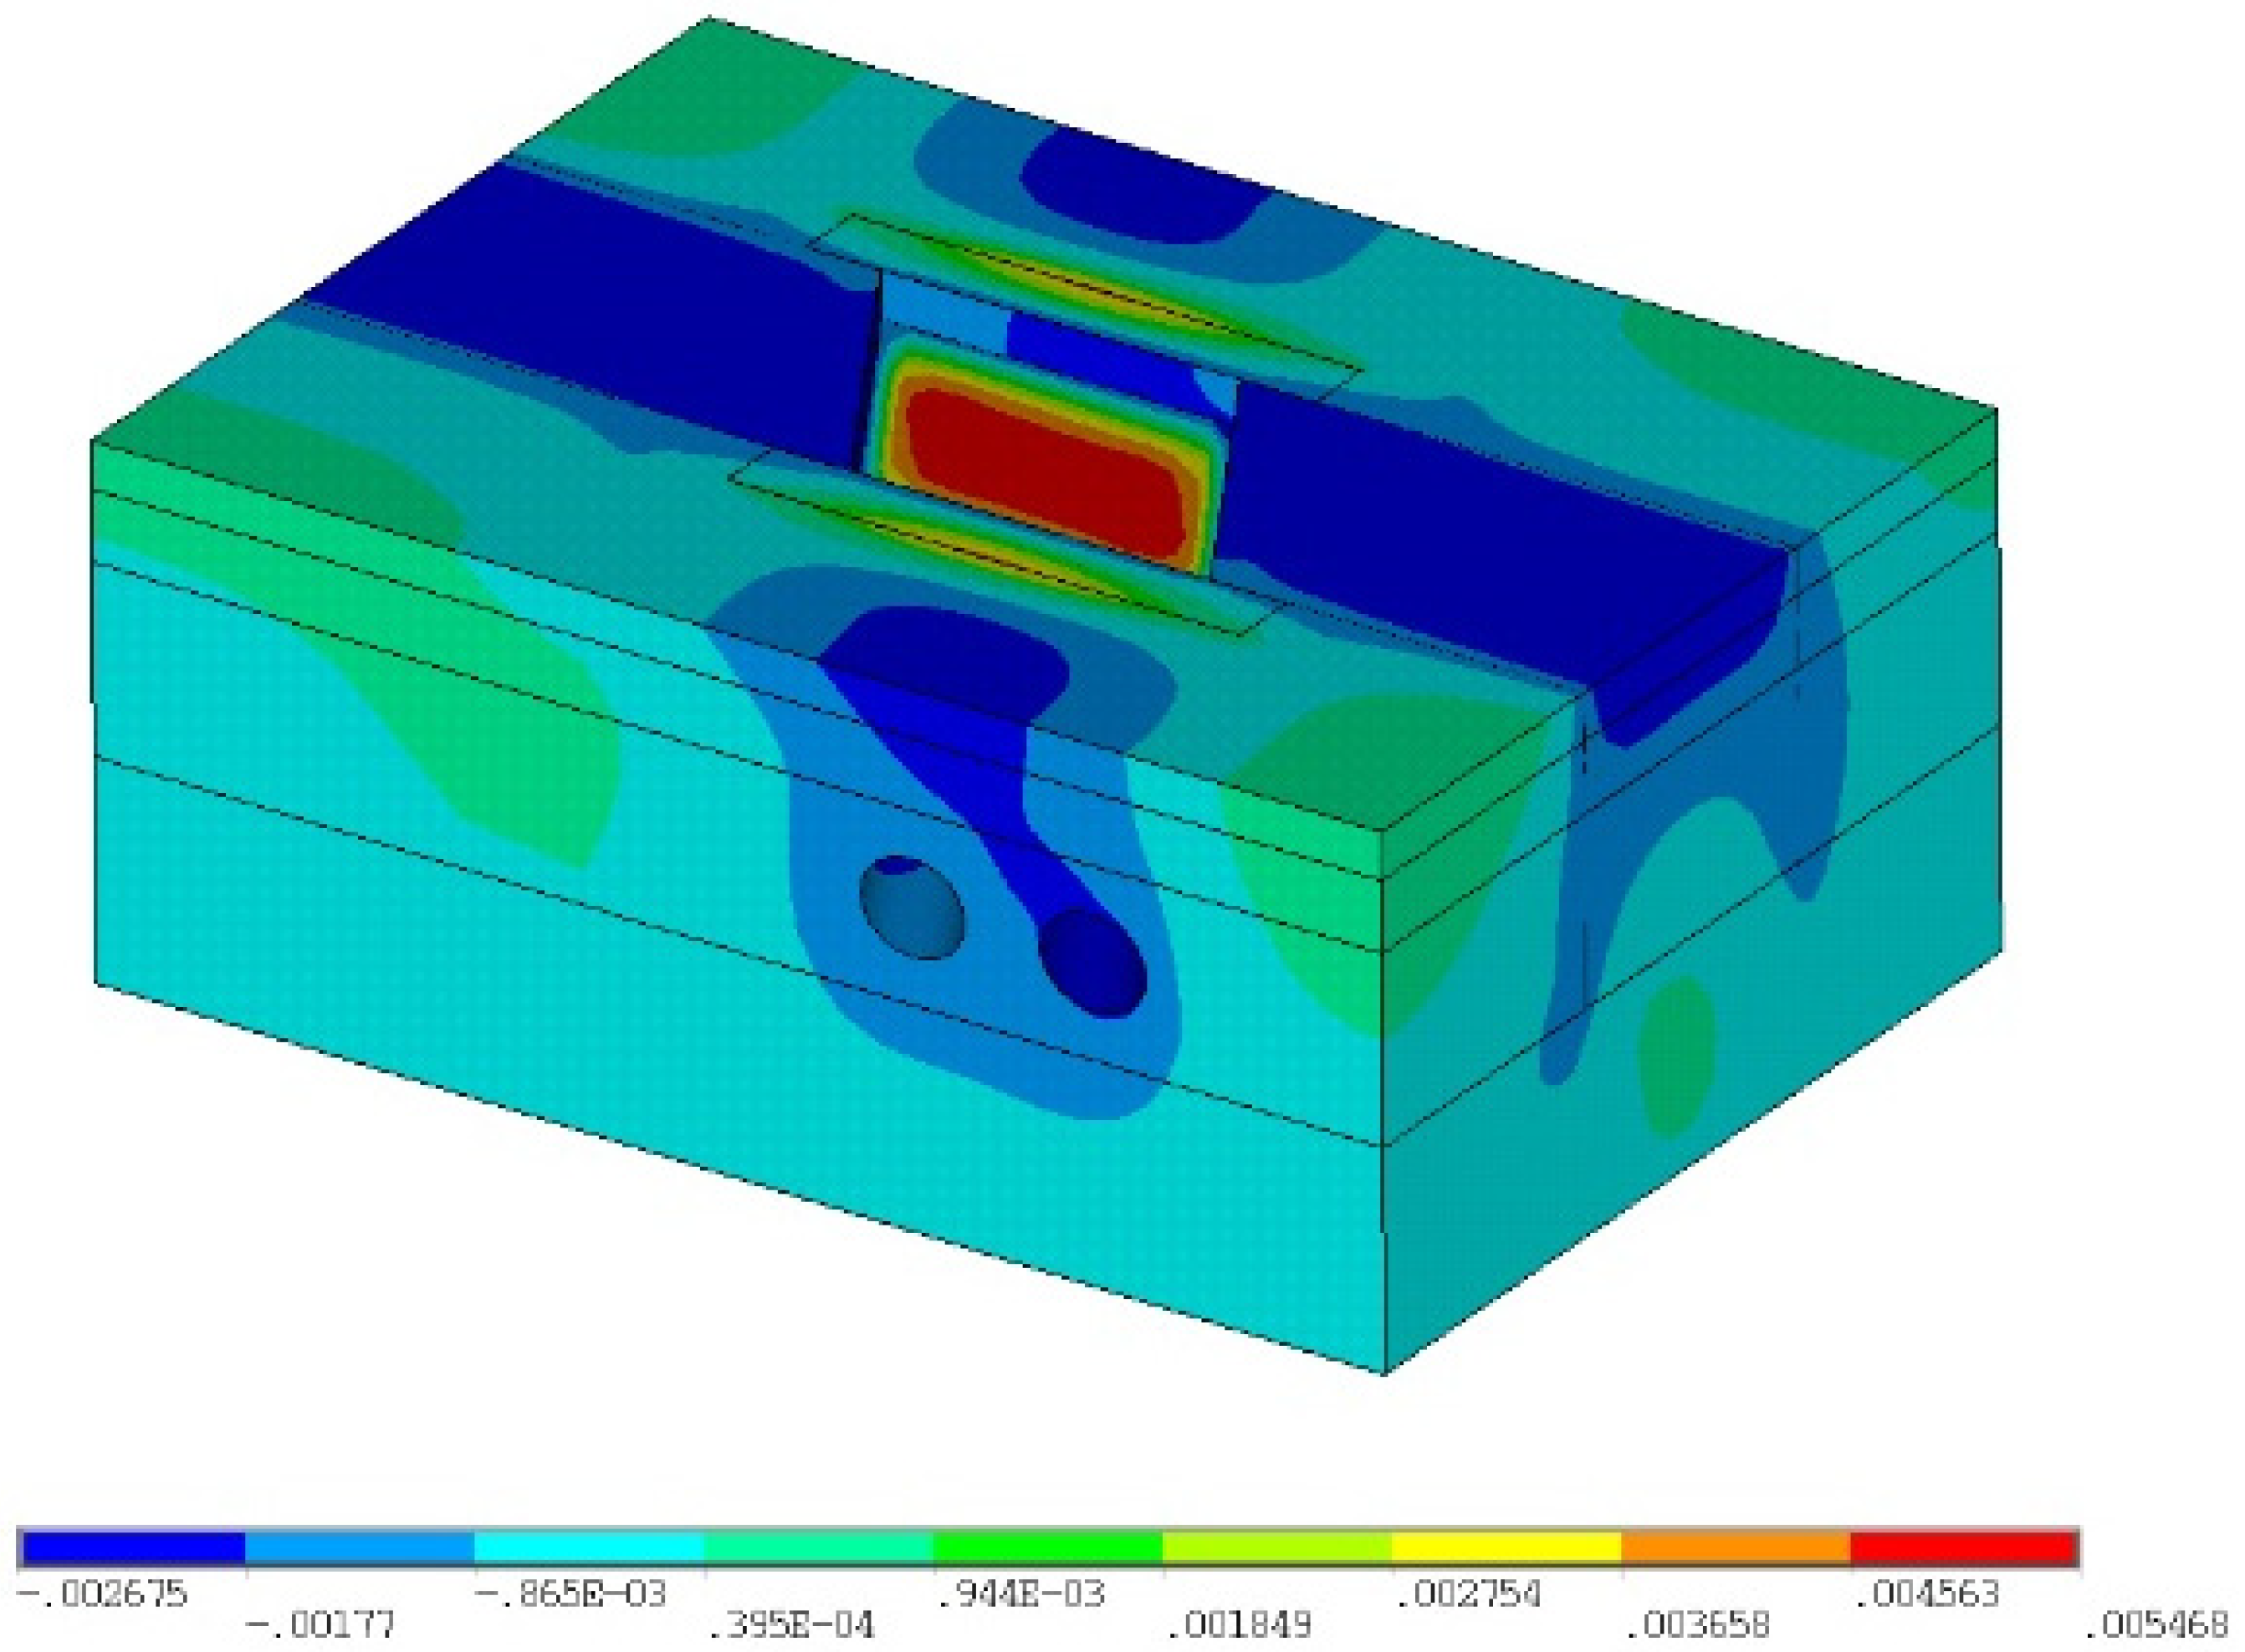
  • When the foundation pit of the upper span was excavated to the bottom, that is, under the most unfavorable working condition 5, uplift occurred at the bottom of the foundation pit, and the uplift value amounted to 5.468 mm. Settlement emerged around the excavation area of the upper-span foundation pit, and the settlement area was mainly concentrated in the regions on both sides of the construction section of the upper-span tunnel, with the maximum settlement value reaching −2.675 mm. Additionally, there was a local settlement area above the existing subway tunnel, and the maximum settlement value in this area attained −2.1 mm.
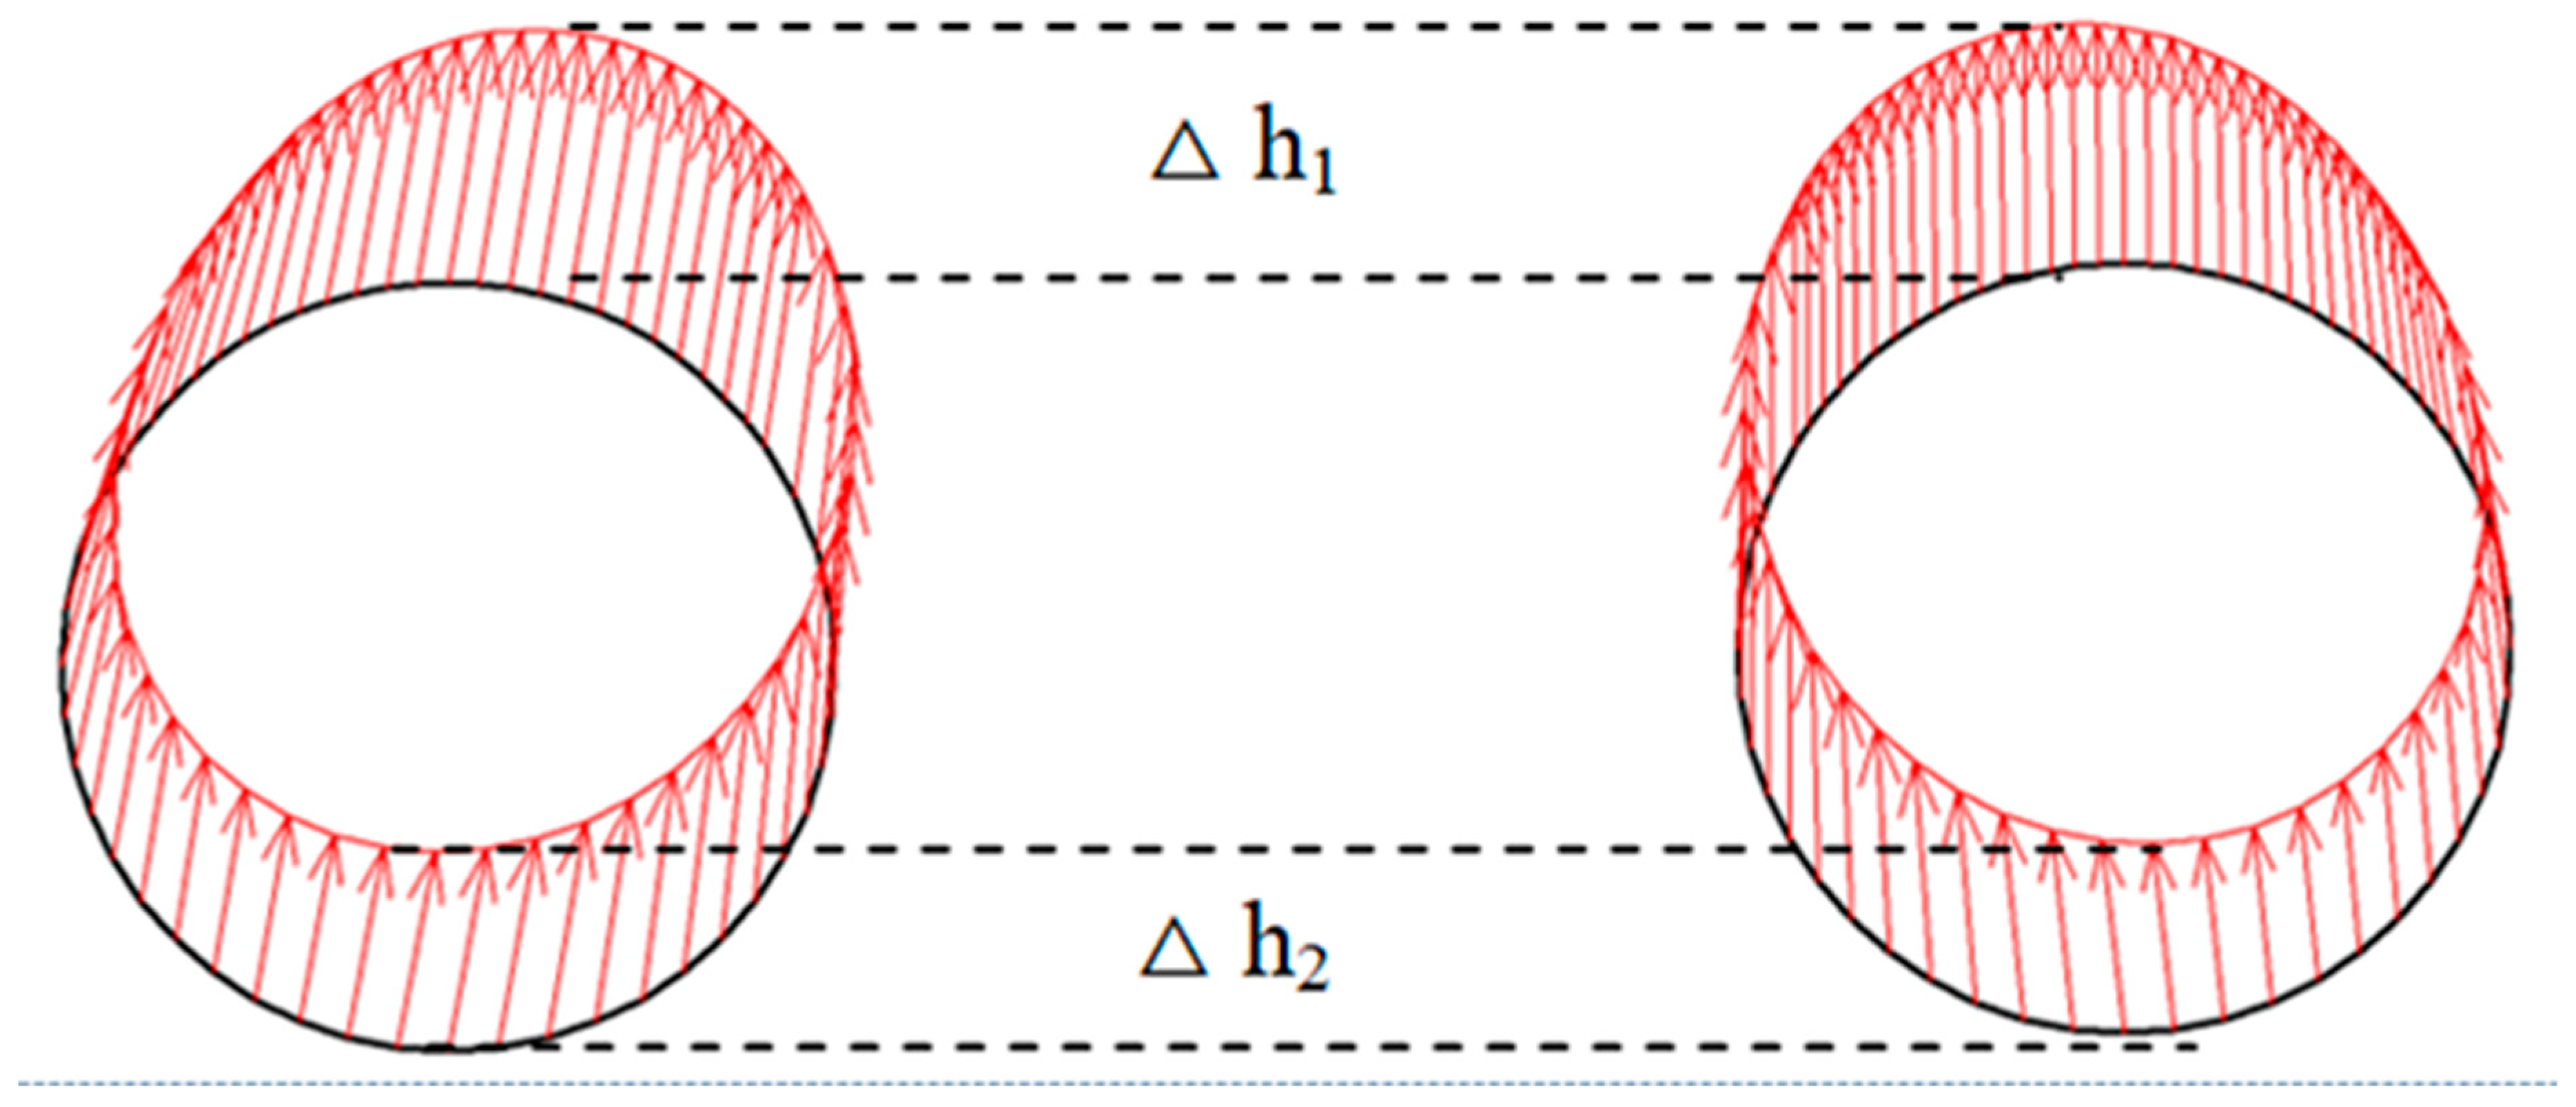
  • The vertical formation deformation outside the excavation area conformed to the Peck normal distribution curve. Additionally, in similar construction processes, particular attention should be given to the area 30 m above the existing shield tunnel. Our research indicated that the main deformation was concentrated within that range, and the vertical deformation was the greatest on the left line.
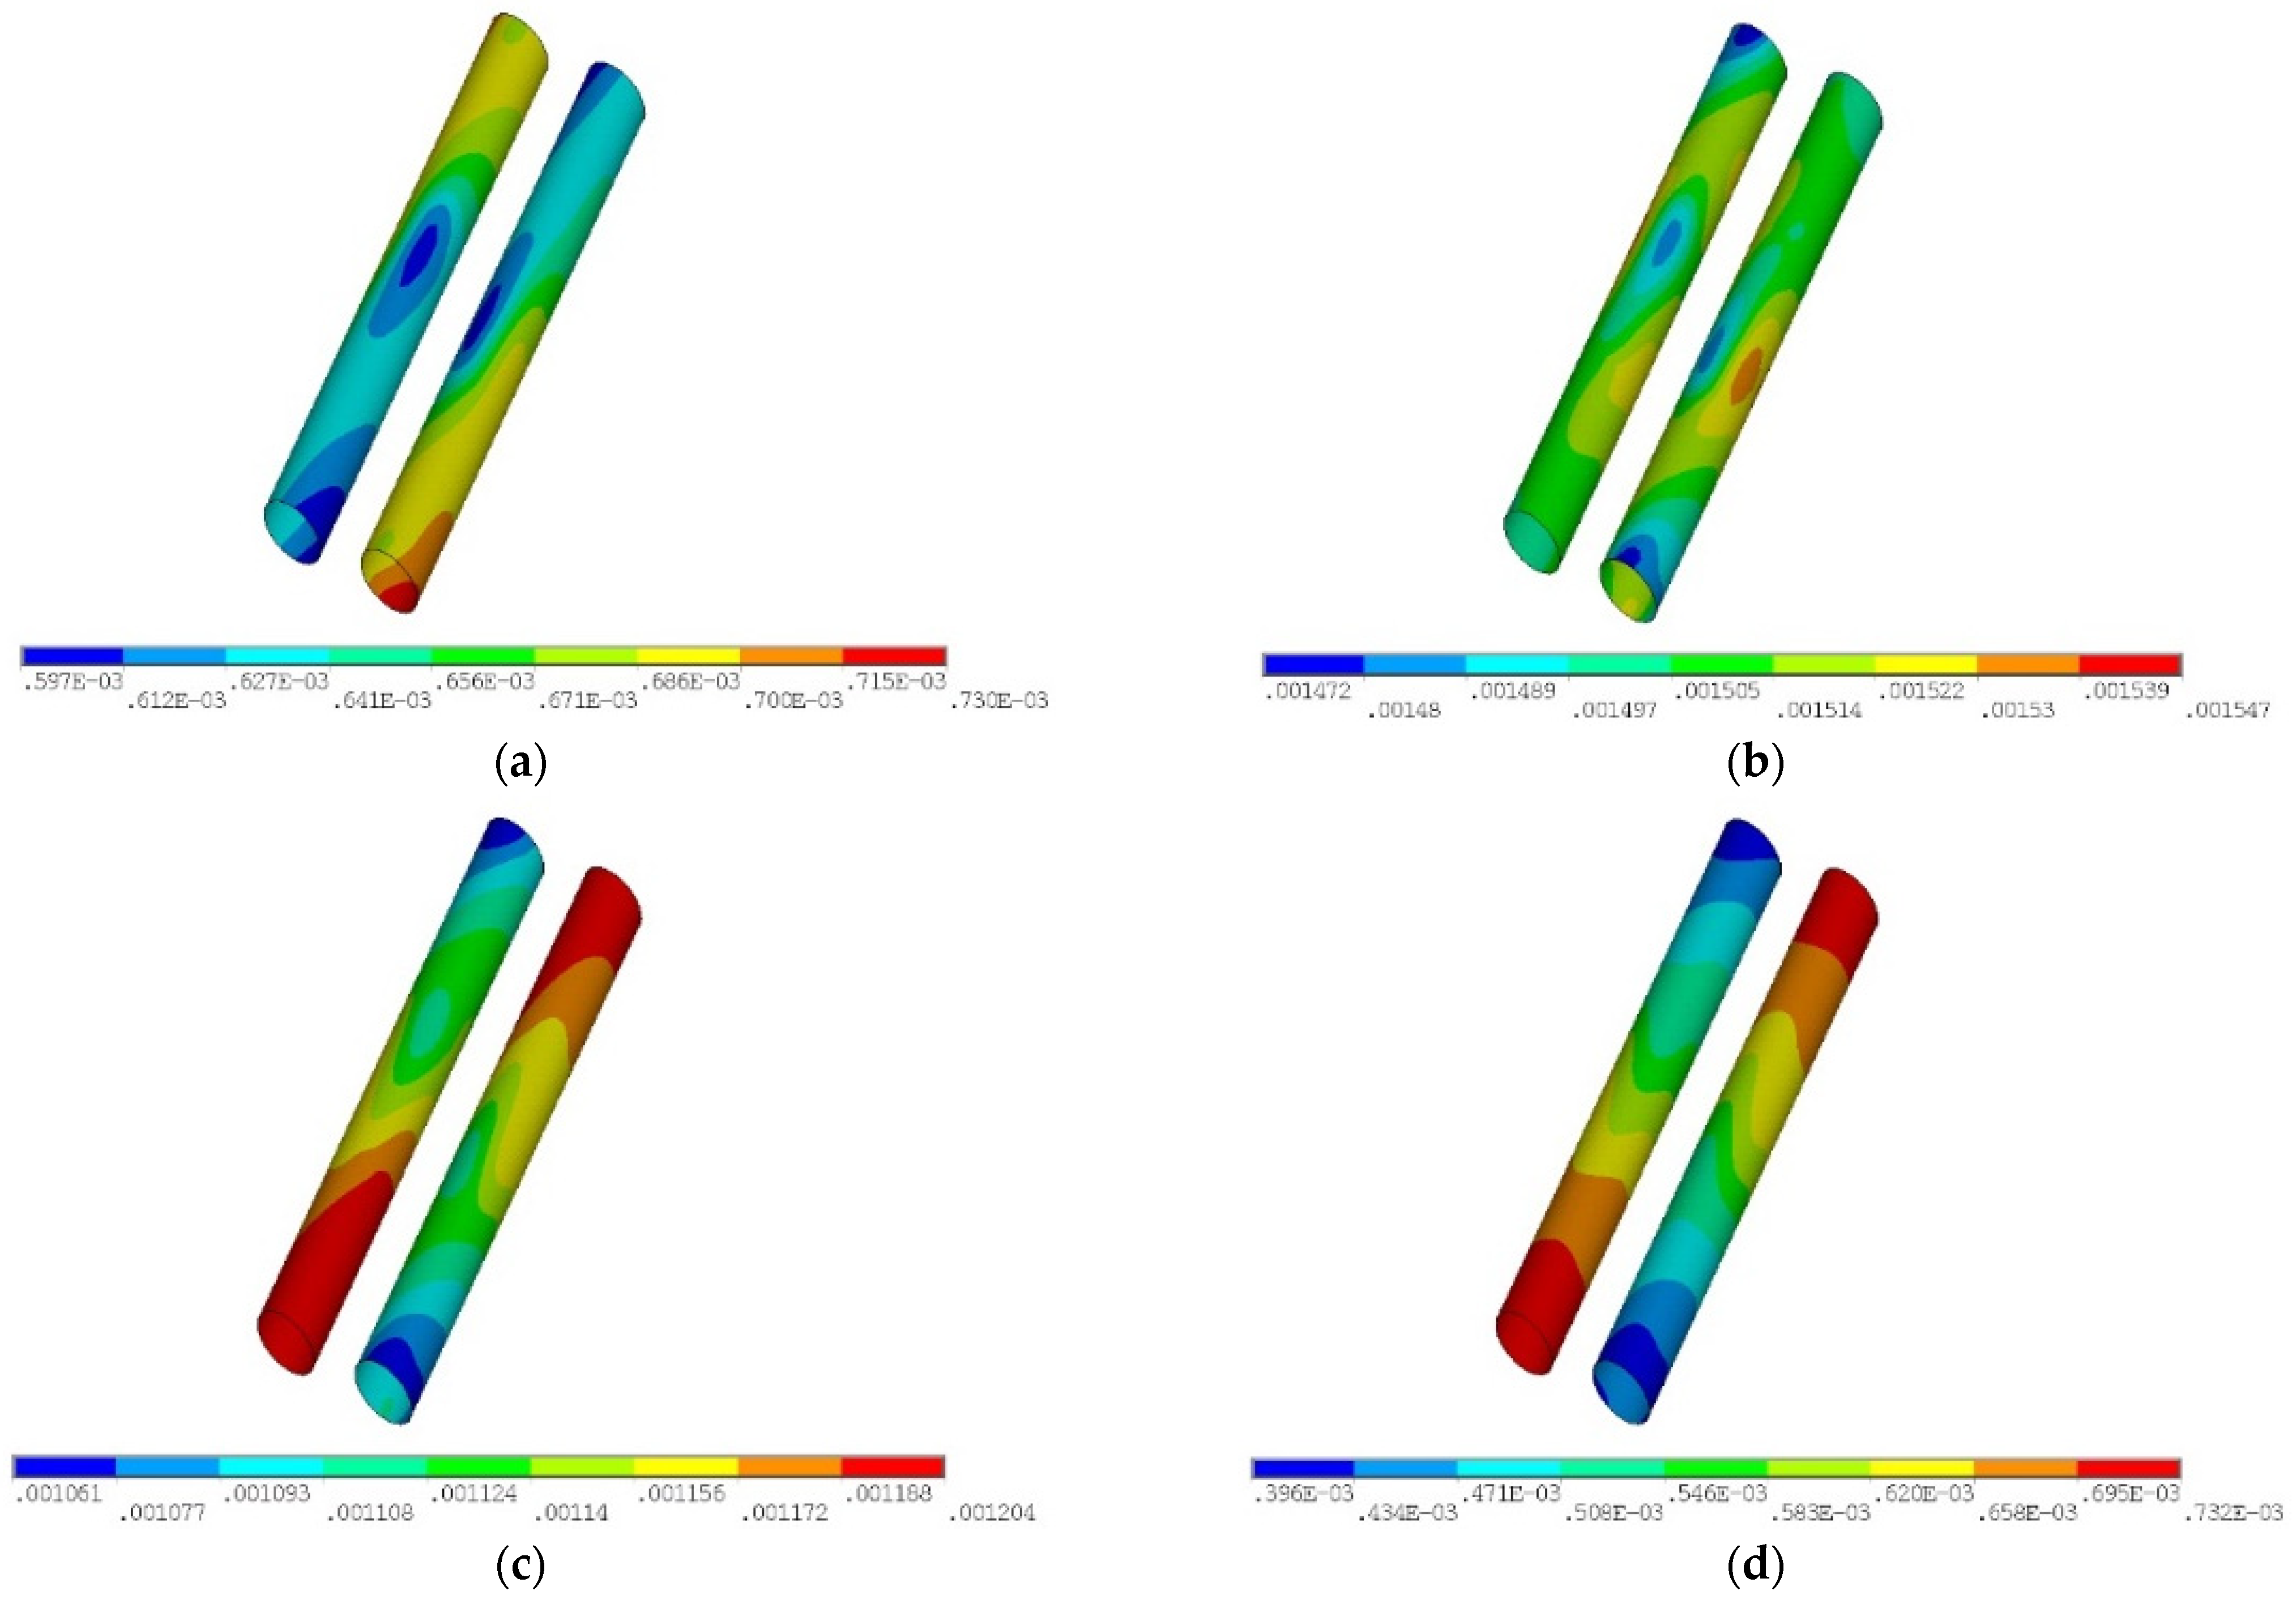
  • The deformation characteristics of the existing subway shield tunnel under various working conditions during the excavation process were initially uplifted and subsequently depressed. As the excavation process progressed, the left and right lines of the existing tunnel gradually floated upward. When the foundation pit was excavated to completion, the amount of floating of the track reached its maximum. The upward floating of the left line was 1.54 mm, and that of the right line tunnel was 1.26 mm, both of which were lower than the control value of the existing tunnel bulge. The construction method involved in this paper has a certain reference value in practical engineering.
  • The maximum principal stress value of the existing shield tunnel increased progressively during the excavation process. The maximum principal stress of the intersecting segments amounted to 2.42 MPa when it was excavated to the bottom. Subsequently, the final principal stress gradually declined with the structural construction and earth filling construction, eventually reaching 1.84 MPa. It can be observed that the principal stress of each construction stage was lower than the tensile strength of the existing tunnel’s C50 concrete. This indicated that the construction process was safe. However, as concrete is subjected to different degrees of natural corrosion underground, it will lead to a reduction in its tensile strength. Therefore, it is necessary to consider the safety problems caused by the reduction in concrete strength in the construction process, and it is necessary to take certain measures.

Author Contributions

Conceptualization, P.N. and C.J.; methodology, C.J.; software, P.Z.; validation, C.J.; formal analysis, P.Z. and Y.S.; investigation, P.Z.; resources, P.Z.; data curation, P.N. and C.J.; writing—original draft preparation, P.N.; writing—review and editing, C.J.; visualization, P.Z.; supervision, P.N. and C.J.; project administration, P.N. and C.J.; funding acquisition, P.N. and C.J. All authors have read and agreed to the published version of the manuscript.

Funding

The research was jointly funded by [China Scholarship Council] grant number [202008210096] and the [Project of Natural Science Foundation of Liaoning province of China] grant number [2022-MS-424].

Data Availability Statement

The original contributions presented in the study are included in the article; further inquiries can be directed to the corresponding author.

Conflicts of Interest

The authors declare no conflicts of interest.

References

  1. Ma, M.M.; Ji, Y.S. Influences of New Tunnel Underpass Construction on Existing Expressway and Study on Construction Method Optimization. Highw. Eng. 2020, 45, 140–145. (In Chinese) [Google Scholar]
  2. Xian, Z.P. Structure Safety Analysis of a Newly Built Expressway Crossing over an Operating High-speed Railway Tunnel. Mod. Tunn. Technol. 2020, 57, 134–140. (In Chinese) [Google Scholar]
  3. Yi, L.B.; Du, M.F.; Zhu, D.D. Study on the Inflence of Underpass Construction on High-speed Railway Subgrade with Small Clear Spacing. J. Hefei Univ. Technol. (Nat. Sci.) 2020, 43, 1653–1656. (In Chinese) [Google Scholar]
  4. Liu, J.; Wu, S.; Wang, L.; Zhou, X. Study on the Settlement Law of Adjacent Buildings Group Caused by Deep and Long Excavation. Chin. J. Undergr. Space Eng. 2022, 18, 1374–1382. (In Chinese) [Google Scholar]
  5. Zhang, Z.; Zhang, M.; Zhao, Q. A simplified analysis for deformation behavior of buried pipelines considering disturbance effects of underground excavation in soft clays. Arab. J. Geosci. 2015, 8, 7771–7785. [Google Scholar] [CrossRef]
  6. Sun, H.; Chen, Y.; Zhang, J.; Kuang, T. Analytical investigation of tunnel deformation caused by circular foundation pit excavation. Comput. Geotech. 2019, 106, 193–198. [Google Scholar] [CrossRef]
  7. Wu, H.N.; Shen, S.L.; Liao, S.M.; Yin, Z.Y. Longitudinal structural modelling of shield tunnels considering shearing dislocation between segmental rings. Tunn. Undergr. Space Technol. 2015, 50, 317–323. [Google Scholar] [CrossRef]
  8. Wu, H.N.; Shen, S.L.; Yang, J.; Zhou, A. Soil-tunnel interaction modelling for shield tunnels considering shearing dislocation in longitudinal joints. Tunn. Undergr. Space Technol. 2018, 78, 168–177. [Google Scholar] [CrossRef]
  9. Ittichai, B.; Takemura, J. Observation of ground movement with existing pile groups due to tunneling in sand using centrifuge modelling. Geotech. Geol. Eng. 2015, 33, 621–640. [Google Scholar]
  10. Gang, Z.; Wei, S.W.; Peng, S.Y.; Diao, Y.; Ng, C.W.W. Centrifuge modeling of the influence of basement excavation on existing tunnels. In Proceedings of the International Conference on Physical Modelling in Geotechnics, Zurich, Switzerland, 28 June–1 July 2010; Volume 1. [Google Scholar]
  11. Li, M.G.; Chen, J.J.; Wang, J.H.; Zhu, Y.F. Comparative study of construction methods for deep excavations above shield tunnels. Tunn. Undergr. Space Technol. 2018, 71, 329–339. [Google Scholar] [CrossRef]
  12. Zhang, H.B.; Chen, J.J.; Fan, F.; Wang, J.H. Deformation monitoring and performance analysis on the shield tunnel influenced by adjacent deep excavations. J. Aerosp. Eng. 2017, 30, B4015002. [Google Scholar] [CrossRef]
  13. Liu, H.; Li, K.; Wang, J.; Cheng, C. Numerical simulation of deep foundation pit construction under complex site conditions. Adv. Civ. Eng. 2021, 2021, 6669466. [Google Scholar] [CrossRef]
  14. Zhao, X.; Wang, H.; Li, Z.; Dai, G.; Yin, Z.; Cao, S.; Zhou, J. Numerical study on the deformation of tunnels by excavation of foundation pit adjacent to the subway. Appl. Sci. 2022, 12, 4752. [Google Scholar] [CrossRef]
  15. Ye, S.; Zhao, Z.; Wang, D. Deformation analysis and safety assessment of existing metro tunnels affected by excavation of a foundation pit. Undergr. Space 2021, 6, 421–431. [Google Scholar] [CrossRef]
  16. Wu, W.; Lu, H.; Chen, S.; Zhang, D. Effect and control of foundation pit excavation on existing tunnels: A state-of-the-art review. Tunn. Undergr. Space Technol. 2024, 147, 105704. [Google Scholar]
  17. Yin, Y. Design and Practice of Deep Foundation Pit Adjacent to Subway Station. Chin. J. Undergr. Space Eng. 2018, 14, 263–269. (In Chinese) [Google Scholar]
  18. Seo, M.; Im, J.C.; Kim, C.; Yoo, J.W. Study on the applicability of a retaining wall using batter piles in clay. Can. Geotech. J. 2016, 53, 1195–1212. [Google Scholar] [CrossRef]
  19. Liang, L.; Li, E.P.; Wang, Q.G.; Wang, X.Z. Practice of MJS Method in Light Railway Inter Change Passage Construction in Shanghai. Chin. J. Undergr. Space Eng. 2012, 8, 135–139. (In Chinese) [Google Scholar]
  20. Wang, X. ANSYS Numerical Analysis of Engineering Structures; China Communications Press: Beijing, China, 2007. (In Chinese) [Google Scholar]
  21. Guo, J.; Liu, G.; Su, W.; Li, M. Numerical Analysis about Influence from the Subsurface Structure on Adjacent Deep Excavation in Foundation Pit Group. J. Shenyang Jianzhu Univ. (Nat. Sci. Ed.) 2019, 35, 222–230. (In Chinese) [Google Scholar]
  22. Li, D.; Yan, C.; Zhang, S. Advances in researching influences of deep excavation onsurrounding environment. J. Wuhan Univ. (Eng.) 2018, 51, 659–668. (In Chinese) [Google Scholar]
  23. Diao, Y.; Zhu, P.; Jia, Z.; Gang, Z.; Du, Y.; Shang, D.; Zhou, H. Stability analysis and safety factor prediction of excavation supported by inclined piles in clay. Comput. Geotech. 2021, 140, 104420. [Google Scholar] [CrossRef]
  24. Jongpradist, P.; Kaewsri, T.; Sawatparnich, A.; Suwansawat, S.; Youwai, S.; Kongkitkul, W.; Sunitsakul, J. Development of tunneling influence zones for adjacent pile foundations by numerical analyses. Tunn. Undergr. Space Technol. 2013, 34, 96–109. [Google Scholar] [CrossRef]
  25. Prasad, S.J.; Kumar, J. Stability of long unsupported twin circular tunnels in soils. Tunn. Undergr. Space Technol. 2013, 38, 326–335. [Google Scholar]
  26. Ashraf, S.O. Stability of unlined twin tunnels in undrained clay. Tunn. Undergr. Space Technol. 2010, 25, 290–296. [Google Scholar]
  27. Liang, R.; Wu, J.; Sun, L.; Shen, W.; Wu, W. Performances of adjacent metro structures due to zoned excavation of a large-scale basement in soft ground. Tunn. Undergr. Space Technol. 2021, 117, 104123. [Google Scholar] [CrossRef]
  28. Talmon, A.M.; Bezuijen, A. Analytical model for the beam action of a tunnel lining during construction. Int. J. Numer. Anal. Methods Geomech. 2013, 37, 181–200. [Google Scholar] [CrossRef]
Figure 1. Location of the project.
Buildings 14 02385 g001
Figure 2. Reinforcement area and reinforcement of the upper-span metro section. (a) Reinforced area diagram and monitoring point location. (b) Comparison of calculated values and measured values of monitoring points.
Buildings 14 02385 g002
Figure 3. Soil reinforcement under foundation pit of metro section with upper span.
Buildings 14 02385 g003
Figure 4. Intersection section construction process.
Buildings 14 02385 g004
Figure 5. Finite element model of upper-span metro section.
Buildings 14 02385 g005
Figure 6. Reinforcement model of upper-span metro section.
Buildings 14 02385 g006
Figure 7. Deformation map of the area affected by formation consolidation.
Buildings 14 02385 g007
Figure 8. Deformation map of working condition 5’s influence area.
Buildings 14 02385 g008
Figure 9. Vertical deformation map.
Buildings 14 02385 g009
Figure 10. Maximum displacement of strata under different working conditions.
Buildings 14 02385 g010
Figure 11. Deformation diagram of existing metro tunnel under different working conditions. (a) Working condition 3; (b) working condition 5; (c) working condition 6; (d) working condition 7.
Buildings 14 02385 g011
Figure 12. Deformation trend map of existing metro tunnel.
Buildings 14 02385 g012
Figure 13. Change curve of △h1/△h2.
Buildings 14 02385 g013
Figure 14. Deformation diagram of bottom of existing tunnel under various working conditions.
Buildings 14 02385 g014
Figure 15. Principal stress diagram of existing tunnel under different working conditions. (a) Post-excavation stress in the first layer; (b) post-excavation stress in the second layer; (c) structural construction; (d) stress after backfilling.
Buildings 14 02385 g015
Figure 16. Site monitoring layout. (a) Monitoring area plan; (b) schematic diagram of the cross-section monitoring point of the subway tunnel.
Buildings 14 02385 g016
Figure 17. Monitoring curve of vertical and horizontal deformation of the existing metro tunnel. (a) Vertical deformation at the position of the left line; (b) vertical deformation at the position of the right line; (c) horizontal deformation at the position of the left line; (d) horizontal deformation at the position of the right line.
Buildings 14 02385 g017
Table 1. List of formation parameters.
Stratigraphic NameUnit Weight γ (kN/m3)Cohesion c (kPa)The Angle of Internal
Friction Φ (°)
Poisson’s
Ratio
Miscellaneous fill18.55.010.00.35
Silty clay18.422.916.00.34
Medium and coarse sand17.34.028.00.32
Gravelly sand18.45.033.00.30
Round gravel20.02.035.00.25
MJS-reinforced soil25.020.035.00.30
Miscellaneous fill18.55.010.00.35
Table 2. Table of structural calculation parameters.
NameStructural Dimensions (mm)Material Density γ (kN/m3)Elastic Modulus
E/MPa
Poisson’s Ratio
Envelope structureΦ80025.03.0 × 1050.25
Initial concrete supporting1000 × 80025.03.0 × 1050.25
Steel pipe bracingΦ609 × 1678.02.01 × 1060.31
Curb girderHM500 × 300 × 11 × 1878.02.01 × 1060.31
Structural base plateh = 90025.03.0 × 1050.25
Structural side walls and partitionsh = 90025.03.0 × 1050.25
Structural roofh = 80025.03.0 × 1050.25
Envelope structureΦ80025.03.0 × 1050.25
Disclaimer/Publisher’s Note: The statements, opinions and data contained in all publications are solely those of the individual author(s) and contributor(s) and not of MDPI and/or the editor(s). MDPI and/or the editor(s) disclaim responsibility for any injury to people or property resulting from any ideas, methods, instructions or products referred to in the content.

