Article

Analysis of Mechanical Properties during Construction Stages Reflecting the Construction Sequence for Long-Span Spatial Steel Structures

1
School of Civil Engineering, Chongqing University, Chongqing 400045, China
2
Chongqing Railway Group, Chongqing 401120, China
*
Author to whom correspondence should be addressed.
Buildings 2024, 14(8), 2389; https://doi.org/10.3390/buildings14082389
Submission received: 25 June 2024 / Revised: 28 July 2024 / Accepted: 31 July 2024 / Published: 2 August 2024

Abstract

:
When constructing long-span spatial steel structures, the unformed structure is often incomplete and unstable. The construction sequence significantly influences the mechanical state of the structure during the construction stages (CSs), affecting both the path and time effects. This study examined the mechanical properties of the construction process using an actual project as a case study, comparing two methods: one-step forming and stage-by-stage forming. Critical turning points of stress and displacement during the CSs were identified as the initial installation and unloading stages. Stress concentrations frequently occurred at temporary support points, and peak displacements often appeared at the outer overhanging bars of the structure. A well-planned construction sequence can effectively manage the structure’s formation, boundaries, and loading to ensure construction safety and stability. The conclusions and analysis methods from this study provide valuable references for the design and construction of similar long-span spatial steel structures.

1. Introduction

Structural state analysis during construction stages (CSs) is pivotal for ensuring the structural safety and efficiency of building projects [1,2,3]. By examining the mechanics and structural behavior during different CSs, engineers can identify potential instabilities and risks early [4]. The insights gained from such analyses assist in adjusting construction techniques and plans, optimizing resource allocation, and reducing costs, thereby enhancing the success and economic efficiency of building projects [5,6,7,8].
Long-span spatial steel structures often experience uneven stresses during the CS, as some members do not yet form a complete mechanical system [9]. The lack of adequate support after installing some structures can lead to additional loads on the installed parts. These uneven forces may cause deformation, stress concentration, or early failure, increasing safety risks and maintenance costs [10,11].
During the structure-forming process, the partially completed structure, supported by a temporary system, behaves as a time-varying structure [12]. The structure’s behavior changes over time during the CSs, directly affecting its stress performance during construction and in service [13,14]. The construction sequence significantly influences the path and time effects during construction, making it critical to analyze the structural state of long-span spatial steel structures [15,16]. A well-planned construction sequence ensures the structure receives the necessary support and stability across all CSs, preventing damage or failure from premature or improper loading [17].
Assessing the reasonableness of the construction sequence involves evaluating the technical requirements and structural safety of each CS. Pre-construction simulations that accurately reflect the construction sequence and provide reliable, intermediate, and final results are important indicators for assessment [18,19,20].
With the rapid development of computer technology, tools such as building information modeling [21] and finite element analysis (FEA) [22] have been widely used in CS analysis. These advanced technologies allow for more accurate simulation and optimization of the construction process for long-span spatial structures [23,24,25,26].
Zheng et al. [27] simulated the jacking construction of a steel truss arch bridge using finite element software and analyzed the stresses and deflections at each jacking stage. Liu et al. [28] used finite element software to simulate and analyze the whole process of pre-stressing tension cable construction and found that the coupling effect would increase the calculated internal force of the structure and effectively reduce the influence of scaffolding dislodgement on the internal force of the structure. Qin et al. [29] proposed the concept of stress-free state variables to derive equations for controlling the mechanical equilibrium and geometry of structures constructed in stages, providing an effective method for construction control and calculation. Li et al. [30]. effectively assessed the local stress state of steel box girders during jacking construction by finite element analysis and revealed the effect of jacking asynchrony on structural forces.
Currently, the analysis of the structural state during the CS of long-span spatial structures has not garnered adequate attention. Specifically, the construction sequence plays a pivotal role in determining the mechanical behavior and stability of the structure as it is being built. To address this gap, our study aims to integrate theoretical analysis, numerical simulation, and real-world engineering examples. Through this comprehensive approach, we seek to delve deeply into the mechanical behavior of long-span spatial structures during their construction phase. Furthermore, we aim to elucidate the precise mechanism through which the construction sequence impacts the structural safety of such projects. By conducting this research, we hope to offer practical guidelines and recommendations for constructing similar long-span spatial structures. Our goal is to ensure not only the safety of these structures but also the efficiency of the construction process itself. This study promises to bridge the knowledge gap, providing valuable insights for engineers and construction professionals alike.
This paper is organized as follows. Section 2 provides the background to this study, including the theory of nonlinear time-varying analyses during the CS, commonly used steel construction techniques, and the engineering background. Section 3 presents the methodology of this study. The construction scheme is developed for an actual project to guide the specific construction process. Section 4 analyzes the construction sequence’s effect on the construction process’s mechanical properties. FEA software Midas Gen 2022 is used to analyze the mechanical properties of the whole construction process of a long-span spatial steel structure that explicitly reflects the construction sequence. The difference between one-step and stage-by-stage forming of the structure is compared. Section 5 presents the conclusions of this study.

2. Background

2.1. Nonlinear Time-Varying Analysis of CS

The construction of a long-span spatial steel structure is a complex and gradual process of the structural system. Throughout the construction process, the structure’s geometry, stiffness, loading, and boundary conditions represent time-varying characteristics [31]. This makes for a certain degree of nonlinear relationship between the force state of the structure during CS and time [32,33]. Iterative or incremental methods generally solve nonlinear problems [34]. In particular, the incremental method involves dividing the load into several steps, where each load increment ΔP corresponds to a displacement increment Δδ in different loading steps, and the final displacement is obtained by accumulating the incremental steps. This method can obtain the analysis results of each stage in the loading process and is an effective method for solving geometric nonlinear problems in CS [35].
Based on incremental finite element theory, the birth and death unit method is a nonlinear analysis method of construction mechanics with more current applications [36]. The birth and death unit method achieves dynamic changes in the model by building a complete structural model at once and gradually activating or deactivating the corresponding units at each CS. The birth and death unit method ensures the continuity of the model. The structural analysis of each CS is based on the previous stage’s internal force and deformation results, reflecting the stage-by-stage effects of the construction process. This study uses the node-corrected birth and death unit method to achieve the mechanical simulation of the construction process. The three-section cantilever structure shown in Figure 1 is used as an example to illustrate the basic principle of this analysis method.
In the first two CSs, the results of the activated unit calculations under the node-corrected birth and death unit method were identical to those of the birth and death unit method. However, the displacement of node 4 is constrained due to the temporary support. The drift of the dead unit is suppressed, controlling the installation pattern of the construction process. When analyzing the 3rd CS, due to the presence of temporary supports, the 3rd section of the beam is activated at this point and coupled with geometrical nonlinearities, forming the controlling equations of the structure at this stage in Equation (1).
[ K 11 , 1 K 12 , 1 0 0 K 21 , 1 K 22 , 1 + K 22 , 2 K 23 , 2 0 0 K 32 , 2 K 33 , 2 + K 33 , 3 K 34 , 3 0 0 K 43 , 3 K 44 , 3 ] [ u 1 u 2 u 3 u 4 ] = [ F 1 F 2 F 3 F 4 ]
where Kij,m, ui, and Fi are sub-matrices of the unit stiffness matrix, node displacements matrix, and load column matrices, respectively. i = j = m has values in the range 1, 2, 3, 4.
The load P4 is introduced into Equation (1) to act directly on the temporary support with boundary conditions u1 = 0 and u4 = 0. The controlling equation is now as in Equation (2).
[ 1 0 0 0 0 K 22 , 1 + K 22 , 2 K 23 , 2 0 0 K 32 , 2 K 33 , 2 + K 33 , 3 0 0 0 0 1 ] [ u 1 u 2 u 3 u 4 ] = [ 0 P 2 P 3 0 ]
The dead units are activated now, and the stiffness matrix is no longer singular. The displacement value under this CS can be obtained directly. Finally, the 4th CS is analyzed based on the first three CSs, and the control equation is shown in Equation (1). However, its boundary condition becomes u1 = 0, and the corresponding control equation is shown in Equation (3).
[ 1 0 0 0 0 K 22 , 1 + K 22 , 2 K 23 , 2 0 0 K 32 , 2 K 33 , 2 + K 33 , 3 K 34.3 0 0 K 43 , 3 K 44 , 3 ] [ u 1 u 2 u 3 u 4 ] = [ 0 P 2 P 3 P 4 ]
The displacement value at each node at completion can be obtained through Equation (3). After the displacements at each CS have been calculated, the corresponding structural strains and stresses can be derived from the geometric and physical equations.

2.2. Construction Methods

Long-span spatial steel structures adopt different construction methods for different structural forms and states [37]. Through scientific and reasonable selection of construction methods, construction efficiency, quality, and safety can be effectively improved [38,39]. At present, the most often used construction methods include the overhead bulk installation method [40], installation methods in strips or blocks [41], the aerial skidding method [42], the overall hoisting method [43], the overall lifting method [44], and the overall jacking method [45]. Relevant cases are shown in Figure 2.

2.3. Engineering Background
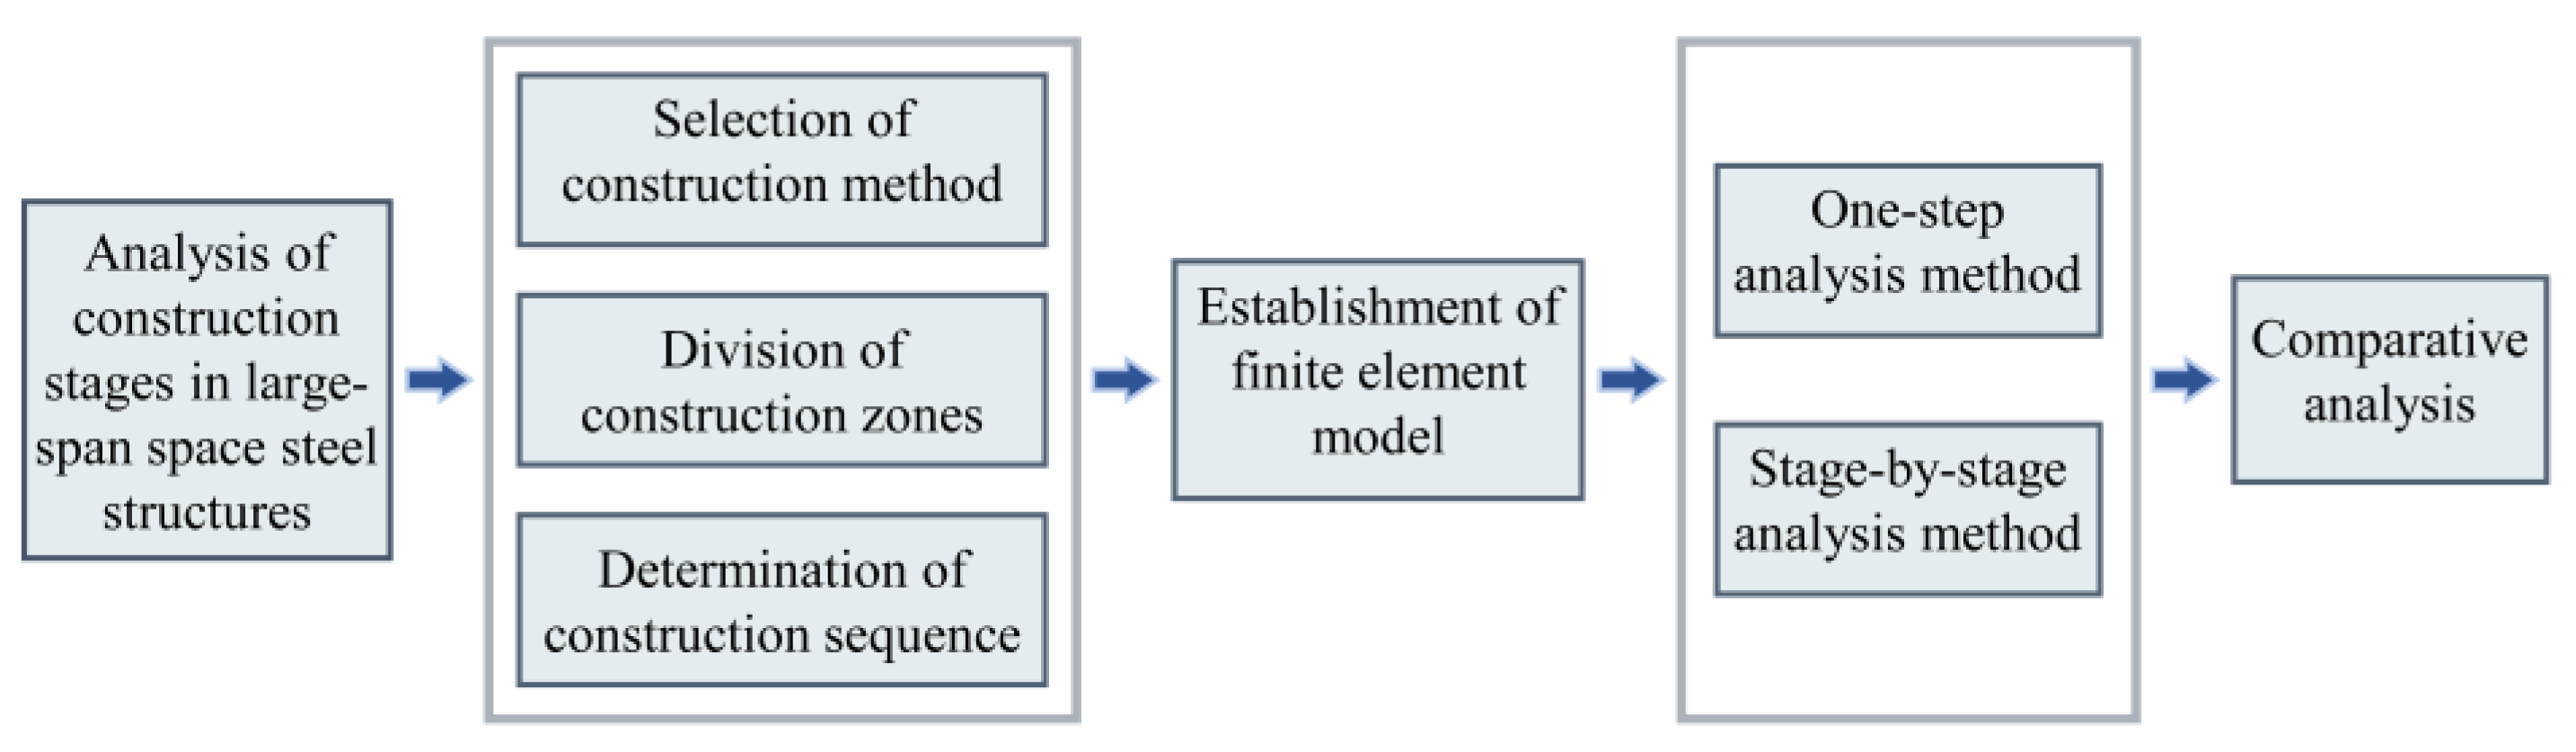
Chengdu Tianfu International Airport in China contains terminals T1 and T2 in a “T” configuration. The building outline is symmetrical. T1 has a floor area of 387,400 m2 and a land area of 126,000 m2. It is a class I integrated terminal building. The building is 1290 m long from north to south, 520 m wide from east to west, and the highest point of the roof is 45 m. The roof grid elevation of T1 is hyperboloidal in shape, and it forms several spatial structures with significant differences in elevation through three skylight bands. The overall steel roof is a steel mesh frame with orthogonal and orthogonal four-angle cone-shaped welded-ball mesh frames. The height of the mesh frame is 4~6 m. The minimum height of the overhanging part is about 1.5 m. The grid size of the standard internode is about 5.2 m × 5.2 m. The specification of the rods is 180 mm × (10~500) mm × 40 mm, and the main specification of the welded balls at the node position is D300 × 14~D800 × 50, among which the balls with a diameter of more than 500 mm are the ones with reinforced ribs. The total steel consumption of the project is about 24,000 t, the number of mesh frame bars is about 160,000 and the projected area of the mesh frame is about 180,000 m2. The actual view of the project is shown in Figure 3.
T1 contains the central hall of the D area and three finger corridors: A, B, and C. Seismic joints separate them to form four independent structural units. The central hall of the D has a large project volume and is in the core dominant position in the construction process. Hence, this study focuses on the analysis of the central hall of the D. The plan dimensions of the central hall of the D are 522 m × (107~324) m, and the central column network dimensions are 9 m × 18 m, 12 m × 18 m, and 18 m × 18 m, with four floors above-ground, five floors of local commercial content, and a roof apex elevation of 45 m. The overview of the project is shown in Figure 4. This steel structure project has a large volume, wide construction scope, long timeframe, and, at the same time, high requirements for installation accuracy, which brings enormous challenges to on-site construction.

3. Methodology

The T1 terminal building adopts a long-span spatial steel structure system. In order to ensure the safety and stability of the roof’s mesh frame of the T1 terminal building during the construction process, the mechanical performance analysis of the CSs of the long-span spatial steel mesh frame, which clearly reflects the construction sequence, was carried out. The framework of the analysis method is shown in Figure 5.
The analysis of the CSs of the long-span spatial steel structure project begins with the corresponding construction design. Including the selection of the construction method, the division of the construction zones, and the determination of the construction sequence. The FEA model is established close to the actual project. The structural and mechanical properties and displacements obtained by the one-step and stage-by-stage forming methods are analyzed, respectively. Then, the results obtained by the two methods are compared, and finally, conclusions are drawn that are useful for guiding the construction.

3.1. Selection of Construction Methods

The long-span spatial steel structure in this project is constructed by combining floor or ground assembly and then the overall cumulative hoisting of blocks and local-zone block lifting. Each block hoisting unit is divided into several cumulative hoisting assembly zones according to the structural floor assembly elevation below the mesh frame projection and the mesh frame’s elevation. The cumulative lifting of the zones during construction can effectively use the working surface of the concrete floor. The amount of overhead work is small, ensuring construction safety while accelerating the construction progress.

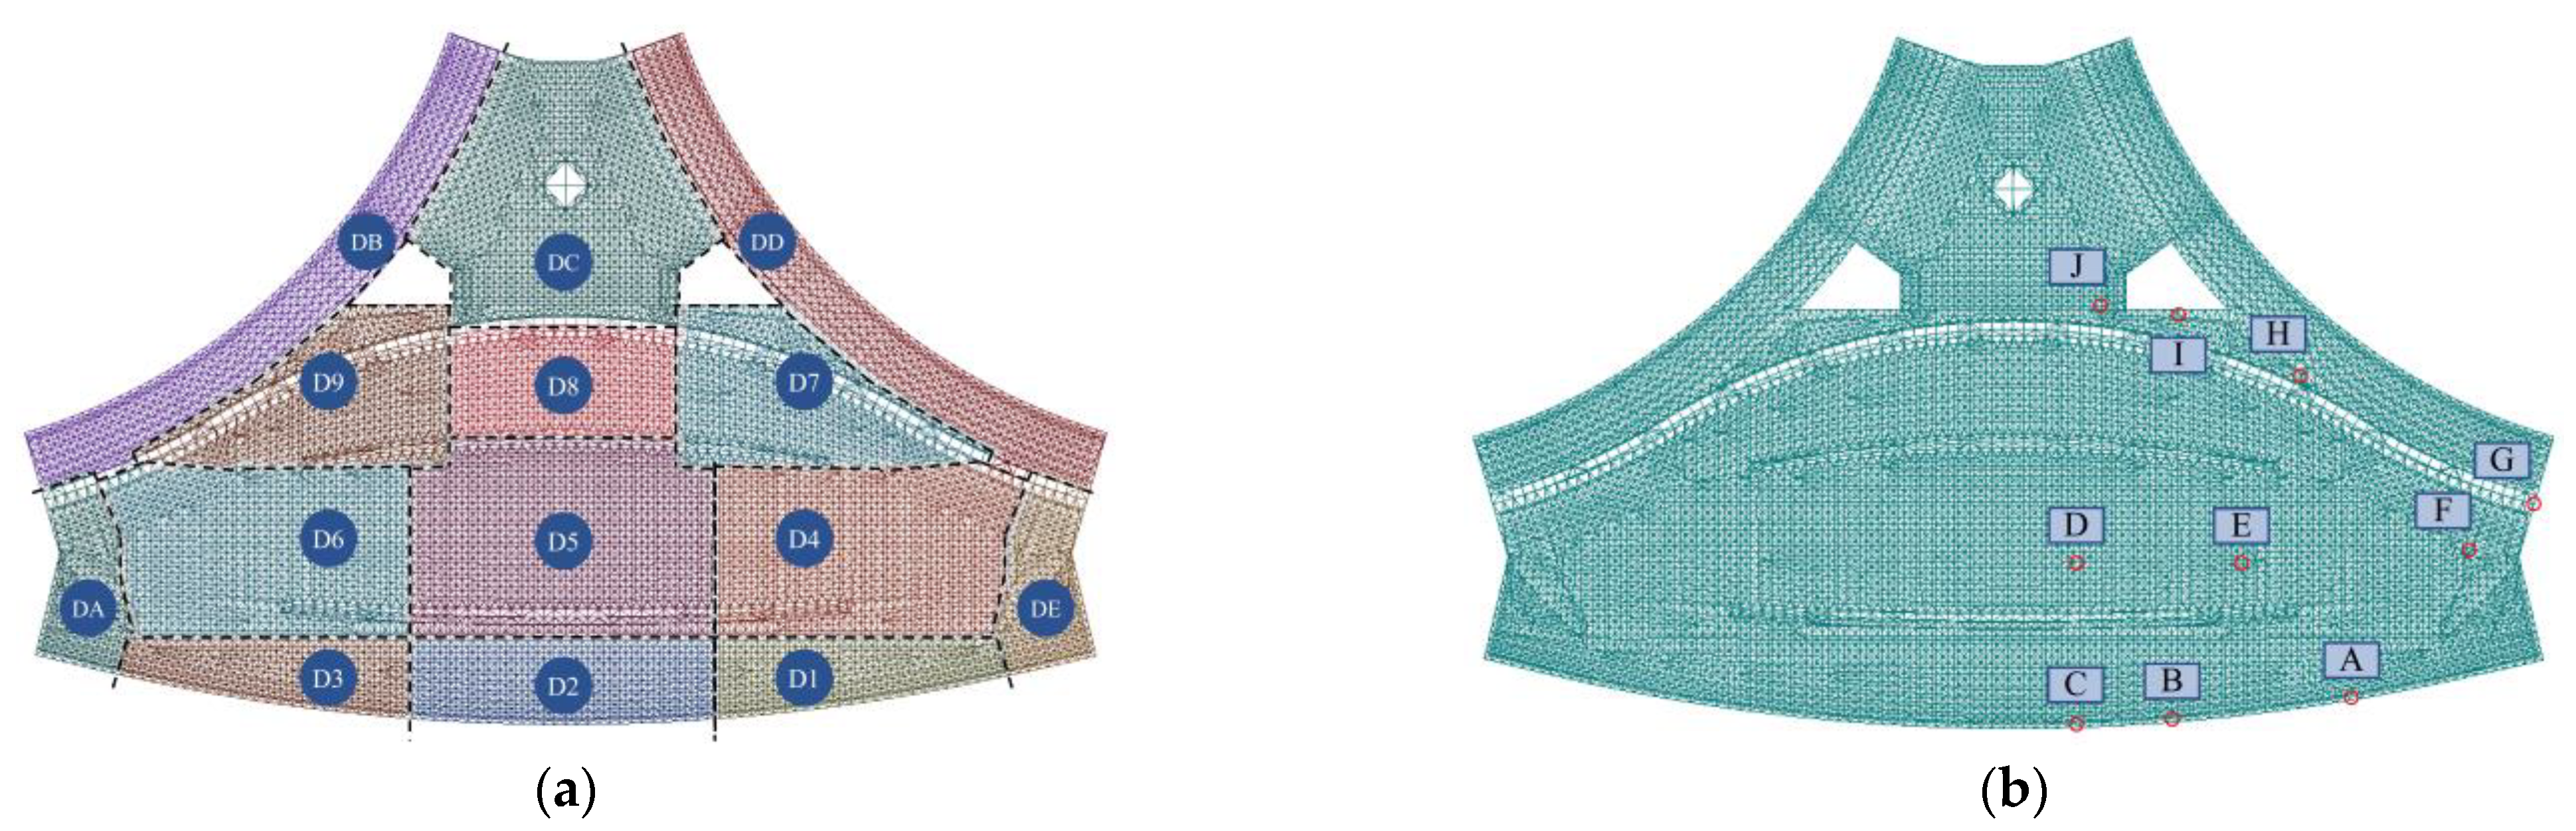
3.2. Division of Construction Zones

The spatial steel mesh frame is supported on the lower steel columns connected to the roof using column-top supports. The structure was partitioned based on the concrete construction sequence. As shown in Figure 6a, the hall’s spatial steel grid was divided into 10 integral hoisting block units and 4 lifting block units.
Critical locations during construction were selected for continuous monitoring of stress and displacement changes. Due to the symmetry of the structure in the plan, one half of the structure was selected for monitoring. The nodes were selected as a reference based on the occurrence of maximum stress and displacement change values during each CS. The arrangement of monitoring points is shown in Figure 6b.

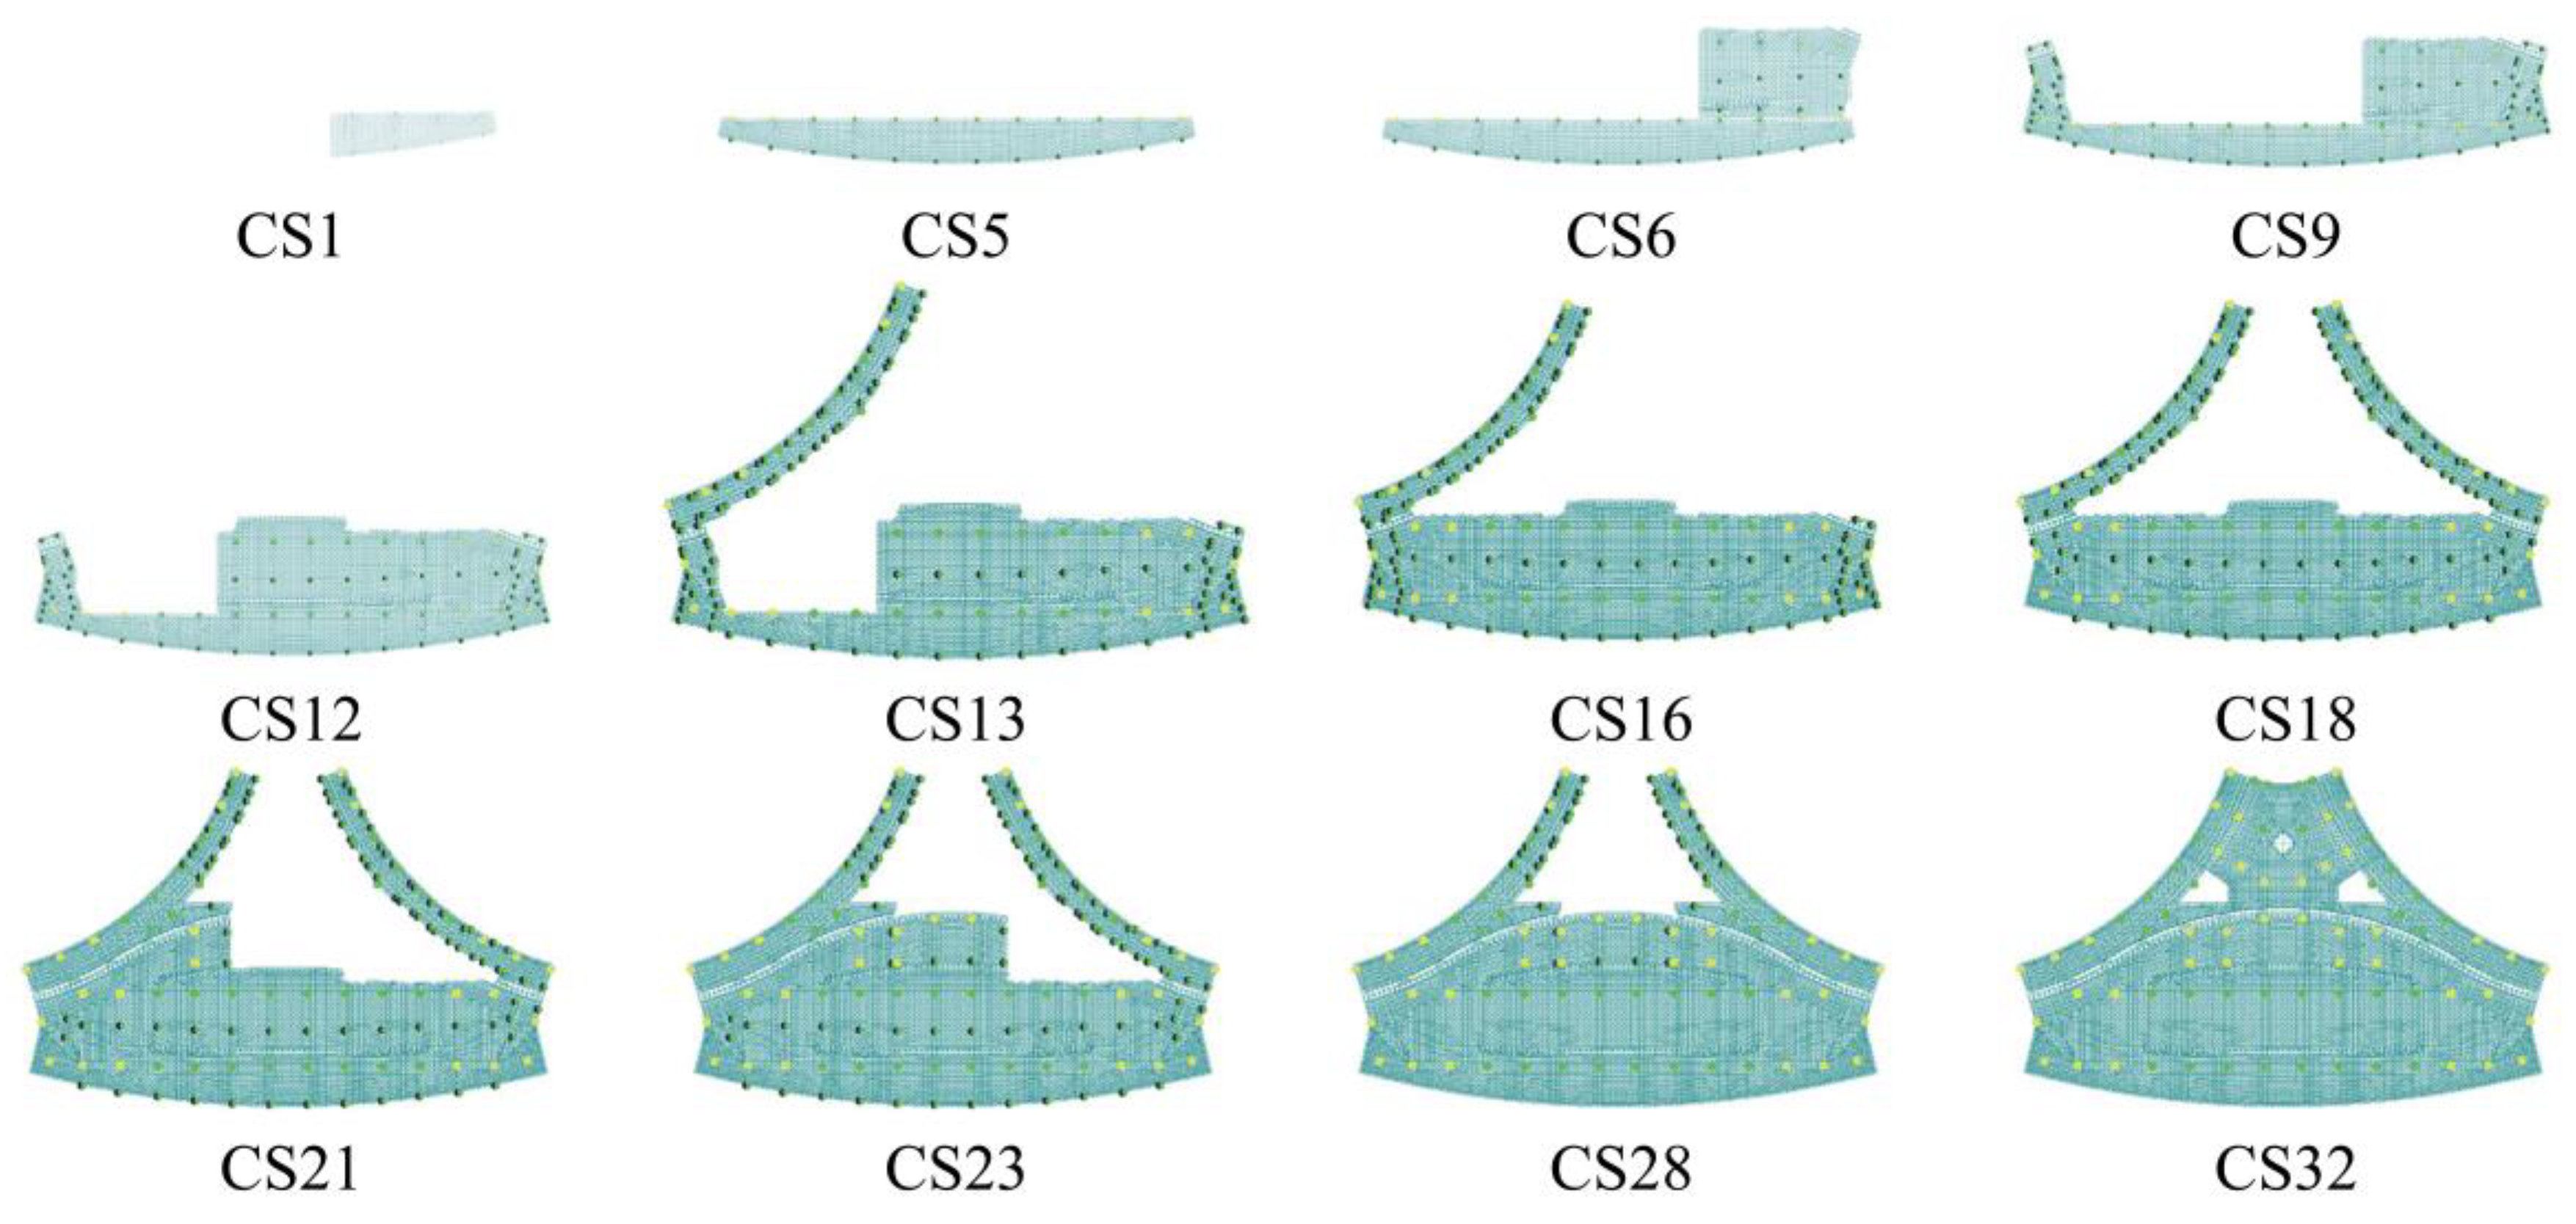
3.3. Determination of Construction Sequence

The project features a hyperbolic spatial mesh frame structure notable for its complexity, expansive spatial span, numerous rods, and stringent demands on installation accuracy. The scope of steel structure construction is extensive, and the timeframe is protracted. Additionally, there is considerable overlap with civil construction, electromechanical work, roofing, and other units. The construction site is confined, necessitating a piecemeal provision of workspaces. Therefore, the construction sequence is as follows: 2 sets of crawler cranes start construction from the left zone of the C zone and advance the construction in the direction of the A zone. The mesh frame hoisting installation process is interspersed with the local block zone rod embedded in it. Construction of the lifting block zone for part of the lifting operation. Temporary support partition unloading is interspersed in the process of mesh frame installation.
The specific CSs were as follows: hoisting sub-block D1 and installing it into the column-top support, hoisting sub-blocks D2 to D4, and carrying out the rod insertion between adjacent sub-blocks. After completing the installation of the D4 sub-block, lifting the DA and DE sub-block, and handling the connection between adjacent structures. Next, remove the lifters of sub-blocks D4 and D1 and turn them into supports. After that, hoist sub-blocks D5 to D9 in sequence, nesting the rods between neighboring structures after each hoist while dismantling the lifters. During this period, the lifting of the DB and DD sub-blocks was interspersed with removing the hoists on the D5 and D6 sub-blocks. Eventually, the DC sub-block was hoisted, and after removing its hoists and the remaining tire frames, all zones of the central-span support pylons were unloaded, completing the installation of the entire structure. Figure 7 shows the critical stages in the structure’s formation process.

4. Experiments and Results

The construction of long-span spatial steel structures is affected by various factors, including the installation sequence, the transformation of the stress system, and the construction loads. The stiffness of the structural system is related to the stress–strain path, so the boundary time-varying process of its construction will directly affect the stress–strain path, which leads to different mechanical states of the overall structure. In this study, the finite element calculation software Midas Gen 2022 is used to perform CS simulation analysis to verify the reasonableness of the construction scheme. The structure is verified to meet the design and code requirements during and after forming. The pre-conditioning deformation is also set according to the displacement results to eliminate the adverse effects of construction deformation and to achieve the structural appearance requirements and functionality.

4.1. Establishment of the Model

The time-varying structure consists of the partially completed structure and the temporary support system, which constantly changes as construction proceeds. Moreover, each CS’s specific conditions and results impact subsequent CSs. Therefore, establishing a correct model is essential to ensure the accuracy and reliability of the analysis results. The steps in the construction sequence analysis include the setting of material properties, which in turn leads to the creation of a complete model. Structural, boundary, and load groups are defined according to the construction scheme. The definition of the CS is then achieved by activation and inactivation of the structure, boundary, and load groups. The structural model was built in Midas Gen 2022 software, and the following is a detailed description of the computational model.
  • Material properties. According to the structural design program, the main materials are Q345 steel and 650-grade alloy steel [46,47,48]. The steel tie rods are made of 650-grade alloy steel, and the rest of the structural parts are made of Q345 steel;
  • Load value. The load conditions involved in the construction process analysis include the constant load and live load. The constant load includes the self-weight of the steel structure and accessory structures. Considering the bolted ball nodes in the grid structure, the self-weight coefficient is enlarged to 1.05. The live load includes the construction loads, such as temporary personnel and machinery weight during construction;
  • Power amplification factor. The structure is subjected to dynamic loads due to the action of lifting equipment during installation. Therefore, the dynamic load coefficient is set to 1.4;
  • Unit type. The grid structure is simulated by a beam unit, considering the bending moment. The truss unit simulates the steel tie rods without considering the bending moment;
  • Boundary conditions. Fixed supports simulate the connection between fixed supports at the top of columns and the mesh frame. Articulated bearing simulates the connection between a temporary support and the grid structure. The sliding bearing simulates the connection between the sliding bearing at the top of the column and the grid. The elasticity coefficients of the sliding bearing are set to 8 kN/mm, 6 kN/mm, and 4 kN/mm, respectively.

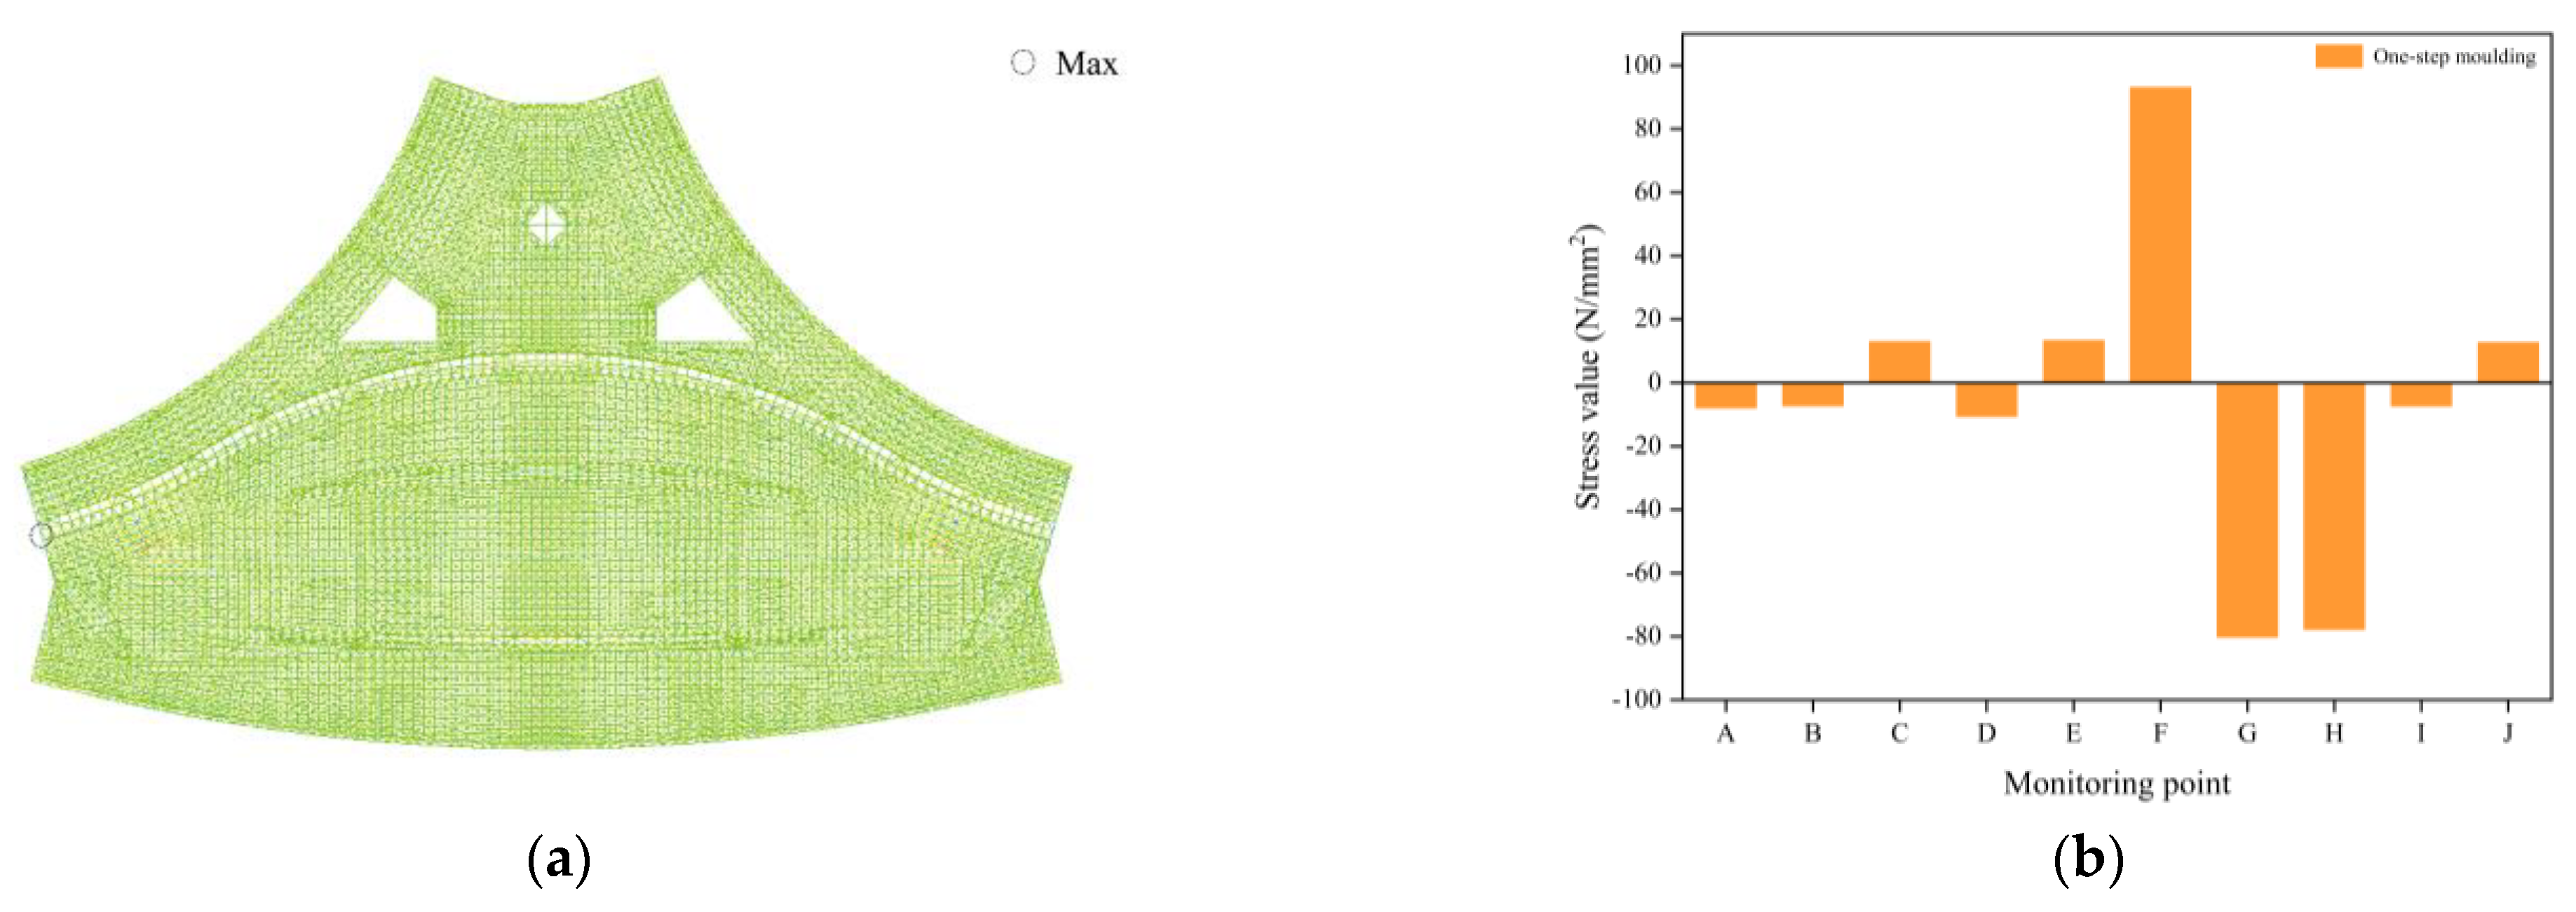
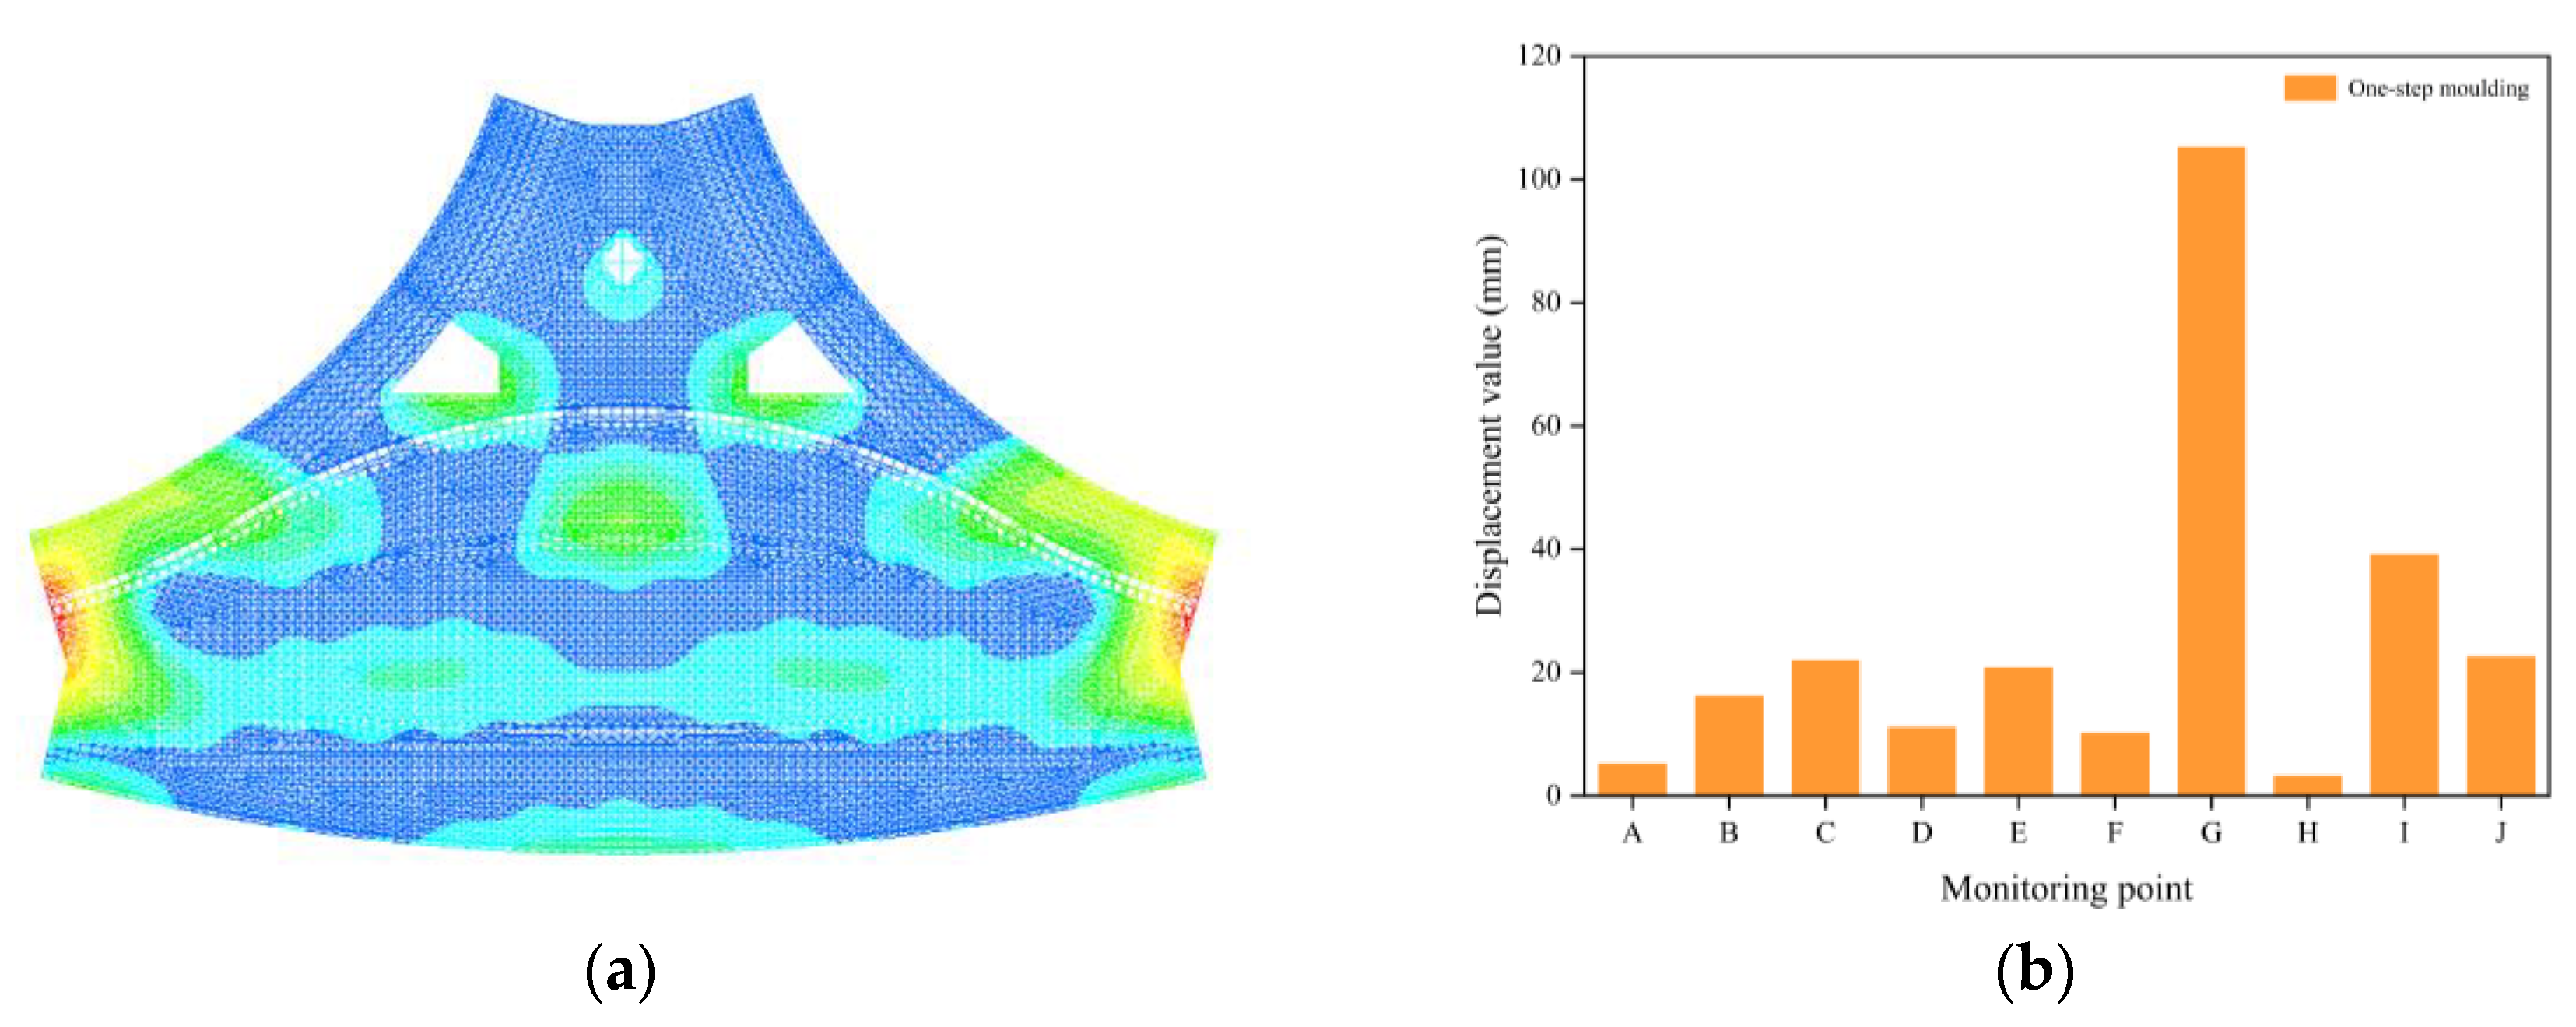
4.2. One-Step Analysis Method

The one-step analysis method can quickly and accurately predict and demonstrate before the structure is actually constructed, the stresses and displacement deformations of the structure once it is fully formed, and any potential structural safety hazards that may arise. The rapidity of the methodology helps the project team to evaluate the effects of different construction design options and select the best solution, thereby reducing construction design time.

4.2.1. Stress Analysis

The stress state of the structure after one-step forming is analyzed, and the stress cloud diagram and the stress values at each monitoring point are shown in Figure 8.
As shown in Figure 8a, the overall stress distribution after the structure is molded is relatively uniform. The stresses showed a symmetrical distribution. The maximum stress value is located in the outermost suspension member in the DA zone, and its value is 113.2 N/mm2. It is influenced by the self-weight of the suspension structure and the longer span. The presence of fixed supports led to the concentration of some highly stressed bars in the D6 and D4 zones, but the stress values were less than 100 N/mm2, which satisfied the safety requirements. Figure 8b shows the stress values at key monitoring points. The maximum stress is at point F, with a value of +93.16 N/mm2; the minimal stress is at point B, with a value of −7.37 N/mm2. The higher stress monitoring points F, G, and H are all located in the structure’s perimeter in the overhanging zone, which reflects the critical zone for monitoring the structure’s stress after forming.

4.2.2. Displacement Analysis

The displacement state of the structure after one-step forming is analyzed, and the displacement cloud diagram and the displacement values at each monitoring point are shown in Figure 9.
As shown in Figure 9a, the larger displacements after forming the structure are concentrated in the overhang and mid-span regions of the structure. Similarly, the displacements are symmetrically distributed. The maximum displacement is located in the outermost bars of the overhangs in the DA and DE zones, with a value of 107.84 mm. Although the value meets the specification requirements, it is appropriate to set the deflection value of the constant load in the reverse arch according to the deflection value of the constant load in order to ensure the accuracy of the structure’s formation. Figure 9b shows the displacement values at key monitoring points. The maximum displacement is at point G, with a value of 105.24 mm. The minimum displacement is at point H, with a value of 3.24 mm. The displacement value of monitoring point G, located in the outer part of the overhanging bars in the DE zone, is much higher than that of the rest of the monitoring points. This is because point H is affected by the support of the temporary support frame below and point G has the largest overhang distance and is affected by the effect of self-weight. Therefore, more attention should be paid to the structure’s displacement and the deformation of the overhang and central-span zone.

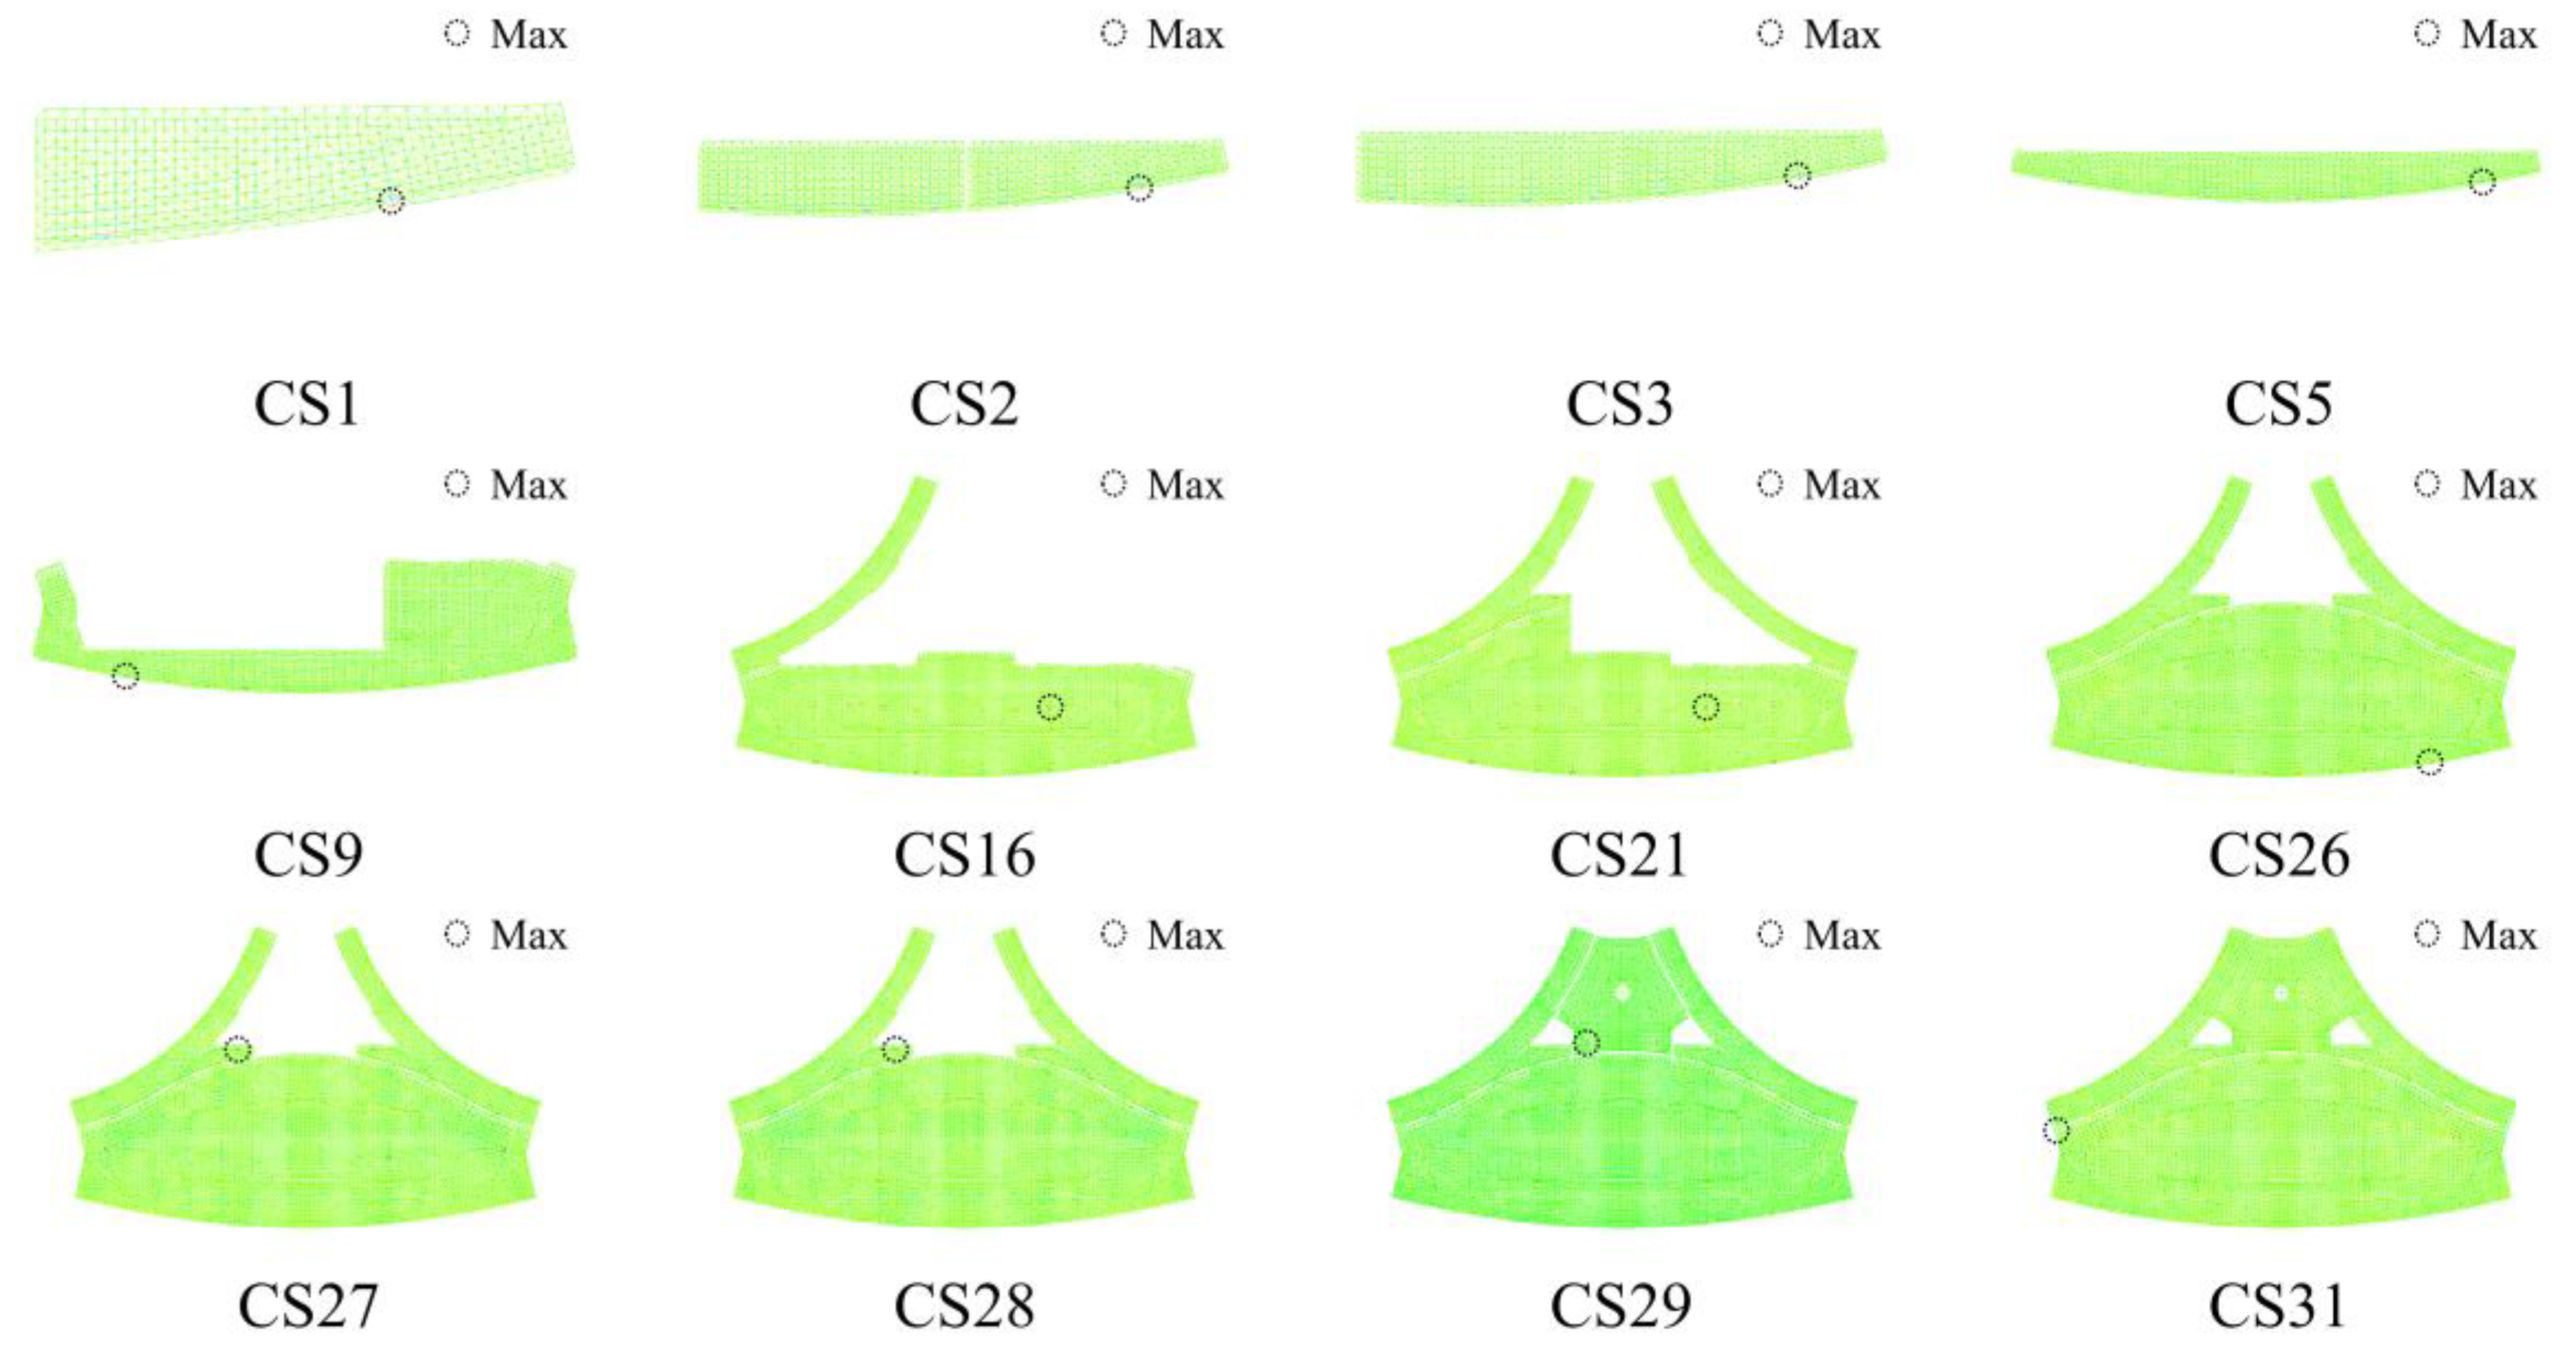
4.3. Stage-by-Stage Analysis Method

The stage-by-stage forming method predicts the stress state and displacement deflections at each CS by modeling the step-by-step construction process of the structure. By modeling the loading conditions and structural interactions specific to each stage, this method provides a detailed understanding of the cumulative impact of successive construction activities on the overall structural integrity.

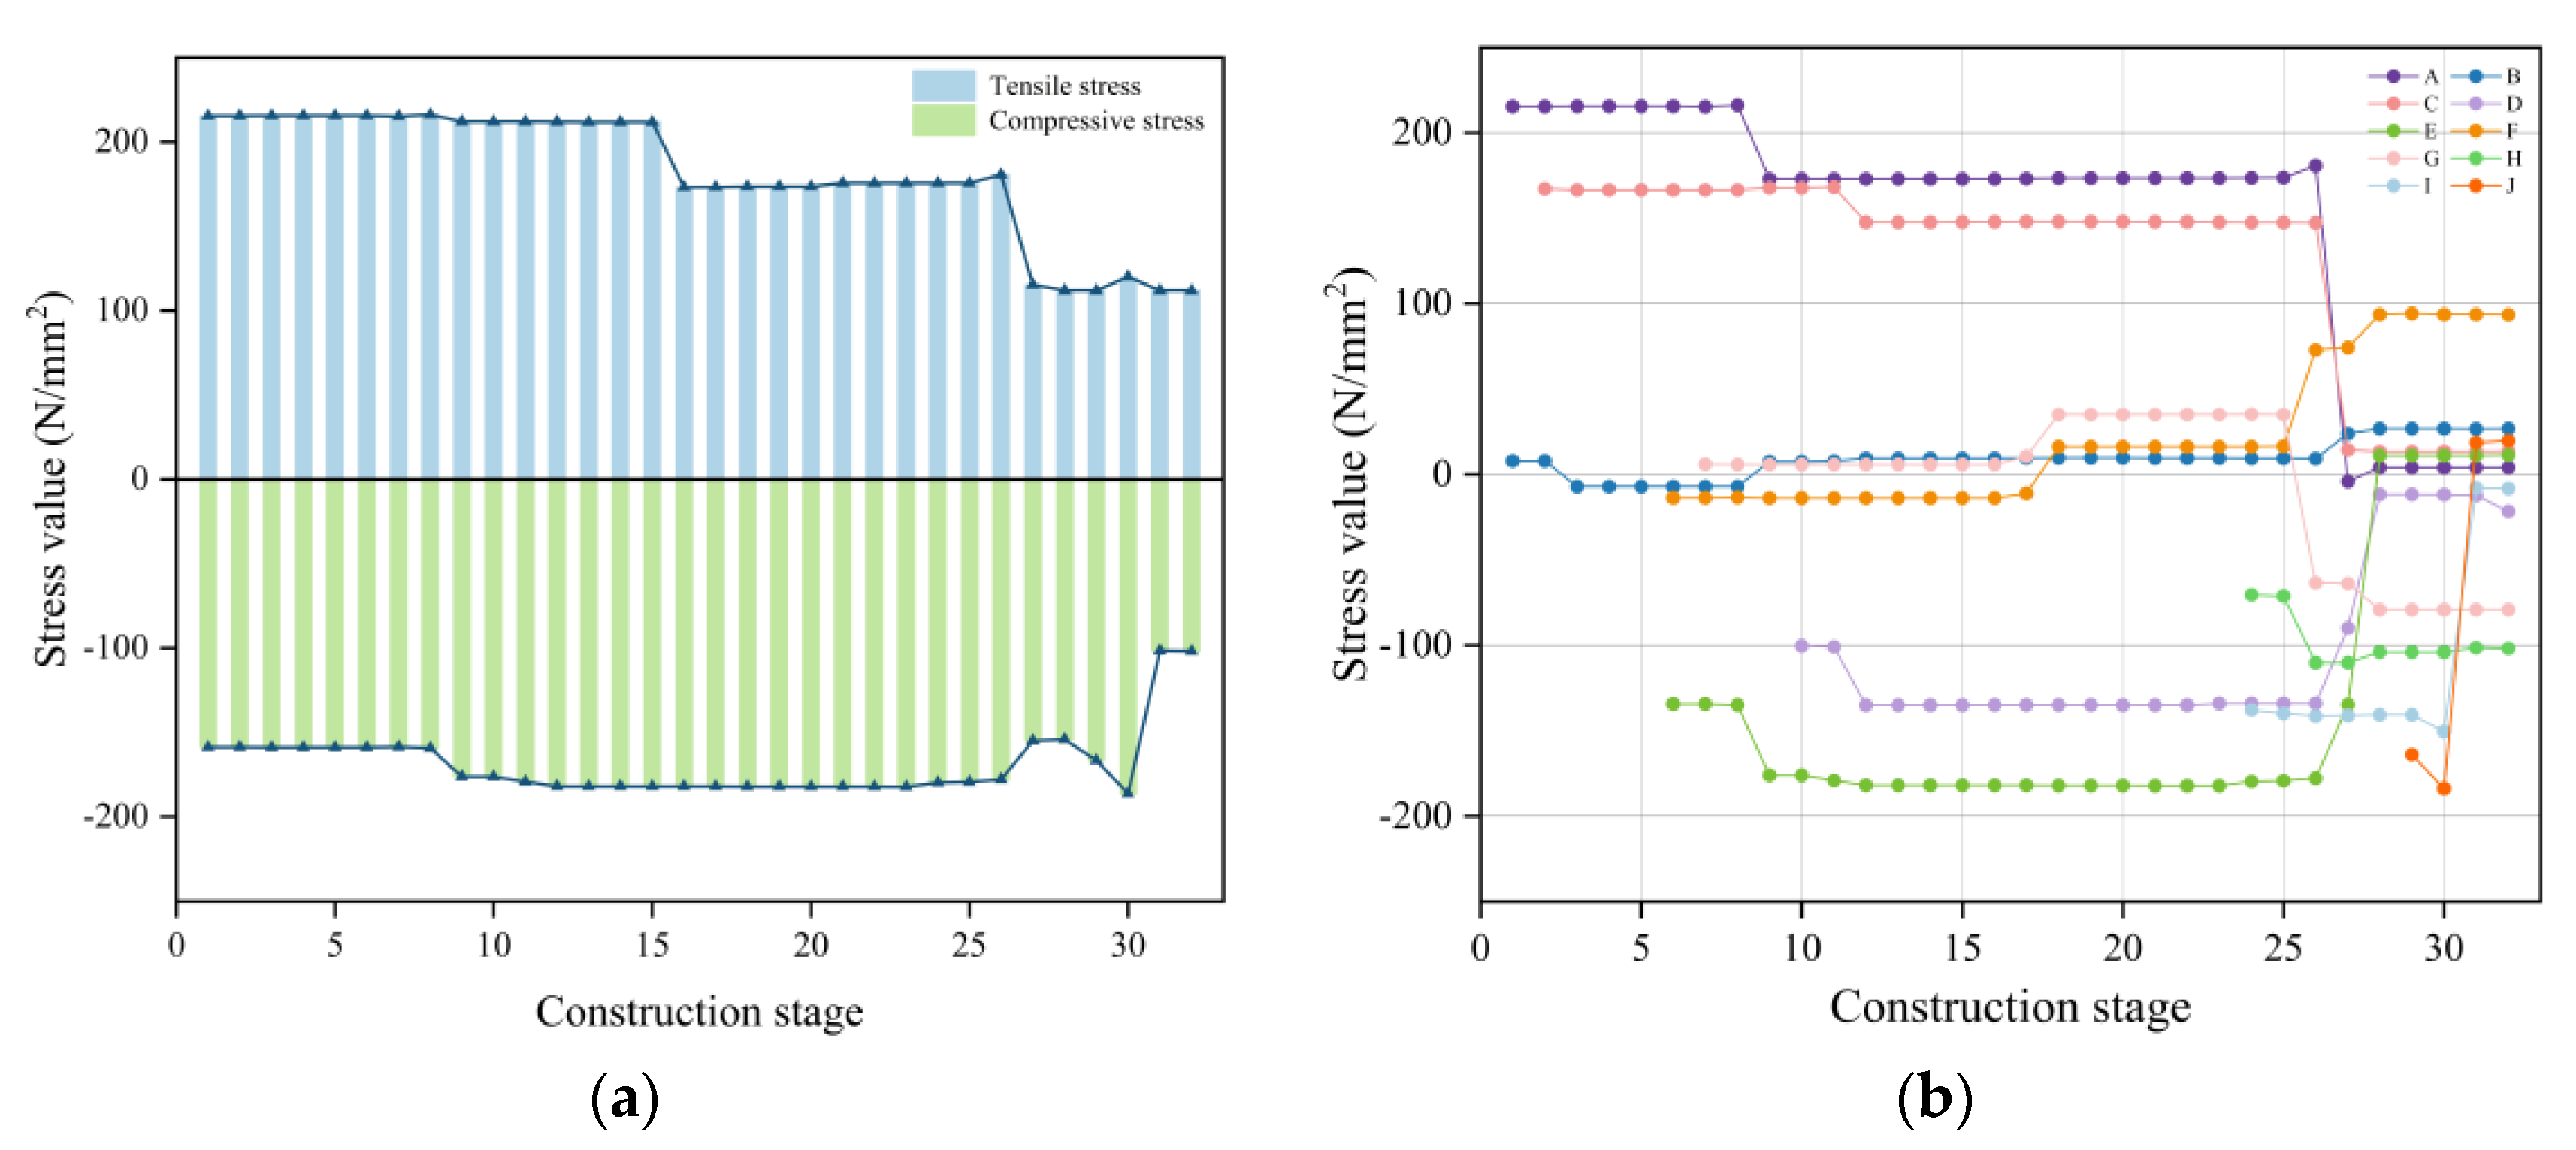
4.3.1. Stress Analysis

According to the division of CSs, the structure is divided into crucial CSs in the process of block installation, steel tie-rod tensioning, and overall unloading in the zones. Therefore, the stress cloud diagram results of the critical stages are selected to be presented, as shown in Figure 10.
The stress cloud diagrams visualize the stress distribution of the unshaped structure at various CSs. It can be seen that there is an evident stress concentration at the support points of the structure, while the structure has a more uniform distribution of stresses in other areas. From CS1 to CS8, the maximum stress value in the structure is located at the temporary support point in the D1 zone. At CS9, the temporary bracing of D1 zone was unloaded, the maximum stress value within the structure was transferred to the D3 zone. At CS16, when the temporary support frame was uninstalled at D3, the maximum stress value shifted to the D4 zone. Until CS26, when the temporary bracing frames of DD and the D7 zone were removed, the maximum stress value again appeared to be highest at the initial position of the D1 zone. After that, the construction operations consisted mainly of zone unloading, and the maximum stress value always appeared in the D9 zone. At CS31, the dismantling of the temporary bracing in subzones DB, DC, and DD caused the maximum stresses to occur in the outermost overhangs of subzone DA, which continued until the construction was formed. The forming and unloading of the structure was the leading cause of stress distribution throughout the construction process. It was necessary to ensure that the temporary bracing in the high-stress zones could reliably support the superstructure loads.
The maximum values of stresses occurring at each CS are recorded in Table 1. Their variations can be seen in Figure 11a.
The maximum tensile stress of 216.18 N/mm2 and the maximum compressive stress of 186.28 N/mm2 appear in CS8 and CS30, respectively. Both are less than the strength design value of the Q345 material, 295 N/mm2. This shows that the strengths of the structural materials during construction meet requirements and have more safety reserves. Based on the trend in stress change, the data can be divided into the following four main stages.
The tensile and compressive stresses from CS1 to CS8 are relatively high and stable. They are around 215 N/mm2 and −158 N/mm2, respectively. This shows that the structure is subjected to high but infrequent changes in tensile and compressive stresses in this stage. The construction work in this stage mainly consists of installing individual sub-blocks and mending the linkage bars between neighboring sub-blocks. The stage is named the initial stage of stress.
There was a significant increase in compressive stresses from CS9 to CS15, with a total increase of 22.68 N/mm2. In contrast, tensile stresses decreased slightly, with a total decrease of only 4.3 N/mm2, due to the first removal of the lifters on the lifting sub-blocks and their conversion to supports during CS9. A case of redistribution of structural stresses was carried out during construction. This stage is named the stress adjustment stage.
The tensile stress decreased significantly from CS16 to CS25, from 211.88 N/mm2 to 173.24 N/mm2. The removal of the lifters on the D6 and D3 sub-blocks resulted in stress redistribution in the structure, which led to a decrease in the tensile stress. Moreover, the compressive stress remained stable, showing the continuity and consistency of the construction process. This stage is named the stress acceleration adjustment stage.
Both tensile and compressive stresses decreased significantly from CS26 to CS32. The total reduction in tensile stress is 68.8 N/mm2, and the total reduction in compressive stress is 75.94 N/mm2. The main construction task in this stage is the step-by-step demolition of the temporary structure, and the structural stresses are continuously redistributed. At this time, the construction has been nearly completed, and the structure has been relatively stable. This stage is named the stress stabilization stage.
Figure 11b shows the stress changes at the monitoring points throughout construction. From CS1 to CS25, the stress values at monitoring points A, C, D, E, and I are above 100 N/mm2. From CS26 to CS32, the stress values at monitoring points D, E, H, and I are above 100 N/mm2. This requires that attention be focused on the structural stresses in the vicinity of the locations of these monitoring points.
Combined with Figure 11a,b, the structural stress values after forming tend to be relatively stable and low. Stress maxima tend to occur during construction. These stress peaks may be due to stress concentrations resulting from changes in structure, loads, or boundary conditions during a particular CS. Therefore, to ensure a smooth construction process and the stability and safety of the structure for long-span spatial steel structures, the construction sequence must be fully considered and accurately modeled.

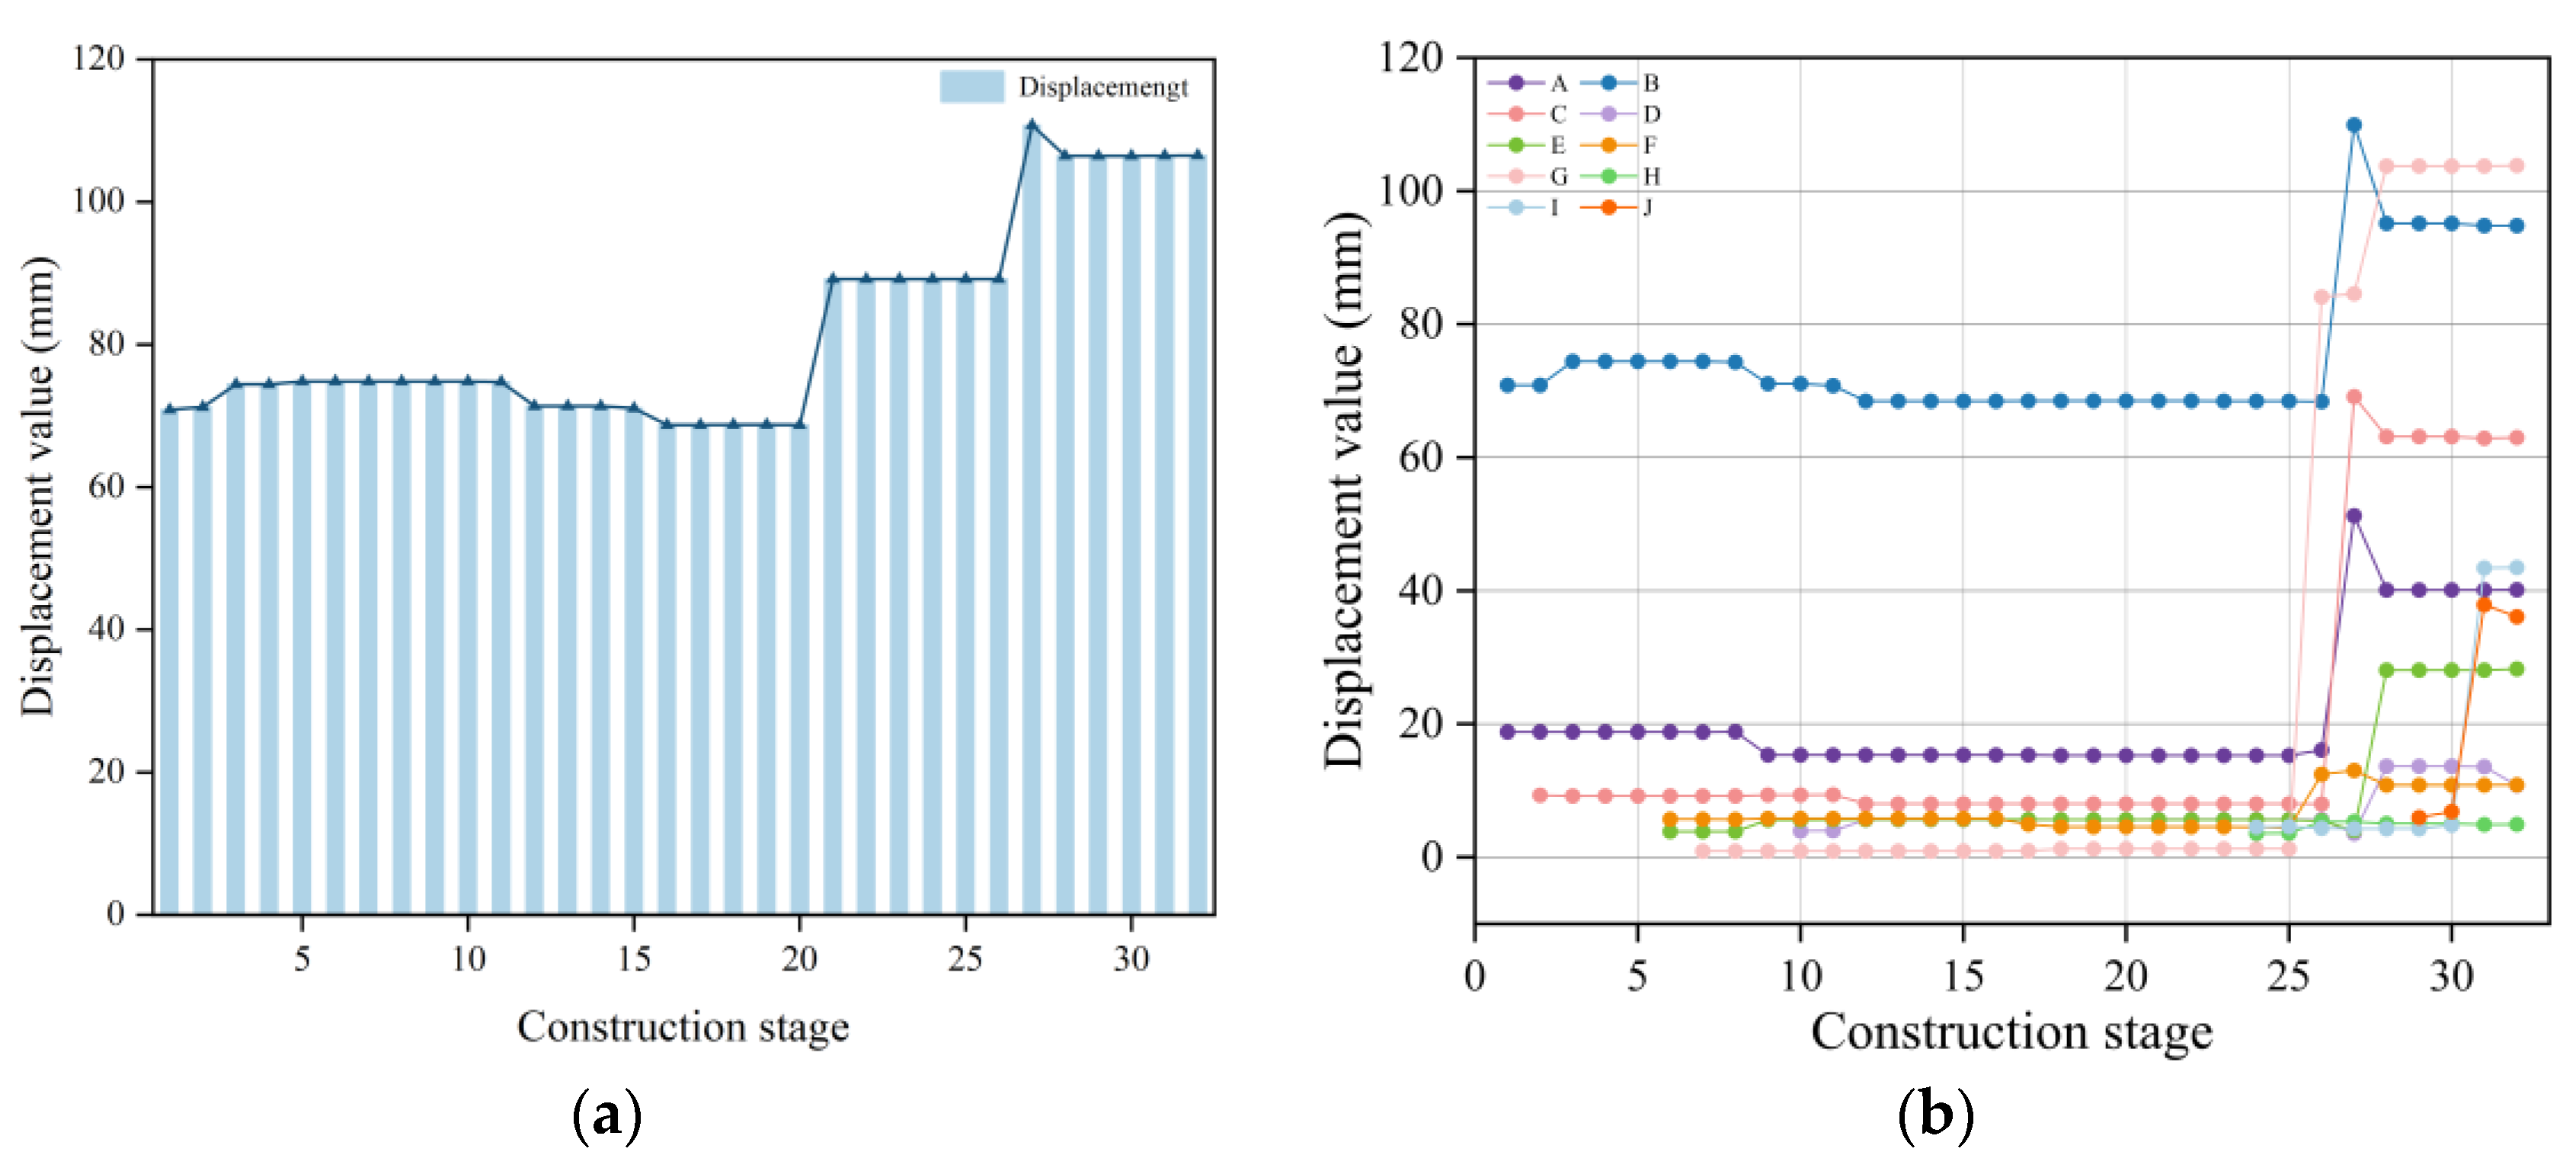
4.3.2. Displacement Analysis

Displacement changes are the focus of construction analyses. Monitoring displacements can help engineers assess the structure’s performance during CS to ensure that it meets the design criteria and to identify potential safety issues in a timely manner. Therefore, the displacement cloud diagram results of the critical stages are selected for presentation, as shown in Figure 12.
As shown in Figure 12, the higher displacement deformations during the construction of the structure occurred in the overhanging areas of the structure and the mid-span areas of the structural subdivisions. The remaining locations have more uniform displacement changes. From CS1 to CS20 and CS27, the overhang in the D1 and D3 zones adjacent to the D2 zone is where the displacement deformation is at its maximum. The other stages also showed large displacement deformations. From CS21 to CS26 and CS28 to CS32, the outermost overhangs of DA and DE showed the maximum displacement deformations. After CS26, the structure has been primarily formed. The construction activities after that mainly included unloading in the zones and replenishing rods in localized areas. At CS27, after unloading the temporary bracing frames of D1, D2, and D3, the displacement and deformation of the outermost overhanging bars in this area were concentrated. At CS28, after unloading the temporary bracing frames in the zones of D4, D5, and D6, the displacement and deformation in the overhanging zone of D1, D2, and D3 decreased, and the displacement and deformation in the central-span position of D4, D5, and D6 increased as a whole. The displacement distribution in the displacement cloud diagram was stable in the subsequent CS.
The maximum values of displacements occurring at each CS are recorded in Table 2. Their variations can be seen in Figure 13a.
The maximum displacement value of 110.76 mm occurred at CS27, where the deflection tolerance value is L/250, and the short span is 53,664 mm, so the displacement value of the frame in this area during construction meets the requirement. In order to ensure the accuracy of structure forming, it is appropriate to set up the reverse arch according to the deflection value of constant load here. The data can be divided into three main stages based on the trend in displacement changes.
The displacement values from CS1 to CS20 are relatively stable, with an extreme difference of 6.13 mm. The displacement maximum point is located at monitoring point B or the symmetry point of B. This is mainly due to the sizeable overhanging span and the self-weight of the structure’s frame bars at that point. The stage is named the displacement stabilization stage.
From CS21 to CS26, the temporary support frame of the DB portion and the lifter of the D9 subsection were dismantled at CS21. This caused a displacement maximum of 89.18 mm at the symmetry point of point G in the DA zone. The stage is named the displacement fluctuation stage.
From CS27 to CS32, the temporary support frames of the D1, D2, and D3 overhanging areas were unloaded at CS27. Therefore, the maximum displacement value of the monitoring point rises to 110.76 mm, which is the maximum value during the construction process. With the continuous forming and unloading of the structure, the maximum displacement value was stabilized at about 106 mm and continued until the final forming of the structure. This stage is named the peak displacement stage.
Figure 13b shows the changes in displacement at the monitoring points throughout the construction process. The displacement values at monitoring points B, C, G, and their symmetry points are high. B, G, and their symmetry points can reach the maximum displacement value.
Combined with Figure 13a,b, unlike stresses, the displacement values of the structure are an accumulating process during construction. The structural displacement values after forming tend to be at a high level. This is determined by the stress characteristics of the structure and the cumulative effect during the construction process.

4.4. Construction Sequencing Impact Analysis

The one-step and stage-by-stage analysis methods have unique applications and advantages in engineering construction design. This study compares and analyses the simulation results of the two methods on the structure’s stress state and displacement and deformation, using the actual project as a case study.

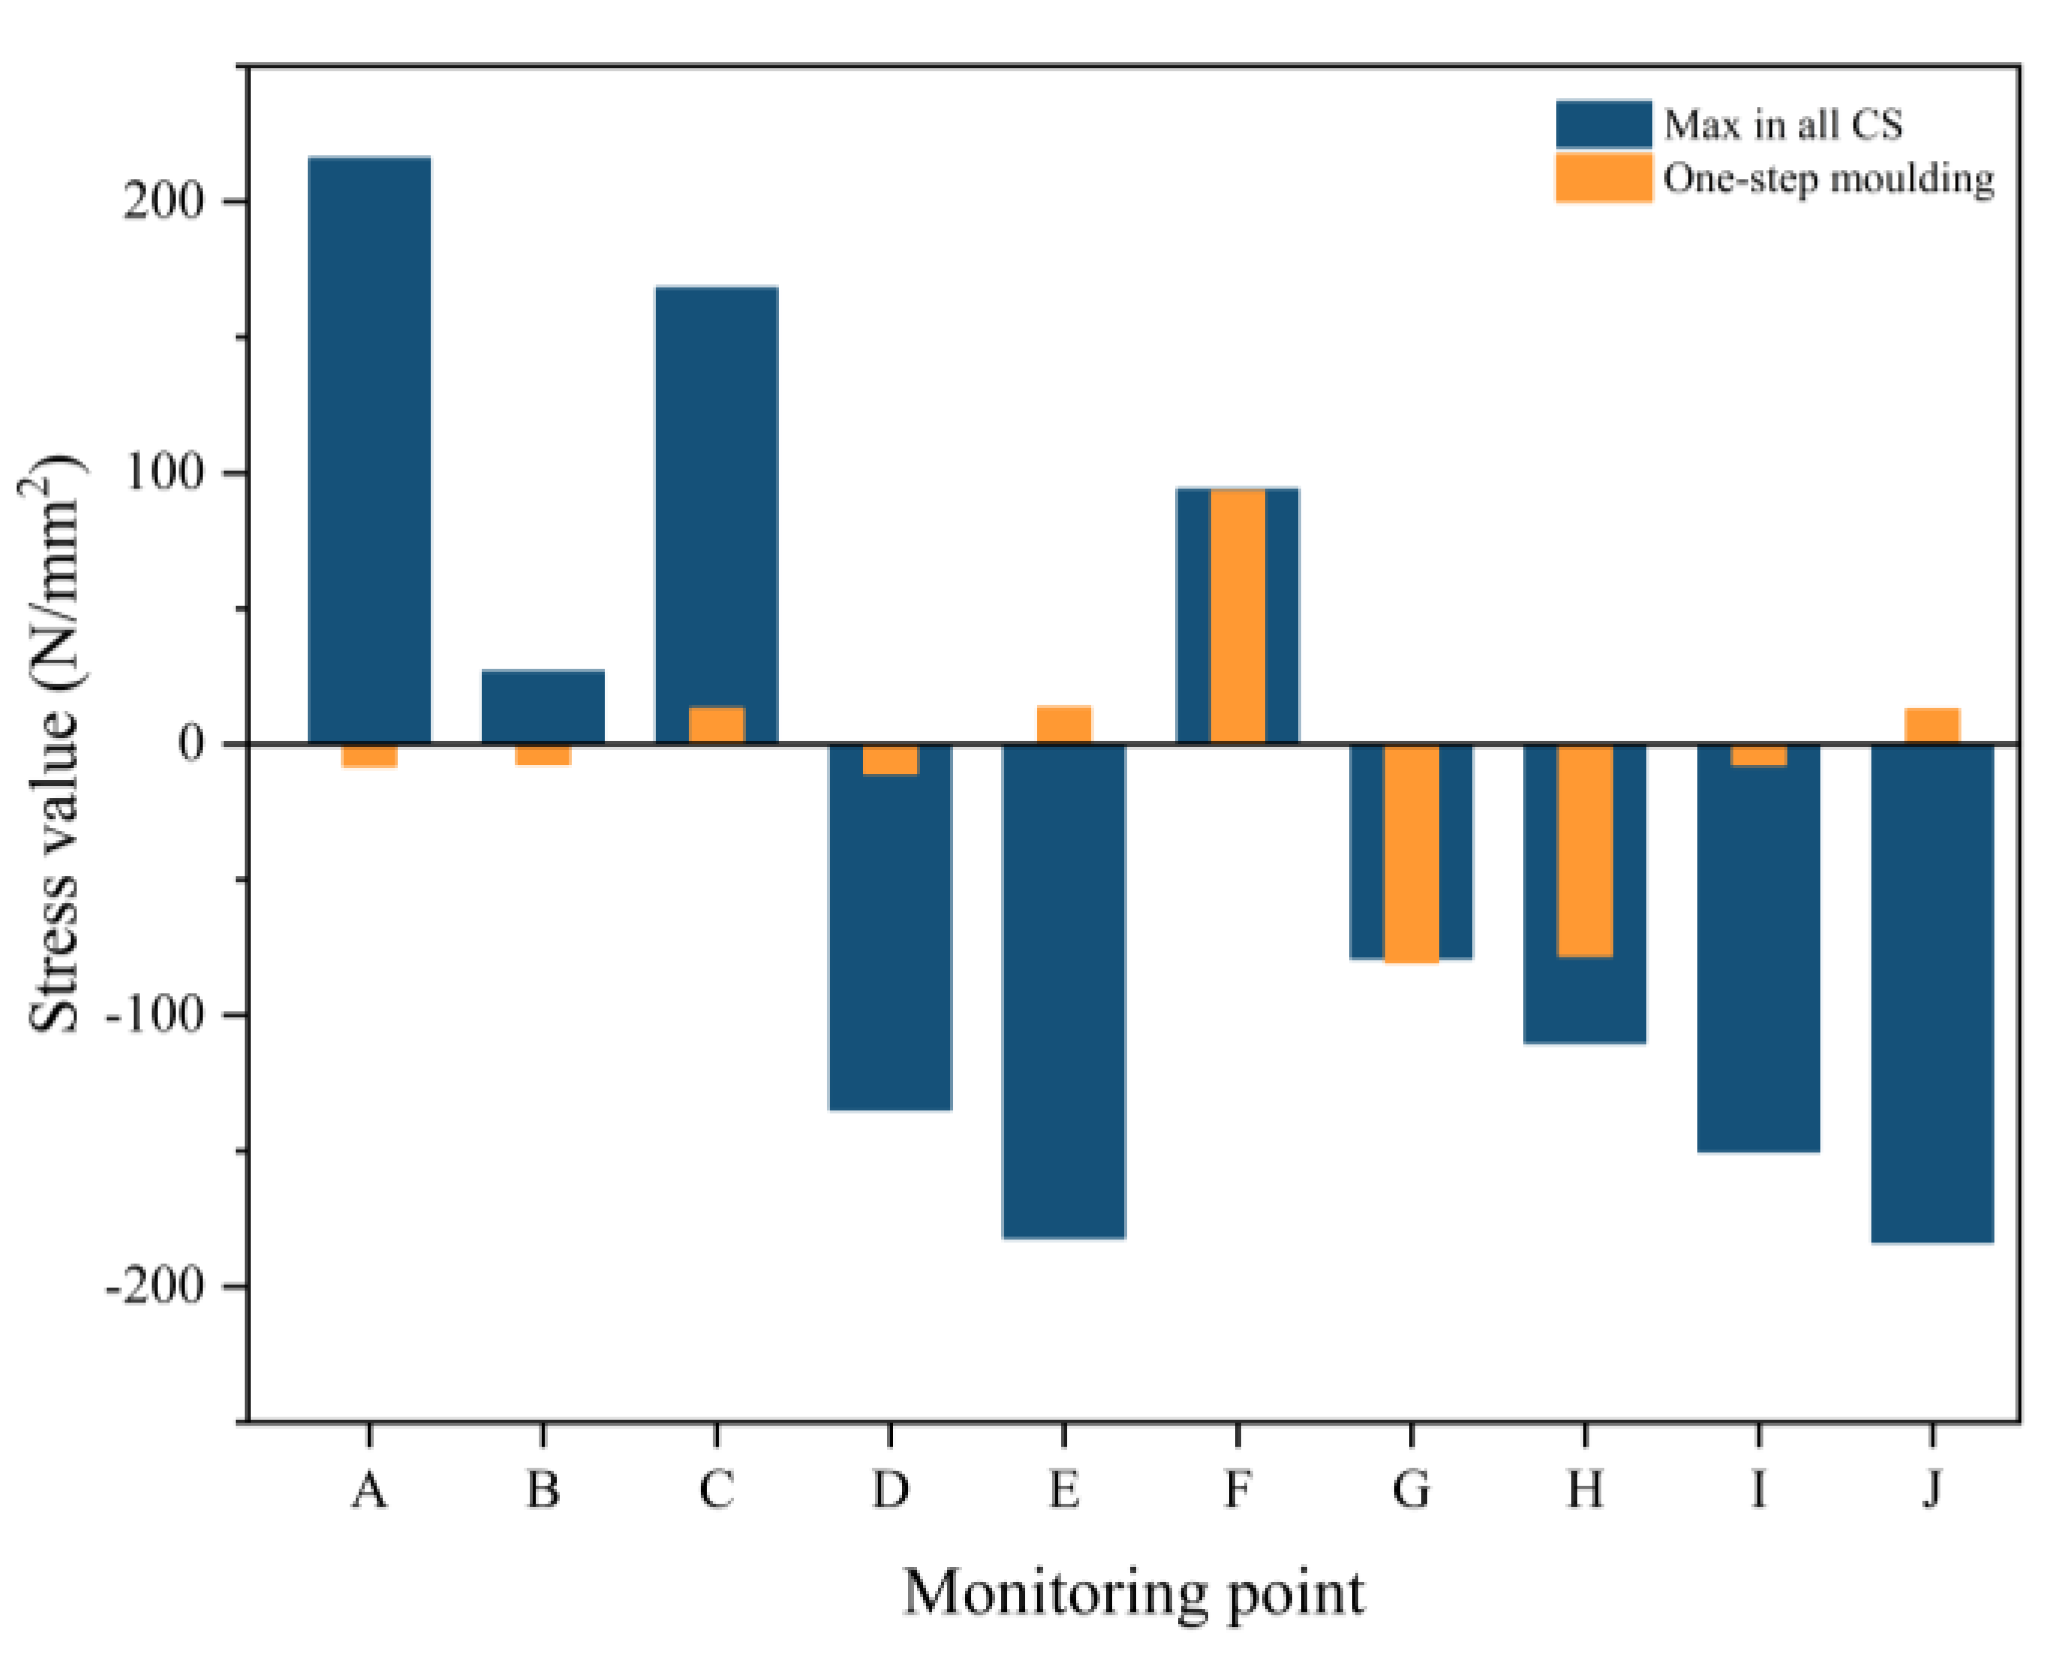
4.4.1. Stress Analysis

Stress is a physical quantity that describes the force applied to a unit area within a material, and it can reflect the internal mechanical behavior and state of a structure when subjected to external forces. The stress values after one-step forming and the maximum values in the stage-by-stage forming were recorded at the critical monitoring points. The results are shown in Figure 14.
As shown in Figure 14, the stresses in one-step and stage-by-stage forming are significantly different at most of the monitoring points. Often, a particular stage in the construction process will show higher absolute values of stress than in the forming condition. Only monitoring points F and G better match the stress values in stage-by-stage and one-step forming. In contrast, at the rest of the monitoring points, the difference between the stress values obtained by the two methods is too significant. In particular, the absolute stress value obtained by the two methods at monitoring point A is 208.21 N/mm2, and the stress states is one of tension and the other of compression.

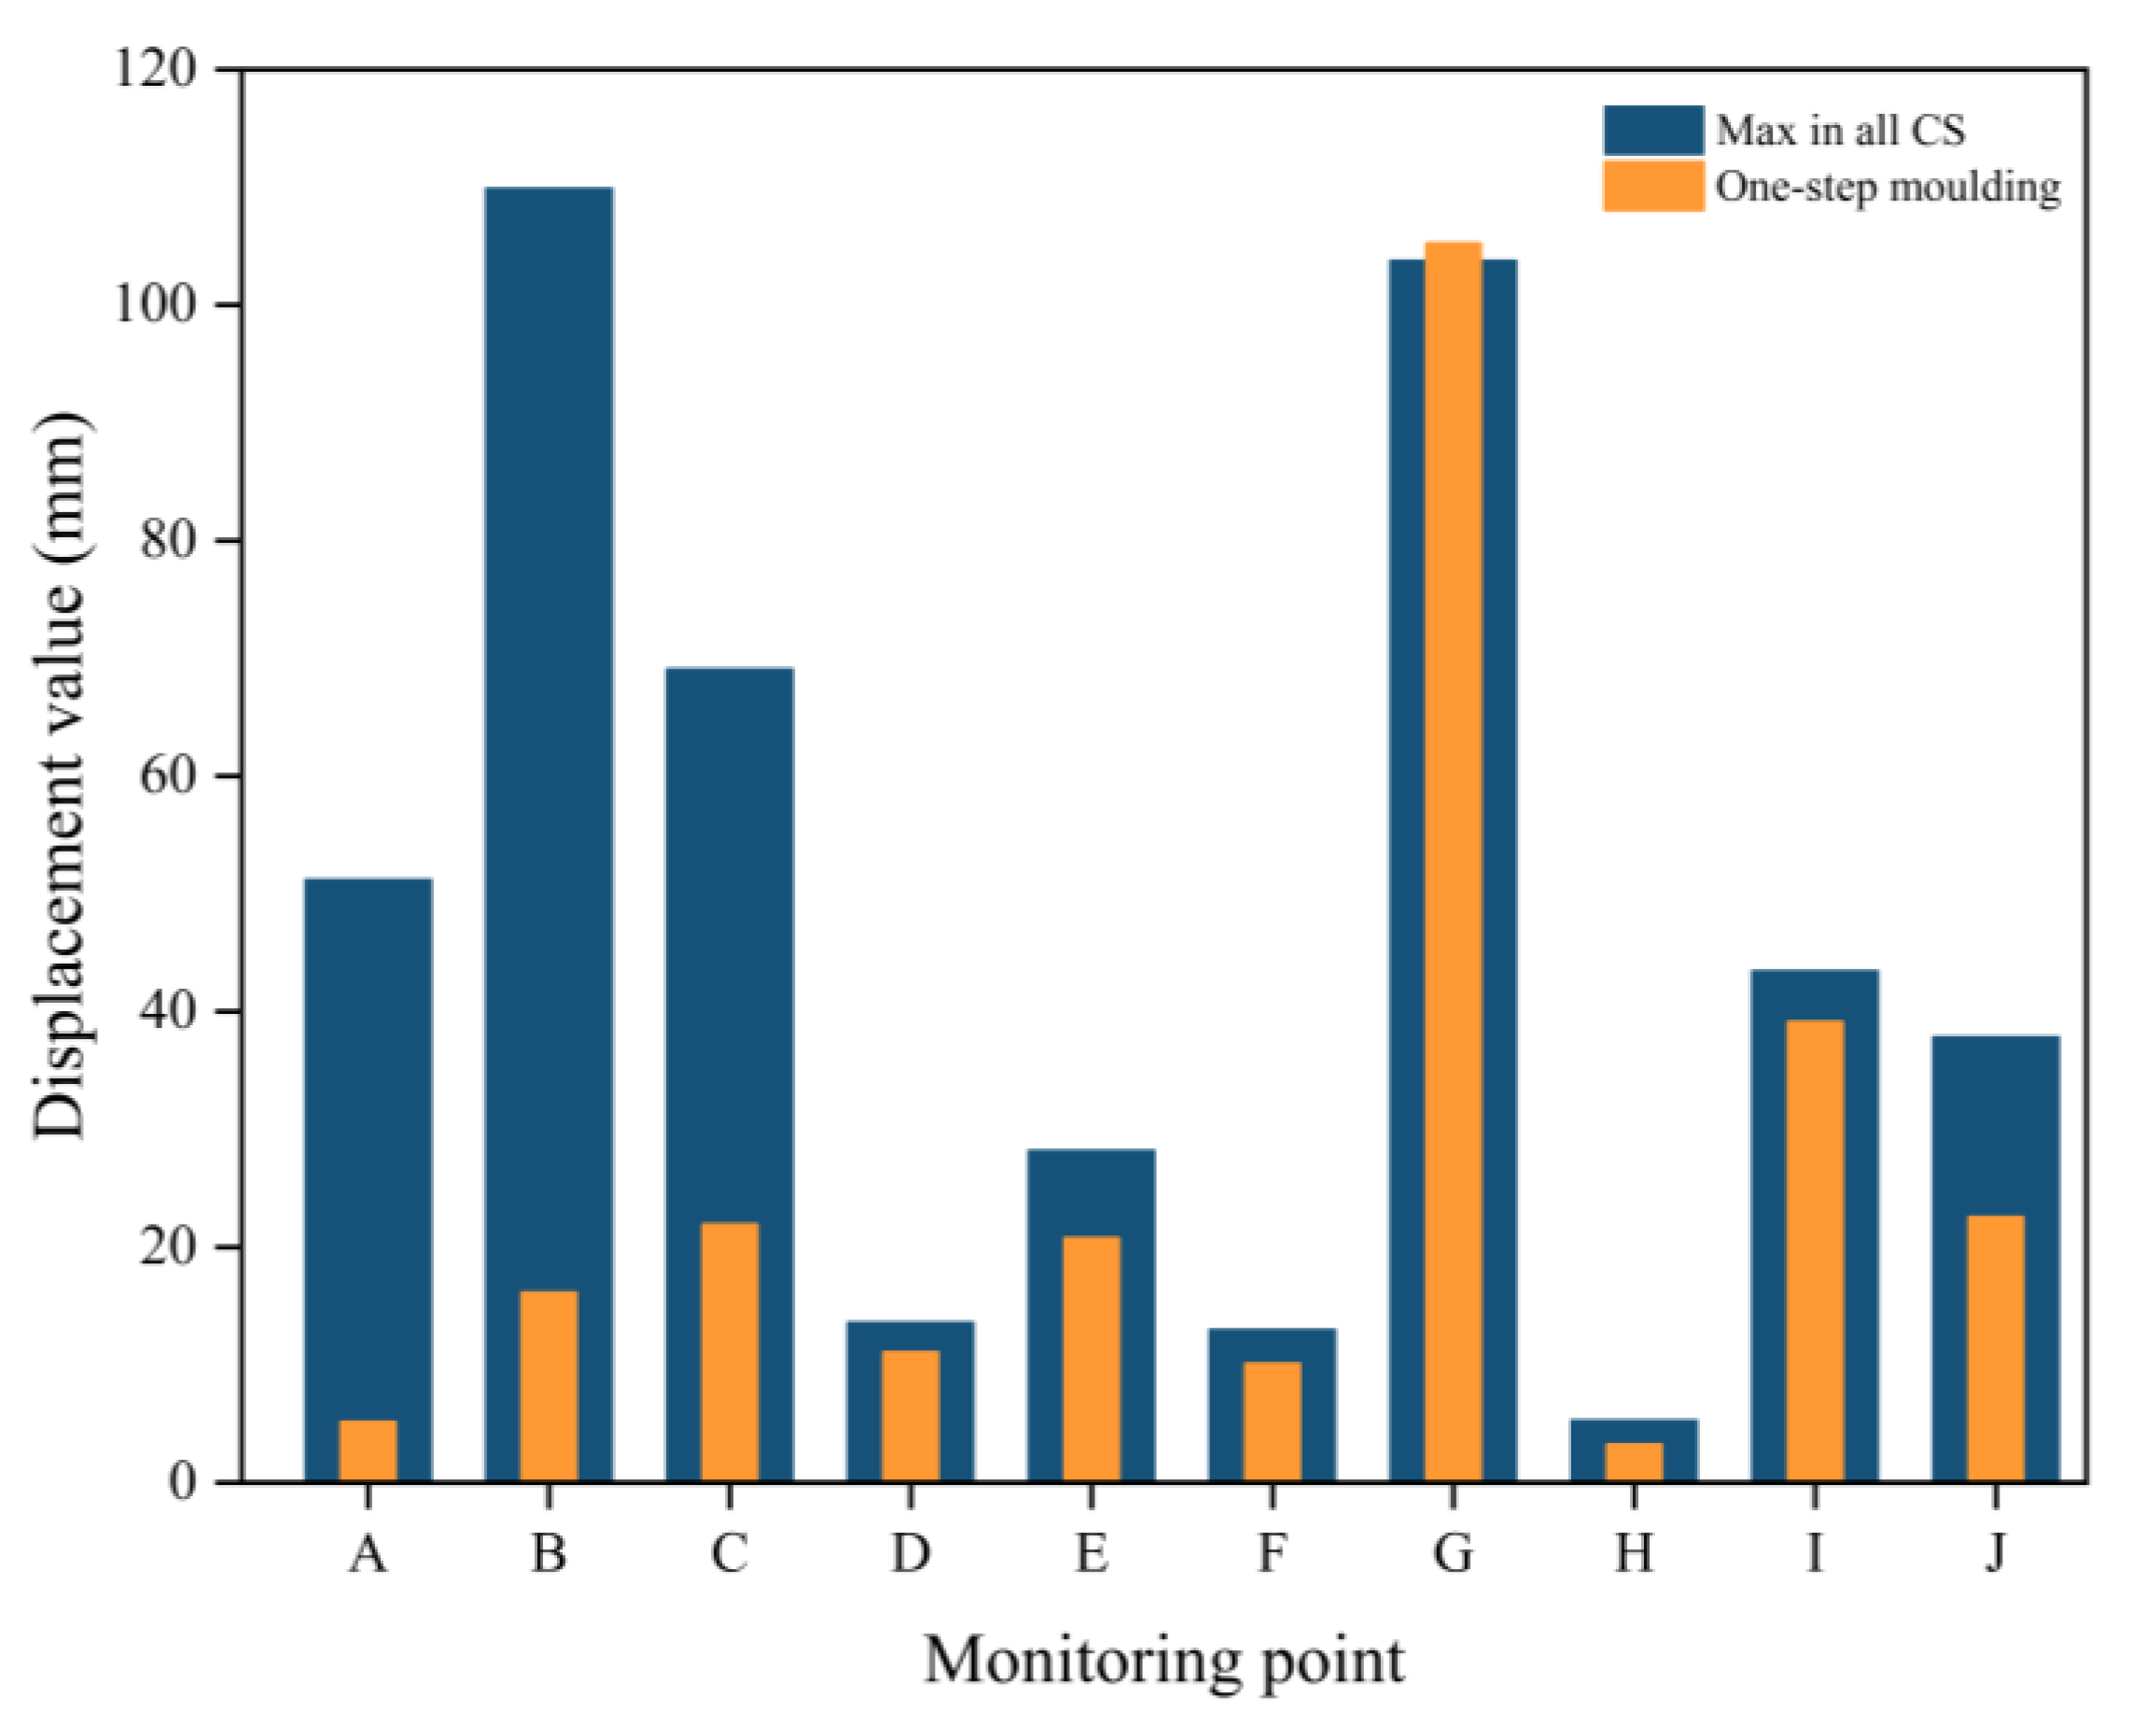
4.4.2. Displacement Analysis

Displacement is the change in shape or position of a structure after a force has been applied. By measuring and analyzing a structure’s displacement response, the structure’s overall stability and possible structural damage can be assessed. The values of displacement deflections after one-step forming and the maximum values of displacement deflections in stage-by-stage forming were recorded at the critical monitoring points. The results are shown in Figure 15.
As shown in Figure 15, the values of displacement deformation obtained by the two methods also exhibit significant differences. Most of the maximum values of displacement occurring during the construction process are higher than the one-step forming displacement values. The phenomenon is more evident at monitoring points A, B, and C, where the difference between the displacement values obtained by the two methods reaches 93.75 mm at monitoring point B. The displacement value of the one-step forming method at monitoring point G is slightly higher than the maximum displacement value during construction by 1.44 mm, which may be due to the influence of the forming sequence on the structural displacement change. The displacement and deformation values obtained by the two methods are relatively consistent with those of the rest of the monitoring points. However, the displacement and deformation values obtained by the one-step forming method are generally low and cannot reflect the dangerous state of the structure.
Significant differences exist between one-step and stage-by-stage forming analysis methods in simulating stress states and displacement deformations while constructing long-span spatial steel structures. Although the one-step forming method can quickly give a prediction after forming, it ignores the dynamic factors during the construction process, such as structural forming and boundary condition changes. On the other hand, the stage-by-stage forming method can ultimately show the structural state after each critical CS, which helps to find and solve the problems in time to ensure construction safety. Therefore, when carrying out the construction of long-span spatial steel structures, the path and time effects caused by the construction sequence should be fully considered. The correct simulation method should be adopted to obtain reliable intermediate and final state simulation results, which can accurately predict the deformation and optimize the construction process.

5. Conclusions

This study uses the engineering background of the T1 terminal building of Chengdu Tianfu International Airport in China. It uses FEA software to analyze the mechanical properties of long-span spatial steel structures in the whole process of construction that explicitly reflects the construction sequence. Comparative analyses were conducted of the one-step and stage-by-stage forming methods for long-span spatial steel structures. The conclusions are as follows.
  • The initial installation and unloading process of the long-span spatial steel structure’s subsection is the turning point where the stress state and displacement changes often occur. During the construction process, the stress concentration phenomenon mainly occurs in the position of the temporary support frame, and the displacement maximum value is in the position of the structure’s outer overhang. Construction technicians should carry out targeted monitoring of the stress state and displacement deformation of the structure, which can quickly identify potential safety hazards.
  • In the process of structural forming, the stress changes through the initial stress stage, stress adjustment stage, stress accelerated adjustment stage, and stress stabilization stage, showing a tendency to develop from high stress to low stress. The maximum tensile stress decreases from +215.53 N/mm2 to +111.97 N/mm2, and the maximum compressive stress decreases from −158.65 N/mm2 to −101.88 N/mm2. While the overall displacement is an accumulative process, the displacement change passes through the stages of displacement stabilization, fluctuation, and peak displacement. Compared with the initial displacement value of 70.86 mm for CS1, the maximum displacement value of the structure after forming reached 106.52 mm. For areas of stress concentration, construction workers should focus on monitoring. At peak displacements, counter-arches should be set up based on the displacement values.
  • The one-step forming analysis method can quickly provide the structure’s stress state and displacement and deformation after forming. The stage-by-stage forming analysis method provides a detailed picture of the structural stresses and displacement deformations after each critical CS. During the construction process, most structures’ peak stresses and displacements occur at certain stages. Therefore, it is necessary for construction technicians to perform CS analyses that reflect the construction sequence.
  • The construction of a long-span spatial steel structure is a complex and continuous gradual process of the structural system. Due to the mutual coupling of structural geometric nonlinearity, time-varying physical properties, and boundary condition changes, different construction sequences will lead to different stress and deformation paths in the construction process. The construction path effect leads to different final mechanical states of the same structure under different construction paths.
  • Future research could explore different types of long-span structures, such as steel skywalks, steel truss bridges, and hybrid structural systems. Additionally, studying new construction techniques like modular construction, high-strength steel, or composite materials may further optimize construction efficiency and structural performance. By expanding the scope of research to include various structural forms and innovative construction methods, we hope to advance the safe and efficient construction of long-span spatial steel structures.

Author Contributions

Conceptualization, G.Y. and Y.Y.; methodology, G.Y. and Y.Y.; software, R.L. and Y.Z; validation, R.L.; formal analysis, R.L.; writing—original draft preparation, R.L., X.C. and Y.Z.; writing—review and editing, R.L. and Y.Y.; visualization, X.C. and C.Z.; supervision, T.L. and Y.Y.; funding acquisition, G.Y. and Y.Y; data curation, C.Z. and T.L. All authors have read and agreed to the published version of the manuscript.

Funding

This research was funded by Integration and Application of Smart Factory Technology for Prefabricated Buildings (CSTB2022TIAD-KPX0145) and the Chongqing Urban Rail Express Line Full Life Cycle CIM Technology Application Research and Demonstration Research Project (S20220413).

Data Availability Statement

The data presented in this study are available on request from the corresponding author.

Conflicts of Interest

Authors Canwei Zhou and Ting Lei were employed by the company Chongqing Railway Group. The remaining authors declare that the research was conducted in the absence of any commercial or financial relationships that could be construed as a potential conflict of interest.

References

  1. Zucca, M.; Tattoni, S.; Di Castri, M.; Simoncelli, M. On the collapse of a post-tensioned reinforced concrete truss bridge during the construction phases. Eng. Fail. Anal. 2024, 158, 107999. [Google Scholar] [CrossRef]
  2. Pei, H.; Jia, L.; Li, J.; Li, K.; Xia, R. A Study of the Mechanical Behavior of a Steel-Concrete Hybrid Beam Bridge during Construction. Buildings 2023, 13, 1781. [Google Scholar] [CrossRef]
  3. Chen, H.; Yin, S.; Qiao, C.; He, J.; Hu, M. Construction Effects on the Mechanical States of a Truss Structure. J. Perform. Constr. Facil. 2022, 36, 1152. [Google Scholar] [CrossRef]
  4. Ding, L.; Sun, Y.-J.; Zhang, W.-Z.; Bi, G.; Xu, H.-Z. Stress Monitoring of Segment Structure during the Construction of the Small-Diameter Shield Tunnel. Sensors 2023, 23, 8023. [Google Scholar] [CrossRef] [PubMed]
  5. Yao, G.; Chen, Y.; Yang, Y.; Ma, X.; Men, W. Investigation on Buckling Performance of Prefabricated Light Steel Frame Materials under the Action of Random Defects during Construction. Materials 2023, 16, 5666. [Google Scholar] [CrossRef] [PubMed]
  6. Fan, Y.; Xin, J.; Yang, L.; Zhou, J.; Luo, C.; Zhou, Y.; Zhang, H. Optimization Method for the Length of the Outsourcing Concrete Working Plane on the Main Arch Rib of a Rigid-Frame Arch Bridge Based on the NSGA-II Algorithm. Structures 2024, 59, 105767. [Google Scholar] [CrossRef]
  7. Yao, H.; She, J.; Zhou, Y. Risk assessment of construction safety accidents based on association rule mining and Bayesian network. J. Intell. Constr. 2024. [Google Scholar] [CrossRef]
  8. Yao, G.; Wu, C.; Yang, Y. Scientometric Analysis for Mechanical Performance of Broken-Line Long-Span Steel Structure in Construction Considering Geometric Nonlinearity. Symmetry 2021, 13, 1229. [Google Scholar] [CrossRef]
  9. Hu, J.; Chen, W.; Ren, S.; Zhang, S.; Qu, Y.; Yin, Y.; Yang, D. Building performance monitoring and analysis of a large-span aerogel-membrane airport terminal. Eng. Struct. 2020, 219, 110837. [Google Scholar] [CrossRef]
  10. Deng, D.; Zou, J.; Cai, J.; Chen, Z.; Wang, H. Non-contact measurement method of displacement of spherical joints in long-span space steel structures. Structures 2024, 61, 106089. [Google Scholar] [CrossRef]
  11. Guo, S.; Xu, D.; Shang, K.; Yang, S.; Wang, D.; Li, G.; Zheng, B.; Jiao, Y. Analysis of progressive collapse of a super-long span latticed steel arch structure. J. Theor. Appl. Mech. 2023, 61, 103–117. [Google Scholar] [CrossRef] [PubMed]
  12. Fu, Y.; Dong, F.; Wang, J. Wind Resistance Performance Assessment of Long-Span Cable-Supported Bridges Based on Time-Varying Reliability Theory. Sustainability 2024, 16, 923. [Google Scholar] [CrossRef]
  13. Fu, R.-C.; Wang, H.-N.; Jiang, M.-J. Exact analytical solution for deep tunnels in viscoelastic-plastic rock considering the actual loading path. Appl. Math. Model. 2024, 128, 370–391. [Google Scholar] [CrossRef]
  14. He, Z.; Lu, Y.; Liu, F.; Pan, F.; He, S. An estimate on in-construction differential settlement of super high-rise frame core-tube buildings. Struct. Des. Tall Spec. Build. 2020, 29, e1737. [Google Scholar] [CrossRef]
  15. Hu, Y.; Lei, H.; Zheng, G.; Shi, L.; Zhang, T.; Shen, Z.; Jia, R. Ground movement induced by triple stacked tunneling with different construction sequences. J. Rock Mech. Geotech. Eng. 2022, 14, 1433–1446. [Google Scholar] [CrossRef]
  16. Ling, C.; Ruan, Y.; Wu, P.; Li, J.; Zhao, J.; Yuan, B. Influence of Different Excavation Sequence of Double-Side Heading Method on Supporting Structure. Adv. Civ. Eng. 2022, 2022, 2258594. [Google Scholar] [CrossRef]
  17. Yang, S.-S.; Zhang, D.-W.; Wang, M.; Xu, J.-M.; Shen, C.; Zhang, C.-Z. Ground settlement caused by pipe-roof pre-construction method: Effect of the sequence of jacking pipe groups. J. Cent. South Univ. 2024, 31, 576–588. [Google Scholar] [CrossRef]
  18. Liu, C.; Zhang, F.; Zhang, H.; Shi, Z.; Zhu, H. Optimization of assembly sequence of building components based on simulated annealing genetic algorithm. Alex. Eng. J. 2023, 62, 257–268. [Google Scholar] [CrossRef]
  19. Soomro, M.A.; Mangi, N.; Xiong, H.; Kumar, M.; Mangnejo, D.A. Centrifuge and numerical modelling of stress transfer mechanisms and settlement of pile group due to twin stacked tunnelling with different construction sequences. Comput. Geotech. 2020, 121, 103449. [Google Scholar] [CrossRef]
  20. Yao, G.; Sun, W.; Yang, Y. Analysis and Identification of Building Construction Accident Risk in China basing Exclusively Database. IOP Conf. Ser. Earth Environ. Sci. 2022, 1101, 072009. [Google Scholar] [CrossRef]
  21. Waqar, A.; Othman, I.; Radu, D.; Ali, Z.; Almujibah, H.; Hadzima-Nyarko, M.; Khan, M.B. Modeling the Relation between Building Information Modeling and the Success of Construction Projects: A Structural-Equation-Modeling Approach. Appl. Sci. 2023, 13, 9018. [Google Scholar] [CrossRef]
  22. Mudiyanselage, S.T.; Wijesundara, K.; Venkatesan, S.; De Silva, S.; Dissanayake, R.; Neluwala, P. Significance of construction sequence and the initial behaviour in concrete-faced rockfill dams. Aust. J. Struct. Eng. 2024, 25, 125–143. [Google Scholar] [CrossRef]
  23. Jiao, Y.; Cao, P. Research on Optimization of Project Design Management Process Based on BIM. Buildings 2023, 13, 2139. [Google Scholar] [CrossRef]
  24. Mayouf, M.; Jones, J.; Elghaish, F.; Emam, H.; Ekanayake, E.M.A.C.; Ashayeri, I. Revolutionising the 4D BIM Process to Support Scheduling Requirements in Modular Construction. Sustainability 2024, 16, 476. [Google Scholar] [CrossRef]
  25. Yilmaz, G.; Akcamete, A.; Demirors, O. BIM-CAREM: Assessing the BIM capabilities of design, construction and facilities management processes in the construction industry. Comput. Ind. 2023, 147, 103861. [Google Scholar] [CrossRef]
  26. Tang, Q.; Xin, J.; Jiang, Y.; Zhang, H.; Zhou, J. Dynamic Response Recovery of Damaged Structures Using Residual Learning Enhanced Fully Convolutional Network. Int. J. Struct. Stab. Dyn. 2024, 2550008. [Google Scholar] [CrossRef]
  27. Zheng, X.; Li, W. Finite element simulation analysis of steel truss arch bridge jacking construction. Civ. Eng. J.-Staveb. Obz. 2023, 32, 519–532. [Google Scholar] [CrossRef]
  28. Liu, J.; Meng, F.; Chen, Y.; Chen, Z. The influence of coupling on the whole process of construction simulation of chord dome structure. E3S Web Conf. 2020, 143, 01046. [Google Scholar] [CrossRef]
  29. Qin, S.; Wei, K.; Qin, J.; Yuan, R.; Xu, L.; Dan, Q. Stress-free-state based structural analysis and construction control theory for staged construction bridges. Adv. Bridge Eng. 2020, 1, 1. [Google Scholar] [CrossRef]
  30. Li, Q.; Guo, H.; Guo, B. The Dual-Parameter Control of Synchronization in Steel Box Girder Incremental Launching Construction. Appl. Sci. 2023, 13, 12074. [Google Scholar] [CrossRef]
  31. Xin, Y.; Li, J.; Hao, H.; Yang, N.; Li, C. Time-Varying System Identification of Precast Segmental Columns Subjected to Seismic Excitations. J. Bridge Eng. 2022, 27, 1–18. [Google Scholar] [CrossRef]
  32. Sun, M.; Li, Q.; Li, Y. Investigation of time-varying natural frequencies of high-rise buildings under harsh excitations using a high-resolution combined scheme. J. Build. Eng. 2022, 57, 104859. [Google Scholar] [CrossRef]
  33. Yang, L.; Wang, L.; Yu, B. Time-varying behavior and its coupling effects with environmental conditions and cementitious material types on surface chloride concentration of marine concrete. Constr. Build. Mater. 2021, 303, 124578. [Google Scholar] [CrossRef]
  34. Huang, J.; Tan, P.; Zhang, Y.; Zhou, F. Endurance time analysis of seismic performances of long-span continuous rigid-frame bridges with corrugated steel webs. Structures 2022, 43, 990–1001. [Google Scholar] [CrossRef]
  35. Yu, L.; Xu, W.; Zhang, D.-B.; Ma, X.-M.; Wu, Y.-H. Strain Incremental Adjustment Method of Cable Force of Composite Saddle Anchor Span of Single-Tower Single-Span Ground-Anchored Suspension Bridge. Math. Probl. Eng. 2021, 2021, 2956496. [Google Scholar] [CrossRef]
  36. Gou, H.; Pu, Q.; Wang, J.; Chen, Z.; Qin, S. Spatial mechanical behaviors of long-span V-shape rigid frame composite arch bridges. Struct. Eng. Mech. 2013, 47, 59–73. [Google Scholar] [CrossRef]
  37. Ruan, R.; Chen, Y.; Lin, W.; Wei, L.; Huang, J. The Construction Technology of Column Replacement Integral Accumulation Sliding at Uneven Elevation for Steel Structures. Buildings 2023, 13, 1958. [Google Scholar] [CrossRef]
  38. Pei, B.; Chong, A.; Xia, H.; Kang, X. Design and key construction technology of steel-concrete-steel sandwich composite pylon for a large span cable-stayed bridge. Sci. Rep. 2023, 13, 6626. [Google Scholar] [CrossRef]
  39. Wen, F.; Liang, X.; Chen, C.; Xu, L.; Feng, Q. Construction Control and Monitoring Platform of a Large-Segment Steel Box Girder with Hoisting Installation. Appl. Sci. 2023, 13, 9573. [Google Scholar] [CrossRef]
  40. Wang, Y. In A closed coal yard grid construction simulation. In Proceedings of the 3rd International Conference on Civil, Architectural and Hydraulic Engineering (ICCAHE), Hangzhou, China, 30–31 July 2014; pp. 1672–1675. [Google Scholar] [CrossRef]
  41. Yang, Q.; Yu, S.; Zhang, X.; Wang, Z.; Yan, J.; Chen, X. The Construction Technology of Roof Steel Structure in YanCheng NanYang Airport. Adv. Civ. Eng. 2018, 2018, 6386020. [Google Scholar] [CrossRef]
  42. Lu, C.; Yang, Z.; Li, P.; Xu, Q.; Chen, L.; Zhang, C. Integral sliding of a 800 T steel roof truss for a cultural and art center building. Case Stud. Constr. Mater. 2022, 17, e01345. [Google Scholar] [CrossRef]
  43. Yang, Y.; Du, H.; Yao, G.; Ma, X.; Men, W. Time-Varying Mechanical Analysis of Long-Span Spatial Steel Structures Integral Lifting in Construction Basing Building Information Model. Sustainability 2023, 15, 1256. [Google Scholar] [CrossRef]
  44. Ruan, R.; Lai, M.; Jiang, C.; Wang, J.; Lin, Y. Integral Lifting of Steel Structure Corridor between Two Super High-Rise Buildings under Wind Load. Buildings 2023, 13, 2441. [Google Scholar] [CrossRef]
  45. Shen, Y.; Lin, Z.; Wang, Z. Single-Side Accumulative Jacking Construction Method for Large-Span Arched Latticed Shells. J. Constr. Eng. Manag. 2022, 148, 06022001. [Google Scholar] [CrossRef]
  46. Huang, Y.; Yang, J.; Feng, R.; Chen, H. Resistance of cold-formed sorbite stainless steel circular tubes under uniaxial compression. Thin-Walled Struct. 2022, 179, 109739. [Google Scholar] [CrossRef]
  47. Akduman, S.; Karalar, M.; Mert, N.; Ozturk, H. Investigation of the Post-Fire Behavior of Different End-Plated Beam-Column Connections. Buildings 2024, 14, 1013. [Google Scholar] [CrossRef]
  48. GB 50017-2017; Standard for Design of Steel Structures. Chinese Ministry of Housing and Urban-Rural Development, China Architecture & Building Press: Beijing, China, 2017.
Figure 1. The analytical process of the node-corrected birth and death unit method. (a) Structural calculation model; (b) First construction stage. (c) Second construction stage. (d) Third construction stage. (e) Fourth construction stage.
Buildings 14 02389 g001
Figure 2. Common construction methods. (a) Overhead bulk installation method; (b) installation method in strips or blocks; (c) aerial skidding method; (d) overall hoisting method; (e) overall lifting method; (f) overall jacking method.
Buildings 14 02389 g002
Figure 3. Actual view of the project.
Buildings 14 02389 g003
Figure 4. Overview of the project.
Buildings 14 02389 g004
Figure 5. Analytical methodology framework.
Buildings 14 02389 g005
Figure 6. (a) Construction area division; (b) monitoring point arrangement.
Buildings 14 02389 g006
Figure 7. Key stages in the structure-forming process.
Buildings 14 02389 g007
Figure 8. (a) Stress cloud diagram after one-step forming; (b) stress values at each monitoring point.
Buildings 14 02389 g008
Figure 9. (a) Displacement cloud diagram after one-step forming; (b) displacement values at each monitoring point.
Buildings 14 02389 g009
Figure 10. Stress cloud diagram in key construction stages.
Buildings 14 02389 g010
Figure 11. (a) Variation of the maximum value of stress during the construction stages; (b) variation of the value of stress at the monitoring point.
Buildings 14 02389 g011
Figure 12. Displacement cloud diagram in key construction stages.
Buildings 14 02389 g012
Figure 13. (a) Variation of the maximum value of displacement during the construction stages; (b) variation of the value of displacement at the monitoring point.
Buildings 14 02389 g013
Figure 14. Comparison of maximum stress values at monitoring points obtained by the two methods.
Buildings 14 02389 g014
Figure 15. Comparison of maximum displacement values at monitoring points obtained by the two methods.
Buildings 14 02389 g015
Table 1. Maximum stresses in each construction stages.
Construction StageTensile Stress (N/mm2)Compressive Stress (N/mm2)Construction StageTensile Stress (N/mm2)Compressive Stress (N/mm2)
CS1+215.53−158.65CS17+173.37−181.97
CS2+215.53−158.65CS18+173.65−182.15
CS3+215.67−158.78CS19+173.65−182.15
CS4+215.67−158.78CS20+173.66−182.15
CS5+215.67−158.78CS21+175.70−182.18
CS6+215.67−158.78CS22+175.70−182.18
CS7+215.28−158.50CS23+175.71−182.21
CS8+216.18−159.27CS24+175.71−179.74
CS9+212.10−176.13CS25+175.71−179.27
CS10+212.10−176.13CS26+180.77−177.82
CS11+212.11−179.11CS27+115.38−154.87
CS12+211.95−181.95CS28+112.03−154.07
CS13+211.89−181.95CS29+112.03−166.54
CS14+211.89−181.95CS30+120.09−186.28
CS15+211.88−181.95CS31+111.99−101.48
CS16+173.24−181.97CS32+111.97−101.88
Table 2. Maximum displacement in each construction stage.
Construction StageDisplacement (mm)Construction StageDisplacement (mm)
CS170.86CS1768.72
CS271.23CS1868.74
CS374.43CS1968.74
CS474.43CS2068.72
CS574.83CS2189.18
CS674.83CS2289.18
CS774.83CS2389.18
CS874.83CS2489.19
CS974.84CS2589.19
CS1074.84CS2689.17
CS1174.75CS27110.76
CS1271.37CS28106.47
CS1371.38CS29106.47
CS1471.38CS30106.47
CS1571.07CS31106.48
CS1668.71CS32106.52
Disclaimer/Publisher’s Note: The statements, opinions and data contained in all publications are solely those of the individual author(s) and contributor(s) and not of MDPI and/or the editor(s). MDPI and/or the editor(s) disclaim responsibility for any injury to people or property resulting from any ideas, methods, instructions or products referred to in the content.

