Article

A Numerical Study of Reinforcement Structure in Shaft Construction Using Vertical Shaft Sinking Machine (VSM)

1
Guangzhou Municipal Engineering Group Co., Ltd., Guangzhou 510060, China
2
Guangzhou Municipal Construction Group Co., Ltd., Guangzhou 510060, China
3
Shanghai Tunnel Engineering Rail Transit Design and Research Institute, Shanghai 200235, China
4
School of Resources and Civil Engineering, Northeastern University, Shenyang 110819, China
*
Author to whom correspondence should be addressed.
Buildings 2024, 14(8), 2402; https://doi.org/10.3390/buildings14082402 (registering DOI)
Submission received: 4 July 2024 / Revised: 30 July 2024 / Accepted: 1 August 2024 / Published: 3 August 2024
(This article belongs to the Section Building Energy, Physics, Environment, and Systems)

Abstract

:
Using the Vertical Shaft Sinking Machine (VSM) for shaft construction is an emerging modern technology, which is also currently one of the most advanced techniques in the field of shaft sinking. Current research on VSM technology primarily focuses on mechanical and technical issues, neglecting the impact of the construction on the surrounding soil and the structure itself. This oversight leaves structural design lacking a reliable foundation. Additionally, there is insufficient information on the role of reinforcement design during construction in soft soils. These engineering challenges have hindered the widespread implementation of this new technology. Therefore, a series of numerical models were used to analyse the mechanical behaviour of shaft and soil during or after the sinking process, with the aim of addressing these gaps by investigating the influence of shafts constructed using VSM technology, and providing a scientific basis for reinforcement design in soft soil. The case study shows that increasing the soil-cement strength does not have a significant effect on the overall deformation of the soil surrounding the shaft, but leads to a notable reduction in the plastic zone volume, subsequently enhancing the overall stability of the neighbouring soil. The ring bottom beam design effectively reduces convergence deformation by about 50%, while also improving the horizontal internal force distribution near the cutting edge. However, this approach significantly escalates local vertical bending moments, necessitating thorough consideration in the design stage.

1. Introduction

The current parking problems in major cities around the world are primarily manifested in a huge gap in urban parking spaces, insufficient total quantity, prominent structural contradictions in urban parking facilitiess, and backward urban parking management. In order to meet the growing demand for parking lots, there is a need for more intensive land use, as well as more effective parking options and methods for utilising urban space. As a solution, the shaft sinking technology for building underground parking garages has the characteristics of low ground interference, low construction site area requirements, and minimal overall cost [1]. Therefore, the mechanized construction for rapid shaft sinking has gained increased attention [2,3].
For the construction of underground shafts, the general method involves on-site pouring of concrete to make the shaft wall, and uses excavators and grabbing machines for excavation and slag removal, and sinking is achieved by overcoming the friction between the shaft wall and the soil layer through the weight of the structure. This technology is suitable for various cross-sectional forms and is relatively mature. However, slow construction efficiency, poor stability, susceptibility to sudden sinking, stop sinking, etc., as well as a significant impact on the surrounding environment are among its shortcomings [4]. The pneumatic caisson method has a relatively high degree of mechanization, but it cannot fundamentally solve the problems of difficult sinking and slow sinking speed; especially when the cutting edge encounters isolated hard rocks, forcibly increasing the downward pressure can easily cause the attitude of the shaft to tilt and sink suddenly [5].
With advancements in engineering technology and increasing practical engineering demands, shaft sinking has been developing towards larger cross-sections and greater depths. The shortcomings of traditional self-sinking shafts have become increasingly evident, leading to a sharp decline in their use since the 1990s. They have been replaced by more rational methods such as the Space System (SS) caisson method [6], the press-in caisson method, and the Super Open Caisson System (SOCS) method [7]. In the SS method, the outer contour line of the cutting edge extends approximately 15–20 cm beyond the boundary of the shaft wall. This design creates a gap between the shaft’s outer wall and the surrounding soil during sinking. The space gravel is filled in the gap in order to reduce the peripheral face frictional resistance without compromising stability of the natural ground. Unlike the self-sinking method, a new shaft sinking method that utilises ground anchor reaction devices to press the shaft into the ground has emerged, known as the press-in caisson method [8]. This method requires the addition of a ground anchor reaction press-in device, and employs through-hole jacks to apply downward pressure on the top of the shaft at the surface, addressing the issues of difficult and slow sinking. Additionally, by adjusting the downward pressure at different positions, the shaft’s attitude can be adjusted and corrected, making it suitable for construction projects with stringent environmental control requirements. Based on the press-in method, a newer sinking technique is the Super Open Caisson System (SOCS), which was developed in Japan [9]. It uses an underwater excavator mounted on the inner shaft wall to dig the soil below the footing to the centre of the shaft, and then discharges the sludge by means of a grapple or a slurry pump, thus reducing the resistance to sinking of the cutting edge, and then the shaft is pressed into the ground by the ground anchor counter-force device. The SOCS method is well-suited for construction projects in urban areas with high-speed construction requirements and stringent environmental controls. Engineers have also improved the underwater excavator, developing a new type of excavator suitable for non-standard cross-section shafts, significantly broadening the application scope of the SOCS method.
Compared to these techniques, shaft sinking using the Vertical Shaft Sinking Machine (VSM) is a more advanced sinking method proposed using Herrenknecht AG in Germany [10,11]. The excavation machinery is has become intelligent and digitised, featuring a cutting drum to efficiently slice through the soil [12,13]. The crushed soil is then mixed with water and pumped out, thereby enhancing the overall excavation process. The shaft wall is prefabricated by concrete lining segments, and over excavation is carried out around the wall, and the gap is filled with bentonite slurry to reduce resistance. A lowering unit is used to control the wall movement, which prevents sudden sinking of the shaft. The VSM method incorporates the shield tunnelling lining construction technique to create a new type of prefabricated shaft wall [14]. Regarding friction reduction, both the VSM and SS methods are similar, employing the injection of bentonite slurry around the exterior of the shaft wall to reduce resistance [15]. The key distinction between the VSM method and traditional sinking methods lies in the sinking process: with the VSM method, the shaft wall is supported by a sinking unit, preventing it from sinking during underwater excavation. This enables precise and active control of the sinking process by adjusting the suspension force. The method has the advantages such as deep excavation depth, small construction disturbance, fast construction speed, minimal site usage, high economic benefits, and broad geological applicability. Combining the characteristics of prefabricated construction, intelligent construction, and environmentally friendly construction processes, the market is developing rapidly. At present, this method has been used in many countries and regions for practical engineering applications, and has achieved favourable outcomes [12,16,17,18]. Some cases are shown in Table 1. Although there are many cases of using VSM technology to construct starting shafts or ventilation shafts, the successful construction of a parking garage in Nanjing, China, and the engineering case presented in this article fully demonstrate the feasibility of this technology in parking garage construction.
In recent years, based on the design concepts, system composition, and functional configuration of VSM, several companies, particularly Chinese enterprises, have undertaken modifications and upgrades to the VSM and optimised the related construction methods [19]. China Railway Construction Heavy Industry Corporation (CRCHI) developed three different product series of VSM based on excavation diameter, with the largest being the 23-meter level which was employed in the studied project in 2023. Additionally, China Railway Engineering Equipment Group (CREG) developed the dry mucking shaft sinking machine, CJM. in contract, CITIC Heavy Industries has developed the multi-arm shaft sinking machine, JSB [20,21]. The difference between the CJM and the aforementioned equipment lies in the utilisation of a free-profile cutting head, enabling excavation to be prformed in both dry and underwater situations, and a mechanical grab for muck disposal, while the JSB uses a toothed roller cutter combined with a rotating and revolving cutting head for excavation, with a muck disposal method similar to that used by the VSM. In addition, Shanghai Tunnel Engineering Co., Ltd. in Shanghai, China developed the APM, which features a more flexible cutting arm, and the shaft wall is made to sink by actively pressing down. These advancements reflect the ongoing research and development in VSM technology. Neye et al. [3] described the role of VSM in mechanical shaft sinking technology and presented the associated equipment components and their performance. Schmäh et al. [22,23] described different projects that have been constructed using the VSM method, demonstrating the potential applications of VSM and highlighting the different requirements that should be met by the VSM technique. Rahimi et al. [24] highlighted geotechnical considerations when VSM is combined with conventional drilling and blasting methods for excavation. Zhou et al. [17] took the Zhuyuan Bailonggang Sewerage Project in Shanghai as an example; through a comparative analysis of on-site measurements and numerical simulations, it was concluded that the maximum ground settlement caused by the VSM was 15.2 mm, and the maximum horizontal displacement was 3.74 mm. The influence of the shaft excavation on the ground settlement was about 30 m from the centre of the shaft.
Previous research on vertical shafts has mainly favoured theory, numerical analysis, monitoring or experiments regarding the general method [25,26,27,28,29,30,31,32,33]. However, there are currently few systematic presentations of new shaft technology based on actual projects [16]. Although there are a number of practical cases of shaft sinking using VSM, there is still a lack of research on the mechanical responses it induces and the effectiveness of the support structures, and even fewer studies on the detailed simulation based on this technique for large-diameter shaft sinking in soft ground. Similarly to conventional methods in terms of load-bearing, the VSM method determines its specific load-bearing characteristics and structural response as shown in Table 2.
This paper will take an underground parking garage project in Shanghai as a case study, and introduce the application of the VSM technology and some types of support structures adopted in this project for large-diameter shaft sinking in soft ground. In addition, the changes in ground deformation and mechanical responses induced by excavation are computed, and the analysis will provide references and suggestions for future similar projects.

2. The Application of VSM and Structural Design in the Case Study

This section will briefly introduce the composition of equipment and construction process with VSM, focusing on the specific execution process in the underground parking garage project in Shanghai, as well as the structural design for reinforcement for the shaft construction, including the concrete ring foundation, strata reinforcement, ring bottom beam and anti-float piles in the water-rich soft soil.

2.1. Project Overview

The shaft being constructed in Shanghai features a large diameter and incorporates VSM technology. The project comprises two shafts, with the first one already completed as of July 2023. Each shaft measures 23.02 m in diameter, with a final excavation depth of approximately 50.5 m and a base plate depth of 44 m. The underground space spans 836 m2, accommodating a 19-layer parking garage with a total of 304 parking spaces.
The shaft wall traverses various strata, including miscellaneous fill soil (2.7 m thick), clayey silt (3.3 m), muddy clay (10.2 m), silty clay (26.3 m), silty clay interspersed with sandy silt (6.6 m), and a 7.5 m interlayer between silty clay and clayey silt. Predominantly, the area beneath the shaft bottom consists of silt and fine sand, indicating that all excavated soil layers were soft.

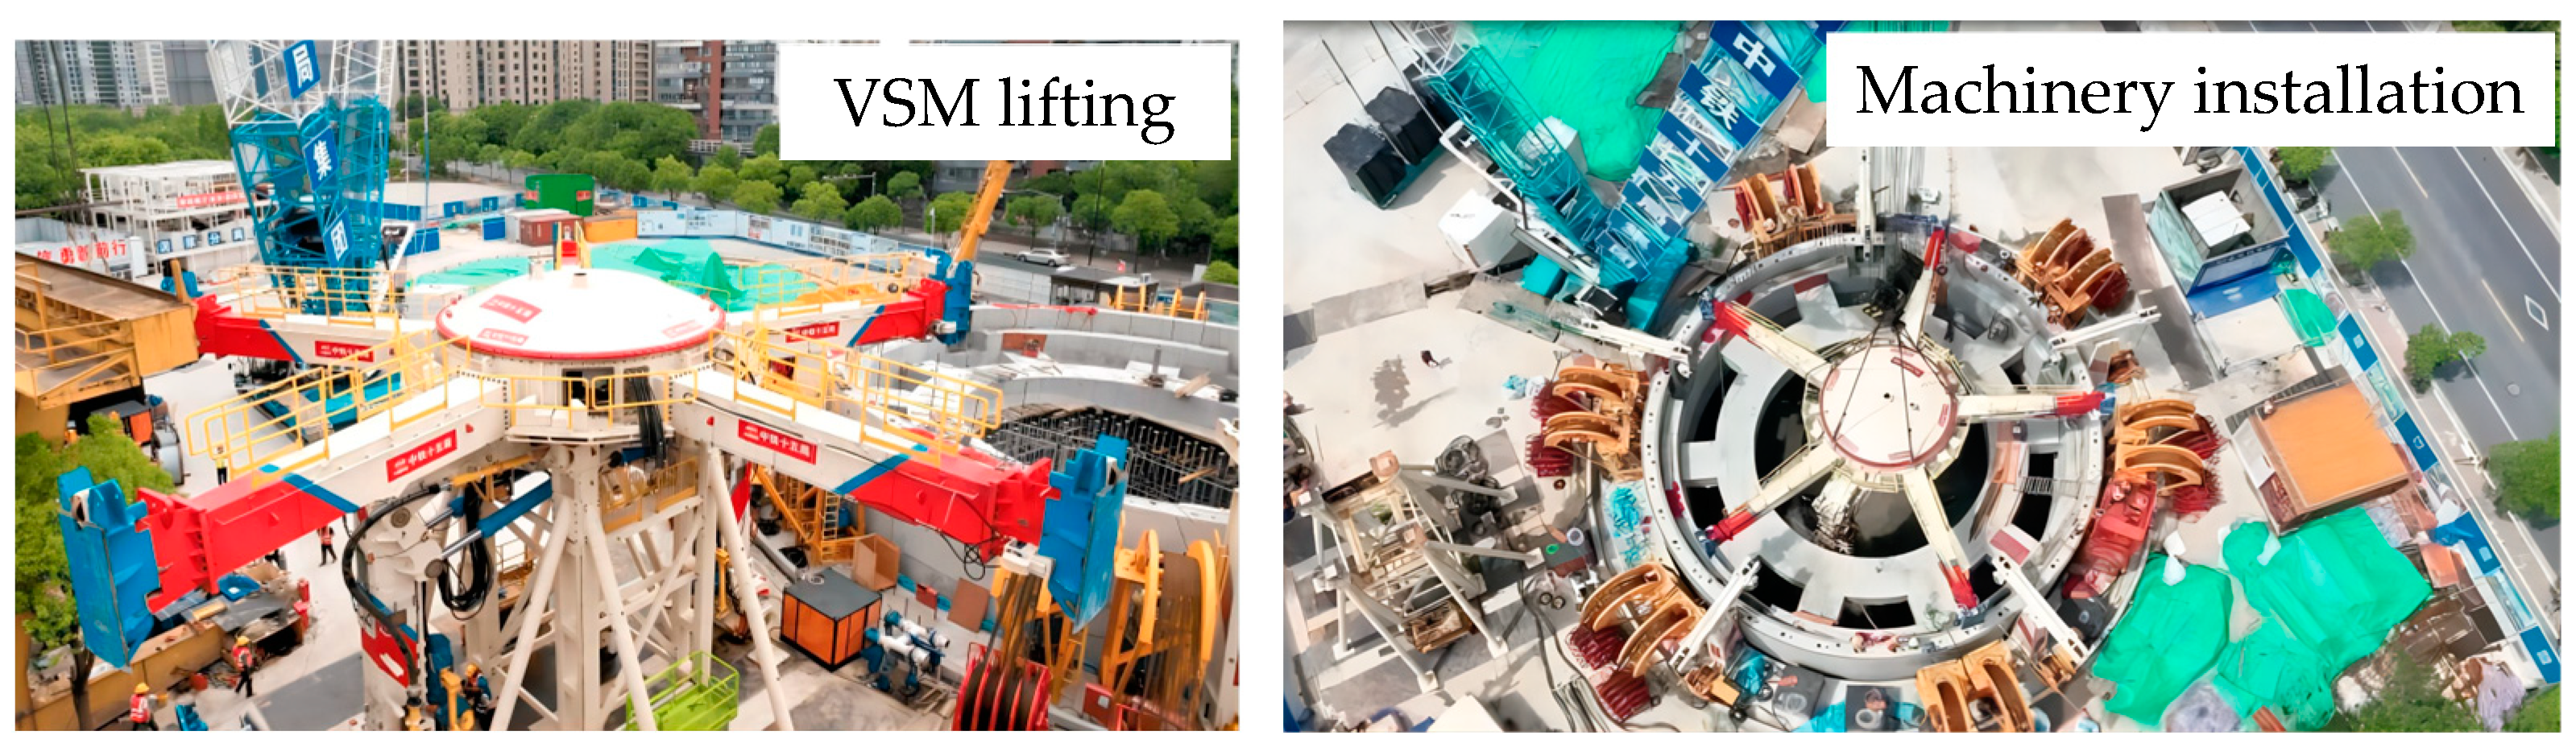
2.2. Components of VSM

The VSM system comprises several key units: the cutting unit, the lifting unit, the lowering unit, and the separation unit. Figure 1 illustrates the setup for the case study. Excavation is executed through a cutting drum mounted on the telescopic arm of the main machine, which mills and breaks the soil. If necessary, over-excavation can also be carried out. This method is ideally suited for soft soil or soft rock environments, but it is important to consider increased tool consumption depending on the soil’s compressive strength and abrasiveness [23].
The VSM used in this case, developed by CRCHI, has an overall height of approximately 10 m and can excavate vertical shafts with a diameter ranging 18 m to 23 m. The maximum excavation depth can reach up to 60 m, with an excavation rate of up to 4 m/d. The main machine has a power output of 2400 kW. It is suitable for soft soil and soft rock strata (with a compressive strength of less than 80 MPa) and can adapt to a variety of complex geological conditions with different working modes, making it effective for both dry and high-water-pressure conditions. Due to its large diameter, it is equipped with two cutting arms operating simultaneously, which enhances construction efficiency compared to traditional methods. The cutting process can be conducted underwater, eliminating the need to lower the water table. This approach facilitates balancing internal and external water pressure, ensures structural stability, controls soil deformation and is environmentally friendly.
For this project, the system employs five lifting units located directly above five support arms to raise and lower the mainframe. Additionally, twelve lowering units are used to suspend the shaft structure, and the overall setup includes two winch towers, as depicted in Figure 1.

2.3. Structural Design for Reinforcement

Given the large excavation diameter of the vertical shaft and the soft strata, reinforcement measures are crucial to manage soil and structural deformation, thereby bolstering safety and structural integrity throughout construction.
  • Concrete ring foundation
The project’s foundation has been meticulously devised to withstand heavy machinery and various stresses encountered while sinking shafts. To significantly increase the bearing capacity of the delicate soil, a hybrid foundation approach has been implemented (Figure 2). A concrete ring foundation, poured from the surface down to 3 m depth, offers a robust base for the core components of the VSM, ensuring the precise descent of the shaft. Before erecting the ring foundation, triple-axis mixing piles reinforce the soil beneath it. This reinforcement mitigates uneven settlement risks during construction and elevates the soil’s load-bearing capacity. The range of soil reinforcement extends is 3 m radially and has a depth of 21.5 m.
2.
Shaft wall and ring bottom beam
Due to the soft strata and extensive excavation diameter, the shaft wall segments in this project feature a relatively thick design, determined as 800 mm through engineering analogies and design calculations considering the construction loads and various actions. Given the lengthy circumference, each ring consists of 10 concrete segments, each 2 m in height and weighing 27.4 tons. Using precision-processed steel cutting edges, these segments are assembled into rings, filled with self-compacting concrete, and then stacked vertically up to 4.5 m from the opening. The uppermost section of 4.5 m employs a cast-in-place shaft wall. To mitigate resistance and facilitate sinking, the gap between the shaft wall and soil layer is filled with bentonite slurry.
To enhance the rigidity of the shaft wall near the bottom, a reinforced ring bottom beam is incorporated, as depicted in Figure 2a. Within the three prefabricated rings, an 80 cm thick reinforced concrete sidewall was poured, and the central ring beam is linked to this sidewall via connecting pillars. The core benefits of this design are reducing the thickness of the base concrete, providing structural reinforcement to the lower shaft wall (exposed to increased soil pressure), reducing wall deformation, and enhancing the stability of the connection between the plain concrete for bottom sealing and the shaft wall.
3.
Piles
The comprehensive anti-float design comprises three key components: the shaft wall, the top ring foundation, and the pile foundation. At the base of the ring foundation and surrounding the vertical shaft, 20 piles with a 1.2 m diameter, approximately 70 m length, and with 3.9 m spacing are strategically arranged, as depicted in Figure 2b. The pile tops are securely embedded within the top concrete foundation, with a embedment depth of 1.5 m. These piles serve the roles in bearing a portion of the vertical load, resisting lateral soil pressures and counteracting buoyancy forces. Once the shaft is sealed and water is pumped out, the structural self-weight helps mitigate buoyancy, while the remaining buoyancy will be counteracted through the combined action of the top ring foundation, the shaft wall and the piles.

3. Methods

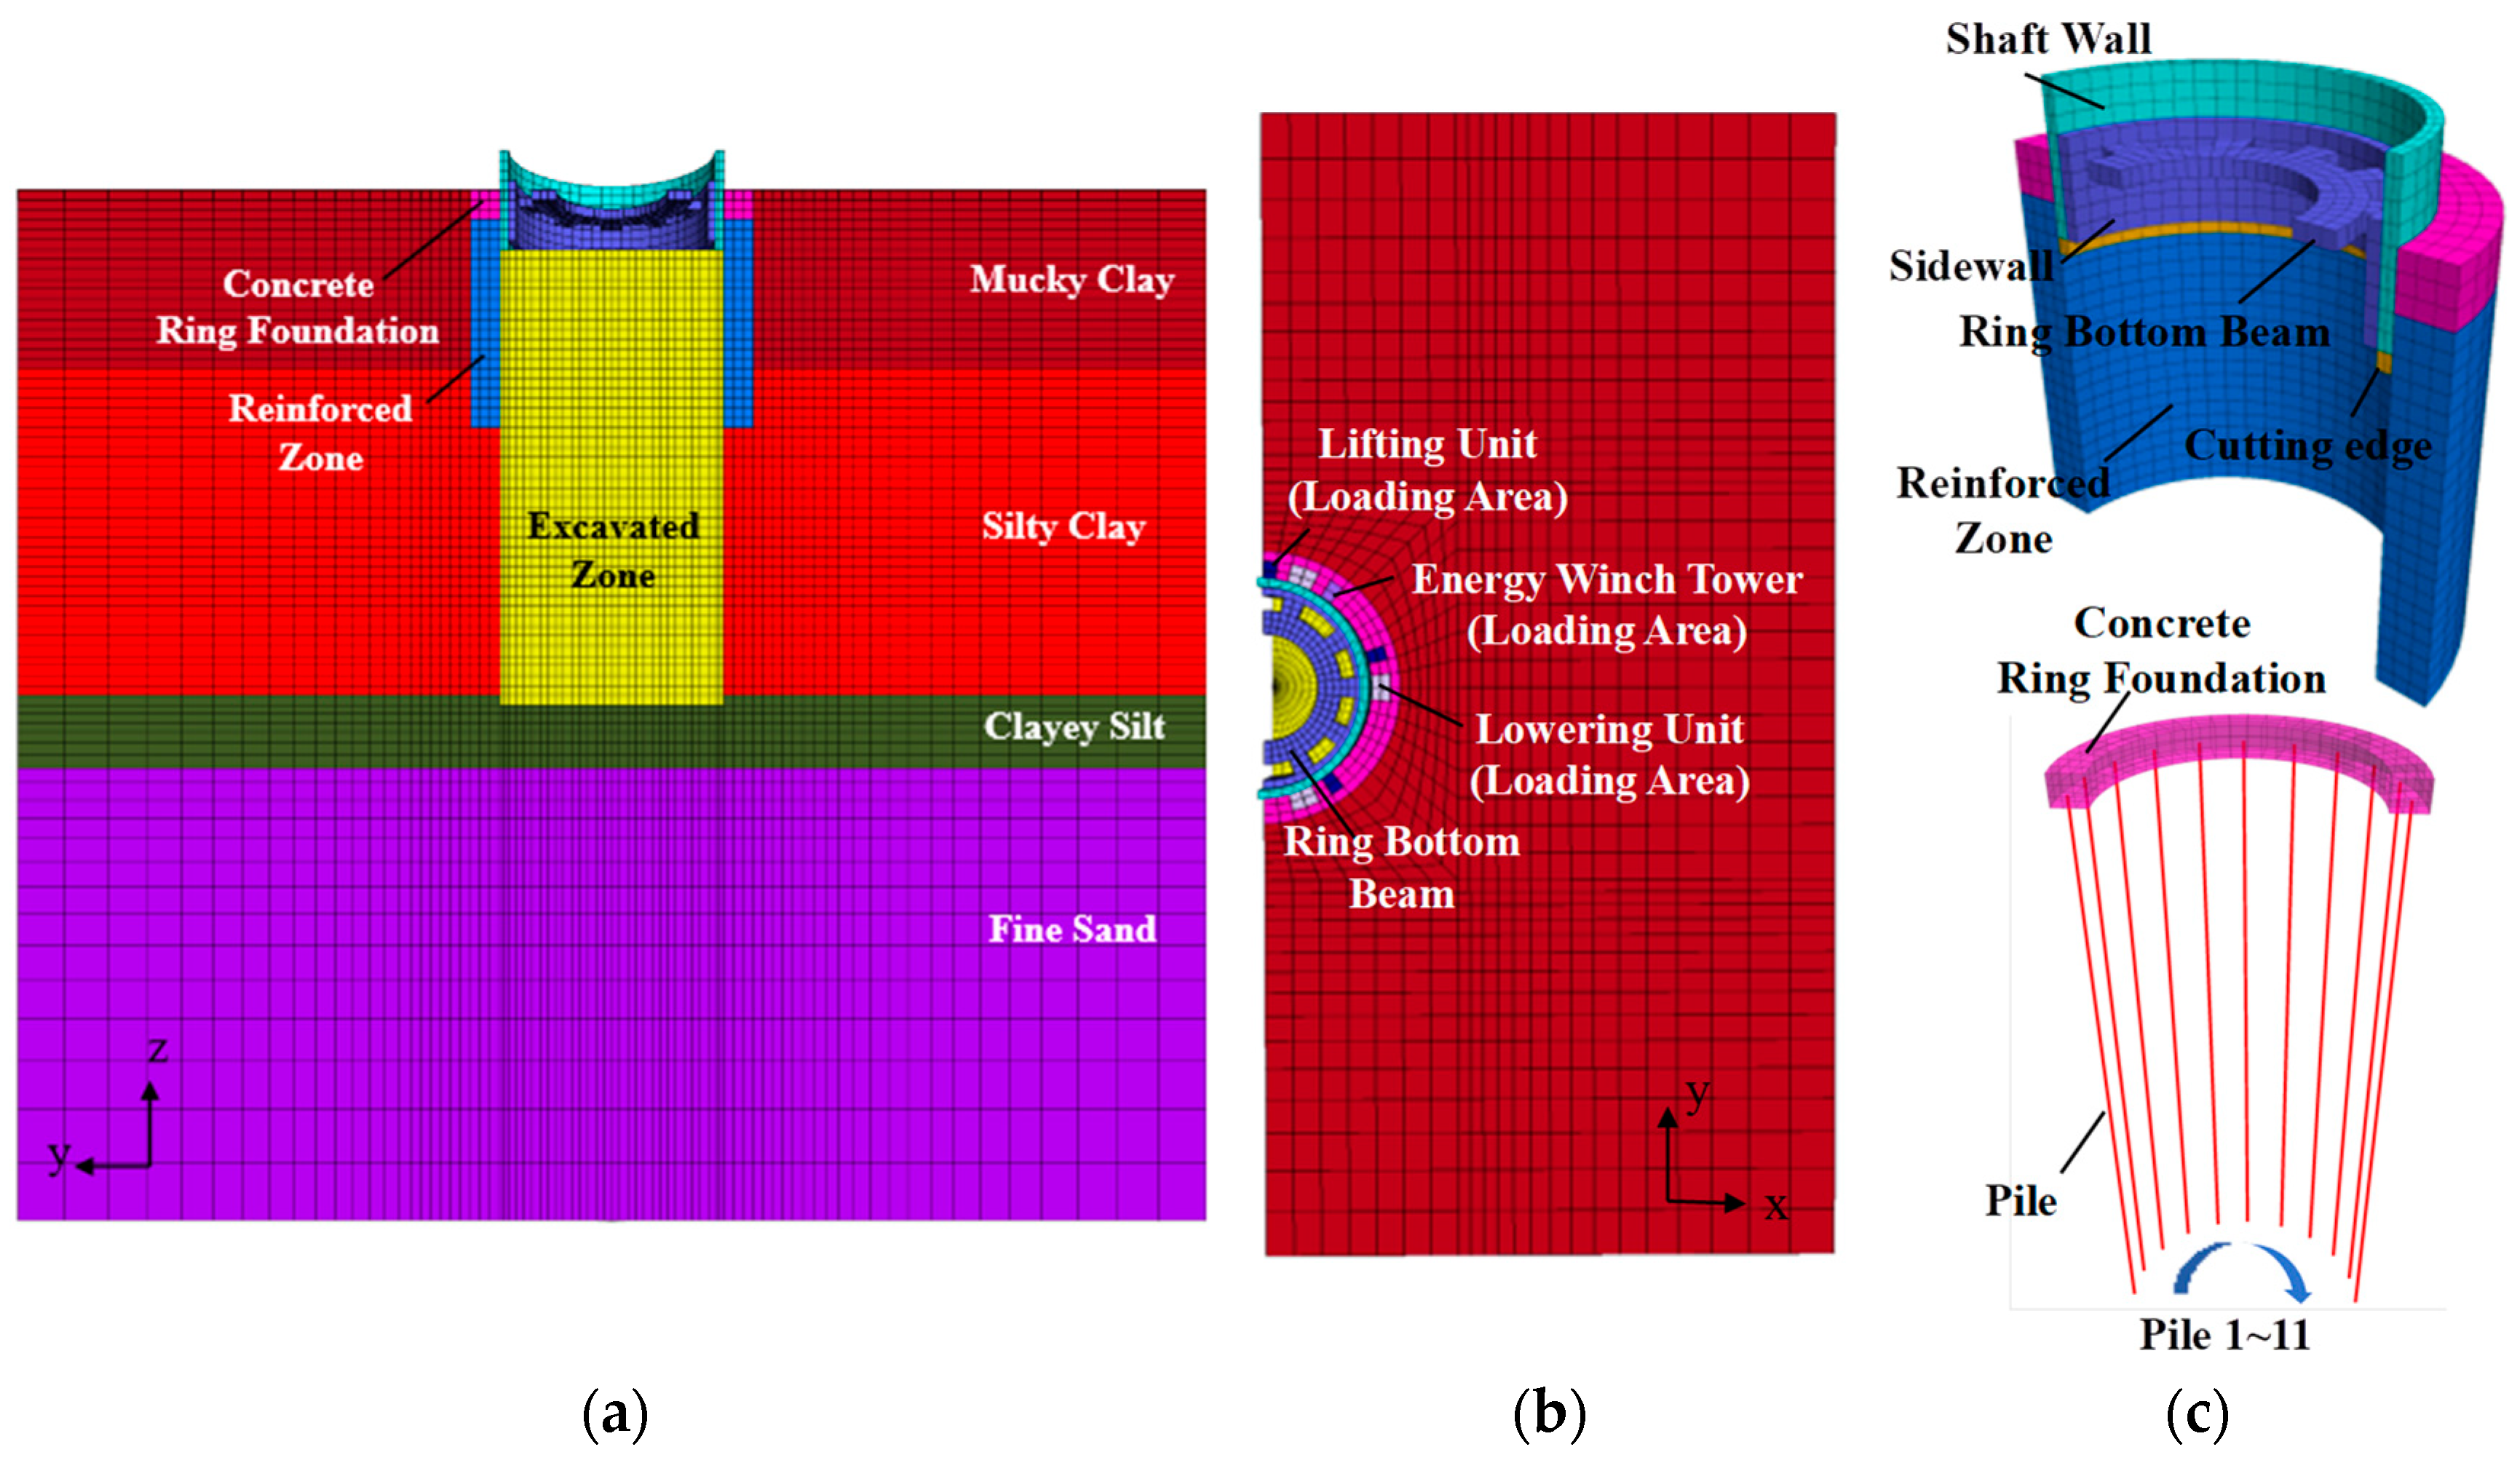
3.1. Model Development

Numerical modelling is conducted considering the geological conditions, incorporating the model geometry with the specific construction characteristics and structural attributes. For this purpose, the Lagrangian finite difference software FLAC3D 6.0 is employed to conduct the numerical analysis.
To minimize boundary effects, the model width is set at 120 m, approximately six times the inner radius of the shaft. Given the shaft’s structural features and pile arrangement, a symmetric model is adopted for simulation. The domain height is 104 m, twice the final sinking depth, as depicted in Figure 3a,b.
The shaft’s total sinking depth is 51 m, with an inner wall diameter of Φ21 m. Each concrete ring is 2 m high and 0.8 m thick. The ring foundation measures 22.6 m in inner diameter, 3 m in width, and 3 m in height. The lower zone reinforced by triple-axial mixing piles maintains the same thickness as the ring foundation, extending 14 m in height. Both the ring foundation and the reinforced zone are impermeable.
The ground surface elevation is set at 0 m, while the excavated zone’s bottom is positioned at −52 m. The piles, with a diameter of 1.2 m, are located between depths of −2 m and −70 m. In this model, 11 piles are arranged, spaced 3.7 m apart, with the pile centre positioned 1.6 m away from the shaft wall’s outer edge. To simplify the complexity of the naturally curved excavation surface, it is modelled as a plane in this study. Furthermore, throughout the sinking process, the vertical distance between the bottom surface and the cutting edge remains fixed at 1 m.
Before commencing the sinking process, the initial support structure comprises a 1 m tall cutting edge, a 9 m high shaft wall, and a ring bottom beam (Figure 3c). A sidewall 1 m thick and 6 m high and five pillars connect the ring bottom beam to the shaft wall, with the sidewall’s bottom aligned with the top of the cutting edge. The initial support structure and excavation face commence at an elevation of −6 m, marking the beginning of the first step in a total of 24 sequential excavation phases. These steps gradually lower both structures until they jointly reach the final depth of −51 m. Each sinking cycle involves a depth of 2 m, necessitating the installation of a new concrete ring atop the shaft wall to maintain a minimum of 2 rings (4 m) above the ground surface. Once the shaft wall reaches its final depth, it aligns with the ground surface. The thickness of the plain concrete for sealing the bottom is 8 m, and the final depth is 52 m.

3.2. Mesh and Boundary Conditions

The model is composed of 111,688 solid hexahedral elements. The elements near the excavation area and the shaft wall are relatively dense, with length, width and height of about 1 m. The mesh size increases at a rate of 1.1 times outside this area. Piles are simulated using structural elements, with each pile comprising 34 elements. The modelling of structural elements is not restricted by the specific position of the solid elements, which allows for easy group pile analysis. The interaction between the pile and the solid elements is achieved through coupled springs. These coupled springs are nonlinear and slidable connectors that can transfer forces and moments between the pile nodes and the solid elements. The tangential springs function similarly to the friction mechanism of grouted anchors. The normal springs are used to simulate the effect of normal loads, and the formation of gaps between the pile nodes and the solid elements can be simulated, as well as the squeezing effect of the surrounding soil on the piles.
A fixed boundary condition is imposed at the bottom, and horizontal displacements are constrained for all four vertical boundaries. Since the shaft wall remains in a suspended state throughout the construction process by means of wire rope traction, the sinking of the shaft wall is precisely controlled by regulating the cutting edge’s velocity, with a cycle sinking depth of 2 m.

3.3. Soil–Structure Interaction

In practice, a 10 cm gap between the shaft wall and the soil is filled with bentonite or cement slurry to adjust the frictional resistance accordingly. In this model, an interface element is utilised to simulate the lubrication effect between the shaft wall and the surrounding soil. The constitutive model is defined by a linear Coulomb shear-strength criterion that limits the shear force acting at an interface node. By default, pore pressure is used in the interface effective stress calculation. Normal forces are calculated through the nodes and distributed on the target surface, while shear forces on the opposite surface are connected to the nodes. These forces are distributed to the nodes of each surface through weighted averaging. The nodal stress is assumed to be uniformly distributed over the representative area. Each node is associated with contact surface parameters. The interface stiffness and shear strength are initially set to low values, which allows for the simulation of force transmission and sliding effects.
The normal and shear stiffness of the interface are set to 4.1 MPa and 2.1 MPa, respectively. The cohesion is 2 kPa, and the internal friction angle is 5°.

3.4. Structural Parameters

  • Concrete structures
The load applied to the top ring foundation is determined by subtracting the buoyancy of the entire structure from the combined gravity of the equipment units, the main machine, the shaft wall, and the ring bottom beam. This load is then uniformly distributed across the corresponding load areas shown in Figure 3b.
After calculations, the results indicate that the stress imposed on the load area of the lifting unit is 28.3 kPa. The load area of the lowering unit experiences a load of 552 kPa, with an incremental increase by 48.7 kPa for each sinking step. Additionally, the load area of the power winch tower bears a load of 178 kPa.
Steel sheet piles surround the outer edge of the ring foundation, standing at a height of 12 m and modelled using shell elements. Considering the presence of water in the shaft, a normal gradient pressure related to the elevation is applied vertically on the inner surface of the shaft wall. Similarly, normal pressure is applied to the surface of the ring support beam and the excavation face.
The reinforced zone is modelled using the Mohr–Coulomb model, a widely recognized elastic-plastic model for simulating soil behaviour. The soil strata in the simulation primarily comprise 18 m of mucky soil, followed by 33 m of silty clay, and 8 m of clayey silt, culminating in a fine sand layer at the bottom. To accurately represent the structural components, the shaft wall, ring foundation, and ring support beam are simulated with the elastic model, while the pile foundation is modelled using a combination of structural and pile elements. The selected key parameters for these components are given in Table 3, based on previous studies [34,35]. A noteworthy aspect is the consideration of buoyant density of the concrete located below the water table. This buoyant density is calculated by subtracting the density of water (1000 kg/m3) from the density of concrete, effectively accounting for the buoyancy effect in the simulation.
The parameters of the pile elements are derived from a circular section with a diameter of 1.2 m, and the normal stiffness is calculated according to the following equation [36]:
k n = K + 4 G / 3 z m i n
where Δzmin [m] is the minimum width of the element in the vicinity of the pile.
The shear stiffness ks [kPa/m] is taken as follows:
k s = 1000 × ( 21.8 + 0.438 σ n )
where σ n [kPa] is the normal stress from the surrounding soil layer. The cohesion and the friction angle of the pile–soil interface are taken as 0.8 times that of the surrounding soil.
2.
Soils
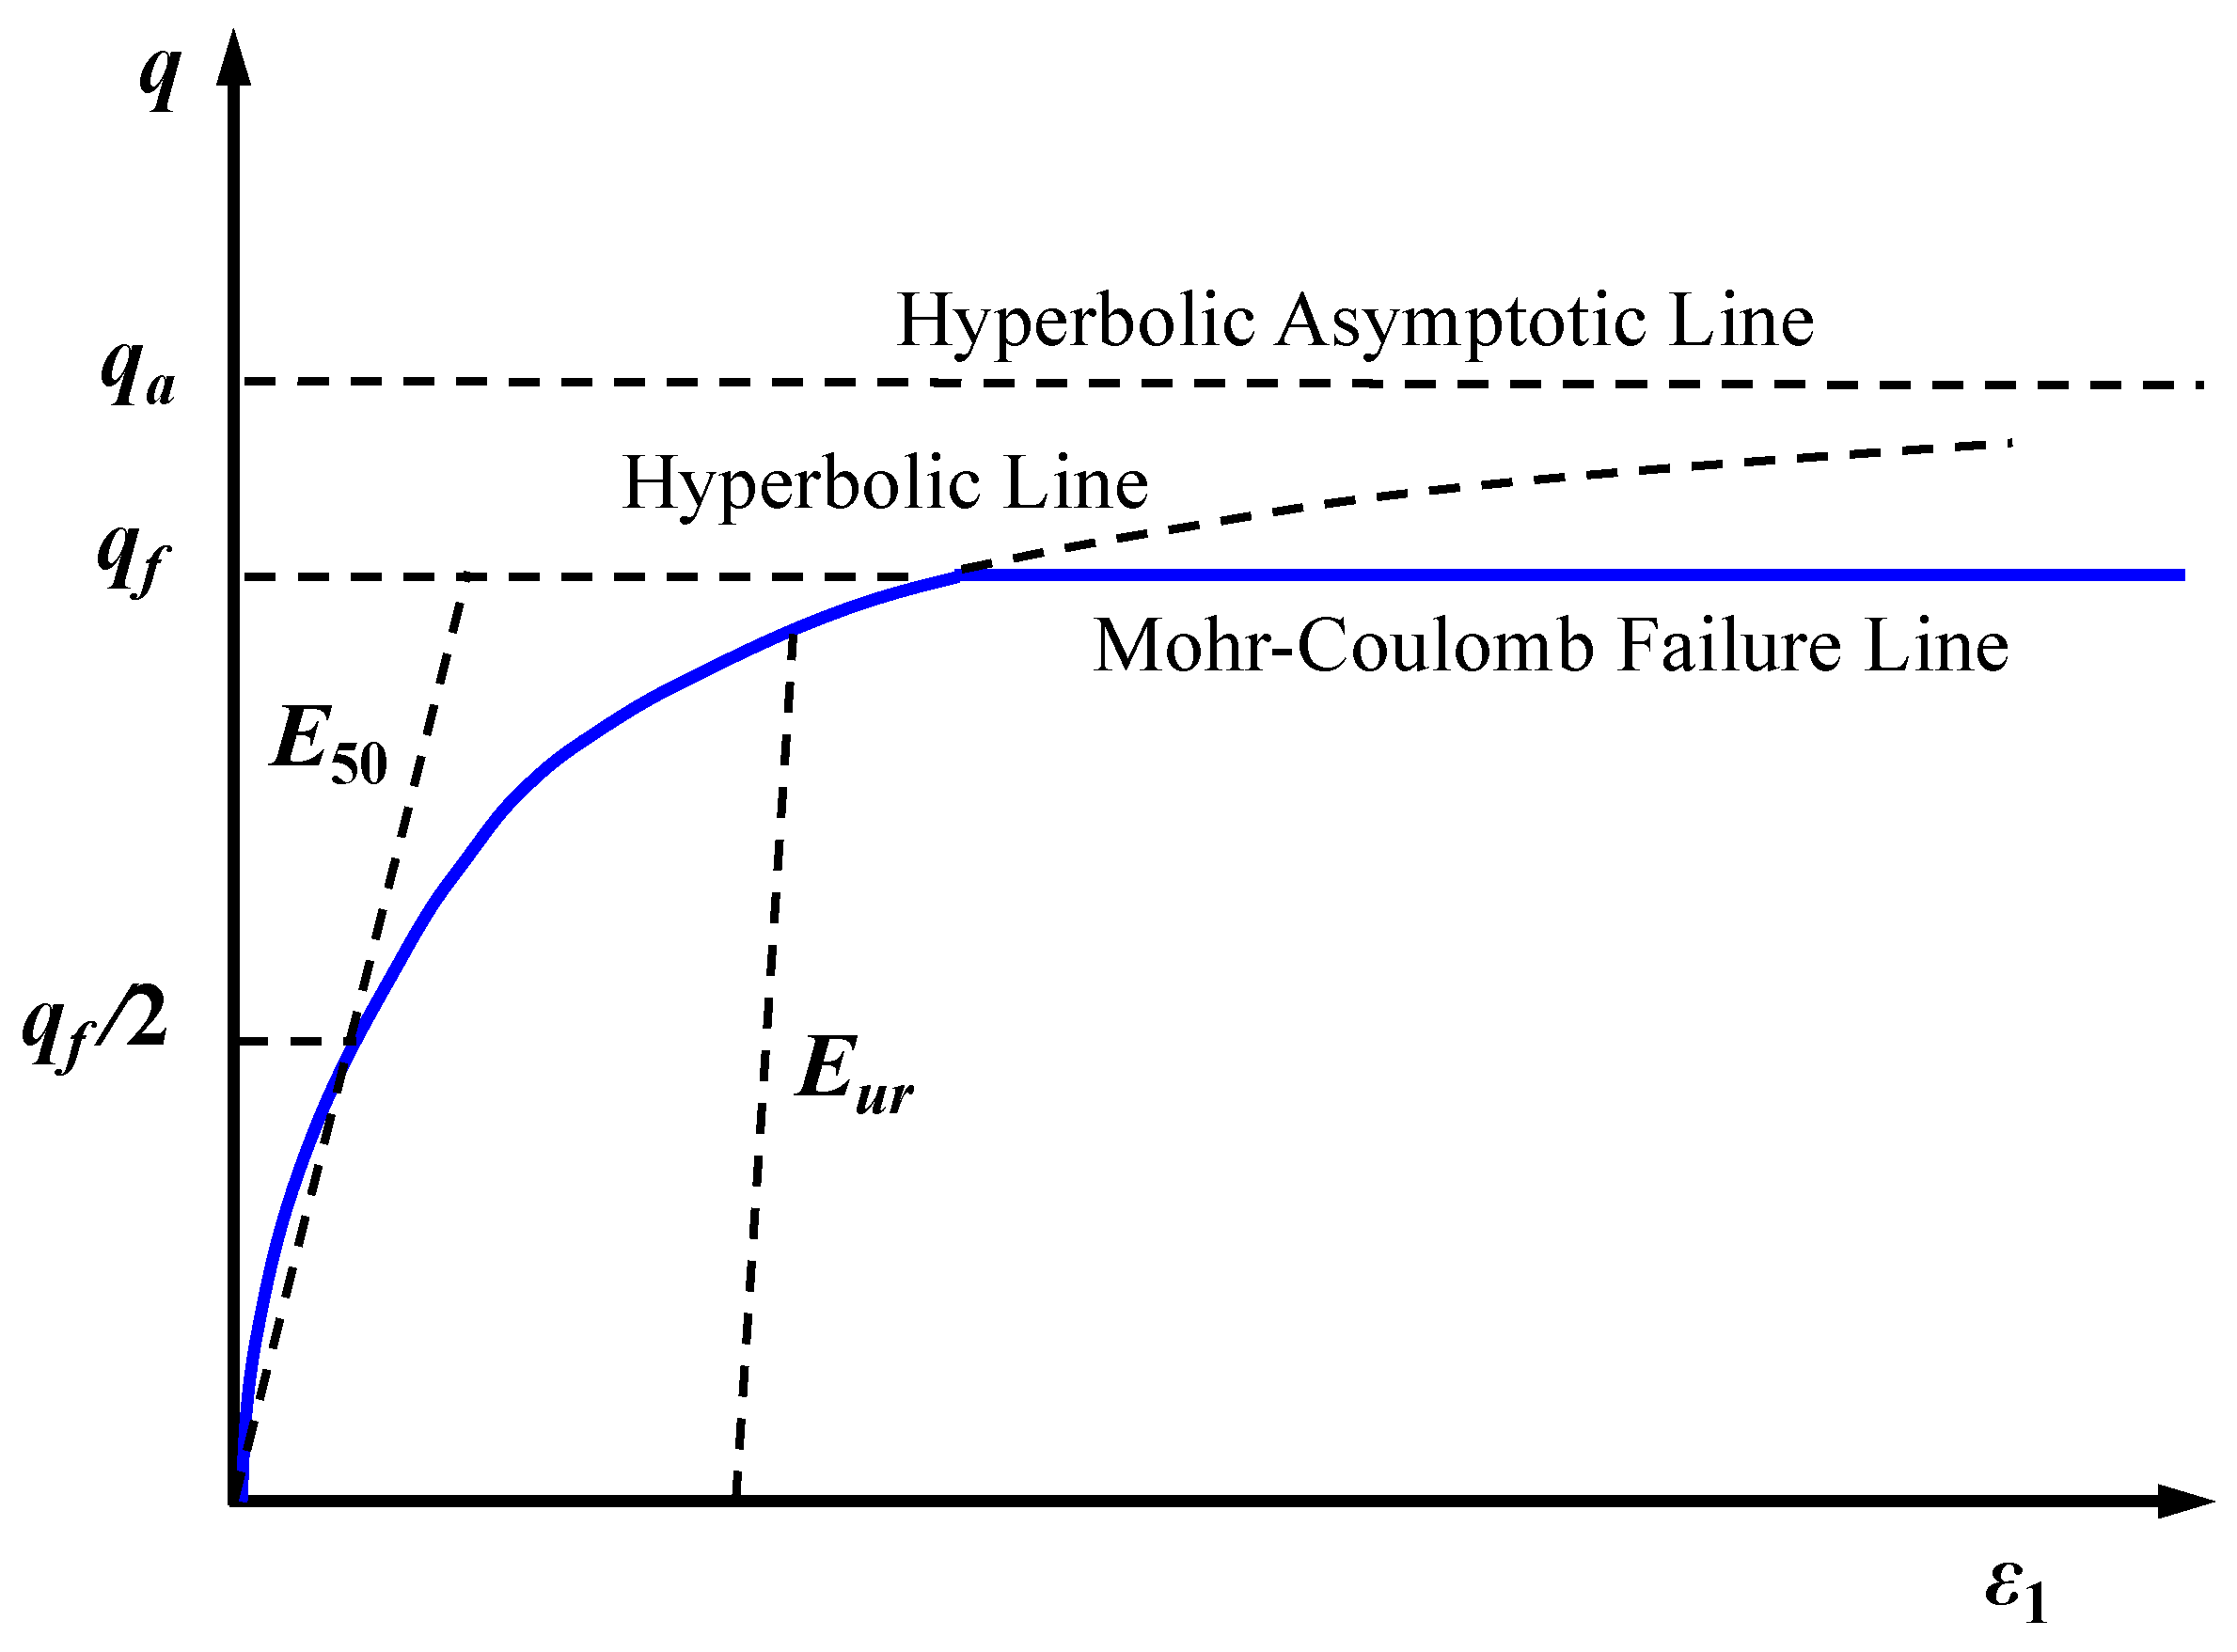
  • Incremental elastic law
The soil structure is appropriately simplified using the HS model, i.e., plastic hardening soil model, to better describe the nonlinear and stress-dependent deformation behaviour of soft or hard soils prior to failure [37]. It is formulated within the framework of hardening plasticity, allowing the removal of the main drawbacks of the original non-linear elastic model formulation, and is well-established for soil–structure interaction problems, excavations, and settlements analysis, among many other applications [38].
The HS mode adopts hypo-elasticity for the description of elastic behaviour,
p = K ϵ v e
s i j = 2 G ϵ i j
where K and G are the elastic bulk and shear moduli, which can be derived from the elastic unloading-reloading Young’s modulus, Eur:
K = E u r 3 1 2 v
G = E u r 2 1 + v
where the Young’s modulus is a stress-dependent parameter:
E u r = E u r r e f Z m
where
Z = c c o t φ σ 3 c c o t φ + p r e f > f c u t
and E u r r e f is the reference unloading-reloading stiffness modulus at the reference pressure p r e f . The current unloading-reloading stiffness modulus E u r depends on the maximum (minimum compressive) principal stress, σ 3 , the cohesion, c, and the ultimate friction angle, φ, as well as the power, m. For clays, m is usually close to 1. For sands, it is usually between 0.4 and 0.9. The default cut-off factor fcut is 0.1.
The HS model also employs an additional stiffness measure, E50, which defines the initial slope of the hyperbolic stress–strain curve. Parameter E50 obeys the following power law:
E 50 = E 50 r e f Z m
where E 50 r e f is a material parameter, which could be estimated from a set of triaxial compression tests with various cell stresses.
  • Shear yield criterion
The shear yield function determining the onset and development of shear hardening is defined as
f s = E u r E i · q a q q a q q E u r γ p 2 = 0
where γ p is a shear hardening parameter (one of the internal variables), E i = 2 E 50 / 2 R f , deviatoric stress q = σ 3 σ 1 , and q a is given as
q a = q f R f = 2 s i n φ R f ( 1 s i n φ ) c c o t φ σ 3
where the failure ratio R f = q f / q a has a value smaller than 1 (typically, R f = 0.9 is used), and q f is the ultimate deviatoric stress, which is consistent with the Mohr–Coulomb failure criterion (Figure 4). For a standard drained triaxial test, the connection between the axial (vertical compressional) strain, ε1, and deviatoric stress, q, is graphically represented in Figure 4 with the cut-off qf.
  • Volumetric cap criterion
The volumetric (cap) yield function is defined as
f v = q ~ 2 α 2 + p 2 p c 2 = 0
q ~ = σ 1 + δ 1 σ 1 δ σ 3
δ = ( 1 + s i n φ ) / ( 1 s i n φ )
where α is a constant based on a virtual (numerical) oedometer test. The evolution of the hardening parameter, p c , is given by the relation:
p c = k K p c c o t φ + p c c c o t φ + p r e f m γ v
where γ v is the volumetric hardening parameter, k is a correction factor with a typical value of 0 < k ≤ 1, K p = K 1 K 2 / K 1 K 2 , K 1 = E u r r e f / 3 1 2 ν , and K 2 = E o e d r e f 1 + 2 K n c / 3 . Parameter K n c denotes the normal consolidation coefficient, and E o e d r e f stands for the tangent oedometer stiffness at the reference pressure p r e f .
  • Tensile yield criterion
The model checks for the tension failure condition. Tension failure and potential functions are
f v = σ 3 σ t
where σ t is the tension limit. By default, σ t is zero, and the user can provide a value with an upper limit of c / t a n φ . The model does not consider tension hardening.
The key parameters for the soils in the case study are given in Table 4.
The hydraulic computation uses the isotropic fluid model, and the hydraulic heads inside and outside the shaft are at the same depth; therefore, seepage is therefore not considered in this case.

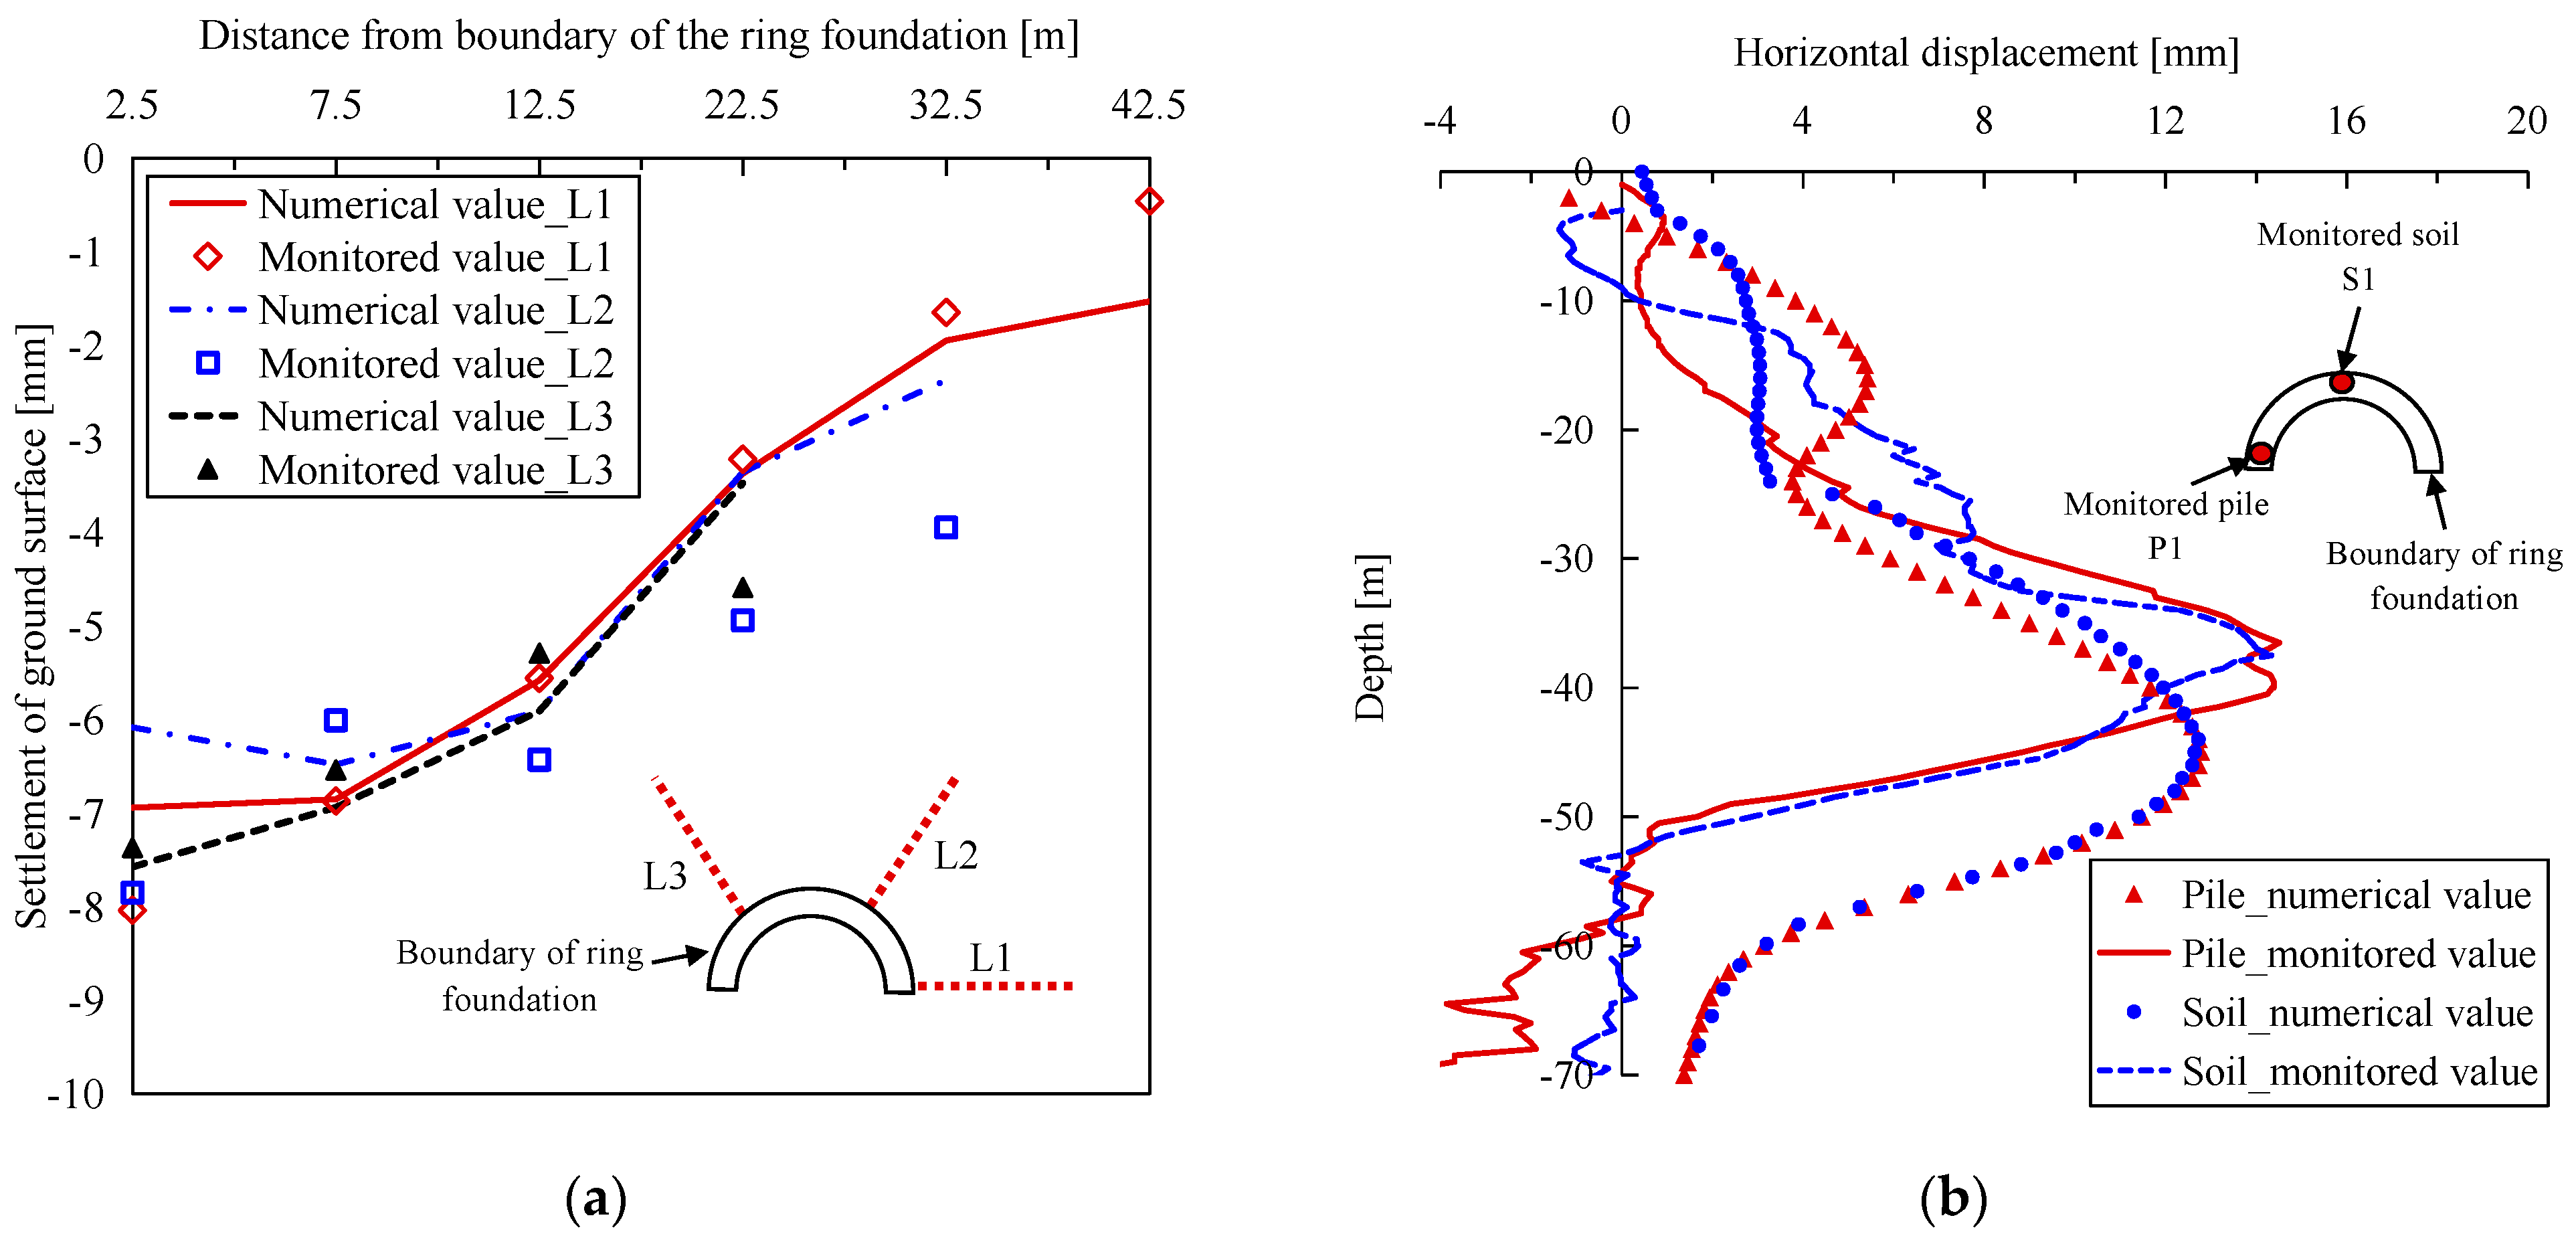
3.5. Model Validation

In this study, the following sign conventions for displacement, axial force, and bending moment are adopted: for displacement, in the absence of a specified coordinate axis direction, positive values represent horizontal movement towards the shaft centre. Vertical displacements with positive values indicate upward movement. When the displacement moves towards the interior (or inside the shaft), it is considered positive. Axial forces and stresses are deemed positive if they tend to compress the member at the section being analysed. Bending moments that deflect the cross-section towards the shaft centre are positive. Negative values represent movement in the opposite direction.
To validate the model, several monitoring points were established on-site along three distinct directions (L1, L2, and L3) around the shaft’s perimeter (see Figure 5a). These points correspond to locations in the numerical model where we collect data. The horizontal displacements of the monitoring piles and soil layers are monitored vertically, as illustrated in Figure 5b. Upon reaching the final excavation depth, the monitored results are compared with numerical results. In the L1 and L3 directions, a relatively minor difference can be observed between the numerical values and the measured data, with a maximum deviation of 1.09 mm. In the L2 direction, the maximum difference is 1.76 mm, which is considered acceptable for the purposes of this study.
The soil displacement’s influence on the piles results in a similar trend in the horizontal displacement variations of both piles and soil along the depth. Notably, the maximum horizontal displacement of Pile 1 (P1) and the monitored soil layer (S1) along the vertical axis occurs at a depth of approximately 40 m, reaching a magnitude of 15 mm (Figure 5b). Conversely, the numerical model predicts a maximum displacement towards the shaft of 13 mm at a depth of roughly 45 m.
Below this depth, a noticeable gap emerges between the monitored results and the numerical results, widening further as depth increases. Interestingly, the monitored values for the piles and soil indicate a displacement away from the shaft below the final excavation depth (−51 m), while the numerical simulations indicate the opposite. However, this does not entirely exclude the possibility of minor errors in the monitored data.
Despite the observed discrepancies between the monitoring and numerical results, the overall similarity in trends suggests that the difference is acceptable. Given this overall alignment, the model is deemed suitable for subsequent numerical analyses.

4. Results

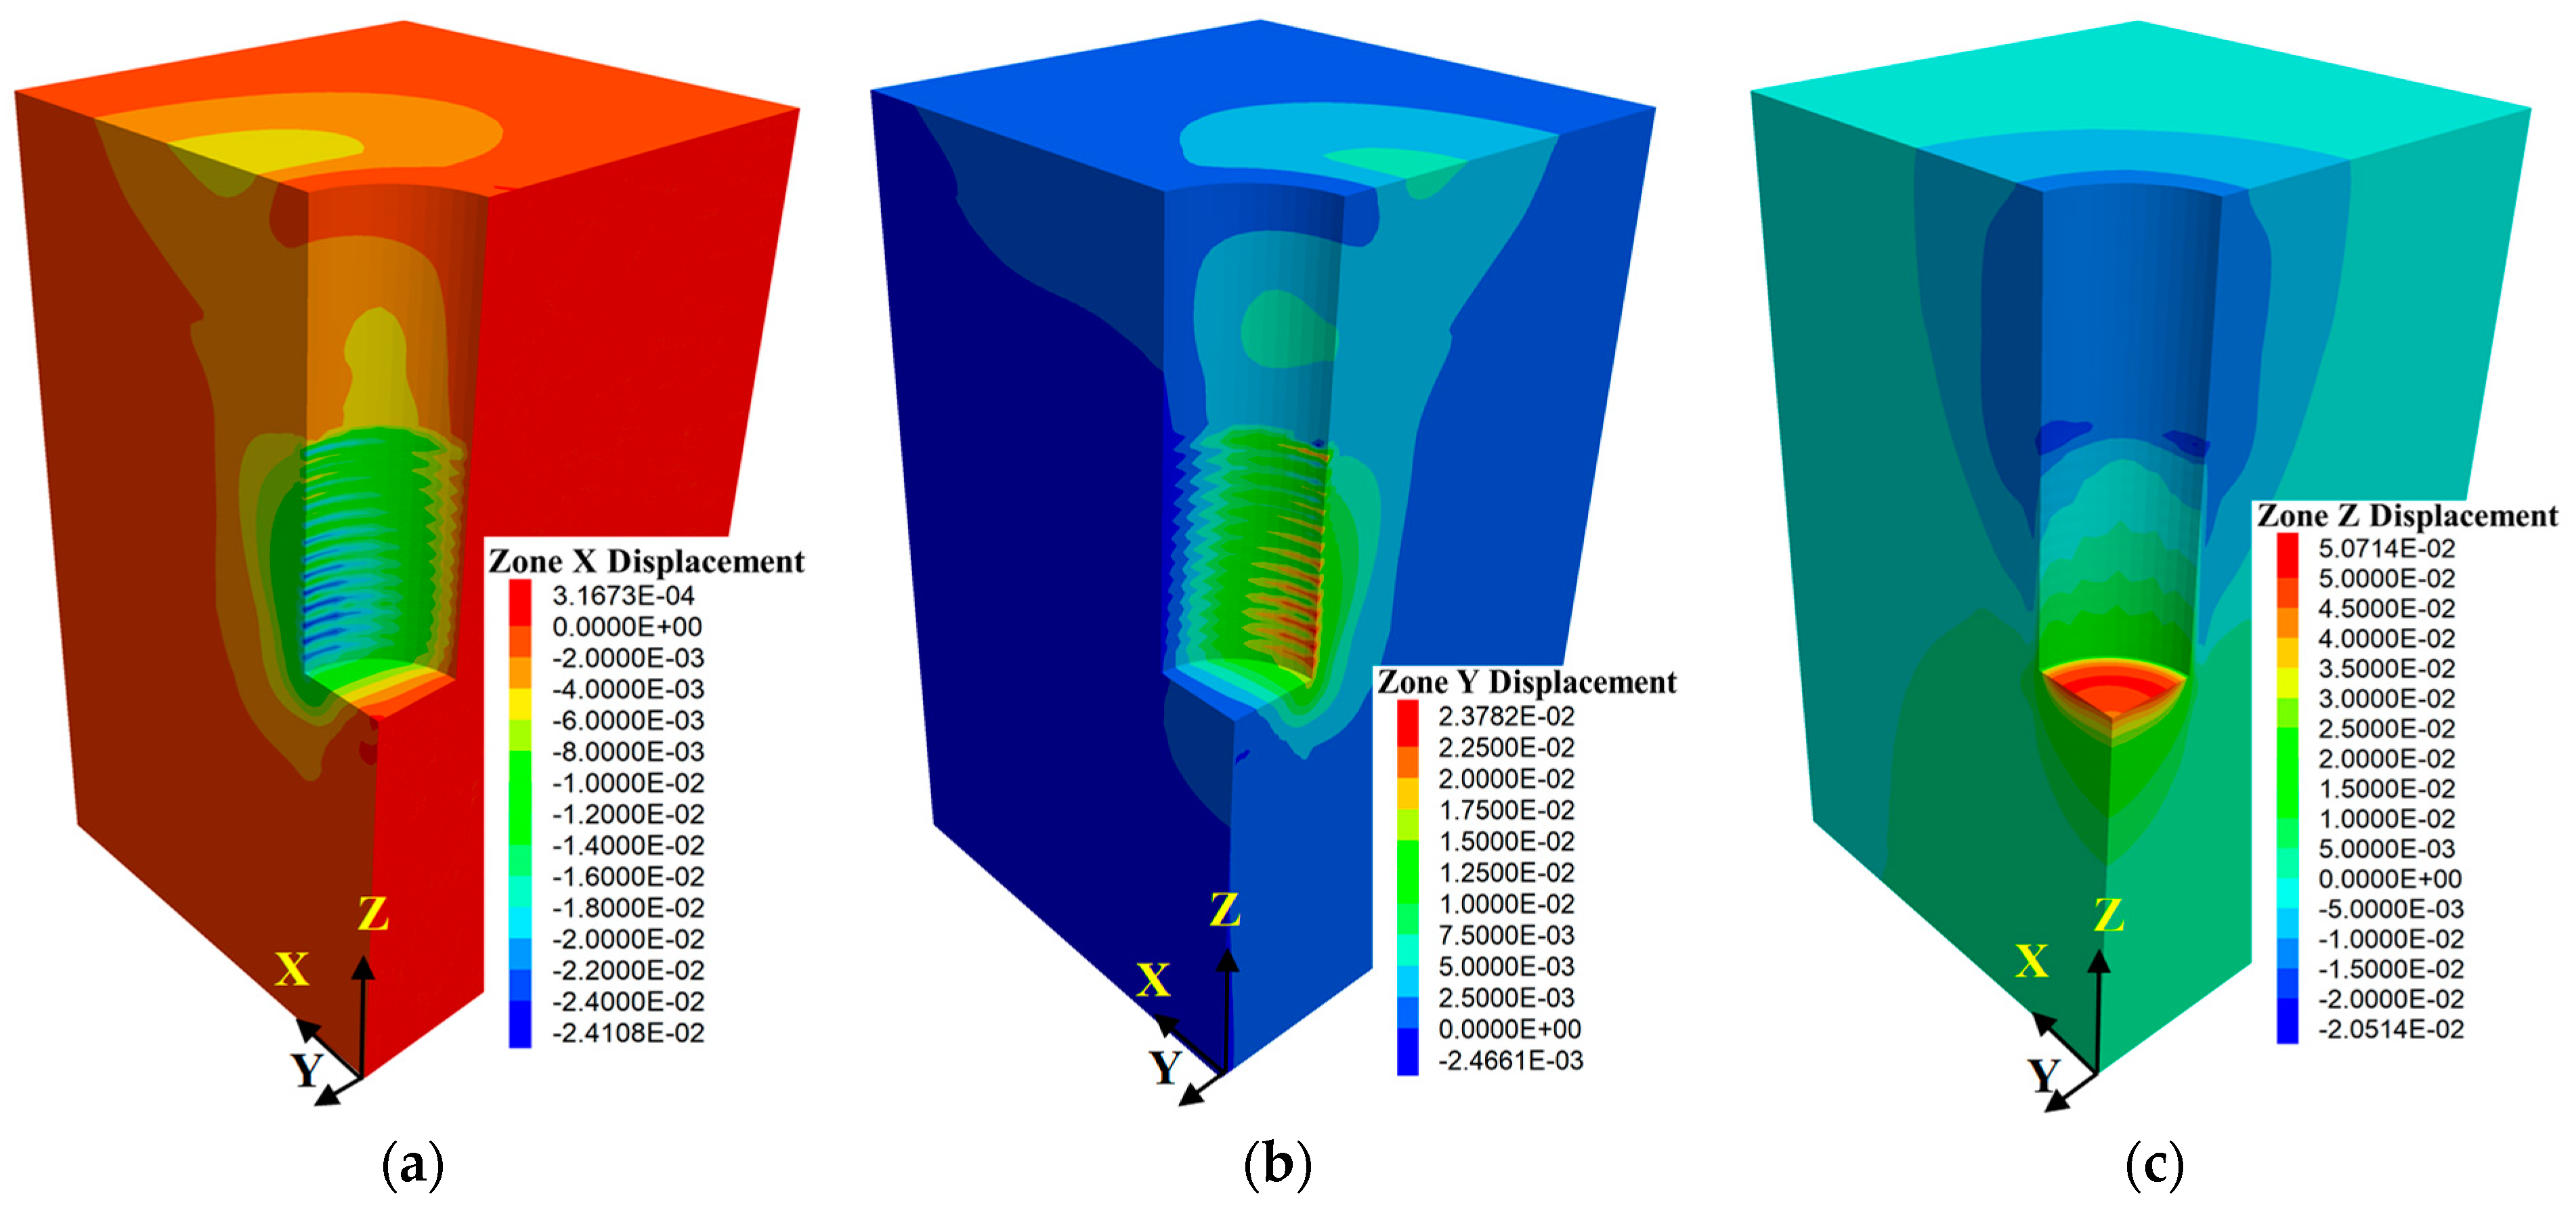
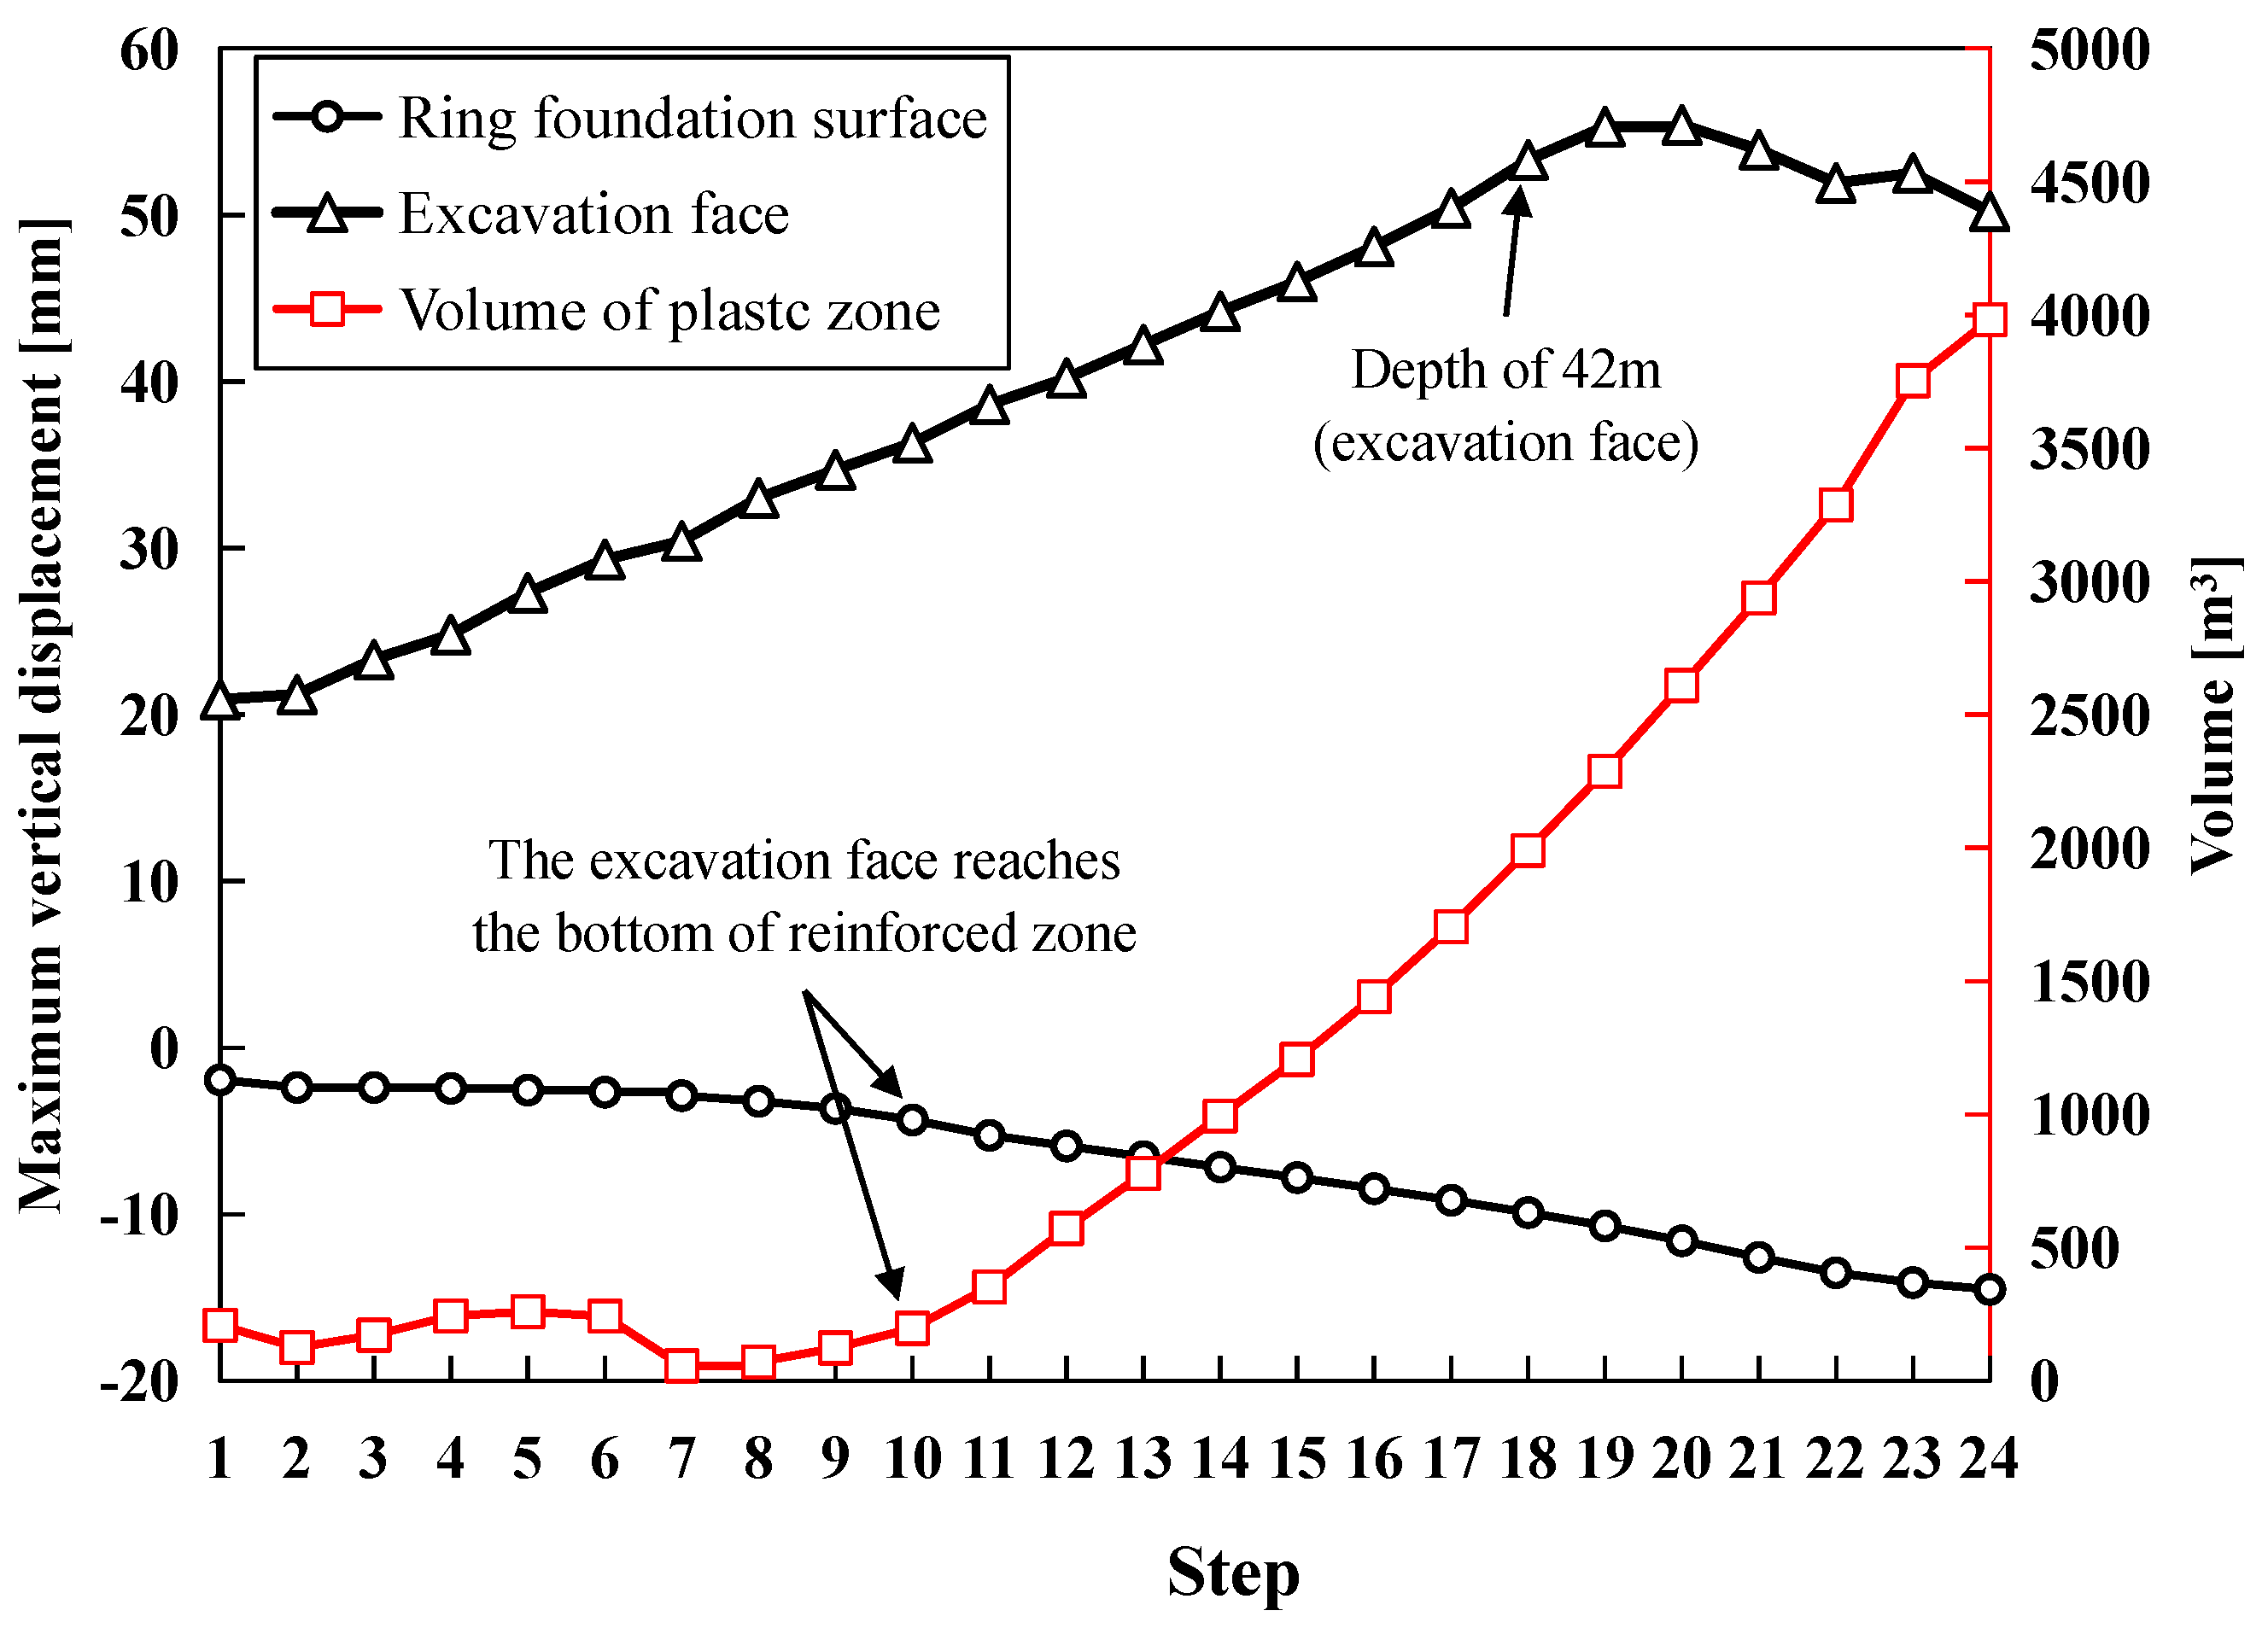
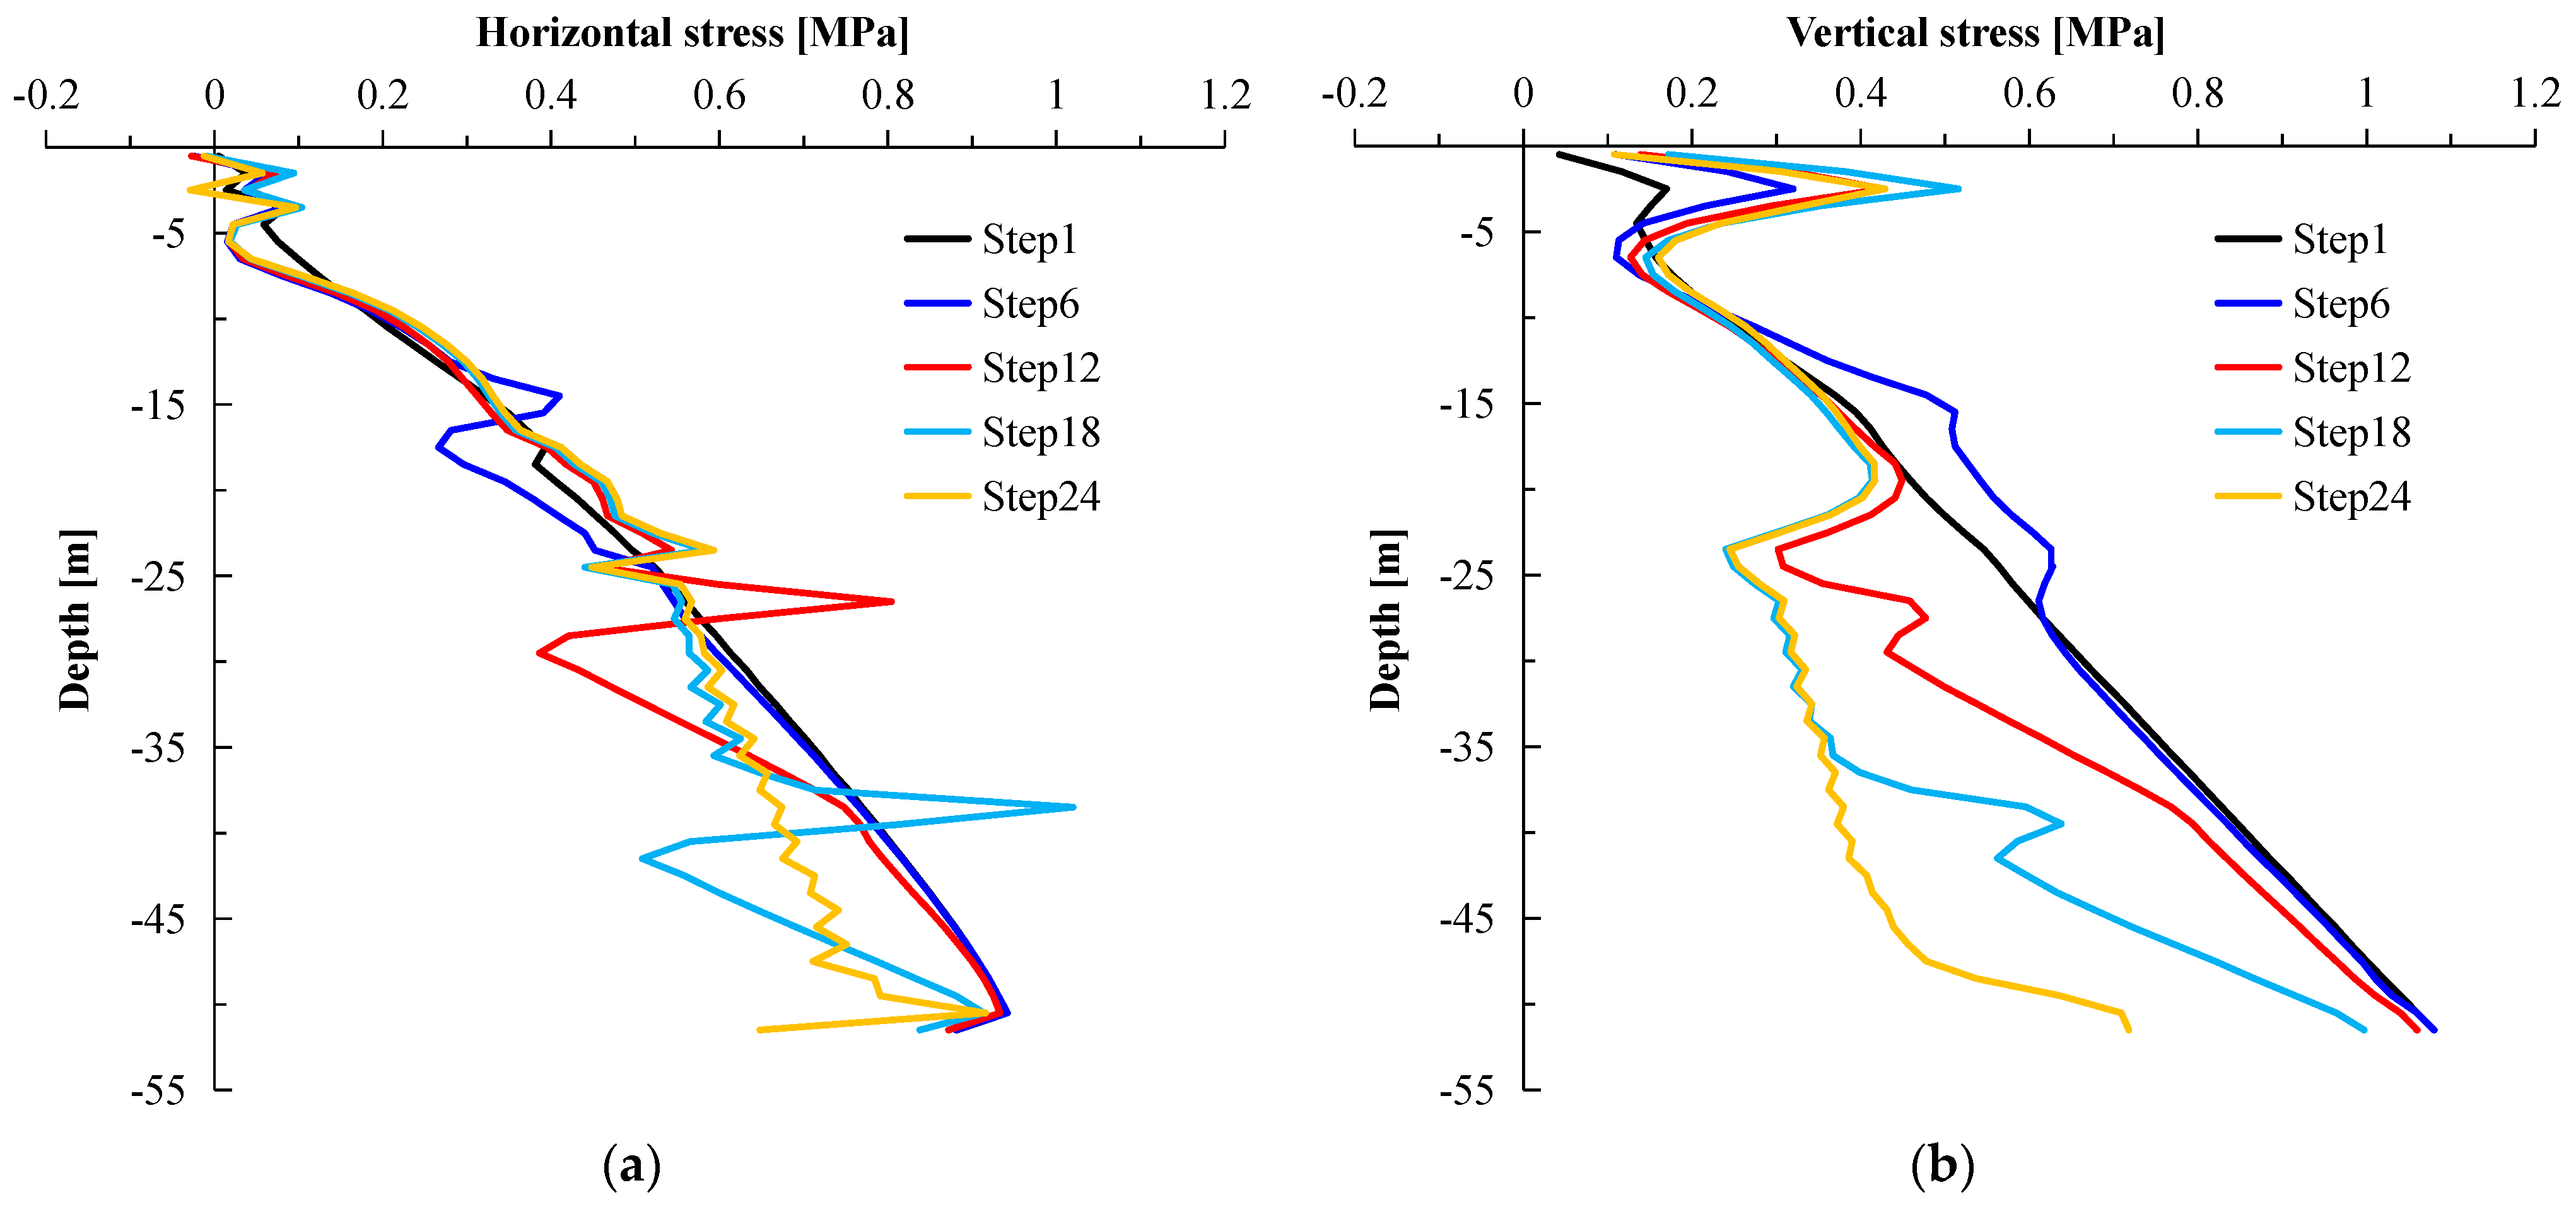
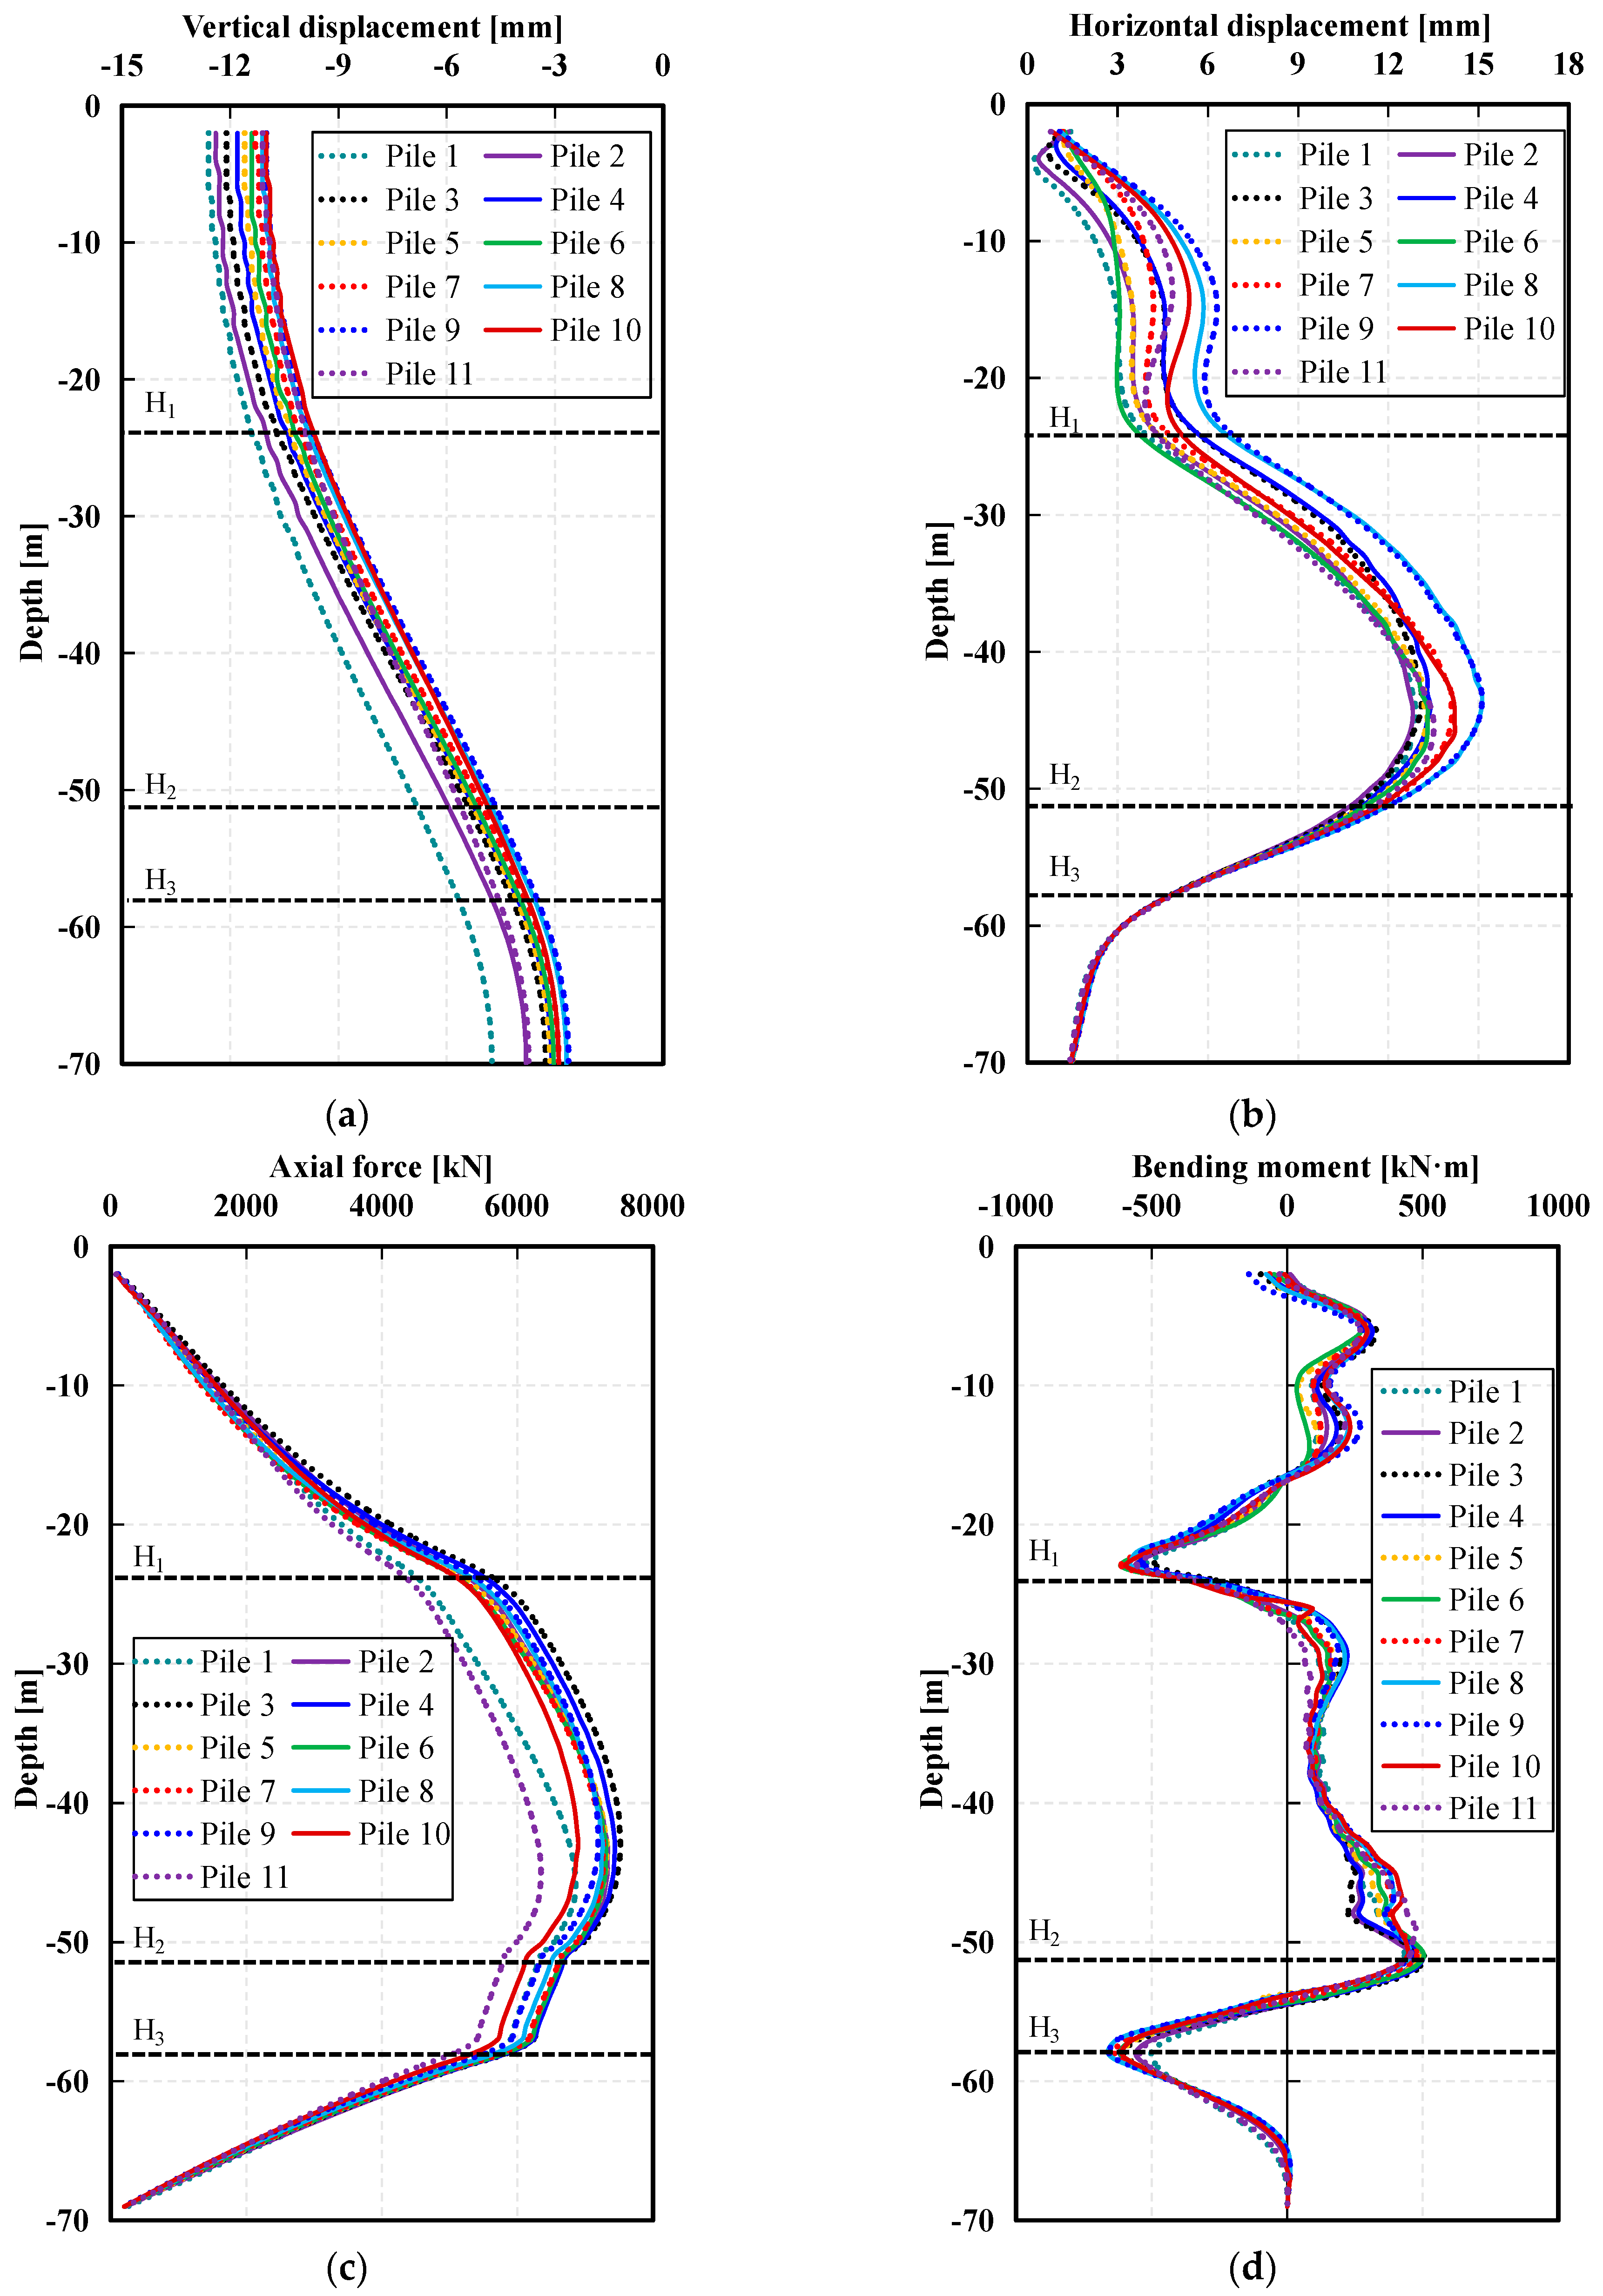
4.1. Mechanical Response in the Vicinity of the Shaft

The vertical position of the bottom of the reinforced zone is denoted by H1 (−24 m), while the final excavation depth is denoted by H2 (−51 m).
Figure 6 shows the deformations of the surrounding soils through half of the model in various directions at the final depth (Step 24). This visualisation highlights the locations of maximum displacements. Computational analysis has determined that the horizontal displacement of the soil beneath the reinforced zone is considerably greater than that above it. Specifically, the maximum horizontal displacement of the surrounding soil towards the shaft is approximately 24 mm. Concurrently, the maximum upward displacement occurs on the excavation surface, reaching a significant value of 50 mm.
However, it is noteworthy that the largest settlement does not occur at the ground surface but rather at the H1 level. This phenomenon is attributed to the softer soil conditions beneath the reinforced zone and the relatively weaker supporting structure, which lead to increased horizontal deformation that subsequently drives vertical displacement of the soil. Conversely, due to the stabilising effect of the piles, the overall settlement within the reinforced zone remains relatively minimal.
Figure 7 shows the peak vertical deformation at various locations throughout the sinking process. As excavation depth increases, vertical displacements at these locations demonstrate a linear trend. When the excavation face progresses past the reinforced zone, the surrounding soft soil experiences greater deformation, resulting in accelerated settlement on the surface of the top ring foundation. Nonetheless, until an excavation depth of 42 m is reached, the rate of uplift at the excavation face remains relatively constant, influenced primarily by the digging process. At this depth, the influence range of vertical deformation encounters the firmer sand layer beneath, causing a decrease in the uplift rate of the excavation face. Before this point, due to the soil’s uniformity, the uplift increases linearly with depth, with each 2 m excavation step leading to a 1.5 mm rise.
Examining the growth rates of displacement and plastic zone volume reveals the reinforcement zone’s significance in maintaining structural stability. Only a few plastic zones are present on the excavation surface before crossing the reinforced zone. However, once the excavation depth surpasses this zone, the focus shifts primarily to the lateral soil beneath it. Consequently, there is a marked increase in top deformation and plastic zone volume, significantly compromising stability.
Figure 8 shows the horizontal and vertical stresses along the depth at S1 (shown in Figure 5). Due to the larger self-weight of concrete ring foundation from 0 to −3 m, the rate of increase in both vertical and horizontal stresses is higher. Before step 6, the excavation depth does not exceed the reinforced zone (0 m to −21 m), causing minimal disturbance to the soil, and the distribution of vertical and horizontal stresses still follows a roughly linear increase. After exceeding the reinforced zone (step 9), irregular horizontal stress distributions begin to appear in the soil near the excavation face due to the formation of a plastic zone. Below the reinforced zone, the reduction in support strength leads to greater stress release in the surrounding soil, resulting in significantly reduced horizontal and vertical stresses compared to before. More stress release indicates increased deformation and decreased safety.
Figure 9a illustrates the vertical displacements of the piles. Despite variations in the horizontal movements of each pile due to uneven load distribution on the top ring foundation, they all exhibit a similar trend. Notably, the significant pressure on the top load area results in the greatest settlement in Piles 1 and 2, while Piles 8 and 9 experience the least. Conversely, in terms of horizontal displacement, Piles 8 and 9 exhibit the largest movements, while Piles 1 and 2 display relatively minor shifts (Figure 9b). As depth increases, the vertical displacements of all piles steadily diminish, peaking at 13 mm at the pile tops. Furthermore, a reverse bending zone appears at H1 for the horizontal displacements, where the movement sharply rises with depth and then sharply drops below H2, ultimately resulting in minimal variation in horizontal displacement among the piles.
The variation in axial force shown in Figure 9c exhibits a similarity to the horizontal displacement patterns displayed in Figure 9b, particularly within the range of H1 to H2, where values are comparatively high. Among the piles, Pile 3 experiences the highest axial force, reaching 7520 kN, closely followed by Pile 4. This underscores the complexity of pile interactions, revealing that the greatest deformation does not always correspond to the highest axial force. Turning to Figure 9d, the differences in bending moments (Mv) among the piles are relatively small. There are three distinct peaks in the bending moment profiles: at the bottom of the reinforced zone, at the final depth, and notably at a depth of −58 m, termed H3, which marks the interface between the hard and soft soil layers. This peak at H3 arises from the abrupt change in horizontal displacement as the piles traverse from the clayey silt layer to the fine sand layer. Consistent with their large horizontal displacements, Piles 8 and 9 have relatively high total bending moments. The maximum recorded bending moment recorded is approximately −660 kN·m.

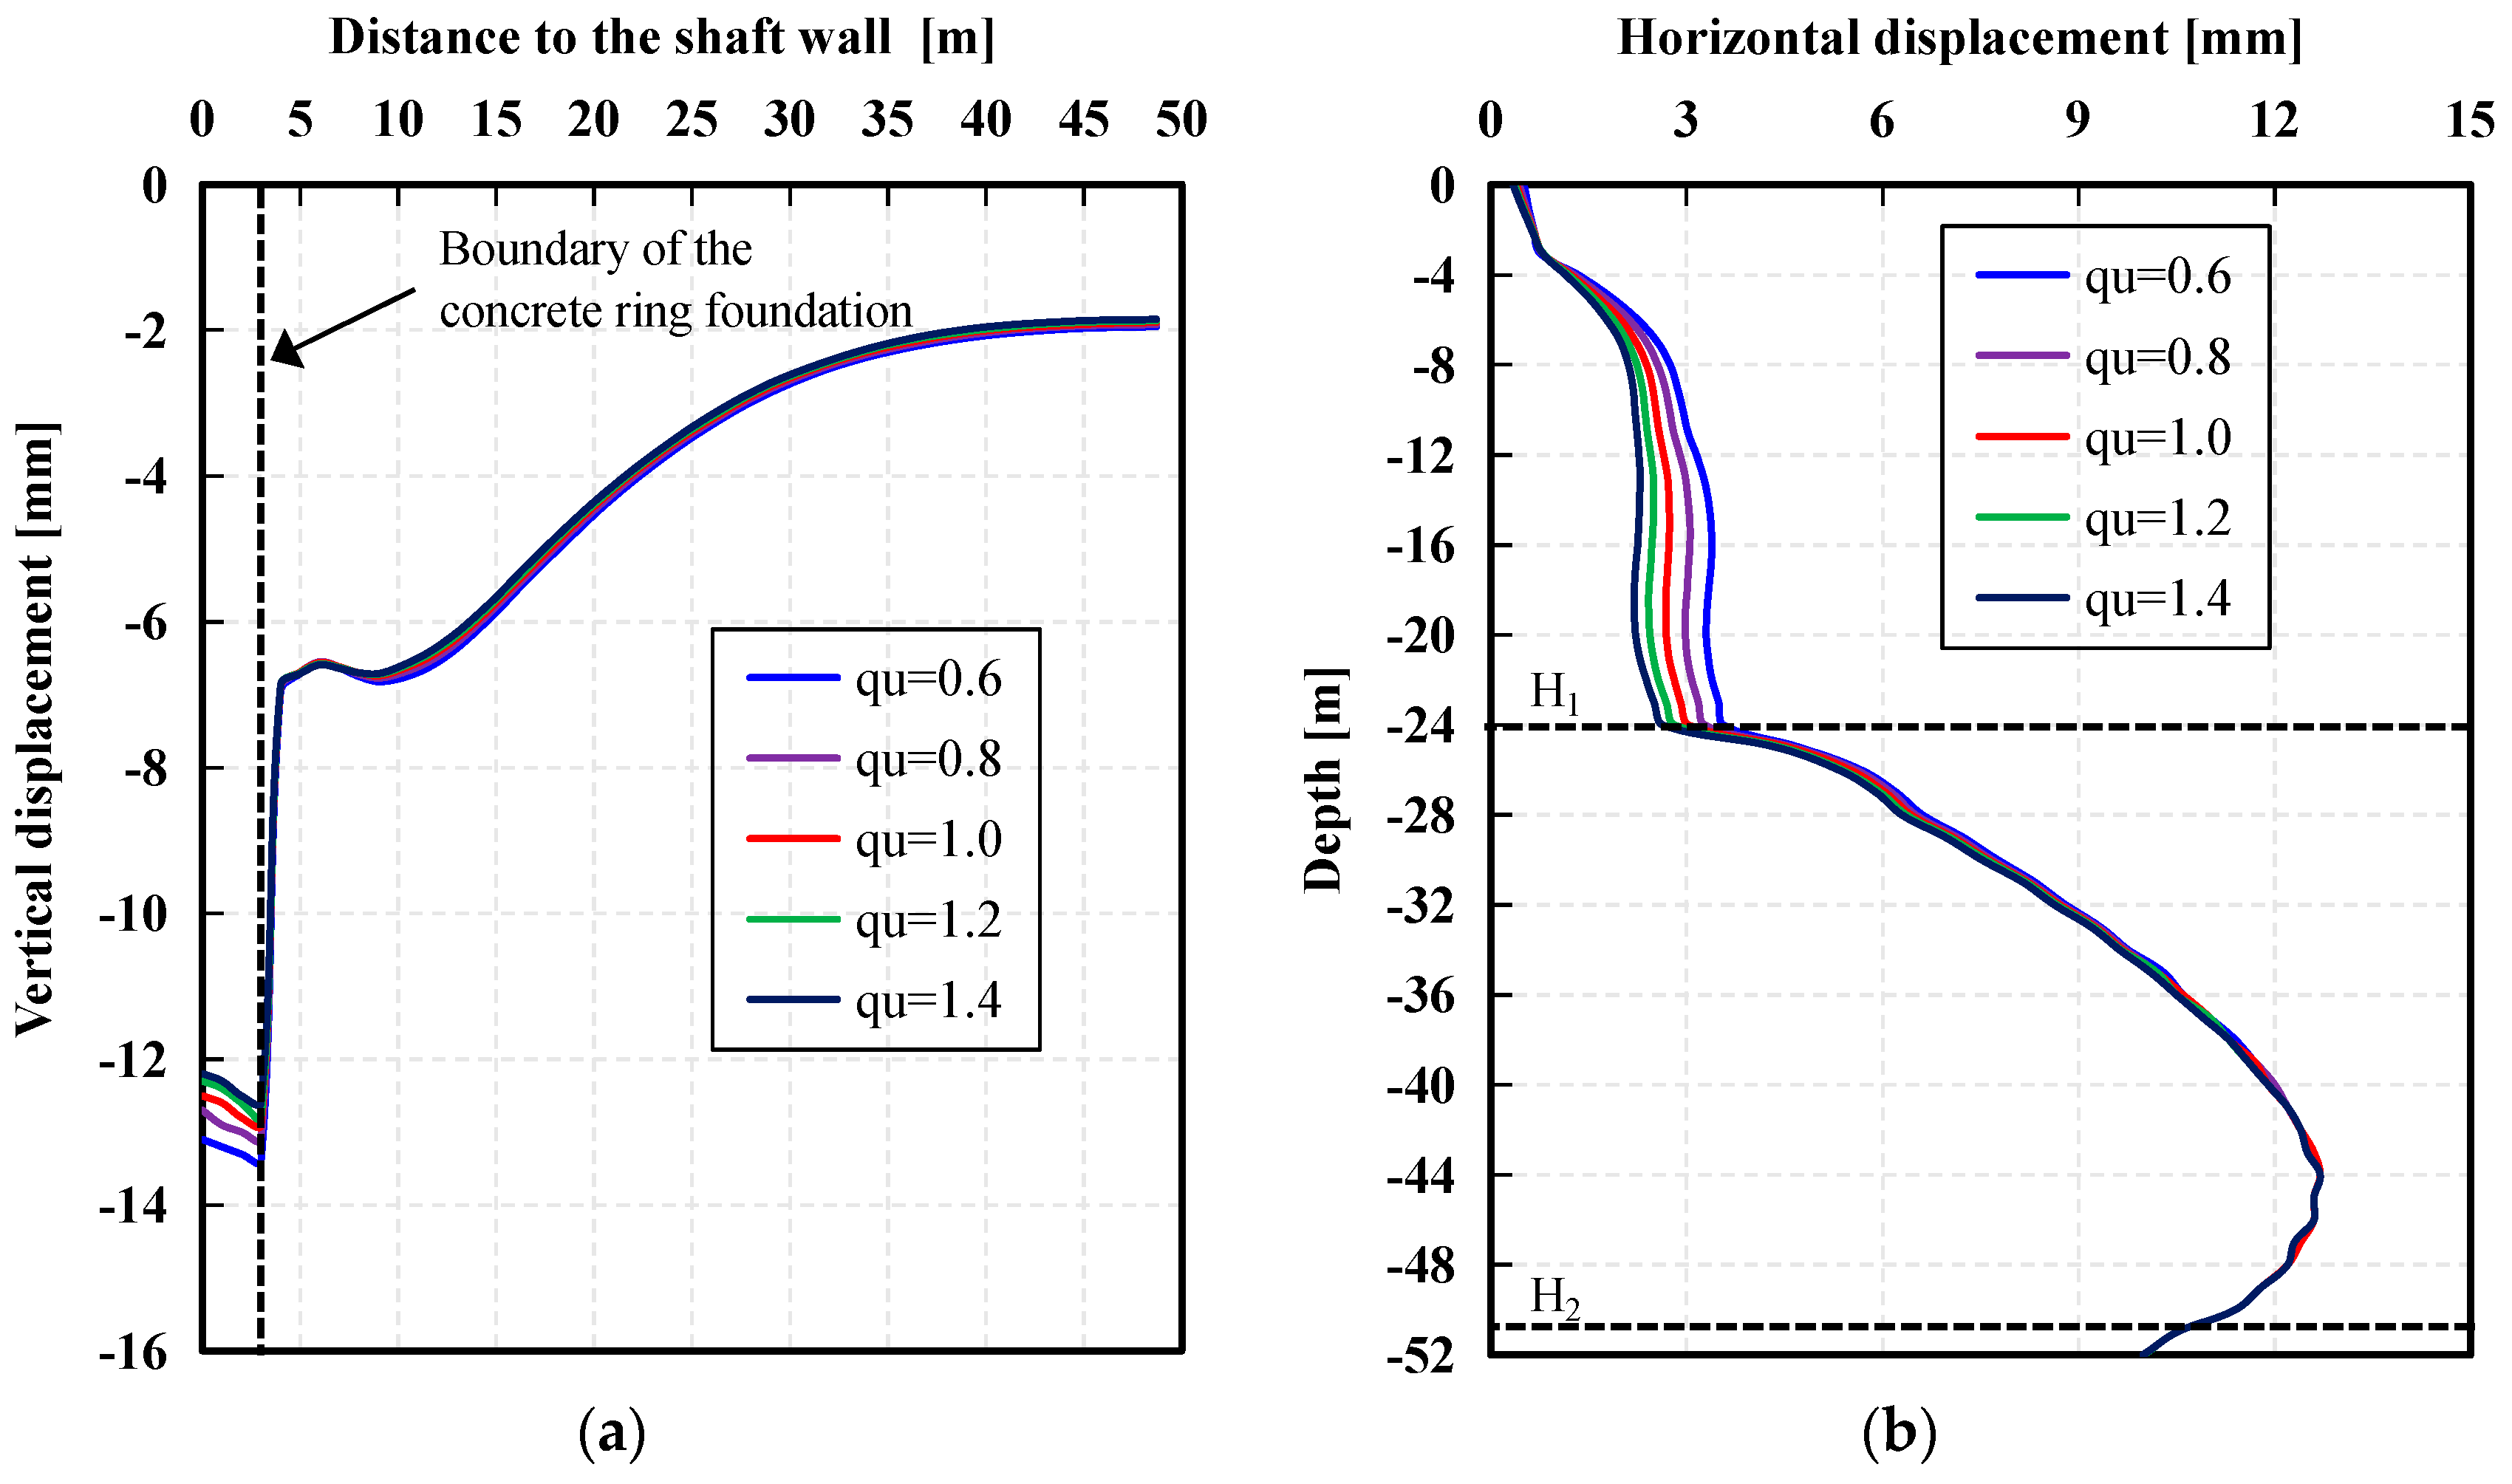
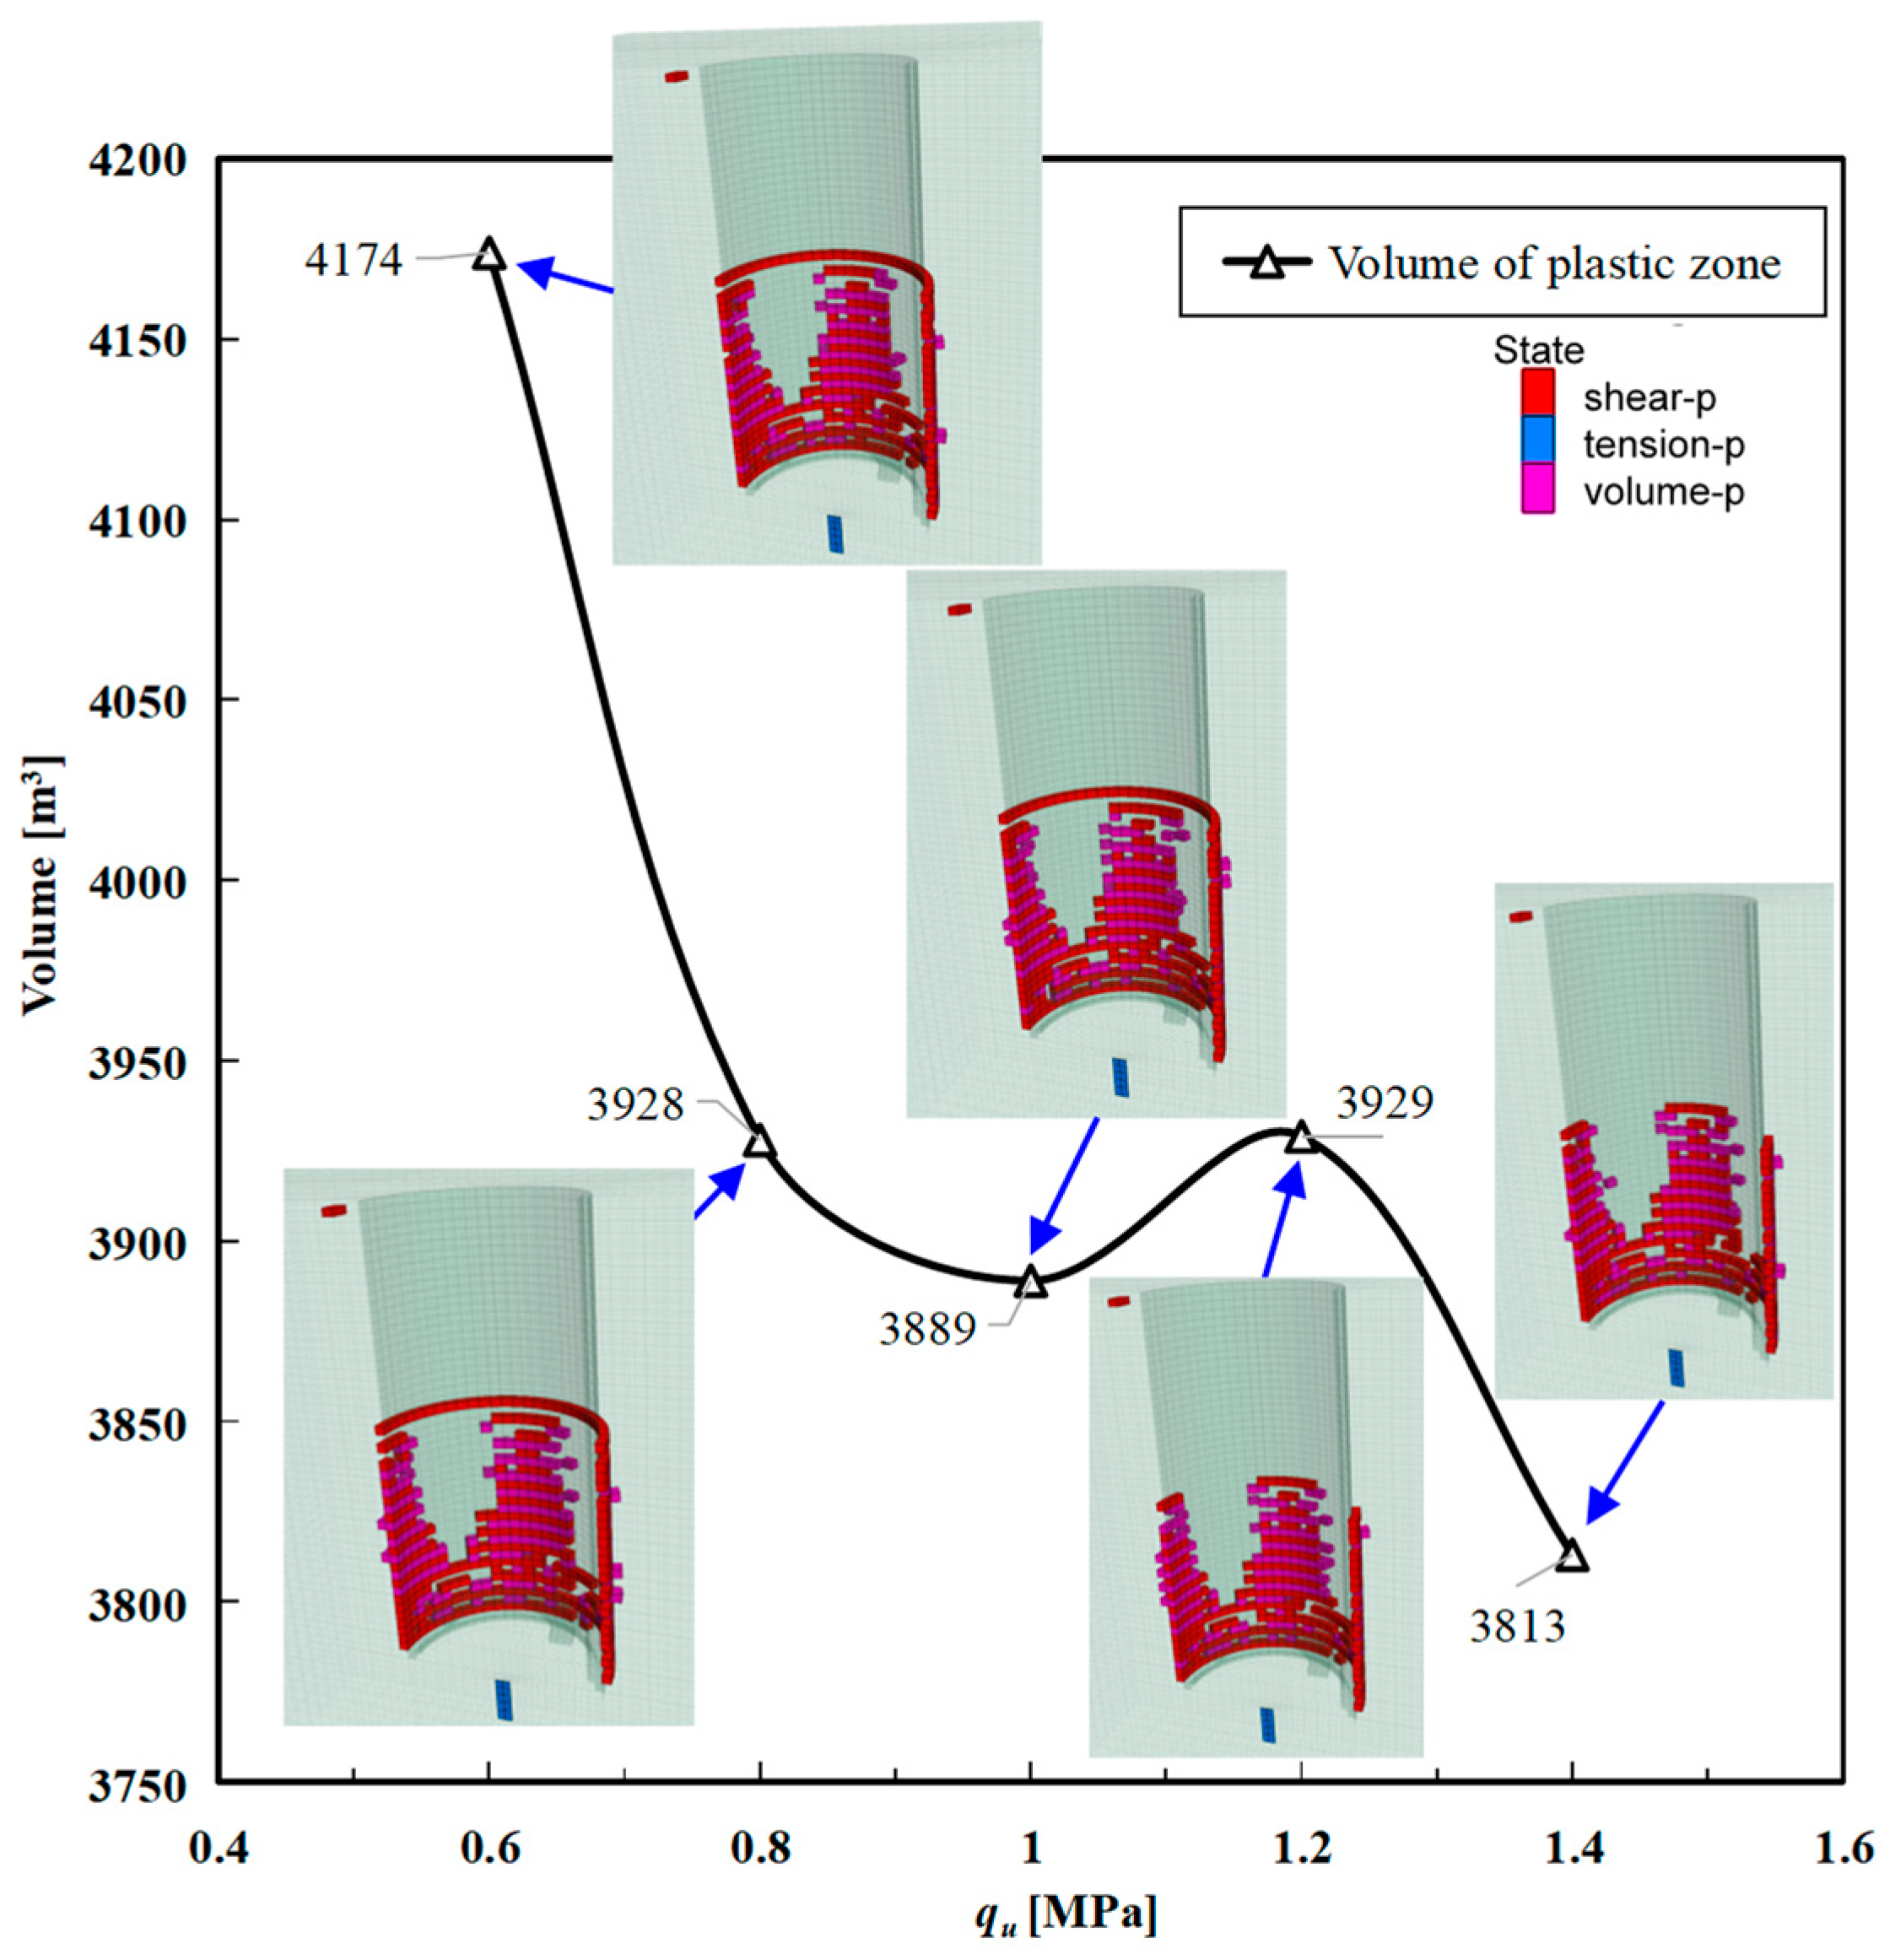
4.2. The Influence of the Reinforced Zone Strength

The effect of reinforced zone strength on the stability of the shaft will be investigated in this section. The reinforced zone is formed by incorporating cement into natural soils through grouting or mixing methods, resulting in a hard, semi-rigid, and durable material formed via cement particle hydration. This material possesses excellent compressive and shear strengths but exhibits brittleness and limited tensile strength, making it susceptible to cracking.
The unconfined compressive strength test is a crucial assessment tool for evaluating the effectiveness of in situ soil-stabilizer mixtures in practical applications. Although laboratory-measured compressive strength moduli may differ from those validated in field tests, they remain an essential component in the design of soil stabilization mixtures. In our project, the unconfined compressive strength is typically maintained within a range of 0.6 MPa to 1.4 MPa. Falling below this lower limit poses safety concerns, while exceeding the upper limit becomes uneconomical.
However, when it comes to numerical modelling, there is no direct option to set the unconfined compressive modulus. To address this, we use equivalent conventions for numerical analysis. Based on experimental data from previous studies, the unconfined compressive modulus, qu, can be correlated with elastic parameters, enabling us to incorporate this crucial parameter into our numerical simulations [39]:
E 50 = 142 q u
where E 50 is the secant Young’s modulus. Based on soil properties and engineering experience in Shanghai, it is suggested that the Young’s modulus of soil-cement, E, could be 4–5 times the secant Young’s modulus [40,41]. However, it should be noted that in practical engineering, there is a considerable variability in the relationship between the compressive strength and the soil modulus. Therefore, the equivalent conversion in this paper can only be used as a reference for research into the relationship between the soil-cement strength and mechanical response, while the shear and tensile strengths given in Table 5 are derived from some experimental studies [39,42,43].
Monitoring points have been strategically positioned along the L1 direction (Figure 5a) to track the ground surface subsidence variations after sinking, particularly those influenced by varying reinforced zone strengths. The concrete ring foundation, with a width matching the thickness of the reinforced zone, is primarily the area most affected by this variable, while the influence on other regions is negligible (Figure 10a). Notably, the vertical displacement at the most affected location shows a mere decrease of 0.9 mm. Furthermore, it becomes evident that the impact of reinforced zone strength on vertical displacement diminishes as the qu increases.
Figure 10b illustrates the horizontal displacement of the soil at S1 (Figure 5b) across various depths. In contrast to vertical deformation, the horizontal displacement change is relatively minor, yet its influence is confined to the depth range of the reinforced zone, with a maximum shift of 1.15 mm.
Based on the computational analysis, it is apparent that enhancing the soil-cement strength is not an effective means of controlling the deformation around the shaft. Based on the deformation results for the piles, as expected, even with varying the soil-cement strength, the deformation and internal forces within the piles undergo minimal changes.
Despite the limited influence of the reinforced zone’s strength on soil deformation, as shown in Figure 11, the total volume of the plastic zone surrounding the shaft exhibits a reduction after the completion of the sinking process. While the plastic zone’s volume is not a direct safety indicator, it does provide insight into the degree of soil disturbance caused by excavation. Its reduction, therefore, contributes to improving the structural stability. Notably, the soil in the vicinity of the reinforced zone remains free of plastic zones, indicating its reinforcing effect.
As qu increases from 0.6 MPa to 1 MPa, the plastic zone’s volume decreases by 7%. When qu rises further to 1.4 MPa, the plastic zone diminishes by an even greater margin of 8.6%. However, interestingly, at qu = 1.2 MPa, the plastic zone’s volume slightly increases compared to qu = 1 MPa. Considering both economic factors and the reinforcement effect, it is advisable for this project to maintain the unconfined compressive modulus of the reinforced soil at approximately 1 MPa.

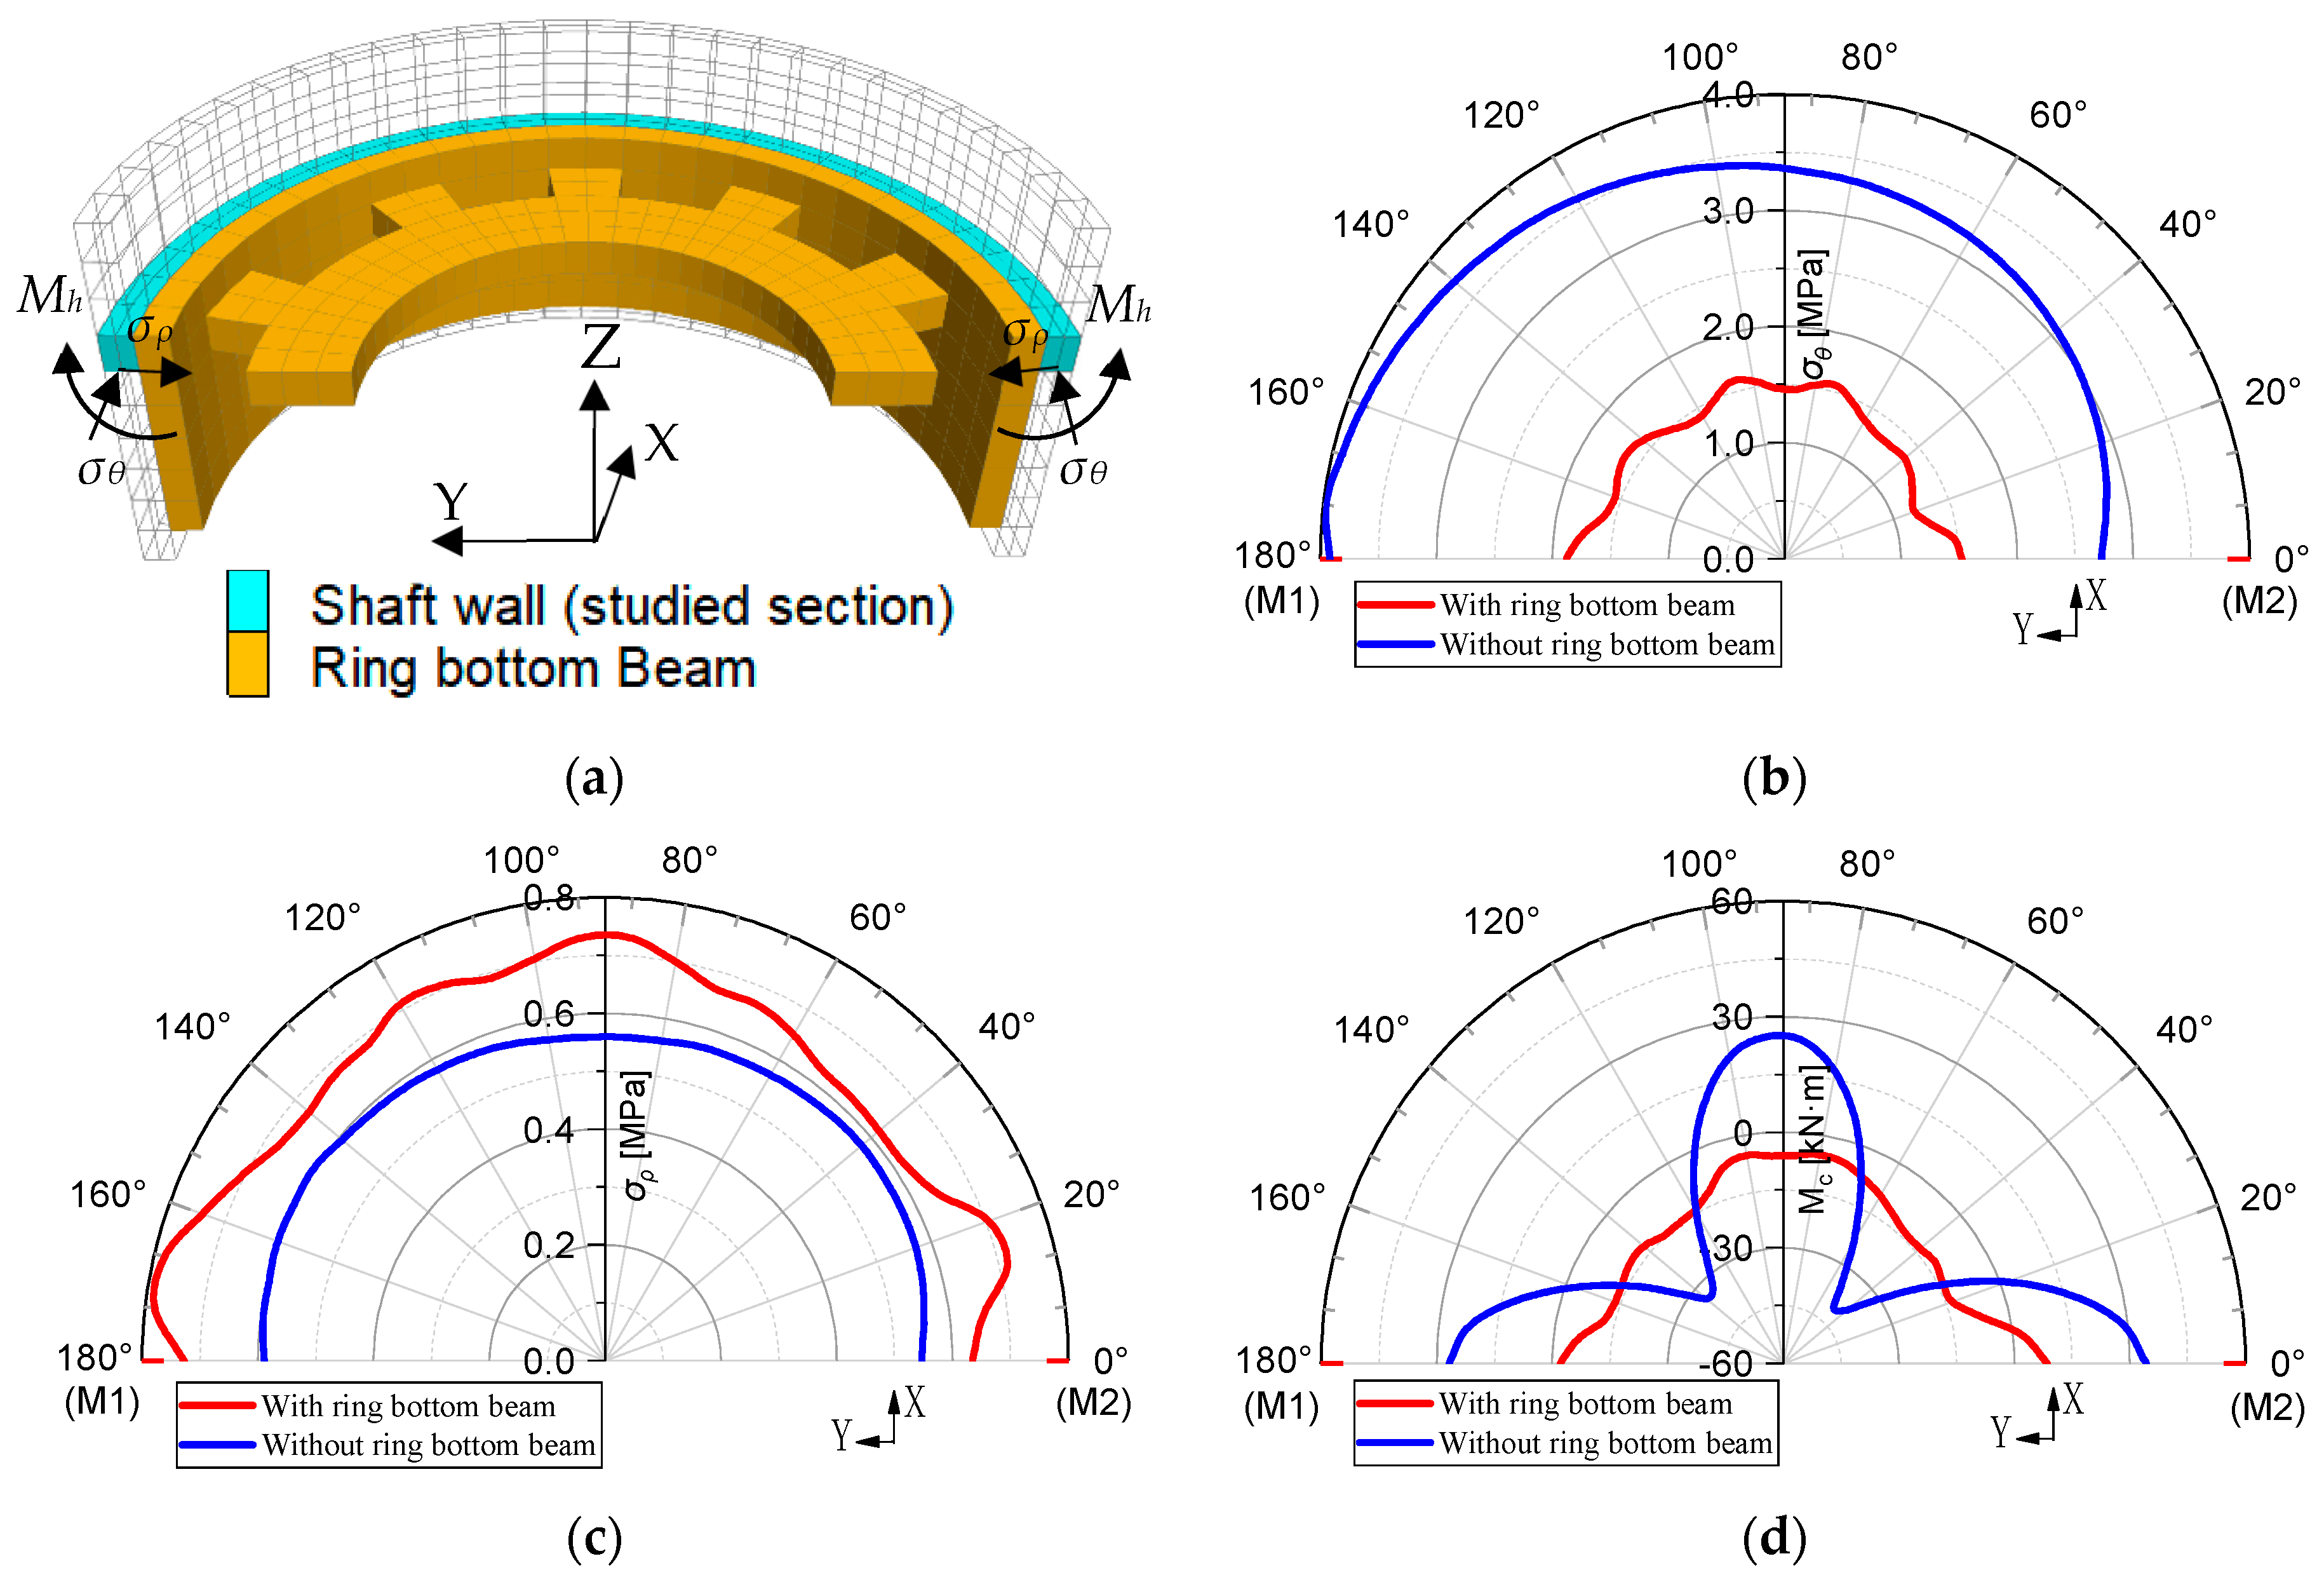
4.3. The Influence of the Ring Bottom Beam

To effectively distribute the excessive soil pressure around the cutting edge, mitigate the convergent deformation of the shaft wall, resist bending moments, and strengthen the interface between the bottom concrete and plain concrete for bottom sealing, a ring bottom beam design has been implemented. However, the actual efficacy of this design remains to be verified, thus necessitating the application of numerical simulation methods to assess its supportive role and scrutinise the results.
It is worth noting that, although supplementary sections are added to the shaft as excavation progresses and the shaft settles, the numerical model in this study assumes a continuous shaft wall, overlooking potential joints between prefabricated segments. In contrast, real-world projects often employ a prefabricated shaft wall, introducing potential disparities in the internal force distribution of the concrete lining, particularly at the joints. Nevertheless, the mechanical response results from this model provide valuable insights into the mechanical behaviour of cast-in-place shafts and serve as a basis for comparing trends with prefabricated shaft walls.
The comparison of shaft deformation with and without the ring bottom beam, as depicted in Figure 12a,b, clearly highlights the effects of this design choice. When the shaft reaches its final depth, the top of the shaft exhibits an offset of approximately 6 mm, increasing gradually towards the cutting edge where the maximum offset occurs. By analysing the data from monitoring lines ML1 and ML2 set at the shaft wall’s centre on the symmetric plane, with the ring bottom beam, the centre axis of the shaft offsets 8.5 mm towards Pile 1, while without it, the offset increases to 9.6 mm. Additionally, a slight abrupt change can be seen in deformation near the top of the initial support structure, as shown in Figure 12c. This observation suggests that the initial support structure, including the ring beam does not significantly mitigate the overall offset but may have a localised impact on shaft deformation patterns.
The most significant impact of the ring bottom beam, however, lies in reducing convergent deformation within the depth range of the initial support structure. As shown in Figure 12d, the presence of the ring bottom beam leads to a notable reduction in convergent deformation, achieving a 50% reduction in the case study. This reduction is crucial for shafts excavated using vertical shaft sinking machines (VSM) as excessive convergent deformation can significantly hinder the lifting and lowering of the machine. It is worth noting that the extent of this reduction may vary depending on the specific geological conditions and structural design of the project.
The axial forces of the shaft wall along ML1 and ML2 (Fv) are presented in Figure 13a. Due to the deviation of the shaft wall, the Fv acting on M1 and M2 is not symmetrical. Below a depth of −11 m, the difference in Fv between ML1 and ML2 begins to increase significantly. The largest disparity occurs at the cutting edge, where ML2 exceeds ML1 by approximately 1370 kN in both cases with and without the ring bottom beam. However, within the depth range of sidewall (−50 m to −44 m), Fv is notably reduced in the presence of the ring bottom beam, decreasing by approximately 35 kN~654 kN. Nonetheless, Fv at the cutting edge returns to a level similar to that without the ring bottom beam.
The analysis of the bending moment (Mv) at different depths of the cross-sections where M1 and M2 are located provides further insights into the structural behaviour of the shaft. As seen in Figure 13b, the difference in Mv between M1 and M2 begins to emerge below the reinforced zone, but it remains relatively small. However, below the top of the initial support structure, the ring bottom beam exerts a significant influence on the distribution of Mv. The substantial variation in Mv near the top of the initial support structure can be attributed to the larger bending deflection of the connection due to the gravity load of the ring bottom beam and the sidewall.
Within the support range of the sidewall and the cutting edge, the direction of Mv on the shaft wall with the ring bottom beam is opposite to that without the ring bottom beam. This reversal in direction indicates a change in the curvature of the shaft wall, likely due to the presence of the ring bottom beam. In terms of the magnitude of values, the ring bottom beam does not appear to improve the vertical distribution of Mv in the lower part of the shaft wall. Instead, it increases the local bending moment in some regions due to changes in the thickness of the concrete structure. This increase in local bending moment may be a concern, as it can lead to higher stresses and potential for cracking or failure in those regions. It is important to monitor and analyse these changes in bending moment distribution carefully to ensure the structural integrity and stability of the shaft. Further design optimisation or reinforcement measures may be needed to mitigate the negative impact of the ring bottom beam on the bending moment distribution.
After comparing the interactions between M1 and M2, we discovered a significant discrepancy near the top of the sidewall between the conditions with and without the ring bottom beam. Consequently, we chose the cross-sectional elements of the shaft wall as the focus of our study to analyse the mechanical alterations induced by the ring bottom beam, as depicted in Figure 14. This analysis was conducted by converting rectangular coordinates to polar coordinates, utilising the average stress across the section to capture the interactions.
The hoop stress is oriented tangentially along the shaft wall (Figure 14a), revealing that with the presence of the ring bottom beam, the internal forces within the shaft wall exhibit a predominantly symmetrical pattern, albeit with minor variations in intensity along the polar axis (Figure 14b). However, in the absence of the ring bottom beam, a notable discrepancy emerges; the hoop stress is considerably higher on the M1 side (180°) compared to the M2 side (0°), reaching values of 3.9 MPa and 2.7 MPa, respectively. Conversely, without the ring bottom beam, these values drop to 1.5 MPa and 1.8 MPa. Notably, at the same section position, the hoop stress without the ring bottom beam is 1.2 MPa to 2.3 MPa higher than that with the beam.
The radial stress, oriented perpendicularly to the hoop stress (Figure 14a), reveals that the ring bottom beam does not mitigate but potentially augments this stress, resulting in an uneven distribution (Figure 14c). This unevenness stems from pressure variations caused by the pillars connected to the sidewalls, though the differences are relatively minor, ranging from 0.04 MPa to 0.18 MPa.
When considering the bending moments along the studied section, the majority of values with a ring bottom beam are negative, indicating an opposite orientation compared to that shown in Figure 14a. In the absence of the ring bottom beam, the bending moments reach negative peaks at 45° and 135°, and positive peaks at M1, 90°, and M2, spanning a range of −40.8 kN·m to 30 kN·m (Figure 14d). In contrast, with the ring bottom beam, the bending moments range from −14.8 kN·m to 8.4 kN·m. Clearly, the inclusion of the ring bottom beam significantly improves the distribution of bending moments in the horizontal direction of the shaft wall, effectively reducing the extreme values by approximately 65%.

5. Discussion

Soft clay is extensively distributed in Shanghai. Due to its high viscoplasticity and low permeability, the construction speed of projects for underground space structures significantly impacts soil deformation. The longer the construction period, the greater the soil deformation. Compared to other methods, the on-site assembly technology and excavation speed of the VSM method in soft clay are significantly faster. Furthermore, the VSM method is an undrained operation; it minimizes disturbance to the surrounding environment, as demonstrated by our numerical analysis and monitoring data. Consequently, the safety and stability of the shaft during construction are higher, and surrounding soil collapse or excessive shaft tilting was observed in this project after completion. It is advisable to raise the water table in the shaft or control the density of the internal slurry to reduce settlement, and to adjust the parameters of the bentonite grout promptly to mitigate lateral deformation of the soil when excavating to the stratum interface, thereby ensuring construction safety. However, since underwater conditions are not visible, encountering boulders or hard rock layers may cause damage to the cutting drum or the suction pump or lead to blockages, resulting in extended construction duration. Such issues are a technical limitation of the VSM method.
Numerical results indicate that while the reinforced zone effectively controls deformation, significant soil deformation below the reinforced zone during subsidence makes deformation control difficult, and conventional reinforcement methods are not always effective. Thus, the thickness and depth of the reinforced zone should be carefully calculated prior to construction. Although the ring bottom beam improves the stress and deformation near the cutting edge and reduces the amount of plain concrete for bottom sealing, its economic performance in this project is not favorable. The deformation results indicate that the improvement is relatively minor. Therefore, the application of this structure should be considered with caution for small or medium-sized caissons.

6. Conclusions

To gain a better understanding of the mechanical responses of the adjacent soil and shaft wall during the sinking process and to analyse the practical implications of reinforcement measures, this study conducted a comprehensive numerical simulation. The simulation outcomes highlight the following key findings:
The reinforced zone demonstrates excellent control over soil deformation and stability. Once the shaft passes through this zone, however, the rate of soil deformation and expansion of the plastic zone accelerate significantly, which results in the soil strength below the reinforced zone decreasing due to greater stress release, causing reduced soil stability. Therefore, it is advisable to reduce the excavation speed and intensify monitoring efforts subsequently.
While enhancing the soil strength within the reinforced zone (ranging from 0.6 MPa to 1.4 MPa in unconfined compressive strength) does not significantly impact soil and pile deformation, it can effectively minimize the plastic zone volume surrounding the shaft. For cost efficiency, the numerical analysis results recommend maintaining the soil-cement’s unconfined compressive strength at approximately 1 MPa for this project.
The ring bottom beam has no impact on the upper shaft wall’s deformation or the lower section’s overall offset. However, it significantly reduces the convergent deformation of the lower shaft wall (up to 50% in our case study) and vertical axial force (with reductions ranging from 100 kN to 654 kN). Nevertheless, it does not optimise vertical bending moment or radial stress on the shaft wall during sinking, and may even intensify local vertical bending moment distribution. This aspect should be carefully considered during design. On the positive side, the ring bottom beam notably reduces hoop stress and horizontal bending moment in the adjacent shaft wall, and the volume of plain concrete used is also reduced. However, achieving a balance between mechanical optimisation and economic feasibility remains a design challenge.
The success of this project demonstrates that the VSM method is highly suitable for large and deep shaft sinking in soft soils. Additionally, it has the advantages of requiring less space and generating less noise, making it particularly advantageous and promising in congested urban areas. The VSM method stands apart from conventional methods in several key aspects, and these features yield a unique stress mechanism, but current research in this domain is still limited. Future research could involve detailed studies on optimal pile structure, the thickness of plain concrete, and the stress effect on segment joints.
Based on the numerical results, this project strictly controlled the sinking rate during construction, increased the frequency of monitoring and measurements, and managed the tilting of the shaft. The timely replenishment of slurry inside the shaft effectively controlled the deformation of both the soil and the piles. It is recommended that for similar projects, a detailed design of the thickness and depth of the reinforced zone and the structural parameters of the ring bottom beam can be completed before construction, and finite element analysis should be performed if necessary.

Author Contributions

C.M.: Conceptualization, Methodology, Writing—original draft; H.H.: Investigation, Writing—review and editing; L.Y.: Validation, Supervision, Writing—review and editing; K.L. and J.H.: Conceptualization, Methodology. All authors have read and agreed to the published version of the manuscript.

Funding

This research was funded by Science and Technology Project of Guangzhou Municipal Construction Group Co., Ltd. (BH20230317604, BH20230315563); Research Project of Department of Housing and Urban Rural Development of Guangdong Province (2023-K9-240562).

Data Availability Statement

Some or all data, models, or code that support the findings of this study are available from the corresponding author upon reasonable request.

Conflicts of Interest

Author Chunjing Ma was employed by the company Guangzhou Municipal Engineering Group Co., Ltd. Authors Haijian Hong and Jiadong Huang were employed by the company Guangzhou Municipal Construction Group Co., Ltd. The remaining authors declare that the research was conducted in the absence of any commercial or financial relationships that could be construed as a potential conflict of interest.

References

  1. Luo, W.; Lin, H.; Huang, W.; Zhou, X.; Zhang, Z. Undrained Sinking Caisson Construction Technology of a 28.4 m Deep Well in Soft Soils. Spec. Struct. 2022, 39, 113–119. [Google Scholar]
  2. Krauze, K.; Boloz, L.; Wydro, T. Mechanized Shaft Sinking System. Arch. Min. Sci. 2018, 63, 891–902. [Google Scholar] [CrossRef]
  3. Neye, E.; Burger, W.; Rennkamp, P. Rapid Shaft Sinking. Min. Rep. 2013, 149, 250–255. [Google Scholar] [CrossRef]
  4. Abdrabbo, F.; Gaaver, K. Challenges and Uncertainties Relating to Open Caissons. J. Deep. Found. Inst. 2012, 6, 21–32. [Google Scholar] [CrossRef]
  5. Peng, F.; Dong, Y.; Wang, H.; Jia, J.; Li, Y. Remote-Control Technology Performance for Excavation with Pneumatic Caisson in Soft Ground. Autom. Constr. 2019, 105, 102834. [Google Scholar] [CrossRef]
  6. Matsumoto, T.; Gomi, N.; Ikemi, Y. Process for Improving Open Caisson, SS Caisson Process; Open Keson No Kairyo kohoSS Keson Koho. Denryoku Doboku Electr. Power Civ. Eng. 1997, 5, 100–102. [Google Scholar]
  7. Tanimura, D.; Ueda, J.; Tani, Y. Large-Scale Vertical Shaft Excavation Using Super-Open Caisson System. Construction of Tamasato Vertical Shaft (Ishioka Vertical Shaft No. 5); Jidoka Open Caisson Koho Ni Yoru Daikibo Tatekui No Kussaku. Tamasato Tateko (Ishioka Dai5 Tateko) Shinsetsu Koji. Kensetsu No Kikaika 1998, 9–14. [Google Scholar]
  8. Wang, Y.; Liu, M.; Liao, S.; Yi, Q.; He, J.; Liu, L.; Gong, Z.; Li, K. Investigation on the Stratigraphic Response and Plugging Effect Induced by Press-in Open Caisson in Mucky Soil. KSCE J. Civ. Eng. 2023, 27, 1928–1941. [Google Scholar] [CrossRef]
  9. Tani, Y.; Nakano, M.; Okoshi, M.; Maeda, S.; Isa, H. Research & Development of Automatic System for Open Caisson Method. In Proceedings of the 13th International Symposium on Automation and Robotics in Construction, Tokyo, Japan, 11–13 June 1996; pp. 323–332. [Google Scholar]
  10. Peila, D.; Viggiani, G.; Celestino, T. Tunnels and Underground Cities. Engineering and Innovation Meet Archaeology, Architecture and Art: Proceedings of the WTC 2019 ITA-AITES World Tunnel Congress (WTC 2019), 3–9 May 2019, Naples, FL, USA; CRC Press: Boca Raton, FL, USA, 2019. [Google Scholar]
  11. Kwong, J.; Sandefur, K.; Nishimura, J. Geotechnical Engineering Aspects of Deep Microtunneled Pipeline Crossings of Honolulu Harbor in Very Soft Sediments. In Proceedings of the Pipelines 2017: Condition Assessment, Surveying, and Geomatics, Phoenix, AZ, USA, 6–9 August 2017; ASCE Press: Reston, VA, USA, 2017; pp. 482–493. [Google Scholar]
  12. Frenzel, C.; Delabbio, F.; Burger, W. Shaft Boring Systems for Mechanical Excavation of Deep Shafts. In Proceedings of the Second International Symposium on Block and Sublevel Caving, Australian Centre for Geomechanics, Perth, Australia, 20–22 April 2010; pp. 289–295. [Google Scholar]
  13. DeMerchant, M.R.; Kierstead, R.D. Evolution of the ARC-100 Reactor Building Design; ARC Clean Technology Canada Inc.: Saint John, NB, Canada, 2023. [Google Scholar]
  14. Jiang, H. A Summary of Precast Technology Application in Tunneling. Proceedings of Geo Shanghai 2018 International Conference: Tunnelling and Underground Construction, Shanghai, China, 27–30 May 2018; Springer: Berlin/Heidelberg, Germany, 2018; pp. 749–756. [Google Scholar]
  15. Huang, M.; Zhang, Z.; Xu, J.; Jiang, H.; Bao, H.; Liu, X. Measuring of Shaft Wall Stress in Caisson Construction Process Based on Vertical Shaft Sinking Machine: A Case Study of Caisson-Type Underground Intelligent Parking Garage Project in Nanjing, China. Tunn. Constr. 2022, 42, 1033–1043. [Google Scholar]
  16. Jiang, H.; Bao, H.; Lin, Y. Research and Application of Design and Construction Technology of Assembled Shaft: A Case Study of a Sinking Shaft Underground Parking Garage in Nanjing, China. Tunn. Constr. 2022, 42, 463–470. [Google Scholar]
  17. Zhou, J.; Liu, C.; Xu, J.; Zhang, Z.; Li, Z. Deformation Mechanism and Control of In-Situ Assembling Caisson Technology in Soft Soil Area under Field Measurement and Numerical Simulation. Materials 2023, 16, 1125. [Google Scholar] [CrossRef]
  18. Stevens, F.; Weiner, S. Deep Tunnel Sewerage Systems Singapore’s Success Story. Water Sanit. Afr. 2022, 17, 19–23. [Google Scholar]
  19. Fu, H.; Xu, Y.; Cheng, L. Overview of the Research Hotspots of China’s Shaft Boring Machine. Mine Constr. Technol. 2023, 44, 83–88. [Google Scholar]
  20. Ma, C.; Hong, H.; Wen, W.; Yu, W.; Pei, H. VSM Technology and Equipment for Shaft Sinking and Its Engineering Applications. Mine Constr. Technol. 2024, 45, 10–15. [Google Scholar]
  21. Xu, G.; Xiao, W.; Zhao, F.; Qi, Z.; Lyu, D.; Zhao, Z. Structural Design of a Kind of Caisson Submerged Shaft Boring Machine. Tunn. Constr. 2022, 42, 145–153. [Google Scholar]
  22. Schmäh, P. Vertical Shaft Machines. State of the Art and Vision. Acta Montan. Slovaca 2007, 12, 208–216. [Google Scholar]
  23. Schmäh, P.; Berblinger, S. VSM Shaft Sinking Technology—Mechanized Shaft Sinking with the VSM in Different Projects for Subway Ventilation Shafts. In Proceedings of the World Tunnelling Congress, Foz do Iguaçu, Brazil, 9–15 May 2014. [Google Scholar]
  24. Rahimi, M.; Rajmohan, A.; Spasojevic, A.; Scheele, J.; Cabot, E.; Ho, K.-S.; Ball, S. Geotechnical Considerations of Deep Mine Shaft, Sinking by Combined VSM and Drill & Blast Construction Methodology. In Proceedings of the GeoCalgary 2022: The 75th Annual Canadian Geotechnical Society Conference, Calgary, AB, Canada, 2–5 October 2022. [Google Scholar]
  25. Royston, R.; Sheil, B.B.; Byrne, B.W. Monitoring the Construction of a Large-Diameter Caisson in Sand. Proc. Inst. Civ. Eng. Geotech. Eng. 2022, 175, 323–339. [Google Scholar] [CrossRef]
  26. Templeman, J.O.; Phillips, B.M.; Sheil, B.B. Cutting Shoe Design for Open Caissons in Sand: Influence on Vertical Bearing Capacity. Proc. Inst. Civ. Eng. Geotech. Eng. 2023, 176, 58–73. [Google Scholar] [CrossRef]
  27. Guo, M.; Dong, X.; Li, J. Study on the Earth Pressure during Sinking Stage of Super Large Caisson Foundation. Appl. Sci. 2021, 11, 10488. [Google Scholar] [CrossRef]
  28. Chu, J.; Ma, J.; Jiang, B.; Li, M.; Zhang, K. Experimental Study on Side Friction Distribution of Caissons during Sinking in Water. Chin. J. Geotech. Eng. 2019, 41, 707–716. [Google Scholar]
  29. Yan, F.; Shi, G. Analysis of Limiting Soil Resistance beneath Cuttingcurb during Sinking Ofopen Caisson. Rock. Soil. Mech. 2013, 34 (add 1), 80–87. [Google Scholar]
  30. Royston, R.; Sheil, B.B.; Byrne, B.W. Undrained Bearing Capacity of the Cutting Face for an Open Caisson. Géotechnique 2022, 72, 632–641. [Google Scholar] [CrossRef]
  31. Chavda, J.T.; Mishra, S.; Dodagoudar, G.R. Experimental Evaluation of Ultimate Bearing Capacity of the Cutting Edge of an Open Caisson. Int. J. Phys. Model. Geotech. 2020, 20, 281–294. [Google Scholar] [CrossRef]
  32. Mu, B.; Bie, Q.; Zhao, X.; Gong, W. Meso-Experiment on Caisson Load Distribution Characteristics During Sinking. China J. Highw. Transp. 2014, 27, 49–56. [Google Scholar]
  33. Gaudio, D.; Madabhushi, S.G.; Rampello, S.; Viggiani, G.M. Experimental Investigation of the Seismic Performance of Caisson Foundations Supporting Bridge Piers. Géotechnique 2022, 74, 892–906. [Google Scholar] [CrossRef]
  34. Wang, W.; Wang, H.; Xu, Z. Experimental Study of Parameters of Hardening Soil Model for Numerical Analysis of Excavations of Foundation Pits. Rock. Soil. Mech. 2012, 33, 2283–2290. [Google Scholar]
  35. Yang, L.; Zhou, L. Experimental Study of Parameters of HS Model for Numerical Analysis of Foundation Pits in Ningbo Soft Soil Area. Tunn. Constr. 2018, 38, 954–962. [Google Scholar]
  36. Itasca Consulting Group, Inc. Fast Language Analysis of Continua in 3 Dimensions, Version 6.0, User’s Mannual; Itasca Consulting Group, Inc.: Minneapolis, MN, USA, 2017. [Google Scholar]
  37. Brinkgreve, R.B. Selection of Soil Models and Parameters for Geotechnical Engineering Application. In Soil Constitutive Models: Evaluation, Selection, and Calibration, Proceedings of the GeoFrontiers 2005, Austin, Texas, 24–26 January 2005; American Society of Civil Engineers: Reston, VA, USA, 2005; pp. 69–98. [Google Scholar]
  38. Schanz, T.; Vermeer, P.; Bonnier, P.G. The Hardening Soil Model: Formulation and Verification. In Beyond 2000 in Computational Geotechnics, 1st ed.; Routledge: London, UK, 1999; pp. 281–296. [Google Scholar]
  39. Ma, J.; Wang, Y.; Li, H.; Wang, G. Study on the relations of cement-Soil parameters with compressive strength. Build. Sci. 2009, 25, 65–67. [Google Scholar]
  40. Li, J.; Liang, R. Research on compression strength and modulus ofdeformation of cemented soil. Rock. Soil. Mech. 2009, 30, 473–477. [Google Scholar]
  41. Liang, Z.; Li, Z.; Liu, J.; Weng, X.; Li, W. Strength analysis and experimental research on soil-cement mixed pile made by triaxial stirring machine. Chin. Joumal Undergr. Space Eng. 2009, 5, 1562–1566. [Google Scholar]
  42. Li, J.; Wang, S. Indoor experimentation and analysis of soil-and-cement tensile strength. J. Hebei Inst. Archit. Sci. Technol. 1998, 15, 35–38. [Google Scholar]
  43. Sun, Y.; Shi, D. Test study to determine the tensile strength of cement-Soil. Struct. Eng. 2003, 6, 70–73. [Google Scholar] [CrossRef]
Figure 1. VSM set-up for the studied project.
Buildings 14 02402 g001aBuildings 14 02402 g001b
Figure 2. Structural design (a) side view; (b) top view.
Buildings 14 02402 g002
Figure 3. Geometry and reinforcement structures (a) side view; (b) top view; (c) support structures.
Buildings 14 02402 g003
Figure 4. Hyperbolic stress–strain relation in primary shear loading.
Buildings 14 02402 g004
Figure 5. Comparison of numerical values with monitored values: (a) surface settlement; (b) horizontal displacements of piles and soils along the depth.
Buildings 14 02402 g005
Figure 6. Displacements (m) in the vicinity of the shaft in (a) horizontal direction (x-axis); (b) horizontal direction (y-axis); (c) vertical direction (z-axis).
Buildings 14 02402 g006
Figure 7. Vertical displacements (m) and plastic zone volume (m3) in the vicinity of the shaft.
Buildings 14 02402 g007
Figure 8. Stress distribution with depth at S1: (a) horizontal stress (b) vertical stress.
Buildings 14 02402 g008
Figure 9. Mechanical response of the piles: (a) vertical displacement; (b) horizontal displacement; (c) axial force; (d) bending moment.
Buildings 14 02402 g009
Figure 10. Displacement change at monitoring points by varying qu: (a) vertical displacement along the L1 direction; (b) horizontal displacement with depth at S1.
Buildings 14 02402 g010
Figure 11. Changes in volume of plastic zone by varying qu.
Buildings 14 02402 g011
Figure 12. Comparison of shaft wall displacement with and without the ring bottom beam. (a) deformation of shaft wall with ring bottom beam (deformed factor: 200); (b) deformation of shaft wall without ring bottom beam (deformed factor: 200); (c) horizontal displacement of monitoring lines; (d) convergent displacement with depth.
Buildings 14 02402 g012
Figure 13. Interactions in the shaft wall elements along ML1 and ML2: (a) vertical axial force Fv, and (b) vertical bending moment Mv.
Buildings 14 02402 g013
Figure 14. Interactions of the studied section of the shaft wall with and without the ring bottom beam: (a) hoop stress σθ, radial stress σρ and bending moment Mh and their positive directions; (b) σθ distribution in the studied section; (c) σρ distribution in the studied section; (d) Mh distribution in the studied section.
Buildings 14 02402 g014
Table 1. Examples of VSM application.
LocationDiameter/(m)Depth/(m)Geological ConditionFunctionality
Neapel, Italy4.550Clay, silt, sand, gravelventilation
Girona, Spain6–1020Loamy coarse-grained clay, sandy clay, marl, driftstonemetro
Dortmund, Germany923Sand, silt, marltube jacking tunnel launch
St. Petersburg, Russia8.485Clay, sand, driftstonesewerage
Moscow, Russia6.430–73Sand, lime, clayventilation
Seattle, USA9.845Clay, silt, sand, gravelshield tunnel launch
Hawaii, USA10.836.2Coral, basaltharbor
Kuwaiti8.815–27Sand, colluvium, clayey sandy soil, limestonetube jacking tunnel launch
Jeddah, Saudi1145Soft soil, clayey sandy soil, sand, gravelsewerage
Singapore11.257Limestone, sandstone, mudstonesewerage
Nanjing, China12.865Clay, silt, sandstoneunderground parking
Shanghai, China (Case study)22.650.5Mucky clay, silty clay, medium silty sandunderground parking
Table 2. Comparison of load-bearing characteristics of different construction methods.
Load TypeGeneral MethodSSPress-inSOCSCJMVSM
Lateral loadSinking process:Lateral earth and water pressureLateral earth and water pressure, lateral gravel pressureLateral earth and water pressureLateral earth and water pressure, internal water pressureLateral earth and water pressure, slurry pressure, equipment loadLateral earth and water pressure, slurry pressure, internal water pressure, strut shoe load
drained condition:Lateral earth and water pressure
Sinking resistanceLateral friction, cutting edge resistance, buoyancyRolling friction resistance of gravel, cutting edge resistance, buoyancyLateral friction, cutting edge resistance, buoyancyLateral friction, cutting edge resistance, suspension forceLateral friction, cutting edge resistance, buoyancy, suspension force
Sinking loadSelf-weightSelf-weight
(+press-in force)
Self-weightSelf-weight
(+press-in force)
Vertical load after completionBuoyancy, self-weight, lateral friction, uplift pile resistance (if any)
Table 3. Parameters of structures.
StructureShaft WallRing FoundationReinforced ZoneRing Support BeamPlain Concrete
Bulk modulus, K/[MPa]1.92 × 1041.8 × 1043141.8 × 1041.75 × 104
Shear modulus, G/[MPa]1.44 × 1041.35 × 1042351.35 × 1041.3 × 104
Cohesion, c/[kPa]--177--
Friction angle, φ/[°]--28--
Density, ρ/[kg/m3]25002500190025002350
Table 4. Key parameters of the soils.
SoilsMucky ClaySilty ClayClayey SiltFine Sand
Reference stress, pref/[kPa]100100100100
Poisson’s ratio, ν/[MPa]0.30.30.30.25
Cohesion, c/[kPa]82411.84
Friction angle, φ/[°]11212834
Dilatancy angle, Ψ/[°]0004
Secant Young’s modulus at reference stress,   E 50 r e f /[MPa]8.318.913.841.1
Unloading-reloading secant Young’s modulus at reference stress, E u r r e f /[MPa]37.813297.5164.4
Oedometric   tan gent   modulus   at   reference   stress ,   E o e d r e f /[MPa]18.422.516.841.1
Exponent in the power law, m0.950.90.70.5
Normal consolidation coefficient, Knc0.810.640.530.44
Failure ratio, Rf0.90.90.90.9
Table 5. Equivalent parameters for unconfined compressive strength.
Qu [Mpa]E [Mpa]c [kPa]φ [°]σt [kPa]
0.642613127110
0.856517728137
1.071020427162
1.285228528185
1.499429034208
Disclaimer/Publisher’s Note: The statements, opinions and data contained in all publications are solely those of the individual author(s) and contributor(s) and not of MDPI and/or the editor(s). MDPI and/or the editor(s) disclaim responsibility for any injury to people or property resulting from any ideas, methods, instructions or products referred to in the content.

