Article

A Reliability-Based Design Approach for the Flexural Resistance of Compression Yielded Fibre-Reinforced Polymer (FRP)-Reinforced Concrete Beams

by
Dharinee Ramamoorthy
1,
Bingcheng Guo
1,*,
Syed Minhaj Saleem Kazmi
1,2 and
Yufei Wu
2
1
School of Engineering, RMIT University, 124, La Trobe Street, Melbourne, VIC 3000, Australia
2
Guangdong Provincial Key Laboratory of Durability for Marine Civil Engineering, Shenzhen University, Shenzhen 518060, China
*
Author to whom correspondence should be addressed.
Buildings 2024, 14(8), 2415; https://doi.org/10.3390/buildings14082415
Submission received: 26 June 2024 / Revised: 16 July 2024 / Accepted: 29 July 2024 / Published: 5 August 2024
(This article belongs to the Section Building Structures)

Abstract

:
Fibre-reinforced polymer (FRP) reinforcement has been employed as an alternative to conventional steel reinforcement in concrete structures, which is attributed to its excellent strength and corrosion resistance. However, one drawback is that FRP reinforcements are brittle and affect the ductility of concrete structures. One of the recent effective techniques proposed to overcome ductility issues is the compression yielding (CY) concept. The CY mechanism allows the structure to fail differently than the conventional FRP-reinforced concrete structure. Thus, the existing design recommendations as per the current codes for FRP-reinforced concrete structures are not appropriate. Hence, reliability studies are crucial for the development of a functional CY beam design in order to emphasise the structure’s lifetime performance and to guarantee safety requirements. In this study, a reliability-based design approach is developed for a compression-yielded FRP-reinforced concrete beam (CY beam) using load and resistance factor design (LRFD). Firstly, the flexural failure modes of CY beams are discussed. The uncertainties involved in the development of the probabilistic model for the CY beam are defined. A case study is consequently conducted for a CY beam with random variables that are associated with the statistical characteristics of material properties and load. The reliability analysis method employed in this research is the Hasofer–Lind method. The results suggest the importance of choosing appropriate design variables and stochastic parameters for CY blocks that contribute to a higher level of reliability. The reliability index and resistance factors of a CY beam are then evaluated using the Monte Carlo Simulation computational method. The reliability index value of 3.336 is obtained from the simulation, which indicates that the CY beam demonstrates ductile behaviour. The results not only demonstrate ductile behaviour but also contribute to a possible reduction in material costs and a substantial safety margin. When compared to conventional FRP-reinforced concrete beams, for different load ratios, CY beams showed higher resistance and better reliability levels.

1. Introduction

Fibre-reinforced polymer (FRP) composites have been increasingly applied in civil engineering structures over the past few decades due to their merits such as their corrosion resistance [1,2], durability [3], high tensile strength [4], cost-effectiveness [5], fabrication and extension of service time [6]. Since an FRP reinforcing bar has excellent corrosion resistance, it is a feasible alternative to conventional steel reinforcement, especially in the areas where steel reinforcement is prone to deteriorate due to seawater [7], de-icing salts and corrosives, leading to damage to the integrity of a concrete member [8,9]. The performance of fibres is mainly controlled by key factors, such as the type, the elastic modulus, the volume fraction, and the aspect ratio [8,9]. The rapid development and deployment of FRP reinforcement are also attributed to its high tensile strength, low thermal expansivity, and economical production [10,11]. The failure of FRP-reinforced concrete members in flexural mode is usually due to either concrete crushing or FRP rupture, which results in a brittle failure [9,12,13,14]. In order to improve the ductility of FRP-reinforced concrete members, various techniques have been used in the past, such as over-reinforcement [15], concrete confinement [16,17], the progressive rupture of reinforcement [18] and the debonding of reinforcement [19]. However, these methods are either complicated and costly, or ineffective with limited improvement in ductility [20]. At present, the only solution recommended by the American Concrete Institute [15] is to design FRP-reinforced concrete members with a higher strength reserve, i.e., to over-reinforce the members. However, an over-reinforcement design in bridge structures is usually unrealistic or impracticable in many circumstances, particularly for bridges with large spans.
Recently, a safe and cost-effective design concept for FRP-reinforced concrete beams was proposed by Wu et al. [21,22], which was called “compression yielding”. The compression zone of an FRP-reinforced concrete beam was substituted with a compression-yielding (CY) material [21], which acted as the structural fuse of the beam. The structural fuse could be triggered by the large flexural deformation at the fuse location when the beam is subjected to an excessive load, resulting in the formation of a plastic hinge. Using a structural fuse, it is possible to prevent overloading and achieve a more ductile structural behaviour for FRP-reinforced concrete beams. The ductility demand (i.e., the required ratio of ultimate displacement and yield displacement) for compression-yielded FRP-reinforced concrete beams (CY beams) was also studied by Wu et al. [23]. To date, two types of CY materials that meet the ductility requirement have been discovered, namely perforated slurry-infiltrated fibre concrete (P-SIFCON) blocks [21] and mild steel blocks with holes [24]. In addition, in the study conducted by Zhou et al. [25], the stress profile and strain profile for CY beams were analysed. Wu et al. [26] conducted an analytical study on the flexural resistance of a CY beam with strain-hardening CY material, and the design method was proposed. More recently, a CY block with strain-softening behaviour was considered in the study conducted by Guo et al. [27] on the analysis of the flexural resistance of CY beams.
At present, some ongoing research concentrates on the analytical study of CY beams [25,26], the experimental test of CY materials [21] and the cost analysis for CY beams [28]. However, there is very limited information available on the lifetime performance of the structure ensuring the safety requirements. Additionally, since the material uncertainties and failure mechanism of CY beams are completely different from conventional reinforced concrete structures and FRP-reinforced concrete structures, the design recommendations, e.g., those in AS3600 [29] and ACI440 [15], cannot be applied to CY beams. It is also worth noting that the factored values considered as per current design recommendations and construction costs are viewed as competing objectives. A reliability-based design is crucial to take into account some of the sources of uncertainty in design [30], to allow designers to rationally assess the possibility of structural failure [31,32] and in order to achieve a logical balance between safety and life cycle costs [33,34], and it is the basis of the wide application of new structures. Hence, this study aims to propose a reliability-based approach for the design of FRP-reinforced concrete beams with compression-yielding blocks.
To ensure the appropriate level of safety, partial safety factors are typically applied to loads and materials, along with resistance reduction factors employed in the design of reinforced concrete structures. For the limit state design of normal concrete structures, the partial safety factors range between 1.2 and 1.5 [35], depending on the load combinations under various collapse and serviceability criteria. For the reliability-based design approach, firstly, the design variables for the CY beam are identified, followed by a sequential reliability analysis employing the first-order reliability method (FORM) approach and Monte Carlo Simulation. This involves determining statistical parameters, constructing probability density functions for the variables under consideration, and assessing the reliability index value. The appropriate partial safety factors and resistance reduction factors for the CY beam design are then evaluated. The results of this study for a CY beam with a low-traffic pedestrian bridge highlight one of the notable benefits of CY beams, in comparison to conventional FRP-reinforced concrete beams, which is their ability to prevent brittle failure with a lower target reliability index. The study reveals the possibility of achieving greater design strength while utilising lower partial safety factors, which not only enhances the cost-effectiveness of the structure but also ensures its safety.

2. Compression-Yielded FRP-Reinforced Concrete Beam—Flexural Resistance

A typical CY beam that consists of a concrete beam, glass fibre-reinforced polymer (GFRP) bars at the bottom and steel bars at the top is shown in Figure 1. The CY block is placed in the centre of the compression side of the beam. To achieve ductile behaviour, the CY block shall yield before concrete crushing and FRP rupture. The detailed analysis method for the flexural resistance of the CY beam has been reported in [25,26]. The assumptions and the principal equations will be introduced in this section.
As shown in Figure 1, the effective depth, the concrete cover thickness, the height of the CY block and its relative length are d , τ d   , η d and a , respectively. To determine the moment resistance of the CY beam, a section analysis shall be conducted with the following assumptions [25,26]:
  • A perfect bond is assumed between the concrete and reinforcing bars (i.e., FRP and steel bars) in order to ensure proper load transfer from the reinforcement to the concrete.
  • A good contact is assumed between the CY block and concrete to eliminate the slipperiness between the CY block and concrete.
  • Any section of the beam is plane before deflection and will remain plane after deflection.
  • The tensile strength of concrete is ignored as the compression zone is the main zone of importance in the study.
The stress–strain relationship of the CY material is shown in Figure 2. f b and f b u are the yield strength and ultimate strength of the CY material, respectively, and f c is the compressive strength of concrete. ε b y and ε b u are the yield strain and ultimate strain of the CY material. E b is the elastic modulus of the CY material, and ξ is the post-yield modulus ratio ( ξ m i n is the minimum value of ξ , and ξ m a x is the maximum value of ξ ) . The constitutive model of steel is assumed to be elastic and perfectly plastic, while the model for FRP is assumed to be linearly elastic, and a triangular model is employed to describe the behaviour of concrete [25,26].
The distinct variation of the CY beam to that of the FRP-reinforced beam is the manner in which the structure fails. Therefore, it is crucial to take into account the failure modes of the CY beam when proposing reliability-based design recommendations. In order to show the failure modes, three typical moment–curvature response curves of the CY beam are shown in Figure 3. The type of curves is based on the post-yield modulus ratio ξ of the CY block [26]. The type I response curve ( ξ ξ 1 ) has a monotonically ascending trend and then it descends post peak response and before CY block failure. In the type II curve ( ξ 1 < ξ ξ 2 ) , after point B, the response curve declines until the minimum value M l m (point D) is reached. The CY beam has a lower moment resistance at its failure point (point C) compared to point B. In the type III ( ξ > ξ 2 ) response curve, the value of point C is greater than that of point B. The boundary values of the ratios ξ 1 and ξ 2 are derived from previous studies and provided in Appendix A [26]. In a CY beam design, the tensile failure of reinforcement and the concrete crushing in the compression zone at ultimate failure are prevented.
The peak moment ( M m ) at point B is the focus of this study as the aim is for the ultimate limit state functions. The three potential cross-section strain distributions at the peak of point B (Cases I, II and III) are shown in Figure 4. Based on the strain distributions at point B, the peak moment or flexural resistance of the CY beam is derived, and finding this flexural resistance is the key step for the reliability analysis. The CY material parameters are based on the strain distribution curve. In Figure 4, E f is the elastic modulus of the FRP, ε f m is the maximum allowable strain of FRP, and ε c m i is the strain at the concrete–CY block junction, where the subscript i -1,2,3 indicate Cases I, II and III, respectively. E c   is the elastic modulus of concrete, E b   is the elastic modulus of the CY block equal to f b / ε b y , ε b y is the yielding strain of the CY block, and f c   is the compressive strength of concrete.
At the onset of M m , the tension force ( F f ) of FRP bars and the curvature K m of the CY beam are given by Equations (1) and (2) [26].
F f = F f i = E s   ε s y   ρ s   b   d + 1 + β 1 i + β 2 i E b   ε b y   η   b   d + b ε c u f c 2 K e m i
K m = K m i = ε f m + ε c m i 1 η d
where
K e m i = K m i 1 n n 1   1 ε c m i ε c u 2 ,   ( for   Case   i = 1 ,   2 ) ;         K e m 3 = K m 3 ,   ( for   Case   i = 3 )
β 11   = ( ε c m 1 ε b y ) ξ ε b y ,   ( for   Case   i = 1 ) ;   β 1 i = ε b y ε c m i 2   2   η   d ε b y K m i ,   ( for   Case   i = 2 ,   3 )
β 21   = K m 1 η d ξ 2 ε b y ,   ( for   Case   i = 1 ) ;   β 2 i = K m i η d + ε c m i ε b y 2 ξ   2   η   d ε b y K m i ,   ( for   Case   i = 2 ,   3 )
where E s is the elastic modulus of the steel bar; ε s y is the yield strain of the steel reinforcement, ρ s is the compression steel reinforcement ratio, b is the breadth of the beam, d is the effective depth of the beam, η is the CY block height to beam depth ratio, ε c u is the crushing/ultimate strain of concrete, and K e m i is the equivalent curvature.
The peak moment ( M m ) or the flexural resistance ( R ) at point B in Figure 3 is given by Equation (6) [26],
M m = R = E s   ε s y   ρ s 1 τ b   d 2 + E b   ε b y   η   b   d   Z b i + b ε c u f c 2 K e m i Z c i
where
Z b 1 = 1 + β 11 1 η 2 d + β 21 1 η 3 d ,   ( for   Case   i = 1 )
Z b i = 1 η 2 d + β 1 i 1 η d + ε b y ε c m i 3 K m i + β 2 i { d K m i η d + ε c m i ε b y 3 K m i ,   ( for   Case   i = 2 ,   3 )
Z c i = 1 ( 3   η   ε o   ε c m i 2   ε c m i 3 3   n   ε o 2   ε c m i n   ε o 3 ) ε f m + ε c m i ( 6   n   ε c m i ε o 3   ε c m i 2 3   n   ε o 2 ) 1 η d ,   ( for   Case   i = 1 ,   2 )
Z c 3 = ( 3   n   ε f m + n + 1   ε c u ) 3 n   ( ε f m + ε c m 3 )   1 η d ,   ( for   Case   i = 3 )
where τ is the distance from the centroid of the steel reinforcement to the top fibre of the beam divided by d .
There are two possible failure modes for a CY beam: (1) failure mode I—CY block failure—in which the ultimate failure is governed by the attainment of the ultimate strain ε b u in any part of the CY block; and (2) failure mode II—the moment resistance drops below an allowable limit after reaching the peak and before CY block failure, i.e., the rate of moment drop (RMD) the limit of the moment drop ( δ d ) before CY block failure, where δ d is given by Equation (11).
δ d = M m M m i n M m
Here, M m i n represents the lowest resistance value, which is equivalent to M l m (at point D in type II and type III curves in Figure 3) or M u (at point C of the type I curve in Figure 3).

3. Reliability Analysis

The flexural resistance is the maximum force that a structure can sustain before it fails. In the below section, LRFD is first introduced. Then a simplified probabilistic model is established using the first-order reliability method (FORM). In addition, the target reliability index is introduced to analyse the material behaviour in the reliability analysis.

3.1. Load and Resistance Factor Design

Load and resistance factor design (LRFD) [36] focuses on evaluating the strength parameter and safety parameter for structure design, in which the strength parameter involves determining the resistance reduction factor which is nothing but the ratio of design resistance to nominal flexural resistance. This paper utilises the flexural resistance equation (Equation (6)) obtained from the literature to suit the current case study and determine the design resistance and the resistance reduction factor using the reliability analysis procedure. The reduced flexural strength of a CY beam shall be no less than the magnified load effects, which is expressed as Equation (12).
γ D D + γ L L   ϕ R  
Here, D is the nominal dead load, γ D the dead load factor, L the nominal live load, and γ L the live load factor. R is the nominal flexural resistance of the CY beam, and ϕ is the resistance reduction factor. Thus, the load factors and the resistance reduction factor can be expressed using design dead load ( D * ), design live load ( L * ), and design resistance ( R * ) as follows
γ D = D * / D
γ L = L * / L
ϕ = R * / R
To determine the load and resistance factors, the statistical parameters for the load component and CY beam resistance are required, including the mean value, standard deviation, coefficient of variation and bias factors. These parameters will be explained in detail under variable uncertainties in Section 3.4.

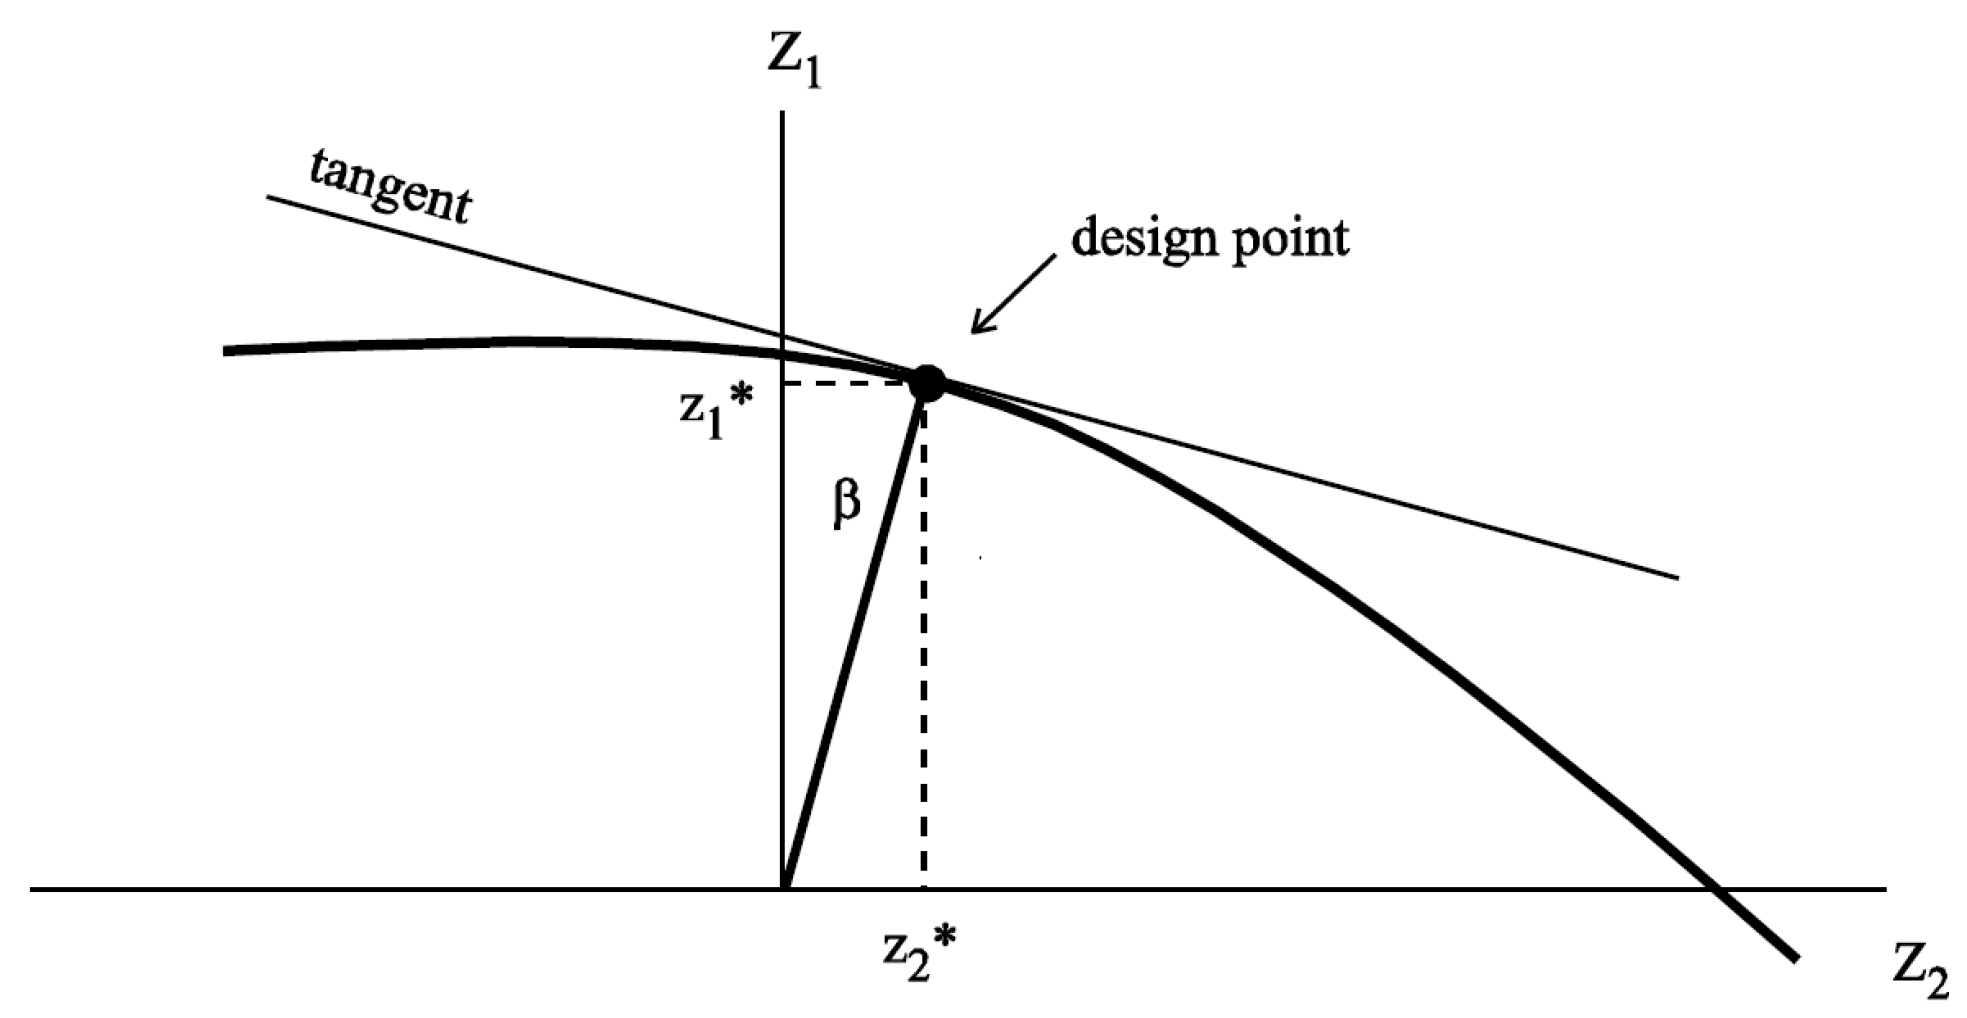
3.2. First-Order Reliability Method

The first-order reliability method (FORM) is one of the established semi-probabilistic reliability analysis approaches, which can be used to determine the index that indicates the level of reliability of a structural system [36]. The reason for using FORM in the current study is that it provides the sensitivity of the failure probability with respect to different input parameters, which is essential when optimising the reliability of the CY beam structure in design, construction and maintenance.
The reliability-based design approach considers the performance of a structure with respect to its design uncertainties during service life, which makes it more reliable than the conventional limit state and working stress methods. Also, the safety margins obtained by the reliability-based design approach are lower than those from the conventional limit state method, resulting in reduced material usage and subsequent cost savings during construction [37,38]. As the flexural resistance of CY beams is the focus of this study, the ultimate limit state is taken into consideration. The equation for the limit state function used for the reliability analysis, denoted by g , is given by Equation (16).
g = R Q
Here, Q = D + L , i.e., the combined load effect due to a dead load and a live load.
The probability of the failure of the CY beam ( P f ) can be described as the integral of the probability density function when g is smaller than 0, which is given by Equation (17).
    P f = P g R D L < 0 = R D L < 0 f R R f D D f L L d R d D d L = 1 Φ β
Here, P g is the probability of failure of random variables R , D and L ; f R R ,   f D D and f L L are the probability density functions for R , D and L , respectively; Φ is the cumulative distribution function of a standard normal random variable; and β is the reliability index. Thus, the reliability index of the structure can be defined from its relationship with the probability of failure as
    P f = Φ β
    β = Φ 1 ( P f )
For the limit state function in Equation (16), g = R Q , where R and Q are independent random variables, and then μ g = μ R μ Q and σ g 2 = σ R 2 + σ Q 2 where μ R = the mean resistance, μ Q = the mean load, σ R = the standard deviation of the resistance, and σ Q = the standard deviation of the load. Then, the reliability index can be calculated using the following formula from Cornell [39]:
β = μ R μ Q σ R 2 + σ Q 2
The relationship between the reliability index of the structure with the probability of failure can be pictorially depicted. The probability density space for the design variables considered is plotted with respect to CDF ( F Q , R ) showing the design point given in Figure 5.
The resistance, dead load and live load of design points [38,40] can be evaluated as
R * = μ R β σ R 2 σ R 2 +   σ D 2 + σ L 2
D * = μ D + β σ D 2 σ R 2 + σ D 2
L * = μ L + β σ L 2 σ R 2 + σ L 2
where μ R is the mean value of resistance, μ D and μ L are the mean values of the dead load and live load, respectively, σ R is the standard deviation of resistance, and σ D and σ L are the standard deviations of the dead load and live load, respectively.

3.3. Target Reliability Index

According to the study reported by Vrouwenvelder and Jonkman et al. [41,42], a higher failure consequence class should be assigned to the structural elements which would collapse suddenly without warning (brittle failure) compared to those with warnings (ductile failure). In general, lifetime target reliabilities ( β t ) for structural steel and RC elements in flexure vary from 3 to 4 [43]. The studies reported in [44,45] suggested that the common bridges and most residential buildings should be designed to have ductile failure mode and result in moderate failure consequences. It has been reported that RC beams that are retrofitted with CFRP bonded on the soffit had a strength reduction factor of 0.85 and a target reliability index ( β t ) value of 3.5 [32,46]. The ACI [47] model for an FRP-strengthened RC beam based on reliability analysis suggested a β t value of 3.5, and Chinese code (GB) [37,48] suggested a β t value of 3.2 for brittle failure and 3.7 for ductile failure. ISO 2394 [49] and Australia Standard AS 5104 [44] recommend a β t of 3.8 for the ultimate strength limit state design of RC beams where consequences of failure are great and the relative cost of safety measures is moderate. A target reliability index of 3.8 was used by Stewart and Lawrence [50] for unreinforced masonry walls in compression. Therefore, a variety of factors, including the type of failure, the relative cost for the consequence of failure, the cost of enhancing safety, and the current levels of safety, influence the value of β t . The β t value of 3.7 corresponding to ductile failure is compared to the reliability index of the CY beam in the subsequent sections.

3.4. Uncertainties Involved in Reliability Analysis

The uncertainties involved in the development of the probabilistic model for the CY beam are defined as model uncertainties, load uncertainties and design variable uncertainties, which will be explained in the sections below.

3.4.1. Model Uncertainties

In probabilistic analysis, the model uncertainties are caused by the approximations and assumptions made while using different possible models. Therefore, the determination of the potential magnitude of a model error holds paramount importance. The model error K R   [37] is denoted as the ratio of the experimental result M e x p   to the predicted value M p r e . The probability values, also known as the p-value, indicate that given a certain statistical measure, such as the mean or standard deviation, the assumed probability distribution will be larger than or equal to the actual results.
Since the studies on the CY beam are currently limited, in this study, the model error/uncertainty values are evaluated based on the test data for FRP-reinforced concrete beams collected from [37,51,52].
To ascertain the distribution of model error K R , the Kolmogorov–Smirnov (K-S) hypothesis test is conducted in this study for four distributions: normal, lognormal, Weibull, and extreme type I. The K-S test results of model error in flexural failure are provided in Table 1. The current assessment for model error and p-values interpreted are based on a screened test database with sets of test data for FRP-reinforced concrete beams determined according to published references. It is suggested that with future experimental testing of CY beams with the same failure mode, the values can be compared with the statistical characters, corresponding p-values and model error. As can be seen, the lognormal distribution yields the lowest error, leading to the acceptance of the hypothesis. Consequently, the model error can be represented by a lognormal distribution with a mean of 0.974 and a coefficient of variation (COV) of 0.158.

3.4.2. Load Uncertainties

In the reliability analysis, the uncertainties associated with various loads cannot be disregarded, which are evaluated based on the distribution-dependent bias and COV. In the LRFD approach, the design load ( S d ) is expressed as a function of the dead load and live load and given as
S d = γ D D + γ L L
The statistical data given in [37] for FRP-reinforced concrete beams are used in this investigation and are listed in Table 2.

3.4.3. Uncertainties of Design Variables

In this research, the bias, COV and distribution for the random variables of concrete, steel, FRP and geometrical properties are based on a screened test database with sets of test data for the flexural failure of FRP-reinforced concrete beams determined according to published references [37,51,52]. The probability parameters for the CY material are based on the experimental results of the perforated SIFCON blocks reported in the literature [23]. These values, although desirable, can have inconsistencies in determining the actual values of this material characteristic and provide no clear boundaries. A sensitivity factor is hence used in the subsequent Monte Carlo Simulation sections. The authors’ current detailed experimental studies can further verify the values. The statistical characteristics of the design variables and the loads are shown in Table 3.

4. CY Beam Reliability Analysis

In this section, the reliability analysis is conducted under the ultimate limit state using the FORM approach to evaluate the reliability index, resistance reduction factor and safety parameters for the CY beam. Both failure modes discussed in Section 2 are analysed using the importance sampling (IS) method. A comparison between the calculated reliability index and the target reliability index β t from the literature is performed, and a discussion is presented regarding the ductility behaviour of the CY beam. In addition, the calculated resistance reduction factor and partial safety factors for dead and live loads are compared with those for the conventional reinforced concrete beams and FRP-reinforced concrete beams recommended in the literature.

4.1. Design Case

In this reliability analysis, CY beams for pedestrian bridges are employed as an example to demonstrate the analysis process. The configuration of the CY beam is depicted in Figure 1. The CY beam is composed of four materials: FRP reinforcing bars, concrete, CY block and compression steel bars. The live load on a pedestrian bridge in a medium-traffic area is taken as L = 5   k N / m 2 according to AS 1170.1. As the focus of this study is on the evaluation of safety factors for CY beam design, only the vertical imposed load is considered in this example. Further research on girder bridges considering other load conditions such as wind and earthquake load will be conducted in the future. The geometric and material properties of the beam taken from previous experimental tests [26] are summarised in Table 4.
The flexural resistance ( R ) of the CY beam is calculated using Equation (6). This value along with dead load and live load taking into consideration their uncertainties are summarised in Table 5.

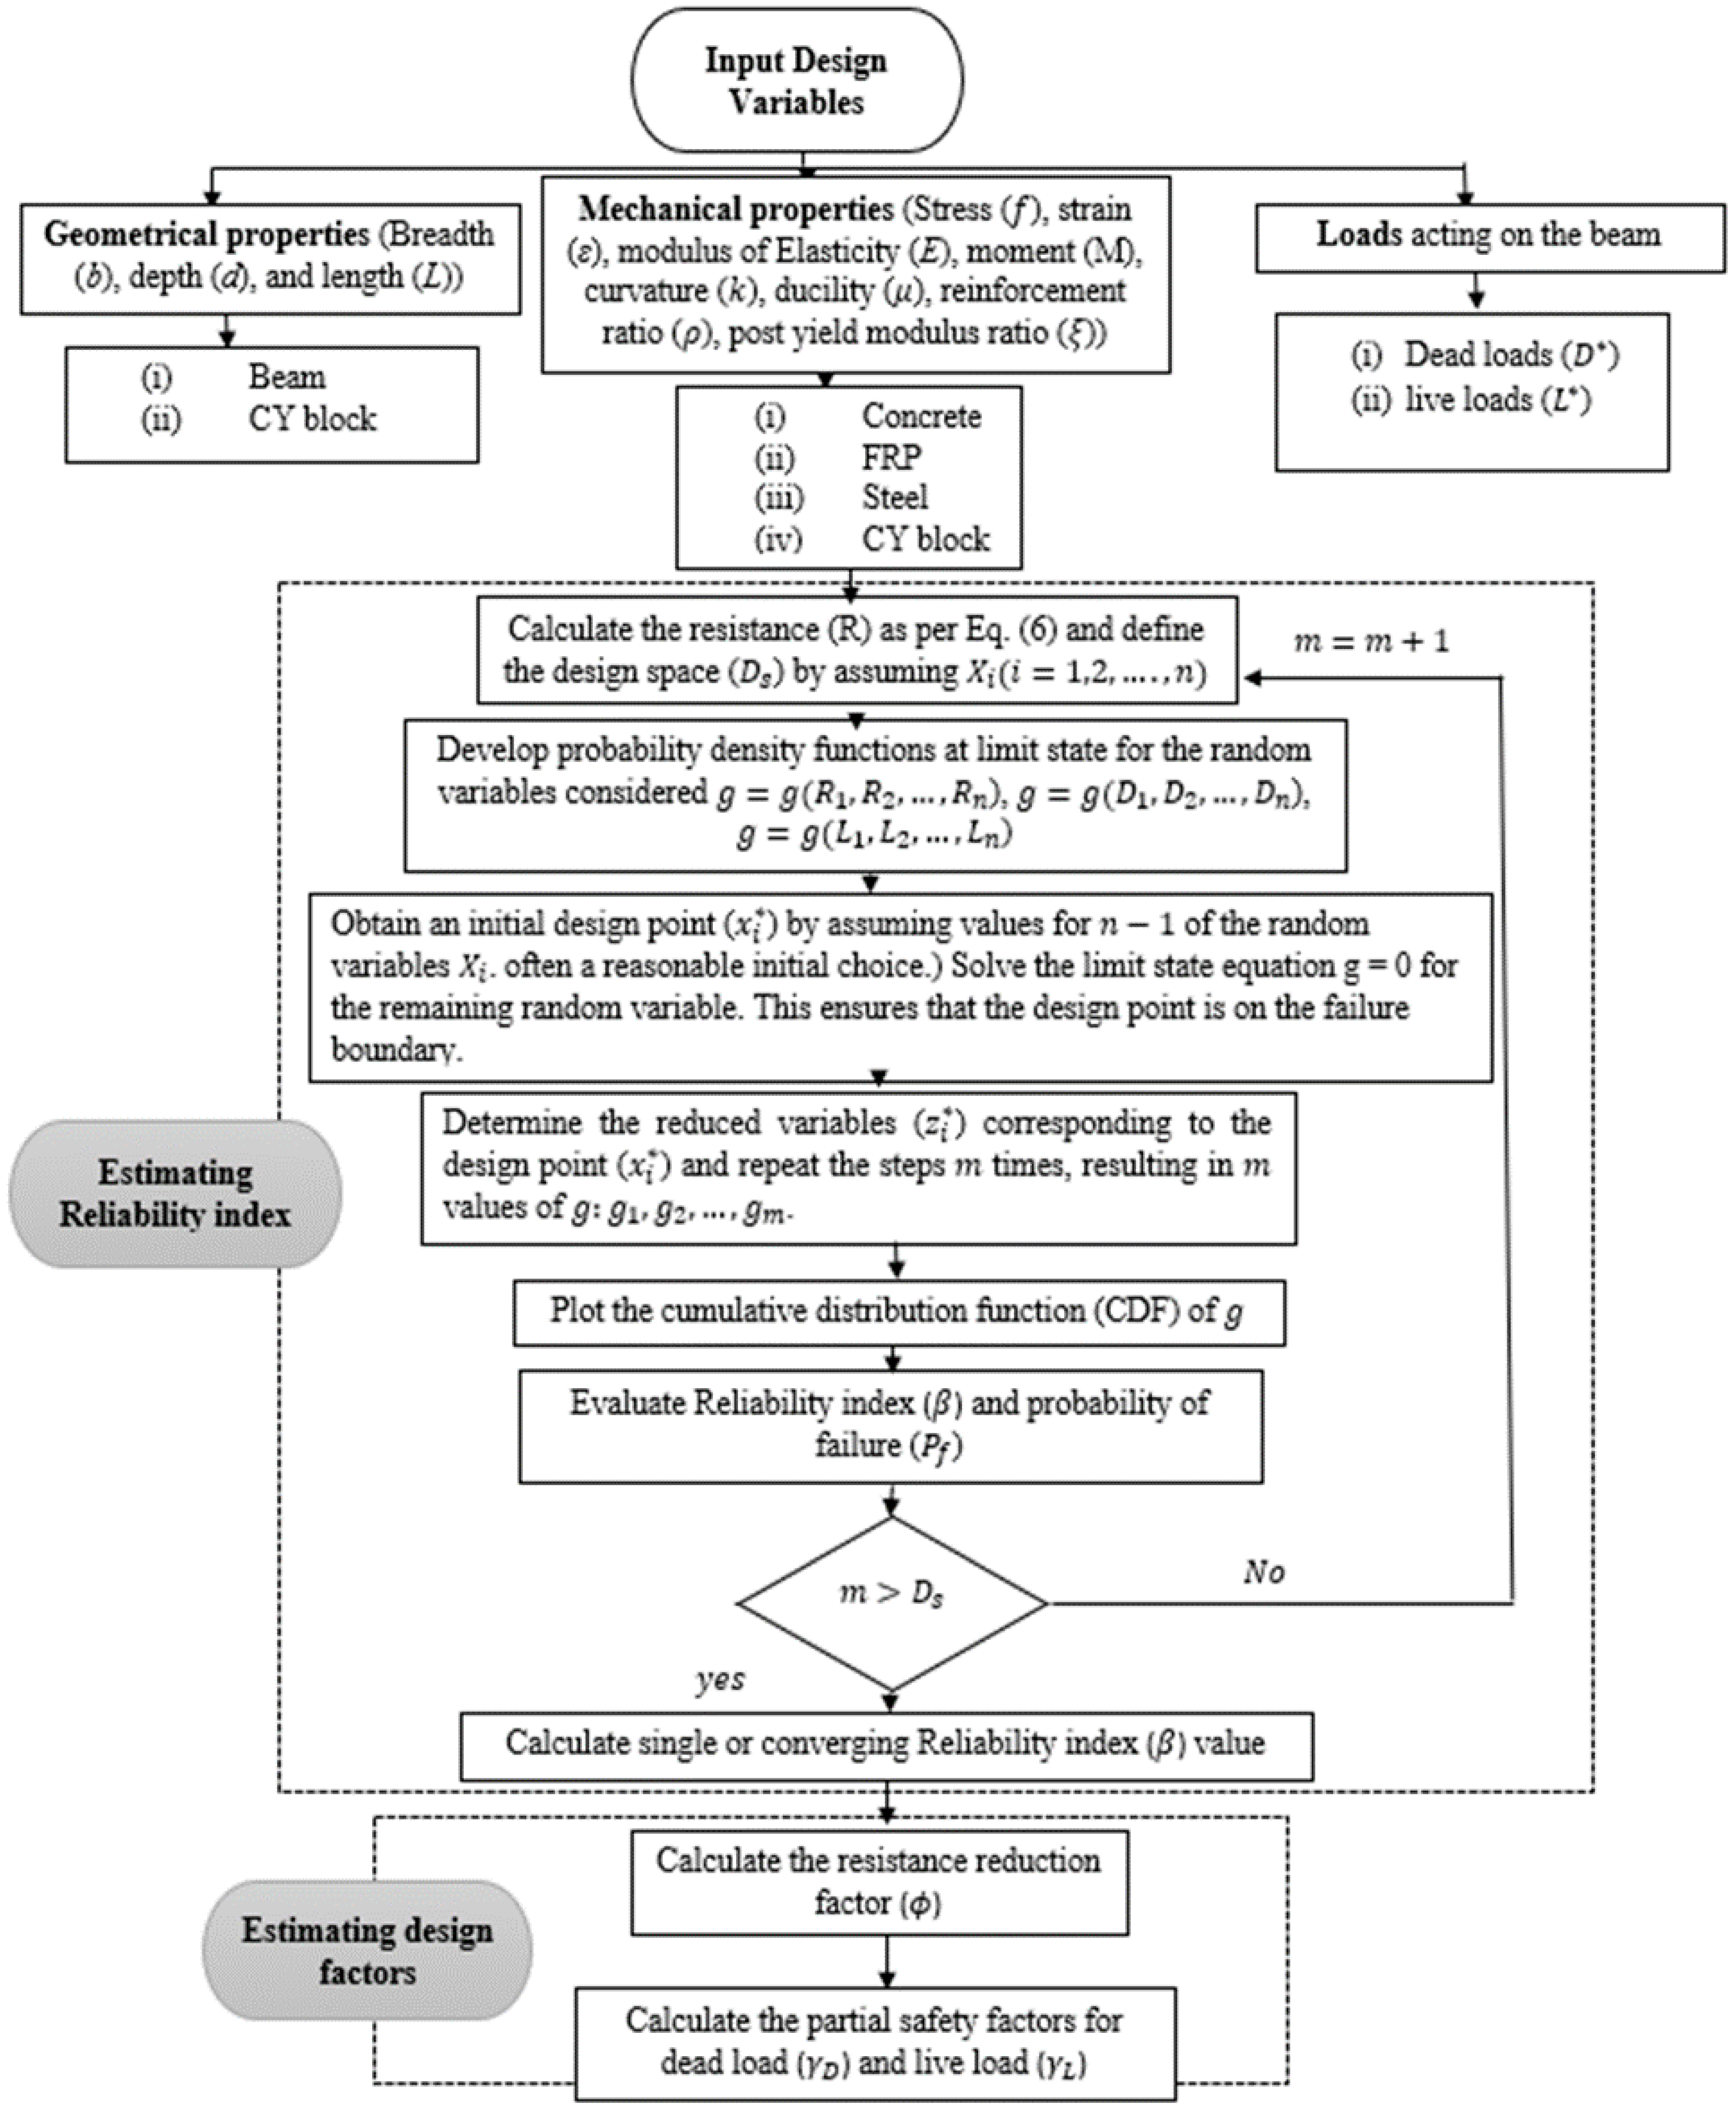
4.2. Reliability Analysis Procedure for the CY Beam

The reliability index can be derived by many methods, and in this research, the Hasofer–Lind method, a matrix procedure, is used to establish the influence of the material strength of the CY beam on the reliability index. Subsequently, a computational method using Monte Carlo Simulation is used to evaluate the reliability index and resistance factors of a CY beam.

4.2.1. Hasofer–Lind Method

Firstly, the flexural resistance of the CY beam is evaluated using Equation (6) considering the statistical parameters of all design variables in Table 3. For the limit state Equation (16), the resistance and loads are the design points that govern the safety boundary of the probability design space. In practical conditions, the design variables involved in the calculation of resistance are uncorrelated and may have a non-linear function or even sometimes they may be related. In these cases, iterations are required to find the design point in reduced variable space such that β still corresponds to the shortest distance (safe space). This is explained in the subsequent section along with the iterative analysis using the matrix procedure [30,38].
Consider a limit state function g X 1 , , X n where the random variables are X i . Each random variable X i has a corresponding reduced variable Z i where Z i = ( X i μ X i ) / σ X i , and replacing this in g X 1 , , X n yields a new limit state function as g Z 1 , , Z n = 0 . Thus, β is determined as the shortest distance between ( 0 , . . 0 )   and g Z 1 , , Z n = 0 in the reduced variable space. This is illustrated in Figure 6.
The iterative procedure requires us to solve a set of ( 2 n + 1 ) simultaneous equations with ( 2 n + 1 ) unknowns, (a) β , λ 1 , λ 2 , , λ n and (b) Z 1 * , Z 2 * , , Z n * , where
λ i = g Z i e v a l u a t e d   a t   d e s i g n   p o i n t k = 1 n ( g Z k e v a l u a t e d   a t   d e s i g n   p o i n t ) 2
The matrix procedure for the reliability analysis of the CY beam is presented below:
Step 1: Define the limit state function and specify the parameters that govern each random variable involving R i   ( i = 1,2 , . . . , n ) , D i   ( i = 1,2 , . . . , n ) and L i   i = 1,2 , . . . , n .
Step 2: Obtain a preliminary design point ( R i * ) through the assumption of values for n 1 of the random variables R i . Mean values are frequently a rational initial selection. Solve the limit state equation g = 0 pertaining to the random variable that remains. This guarantees that the design point coincides with the boundary of failure.
Step 3: Calculate the reduced variables ( Z i * ) that are associated with the design point ( R i * ) by employing
Z i * = R i * μ R i σ R i
Step 4: Calculate the limit state function’s partial derivatives in relation to the reduced variables. Define a column vector {G} comprising these partial derivatives multiplied by −1, for convenience:
G = G 1 G n ,     G i = g Z i R i *
Step 5: Perform similar calculations for random variables D i and L i .
Step 6: Calculate an estimate of β using the following formula:
β = { G } T { Z * } { G } T { G } ,     Z * = Z 1 * Z n *
Step 7: Calculate a column vector containing the sensitivity factors using
λ = { G } { G } T { G }
Step 8: Assign a new design point to n − 1 of the reduced variables by using
Z i * = λ i β
Step 9: Calculate the design point values in the original coordinates that correspond to the n − 1 values specified in Step 7
R i * = μ R i + Z i * σ R i
Step 10: In order to calculate the values of the remaining random variables (i.e., D i and L i ), repeat the steps by calculating the reduced variables that are associated with the design point ( D i * ) and ( L i * ).
Step 11: Repeat steps 3–9 until β and the design point ( R i * ) converge (i.e., the difference from the two results smaller than 10−6).

4.2.2. Monte Carlo Simulation

The matrix procedure was implemented in the context of limit state equations in which the random variables are uncorrelated. Nevertheless, in practice, certain random variables may be correlated for a CY beam. This correlation can have a significant impact on the reliability index. The Monte Carlo Simulation computational method is employed to address correlated random variables.
A step-by-step algorithm is presented here for carrying out the reliability analysis of a CY beam using Monte Carlo Simulation,
Step 1: A linear limit state function with n cases, denoted as R 1 ,   R 2 ,   ,   R n , D 1 ,   D 2 ,   ,   D n and L 1 ,   L 2 ,   ,   L n , is to be considered for each random variable presented in Table 5. R i , D i and L i are uncorrelated random variables that have known mean values, standard deviations and distributions. As a function of g = g ( R 1 ,   R 2 ,   ,   R n ), g = g ( D 1 ,   D 2 ,   ,   D n ) and g = g ( L 1 ,   L 2 ,   ,   L n ), the limit state function is defined.
Step 2: The preceding step is repeated X times (432 times in the current study) to create a reduced variable for each random variable g :   g 1 ,   g 2 ,   ,   g X .
Step 3: The design points are calculated from the reduced variables generated from the Taylor series. The values are then plotted with respect to the cumulative distribution function (CDF) of g on the normal probability paper (Figure 7a,b), and in case the CDF of g is too short, then either X is increased or we must extrapolate (Figure 7c) to determine β and P f values.
Step 4: Further, the reliability index value obtained from Equation (19) can be validated with the results obtained for the probability of failure P f calculation using MCS.

5. Results and Discussion

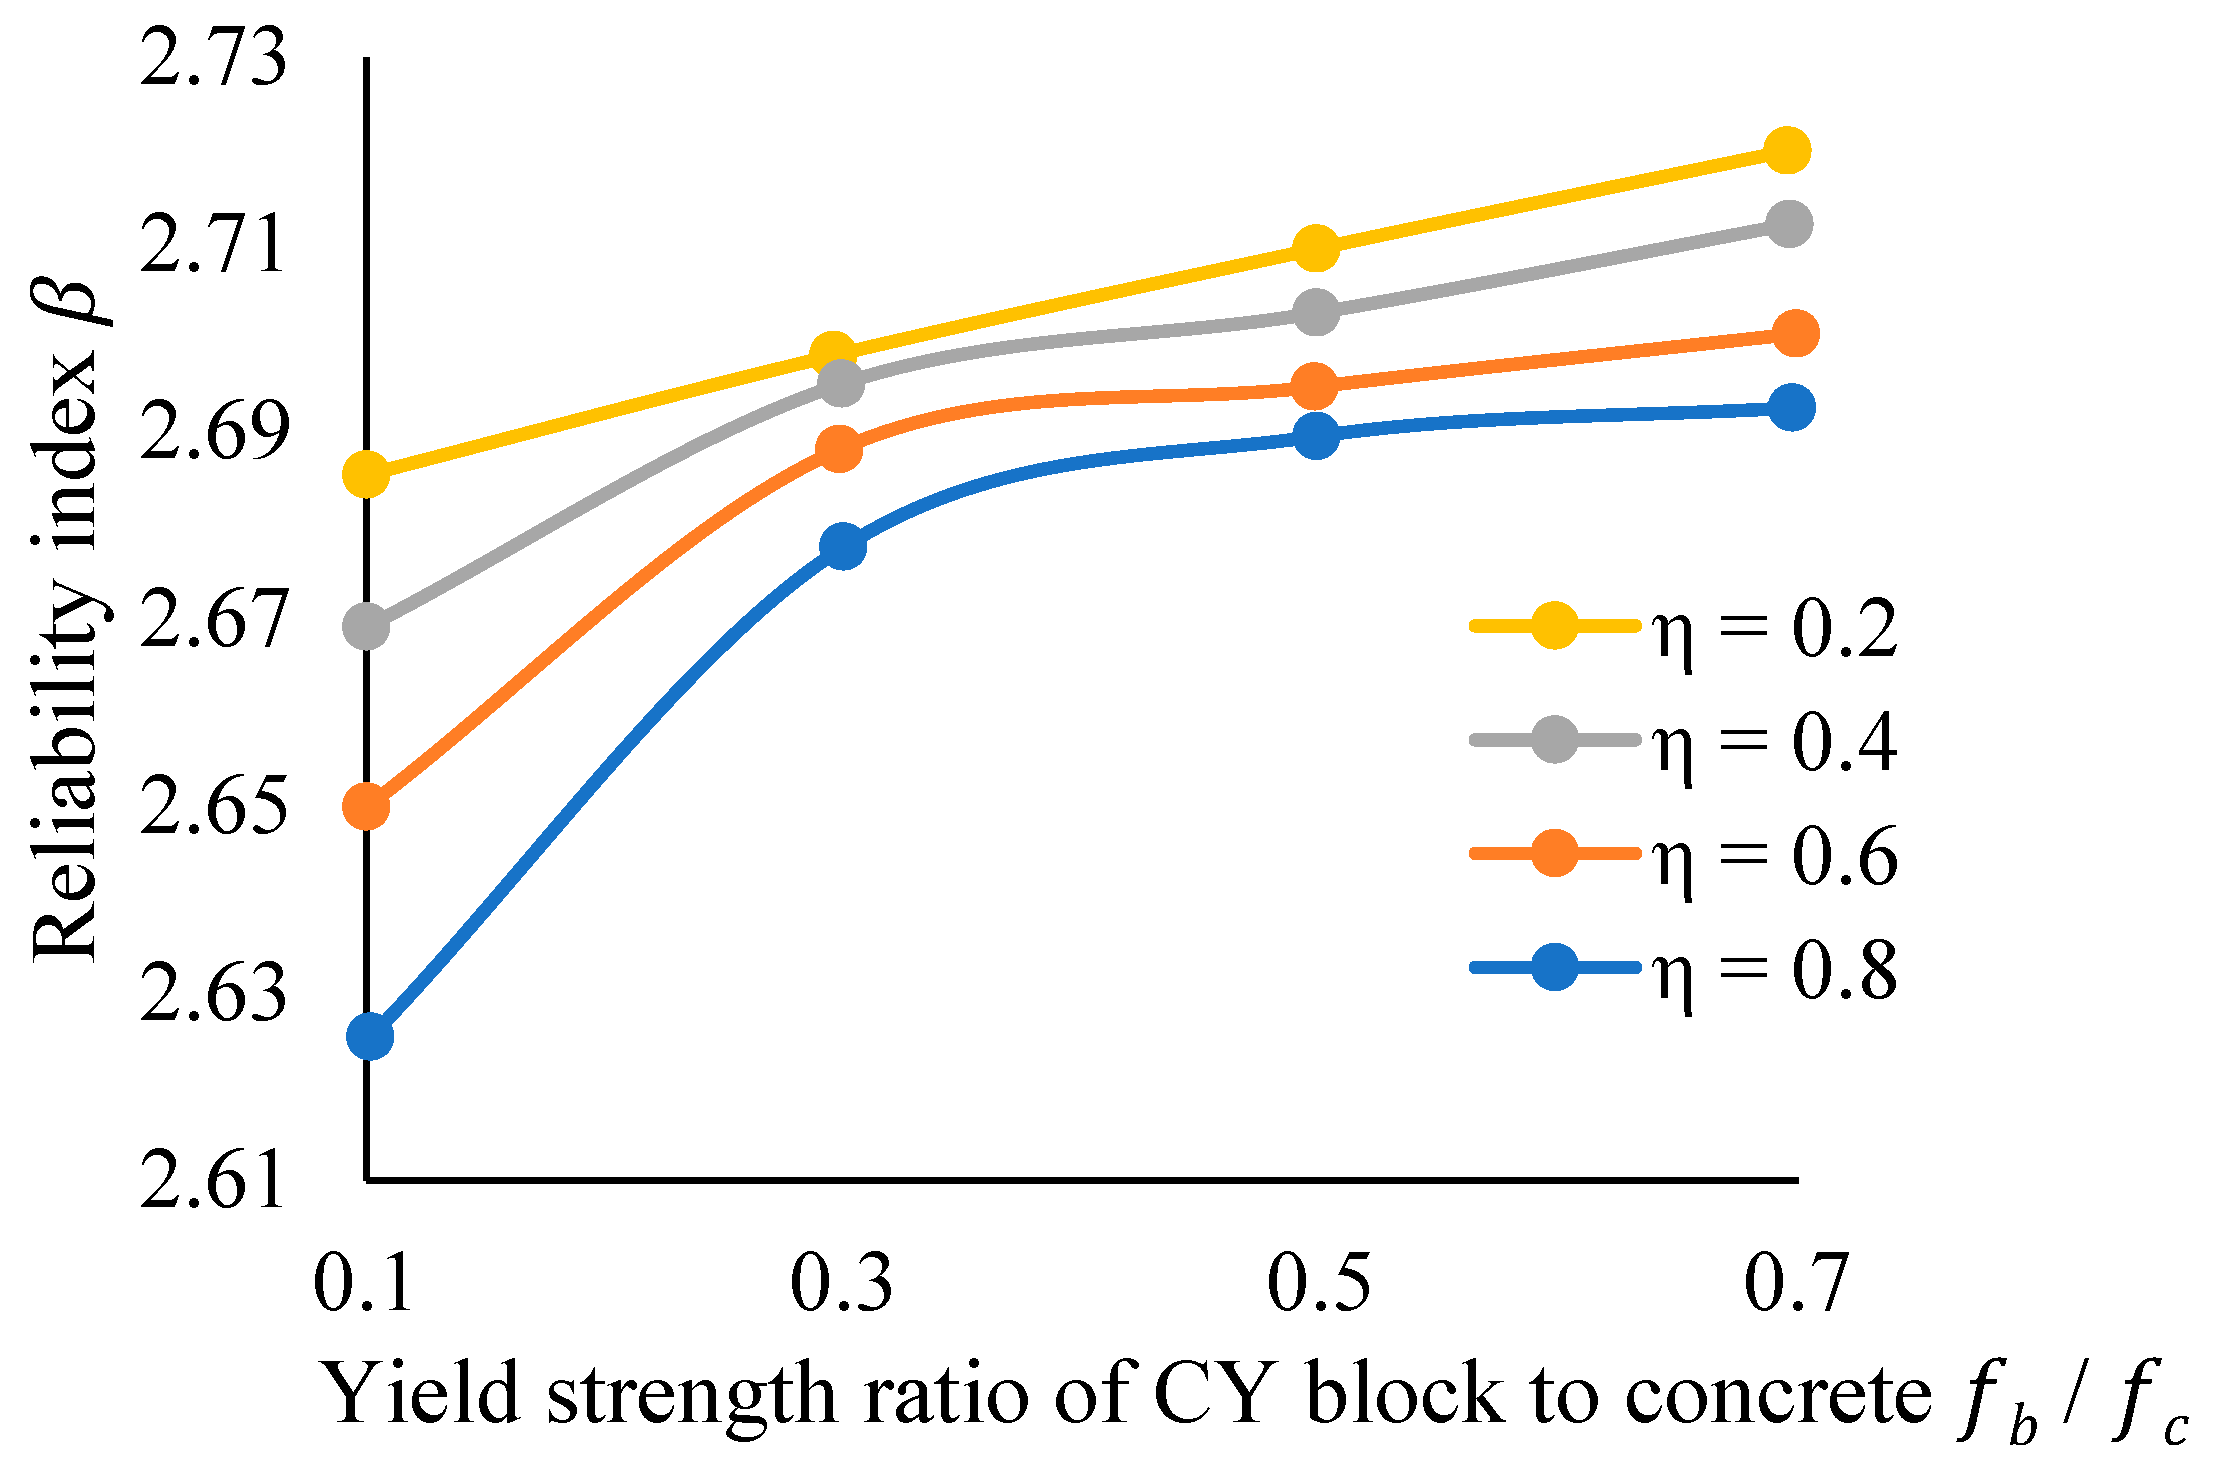
5.1. Matrix Procedure to Find Influence of Material Strength

As explained in Section 4.2.1, the matrix procedure is employed to understand the influence of the material strength of a CY block on the reliability index ( β ). The limit state function is developed considering the yield strength ratio of the CY block ( f b ) and concrete ( f c ) as random variables. By substituting the values in Equation (1) and expressing it as a limit state function in terms of ( f b ) and ( f c ),
g f b , f c = 8.744 f b + 15.70 f c
Assuming an initial design point of f b * = 40.4 MPa, then from g = 0 , f c * = 22.5 after estimating the initial design point. By applying the matrix procedure to solve the equation, the values of the reduced variables are computed as follows:
Z 1 * = f b * μ f b σ f b = 1.61 ;     Z 2 * = f c * μ f c σ f c = 2.65
Now, the partial derivatives of the limit state function with respect to the reduced variables are determined and defined as column vector {G}
G 1 = 8.744 σ f b ;   G 2 = 15.70 σ f c
By using Equation (29), the β value is obtained,
β = { G } T { Z * } { G } T { G } = 24.15 18.38 T 1.61 2.65 24.15 18.38 T 24.15 18.38 = 2.69
Then, a column vector containing the sensitivity factors is calculated using
λ = { G } { G } T { G } = 0.64 0.73
The new design point for the reduced variables is now calculated using
Z 1 * = λ 1 β = 0.98 2.69 = 2.64
Then, the corresponding design point values in original coordinates for the n − 1 values is calculated as
f b * = μ b + Z 1 * σ b = 63
Iterations are continued until the value of β and the design point converge. A graph is plotted with the yield strength ratio of the CY block to concrete in the x-axis and the reliability index in the y-axis for different ratios of the CY block height to beam depth shown in Figure 8. The reason for studying the deviation with respect to ratio of the CY block height to beam depth is that, from the authors’ current experimental studies, it is observed that the strength of the beam is affected by the changes in the geometry of the CY blocks. It can be seen that the trends corresponding to η follow a similar ascending pattern when plotted for the reliability index and yield strength ratio. It is observed that for η = 0.8 , the β value increases steadily for a strength ratio between 0.1 and 0.3 after which it slows down or otherwise converges as the difference between the reliability levels is smaller. This indicates that the influence of the CY block depth is critical for design purposes and is effective at particular embedding depths. The resulting variations between η = 0.2 and η = 0.8 is also an indication that higher-strength CY blocks are more reliable. Additionally, it is observed that when η = 0.2 and η = 0.8 , the β values decrease as η increases which signifies that a smaller ratio of CY block height to the overall beam depth has a better reliability level. Thus, varying the CY block height to beam depth ratio ( η ) not only influences the strength of the beam but also its relationship with the reliability index.

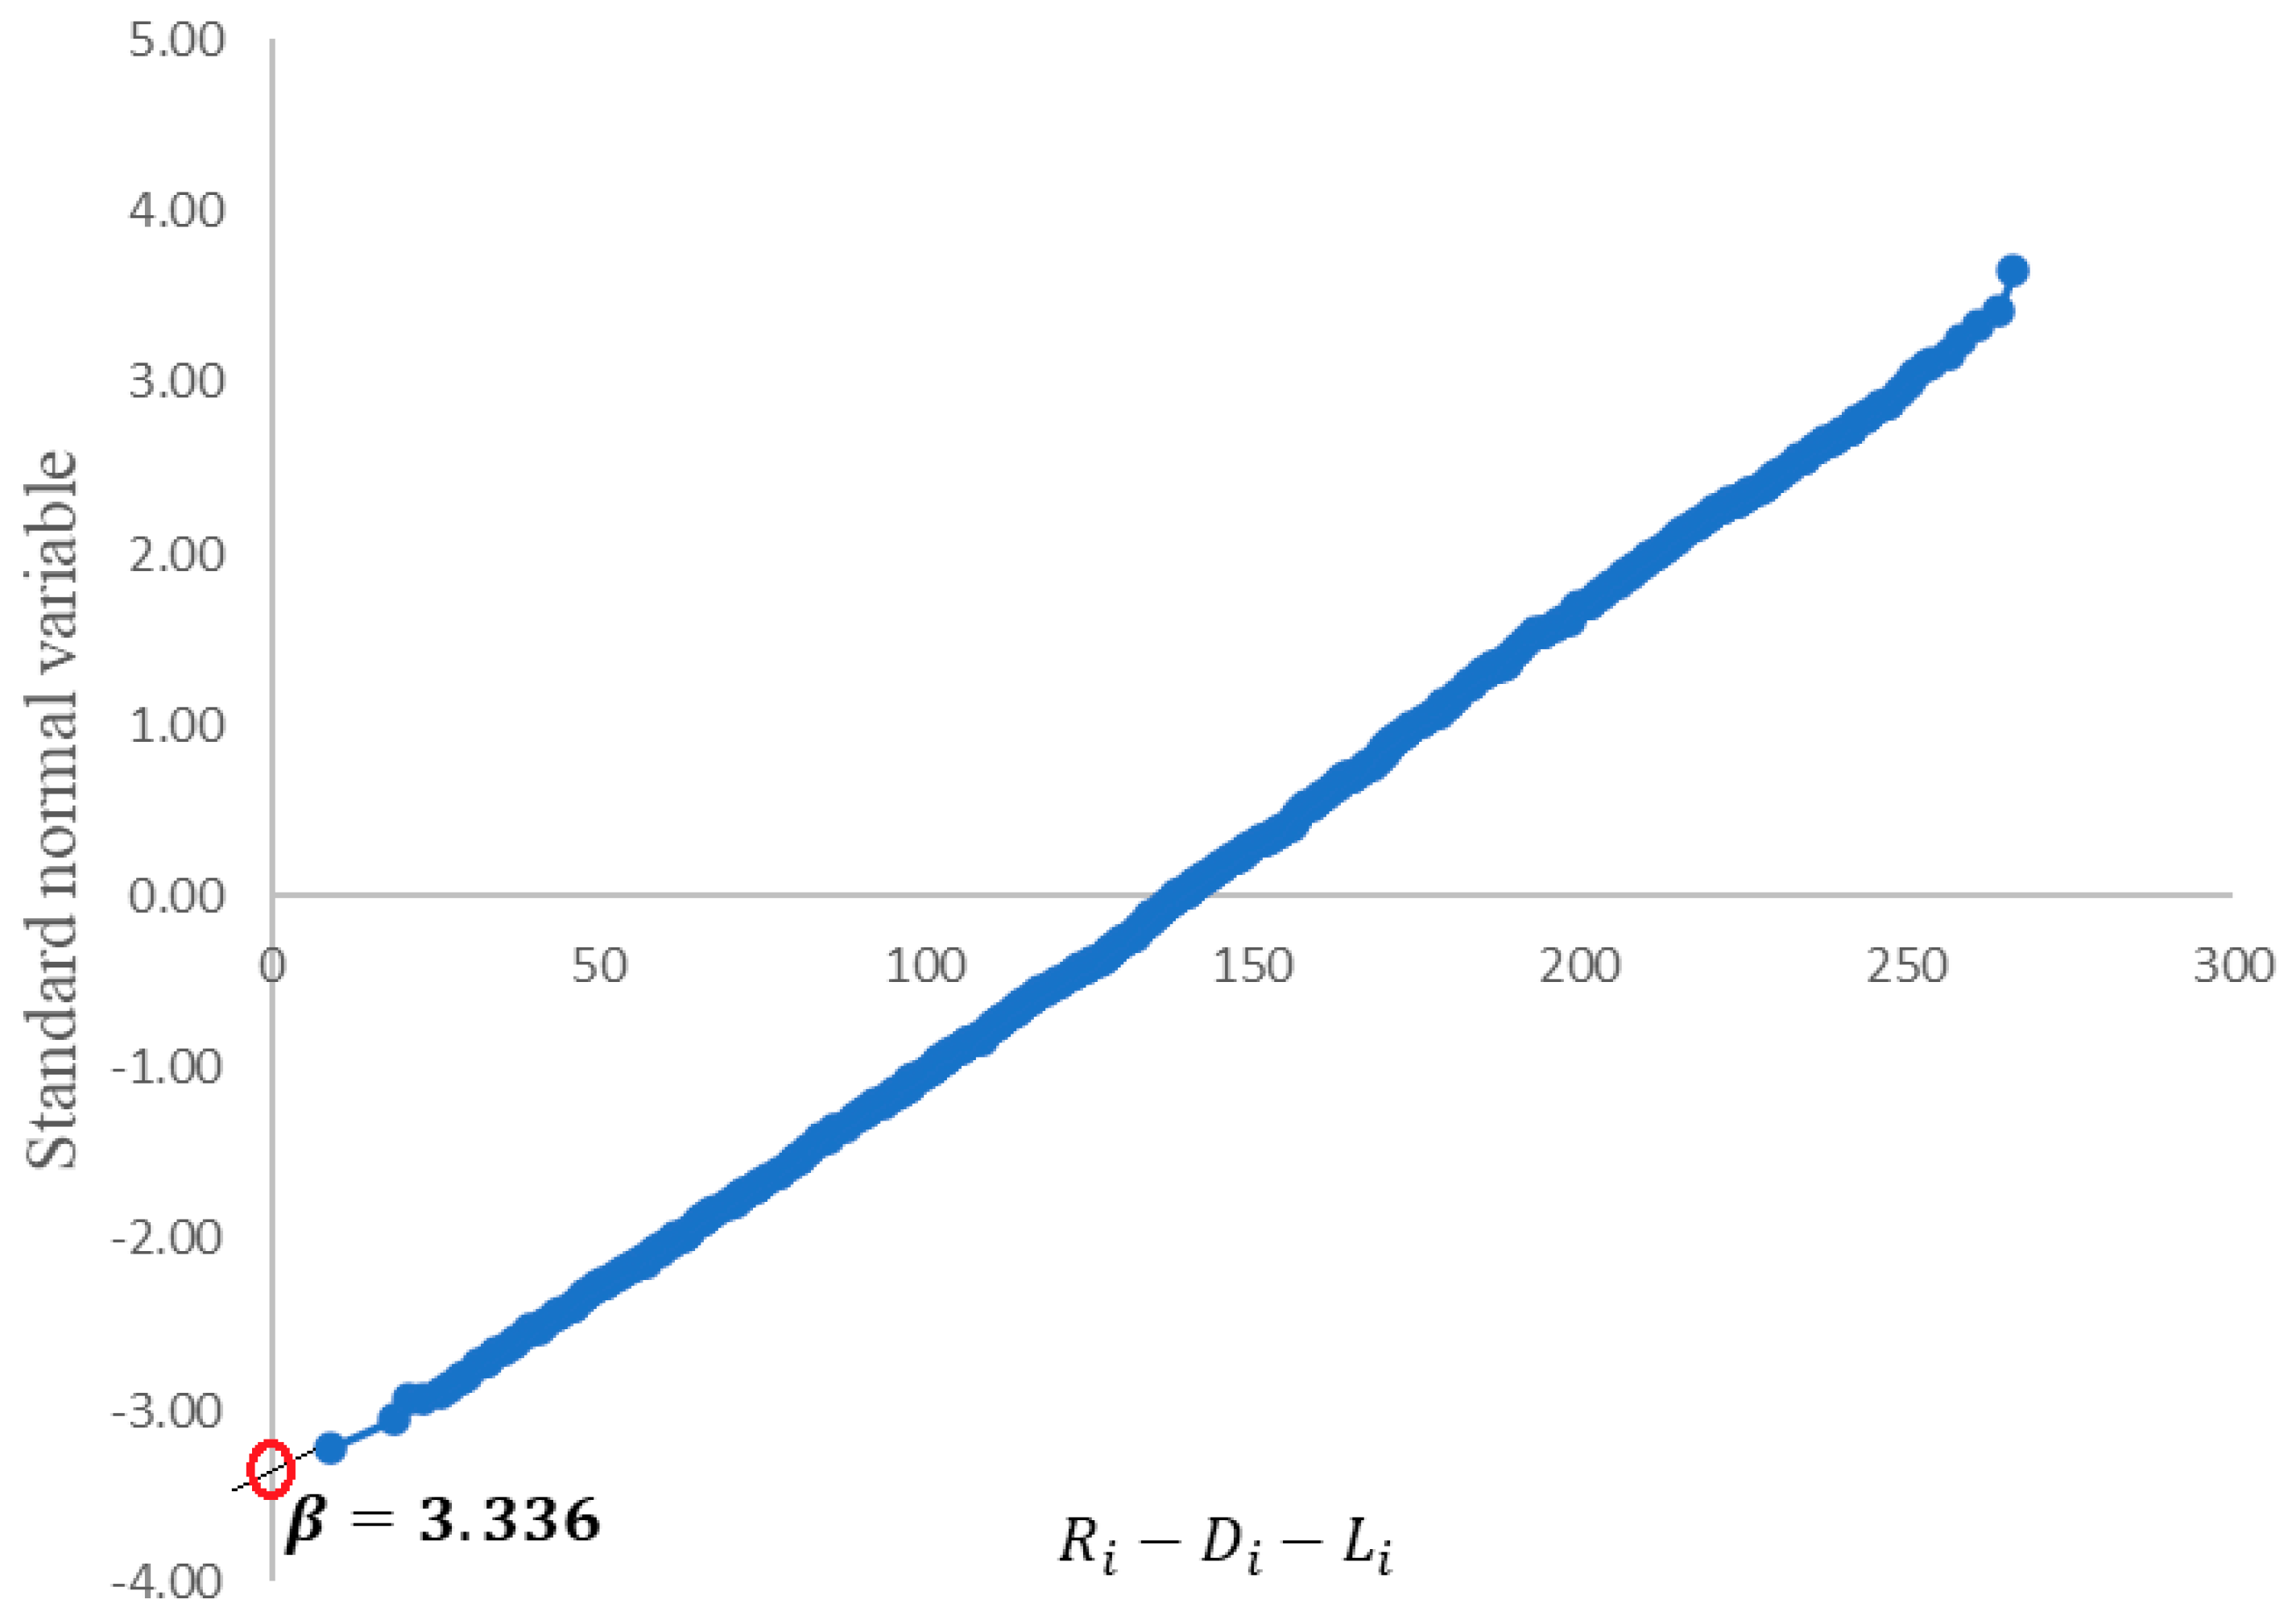
5.2. Monte Carlo Simulation to Find Reliability Index

In this research, Monte Carlo Simulation explained in Section 4.2.2 is carried out for the CY beam with a total of 432 runs as the values were observed to converge after that. For a complex problem with wind and seismic load cases, a greater number of runs might be essential. In total, 30 out of 432 runs of the analysis are presented in Table 6 for reference.
Here, i random numbers are generated using a similar function in Excel, D i are the dead load variables generated from i random numbers, Z i are the reduced variables, L i are the live load variables generated from i random numbers, R i are the resistance variables generated from i random numbers, X values are the random variables defined in previous sections, and R i D i L i is also nothing but denotes the probability of failure. As per Equation (19), Φ 1 of the probability of failure can generate the values of the reliability index. The results are plotted in normal probability paper (Figure 9) with standard normal variables in the y-axis with respect to the function of R i D i L i in the x-axis. It is observed the cumulative distribution function falls short and hence X is extrapolated which yields a reliability index value of β = 3.336 . The probability of failure is thus calculated as P f = 0.0020 . It is also observed that the β value is close to the β T value of 3.5 [47], which corresponds to ductile failure in the literature. This is a good indication that the CY beam exhibits ductile behaviour.
With the determined β value, the resistance reduction factor and the partial safety factors account for the uncertainties in material properties and loads in the design. The resistance reduction factor values calculated using Equations (15) and (21) yields a value of ϕ   = 0.78. The partial safety factors for dead loads and live loads calculated using Equations (13, 14, 22 and 23) yields a value of γ D = 1.12 and γ L = 1.36. From the ACI code [47], the FRP resistance reduction factor value for compression controlled moment is 0.65, while partial safety factors for dead loads are near 1.35, and live loads are near 1.5. This shows that the resistance reduction factor for the CY beam is greater than the FRP beam, and design loads can be reduced compared to the FRP beam. As a result of the structure’s increased resistance and decreased design loads, these values contribute to an initial reduction in material costs. Thus, the CY beam not only shows a ductile (less catastrophic) failure but is also more economical. In the subsequent sections, the variation in the reliability index with respect to resistance reduction factors for different live-to-dead load ratios is explained in detail which again proves the above finding.
The summary of the reliability analysis procedure for a CY beam design is illustrated in the flowchart below in Figure 10.

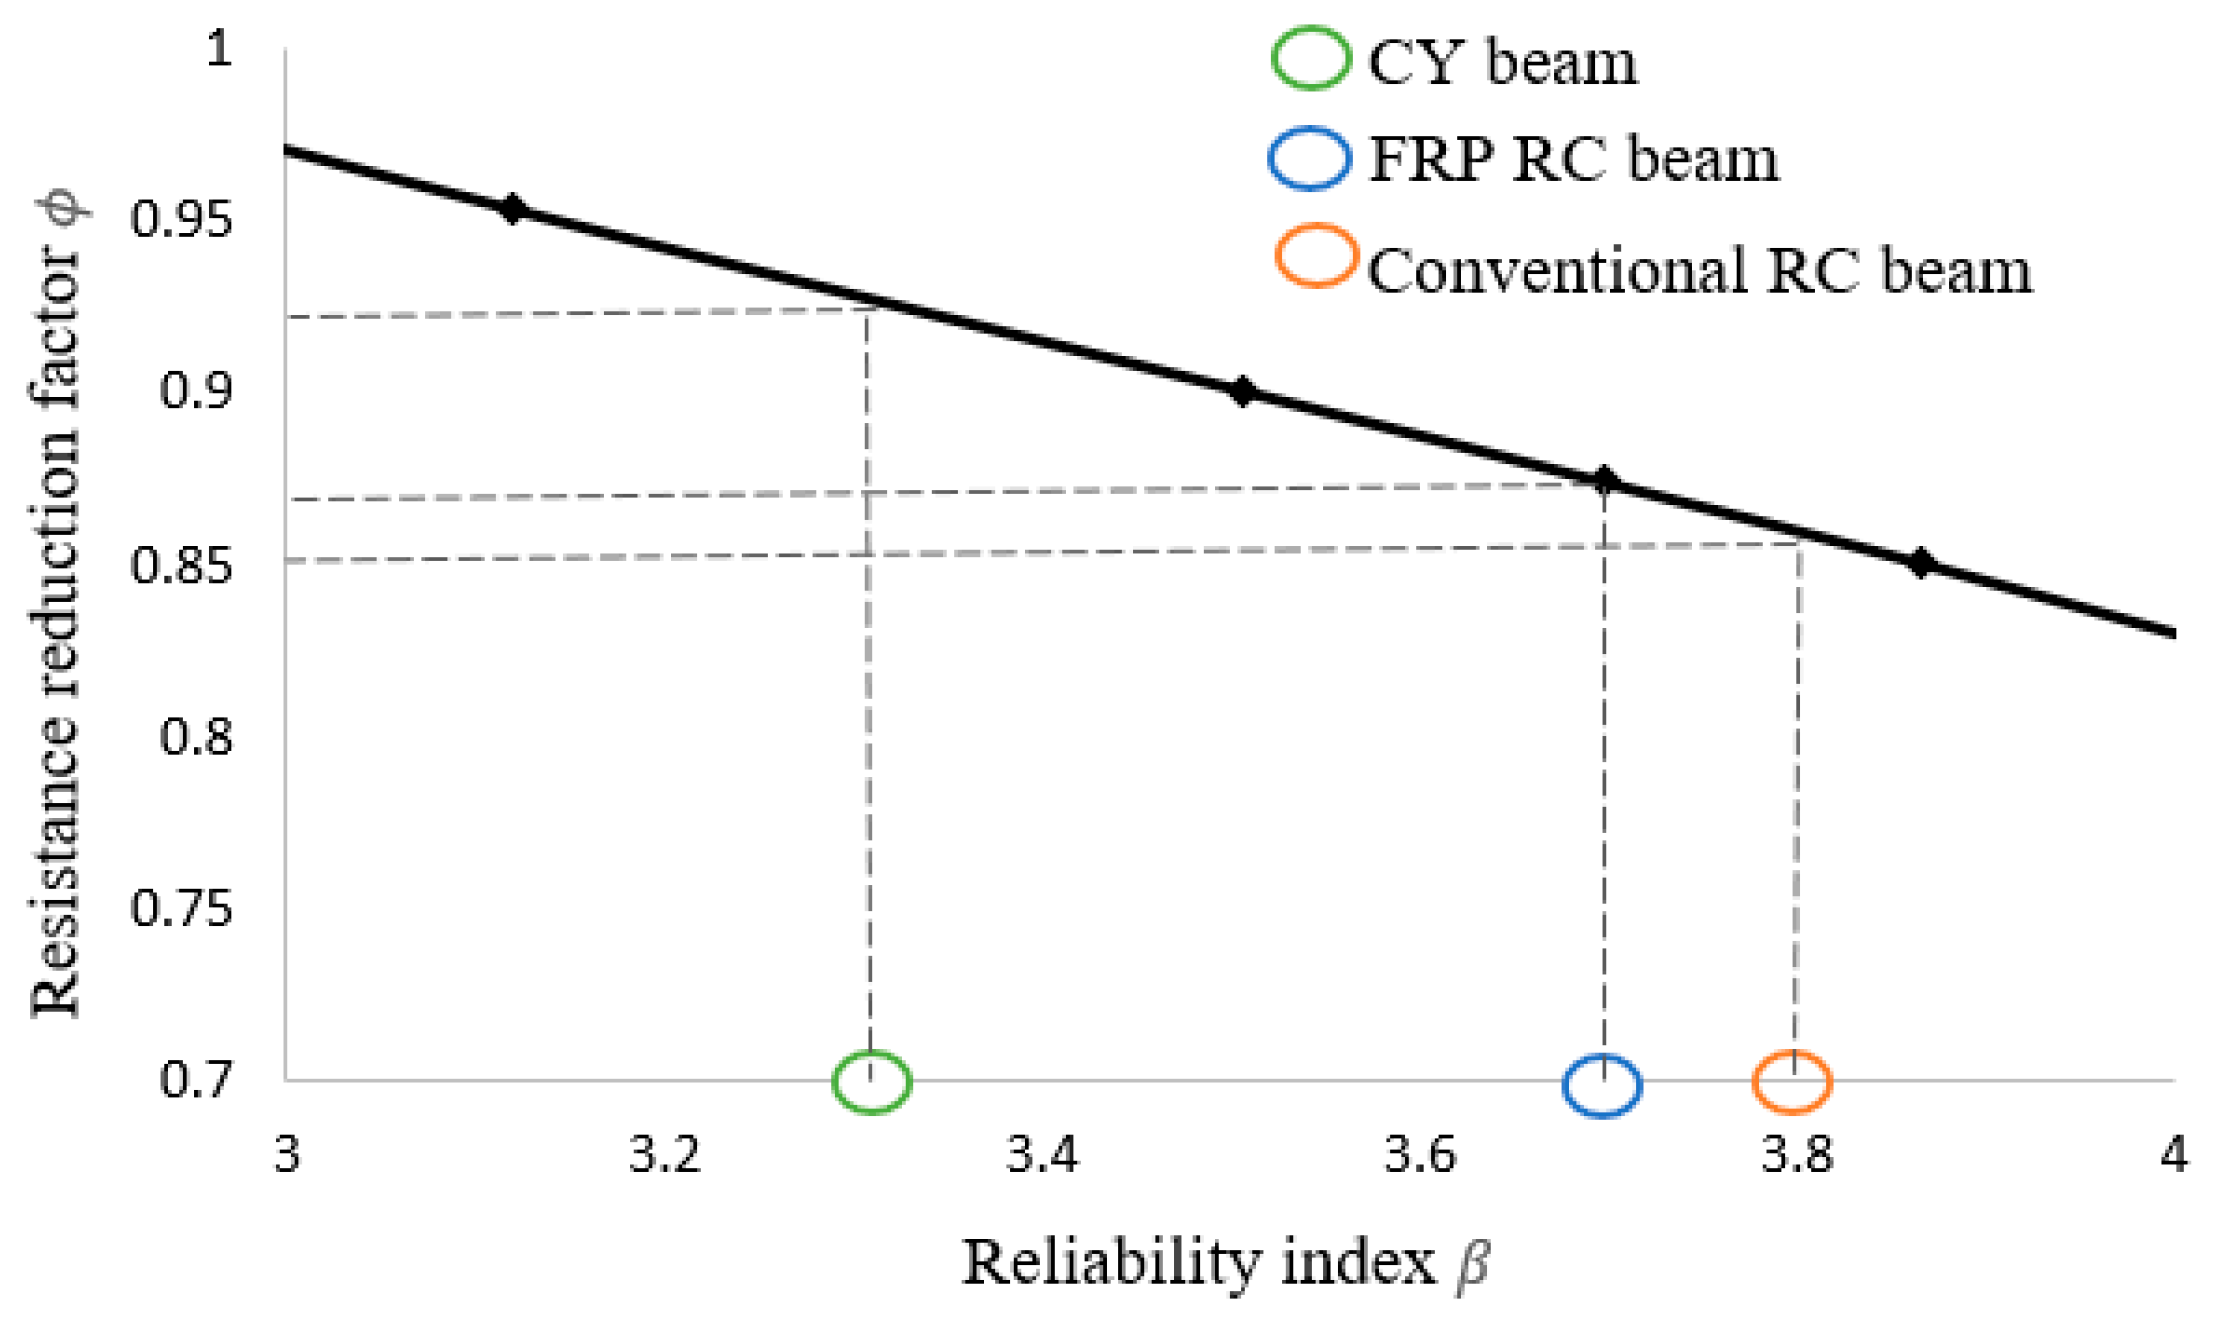
5.3. Reliability Index vs. Resistance Reduction Factor

Next, the deviation in the reduction factor for the reliability index for different load ratios is shown in Figure 11. It can be seen that the trend corresponding to different load ratios ( α ) follows a similar descending pattern when plotted for the reliability index versus resistance reduction factor. For example, when α = 0.5 and 1 , the reliability index drops from 3.64 to 3.3 for ϕ = 0.6 . However, on further increasing the α values to 1.5 and 2, there are insignificant changes to the reliability index at 3.08 and 2.93. This indicates that the CY beam has better reliability at a specific load ratio, beyond which the values start converging. When ϕ = 0.7 , the reliability index value further decreases with the increased load ratio and reaches the minimum value with a higher load ratio. In the case of wind load and seismic load, the trend of the corresponding load ratio can be similar which needs further research. Thus, CY beams have higher resistance and better reliability levels for different load ratios compared to FRP-reinforced concrete beams. In the subsequent section, the resistance factor of the CY beam is compared with the RC beam and FRP-reinforced concrete beam.
As explained in Section 3.3, the target reliability index value for the ultimate strength limit state design of an RC beam as per Australia Standard AS 5104 is 3.8. For an FRP-strengthened RC beam target, the reliability index value is 3.2 for brittle failure and 3.7 for ductile failure as per the Chinese code. Comparing the values, with the calculated reliability index as per Section 5.2 and their corresponding resistance reduction factors, a linear regression is obtained as illustrated in Figure 12. CY beams exhibited higher resistance than FRP-strengthened RC beams and conventional RC beams. This implies that CY beam designs can have higher resistances for reduced design loads, which ultimately results in a reduction in material costs. Also, it is worth noting that CY beams compared to conventional RC beams show a lack of steel corrosion issues throughout their lifespan, providing the advantage of reduced maintenance costs. Simply put together, CY beams can limit the loss of bearing capacity which mitigates the severity of failure consequences, and a simple local replacement of the fuse is more cost-efficient than replacing the structure as a whole.

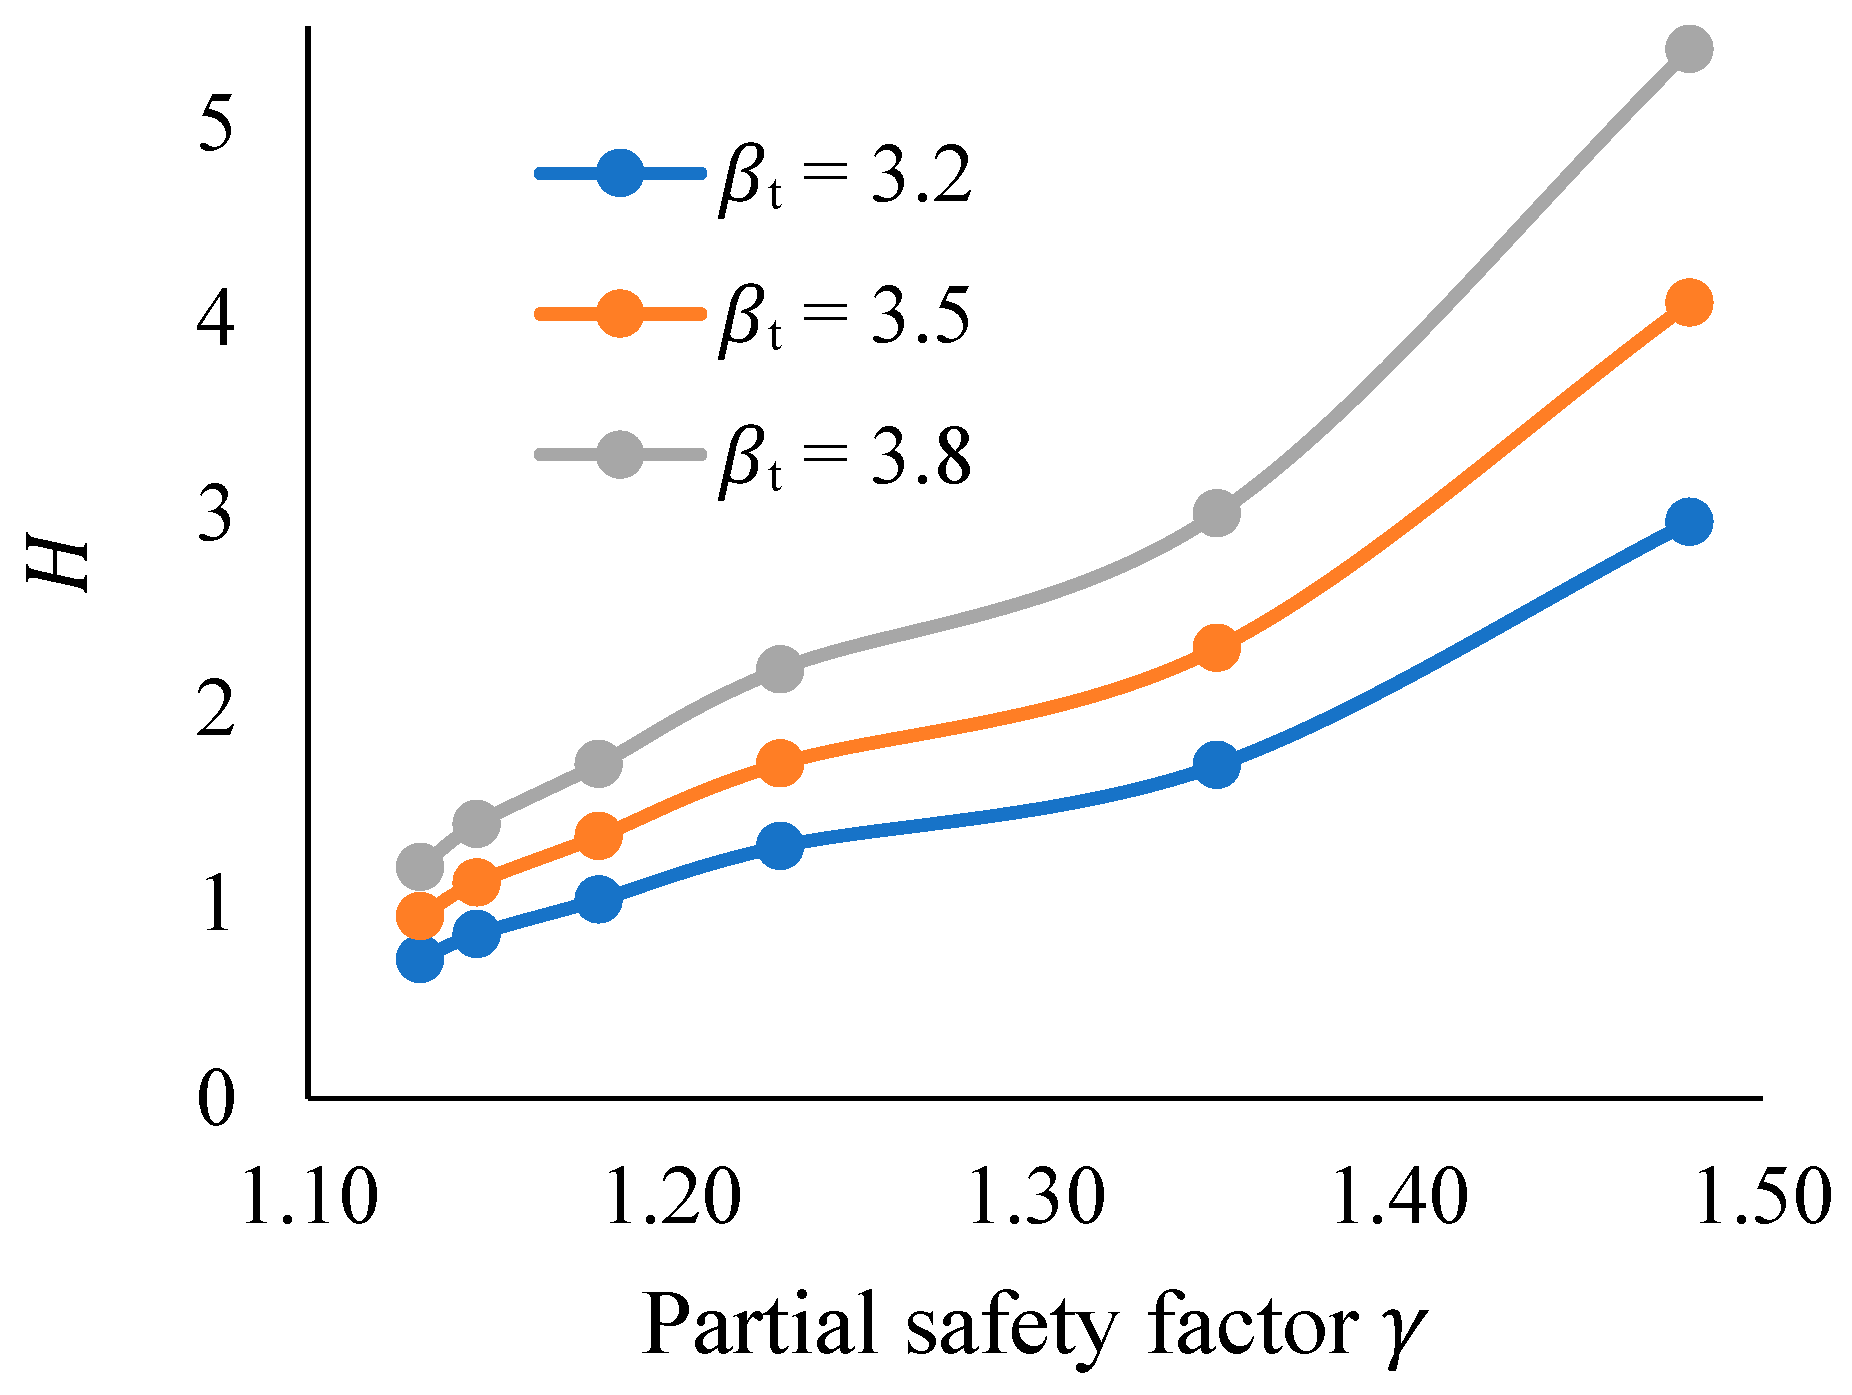
5.4. Optimal Value Factor

If the reliability index is too low, the structural safety cannot be guaranteed, while if the reliability index is too high, although the structural safety is increased, it is not economical. Therefore, it is necessary to make sure the designed reliability index is close to the target reliability. Due to the large number of cases (the number of cases corresponding to each material partial safety factor or resistance reduction factor), the least-square formula is used to calculate the deviation value H between the reliability index and the target one β t , and it can be written as
H = 1 n i = 1 n ( β i β t ) 2
where n is the number of cases; β i denotes the reliability index of the i -th case; and β t denotes the target reliability index specified in Section 3.3. In this study, β t corresponds to the suggested maximum values as per the literature for the RC beam and FRP beam, i.e., the curves for β t = 3.2, 3.5 and 3.8 are plotted in Figure 13. It can be seen that the trend of average deviation curves corresponding to different target reliability indexes follows an ascending pattern.
Thus, the optimal value of a partial safety factor of 1.3 is derived in this case. Based on the studies in this paper, it can be observed that CY beams not only exhibit a ductile property compared to FRP beams but also have better reliability levels. The results suggest the importance of choosing appropriate design variables and stochastic parameters. Since there is limited information from experimental testing of CY blocks, further research on the material properties of CY blocks is recommended. The author is currently conducting experimental research on the CY material properties and the behaviour of CY blocks and beams. Based on the testing results, the design variables chosen in this research are to be verified in future. Once the effective CY material is determined, the CY beam can not only be an economical option since it saves the material during the design stage but also a localised repair of the affected/failed fuse structure is possible.

6. Conclusions

This paper aims to develop a reliability-based design approach for compression-yielded fibre-reinforced polymer (FRP)-reinforced concrete beams. The study involves using the peak moment or flexural resistance of the CY beam in a reliability-based load and resistance factor design (LRFD) approach to establish a design space and probability density function. The design variables and corresponding stochastic parameters are generated to determine the optimal design point using the FORM.
For the design case considered in this study, the reliability index, resistance reduction factor and partial safety factors for dead and live loads are determined using Monte Carlo Simulation. The reliability index value obtained by this simulation was in close proximity to the target reliability index value, as per the literature. This is a good indication that the CY beam demonstrates ductile behaviour. Also, the resistance reduction factor for the CY beam is greater than the FRP beam, and design loads can be reduced compared to the FRP beam. As a result of the structure’s increased resistance and decreased design loads, these values contribute to an initial reduction in material costs which means an economical structure.
In comparison to an FRP-reinforced concrete beam, CY beams exhibited better reliability levels for different load ratios. However, they are deemed to have a lower reliability index than conventional RC structures. Nevertheless, CY beams demonstrated a lack of steel corrosion issues throughout their lifespan. This depends on the effective utilisation of the structural bearing capacity which is contingent upon the synchronisation between the initial safety margin and subsequent maintenance. This is particularly noteworthy because CY beams can limit the loss of bearing capacity which mitigates the severity of failure consequences. The results also suggest the importance of choosing appropriate design variables and stochastic parameters for CY blocks that contribute to a higher level of reliability.
Ultimately, the ductility demand for the CY beam was satisfied through the utilisation of the CY block, in addition to the advantages of FRP reinforcement such as high tensile strength, low thermal expansivity and economical production. Future research should investigate the cost-effectiveness and long-term durability of FRP in a variety of environmental conditions. Also, the uncertainties considered in this paper are based on the literature for FRP beams and limited experimental studies available for CY beams. The author is currently researching further with experimental investigations on CY material properties, CY blocks and CY beam behaviour. With these detailed experimental studies, it is believed that the type of epistemic uncertainties can further be reduced. A comprehensive assessment is planned for future research to provide an extended method for evaluating assumption deviation for safety margins and its cost analysis.

Author Contributions

Conceptualization, methodology, validation, formal analysis, investigation, visualization, resources, data curation, writing—original draft preparation—D.R.; writing—review and editing—D.R. and B.G.; supervision—S.M.S.K. and Y.W.; project administration—S.M.S.K. and Y.W.; funding acquisition—Y.W. All authors have read and agreed to the published version of the manuscript.

Funding

This research was funded by Australian research council grant number DP200100631.

Data Availability Statement

Data will be made available upon reasonable request.

Conflicts of Interest

The authors declare no conflict of interest.

References

  1. Goldston, M.; Remennikov, A.; Sheikh, M.N. Experimental investigation of the behaviour of concrete beams reinforced with GFRP bars under static and impact loading. Eng. Struct. 2016, 113, 220–232. [Google Scholar] [CrossRef]
  2. Baena, M.; Torres, L.; Turon, A.; Barris, C. Experimental study of bond behaviour between concrete and FRP bars using a pull-out test. Compos. Part B Eng. 2009, 40, 784–797. [Google Scholar] [CrossRef]
  3. Robert, M.; Benmokrane, B. Effect of aging on bond of GFRP bars embedded in concrete. Cem. Concr. Compos. 2010, 32, 461–467. [Google Scholar] [CrossRef]
  4. Teng, X.; Zhang, Y.; Lin, X. Two new composite plate elements with bond–slip effect for nonlinear finite element analyses of FRP-strengthened concrete slabs. Comput. Struct. 2015, 148, 35–44. [Google Scholar] [CrossRef]
  5. Lin, X.; Zhang, Y. Evaluation of bond stress-slip models for FRP reinforcing bars in concrete. Compos. Struct. 2014, 107, 131–141. [Google Scholar] [CrossRef]
  6. Pang, B.; Jin, Z.; Zhang, Y.; Xu, L.; Li, M.; Wang, C.; Zhang, Y.; Yang, Y.; Zhao, P.; Bi, J. Ultraductile waterborne epoxy-concrete composite repair material: Epoxy-fiber synergistic effect on flexural and tensile performance. Cem. Concr. Compos. 2022, 129, 104463. [Google Scholar] [CrossRef]
  7. Sun, L.; Wang, C.; Zhang, C.; Yang, Z.; Li, C.; Qiao, P. Experimental investigation on the bond performance of sea sand coral concrete with FRP bar reinforcement for marine environments. Adv. Struct. Eng. 2023, 26, 533–546. [Google Scholar] [CrossRef]
  8. Huang, H.; Yuan, Y.; Zhang, W.; Zhu, L. Property Assessment of High-Performance Concrete Containing Three Types of Fibers. Int. J. Concr. Struct. Mater. 2021, 15, 39. [Google Scholar] [CrossRef]
  9. Lin, X.; Zhang, Y. Nonlinear finite element analyses of steel/FRP-reinforced concrete beams in fire conditions. Compos. Struct. 2013, 97, 277–285. [Google Scholar] [CrossRef]
  10. Balendran, R.; Rana, T.; Nadeem, A. Strengthening of concrete structures with FRP sheets and plates. Struct. Surv. 2001, 19, 185–192. [Google Scholar] [CrossRef]
  11. Lin, X.; Zhang, Y. Novel composite beam element with bond-slip for nonlinear finite-element analyses of steel/FRP-reinforced concrete beams. J. Struct. Eng. 2013, 139, 06013003. [Google Scholar] [CrossRef]
  12. Neocleous, K.; Pilakoutas, K.; Guadagnini, M. Failure-mode-hierarchy-based design for reinforced concrete structures. Struct. Concr. 2005, 6, 23–32. [Google Scholar] [CrossRef]
  13. Pilakoutas, K.; Neocleous, K.; Guadagnini, M. Design philosophy issues of fiber reinfored polymer reinforced concrete structures. J. Compos. Constr. 2002, 6, 154–161. [Google Scholar] [CrossRef]
  14. Lin, X.; Zhang, Y. Bond–slip behaviour of FRP-reinforced concrete beams. Constr. Build. Mater. 2013, 44, 110–117. [Google Scholar] [CrossRef]
  15. ACI PRC-440.2-17; Guide for the Design and Construction of Externally Bonded FRP Systems for Strengthening Concrete Structures. American Concrete Institute: Indianapolis, IN, USA, 2017; p. 112.
  16. Realfonzo, R.; Napoli, A. Concrete confined by FRP systems: Confinement efficiency and design strength models. Compos. Part B Eng. 2011, 42, 736–755. [Google Scholar] [CrossRef]
  17. Rousakis, T.C.; Karabinis, A.I.; Kiousis, P.D. FRP-confined concrete members: Axial compression experiments and plasticity modelling. Eng. Struct. 2007, 29, 1343–1353. [Google Scholar] [CrossRef]
  18. Bank, L.C. Progressive failure and ductility of FRP composites for construction. J. Compos. Constr. 2013, 17, 406–419. [Google Scholar] [CrossRef]
  19. Kotynia, R. Debonding Phenomena in FRP–Strengthened Concrete Members. In Brittle Matrix Composites 8; Elsevier: Amsterdam, The Netherlands, 2006; pp. 109–122. [Google Scholar]
  20. Naaman, A. FRP reinforcements in structural concrete: Assessment, progress and prospects. Fibre Reinf. Polym. Reinf. Concr. Struct. 2003, 2, 3–24. [Google Scholar]
  21. Wu, Y.-F. Ductility demand of compression yielding fiber-reinforced polymer-reinforced concrete beams. ACI Struct. J. 2008, 105, 104. [Google Scholar]
  22. Wu, Y.-F.; Zhou, Y.-W.; Hu, B.; Huang, X.; Smith, S. Fused structures for safer and more economical constructions. Front. Struct. Civ. Eng. 2020, 14, 1–9. [Google Scholar] [CrossRef]
  23. Wu, Y.-F.; Jiang, J.-F.; Liu, K. Perforated SIFCON blocks–An extraordinarily ductile material ideal for use in compression yielding structural systems. Constr. Build. Mater. 2010, 24, 2454–2465. [Google Scholar] [CrossRef]
  24. Liu, X.; Wu, Y.; Leung, A.; Hou, J. Mechanical behavior of mild steel compressive yielding blocks. In Proceedings of the First Asia-Pacific Conference on FRP in Structures, Hong Kong, China, 12–14 December 2007; pp. 12–14. [Google Scholar]
  25. Zhou, Y.; Wu, Y.; Teng, J.; Leung, A. Parametric space for the optimal design of compression-yielding FRP-reinforced concrete beams. Mater. Struct. 2010, 43, 81–97. [Google Scholar] [CrossRef]
  26. Wu, Y.-F.; Zhou, Y.-W.; He, X.-Q. Performance-based optimal design of compression-yielding FRP-reinforced concrete beams. Compos. Struct. 2010, 93, 113–123. [Google Scholar] [CrossRef]
  27. Guo, B.; Lin, X.; Wu, Y.; Zhang, L. Evaluation of flexural resistance of compression yielded concrete beams reinforced with fibre reinforced polymers. Eng. Struct. 2022, 250, 113416. [Google Scholar] [CrossRef]
  28. Feng, L.; Wu, Y.-F.; Guo, B.-C.; Huang, X.-X. Reducing target reliability index of concrete bridge beams through compression yielding. Eng. Struct. 2024, 316, 118506. [Google Scholar] [CrossRef]
  29. AS 3600; Concrete Structures. Standards Australia: Sydney, Australia, 2018.
  30. Nowak, A.S.; Collins, K.R. Reliability of Structures; CRC Press: Boca Raton, FL, USA, 2012. [Google Scholar]
  31. Kim, J.H.; Lee, H.S. Reliability assessment of reinforced concrete rectangular columns subjected to biaxial bending using the load contour method. Eng. Struct. 2017, 150, 636–645. [Google Scholar] [CrossRef]
  32. Pham, H.B.; Al-Mahaidi, R. Reliablity analysis of bridge beams retrofitted with fibre reinforced polymers. Compos. Struct. 2008, 82, 177–184. [Google Scholar] [CrossRef]
  33. Gu, X.; Guo, H.; Zhou, B.; Zhang, W.; Jiang, C. Corrosion non-uniformity of steel bars and reliability of corroded RC beams. Eng. Struct. 2018, 167, 188–202. [Google Scholar] [CrossRef]
  34. Ghasemi, S.H.; Nowak, A.S. Target reliability for bridges with consideration of ultimate limit state. Eng. Struct. 2017, 152, 226–237. [Google Scholar] [CrossRef]
  35. Standards Australia. Reinforced Concrete Design: In Accordance with AS 3600-2009; Cement & Concrete Aggregates Australia; Standards Australia: Sydney, Australia, 2011. [Google Scholar]
  36. Ellingwood, B. Development of a Probability Based Load Criterion for American National Standard A58: Building Code Requirements for Minimum Design Loads in Buildings and Other Structures; US Department of Commerce, National Bureau of Standards: Gaithersburg, MD, USA, 1980; Volume 13.
  37. Huang, X.; Zhou, Y.; Xing, F.; Wu, Y.; Sui, L.; Han, N. Reliability-based design of FRP flexural strengthened reinforced concrete beams: Guidelines assessment and calibration. Eng. Struct. 2020, 209, 109953. [Google Scholar] [CrossRef]
  38. Ayyub, B.M.; Assakkaf, I.A. Reliability-based structural design of ships using load and resistance factor design approach. Ship Struct. Comm. Rep. 2000, 1–21. [Google Scholar]
  39. Cornell, C.A. Bounds on the reliability of structural systems. J. Struct. Div. 1967, 93, 171–200. [Google Scholar] [CrossRef]
  40. Holicky, M. Reliability Analysis for Structural Design; SUN MeDIA Stellenbosch, 52 Ryneveld St, Stellenbosch Central: Stellenbosch, South Africa, 2009. [Google Scholar]
  41. Vrouwenvelder, A. Developments towards full probabilistic design codes. Struct. Saf. 2002, 24, 417–432. [Google Scholar] [CrossRef]
  42. Jonkman, S.; Steenbergen, R.; Morales-Nápoles, O.; Vrouwenvelder, A.; Vrijling, J. Probabilistic design: Risk and reliability analysis in civil engineering. Coll. CIE4130 2015. [Google Scholar]
  43. Foster, S.J.; Stewart, M.G.; Sirivivatnanon, V.; Mindy, K.Y.; Loo, M.A.; Ng, T.S.; Valipour, H. Reinforced Concrete Structures Designed to AS3600; The University of Newcastle: Newcastle, Australia, 2015; ISSN 0077-880X. [Google Scholar]
  44. AS 5104; General Principles on Reliability for Structures. Defines the reliability principles for design of structures. Standards Australia: Sydney, Australia, 2005; p. 75.
  45. Sykora, M.; Holicky, M.; Lenner, R.; Maňas, P. Target reliability levels for existing bridges considering emergency and crisis situations. Adv. Mil. Technol. 2014, 9, 45–57. [Google Scholar]
  46. Feng, L.; Li, P.-D.; Huang, X.-X.; Wu, Y.-F. Reliability-Based Design Analysis for FRP Reinforced Compression Yield Beams. Polymers 2022, 14, 4846. [Google Scholar] [CrossRef] [PubMed]
  47. ACI 440; Guide for the Design and Construction of Structural Concrete Reinforced with FRP Bars. American Concrete Institute: Indianapolis, IN, USA, 2006.
  48. GB50068; Unified Standard for Reliability Design of building Structures. China Architecture & Building Press: Beijing, China, 2001.
  49. ISO 2394:1998; I. General Principles on Reliability for Structures. International Organization for Standardization: Geneva, Switzerland, 1998.
  50. Stewart, M.; Lawrence, S. Model error, structural reliability and partial safety factors for structural masonry in compression. Mason. Int. 2007, 20, 107–116. [Google Scholar]
  51. Galambos, T.V.; Ellingwood, B.; MacGregor, J.G.; Cornell, C.A. Probability based load criteria: Assessment of current design practice. J. Struct. Div. 1982, 108, 959–977. [Google Scholar] [CrossRef]
  52. Huang, X.; Sui, L.; Xing, F.; Zhou, Y.; Wu, Y. Reliability assessment for flexural FRP-Strengthened reinforced concrete beams based on Importance Sampling. Compos. Part B Eng. 2019, 156, 378–398. [Google Scholar] [CrossRef]
  53. Lu, R.; Luo, Y.; Conte, J.P. Reliability evaluation of reinforced concrete beams. Struct. Saf. 1994, 14, 277–298. [Google Scholar] [CrossRef]
  54. Yongxin, Y. Reliability analysis of RC concrete beams strengthened with CFRP sheets. J. Build. Struct. 2008, 29, 88–91. [Google Scholar]
  55. Okeil, A.M.; El-Tawil, S.; Shahawy, M. Flexural reliability of reinforced concrete bridge girders strengthened with carbon fiber-reinforced polymer laminates. J. Bridge Eng. 2002, 7, 290–299. [Google Scholar] [CrossRef]
  56. Desayi, P.; Rao, K.B. Reliability of reinforced concrete beams in limit state of cracking—Failure rate analysis approach. Mater. Struct. 1989, 22, 269–279. [Google Scholar] [CrossRef]
  57. Atadero, R.A.; Karbhari, V.M. Calibration of resistance factors for reliability based design of externally-bonded FRP composites. Compos. Part B Eng. 2008, 39, 665–679. [Google Scholar] [CrossRef]
  58. Wu, Y.-F. New avenue of achieving ductility for reinforced concrete members. J. Struct. Eng. 2006, 132, 1502–1506. [Google Scholar] [CrossRef]
Figure 1. The structural configuration of a CY beam [26].
Buildings 14 02415 g001
Figure 2. Stress–strain relationship of CY material [26].
Buildings 14 02415 g002
Figure 3. Typical moment–curvature response curves of CY beam [25,26].
Buildings 14 02415 g003
Figure 4. Strain distributions of CY beam cross section at peak of point B [26].
Buildings 14 02415 g004
Figure 5. Probability density space of design variables for limit state function g .
Buildings 14 02415 g005
Figure 6. Hasofer–Lind reliability index [30].
Buildings 14 02415 g006
Figure 7. Cumulative distribution function (CDF) of g plots on probability paper. (a) To obtain reliability index value. (b) To obtain probability of failure value. (c) Line extrapolated to obtain reliability index value.
Buildings 14 02415 g007
Figure 8. Influence of yield strength ratio of CY block to concrete on reliability index.
Buildings 14 02415 g008
Figure 9. Results of simulation for g = R D L (432 runs).
Buildings 14 02415 g009
Figure 10. Procedure for reliability analysis of CY beam using MCS method.
Buildings 14 02415 g010
Figure 11. Impact of reduction factor on reliability index for different live-to-dead load ratios.
Buildings 14 02415 g011
Figure 12. Relationship between β and ϕ comparisons for CY beam, FRP RC beam and conventional RC beam.
Buildings 14 02415 g012
Figure 13. Average deviation trends of β t of CY beam for partial safety factor.
Buildings 14 02415 g013
Table 1. K-S test results of model error in flexural failure [37,51,52].
Distributionp ValueMeanCOVError %
Normal0.8860.9610.1557.15
Lognormal0.9820.9740.1582.96
Weibull0.3410.9530.16117.03
Extreme type I0.0910.9460.18126.04
Table 2. Statistical characteristics of loads [37].
LoadsBiasCOVDistribution
Dead load D 1.050.12Normal
Live   load   L 0.950.25Extreme type I
Table 3. Statistical characteristics of design variables and loads.
CategoryVariableBiasCOVDistributionReference
Geometry Width   b   (mm)10.02Normal[53]
Depth   d f (mm)10.02Normal[54]
Effective   depth   d (mm)10.03Normal[55]
Length   L (mm)10.03Normal[52]
Concrete Compressive   strength   f c (MPa)1.250.15Normal[52]
Steel Area   A s (mm2)10.03Normal[54]
Elastic   modulus   E s (MPa)10.024Normal[32]
Yield   strength   f s (MPa)1.10.075Normal[56]
FRP Thickness   t (mm)10.05Lognormal[57]
Elastic   modulus   E f (MPa)10.04Normal[52]
Tensile   strength   f f (Mpa)1.150.1Weibull[52]
CY block Ratio   of   CY   block   height   to   beam   depth   η 10.02Normal[25]
Elastic   modulus   E b (MPa)10.30Normal[58]
Yield   strength   f b (Mpa)10.30Normal[23]
LoadsDead load1.050.12Normal[37]
Live load0.950.25Extreme Type I[37]
Table 4. Summary of geometric and material properties.
CategoriesParametersValues
Geometry Width   b (mm)180
Depth   d f (mm)350
Effective   depth   d (mm)300
Length   L (mm)2500
Concrete Compressive   strength   f c (MPa)30
Yield   strain   of   concrete   at   CY   block   interface   ε c m i 0.002
Crushing / ultimate   strain   ε c u 0.006
Steel Elastic   modulus   E s (GPa)200
Yield   strain   ε s y 0.0015
Reinforcement   ratio   ρ s (%)0.5
FRP Elastic   modulus   E f (GPa)124
Rupture / ultimate   strain   ε f u 0.017
FRP   area   fraction   ρ f (%)0.05
CY block [25,58] Yield   strength   f b (MPa)40.4
Yield   strain   ε b y 0.001
Ultimate   strain   ε b u 0.2
Table 5. Summary of random variables.
Random VariablesNominal Values Bias   Factor   ( λ )Mean
( μ )
COV
( V )
Std.   Dev   ( σ )Distribution
Resistance   ( R ) 21.943   k N m 0.982 21.548   k N m 0.158 3.404   k N m Lognormal
Dead   Load   ( D ) 1.575   k N / m 1.05 1.654   k N / m 0.12 0.165   k N / m Normal
Live   Load   ( L ) 5   k N / m 2 0.95 5   k N / m 2 0.25 1.25   k N / m 2 Extreme type I
Table 6. Monte Carlo Simulation results (showing 30 out of 432 runs).
S. NoRandom Nos D i Z i Random Nos L i Z i Random Nos R i Z i R i D i L i X / ( X + 1 ) Φ 1 ( X / ( X + 1 ) )
10.8762.4364.7410.7656.61010.4800.98017.66724.1978.6210.004−3.298
20.2513.0128.2280.2627.32111.8650.79528.72342.81018.3910.006−3.046
30.0183.30810.0220.5525.4768.2700.69329.47444.07420.6900.008−2.936
40.4434.72818.6320.7847.37411.9690.94435.09153.53022.9890.010−2.936
50.8002.7826.8390.0387.55612.3230.39436.20055.39825.8620.012−2.900
60.7192.3033.9360.4097.77212.7450.12037.27957.21427.2030.014−2.863
70.8254.68818.3900.4475.2977.9200.44538.72159.64128.7360.016−2.812
80.1904.23015.6090.7577.86312.9210.14940.82863.18828.7360.018−2.812
90.4644.25915.7860.0297.53112.2760.25643.39967.51731.6090.020−2.725
100.8913.67212.2280.6736.3459.9620.81639.51860.98429.5020.022−2.791
110.1524.94319.9350.5725.2387.8050.45942.74866.42132.5670.024−2.710
120.2394.17715.2930.7916.96011.1620.02943.70468.03132.5670.026−2.710
130.6912.5915.6770.1947.85012.8960.86844.34869.11533.9080.028−2.667
140.3964.80919.1230.0055.7078.7200.95145.76671.50135.2490.030−2.645
150.1402.2883.8420.6257.85112.8980.74046.92073.44536.7820.032−2.608
160.5601.9581.8400.2605.6618.6290.79544.97570.16937.3560.034−2.594
170.1623.53911.4230.7115.1257.5840.64547.55374.50938.8890.036−2.543
180.1892.0272.2590.9946.47210.2100.25447.96275.19939.4640.038−2.528
190.3972.0062.1330.5495.9829.2560.60247.45274.34039.4640.042−2.528
200.9883.59711.7750.9867.60412.4170.11651.81481.68340.6130.047−2.521
210.6123.43810.8120.4267.87312.9410.55453.07383.80441.7620.051−2.485
220.3313.82313.1470.8095.9389.1690.25553.24884.09743.4870.055−2.441
230.8902.4754.9740.7036.40910.0880.03852.37082.62043.4870.058−2.441
240.4484.47117.0720.2096.75510.7610.93555.67088.17544.4440.060−2.419
250.8652.6055.7650.2926.3349.9410.84155.10887.22846.1690.064−2.390
260.0803.33610.1960.1126.2189.7150.67955.72388.26446.1690.067−2.390
270.0242.6706.1590.8147.17511.5810.09057.16390.68947.3180.070−2.339
280.5823.2749.8170.5676.39510.0610.94257.56291.36047.8930.074−2.324
290.3812.3424.1690.7986.87911.0040.53057.11490.60647.8930.077−2.324
300.0674.04114.4640.0937.03011.2980.49860.30495.97749.2340.079−2.288
Disclaimer/Publisher’s Note: The statements, opinions and data contained in all publications are solely those of the individual author(s) and contributor(s) and not of MDPI and/or the editor(s). MDPI and/or the editor(s) disclaim responsibility for any injury to people or property resulting from any ideas, methods, instructions or products referred to in the content.

