Abstract
Recent rapid urbanization has led to an increase in tunnel construction, escalating the prevalence of ground collapses. Ground collapses, characterized by large deformation and strain-softening, pose a significant challenge for classical numerical theories and simulation methods. Consequently, a numerical framework combining the material point method (MPM) and strain-softening Drucker–Prager plasticity is introduced in this study to more accurately describe the evolution process and failure mechanism of the subgrade during tunnel excavation. The proposed numerical framework was validated against an analytic solution employing a typical ‘dry bottom’ dam model with solid non-linearity and large deformation; some of the results are also compared with those of the SPH method and centrifugal modeling tests to verify the validity of the MPM method in this paper. The validated model was used in this study to conduct a comprehensive analysis of surface instability and ground collapse under varying soil conditions. This included factors such as strata thickness, cohesion, internal friction angle, and a quantitative description of the development of longitudinal subsidence of the surface. The aim was to clarify deformation responses, failure patterns, and excavation mechanisms, providing insights for underground tunneling practices.
1. Introduction
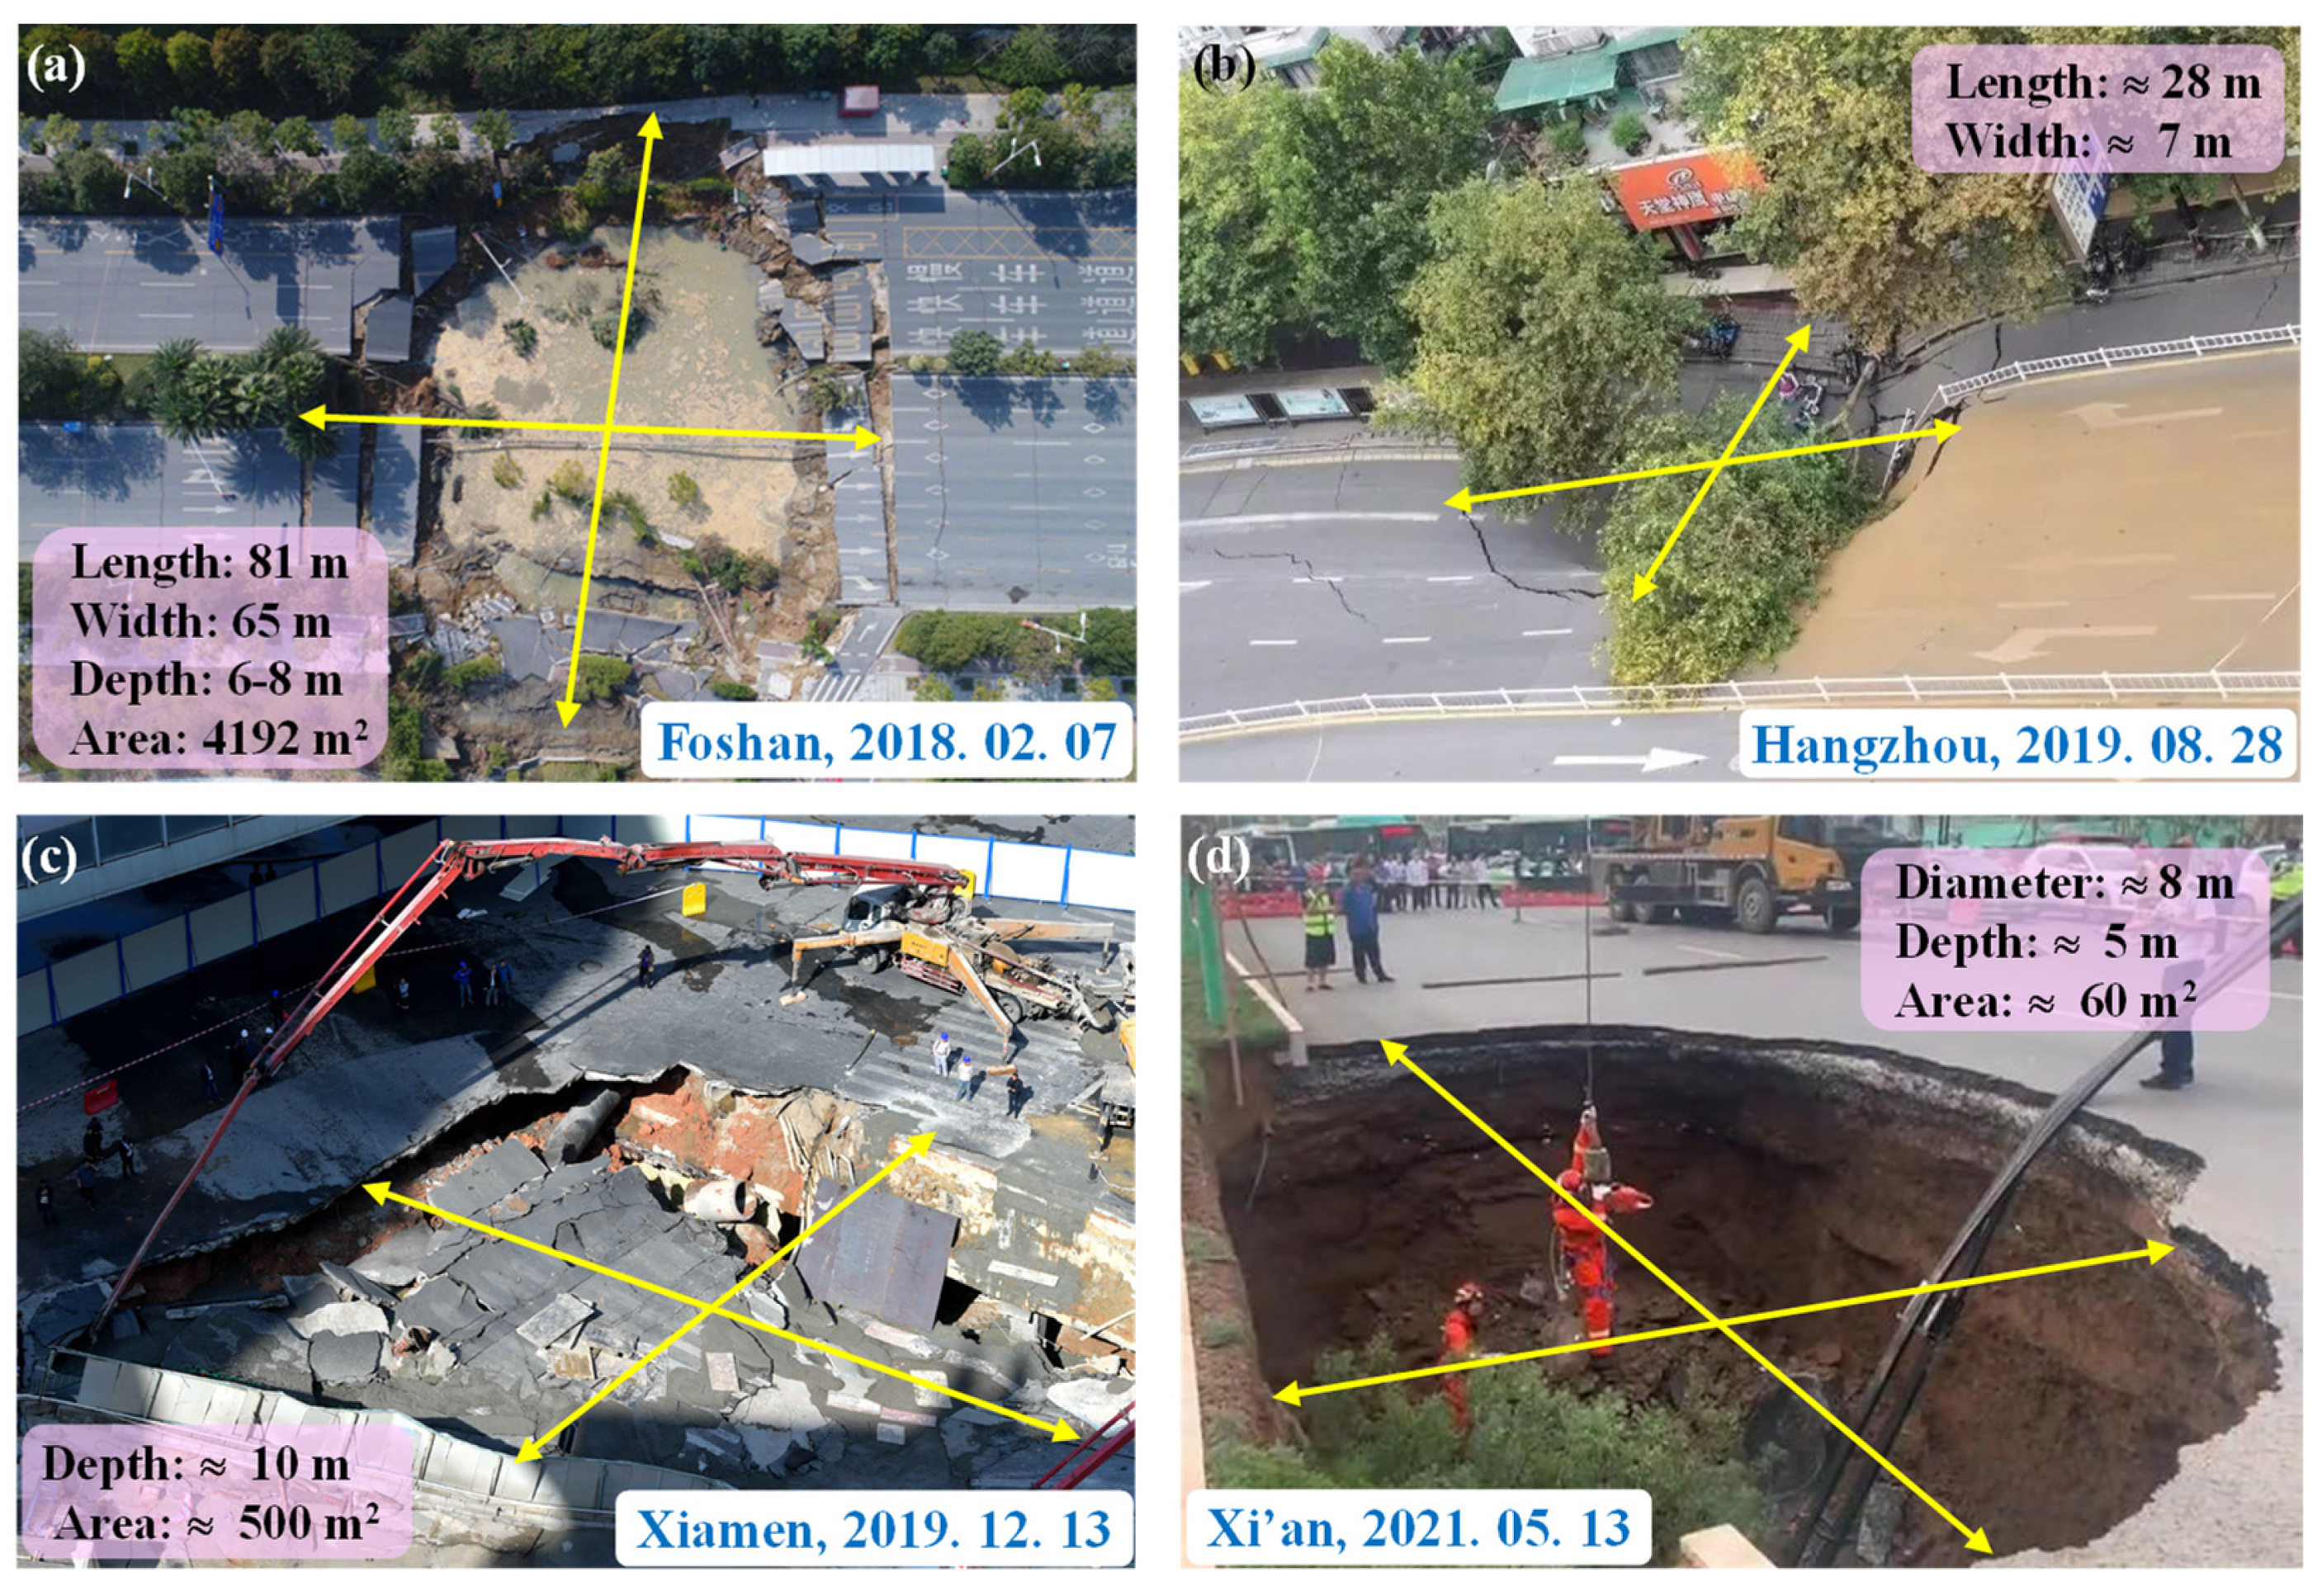
Rapid urbanization in China has spurred the construction of numerous tunnels within cities, aimed at enhancing urban traffic flow and accommodating cables and pipe networks. Stress relief before excavation faces, due to improper treatment measures during tunneling, can result in face instability and deformation, widely recognized as a primary factor contributing to substantial ground collapse and ensuing secondary damage [1,2,3,4]. Instances of road collapse in Chinese urban centers such as Foshan, Hangzhou, Xiamen, and Xi’an have consistently been attributed to the construction of adjacent subway tunnels, posing threats to economic development and public safety (Figure 1, references [5,6,7,8]). Hence, it is imperative to comprehensively comprehend the mechanisms responsible for surface instability and ground collapse during tunnel excavation, along with their implications for engineering projects.
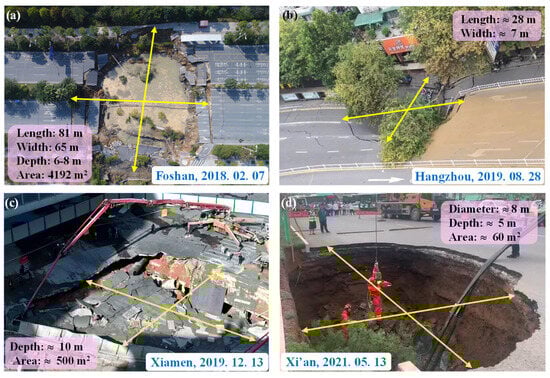
Figure 1.
Representative incidents of tunnel-induced road collapse in (a) Foshan, (b) Hangzhou, (c) Xiamen, and (d) Xi’an [5,6,7,8].
Previous studies on this topic can be primarily classified into five methodological categories: engineering case studies, theoretical analyses, physical model tests, machine learning, and numerical simulations. With the case analysis of 334 road collapses in China, Wang and Xu [9], Wang et al. [10], and Alhaji et al. [11] emphasized the crucial role of human activities (e.g., underground engineering, groundwater withdrawal, heavy vehicle overload, among others) in causing urban ground collapse; Peng et al. [12] revealed the tunnel-induced failure caused by seepage erosion through a case study illustrated in Figure 1a. However, as highlighted by Zhang et al. [13], case studies only reveal the post-collapse state of the ground under specific geological conditions, thereby failing to offer a comprehensive understanding of the reasons behind ground collapses. Theoretical analyses utilizing Peck’s Gaussian settlement curve (and its modifications, [14,15,16]) alongside model tests conducted in diverse scenarios facilitate the incorporation of additional factors contributing to ground collapse [17,18,19,20]. Additionally, machine learning, as a rapidly evolving research methodology, also holds significance in studying road collapse phenomena. For example, Zhang et al. [21] integrated interpretative structural modeling with Bayesian networks to develop a road collapse risk assessment model. This model quantifies the coupling strength and impact of multiple risk factors on road collapse accidents. Similarly, Cheng et al. [22] introduced an evolutionary risk preference fuzzy support vector machine inference model for predicting road slope collapses.
However, when compared to model tests, which are costly, time-consuming, and subject to scale effects, and machine learning, which cannot simulate the collapse evolution process, numerical simulation often offers lower costs, higher efficiency, and the ability to construct full-scale computational models. Consequently, in recent years, many studies have employed numerical simulations to replicate the formation process of stratum collapses and to delve deeper into their underlying mechanisms. Classical methods include the FEM and FDM [4,23,24]; however, they often encounter issues with mesh distortion and constringency when simulating large deformations and discontinuous deformations present in ground collapse accidents [25]. By contrast, the discrete element method (DEM) may be more applicable [26,27,28,29,30]. For instance, Tao et al. [31] conducted numerical analyses to study the development of circular cavities beneath urban roads using the discrete element software PFC2D5.0; Shamy et al. [32] employed computational fluid dynamics (CFD) coupled with DEM to investigate soil vibration liquefaction during the seepage process of soil slopes; and Tao et al. [33] utilized the CFD-DEM method to simulate pipeline erosion phenomena in embankments.
While the DEM is commonly used in problems involving large deformations, it is restricted by the limitations on the number of particles and imperfections in its theoretical foundation for parameter calibration. In contrast, the MPM introduced by Sulsky et al. [34,35] addresses these limitations by combining Lagrangian and Eulerian methods, allowing for simulating material behavior over time without mesh distortion issues. Moreover, MPM retains the advantage of DEM in describing the arbitrary motion of particles. MPM finds extensive application in dealing with geological disasters and geotechnical challenges. For instance, Sun and Song [36] employed MPM to dynamically simulate the complete process of the 12.20 Shenzhen landslide, assessing its destructive impact on buildings; Fern [37] quantitatively replicated the ground response during tunneling using MPM; Fernández et al. [38] utilized MPM to reveal the face instability of shallow tunnels and the subsequent collapse process; Li et al. [39] examined the failure responses of rock tunnel faces during excavation through the fault-fracture zone; and Wang et al. [40] investigated face instability resulting from the shutdown of earth pressure balance shields with a partially filled chamber using MPM. While these studies confirm the robust capability of MPM in replicating large deformations related to geotechnical issues, there is still a notable scarcity of comprehensive analyses regarding the evolution of failure processes in surface instability and ground collapse in cohesive soil, as well as the influence of material properties and excavation parameters on the failure mechanism.
On the one hand, most of the existing literature chooses the ultimate support force on the tunnel palm face as the research object, for example, to study the deformation and damage mechanism under different support forces [38,41], the ultimate support force under different soil parameters or support conditions, etc. [42,43], all of which require the deformation and destruction of the soil to reach a steady state, i.e., focus on the final state of the soil. On the other hand, there are fewer studies on the development of stress concentration zones in the soil and the settlement of the ground surface at different time points in the deformation process; on the other hand, for the problem of ground collapse caused by tunnel construction, most of the studies discuss the development of stress and strain in the soil in the presence of small palisade displacements (normalized palisade displacements of <5%) [44,45,46,47], there are still fewer studies on the use of the MPM method to simulate the extensive deformation process of the soil collapsing above the tunnel in similar scenarios by controlling the palm face to produce large displacements (normalized palm face displacement >5%). In addition, although there are similar articles investigating soil deformation damage in the same scenario, the focus is more on the type of damage at the palm face [39,48] or the settlement change along the lateral direction at the surface [37,40].
In response, this study seeks to develop an MPM-based numerical framework by integrating MPM with a strain-softening Drucker–Prager plasticity model using the weighted least squares approximation. Furthermore, this study utilizes the MPM-based method to simulate surface instability and ground collapse induced by tunnel excavation and focuses on the process of deformation damage and the settlement of the surface in the longitudinal direction. This is aimed at providing new insights into understanding the deformation responses and failure mechanisms of the soil layer under varying construction parameters and geological conditions, while also obtaining implications for similar engineering projects.
2. MPM-Based Numerical Framework and Its Validation
2.1. MPM-Based Numerical Model
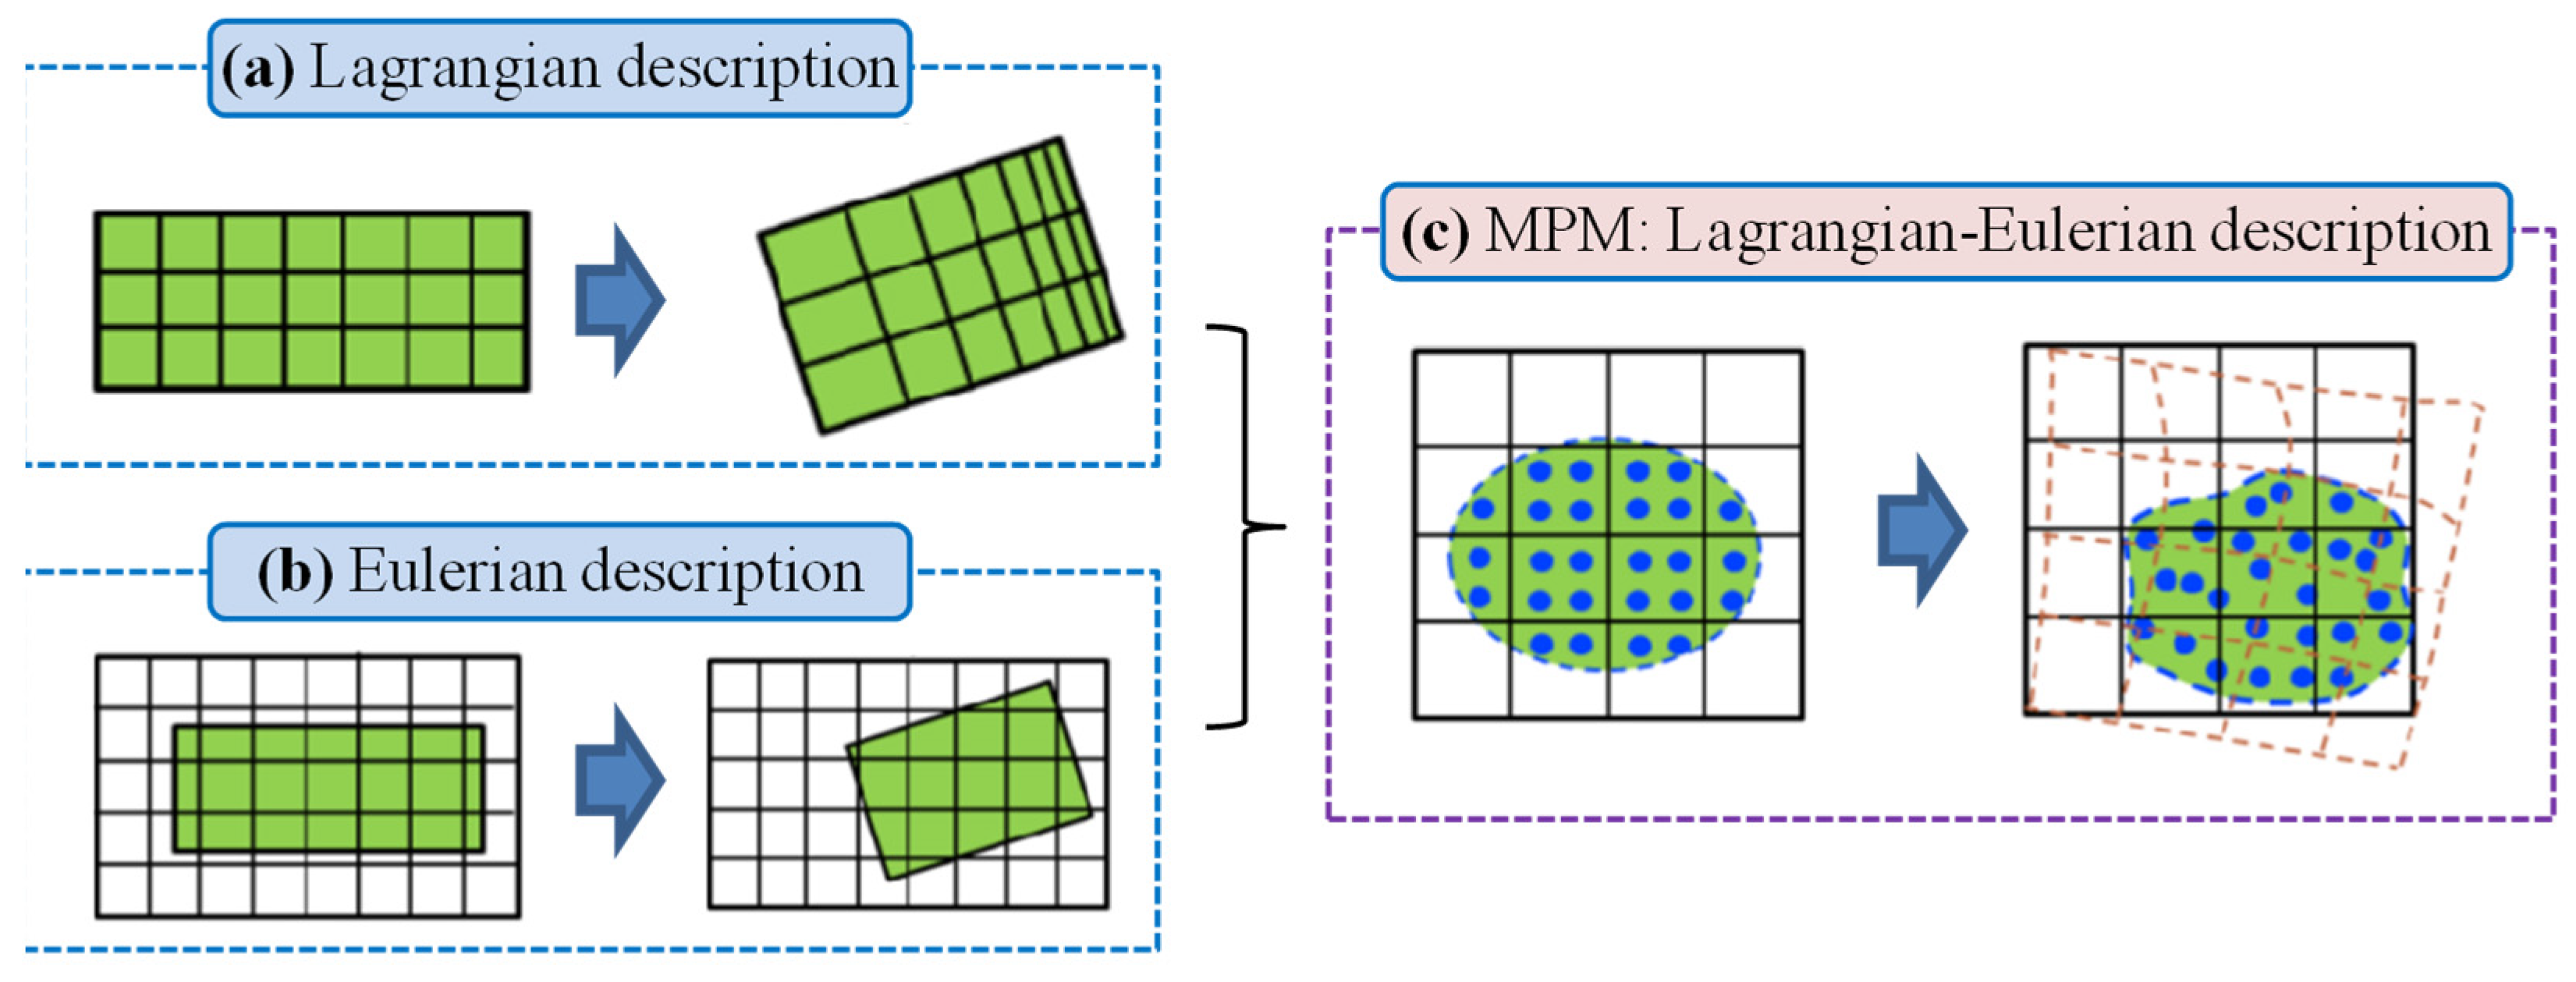
In this study, an MPM-based numerical method is introduced to simulate the complete process of tunnel excavation and its impact on face stability and ground deformation. In MPM, a hybrid approach of the Lagrangian and Eulerian descriptions is employed to model material behavior, as illustrated in Figure 2c. Moreover, the material domain is equivalent to Lagrangian particles, referred to as material points. These points encapsulate all physical and motion information, with stress-strain relationships calculated at the particle level to track deformation history. They can move through a background grid (known as the Eulerian grid), as depicted in Figure 2b. Control equations are solved on the Eulerian grid, and the grid is reset at each step.

Figure 2.
Schematic illustrating material behavior description based on MPM.
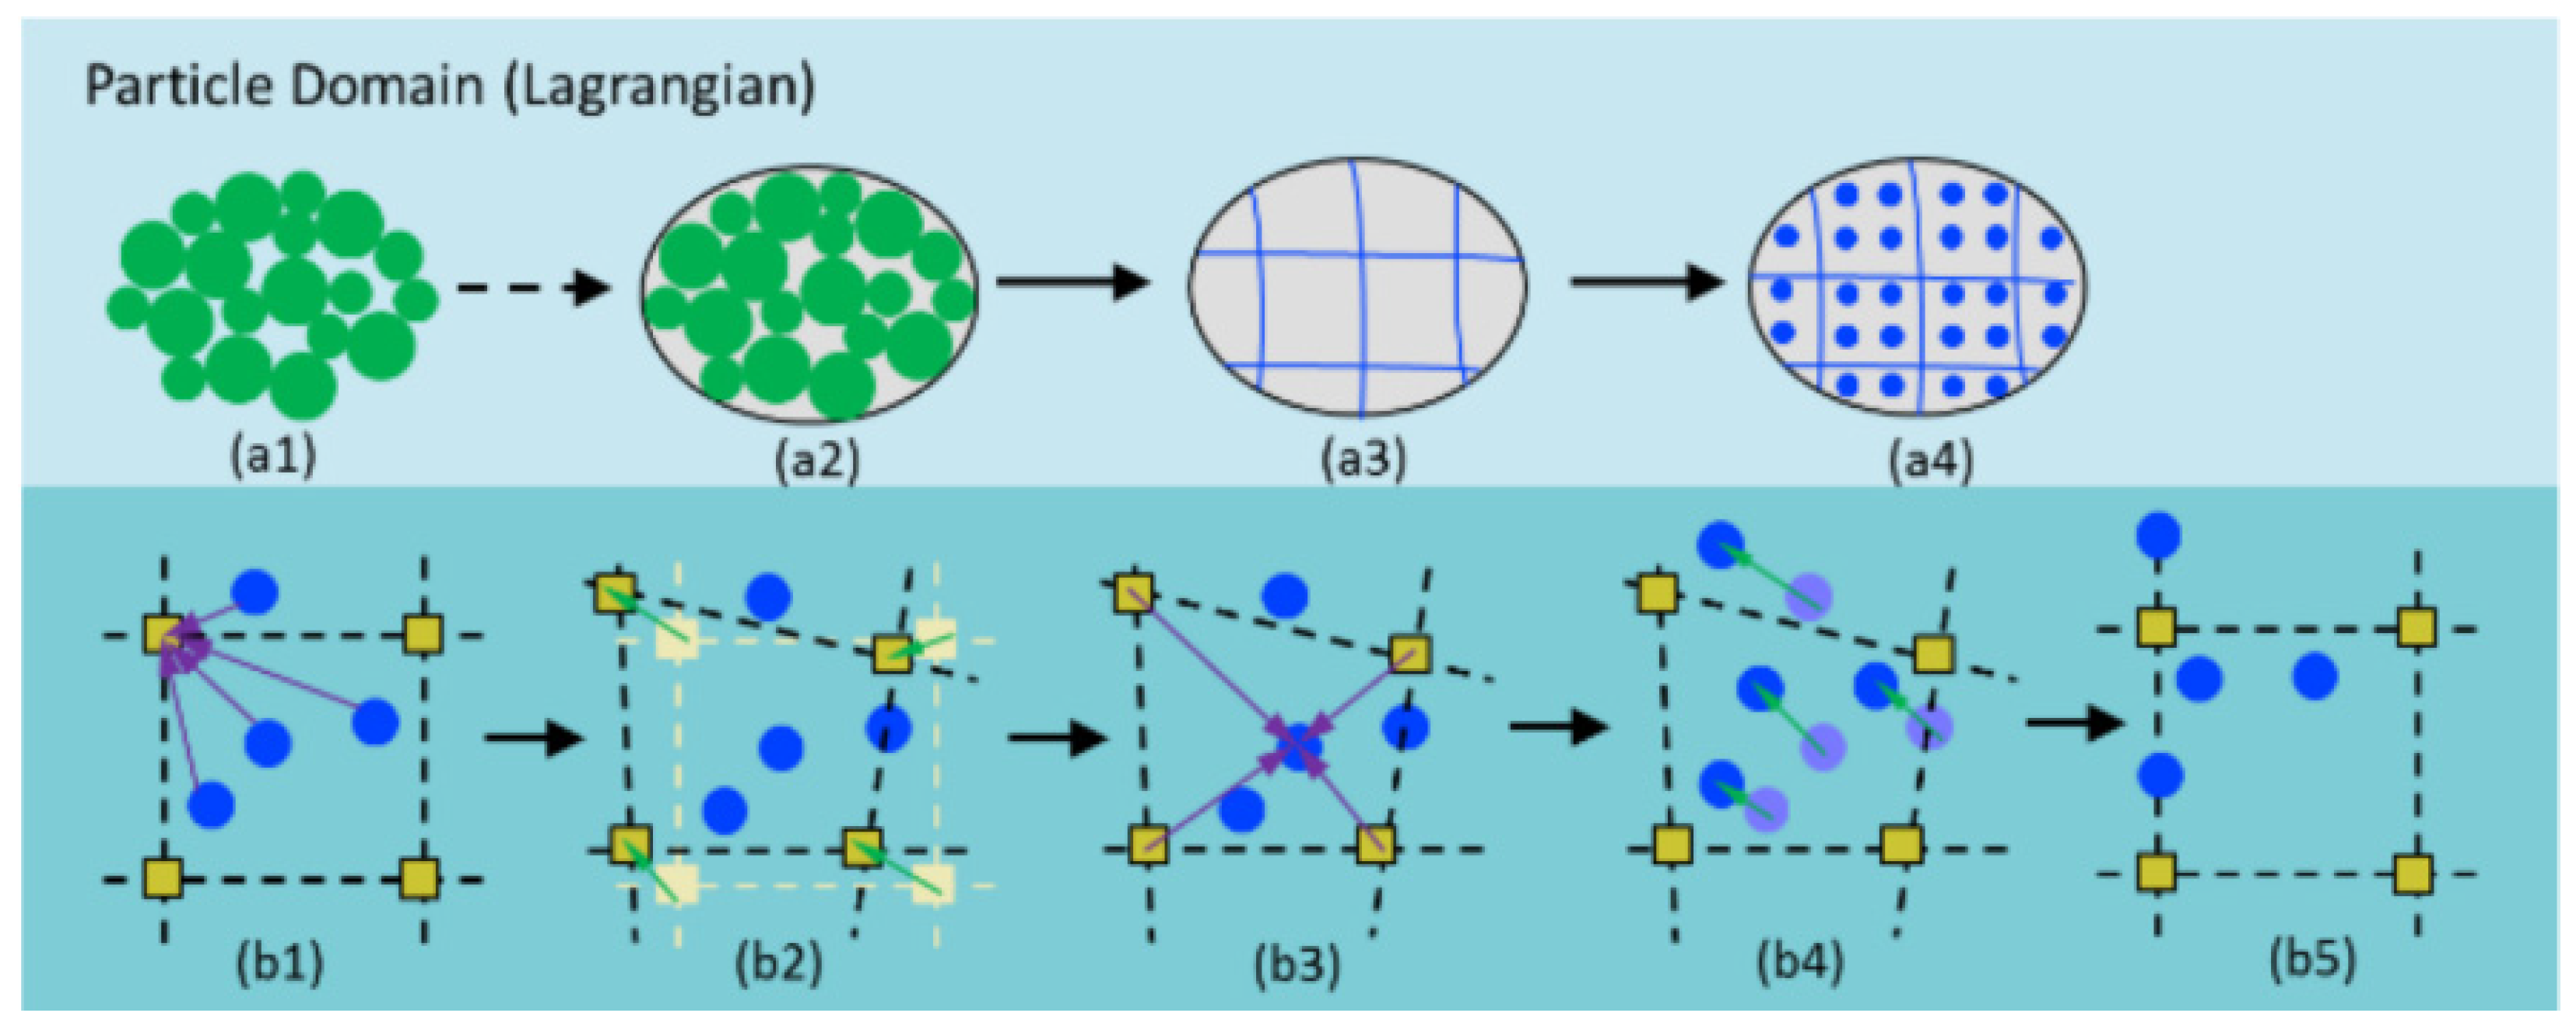
Figure 3 illustrates the entire computational process of the MPM. The collapse body after surface instability can be considered a granular flow composed of individual coarse particles (Figure 3(a1)). Based on the theory of continuum mechanics, these particles are first regarded as a continuous body (Figure 3(a1,a2)), and further discretized into a series of material points in space (Figure 3(a2–a4)). Each material point stores all physical quantities representing its corresponding regions, such as mass, momentum, displacement, and historical variables related to constitutive models, and is closely connected to background grid nodes through shape functions (or weight functions). Figure 3(b1–b5) depicts the solution process within a computational step. Firstly, the information in material points is mapped to the background grid (Figure 3(b1)), and then the governing equations are solved on the background grid to obtain new state variables, causing grid deformation. Finally, the new state variables are mapped back to material points (Figure 3(b2,b3)), updating the positions, velocities, and other information of material points (Figure 3(b4)), and deformed grids are discarded, adopting regular grids for the next computation step (Figure 3(b5)), thus avoiding grid distortion. The single-phase MPM formulation was utilized in this study. Detailed equations for mass and momentum conservation are referenced in [35,40,49].

Figure 3.
The diagram illustrating MPM computation.
The joint simulation of large deformation damage problems in geotechnical engineering by DP criterion and non-associative flow law has been well proved and applied, such as the large deformation process of soil slope damage and its subsequent damage [50], the collapse process of shallow buried tunnels [47], and so on. This paper aims to employ a Drucker–Prager (DP)-based elastoplastic model to capture the deformation of geological layers induced by tunnel excavation within the MPM-based numerical framework. Plastic flow occurs once the trial stress of the material points reaches the yield surface. The DP yield criterion, as proposed by [49], is written as follows:
wherein J2 denotes the stress second invariant; σm is the stress first invariant; c denotes soil cohesion; and and denote the material parameters, as defined in [49]:
wherein φ denotes the soil internal friction angle. This elastoplastic model assumes a non-associated rule, wherein the plastic potential function is defined as follows:
where ψ is the dilatancy angle of the soil material.
Additionally, considering the strength reduction in the localized deformation zones of geomaterials, parameter c in Equation (1) was defined as below:
where c0 denotes initial soil cohesion; denotes accumulated plastic strain, which is defined as follows:
where Δεips denotes plastic strain components along the principal direction, i = 1, 2, and 3, and is its critical value.
The numerical implementation of the MPM-based method was conducted using open-source code downloaded from https://www.anuracode.com/ (accessed on 23 March 2024). Furthermore, the implementation details of the strain-softening DP model can be referenced in the work reported in [51].
2.2. MPM Validation Based on a Benchmark Example
This section validates the effectiveness of the MPM-based method in modeling large deformations of materials using a benchmark example presented by Stoker [51]., namely a “dry bottom” dam illustrated in Figure 4. The red mark indicates removal, after removing the baffles on the right side of the water block, the dam collapses under its weight. The initial height of the water block H0 = 0.1 m and its length L0 = 1.0 m, along with its geometric configuration, are as shown in Figure 4. Initially, a background grid covering the entire area involved in the dam collapse process is set up. It is discretized with a minimum grid spacing to cover the initial solution domain. Particles are then generated within the background grid covering the initial solution domain, with each background grid initially uniformly distributed with 4 particles, totaling 400,000 particles. The MPM-based method described in Section 2.1 is employed to compute the motion process involving large deformations following the dam collapse and validate it against analytical solutions to the dam collapse problem.
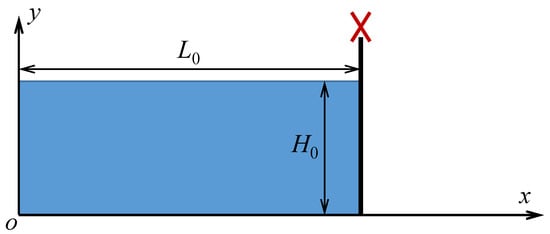
Figure 4.
The initial geometric configuration of a “dry bottom” dam.
According to the shallow water theory [51], the positions of points on the free surface of the water block (top and right side) are written analytically as follows:
wherein x and y denote the coordinates of the point’s position mentioned above (see Figure 4); g is the gravity acceleration, with a value of 9.81 m/s2; and t is the time after removing the right-side baffle. The shape of the free surface of the water block at different times during the dam collapse process can be obtained based on the provided analytical solution.
Additionally, when simulating the dam collapse problem using the MPM, the contact surfaces of the water block with the left side and bottom are set to be free-sliding. Furthermore, water is assumed to be an incompressible fluid, with its continuity described using a linear polynomial state equation as follows:
where cn = 35 m/s and ρ0 = 1.0 × 10³ kg/m3.
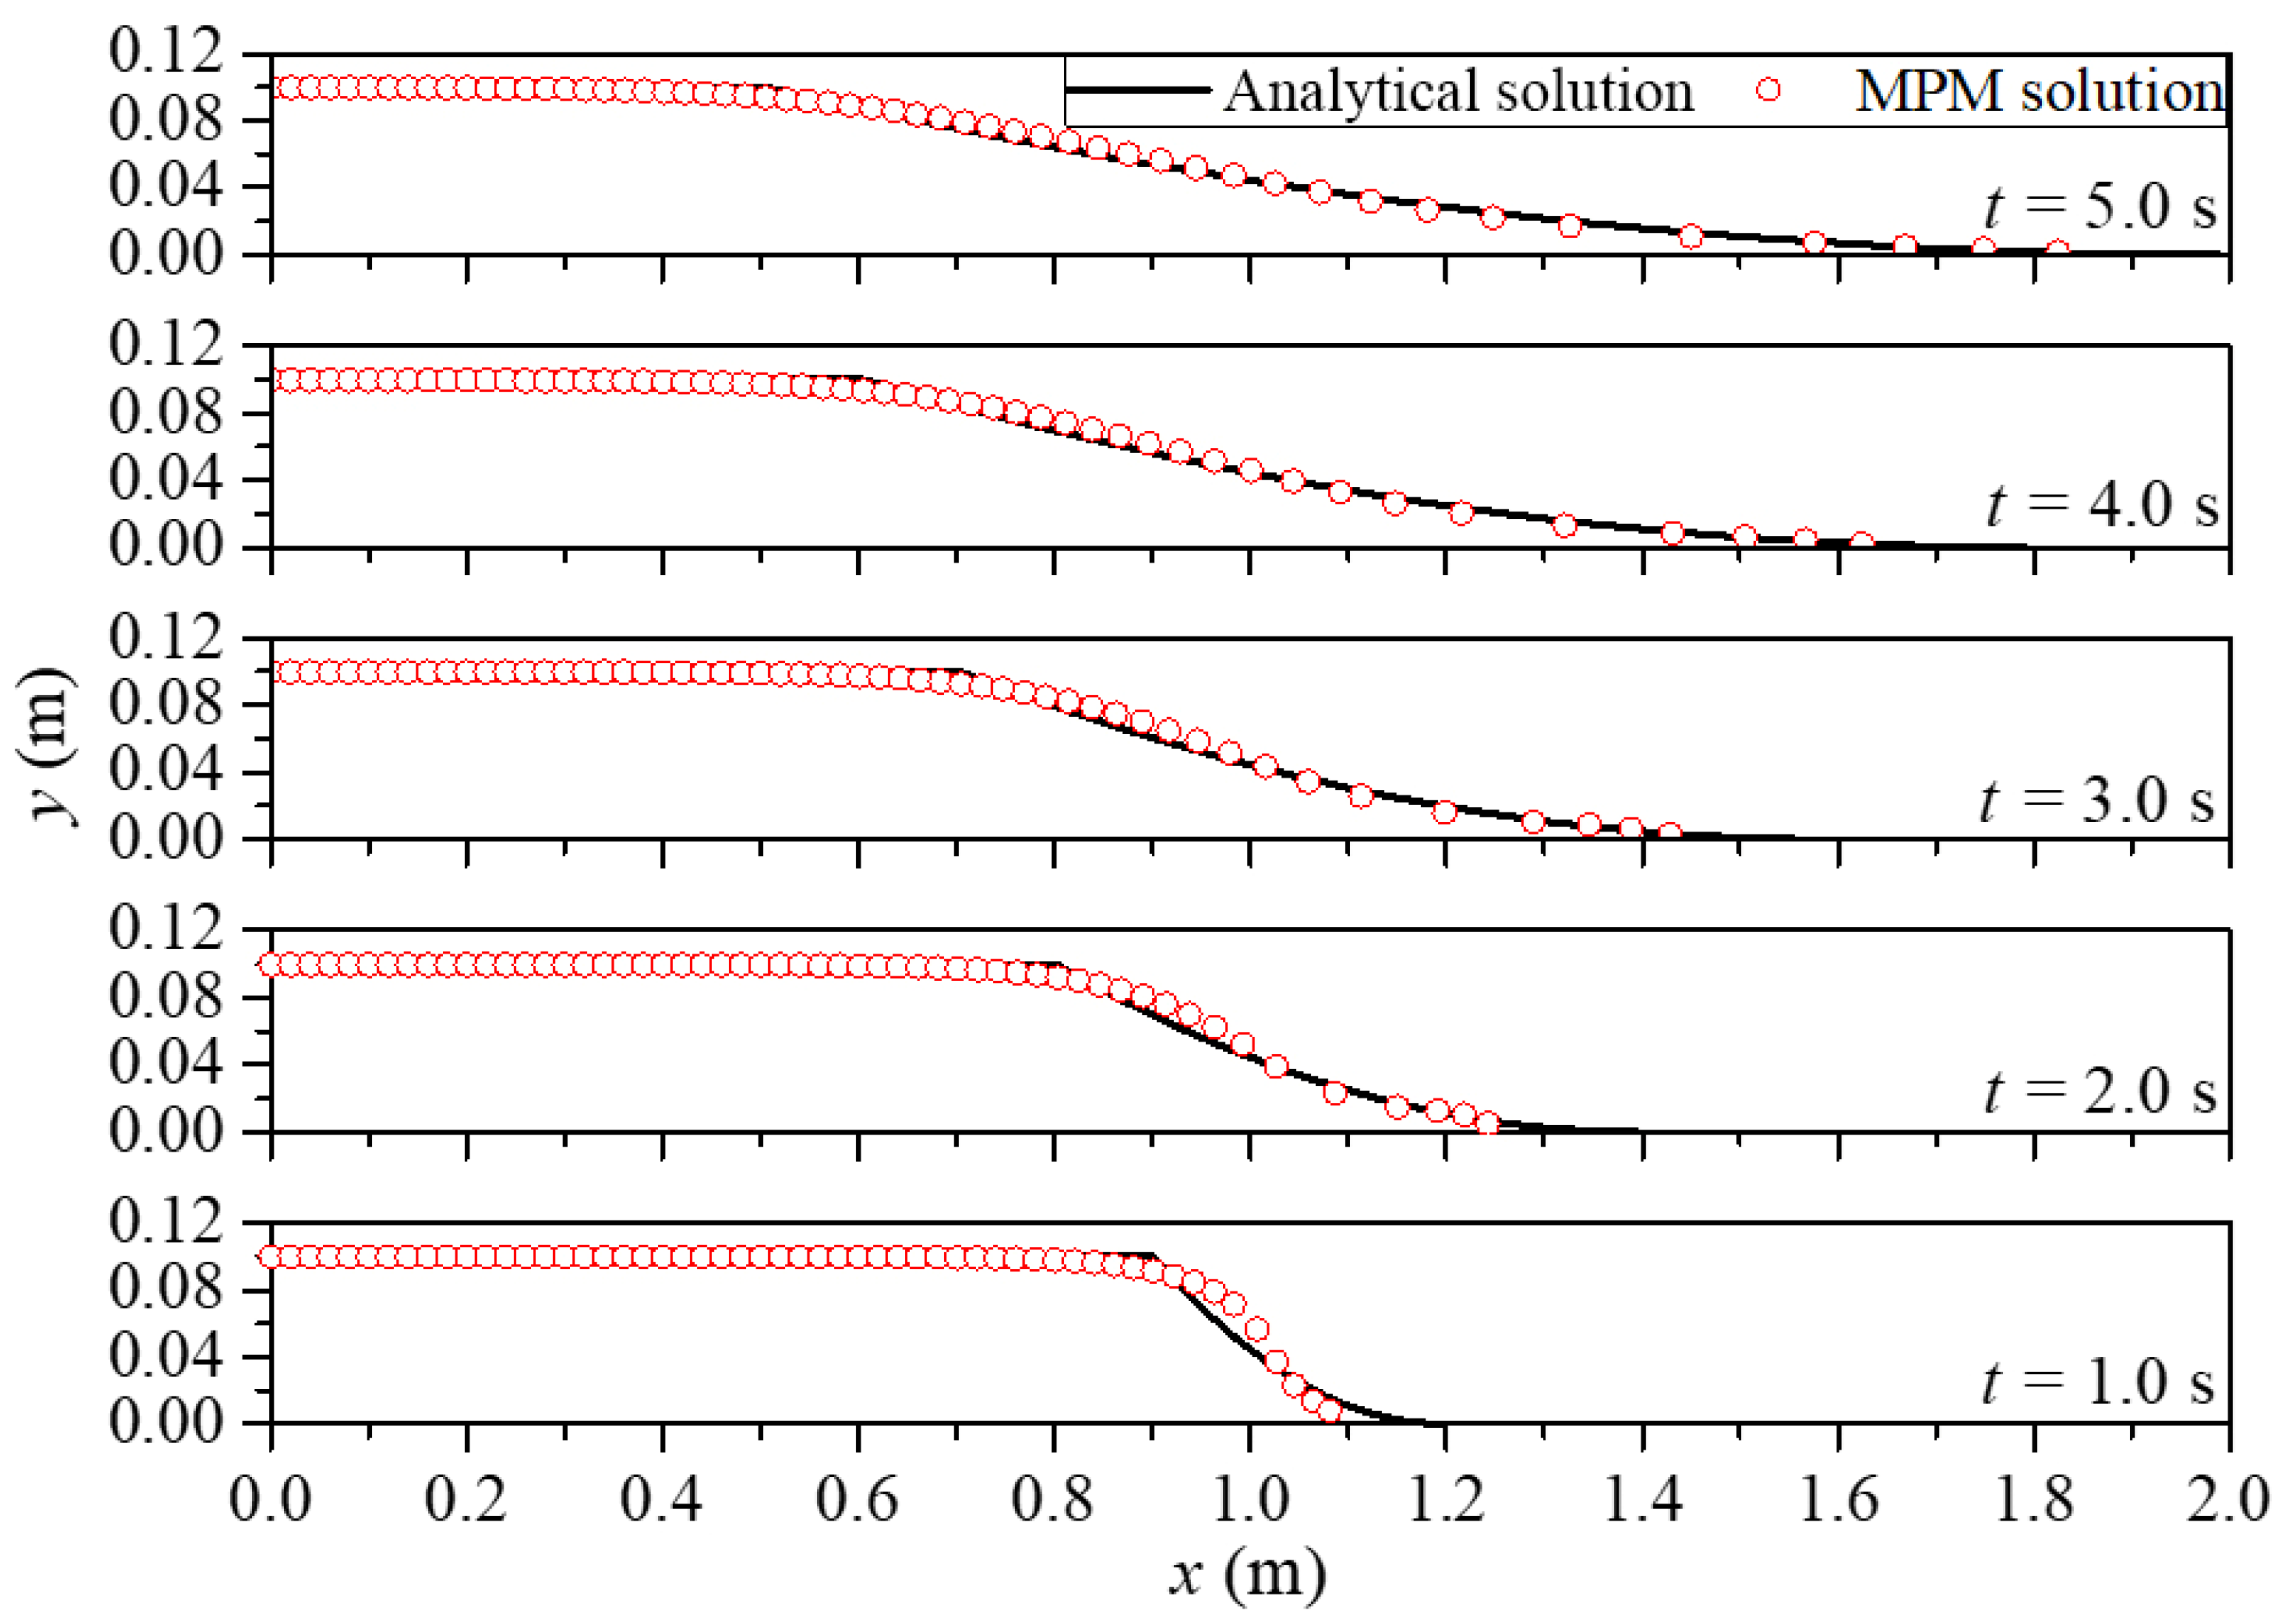
Figure 5 compares the numerical and analytical solutions for the dam collapse problem. The positions and shapes of the water block’s free surface during the dam collapse are recorded at the intervals of 1, 2, 3, 4, and 5 s. It can be observed that during the dam collapse process, the free surface moves towards the right-hand free area under the effect of gravity. Additionally, through observation of alterations in the intersection point between the upper and right free surfaces, it is evident that the collapse area progressively extends towards the left side, starting from the baffle position. This motion of the dam collapse process aligns with expectations. Furthermore, the free surface curves derived from both MPM and analytical approaches exhibit substantial consistency over various time intervals, illustrating MPM’s efficacy in modeling extensive material deformation.
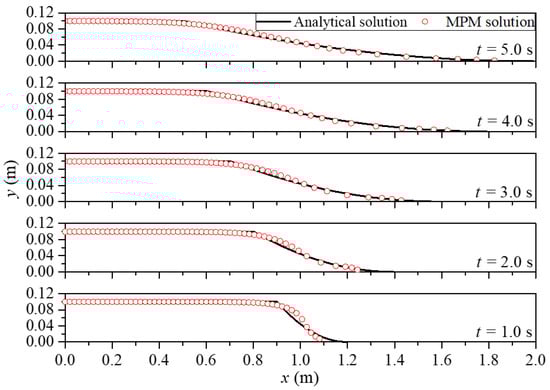
Figure 5.
Comparisons of MPM and analytical solutions for the dam collapse problem.
3. Numerical Simulation of Tunnel Excavation in a Soil Stratum
This section aims to simulate the movement of a tunnel during shield tunneling, as reported by Schofield [52], to reveal the deformation evolution and intrinsic mechanisms of overlying strata across various excavation stages. It considers the tunnel’s burial depth (or thicknesses of overlying strata, denoted as t), initial soil cohesion c0, and internal friction angle φ. The shield tunnel construction site spans 60 m in length, with a tunnel floor descending 20 m, a tunnel face width (l) of 10 m, and overlying strata thicknesses (t) of 5, 10, and 20 m (see Figure 6). A rigid vertical lining above the tunnel, which does not allow for displacements, will be used with the aim of reducing the effect of the boundary conditions on the deformation of the soil and providing more internal space. The geometric layout of the site and boundary conditions are outlined in the same figure; the bottom of the site is fixed both horizontally and vertically, while the left and right sides of the site are fixed horizontally; the background cell grid size is 0.5 m, with 2 material points along its length. In the MPM simulation, the tunnel face moves to the right to replicate the disruption caused by shield tunnel construction. This study employs a DP elastoplastic model, which adheres to a non-associated flow rule, to characterize material behavior, as elaborated in Section 2.1. The primary soil properties are as below: Young’s modulus E = 20 MPa, Poisson’s ratio ν = 0.26, friction angle φ = 10°, 27°, 40°, dilation angle ψ = 2°, initial cohesion c0 = 2, 10, 20 kPa, density ρ = 1.798 × 10³ kg/m3, coefficient of earth pressure at rest k0 = 0.35, as shown in Table 1.
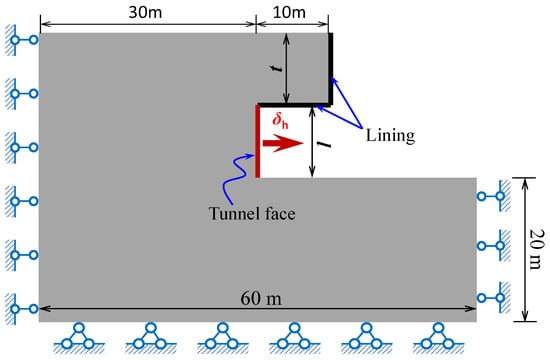
Figure 6.
Initial configuration of the tunnel model.

Table 1.
Parameters of the numerical test.
The main assumptions involved in the MPM modeling analysis are set out below:
(1) In this study, based on the MPM modeling process, the soil material is assumed to be a continuous homogeneous medium, and the effect of pore water pressure is not considered; (2) The material principal is selected assuming that the soil is elastoplastically deformed, conforming to the non-associated flow rule, and that its softening behavior is mainly due to the increase in cohesion with the equivalent plastic strain, without considering the softening effect of the internal friction angle and the shear expansion angle; (3) The construction of the tunnel excavation model is simplified to a two-dimensional plane strain problem based on the results of Li et al. [39].
Since the complete strain-softening effect of the material could not be captured in the stress-controlled tests, a displacement-controlled approach was taken in order to study the damage process. When simulating the collapse process induced by construction disturbance using the MPM numerical framework proposed in this paper, two stages are distinguished: (1) The first stage involves loading due to self-weight stress. Initial stress conditions are established by applying static soil pressure and balancing self-weight stress with the baffles kept in place at the tunnel face. (2) The second stage involves loading due to the movement of the tunnel face after tunnel excavation. Following excavation, linings are installed at the top and bottom of the tunnel. The magnitude of the construction disturbance is simulated by displacing the baffles to the right after tunnel excavation.
4. Results and Discussions
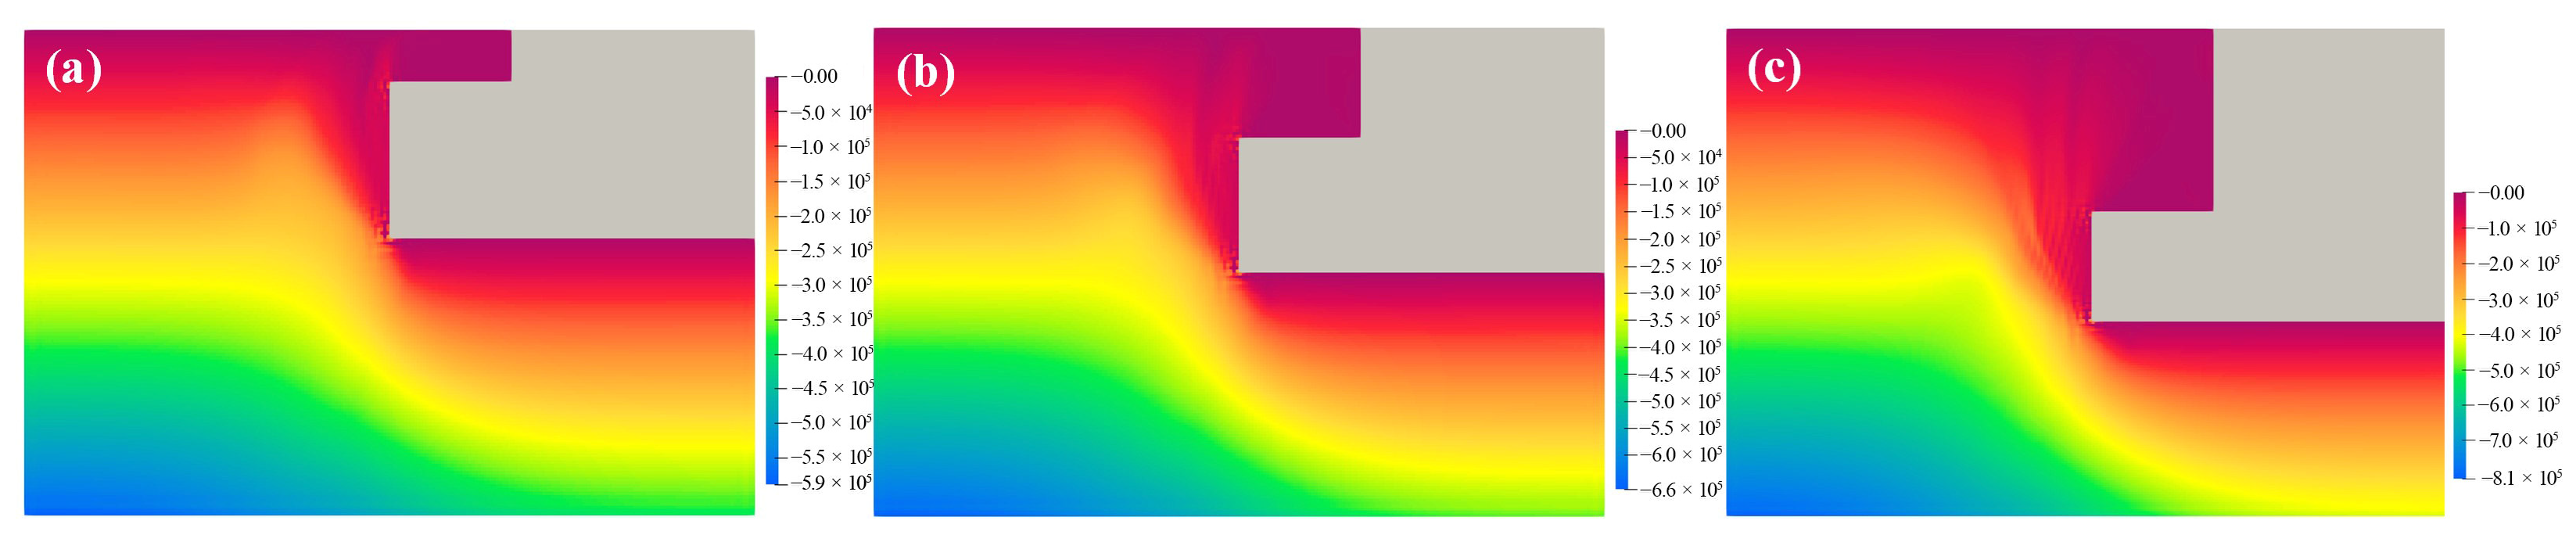
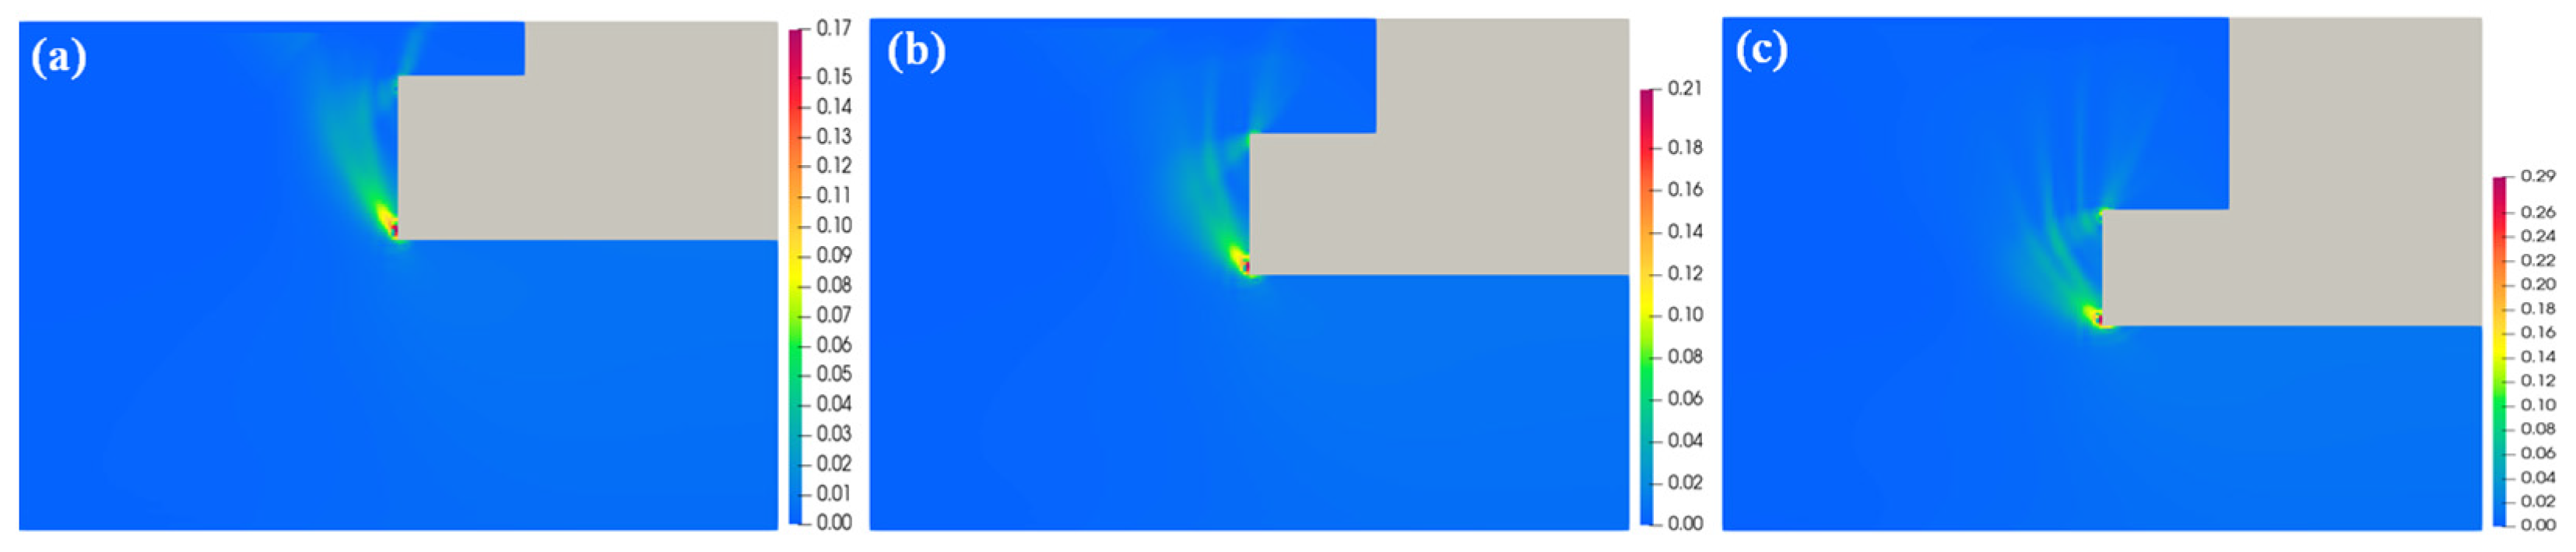
Figure 7 depicts the spatial distribution of vertical stresses following self-weight stress loading at a shield tunnel construction site, considering varying overburden heights during the initial phase. Observations suggest that excavation of the tunnel on the site’s right side alleviates earth pressure at the lower strata, leading to nearly zero vertical stress at the tunnel surface. A comparison of the impact of tunnel overburden height on the site’s stress reveals that higher overlying soil layers lead to increased vertical stress on the left side of the site. All simulated results align with soil mechanics theory, demonstrating that stress equilibrium, as per the MPM method, is well satisfied for this tunnel model. Figure 8 displays the spatial distribution of deviatoric strain following self-weight stress loading and before construction disturbance at the site. Stress concentration is observed at the corners of the tunnel face, even in the absence of disturbance. Additionally, more severe stress concentration occurs at the bottom due to higher stresses, resulting in minor damage at the tunnel face corners before significant construction disturbance. Typically, this issue is mitigated through methods such as lining, anchoring, or bracing.

Figure 7.
The spatial distribution of vertical stresses at a tunnel construction site under different overburden heights following the application of self-weight stress loads (δh = 0 m): (a) t = 5 m, t/l = 0.5, (b) t = 10 m, t/l = 1.0, and (c) t = 20 m, t/l = 2.0.
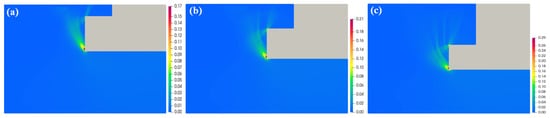
Figure 8.
The spatial distribution of deviatoric strain at a tunnel construction site under various overburden heights after the application of self-weight stress loads (δh = 0 m): (a) t = 5 m, t/l = 0.5, (b) t = 10 m, t/l = 1.0, and (c) t = 20 m, t/l = 2.0.
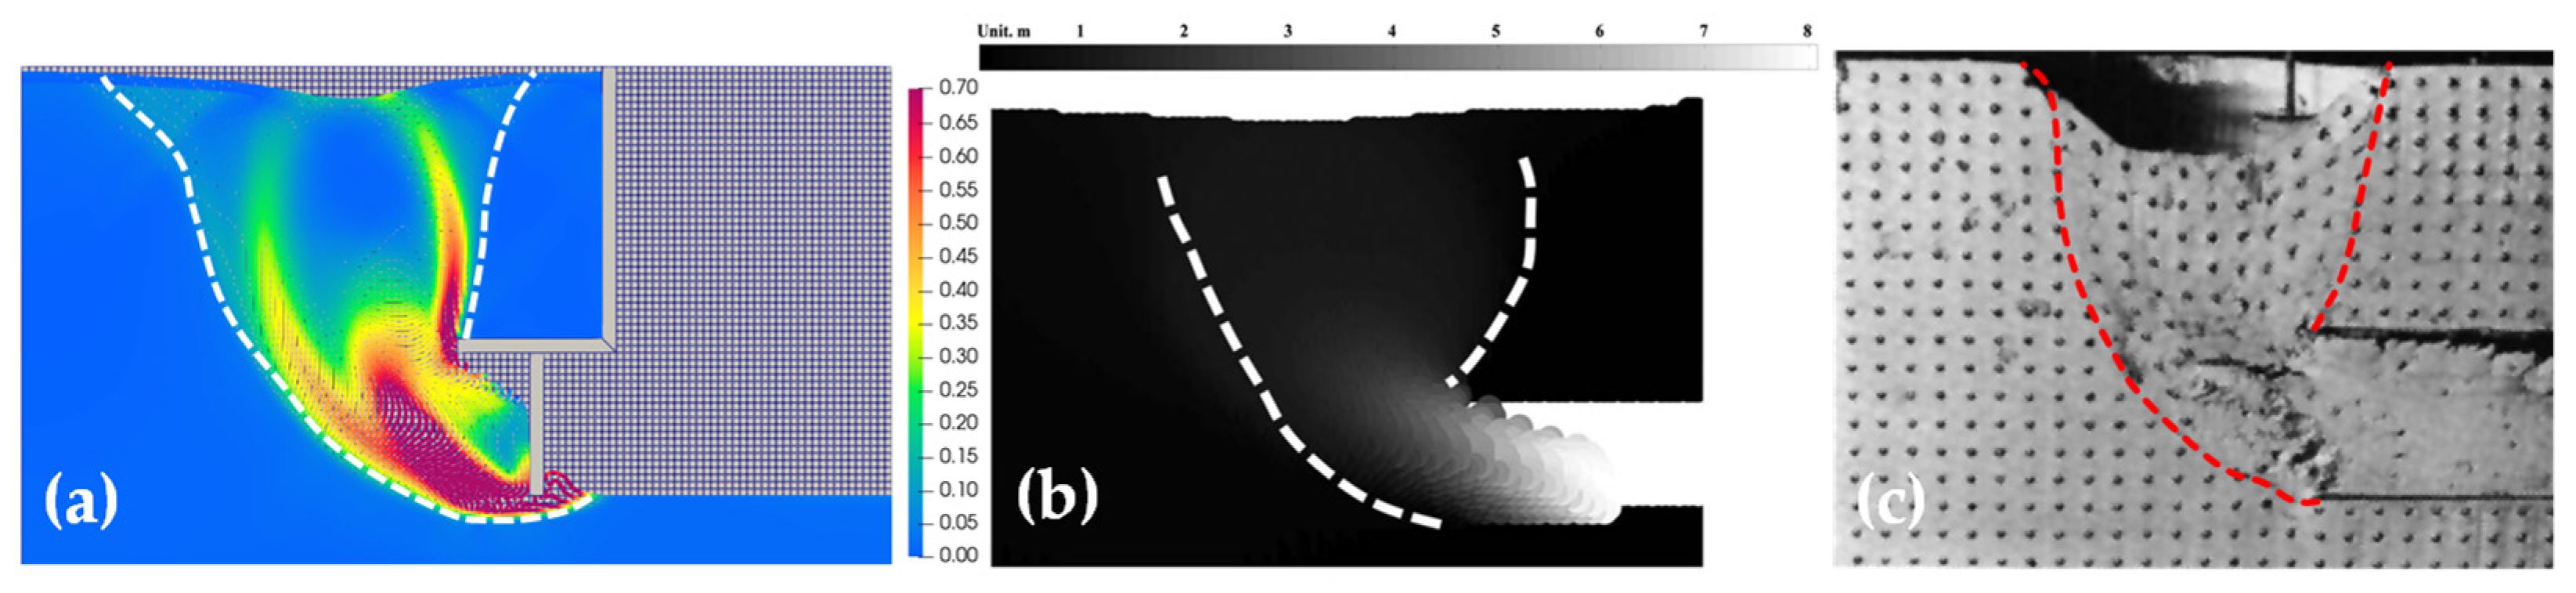
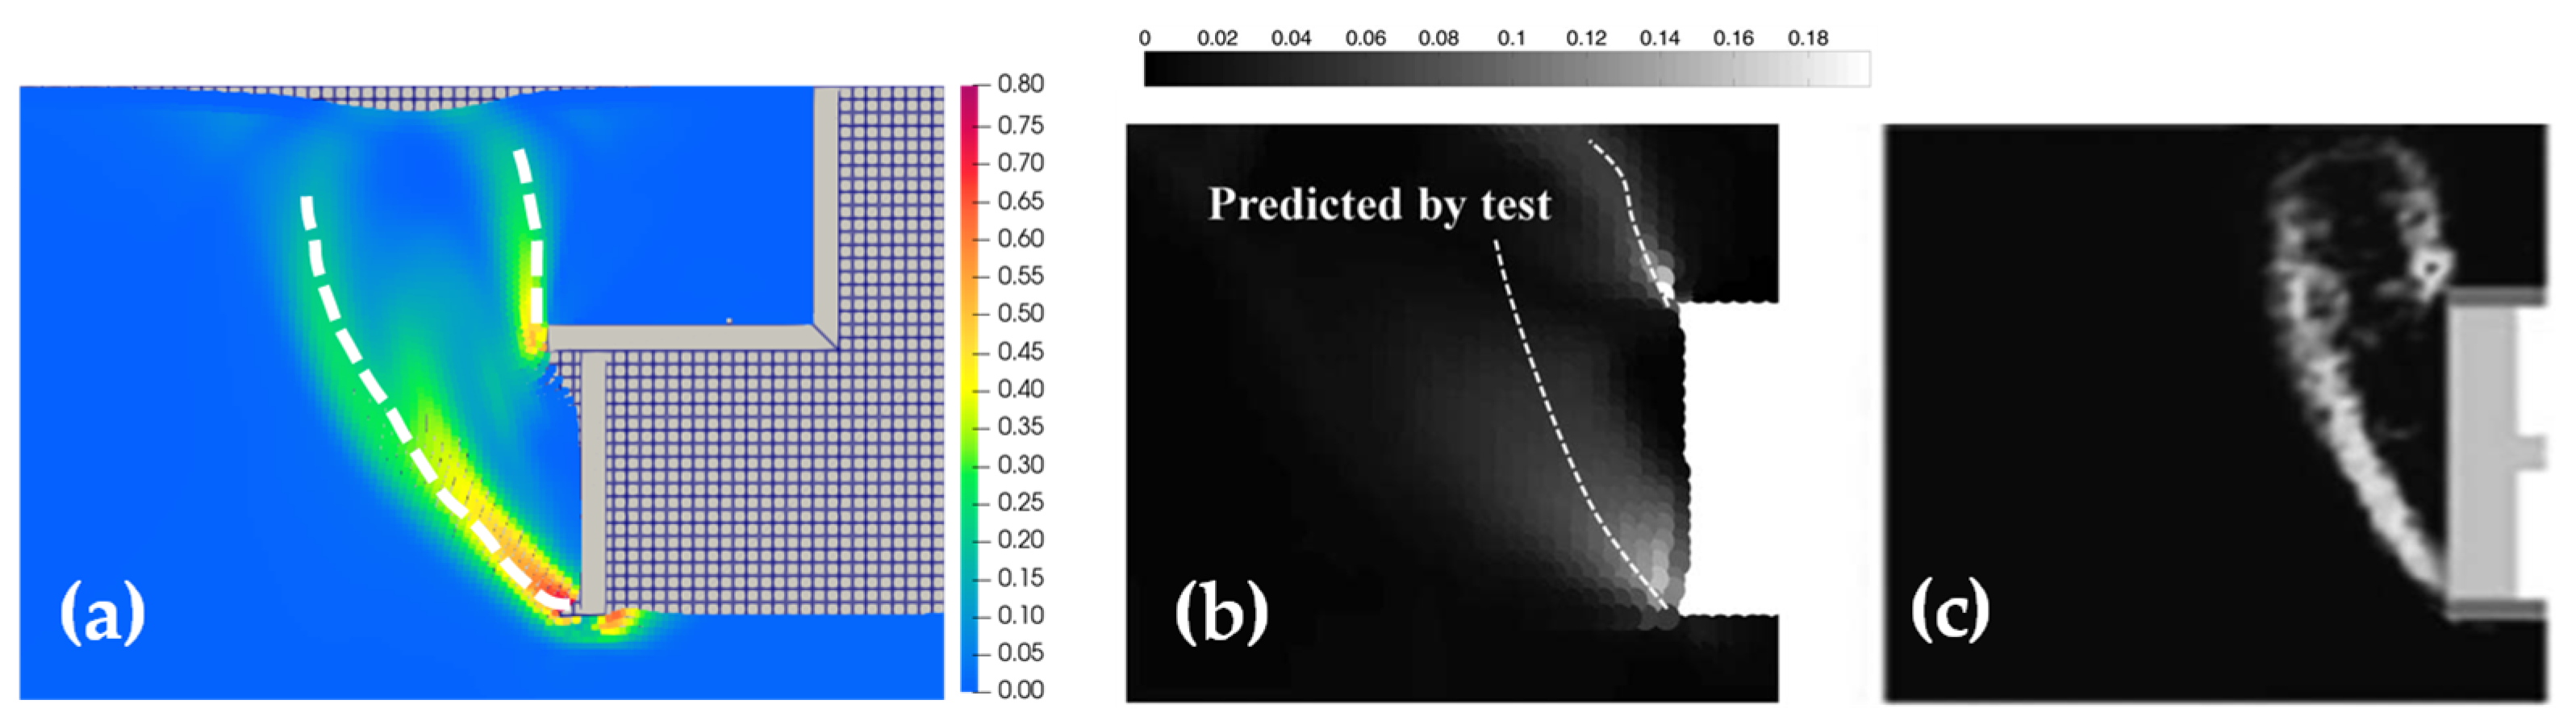
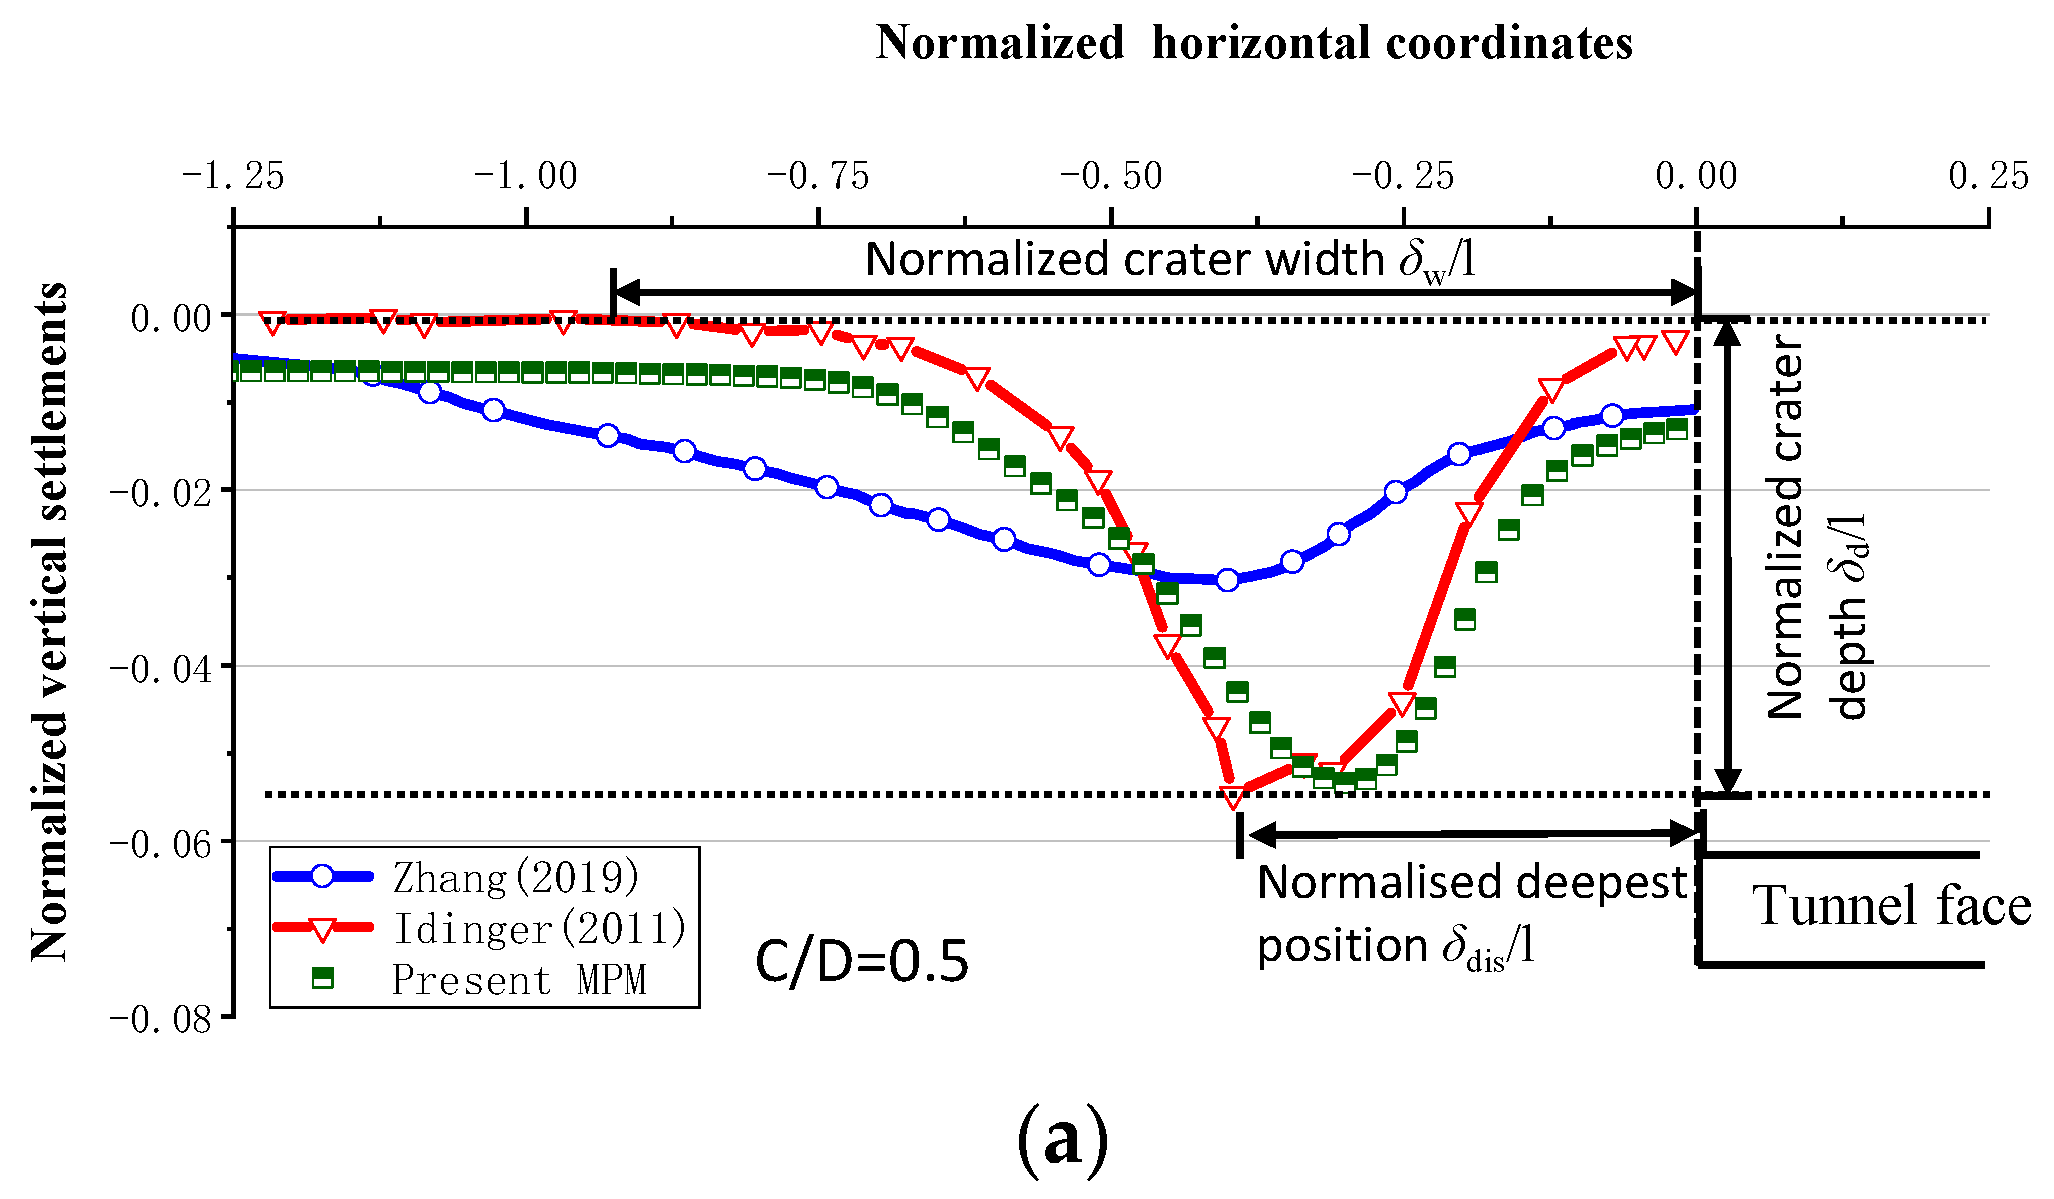
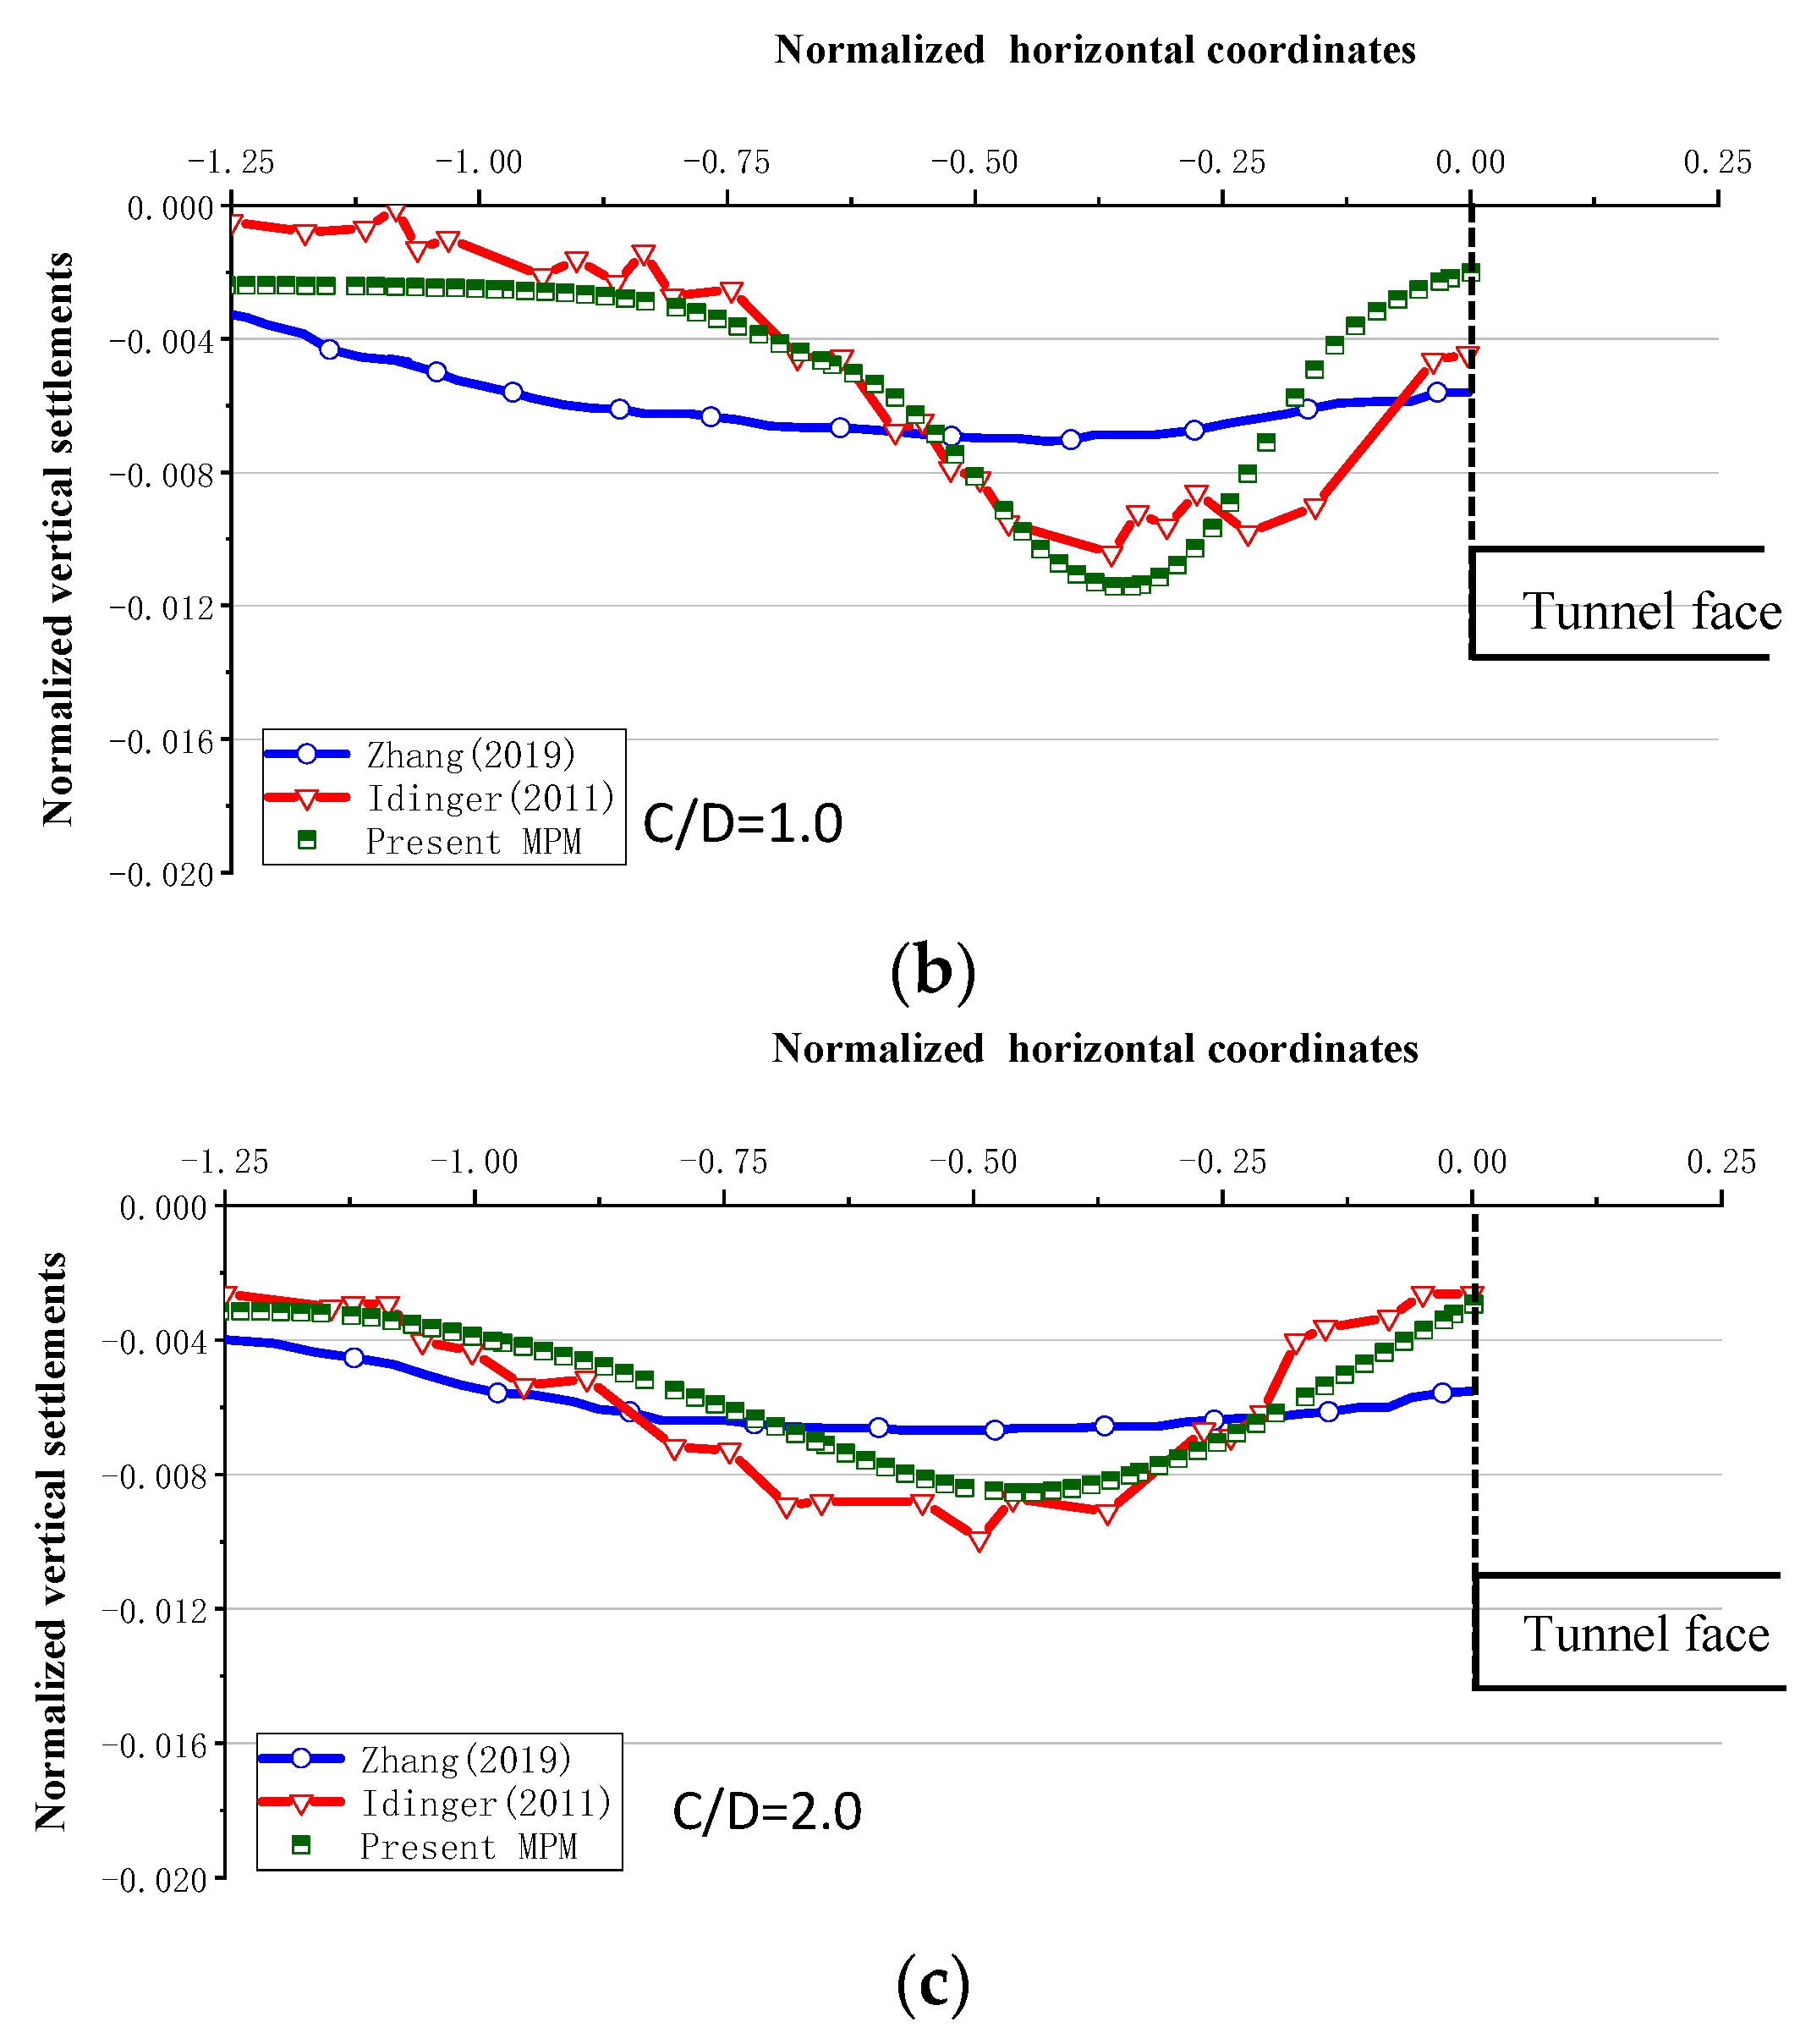
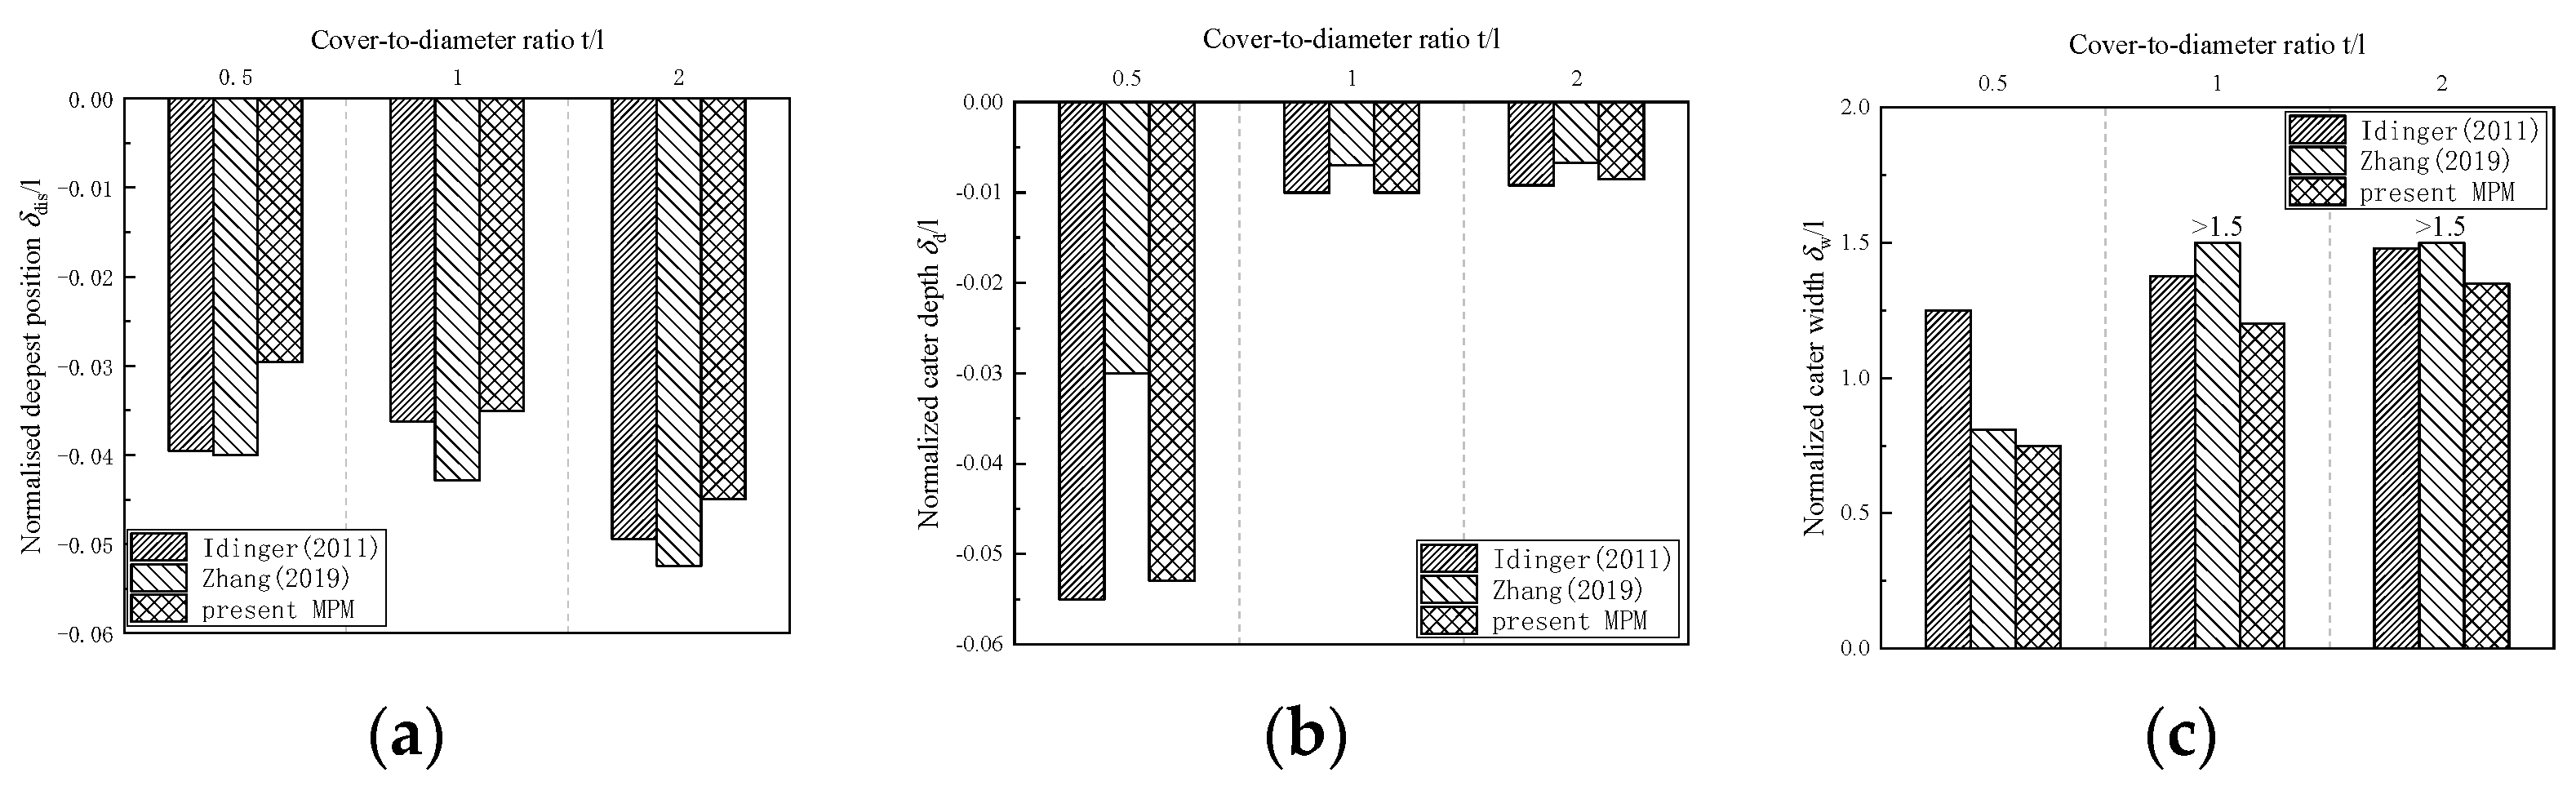
Zhang et al. [47] investigated the collapse behavior of shallow tunnels under open excavation conditions using the SPH method and compared it with the results of centrifugal tests by Idinger et al. [44], which were also investigated by Schofield [52] with similar tests. In order to further verify the effectiveness of the MPM method used in this paper in simulating the settlement and collapse of the ground surface caused by insufficient support force at the tunnel face, the results of the same conditions were simulated when the displacement of the face was 5% of the tunnel diameter for the diameter-to-depth ratios of t/l = 0.5, 1.0, and 2.0, and compared with the numerical results in the literature and the results of centrifugal tests. Firstly, the deformations are compared by the partial strain maps, from which it can be seen that the funnel-like rupture zones formed by the large deformations in Figure 9 or the extension paths of the stress concentration zones under the smaller deformations in Figure 10 are similar to the SPH results as well as the centrifugal test results. Secondly, the longitudinal horizontal settlement of the ground surface is plotted, and the comparison results are shown in Figure 11, which shows that the longitudinal surface settlement contours obtained by the MPM method used in this paper are much closer to the centrifugal test of Idinger et al. compared with the SPH method adopted by Zhang et al. Finally, the key parameters are defined for a more intuitive comparison: (a) normalized deepest position δdis/l, (b) normalized crater width δw/l, (c) normalized crater depth δd/l, where δdis denotes the horizontal distance from the location of the maximum depth of the longitudinal settlement to the initial position of the tunnel’s palisade face, while δw and δd denote the width and depth of the longitudinal settlement crater, respectively, are defined and normalized, and the image parametric The results of the normalization are detailed in Figure 12. Although the simulation results of SPH are closer to the experimental values for the location of the maximum depth, the results of MPM adopted in this paper are better than those of SPH for both crater width and crater depth, and the SPH method underestimates the depth of the sinkhole.

Figure 9.
Comparison between the final deformation patterns from (a) present MPM, (b) Zhang et al., SPH (2019) [47], and (c) Schofield, centrifuge test (1980) [52].
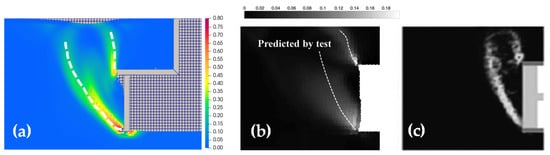
Figure 10.
Comparison between the shear bands from (a) present MPM, (b) Zhang et al., SPH (2019) [47], and (c) Idinger et al., centrifuge test (2011) [44].
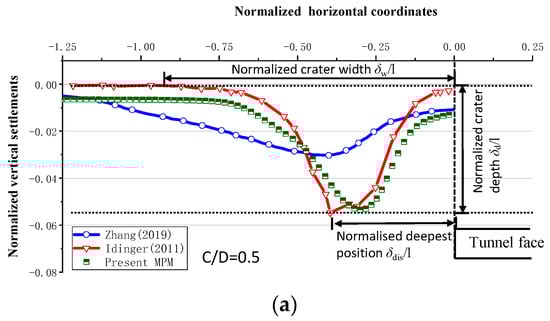

Figure 11.
Final surface settlement under the conditions of (a) C/D = 0.5; (b) C/D = 1.0; (c) C/D = 2.0. (The mentioned references are Zhang et al. (2019) [47], Idinger et al. (2011) [44]).

Figure 12.
Comparison of (a) normalized deepest position; (b) normalized crater depth; (c) normalized crater width. (The mentioned references are Zhang et al. (2019) [47], Idinger et al. (2011) [44]).
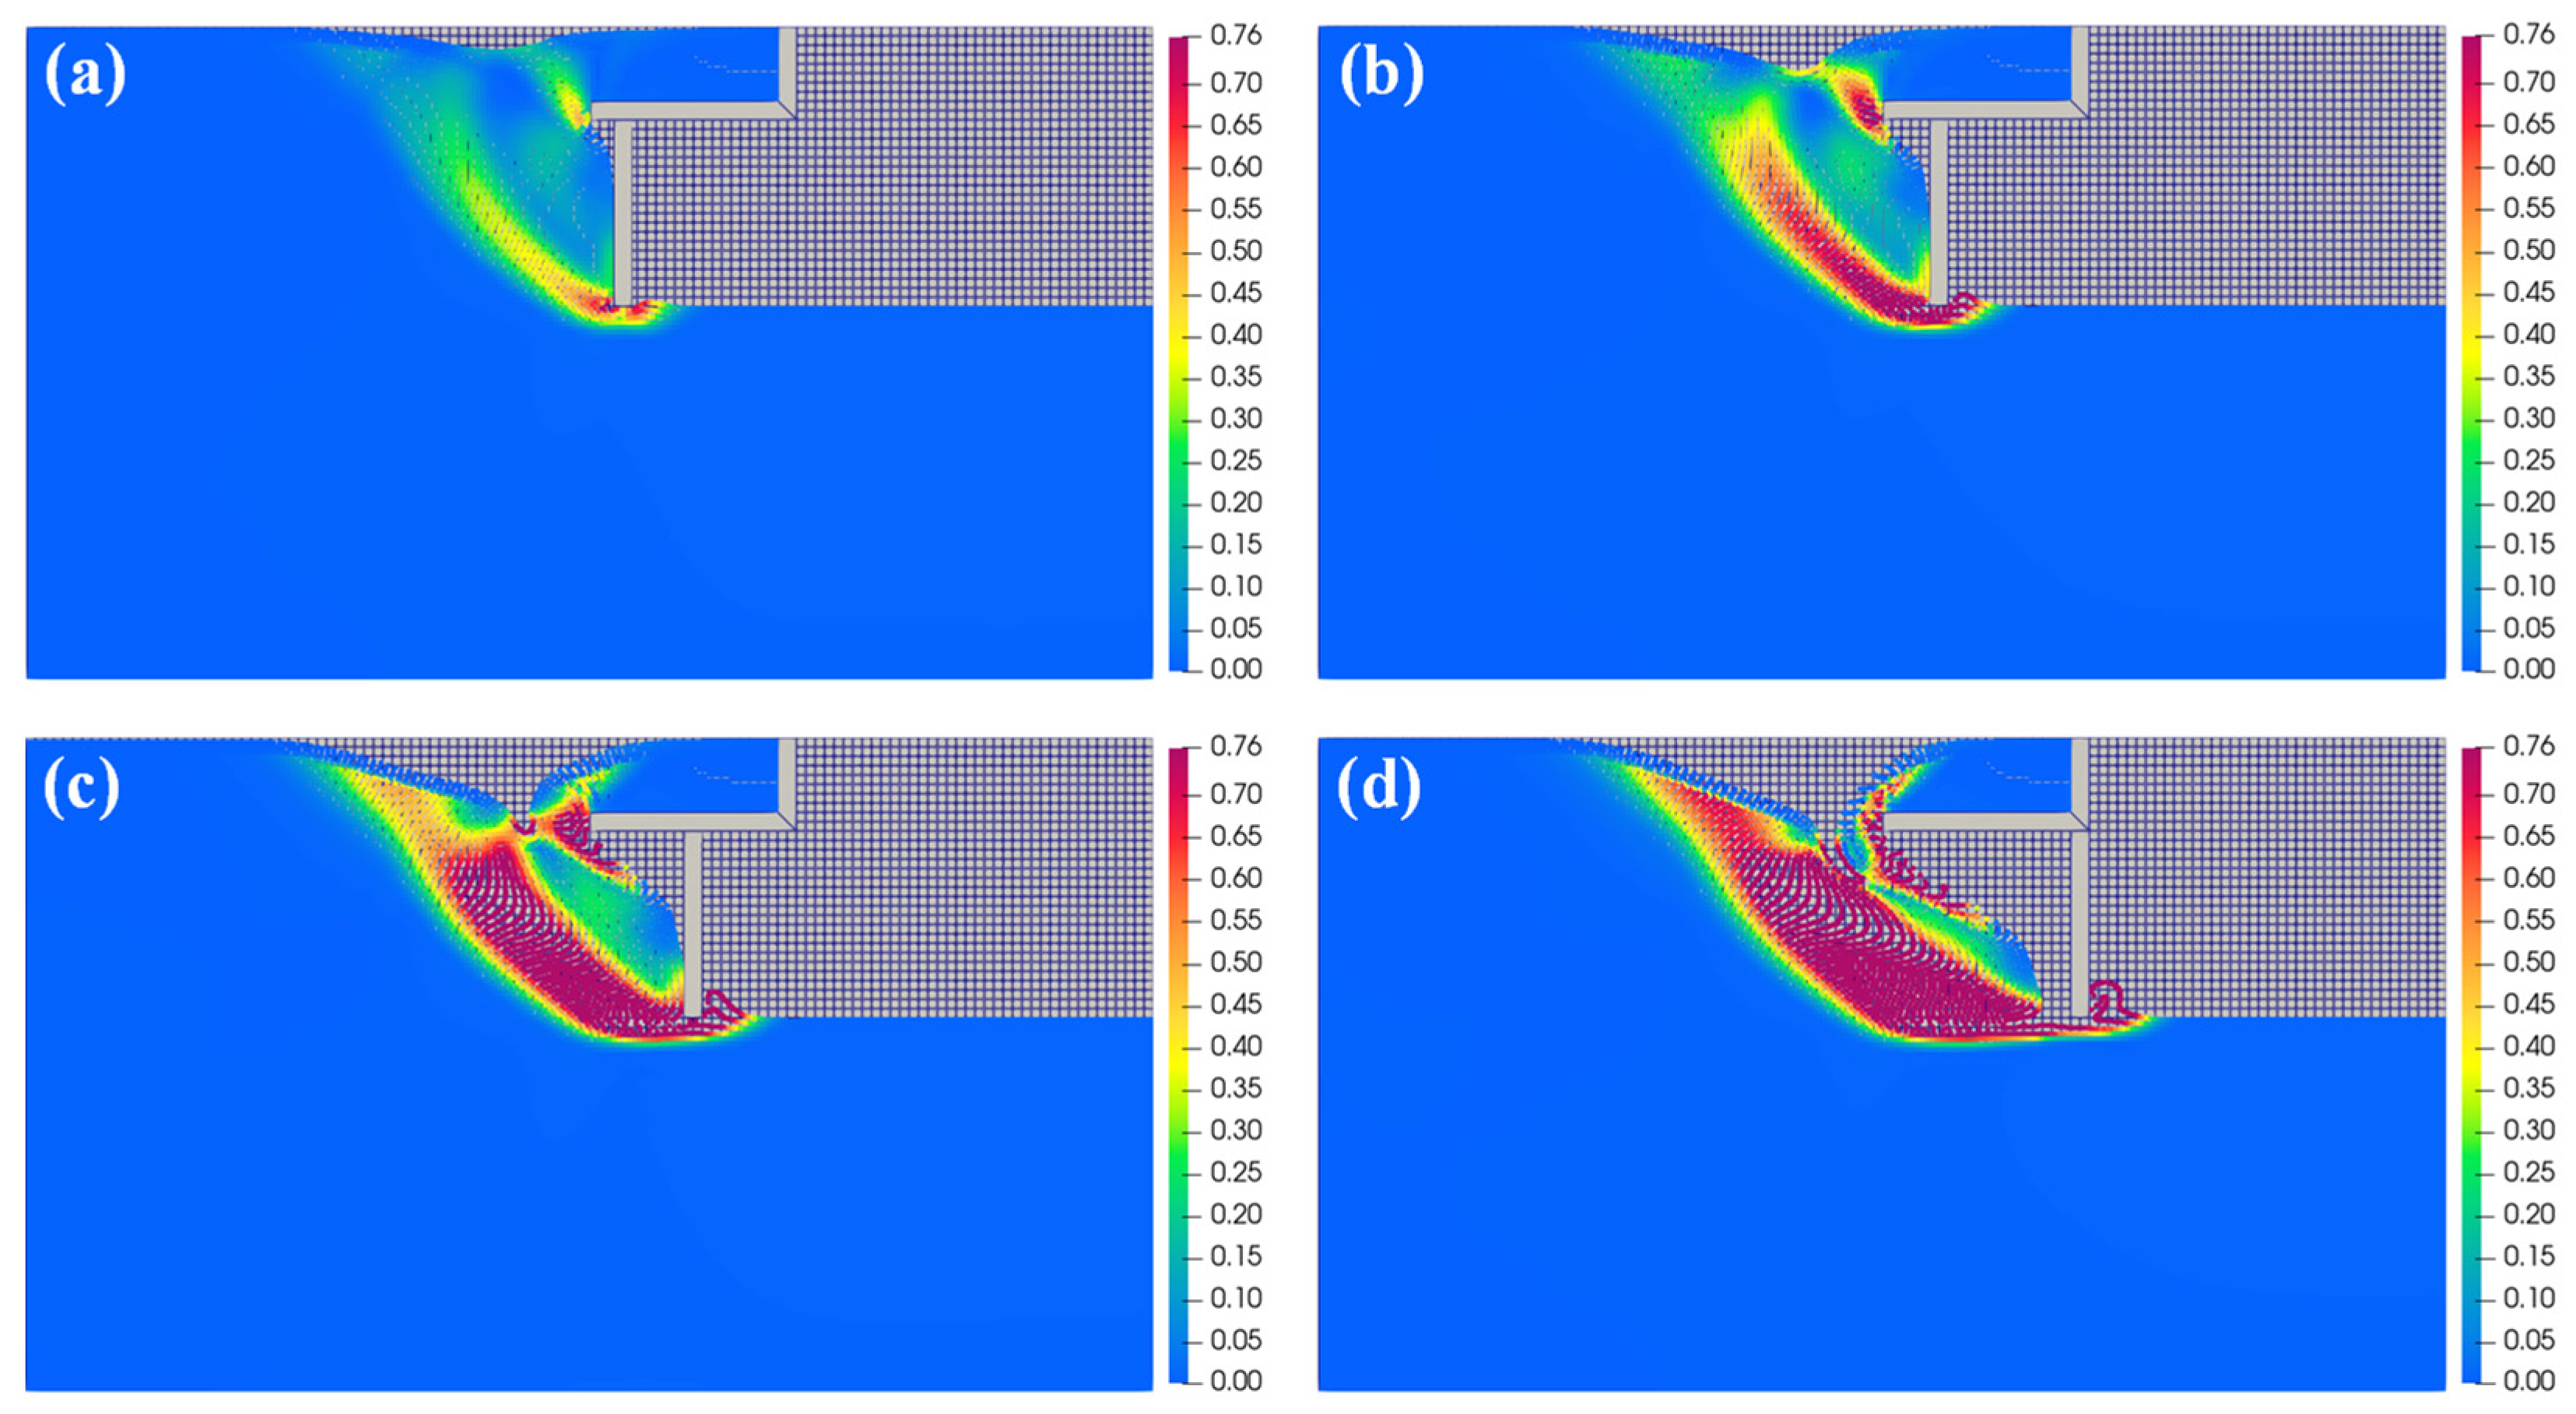
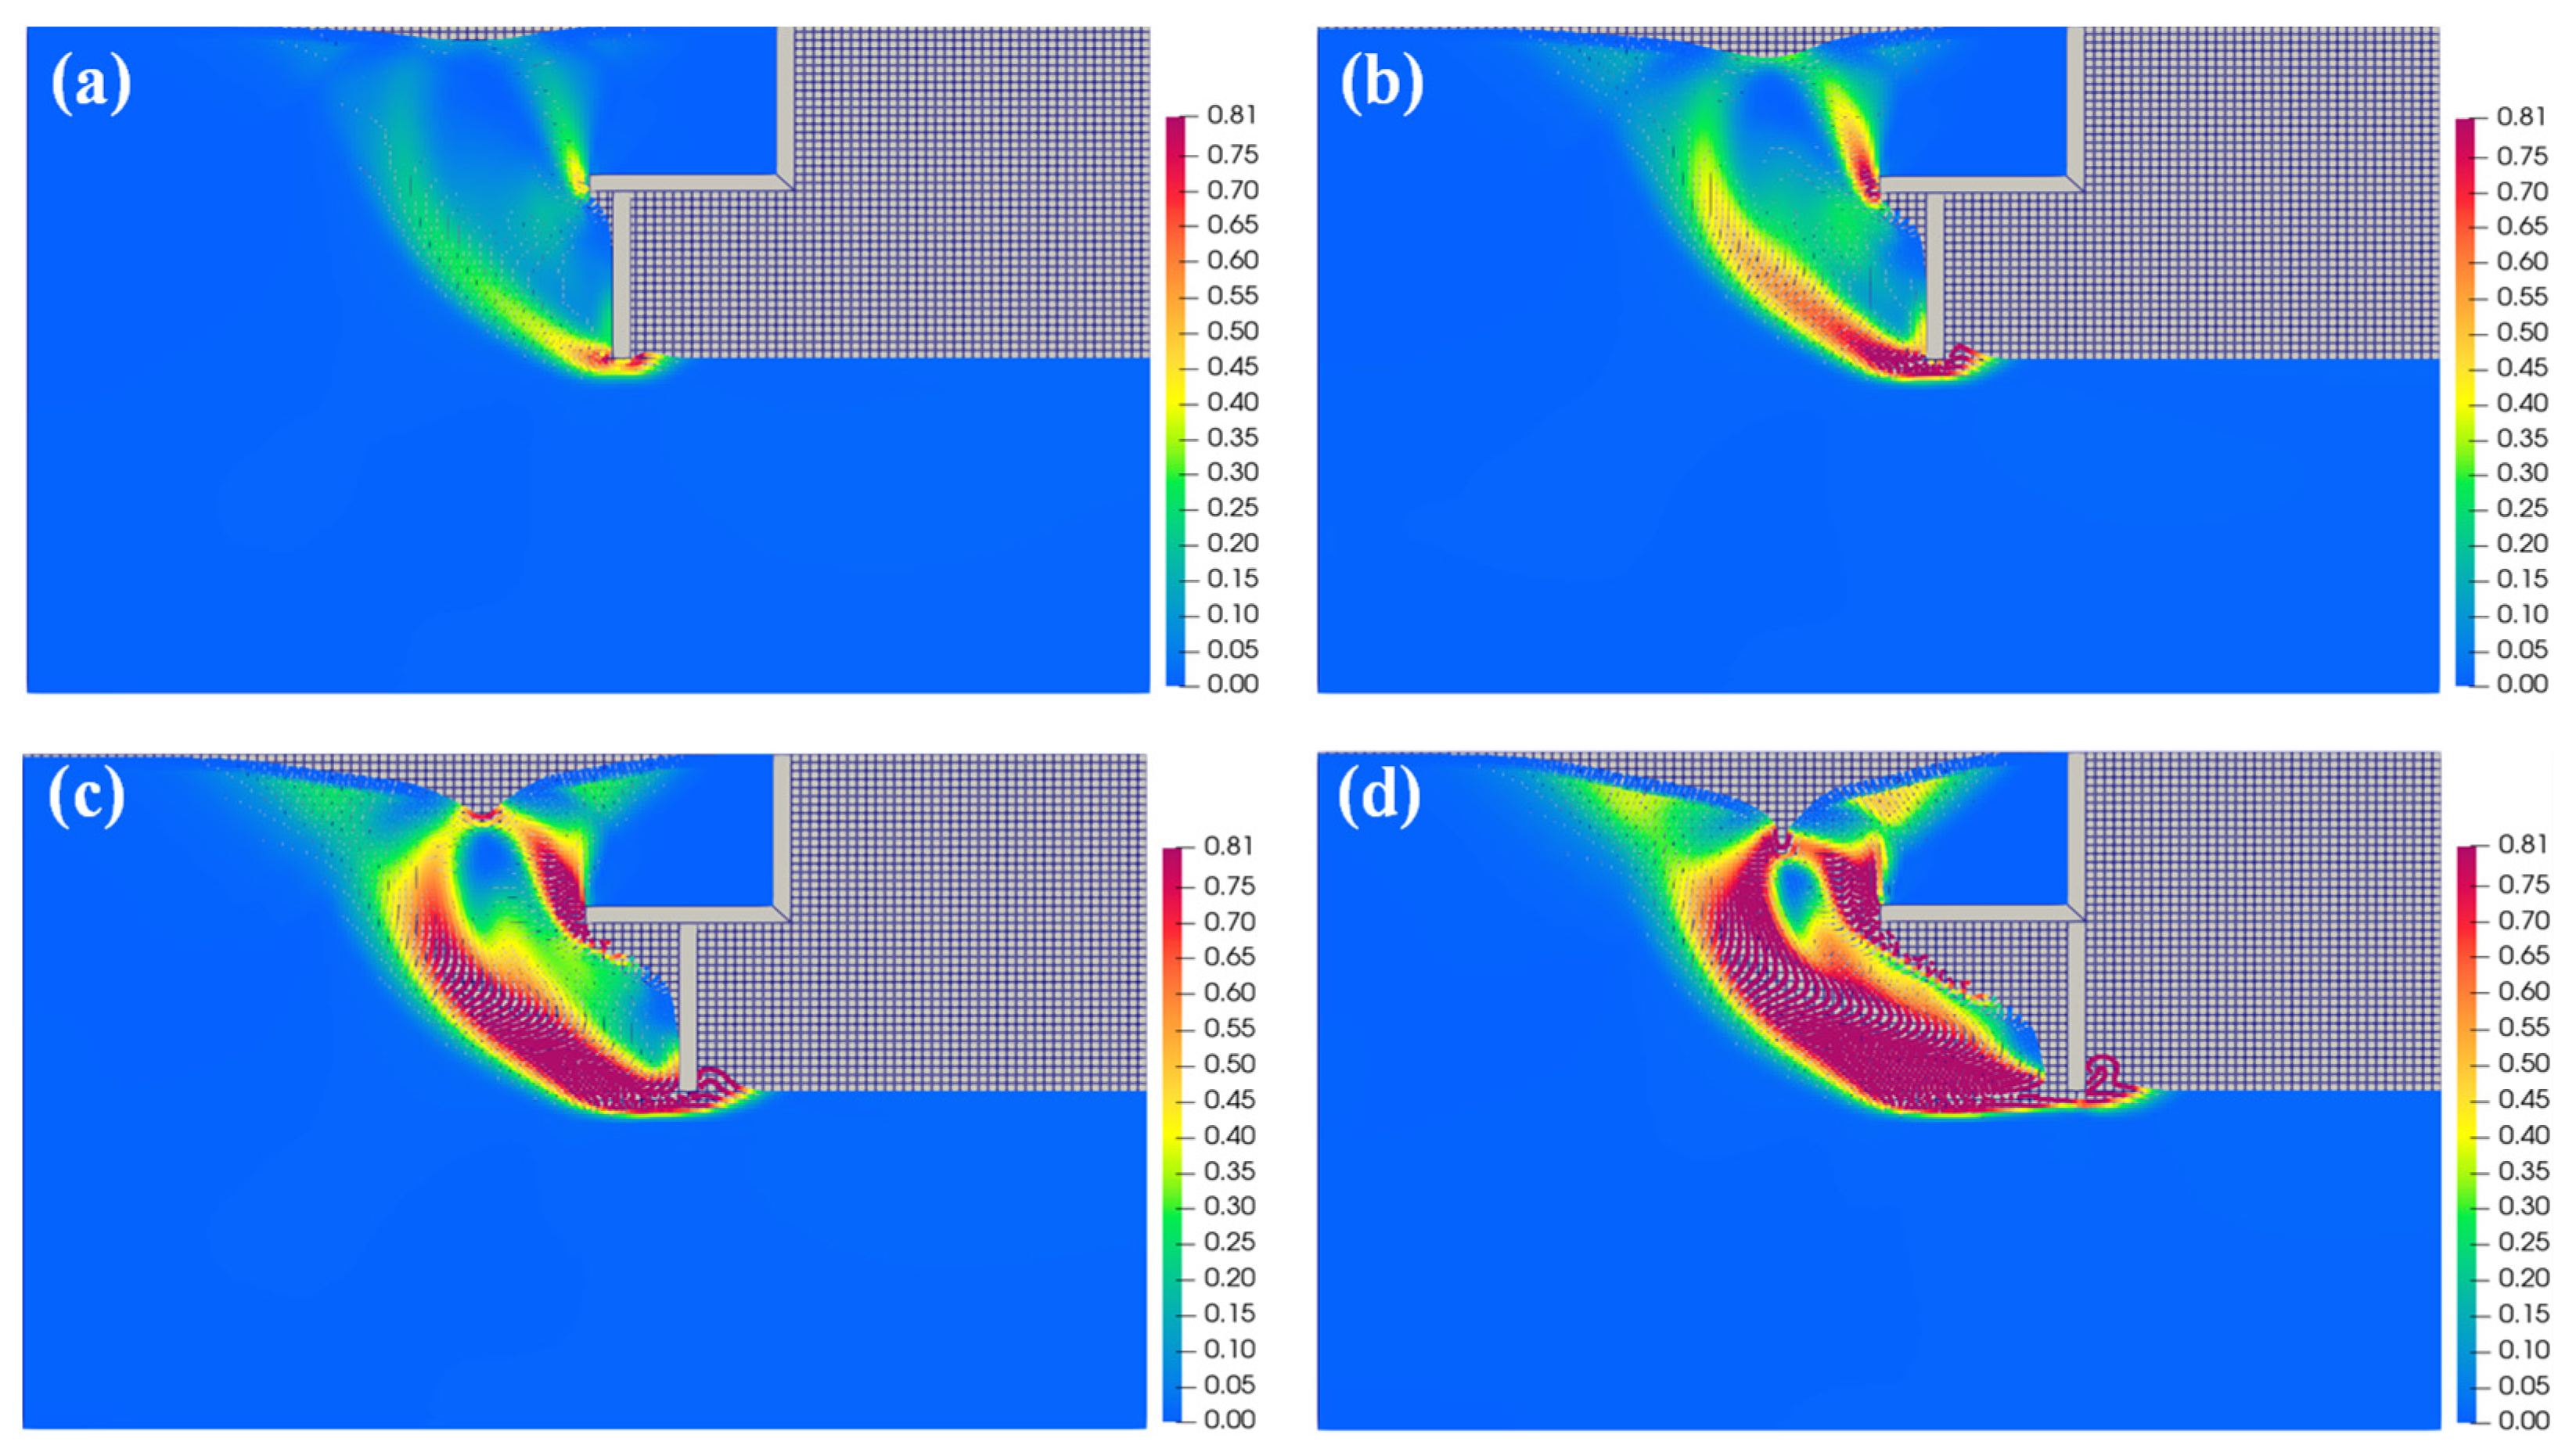
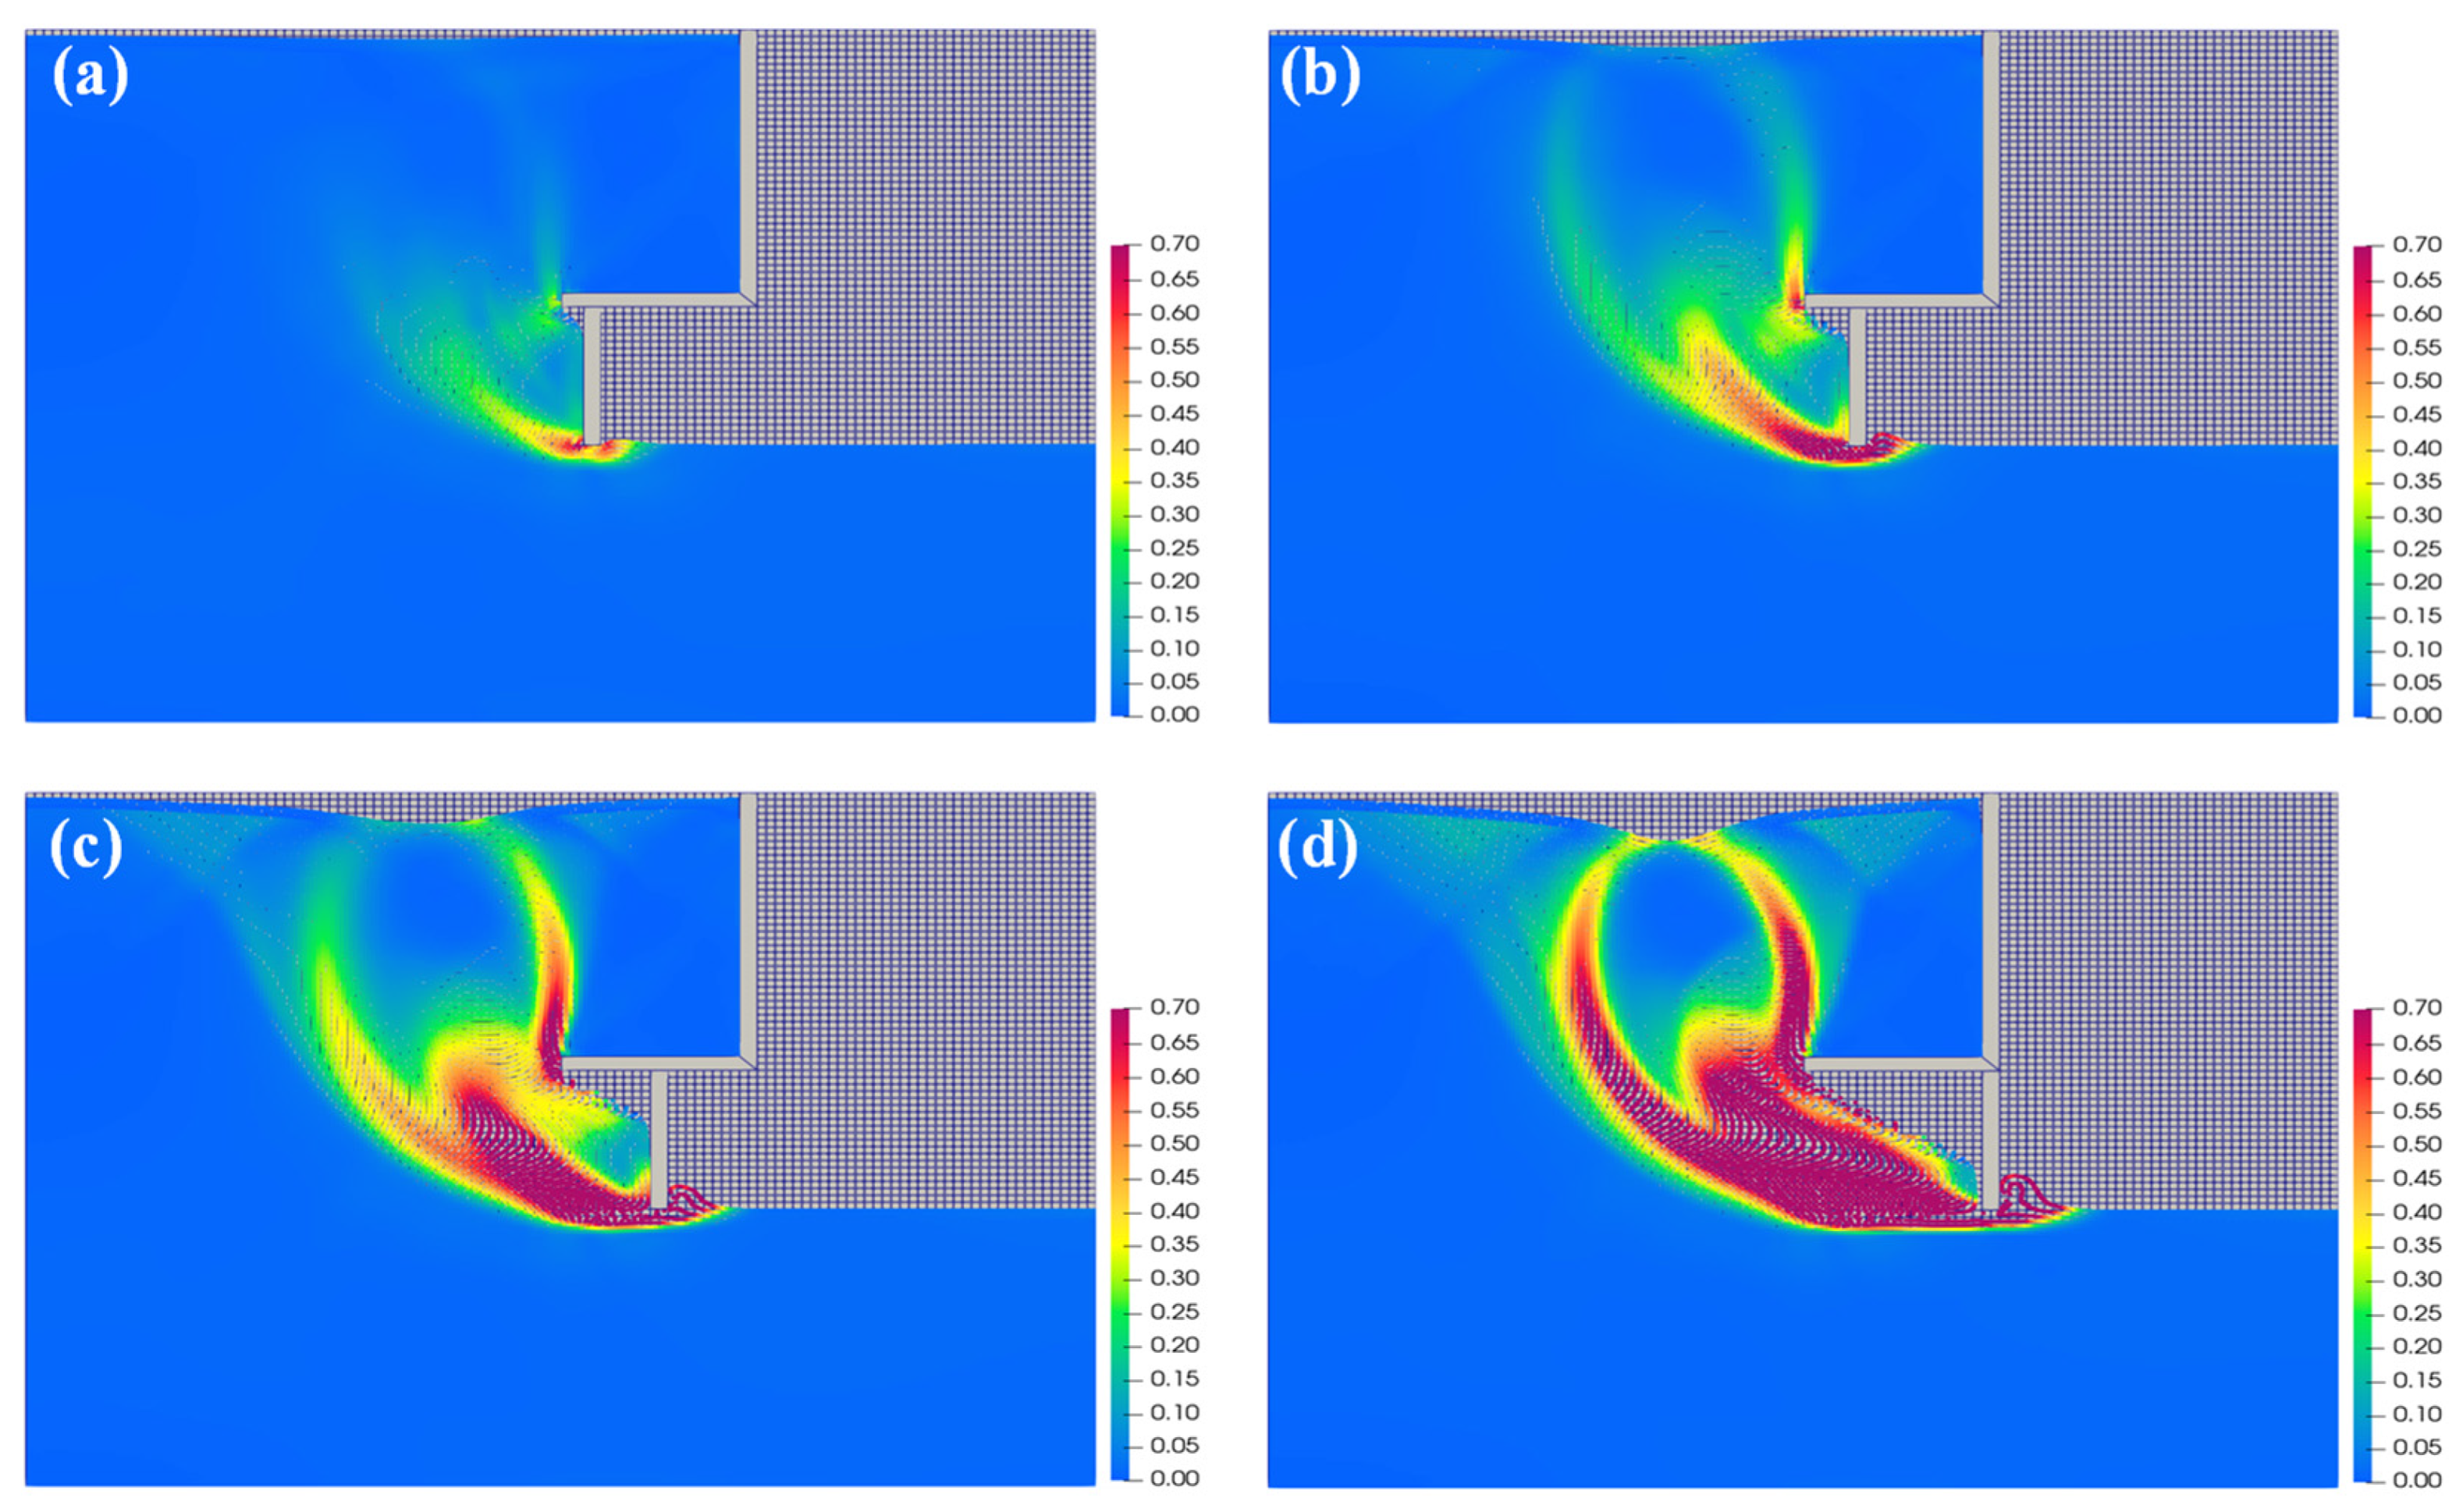
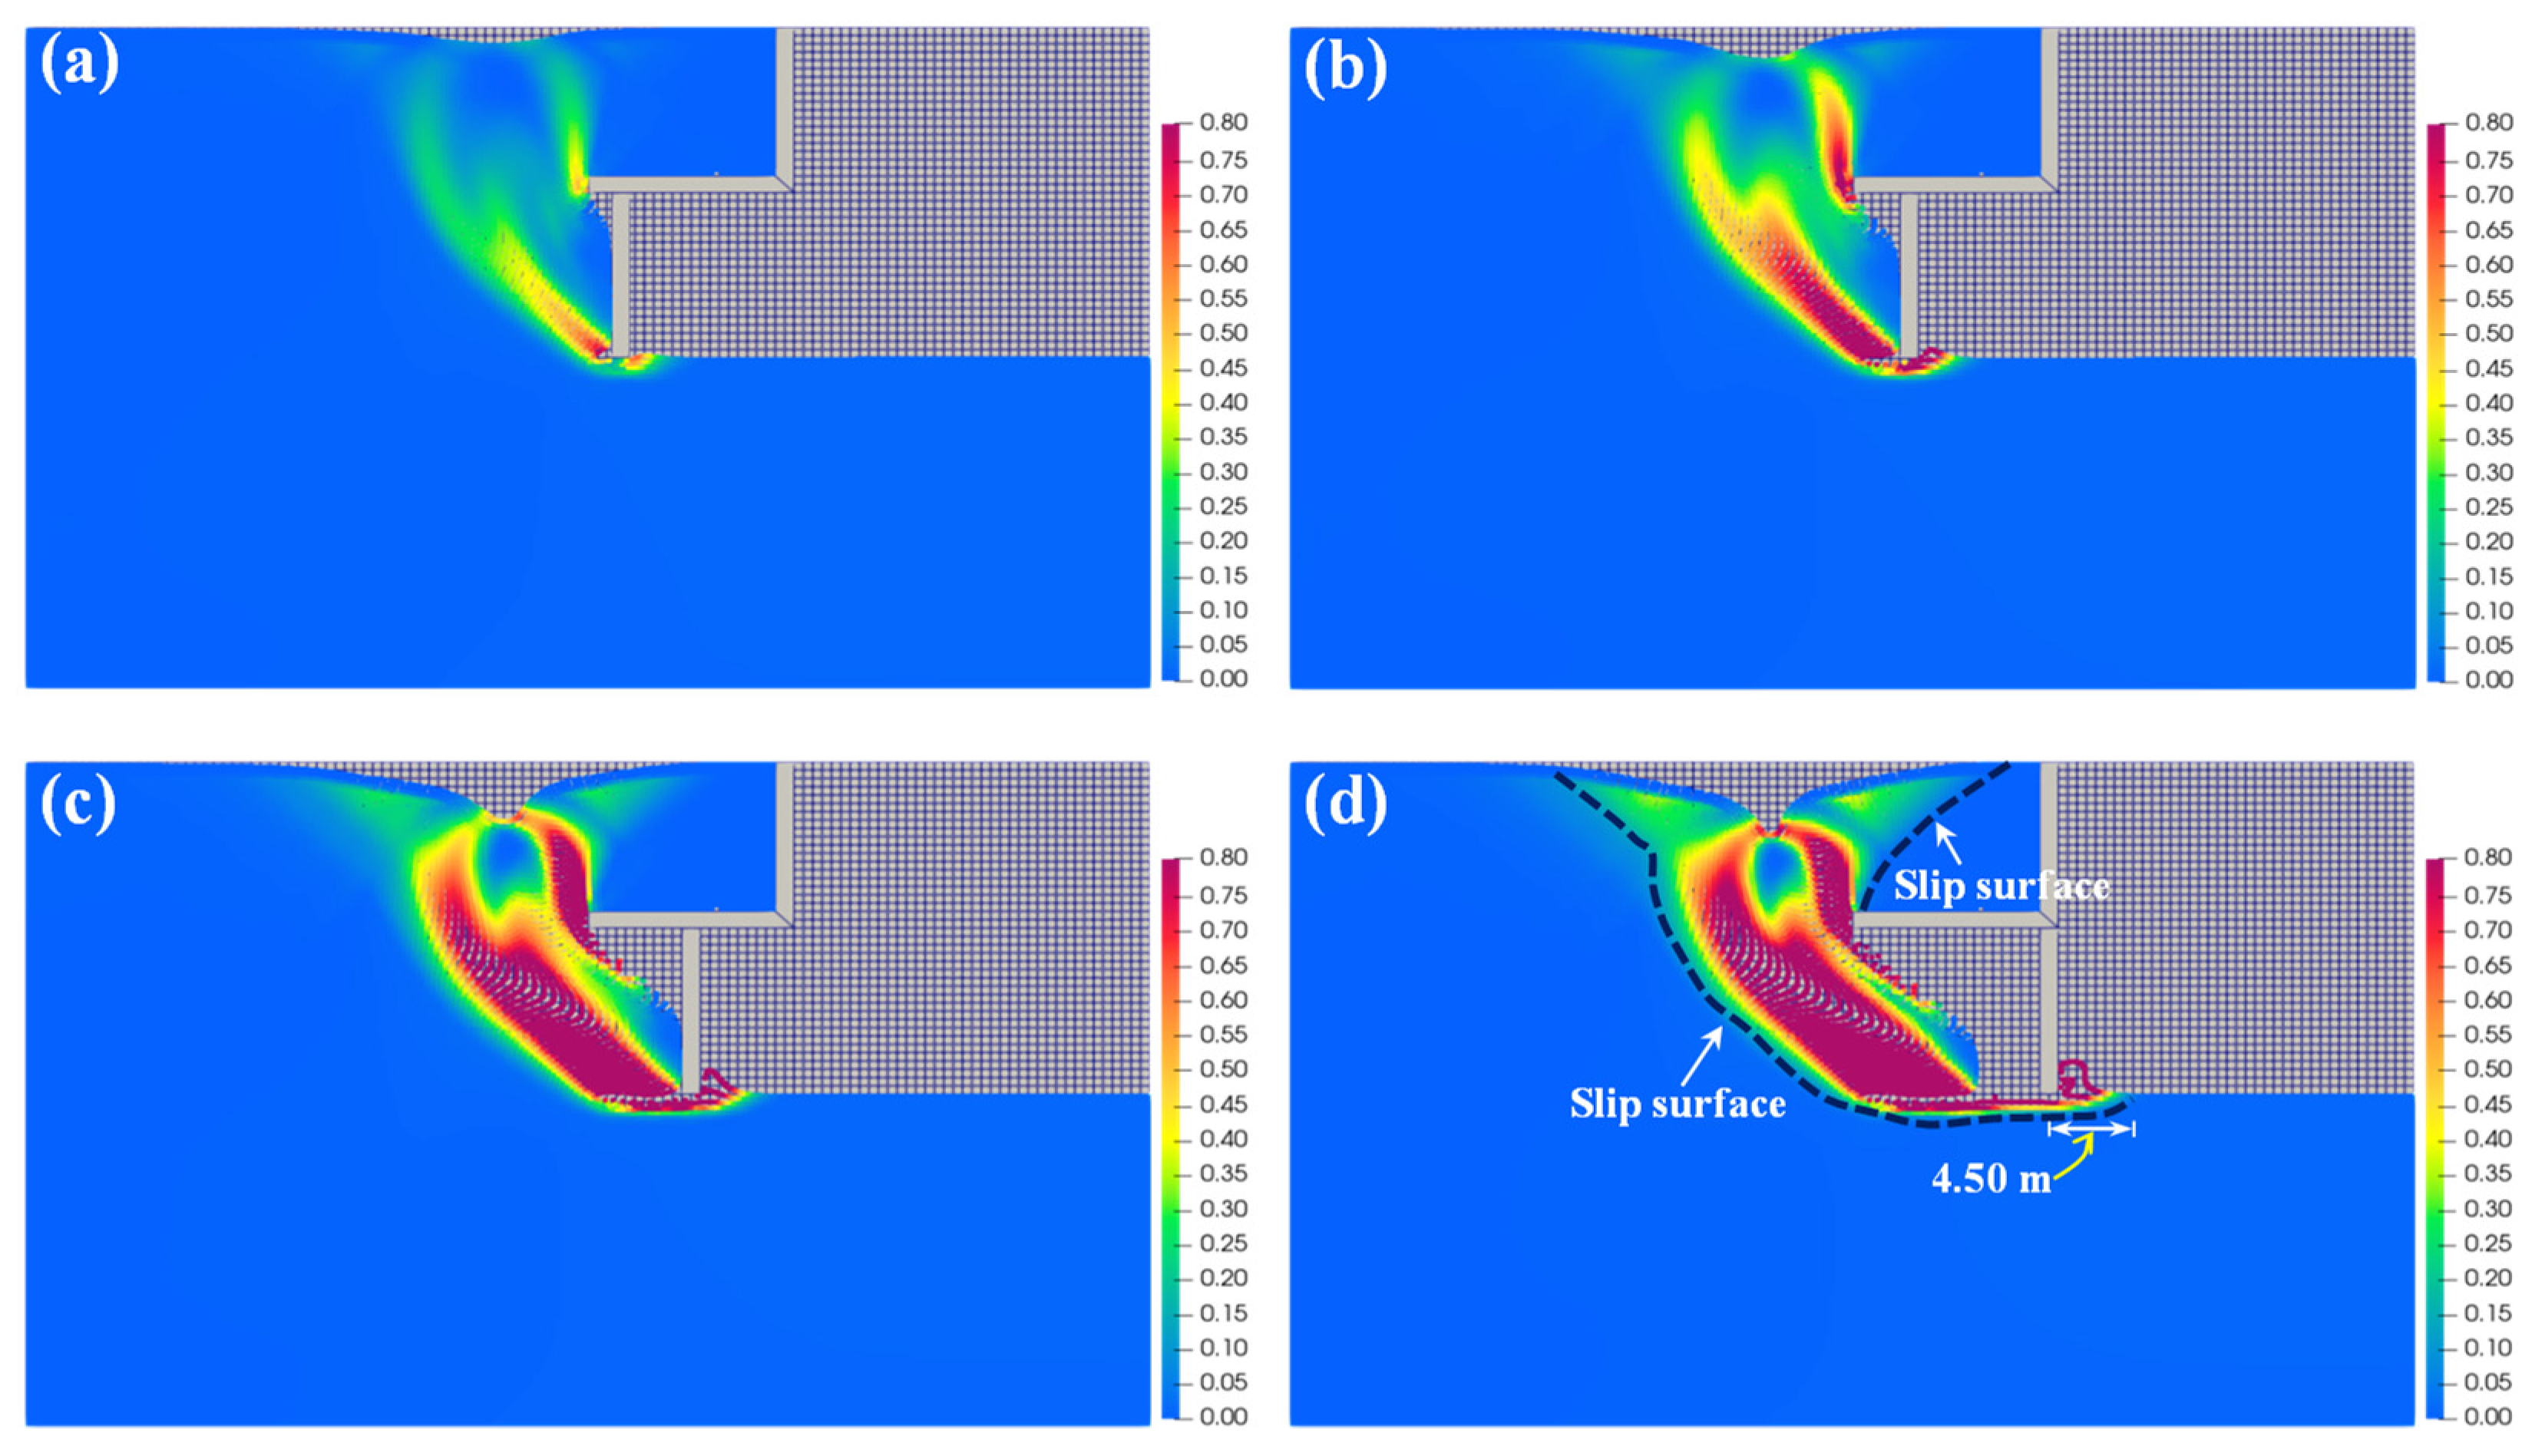
Figure 13, Figure 14 and Figure 15 depict the complete process of soil collapse induced by tunnel face displacement disturbance (δh = 1.25, 2.50, 5.00, and 10.00 m) under three distinct overburden heights. The simulation results depict the spatial distribution of shear strain at the site. Observations indicate that the construction disturbance promptly initiates plastic shear bands originating from both ends of the tunnel face. As the tunnel face progresses towards the right, the localized plastic zones gradually extend toward the top surface of the overlying soil strata, eventually penetrating its surface. A comparison of deformation states at various times following construction disturbance reveals significant deformation and sliding in both the tunnel face and its overlying soil mass. Consequently, this sliding induces subsidence of the neighboring road surface. With the tunnel face advancing to the right, the subsidence gradually exacerbates, culminating in face instability and ground collapse.
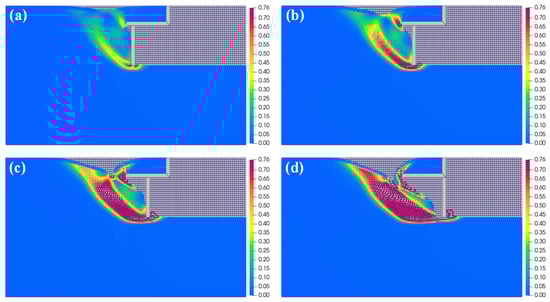
Figure 13.
The process of ground collapse induced by the displacement disturbance of the tunnel face during construction (t = 5 m, t/l = 0.5): δh = (a) 1.25, (b) 2.50, (c) 5.00, and (d) 10.00 m.
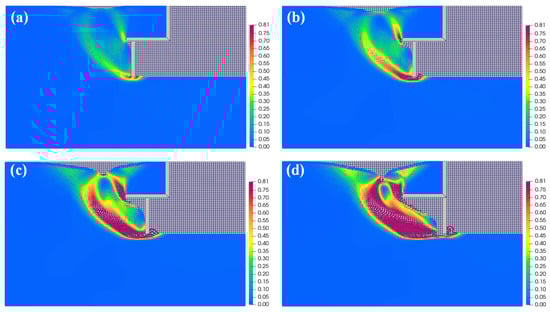
Figure 14.
The process of ground collapse induced by the displacement disturbance of the tunnel face during construction (t = 10 m, t/l = 1.0): δh = (a) 1.25, (b) 2.50, (c) 5.00, and (d) 10.00 m.
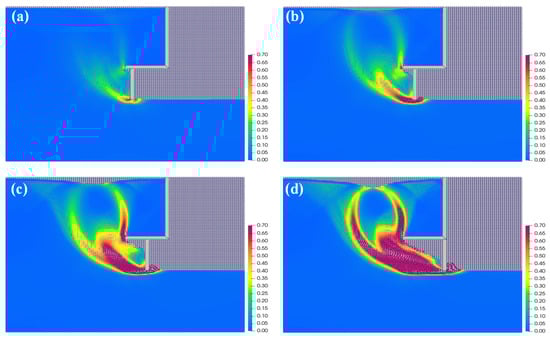
Figure 15.
The process of ground collapse induced by the displacement disturbance of the tunnel face during construction (t = 20 m, t/l = 2.0): δh = (a) 1.25, (b) 2.50, (c) 5.00, and (d) 10.00 m.
Compared to the collapse deformation motion states illustrated in Figure 7 and Figure 8, it is evident that the thicknesses of overlying strata notably influence the trajectory, depth, width, and evolution trend of the collapse. A greater thickness of overlying strata corresponds to less severe collapse. The collapse primarily occurs in the soil mass areas on the left side of the tunnel face following its movement, leading to substantial deformation. These areas are surrounded by localized plastic shear bands on both sides, demonstrating that the collapse characteristics are influenced by the shape and evolution of these shear bands. With thinner overlying soil layers, the inclination angle of the shear slip surface originating from both ends of the tunnel face is larger. Conversely, thicker overlying soil layers result in a gradual decrease in the inclination angle of the shear slip surface from the tunnel face to the ground surface. This leads to smaller depths and larger widths of the eventual collapse in the road, aligning with real-world observations.
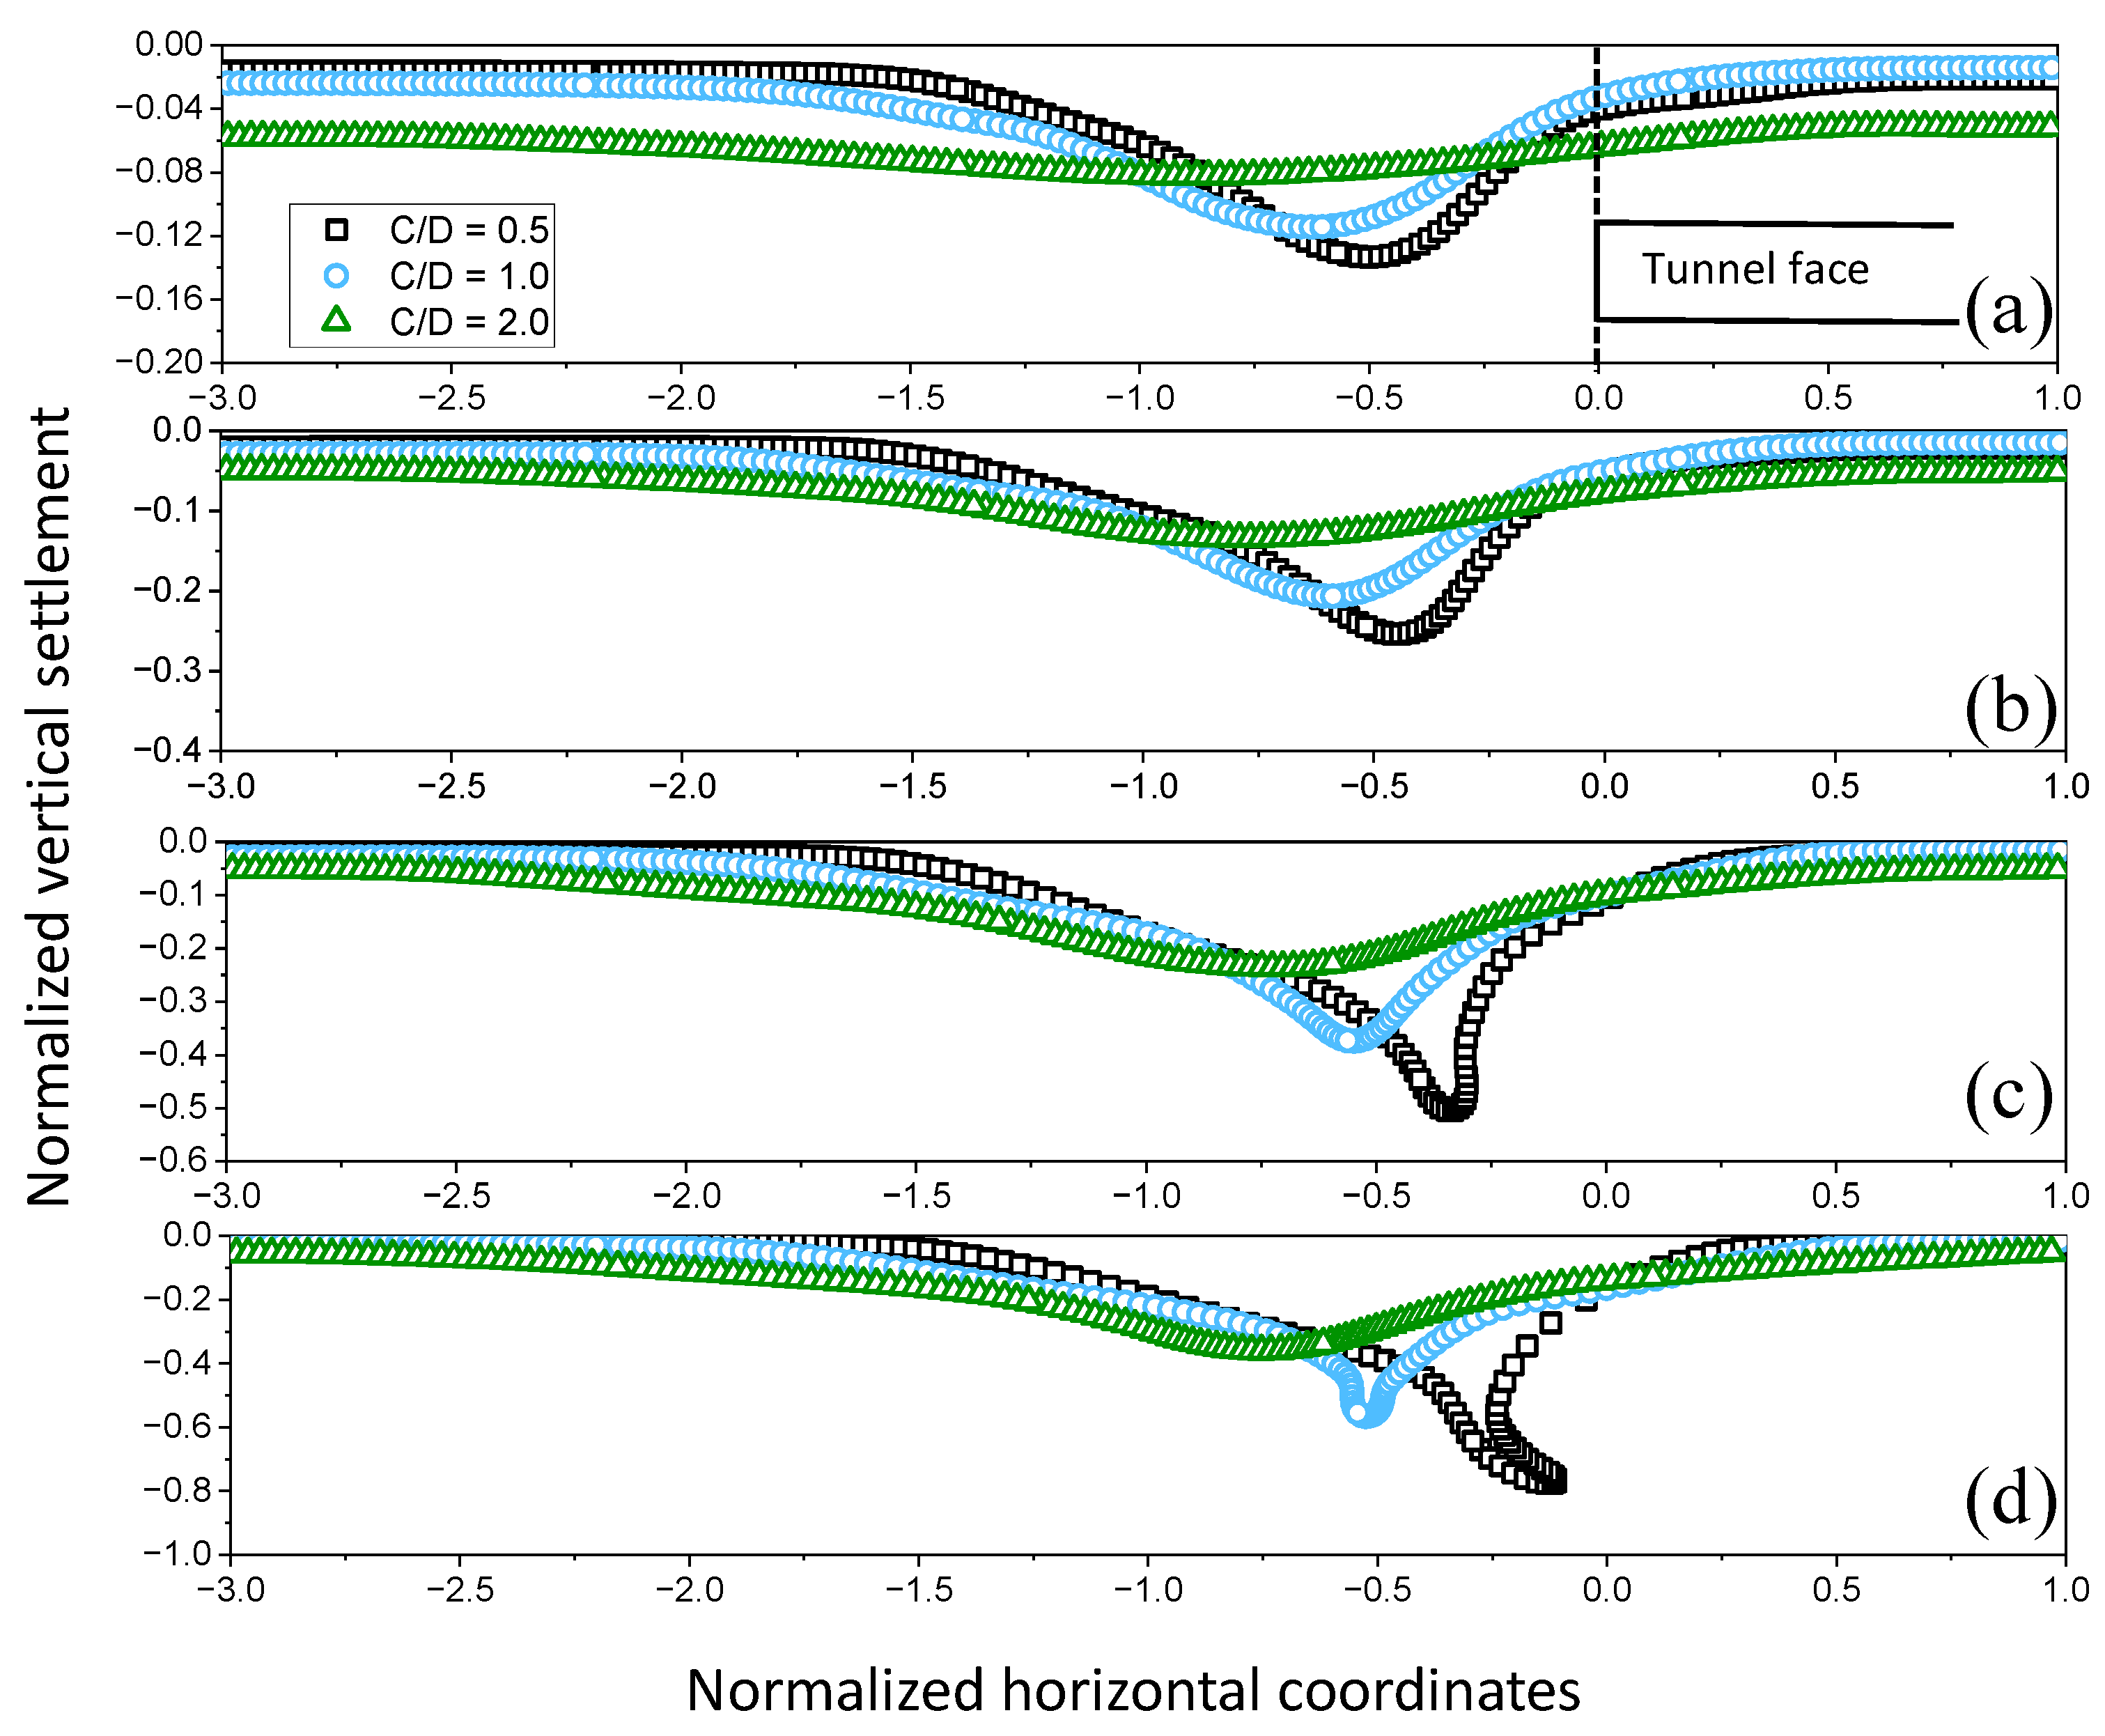
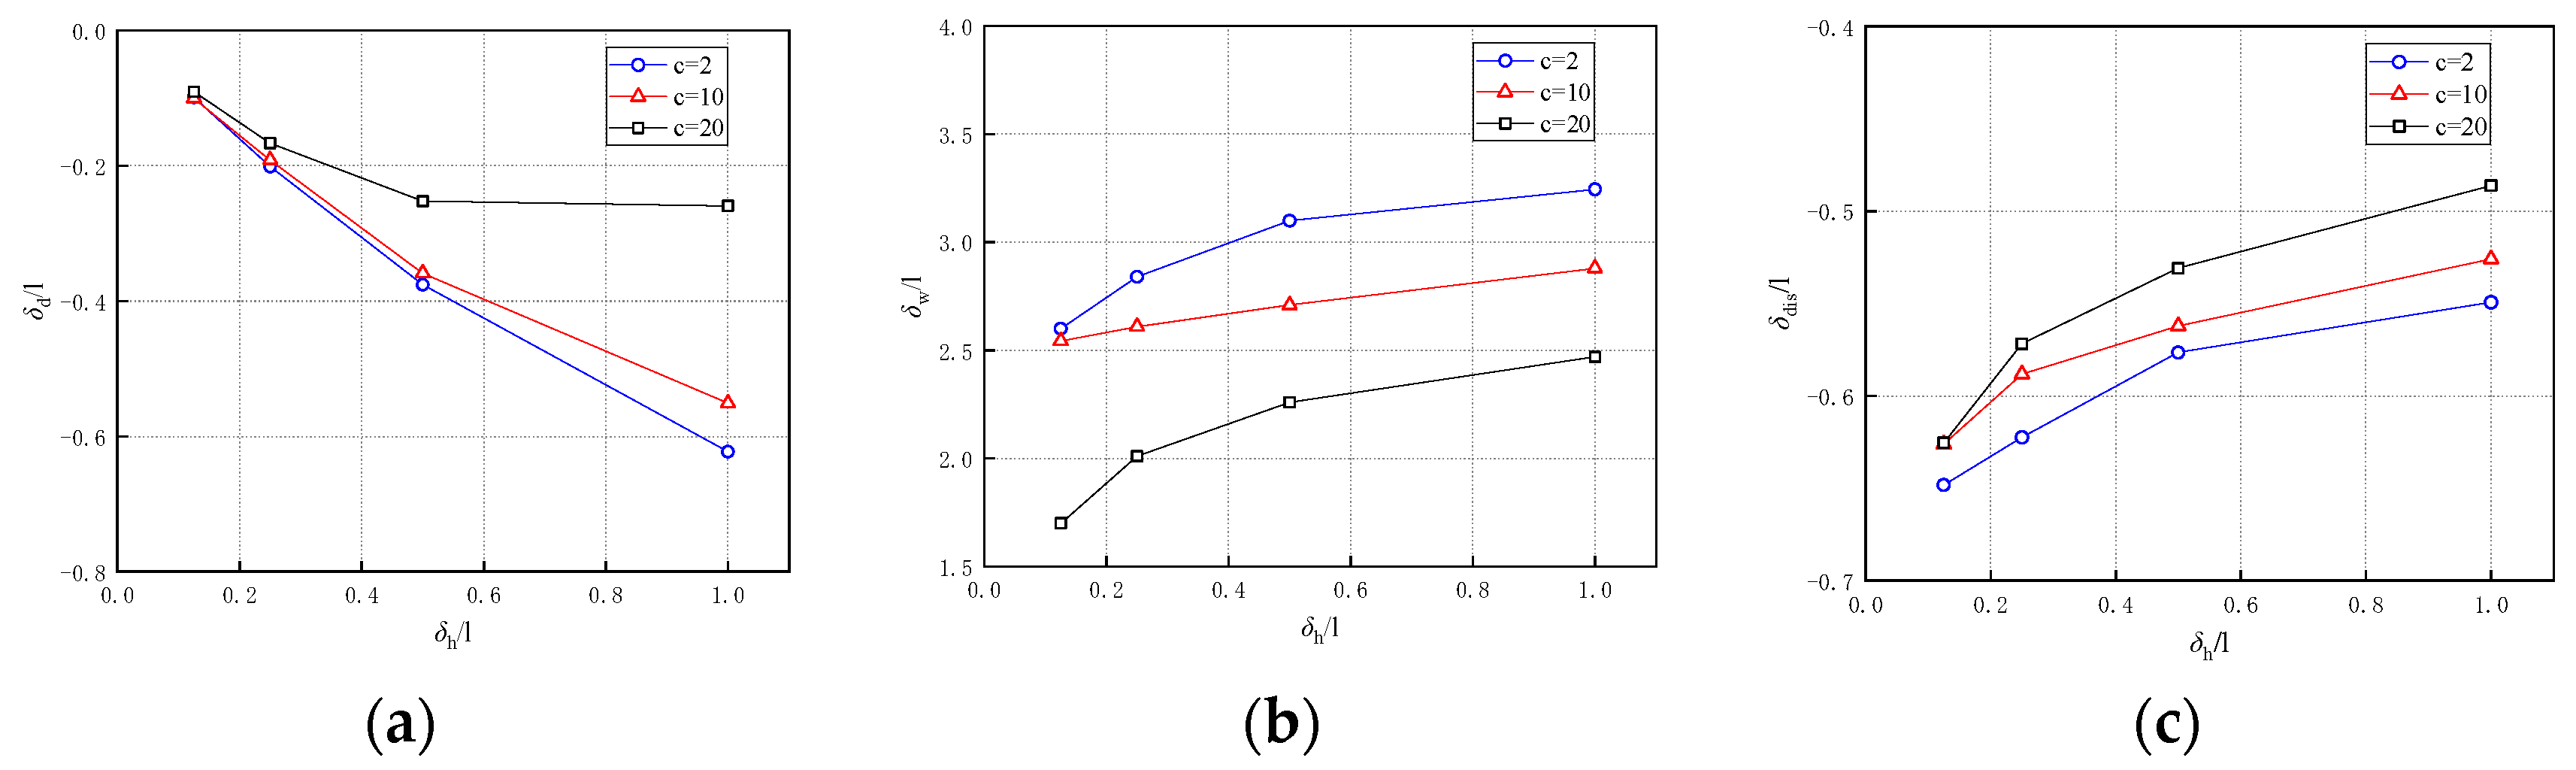
The vertical displacement of the ground surface was extracted from the deformed model and plotted in Figure 16. In order to describe the deformation more intuitively, the key parameters in the surface longitudinal settlement curve are similarly extracted, as shown in Figure 17. It can be seen that the thicker the overburden, the wider the subsidence range, the smaller the peak subsidence values, and the greater the distance of the maximum settlement point from the tunnel face, which is consistent with what is observed in the shear strain contours shown in Figure 13, Figure 14 and Figure 15. Moreover, based on the subsidence curve, it can be further observed that the horizontal coordinate corresponding to the peak subsidence under each case of overlying thickness strata shifts to the right side due to the increase in tunnel face displacement, and the peak settlement point moves significantly faster when the thickness of the overburden is small. Meanwhile, the greater the thickness of the soil layer, the larger the deviation of the horizontal axis of peak subsidence from the tunnel surface. This phenomenon may be attributed to the soil arch effect of the overlying strata, wherein the self-weight of the soil layer at the top of the soil arch is transferred to its base, especially for those with thicker soil layers. These results can have the following implications for engineering projects: (1) for thicker overlying strata during tunneling, high-range observation points should be placed on the ground surface to minimize potential blind spots for ground subsidence; (2) additionally, more observation points should be allocated for the thinner overlying strata within a narrower range compared to those for thicker overlying strata.
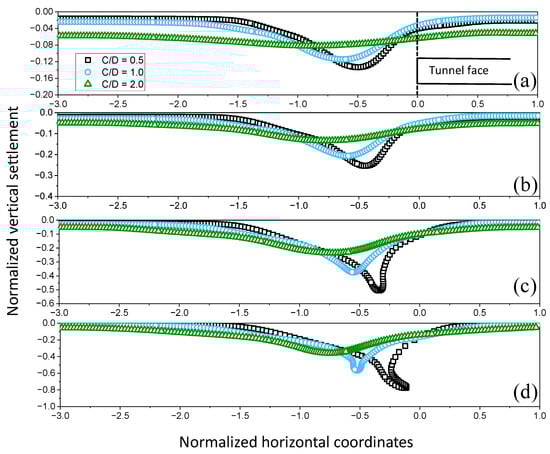
Figure 16.
The surface subsidence during tunnel construction varies with overburden heights: δh = (a) 1.25, (b) 2.50, (c) 5.00, and (d) 10.00 m.
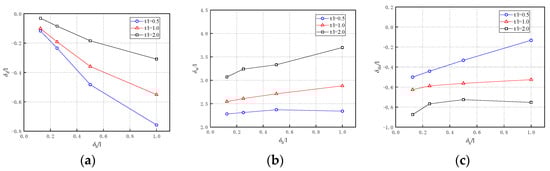
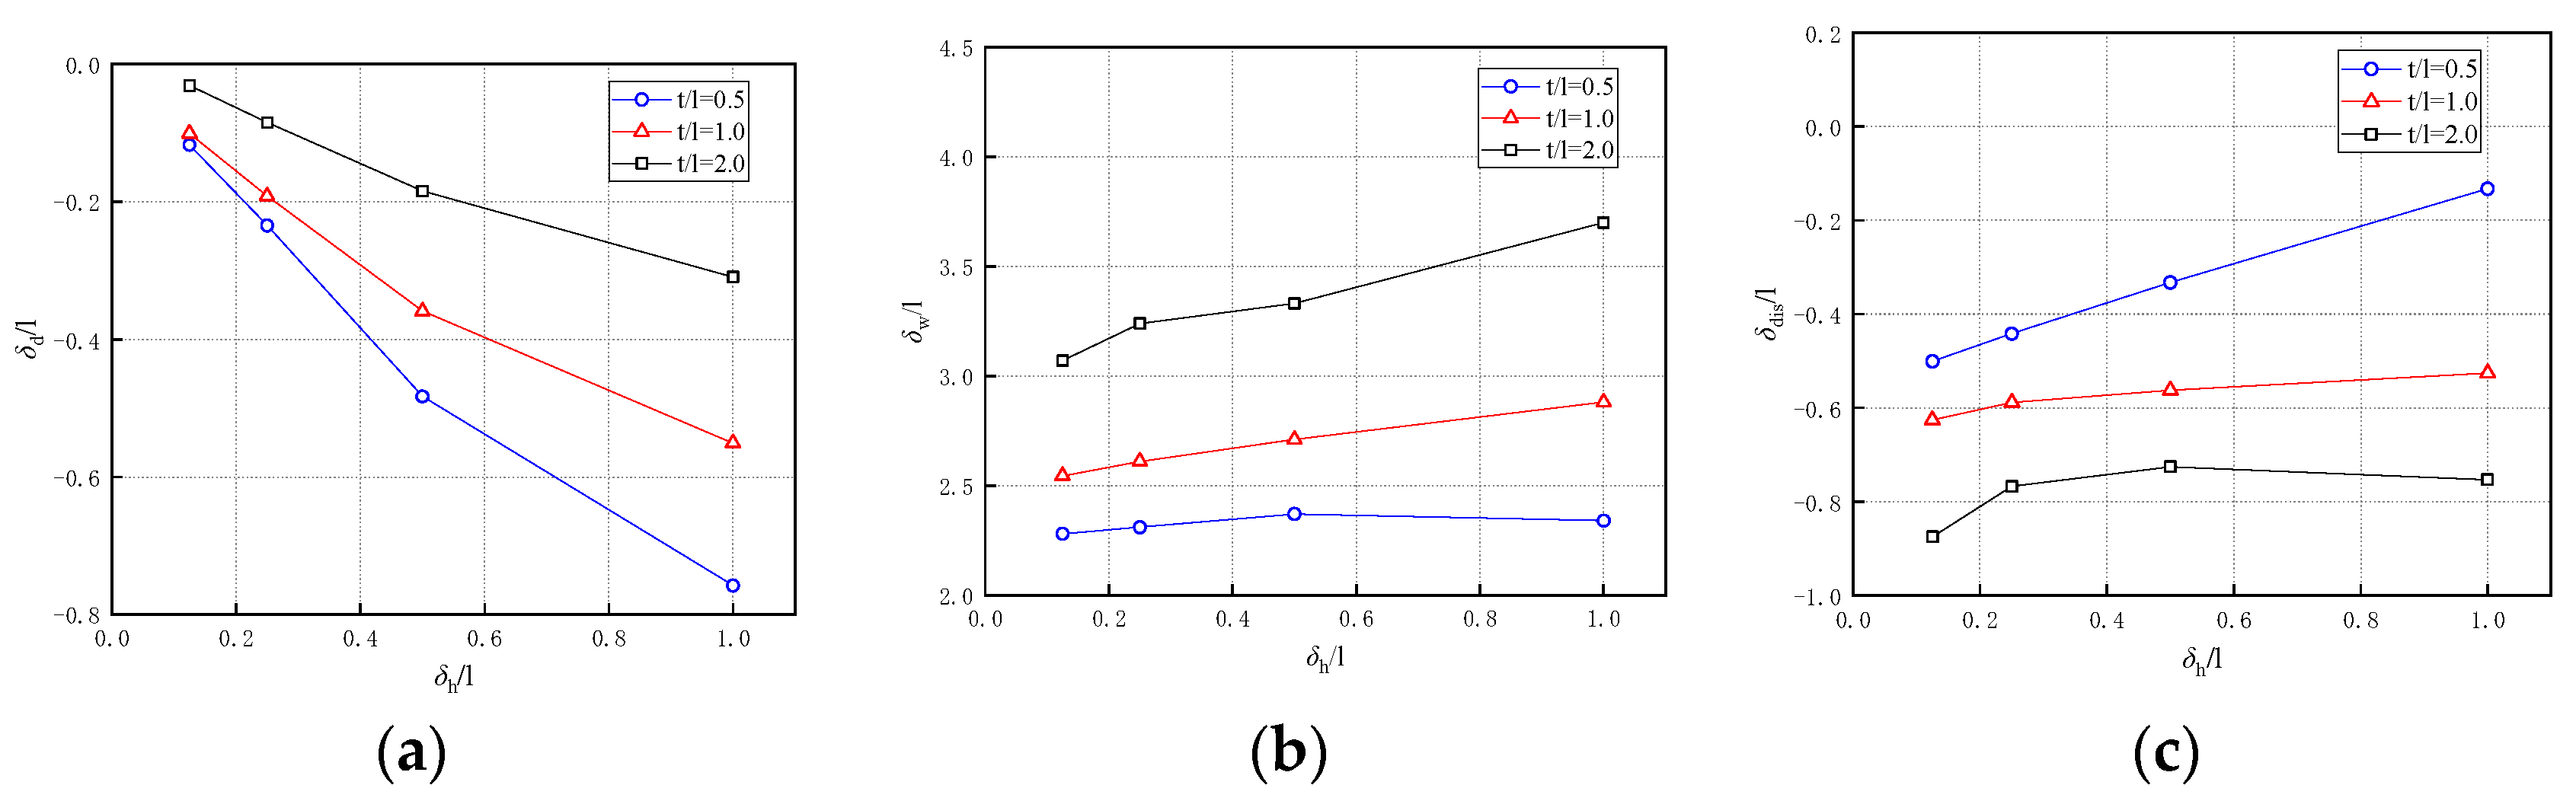
Figure 17.
Parameter variations at different deformation stages (δh/l) under different cover-to-diameter ratios (t/l). (a) Normalized crater depth (δd/l); (b) Normalized crater width (δw/l); (c) Normalized deepest position (δdis/l).
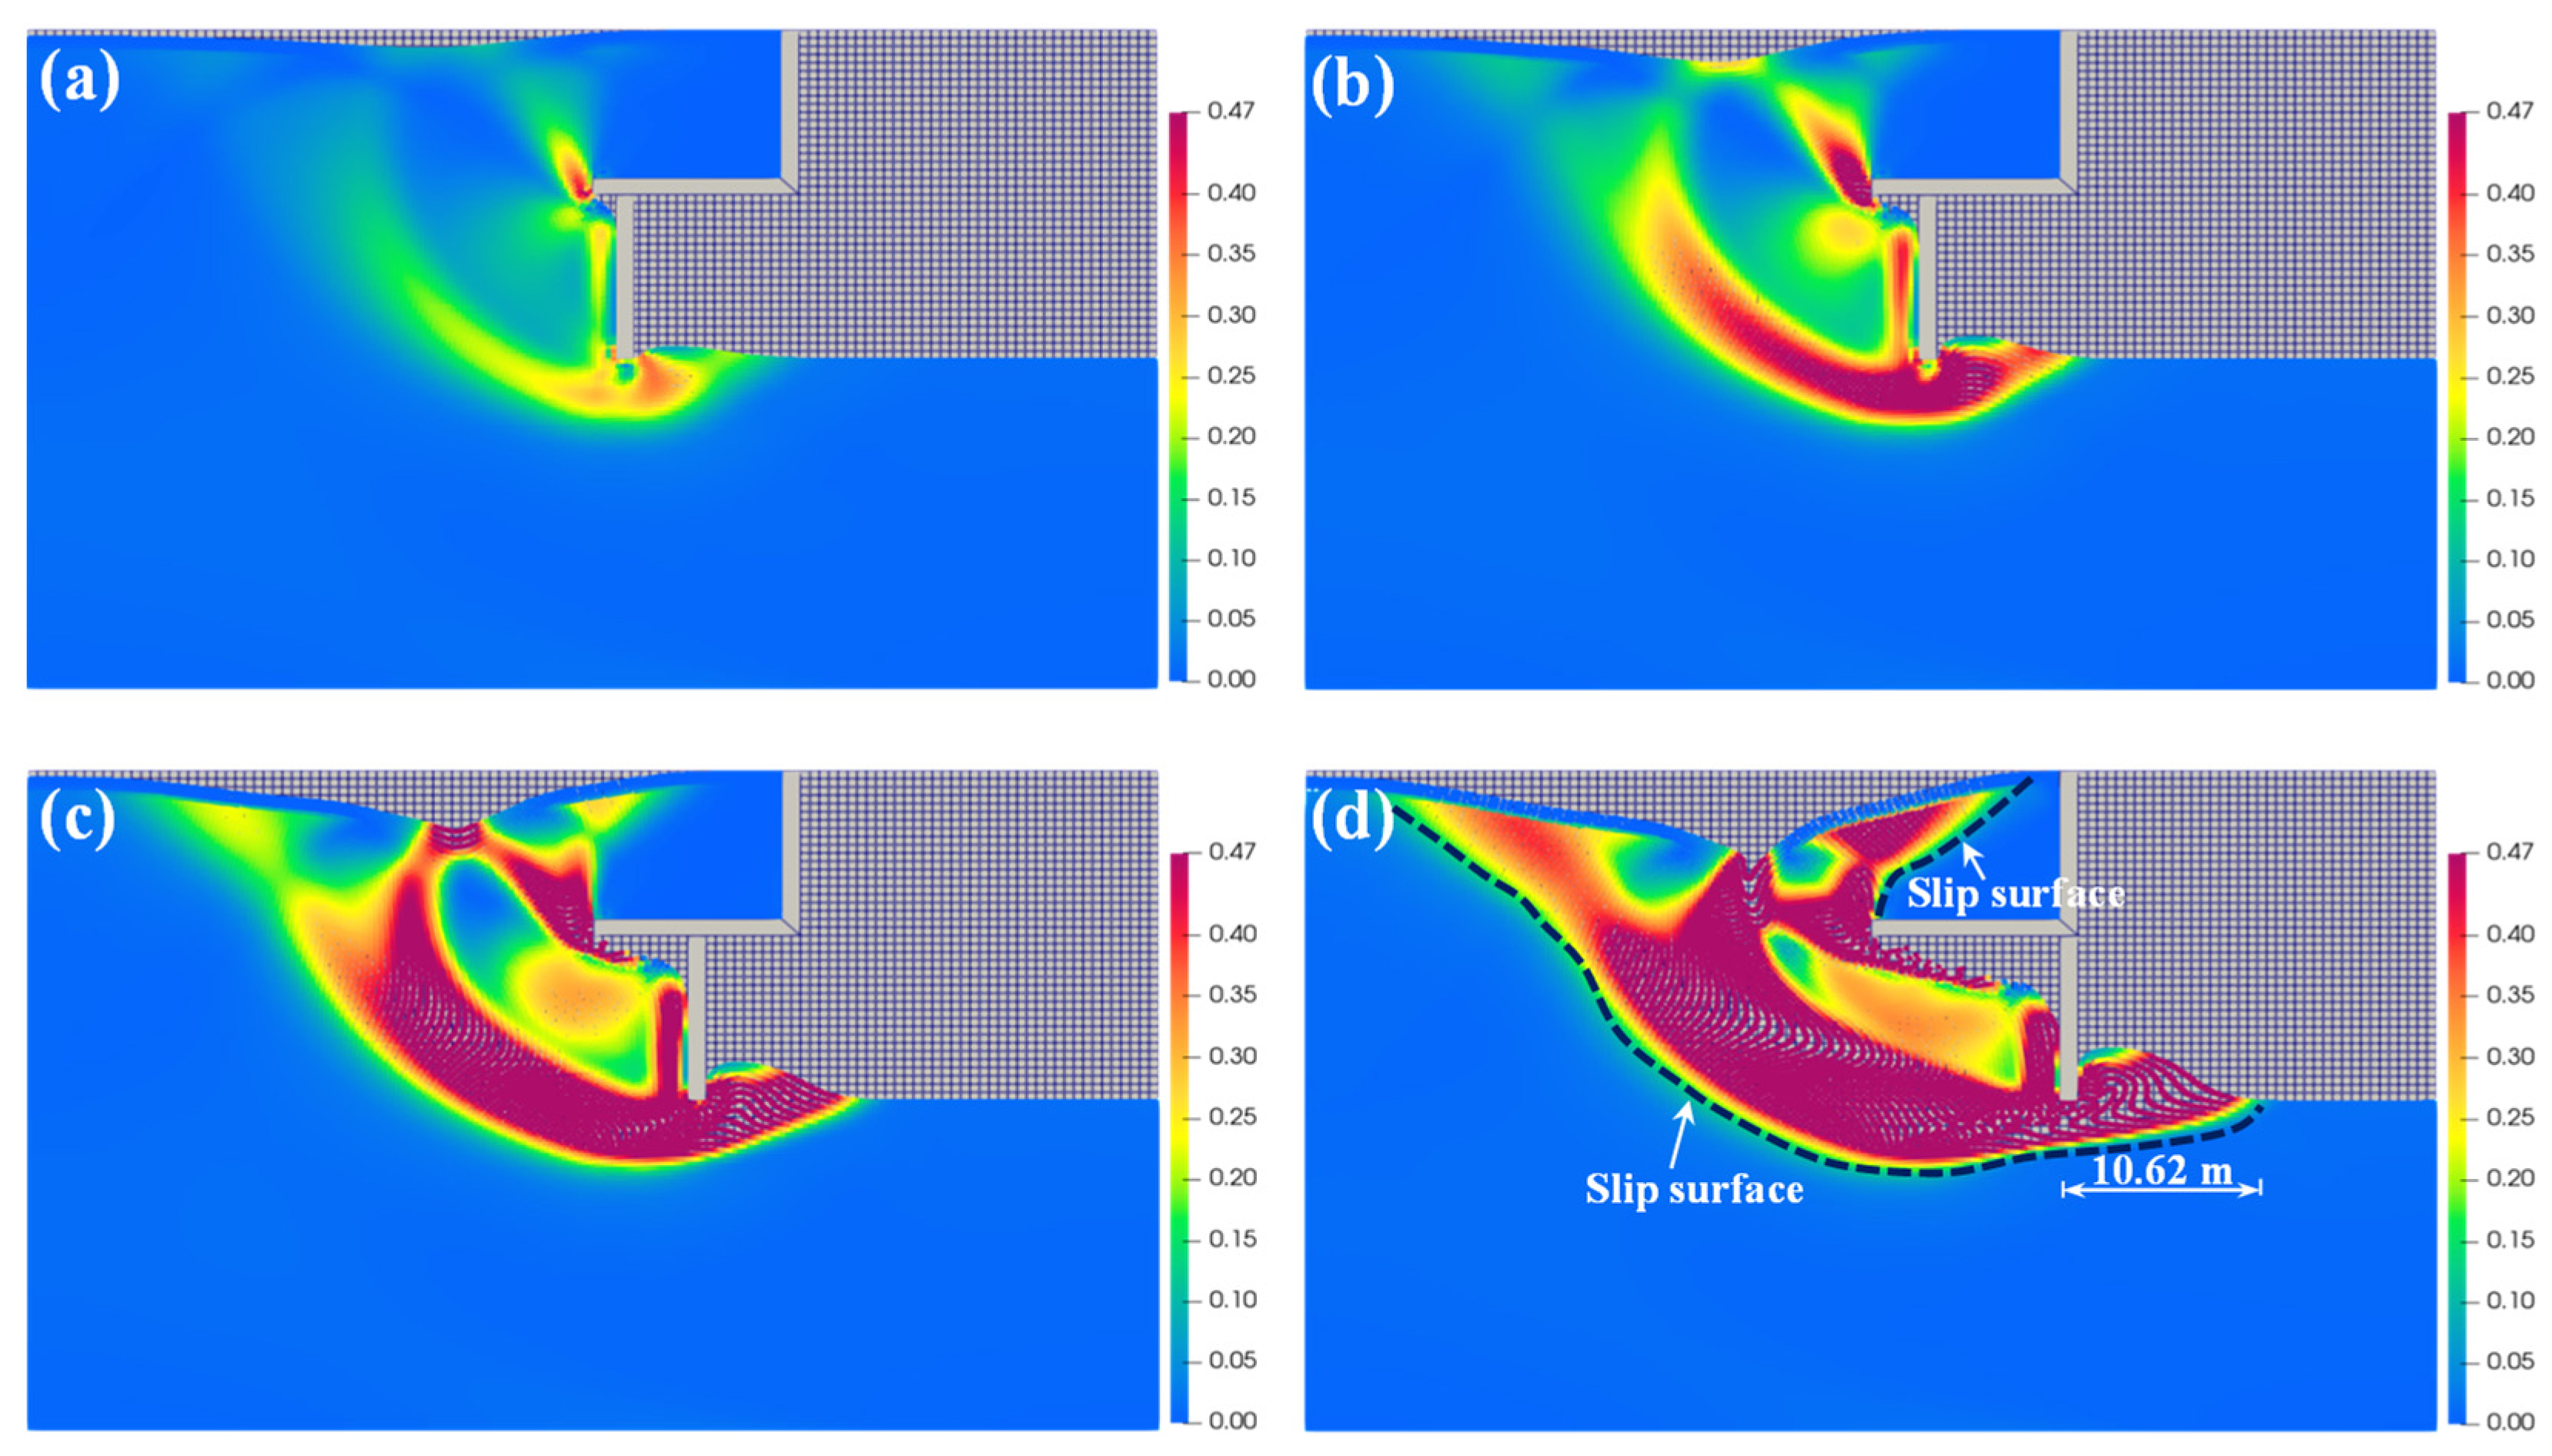
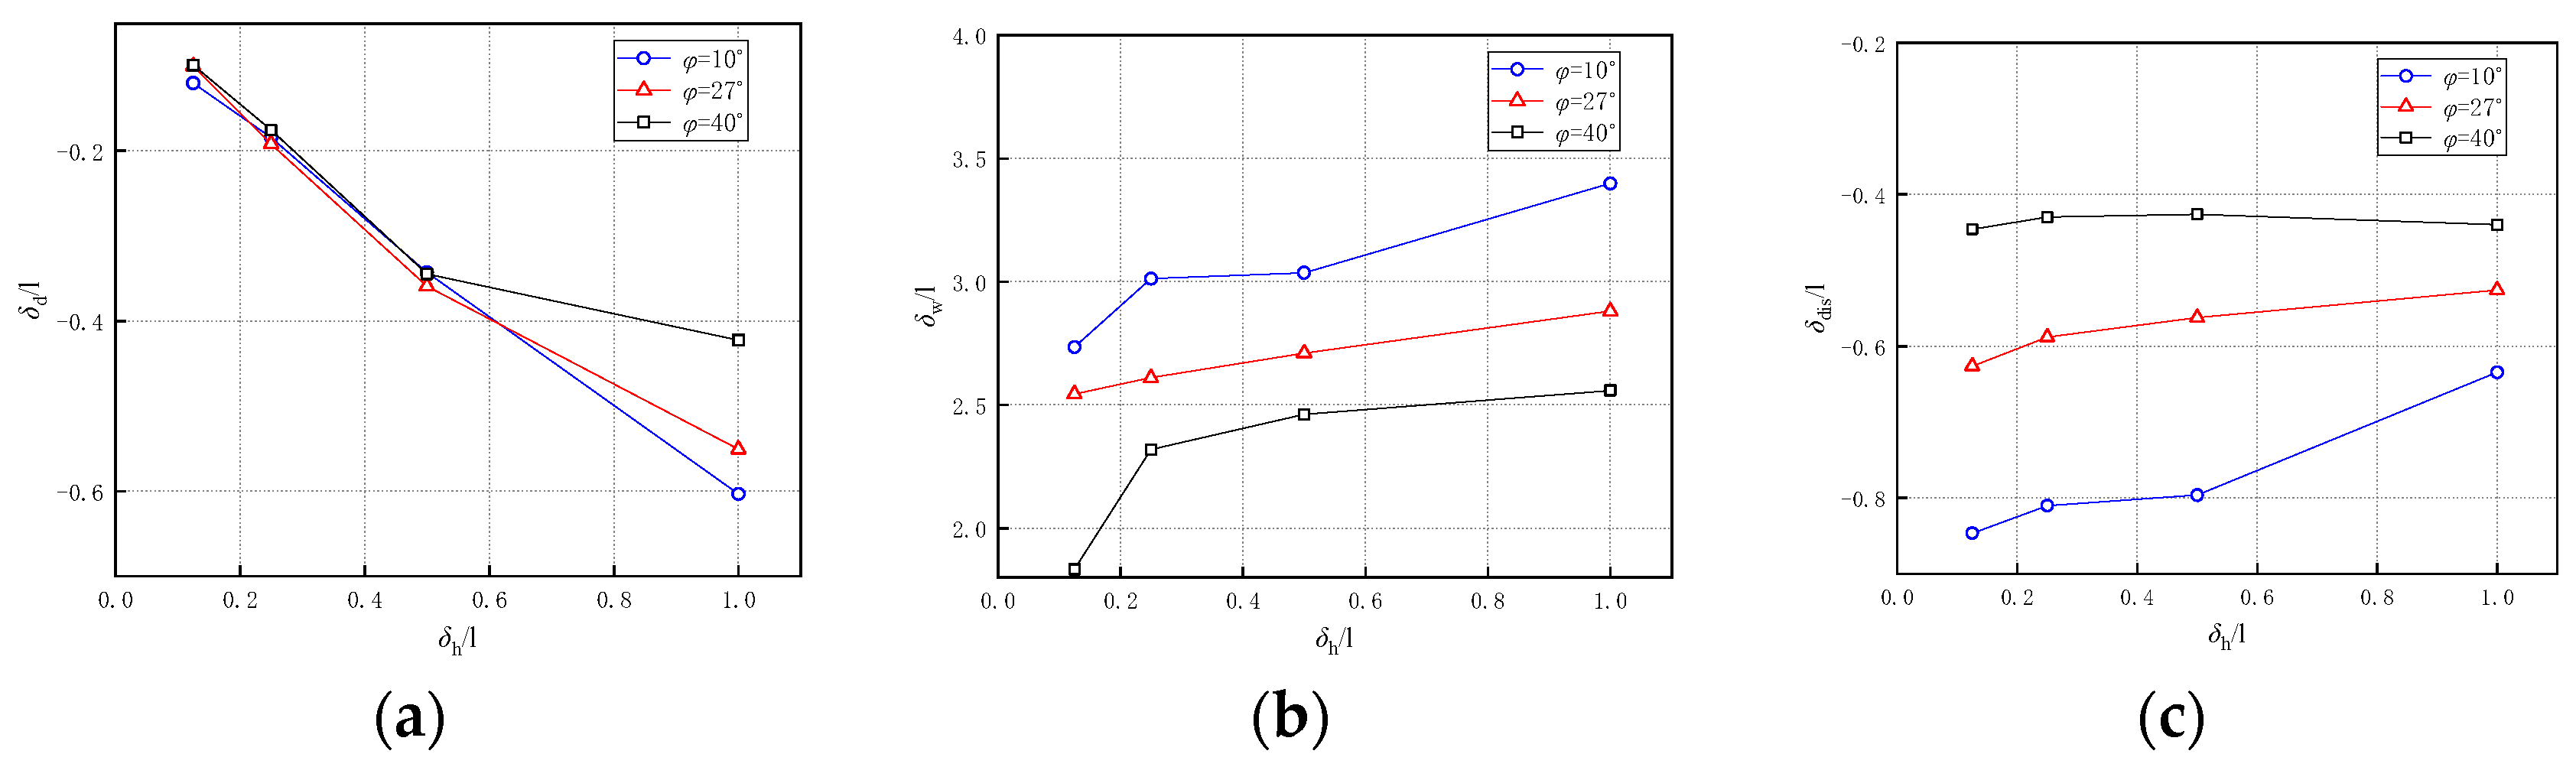
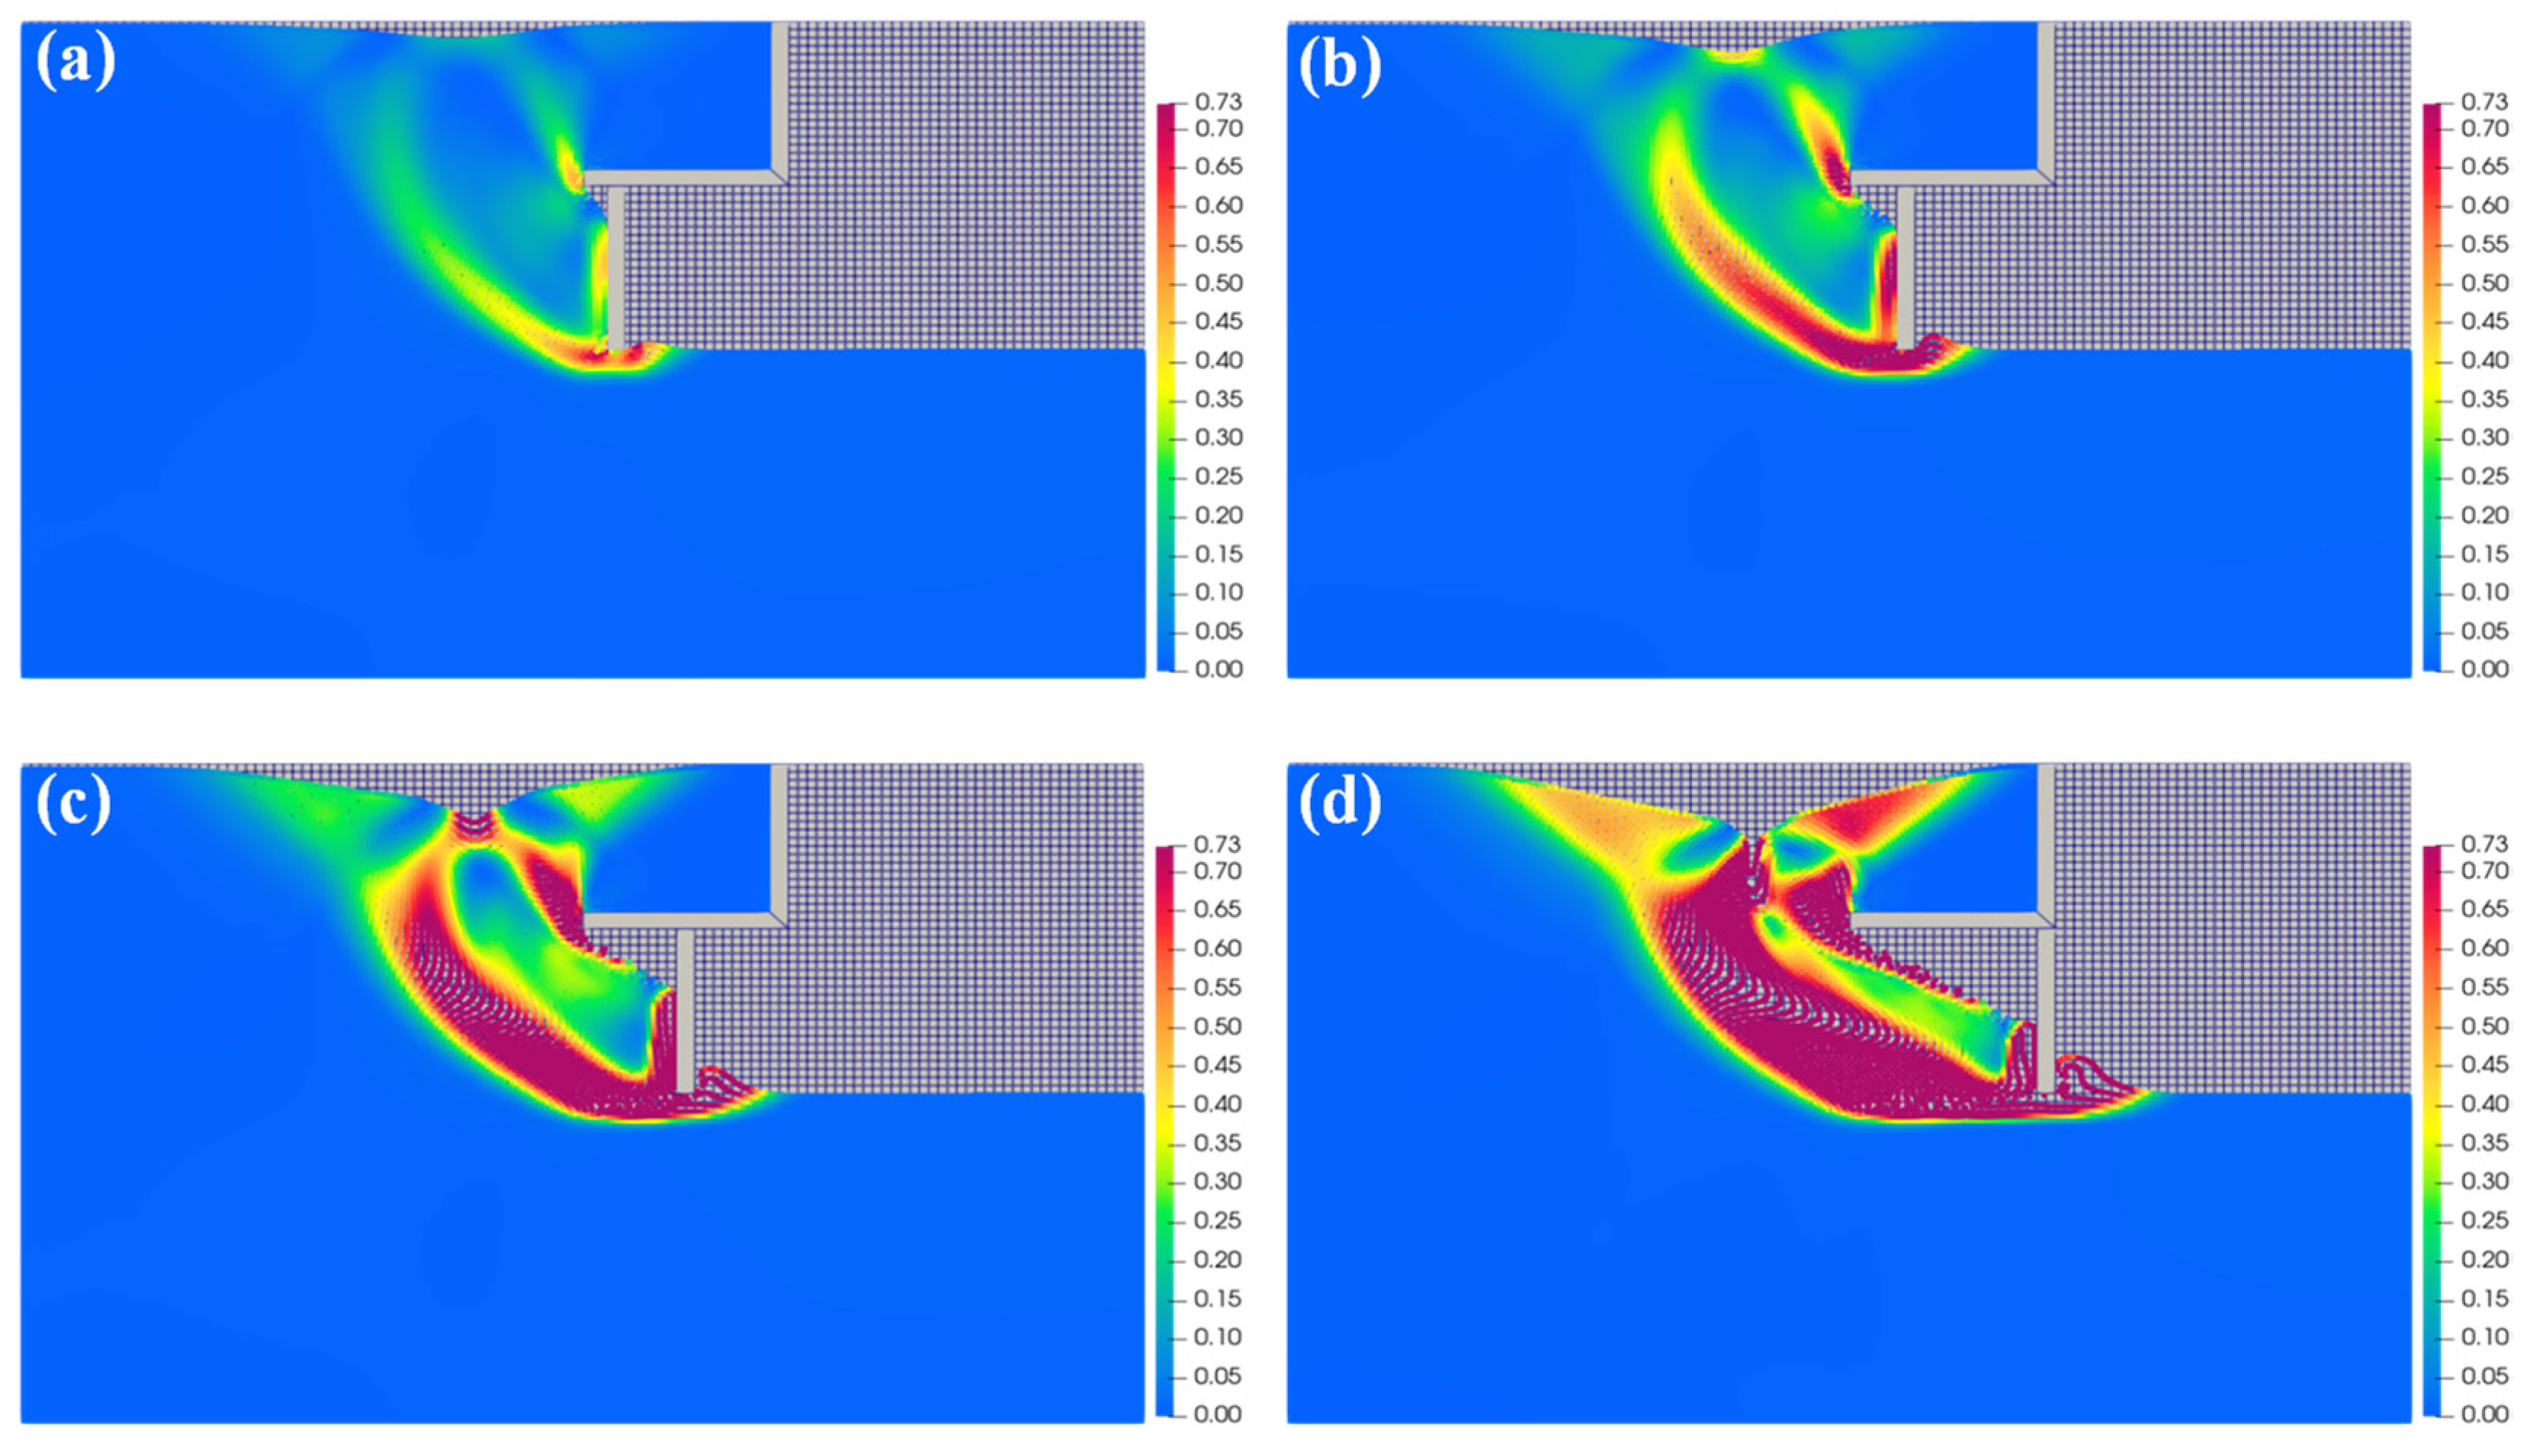
Figure 14, Figure 18 and Figure 19 illustrate the complete process of ground collapse resulting from displacement disturbance of the tunnel face under three different internal friction angles of the soil material (i.e., φ = 10°, 27°, and 40°). It is evident that the geometric outline of ground collapse under various internal friction angles appears to be similar. However, the collapse range and ground subsidence decrease as the internal friction angle increases. In addition, it can be further seen from Figure 20a that although the settlement depth of the soil is smaller for the larger angle of internal friction when the normalized displacement of the tunnel face reaches 1.0, the change in the angle of internal friction does not have a significant effect on the maximum settlement depth when the displacement perturbation is small. The possible reason is that when the soil with a smaller internal friction angle is disturbed, the soil yields in a direction closer to the horizontal direction, which on the one hand makes the influence area wider and, on the other hand, leads to a lag in the deformation along the depth direction and needs to accumulate a certain amount of deformation in the horizontal direction. These results were interpreted as localized deformation of materials, where local material points may initially reach a yield state due to the emergence of a non-uniform stress field during tunnel excavation. According to Equations (1) and (2), soils with smaller internal friction angles are more prone to yielding. Consequently, the stress concentrated within the yielding material points transfers to their adjacent material domain, resulting in further plastic deformation of the model. For example, in the case of soil with φ = 10°, the movement displacement after collapse exceeds 10 m (see Figure 18d). If the baffle continues moving to the right, the soil within the collapse area will continue to deform and shift. Conversely, for soil with φ = 40°, under the same construction disturbance, the movement displacement after collapse does not exceed 6.5 m (see Figure 19d). Overall, the ground collapse area of the soil layer with a smaller internal friction angle is larger than that of the model with a higher internal friction angle. Moreover, from Figure 20c, it can be seen that when the friction angle is equal to 20° or 40°, the position of the maximum depth gradually tends to stabilize with the increase of disturbance, so it can be seen that the effect of construction disturbance on the position of the maximum longitudinal surface settlement of the soil with a larger friction angle is small.
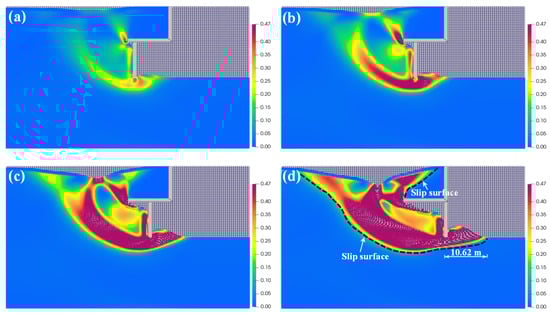
Figure 18.
The process of ground collapse induced by the displacement disturbance of the tunnel face during construction (φ = 10°): δh = (a) 1.25, (b) 2.50, (c) 5.00, and (d) 10.00 m.

Figure 19.
The process of ground collapse induced by the displacement disturbance of the tunnel face during construction (φ = 40°): δh = (a) 1.25, (b) 2.50, (c) 5.00, and (d) 10.00 m.
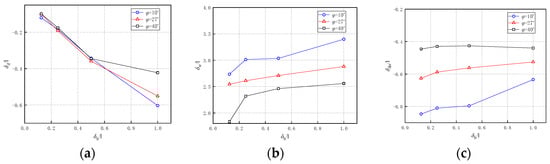
Figure 20.
Parameter variations at different deformation stages (δh/l) under different friction angles (φ). (a) Normalized crater depth(δd/l); (b) Normalized crater width (δw/l); (c) Normalized deepest position (δdis/l).
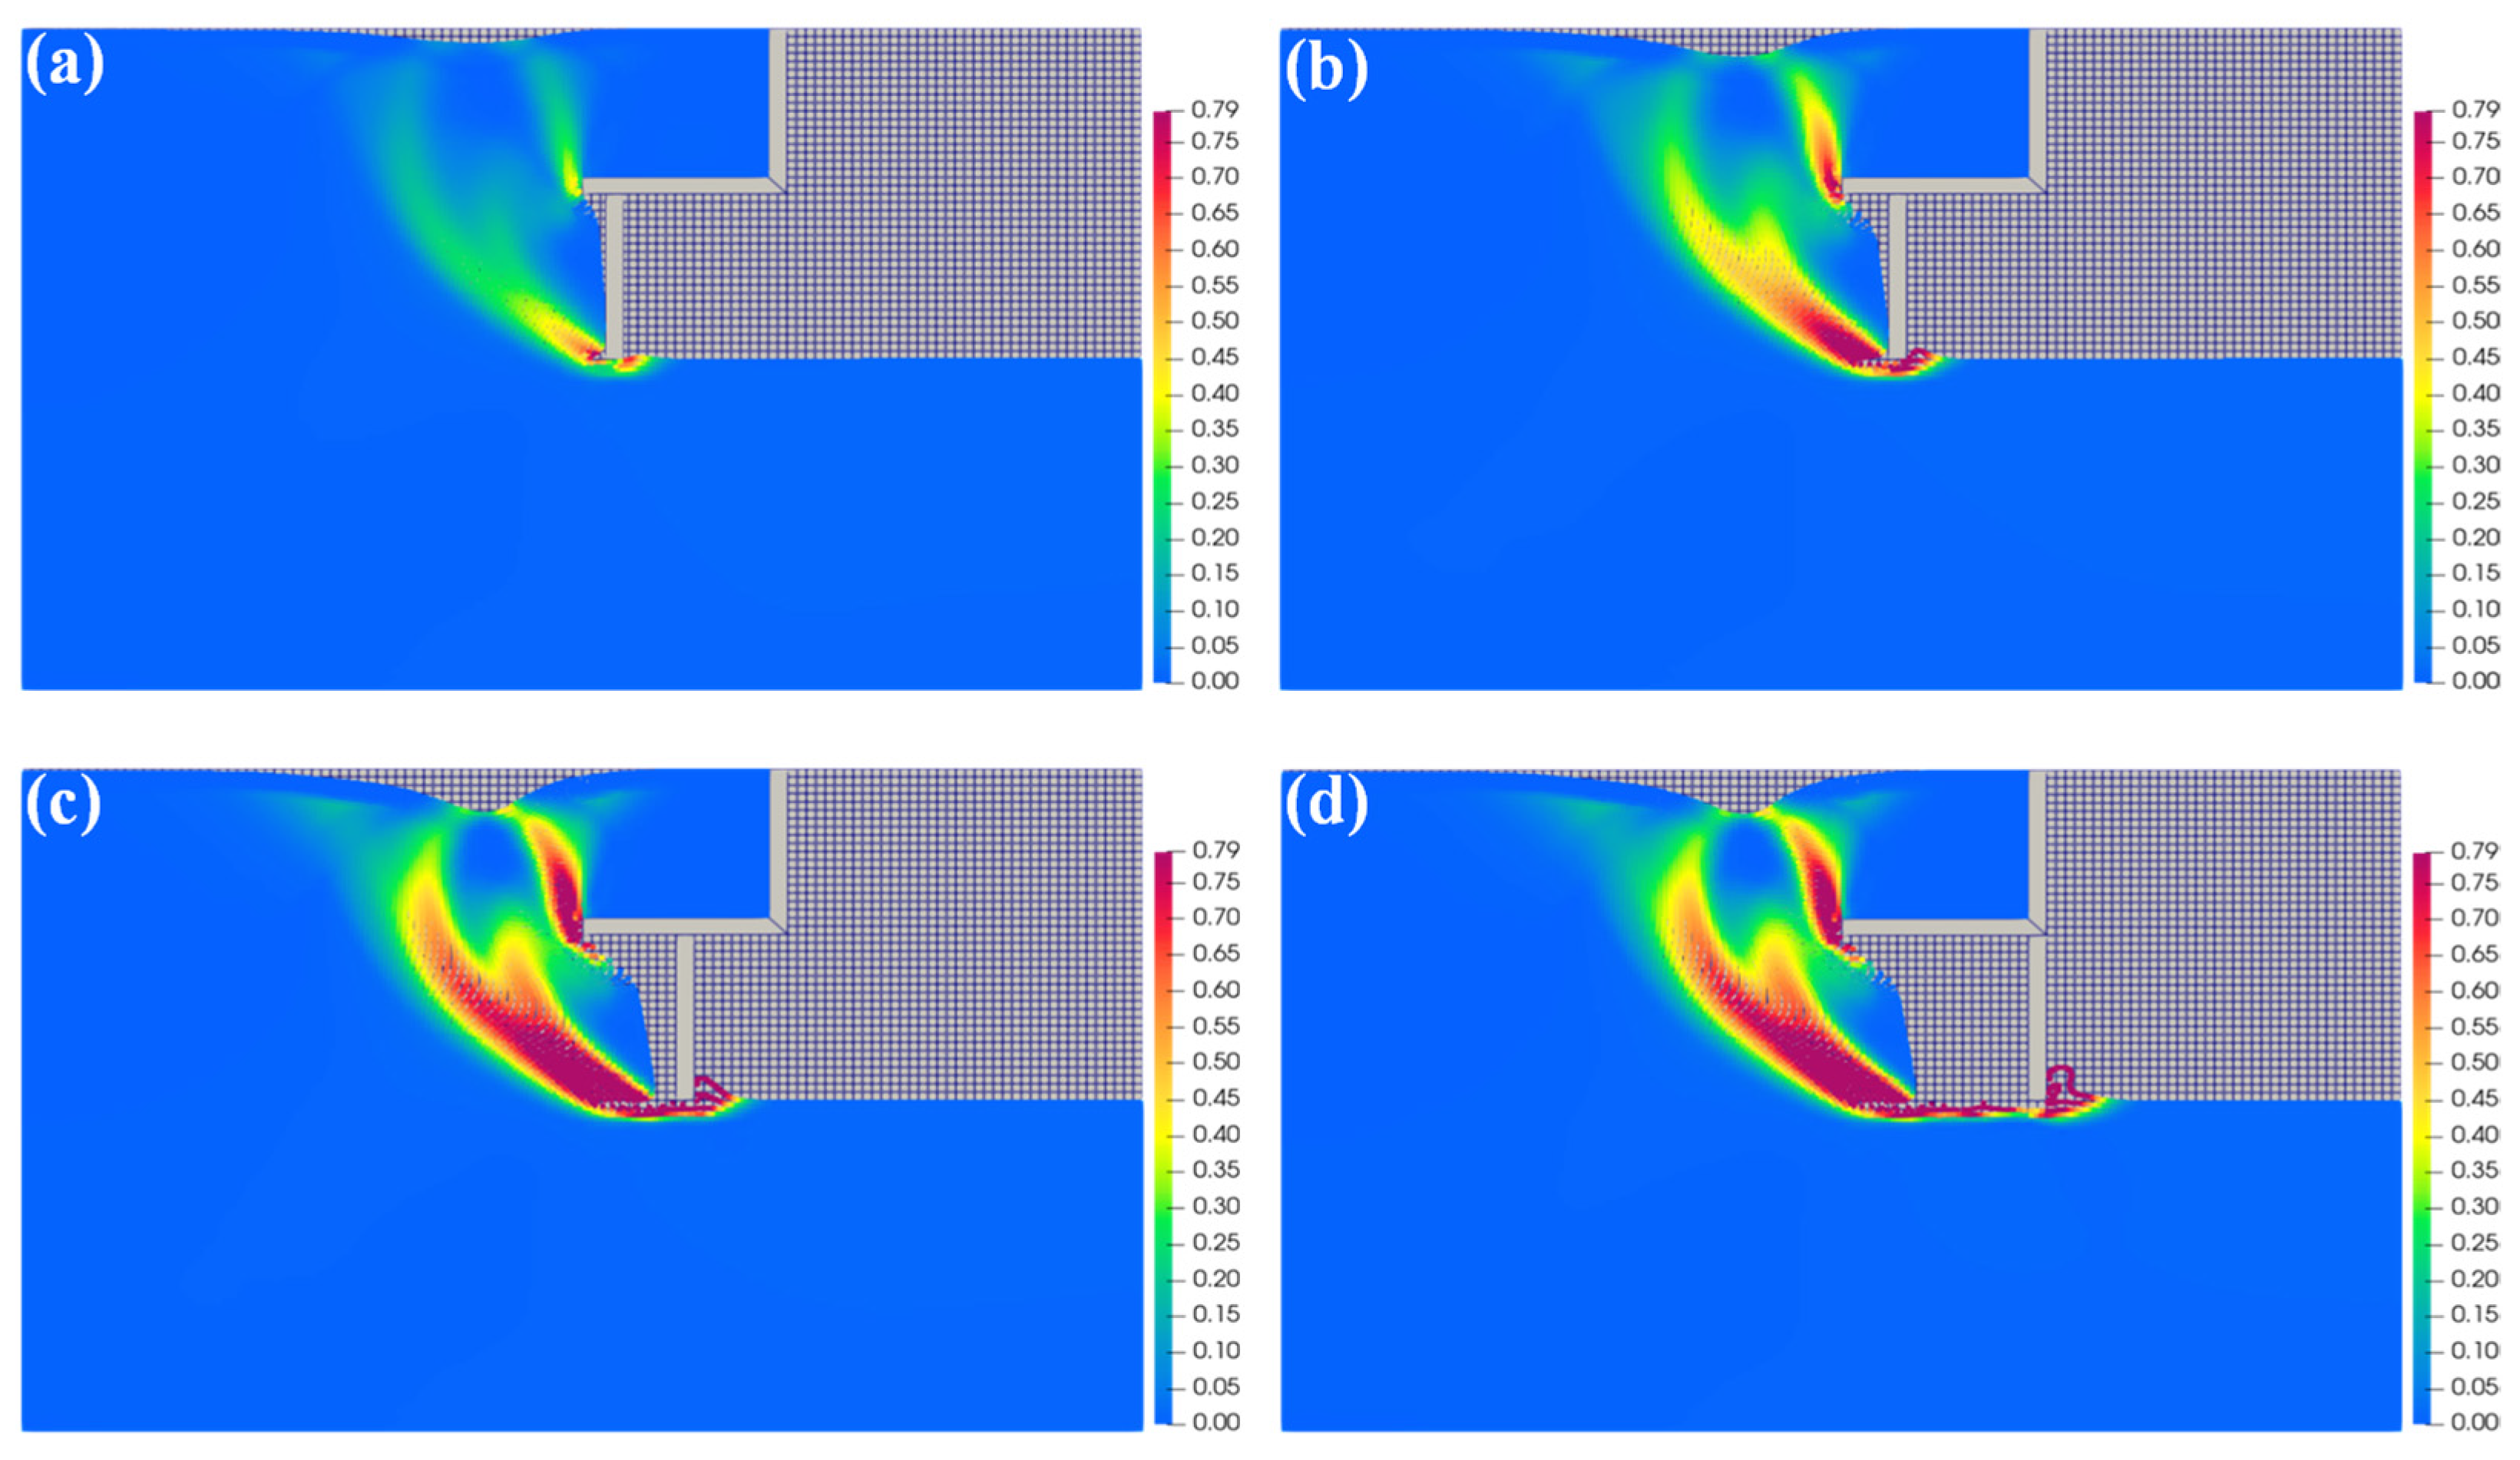
Figure 14, Figure 21 and Figure 22 depict the complete process of soil collapse induced by tunnel face displacement disturbance under varying initial cohesion of the soil material (c0 = 2, 10, and 20 kPa) and tunnel face displacements (δh = 1.25, 2.50, 5.00, and 10.0 m). Figure 23 then gives the variation of the three key parameters with the disturbance. As the displacement of the palm face increases, both the normalized crater depth and crater width increase, while the horizontal distance from the deepest position of the normalized crater to the initial position of the tunnel face decreases, and this pattern is overall the same as that discussed earlier for both cases of varying the cover-to-depth ratio and varying the angle of internal friction. Likewise, through comparison of the deformation motion patterns of the soil mass in the collapse area at different times, it is evident that sites with greater soil cohesive strength experience less severe collapse induced by shield tunnel construction disturbance. Observation from Figure 21 reveals that as the baffle moves to the right, the movement of the collapsed soil mass is relatively sluggish, resulting in a final collapse displacement of approximately 3.5 m. In conclusion, the fundamental mechanical properties of the soil mass at shield tunnel construction sites significantly influence the collapse displacement, depth, and extent caused by construction disturbance. Cohesive strength and internal friction angle both indicate the shear resistance of the soil mass. Hence, measures such as drainage and consolidation can be implemented to enhance the shear strength of the soil mass.

Figure 21.
The process of ground collapse induced by the displacement disturbance of the tunnel face during construction (c = 2 kPa): δh = (a) 1.25, (b) 2.50, (c) 5.00, and (d) 10.00 m.

Figure 22.
The process of ground collapse induced by the displacement disturbance of the tunnel face during construction (c = 20 kPa): δh = (a) 1.25, (b) 2.50, (c) 5.00, and (d) 10.00 m.
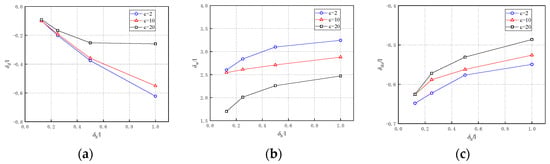
Figure 23.
Parameter variations at different deformation stages (δh/l) under different cohesion (c). (a) Normalized crater depth (δd/l); (b) Normalized crater width (δw/l); (c) Normalized deepest position (δdis/l)
5. Implications and Limitations
5.1. Implications of This Study for Underground Construction
The simulated results of the study underscore the critical influence of the geometry and mechanical properties of overlaying strata on determining ground collapse behaviors. Comprehensive analyses and comparisons among numerical models under varying strata thickness, cohesion, and friction angle suggest a similar failure pattern and evolution processes, but significant differences in settlement range, ground displacement distribution, and peak ground subsidence. These differences should be carefully considered in engineering construction projects.
- (1)
- When determining the spacing and range of monitoring points for measuring ground displacement, reference to the deformation and collapse results of overlaying strata with varying thickness, cohesion, and friction angle should be made;
- (2)
- Regarding the tunnel boring machine, its primary construction technical parameters, such as advance rate, propelling pressure, cutter thrust, and torque, could be adjusted flexibly based on soil layer information;
- (3)
- To address weakened soil layers, measures aimed at enhancing material cohesion and internal friction angle should be implemented to prevent excessive deformation and ground collapse during tunneling.
5.2. Limitations of This Study
Although comprehensive analyses have been conducted regarding the evolution and failure processes of surface instability and ground collapse in overlaying strata with varying soil properties and geometry, it is imperative to acknowledge certain limitations:
- (1)
- This study employed a two-dimensional (2D) plane strain model to simulate the deformation of overlaying strata during tunnel excavation. While previous studies [39,53,54] have demonstrated the similarity between the predicted results of the 2D model and those of the 3D model, it is still necessary to establish an MPM-based 3D model to more accurately reflect the stress state of the stratum during tunneling;
- (2)
- This study assumed homogeneity in the overlaying strata and neglected the existence of pore water pressure in the soil mass, which may not align with practical conditions. Considering the stratification of the foundation, future work should incorporate a numerical model that accounts for various soil layers, thicknesses, and soil contact angles.
6. Conclusions
This paper presents a numerical framework based on the material point method (MPM), integrating weighted least squares approximation and strain-softening Drucker–Prager plasticity, to simulate large subgrade deformations and failures near underground tunnels. Additionally, the paper conducts a detailed analysis of surface instability and ground collapse across various soil conditions, strata thickness, cohesion, and friction angle, complemented by a validation of the numerical method using a benchmark example. Key features of this study include the following:
- (1)
- Numerical predictions from the benchmark example in Section 2.2 and the case model in Section 3 as well as Section 4 show that the MPM-based method effectively simulates large deformations and offers a comprehensive, systematic description of tunnel-induced surface instability and collapses. This approach enables proactive, informed tunnel design and construction strategies to prevent collapses.
- (2)
- Ground collapse during tunneling is shaped by the evolution of shear bands at the tunnel’s ends. Thinner soil layers increase the shear band’s inclination angle, whereas thicker layers decrease it, leading to varied collapse depths and widths depending on the strata thickness.
- (3)
- The cohesive strength and internal friction angle minimally impact the failure patterns and displacement modes of overlying strata during tunneling. However, increasing soil cohesion and internal friction angles significantly reduces the extent of localized plastic zones and ground subsidence.
- (4)
- The pattern of change in the longitudinal settlement of the ground surface with the development of deformation is investigated. In general, the depth and width of the crater gradually increased, while the location of the maximum depth was gradually closer to the initial position of the tunnel face.
Author Contributions
Conceptualization, C.H. and H.L.; methodology, C.H., H.L. and S.G.; validation, C.H., H.L. and S.G.; formal analysis, S.G. and M.S.; investigation, C.H., H.L., S.G., S.Z. and M.S.; data curation, H.L.; writing—original draft preparation, C.H., H.L., S.G., S.Z. and M.S.; writing—review and editing, C.H., H.L., S.G., S.Z. and M.S.; visualization, C.H. and H.L.; supervision, S.Z. and M.S.; project administration, C.H., S.Z. and M.S.; funding acquisition, C.H. and M.S. All authors have read and agreed to the published version of the manuscript.
Funding
This research was supported by the Zhejiang Provincial Natural Science Foundation of China under grants LQ23E080001 and LTGG23E080002.
Data Availability Statement
Data will be made available on request.
Conflicts of Interest
The authors declare no conflicts of interest.
References
- Liang, Y.; Chen, X.Y.; Yang, J.S.; Zhang, J.; Huang, L.C. Analysis of ground collapse caused by shield tunnelling and the evaluation of the reinforcement effect on a sand stratum. Eng. Fail. Anal. 2020, 115, 104616. [Google Scholar] [CrossRef]
- Wang, R.H.; Li, D.Q.; Chen, E.J.; Liu, Y. Dynamic prediction of mechanized shield tunneling performance. Autom. Constr. 2021, 132, 103958. [Google Scholar] [CrossRef]
- Zhang, W.G.; Zhong, H.Y.; Xiang, Y.Z.; Wu, D.F.; Zeng, Z.K.; Zhang, Y.M. Visualization and digitization of model tunnel deformation via transparent soil testing technique. Undergr. Space 2022, 7, 564–576. [Google Scholar] [CrossRef]
- Chen, X.J.; Hu, Y.; Zhang, L.; Liu, Y. 3D large–deformation modelling on face instability and sinkhole formation during tunnelling through non–uniform soils. Tunn. Undergr. Space Technol. 2023, 134, 105011. [Google Scholar] [CrossRef]
- Ground Collapse Adjacent to Metro Line 2 of Xiamen. Available online: https://news.ifeng.com/c/7sNCmxmkKQq (accessed on 13 December 2019).
- Ground Collapse Induced by the Construction of the I Phase of Foshan Metro Line 2. Available online: https://www.sohu.com/a/221699076_270606 (accessed on 2 August 2018).
- Road Collapse of Jianguo North Road in Hangzhou. Available online: http://k.sina.com.cn/article_1686546714_6486a91a02000rhva.html (accessed on 28 August 2019).
- Road Collapse of Yanxiang Road in Xi’an City. Available online: https://www.163.com/dy/article/G9VUP05S0534PA9T.html (accessed on 14 May 2021).
- Wang, X.W.; Xu, Y.S. Investigation on the phenomena and influence factors of urban ground collapse in China. Nat. Hazards 2022, 113, 1–33. [Google Scholar] [CrossRef]
- Wang, K.; Zhang, J.W.; Gao, G.Q.; Qiu, J.L.; Zhong, Y.J.; Guo, C.X.; Zhao, W.C.; Tang, K.J.; Su, X.L. Causes, risk analysis, and countermeasures of urban road collapse in China from 2019 to 2020. J. Perform. Constr. Facil. 2022, 36, 04022054. [Google Scholar] [CrossRef]
- Alhaji, M.M.; Alhassan, M.; Adejumo, T.W.; Abdulkadir, H. Road pavement collapse from overloaded trucks due to traffic diversion: A case study of Minna–Kateregi–Bida Road, Nigeria. Eng. Fail. Anal. 2022, 131, 105829. [Google Scholar] [CrossRef]
- Peng, S.G.; Huang, W.R.; Luo, G.Y.; Cao, H.; Pan, H.; Mo, N.J. Failure mechanisms of ground collapse caused by shield tunnelling in water–rich composite sandy stratum: A case study. Eng. Fail. Anal. 2023, 146, 107100. [Google Scholar] [CrossRef]
- Zhang, X.Y.; Ruan, Y.C.; Xuan, W.H.; Bao, H.J.; Du, Z.H. Risk assessment and spatial regulation on urban ground collapse based on geo–detector: A case study of Hangzhou urban area. Nat. Hazards 2023, 118, 525–543. [Google Scholar] [CrossRef]
- Peck, R.B. Deep excavations and tunnelling in soft ground–State–of–the–Art Report. In Proceedings of the Seventh International Conference on Soil Mechanics and Foundation Engineering; Sociedad Mexicana de Mecanica: Mexico City, Mexico, 1969; pp. 225–290. [Google Scholar]
- Mair, R.J.; Taylor, R.N.; Bracegirdle, A. Subsurface settlement profiles above tunnels in clays. Géotechnique 1993, 43, 315–320. [Google Scholar] [CrossRef]
- Vorster, T.E.; Klar, A.; Soga, K.; Mair, R.J. Estimating the effects of tunneling on existing pipelines. J. Geotech. Geoenviron. Eng. 2005, 131, 1399–1410. [Google Scholar] [CrossRef]
- Moussaei, N.; Khosravi, M.H.; Hossaini, M.F. Physical modeling of tunnel induced displacement in sandy grounds. Tunn. Undergr. Space Technol. 2019, 90, 19–27. [Google Scholar] [CrossRef]
- Song, G.; Marshall, A.M. Centrifuge modelling of tunnelling induced ground displacements: Pressure and displacement control tunnels. Tunn. Undergr. Space Technol. 2020, 103, 103461. [Google Scholar] [CrossRef]
- Chen, X.H.; Chen, W.X.; Zhao, L.Y.; Chen, Y.K. Influence of buried pipeline leakage on the development of cavities in the subgrade. Buildings 2023, 13, 1848. [Google Scholar] [CrossRef]
- Wang, Y.X.; Shi, G.; Tian, X.W.; Li, C.Y.; Cheng, H.Y. Experimental study on city road collapse under vibrating load. Shock Vib. 2020, 13, 1–13. [Google Scholar] [CrossRef]
- Zhang, Z.W.; Qi, Q.J.; Cheng, Y.; Cui, D.W.; Yang, J.H. An integrated model for risk assessment of urban road collapse based on China Accident Data. Sustainability 2024, 16, 2055. [Google Scholar] [CrossRef]
- Cheng, M.Y.; Roy, A.F.V.; Chen, K.L. Evolutionary risk preference inference model using fuzzy support vector machine for road slope collapse prediction. Expert Syst. Appl. 2012, 39, 1737–1746. [Google Scholar] [CrossRef]
- Wongsaroj, J.; Soga, K.; Mair, R.J. Tunnelling–induced consolidation settlements in London Clay. Géotechnique 2013, 63, 1103–1115. [Google Scholar] [CrossRef]
- Zou, J.F.; Qian, Z.H. Face–stability analysis of tunnels excavated below groundwater considering coupled flow deformation. Int. J. Geomech. 2018, 18, 04018089. [Google Scholar] [CrossRef]
- Hu, C.B.; Yang, Q.D.; Ling, D.S.; Tu, F.B.; Wang, L.; Gong, S.L. Numerical simulations of arbitrary evolving cracks in geotechnical structures using the nonlinear augmented finite element method (N–AFEM). Mech. Mater. 2021, 156, 103814. [Google Scholar] [CrossRef]
- Jiang, M.; Yu, H.S.; Leroueil, S. A simple and efficient approach to capturing bonding effect in naturally microstructured sands by discrete element method. Int. J. Numer. Methods Eng. 2007, 69, 1158–1193. [Google Scholar] [CrossRef]
- Jiang, M.J.; Konrad, J.M.; Leroueil, S. An efficient technique for generating homogeneous specimens for DEM studies. Comput. Geotech. 2003, 30, 579–597. [Google Scholar] [CrossRef]
- Das, N. Modeling Three-Dimensional Shape of Sand Grains Using Discrete Element Method; University of South Florida: Tampa, FL, USA, 2007. [Google Scholar]
- Jiang, M.J.; Li, T.; Hu, H.J.; Thornton, C. DEM analyses of one–dimensional compression andcollapse behaviour of unsaturated structural loess. Comput. Geotech. 2014, 60, 47–60. [Google Scholar] [CrossRef]
- Sadek, M.A.; Chen, Y.; Liu, J. Simulating shear behavior of a sandy soil under different soil conditions. J. Terramechanics 2011, 48, 451–458. [Google Scholar] [CrossRef]
- Tao, L.J.; Yuan, S.; An, J.H. Development mechanism of underground cavity disease in urban roads and its impact on road surface collapse. J. Heilongjiang Univ. Sci. Technol. 2015, 3, 289–293. [Google Scholar]
- Shamy, U.E.; Zeghal, M. Coupled continuum–discrete model for saturated granular soils. J. Eng. Mech. 2005, 131, 413–426. [Google Scholar] [CrossRef]
- Tao, H.; Tao, J. Quantitative analysis of piping erosion micro-mechanisms with coupled CFD and DEM method. Acta Geotech. 2017, 12, 573–592. [Google Scholar] [CrossRef]
- Sulsky, D.; Chen, Z.; Schreyer, H.L. A particle method for history–dependent materials. Comput. Methods Appl. Mech. Eng. 1994, 118, 179–196. [Google Scholar] [CrossRef]
- Sulsky, D.; Zhou, S.J.; Schreyer, H.L. Application of a particle–in–cell method to solid mechanics. Comput. Phys. Commun. 1995, 87, 236–252. [Google Scholar] [CrossRef]
- Sun, Y.J.; Song, E.X. Dynamic simulation of the “12.20” landslide in Shenzhen. Chin. J. Geotech. Eng. 2018, 40, 441–448. [Google Scholar]
- Fern, E.J. Modelling tunnel–induced deformations with the material point method. Comput. Geotech. 2019, 111, 202–208. [Google Scholar] [CrossRef]
- Fernández, F.; Rojas, J.E.; Vargas Jr, E.A.; Velloso, R.Q.; Dias, D. Three–dimensional face stability analysis of shallow tunnels using numerical limit analysis and material point method. Tunn. Undergr. Space Technol. 2021, 112, 103904. [Google Scholar] [CrossRef]
- Li, Z.Y.; Huang, H.W.; Zhou, M.L.; Zhang, D.M. Failure responses of rock tunnel faces during excavation through the fault–fracture zone. Undergr. Space 2023, 10, 166–181. [Google Scholar] [CrossRef]
- Wang, S.Y.; Liu, T.Y.; Zheng, X.C.; Yang, J.S.; Yang, F. Dynamic collapse characteristics of the tunnel face induced by the shutdown of earth pressure balance shields (EPB): A 3D material point method study. Undergr. Space 2024, 16, 164–182. [Google Scholar] [CrossRef]
- Wong, K.S.; Ng, C.W.W.; Chen, Y.M.; Bian, X.C. Centrifuge and numerical investigation of passive failure of tunnel face in sand. Tunn. Undergr. Space Technol. 2012, 28, 297–303. [Google Scholar] [CrossRef]
- Zhang, C.P.; Han, K.H.; Zhang, D.L. Face stability analysis of shallow circular tunnels in cohesive–frictional soils. Tunn. Undergr. Space Technol. 2015, 50, 345–357. [Google Scholar] [CrossRef]
- di Prisco, C.; Flessati, L.; Frigerio, G.; Castellanza, R.; Caruso, M.; Galli, A.; Lunardi, P. Experimental investigation of the time-dependent response of unreinforced and reinforced tunnel faces in cohesive soils. Acta Geotech. 2018, 13, 651–670. [Google Scholar] [CrossRef]
- Idinger, G.; Aklik, P.; Wu, W.; Borja, R.I. Centrifuge model test on the face stability of shallow tunnel. Acta Geotech. 2011, 6, 105–117. [Google Scholar] [CrossRef]
- Kirsch, A. Experimental investigation of the face stability of shallow tunnels in sand. Acta Geotech. 2010, 5, 43–62. [Google Scholar] [CrossRef]
- Chen, R.P.; Li, J.; Kong, L.G.; Tang, L.J. Experimental study on face instability of shield tunnel in sand. Tunn. Undergr. Space Technol. 2013, 33, 12–21. [Google Scholar] [CrossRef]
- Zhang, Z.Y.; Jin, X.G.; Luo, W. Numerical Study on the Collapse Behaviors of Shallow Tunnel Faces under Open-Face Excavation Condition Using Mesh-Free Method. J. Eng. Mech. 2019, 145, 04019085. [Google Scholar] [CrossRef]
- Yang, H.B.; Wang, M.N.; Yu, L.; Zhang, X.; Wang, Z.L.; Liu, D.G. MPM analysis for the stability mode and failure characteristics of tunnel face considering unsupported length. Comput. Geotech. 2024, 172, 106417. [Google Scholar] [CrossRef]
- Ai, S.G.; Gao, K. Elastoplastic damage modeling of rock spalling/failure induced by a filled flaw using the material point method (MPM). Rock Mech. Rock Eng. 2023, 56, 4133–4151. [Google Scholar] [CrossRef]
- Bui, H.H.; Fukagawa, R.; Sako, K.; Ohno, S. Lagrangian meshfree particles method (SPH) for large deformation and failure flows of geomaterial using elastic–plastic soil constitutive model. Int. J. Numer. Anal. Methods Geomech. 2008, 32, 1537–1570. [Google Scholar] [CrossRef]
- Stoker, J.J. Water Waves: The Mathematical Theory with Applications; John Wiley & Sons: Hoboken, NJ, USA, 1992; Volume 36. [Google Scholar]
- Schofield, A.N. Cambridge geotechnical centrifuge operations. Géotechnique 1980, 30, 227–268. [Google Scholar] [CrossRef]
- Ukritchon, B.; Keawsawasvong, S. Lower bound stability analysis of plane strain headings in Hoek-Brown rock masses. Tunn. Undergr. Space Technol. 2019, 84, 99–112. [Google Scholar] [CrossRef]
- Augarde, C.E.; Lyamin, A.V.; Sloan, S.W. Stability of an undrained plane strain heading revisited. Comput. Geotech. 2003, 30, 419–430. [Google Scholar] [CrossRef]


Disclaimer/Publisher’s Note: The statements, opinions and data contained in all publications are solely those of the individual author(s) and contributor(s) and not of MDPI and/or the editor(s). MDPI and/or the editor(s) disclaim responsibility for any injury to people or property resulting from any ideas, methods, instructions or products referred to in the content. |
© 2024 by the authors. Licensee MDPI, Basel, Switzerland. This article is an open access article distributed under the terms and conditions of the Creative Commons Attribution (CC BY) license (https://creativecommons.org/licenses/by/4.0/).