Article

Shear Performance of Prefabricated Steel Ultra-High-Performance Concrete (UHPC) Composite Beams under Combined Tensile and Shear Loads: Single Embedded Nut Bolts vs. Studs

School of Civil and Transportation Engineering, Guangdong University of Technology, Guangzhou 510006, China
*
Author to whom correspondence should be addressed.
Buildings 2024, 14(8), 2425; https://doi.org/10.3390/buildings14082425
Submission received: 8 June 2024 / Revised: 1 August 2024 / Accepted: 4 August 2024 / Published: 6 August 2024

Abstract

:
Ultra-high-performance concrete (UHPC) is widely used in precast concrete-steel composite beams because of its beneficial properties, including reduced structural weight, higher flexural rigidity, and reduced tensile crack formation. In comparison to conventional steel-concrete composite beams, steel-UHPC composite beams exhibit superior characteristics, including reduced structural deadweight, enhanced flexural stiffness, and the capacity to withstand tensile cracking. One successful attempt at meeting the current demands for expedited girder engineering is the development of steel-UHPC composite beams with full-depth precast slabs as key components affecting the overall structural performance using dismountable single embedded nut bolts (SENBs) and widely used studs as competitive alternatives. In contrast, shear connectors are exposed to a combined tensile and shear stress in service life rather than shear only. The corresponding scientific problem is the problem of combined effects under stress in practical applications, but there is currently no relevant research. The shear performance of SENBs in precast steel-UHPC composite beams under tension and shear loads remains unclear. For this purpose, ten push-out specimens and theoretical analyses were performed in this paper, considering the influence of the connector’s type and tensile-to-shear ratio. However, ten specimens were conducted to investigate the tensile-to-shear ratio, and the connector’s type on shear performance is limited. In the future, an increasing number of specimens and test parameters should be considered to investigate the shear performance of precast steel-UHPC composite beams. An increase in the tension-to-shear ratio resulted in a substantial reduction in the ultimate shear capacity, initial shear stiffness, and ductility of the studs. The increase in the tensile-shear ratio from 0 to 0.47 resulted in a 16.9% decline in the ultimate shear capacity, a 30.4% reduction in the initial shear stiffness, and a 21.7% decrease in the ductility of the Series I samples. However, an increase in the tensile-to-shear ratio of the Series II samples from 0 to 0.47 resulted in a 31.3% decline in ultimate shear strength, a 33.2% decline in initial shear stiffness, and a 41.9% decline in ductility. The SENBs demonstrated minimal deviations in ultimate shear capacity compared to their stud counterparts, despite exhibiting notable differences in shear stiffness, and ductility. A lower tensile-to-shear ratio was recommended in practical engineering, which might achieve a larger ultimate shear capacity, stiffness, and ductility. The design-oriented models with enhanced applicability were developed to predict the tension-shear relationship and the load-slip curve of SENBs in prefabricated steel-UHPC composite beams subjected to combined tensile and shear loads. For a tensile-shear relationship model, the point error range was 0 to 0.08, with an average error of 0.03. The square coefficient (R2) was 0.99 for a load-slip curve model. The study findings could offer a credible reference for the shear mechanism of such economical and environmentally friendly precast steel-UHPC composite beams in accelerated bridge construction.

1. Introduction

Normal concrete (NC) is widely utilized in beam construction due to its reliability and economy. However, it is often necessary to use large concrete structures to ensure reliable performance, which might require longer construction times. In addition, crushing and spalling concrete appear on NC due to its concrete strength. With the increasing demand for better behavior and lower costs, mounting research has been devoted to upgrading or exploiting structural mechanical performance by introducing innovative materials, structures, and techniques [1,2,3,4,5]. As a modern cement composite material, ultra-high-performance concrete (UHPC) has exceptional structural characteristics that minimize the life cycle costs of concrete structures [6,7,8]. The dense microstructure and distributed steel fibers of UHPC provide outstanding mechanical properties (e.g., strength, stiffness, and ductility) and durability (e.g., crack controllability and resistance to harsh environments), resulting in a lightweight structure compared to normal concrete (NC) [9,10,11]. With these favorable material properties and advanced manufacturing technologies, UHPC has become a concentrated research area in structures [12,13,14]. Recently, the combination of UHPC and precast technologies has gained the attention of academic and engineering communities due to the demand for energy efficiency and green construction [15,16]. One of the competitive approaches is using UHPC in steel-concrete composite beams. Compared to conventional steel-concrete composite beams, steel-UHPC composite beams exhibited superior characteristics, including reduced structural deadweight, enhanced flexural stiffness, and the capacity to withstand tensile cracking [17]. Nevertheless, conventional steel-UHPC composite beams often require on-site casting, steam curing operations, and extensive temporary formwork, which cannot be considered adequate for accelerated beam construction (ABC) [18,19].
As a posteriori response to this constraint, prefabricated steel-UHPC composite beams were designed with full-depth precast slabs and presented in Figure 1. These prefabricated steel-UHPC composite beams are assembled from factory-fabricated steel beams and full-depth precast UHPC panels, which are conveniently assembled through shear pockets by arranging the shear connectors in groups in the shear pockets. Shear connectors represent a fundamental component of steel-concrete composite beams. Their primary function is to transmit shear forces along the steel-concrete interface, with a direct consequence on the overall static behavior of steel-concrete composite beams. In recent years, several concentrated efforts have been made to investigate the shear performance of high-strength bolted shear and stud connectors within steel-concrete composite beams [18,20,21,22,23]. Conventional welded studs are usually clustered in a tight shear zone in order to achieve an important component of the effective action of the composite beams (Type I in Figure 1) [18,24,25]. Given the analogous failure mechanisms of conventional welded studs and SENBs, single-embedded nut bolts (SENBs) with one pre-embedded nut and one external nut on either side of the steel flange can also be employed in prefabricated steel-UHPC composite beams with full-depth precast UHPC slabs, as demonstrated in Figure 1 (Type II), which offer superior material properties, easier assembly, and superior accountability in comparison to conventional welded studs. Due to higher manufacturing tolerances, SENBs also exhibit a more significant ease of installation than the widely used high-strength friction-grip bolts (HSFGB). In addition, combining UHPC and demountable SENBs makes it possible to fully utilize their excellent material properties. Moreover, these new prefabricated steel-UHPC composite beams enable rapid dismantling and replacement around degraded members, extending the life of the structure at minimal cost. However, in the existing studies on steel-prefabricated UHPC composite beams using SENBs as shear connectors in full-depth prefabricated UHPC slabs, the shear mechanism remained unclear.
Among existing investigations on the shear performance of connectors in steel-concrete composite beams, increasing the diameter of the connector could effectively enhance the shear strength, stiffness, and ductility [26,27,28,29]. In our previous study, the connectors with a diameter of 22 mm presented superior shear performance [21]. In addition, increasing the height of the connector would enhance the shear strength [26,27]. However, the shear strength had an insignificant effect when the height was greater than 60 mm. The grade of concrete significantly affected shear strength when the compressive strength was less than 50 MPa [26,29,30,31]. However, in this study, the compressive strength of UHPC was at least 120 MPa. Increasing the number of connectors could improve the shear performance of composite beams [32,33]. In our previous studies, 4d was the best spacing of the connectors, which might achieve superior shear performance [10]. In the case of prefabricated steel-UHPC composite beams incorporating full-depth precast slabs, current investigations have examined the in-situ behavior of these elements, including the effects of stud diameter, bolted grade, bolted prestressing, casting method, and shear connector type on their shear behavior, including failure modes, load-slip behavior, ultimate shear/slip capacity, frictional resistance, and initial shear stiffness [34]. Nevertheless, with the expansion of the number of composite structural applications, shear connectors are used in specific cases for both tension and shear applications, including composite beams, composite columns, connections in composite truss beams, and cable beam suspension in composite cable-stayed beams. The findings of these studies on the combination of tension and shear showed that the shear resistance of the joints diminished as the tension in the joints increased. The mode of failure of the studs under mixed loading was characterized by shear deformation and necking [35]. It had been demonstrated that the ultimate shear strength of welded studs might be reduced when subjected to combined loads, with this reduction being more pronounced at higher tensile forces [36,37,38,39,40,41]. The laboratory evidence led McMackin et al. [42] to derive an elliptical equation for the ultimate shear strength of studs under combined tensile and shear forces, which was later recognized as a standard by PCI 6th (2004). Bode et al. [43] conducted an in vitro experiential study and proposed a triple equation for calculating the ultimate shear strength of headed studs under combined tension and shear loads. This equation was subsequently identified as the most appropriate by the PCI 6th [44] and ACI 318-08 [45]. In a study published in 2008, Takami and colleagues [9] presented a circular equation for calculating the ultimate shear strength of studs under the joint action of tensile and shear stresses. The Japan Society of Civil Engineers (JSCE) [46] later endorsed this equation. Johnson et al. [47] conducted an investigation into the response of studs to combined forces and concluded that the failure of studs was attributable to the mixed action of tensile and shear stresses. The test results of studs subjected to different tensile forces were analyzed by Lin et al. [35], who identified the necessary calculation equations for the ultimate shear strength of studs under combined tensile and shear forces. The focus of previous studies has been on the performance of conventional studs under conditions of mixed shear and tension stress. Few investigations have been made on the behavior of precast steel-UHPC composite beams using SENBs as shear connectors in full-depth precast UHPC slabs under the simultaneous application of tension and shear, and the shear mechanism is still unclear.
In this paper, 10 push-out samples were used to investigate the shear behavior of both SENBs and studs under mixed tensile and shear loading. Various inclination angles were examined to evaluate the influence of tensile-shear ratios on failure modes, load-slip curves, load-uplift curves, ultimate shear capacity, shear stiffness, and ductility of SENBs and studs in prefabricated steel-UHPC composite beams with full-depth precast slabs. On the basis of the results of the present and previous investigations, the models for the prediction of the shear-tension interaction strength and the load-slip relations of SENBs embedded in UHPC under combined tensile and shear loading have been established. The study findings could offer a credible reference for the shear mechanism of such economical and environmentally friendly precast steel-UHPC composite beams in accelerated bridge construction, bridge the existing knowledge gap, meet the increasingly widespread demand for composite structure applications, and enhance the competitive application of UHPC in construction and bridge engineering.

2. Experimental Program

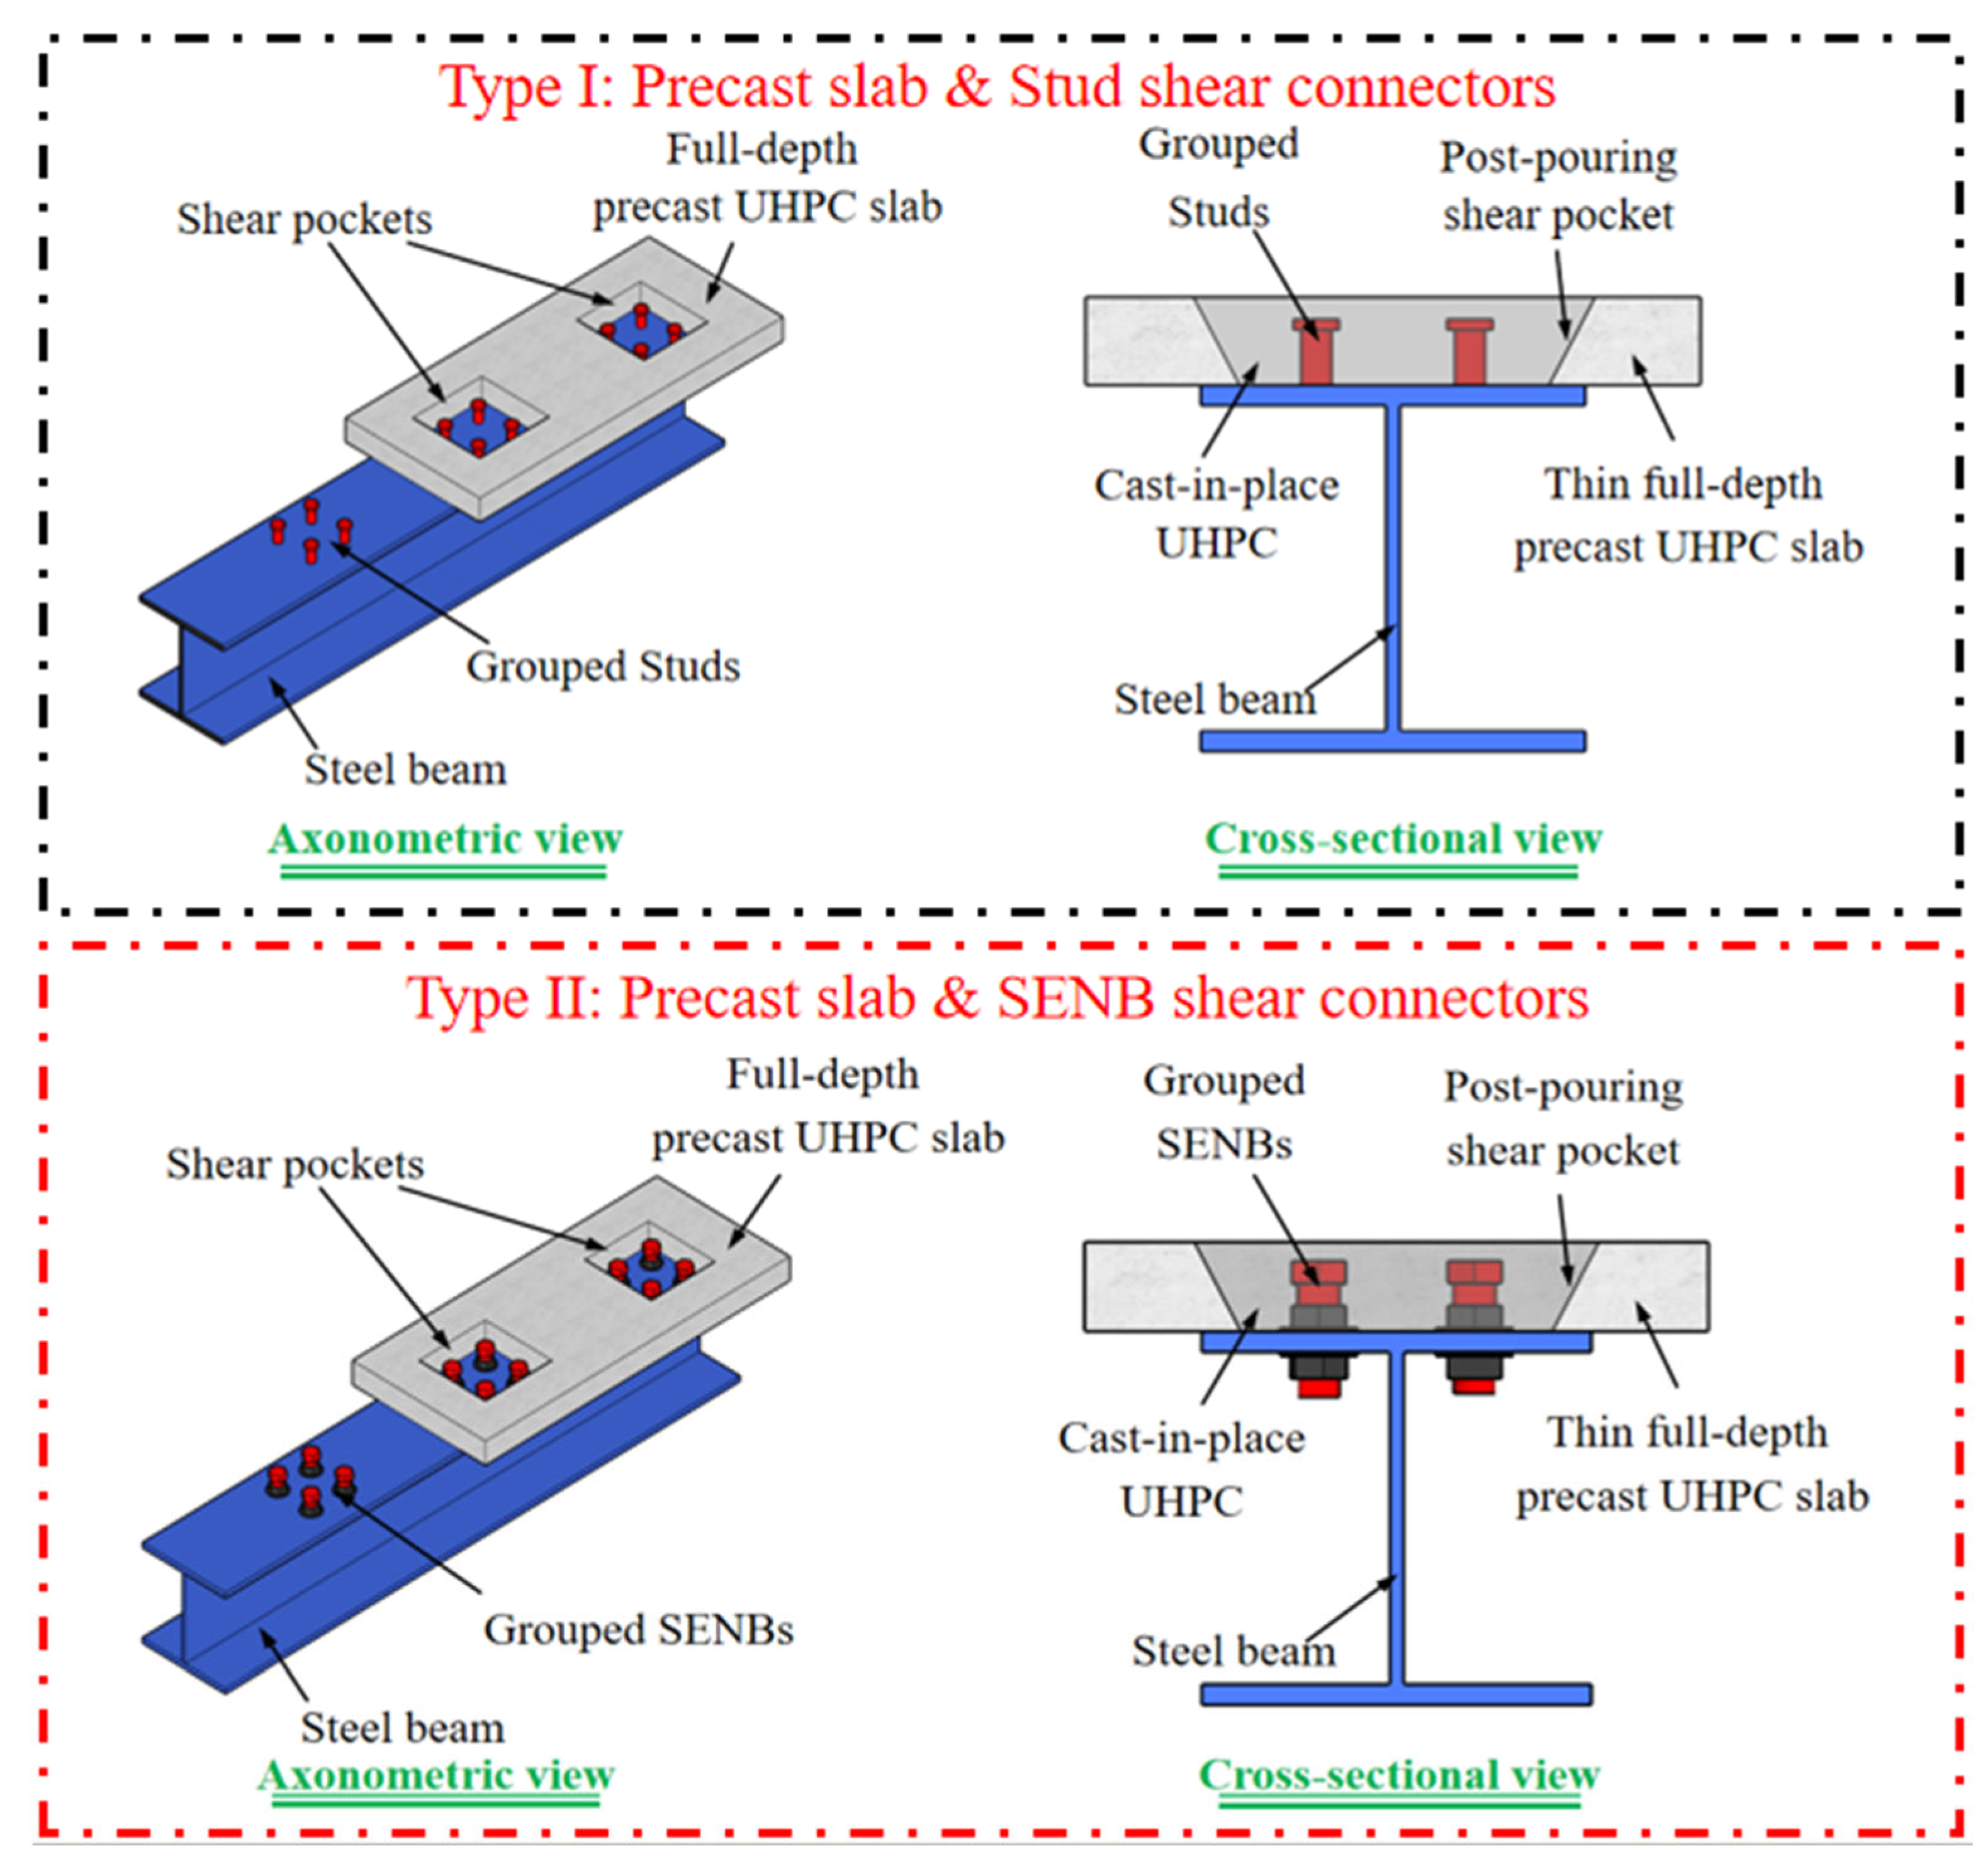
2.1. Specimen Details and Preparation

The push-out test is a cost-effective tool to study the shear behavior of shear connectors in steel-concrete composite beams. The design formulae in Eurocode 4, as well as in other design codes, were developed based on lots of push-test results. And it was also suggested that the shear strength of connectors can be directly determined through the push-out test. The results and conclusions from the push-out tests can be regarded as references for the design of the steel-precast UHPC composite structures. To determine the shear behavior of SENBs and studs in prefabricated steel-UHPC composite beams under combined tension-shear loading, ten samples were prepared in this study. In our previous study, the combination of UHPC slabs with a thickness of 75 mm and high-strength friction-grip bolts with a diameter of 22 mm and a strength grade of 12.9 allowed the specimens to present superior shear performance [48]. More recently, the feasibility of prefabricated steel-UHPC composite beams with grouped SENBs has been demonstrated through comprehensive experimental and numerical investigations. The typical configurations and dimensions of these samples were determined according to Eurocode 4 (2004) [49], as depicted in Figure 2. To analyze the structural performance of different shear connectors, these tests could be divided into two series, with each series consisting of one standard push-out (SP) and four modified push-out (MP) specimens. The SP sample represented a push-out sample under pure shear loading, in which the inclination angle was 90° from the horizontal interface, according to Figure 2a. Each push-out test was composed of a 450 mm high HW250 × 250 × 14 × 9 hot-rolled steel beam and two UHPC side panels. All precast panels were designed to represent the full-depth precast panels with the same geometric dimensions of 450 mm in height, 400 mm in breadth, and 75 mm in gauge. The steel and concrete sections were connected using two pairs of shear connectors arranged in two rows and two columns. These connectors had the same height of 60 mm and a longitudinal distance of 100 mm. In addition, these shear connectors were embedded in inverted conical shear pockets, which have dimensions of 255 mm × 255 mm on the outside and 215 mm × 215 mm on the inside on each side of the samples. Unlike the SP samples, the hot-rolled steel beams in all MP samples needed to be cut through the symmetry plane for the corresponding assembly process, as depicted in Figure 2b. The front face of the steel beam was trapezoidal with a thickness of 14 mm, while the other dimensions of the steel beam were variable as a function of the slope gradient of the steel-UHPC interface. Accordingly, the UHPC panels in all MP samples were 400 mm wide, 75 mm thick, and 450 mm high, but varied in height according to the tension-shear ratio. In addition, a height difference of 100 mm was established at the upper end of the steel and concrete sections. This was done to allow for interfacial sliding during testing.
Table 1 lists the sample names and arrangement details. Figure 2 depicts the typical structure and measurements of the standard and modified push-out test samples of the SENBs series. The standard push-out test (SP-Test) sample represented a push-out sample tested at an inclination angle of 90° from the horizontal interface, i.e., under pure shear loading, and consisted of a 450 mm high HW250 × 250 × 14 × 9 hot-rolled steel beam and two lateral UHPC slabs of the same dimensions and configuration. Designed to represent full-depth precast panels, all precast panels had essentially the same geometric dimensions of 450 mm high, 400 mm wide, and 75 mm thick. Due to the inverted conical shear pockets, which increased the confinement of the surrounding concrete, the ultimate load capacity, initial shear stiffness, and ductility of the samples were improved [50,51]. The steel and concrete sections were attached using two pairs of shear connectors in two rows and two columns embedded in inverted conical shear pockets measuring 255 mm × 255 mm on the outside and 215 mm × 215 mm on the inside on each side of the sample. These connectors had the same height of 60 mm and a distance of 100 mm in the longitudinal direction. Figure 2a is a diagram of a grouped stud array and additional features of the push-out samples. Figure 2b shows a sample from the SENBs series with an inclination angle of 75° from the horizontal interface. Unlike the SP-Test samples, the hot-rolled steel beams in all MP-Test samples needed to be cut through the symmetry plane for the corresponding assembly process. The front face of the steel mesh was trapezoidal with a thickness of 14 mm, while the different measurements of the steel beams varied according to the angle of inclination of the steel-UHPC interface, i.e., the angle of inclination from the horizontal interface. Correspondingly, the width of the UHPC plate in all the MP-Test samples was 400 mm, the thickness was 75 mm, and the outer height varied according to the tensile-shear ratio, and the inner height was 450 mm so that the front view of the UHPC plate was trapezoidal. The dimensions of the inverted conical shear pockets of the MP test samples were the equivalent of those of the SP test samples, and the measurements of the studs were the equivalent of those of the grouped studs. The connector layouts were the following: the same as the SP test sample. The MP sample had the same inverted conical shear pocket dimensions as the SP test sample, and the stud dimensions and grouped stud layout were the same as the SP test sample. Other details are shown in Figure 2b. In addition, a 100 mm height difference was allowed at the top of the rebar and concrete sections to allow for interfacial sliding during testing.
Table 1 lists the detailed sample designations and arrangements. To compare the different types of shear connectors, two series of push-out tests were set up using SENBs (Series I) and studs (Series II). To compare the shear behavior of the two types of shear connectors under different combinations of forces, each series was further set up with five separate angles of inclination from the horizontal interface (90°, 80°, 75°, 70°, and 65°). The samples were labeled according to these test parameters, i.e., “connector type-connector diameter-the angle of inclination from the horizontal interface.” For example, SP sample B-D22A90 in Series I indicated a sample with a 22 mm diameter SENB and an inclination angle of 90° from the horizontal interface.
Figure 3 presents the manufacturing process for all samples. The fabrication of the steel beams was conducted before the fabrication of the concrete slabs. To minimize the difference in material properties among the concrete slabs, the steel beams were cut along the symmetry plane into two T-shaped sections. The flanges of the steel joists were supplied with bolted holes of the appropriate diameters. After the bolts had been installed in the precast holes, a preload was applied to the bolts. As shown in Figure 3, Step1, to ensure sufficient preload, the torque coefficient was tested using a torque wrench. As shown in Figure 3, Step2, twenty corresponding wooden formworks were made. Then UHPC was poured into wooden formworks to obtain the precast slabs with reverse shear pockets. These slabs were cured in a specific curing environment with temperatures exceeding 80 °C and a relative humidity of not less than 95% for three days after the hardening of the concrete (in 24 h). The cured slabs were then placed on the steel flange in accordance with Figure 3, Step3. Grease was applied to the steel flanges to relieve the surface adhesion between the steel and concrete components prior to the placement of the pocket concrete. The pocket connections on each sample were poured at the same time to minimize the effect of material properties. As shown in Figure 3 Step4, the curing procedure for the shear pocket concrete was the same as that for the precast panels. When the shear pocket concrete cured, two individual T-shaped steel beams were welded together to form the target push-out tests. Finally, the beams and precast slabs were leveled to minimize fabrication errors. Through the above-mentioned process, ten push-out samples were prepared and ready for load testing, as shown in Figure 3 Step5. Six cylindrical samples (ɸ 100 × 200 mm2) were manufactured for each batch and were hardened under the same circumstances to evaluate the physical characteristics of the concrete.

2.2. Material Properties

The UHPC cast in precast slabs and shear pockets had the same properties. The UHPC mixtures consisted of 52.5R silicate cement, silica fume, nano-CaCO3, silica sand, steel fibers, super-plasticizers, and water with a mass of 829, 216, 35, 1079, 156, 29, and 194 kg/m3, respectively. Accordingly, the corresponding serviceability of fresh UHPC was determined by flow testing according to ASTM C1437 (2015) [50]. The density of fresh UHPC was then evaluated according to the procedure specified in ASTM C29/C29M (2016) [51]. As previously described, several cylinders with diameters of 100 mm and heights of 200 mm were prepared to measure the compressive strength fc (ASTM C1231/C1231M 2015) [52], modulus of elasticity Ec (ASTM C469/C469M 2014) [53], Poisson’s ratio v (ASTM C469/C469M 2014) [53], and the split tensile strength ft (ASTM C496/C496M 2011) [54] of UHPC. Table 2 summarizes the average results for the above-mentioned material properties for at least three samples.
As shown in Figure 4, tensile tests had been carried out on the production of the steel. The material performance of the fasteners was measured by examining three 12.5 mm diameter circular tensile samples from the same lot as the push-out samples. The direct tensile performance of the steel beams was obtained by testing three dog-bone shaped samples cut from the same lot as the push-out samples. The average test results, including the modulus of elasticity Es, the yield strength fy, and the corresponding tensile strength fu, are depicted in Table 3.

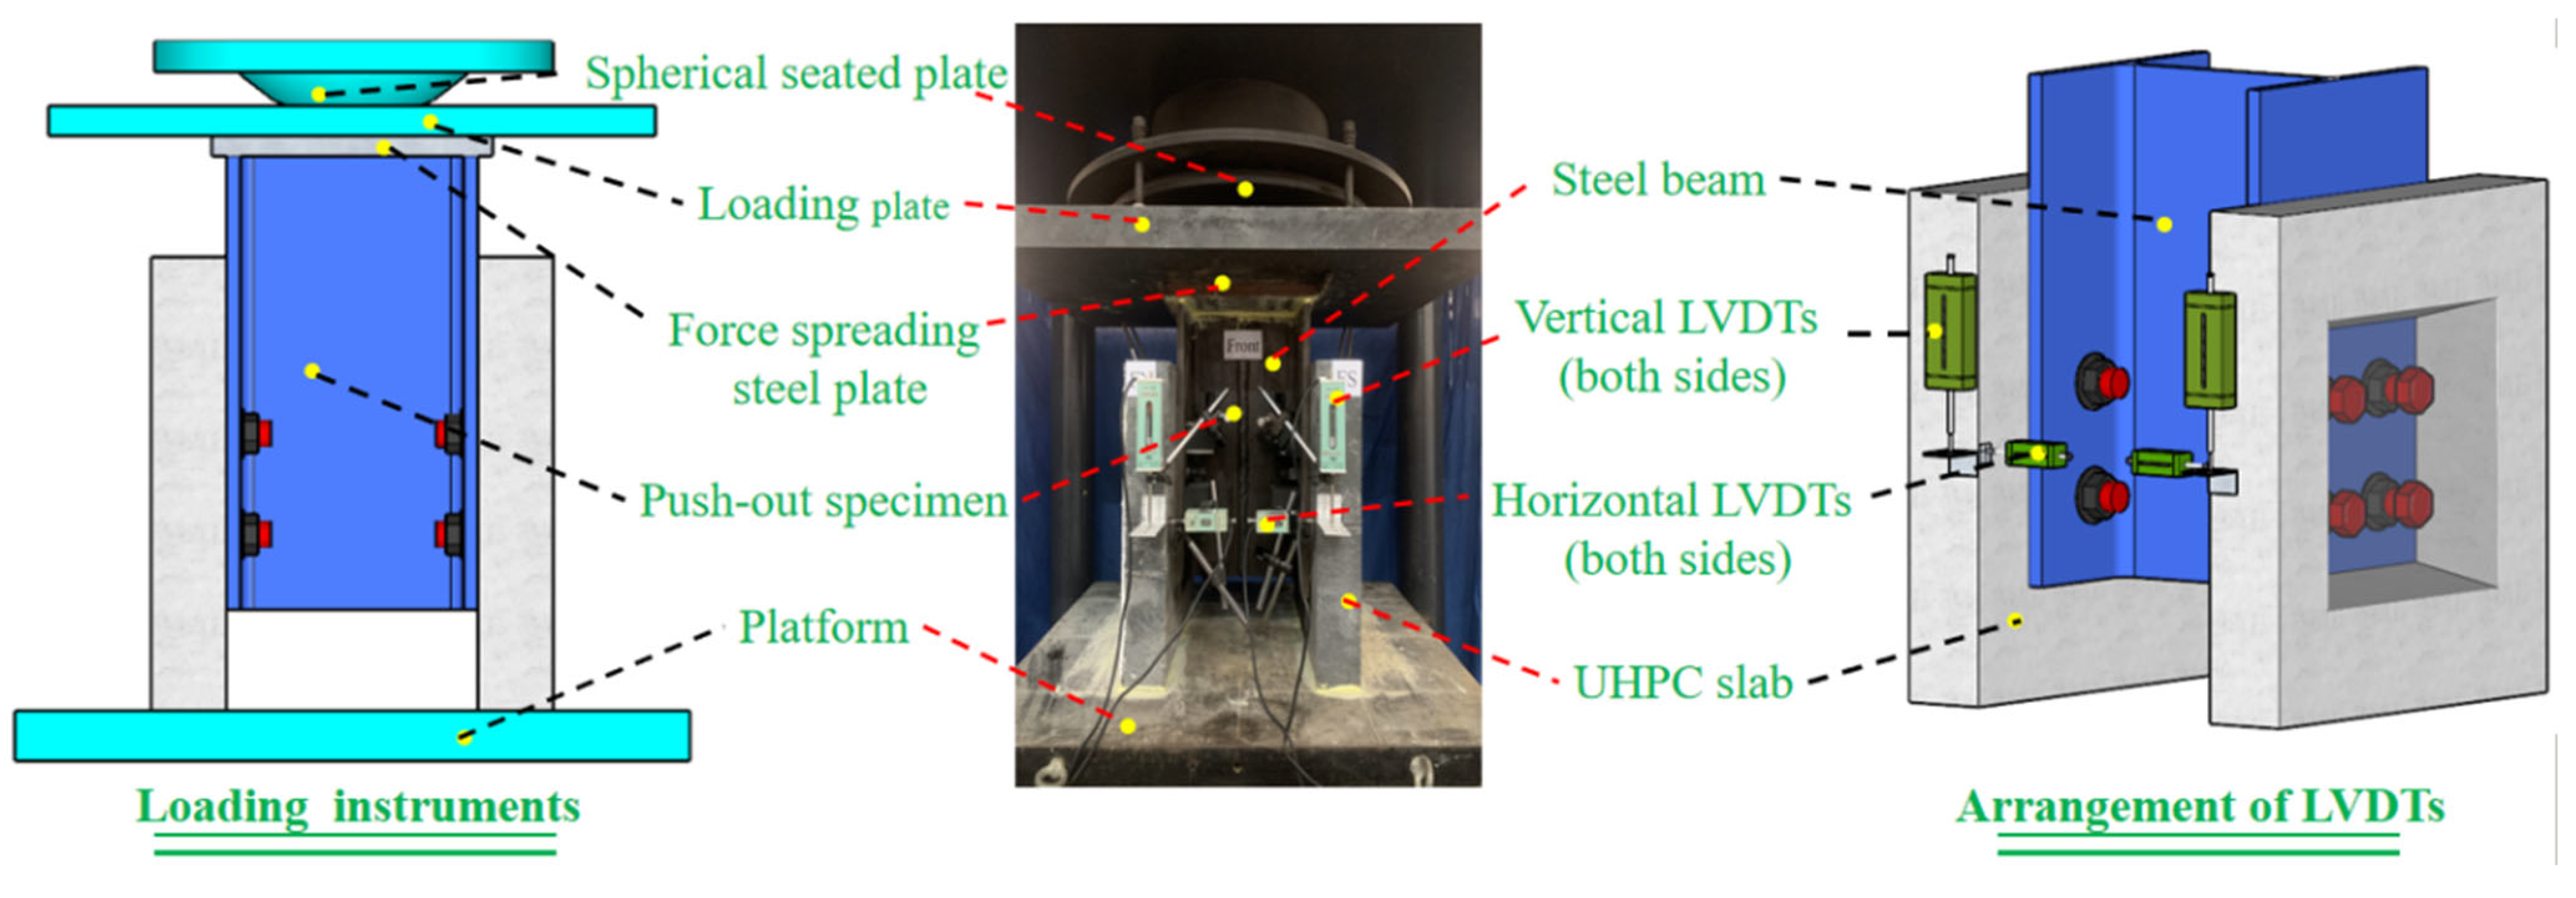
2.3. Test Setup and Instruments

At the Bridge Laboratory of the Guangdong University of Technology, China, all push-out investigations were carried out on a 500 T compression machine (Figure 5). This 500T compression machine with the serial number YA2005114S was an automatic pressure testing machine that was made by Zhejiang Schlikor Equipment Manufacturing Co., Ltd. in China. To guarantee consistent load transfer, a 25 mm thick force-expanding steel plate was used on the upper side of the sample, and a thin coating of high-strength gypsum was used between the sample and the machine platform for stress transfer on the upper/lower sides of the sample. Eight linear variable displacement transducers (LVDTs) were installed to track the displacement during the push-out tests (Figure 5), including four 50 mm LVDTs oriented vertically to gauge the relative longitudinal slip between the steel beams and the UHPC slab, and four 10 mm LVDTs oriented horizontally to measure the relative transverse displacements. These transducers were attached to the four edges of the sample at a height equal to the center of the shear pocket.
A two-phase loading procedure was used for this investigation. Before official loading, the samples were preloaded to 20 kN. For the formal loading, force loading was first applied at a velocity of 1 kN/s. The force-controlled loading was ramped up to 100 kN and then switched to displacement-controlled loading. The sample was loaded monotonically at a velocity of 0.18 mm/min without stopping for the duration of the push-out test. The test was terminated when the shear connector broke or the load was reduced to half the ultimate shear capacity.

3. Discussion of the Results of the Experiment

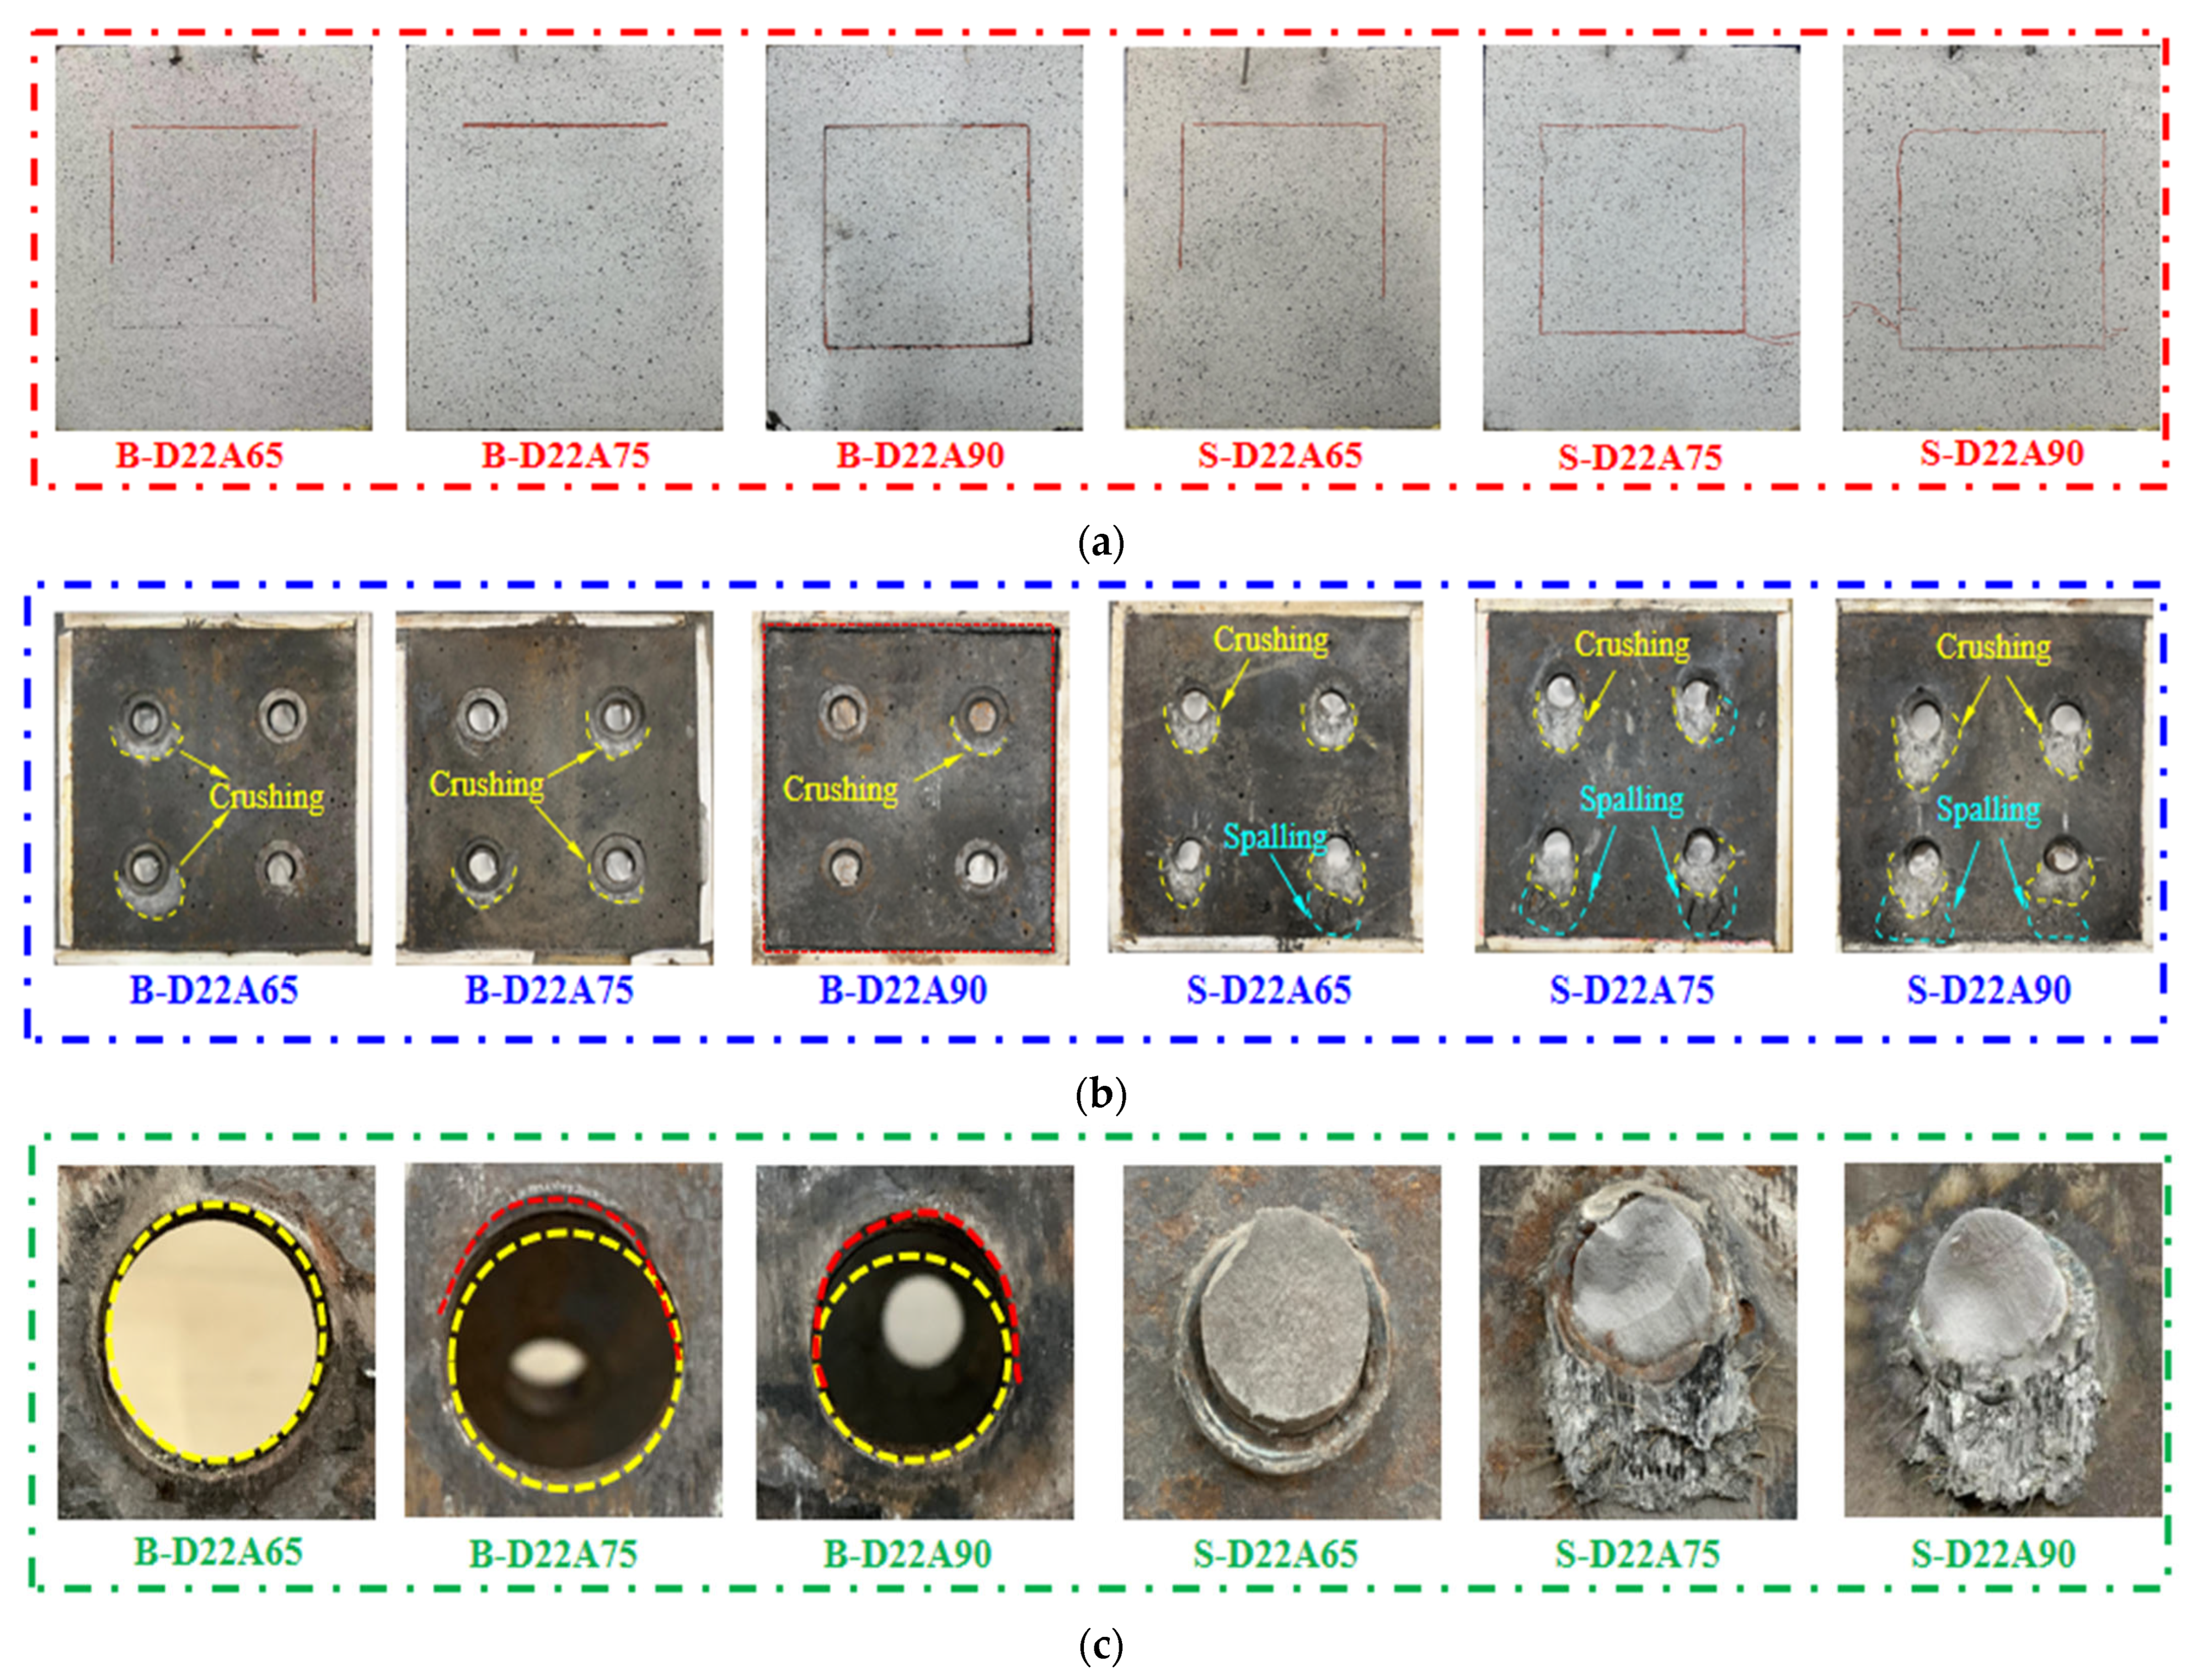
3.1. Typical Failure Modes

Figure 6 illustrates the typical failure modes and close-up views of the samples. It could be noticed that there was a slight difference in the fracture appearance on the outer side of the concrete slab for the samples from Series I. Figure 6a showed that cracks were found only around the shear pockets on the outside of the slab, but only a small number of fractures were seen on the exterior of the concrete slab of sample B-D22A75. As displayed in Figure 6b, the samples exhibited concrete crushing in the region near the root of the bolt. This localized concrete crushing in the vicinity of the connector root was due to the large bearing pressure at the steel-concrete joint [55]. The failure pattern was controlled by the fracture of the bolts adjacent to the beam-pocket interface, with only a small portion of concrete damage below the bolt roots. According to Figure 6a,b, no evident variation in crack development and failure in the regions close to the bolt root was found in samples with different tension-to-shear ratios, which might be related to the small diameter of the SENBs.
However, after removing the steel beams after the tests, a slight plastic deformation of the predrilled holes was noted, accompanied by the penetration of the bolt threads through the walls of the holes. It could be noticed through Figure 6c that the shearing force on the bolts decreased and the deformation on the bolt holes decreased as the tension-shear ratio increased.
Unlike the push-out tests with SENBs, all the samples in Series II showed similar failure modes. However, horizontal cracks between the shear pockets and the surrounding precast slabs could be found in Figure 6a, which was attributed to the horizontal and vertical deformation between the shear pockets and the surrounding precast slabs when subjected to large loads. Consequently, for samples with a large ultimate shear capacity (e.g., S-D22A90), the concrete splitting around the shear pockets were more pronounced and tended to propagate from the bottom corners to the precast slabs. In addition, due to the superior pullout resistance of the high-strength bolts, crack development was more significant in the samples with studs compared to those with SENBs, as shown in Figure 6a. Due to the confinement of the root region by the weld, the position of the bolts’ sections was produced above the weld. The section of the bolts had an inclined planar shape, which was related to the tensile shear ratio. In addition, samples in Series II failed in stud fracture, and all fractured studs remained encased in pocket concrete with the welds on the steel beams remaining intact. The restraining effect of the weld ring resulted in a predominantly compression collapse of the concrete. However, as illustrated in Figure 6b, significant concrete crushing and localized spalling occurred in front of the stud roots on the inner side of the precast slabs due to stress concentration. It was also observed from Figure 6c that there was no appreciable variation in the failure modes of the Series I sample with different tensile/shear ratios, which further resulted in similar load-slip behavior as described below.

3.2. Relationship between Load and Interfacial Slip

Figure 7 illustrates the relationships between the exerted load and the vertical interfacial slip (referred to as the “load-slip relation”). The shear capacity was defined as the load applied to each connector, while the slippage at the interface was specified as the average recorded value of the four LVDTs installed in the vertical direction. As shown in Figure 7, the minimum value of the load applied to the push-out specimens was 0. For Series I specimens, the maximum loads applied to the specimens from B-D22A90 to B-D22A65 were: 1497, 1351, 1319, 1294, and 1243 kN. For Series II specimens, the maximum loads applied to the specimens from S-D22A90 to S-D22A65 were: 1724, 1533, 1464, 1269, and 1184 kN.
As illustrated in Figure 7a, it was noticed that the samples of Series I exhibited a comparable pattern in their overall load-slip responses. The general load-slip relations consisted of four distinct regions, i.e., elastic, plastic, strengthening, and decline phases. In the initiating elastotic phase, a linear correlation was established with the applied load and interfacial slip [14,56], resulting in the physical abrasion of the nut embedded in the steel beam due to the preload of the bolts. Once the friction was overcome, the slope of the curve for the load-slip relationship decreased significantly, indicating that the plastic phase was reached. The apparent interfacial slip at this stage was mainly caused by thread penetration and the nonlinear responses of the bolts and concrete slabs. During the subsequent strengthening phase, the yielding of the bolts and deformation of the preformed holes occurred, increasing shear capacity with decreasing slope until the ultimate shear capacity was reached. During the post-peak decline phase, the shear load dropped abruptly, indicating the brittle behavior of the bolt fracture.
The load-slip relations for the Series II samples are illustrated in Figure 7b, which also exhibited similar four-stage behavior. However, different to the Series I samples, no significant change was observed between the elastic and plastic phases because the stud shear resistance was provided by the bearing mechanism rather than by mechanical friction. Due to the absence of thread penetration, studs exhibited stiffer load-slip behavior than bolts during the plastic phase.
Although the load-slip responses of all push-out samples were comparable, the characteristic values used to define the performance of the connectors varied with the test parameters. However, it could be observed from Figure 7a,b that the ultimate shear bearing capacity, initial shear stiffness, and corresponding slip capacity of samples of the same shear connector type decreased as the tensile-shear ratio increased. In the subsequent paragraphs, this phenomenon is discussed.

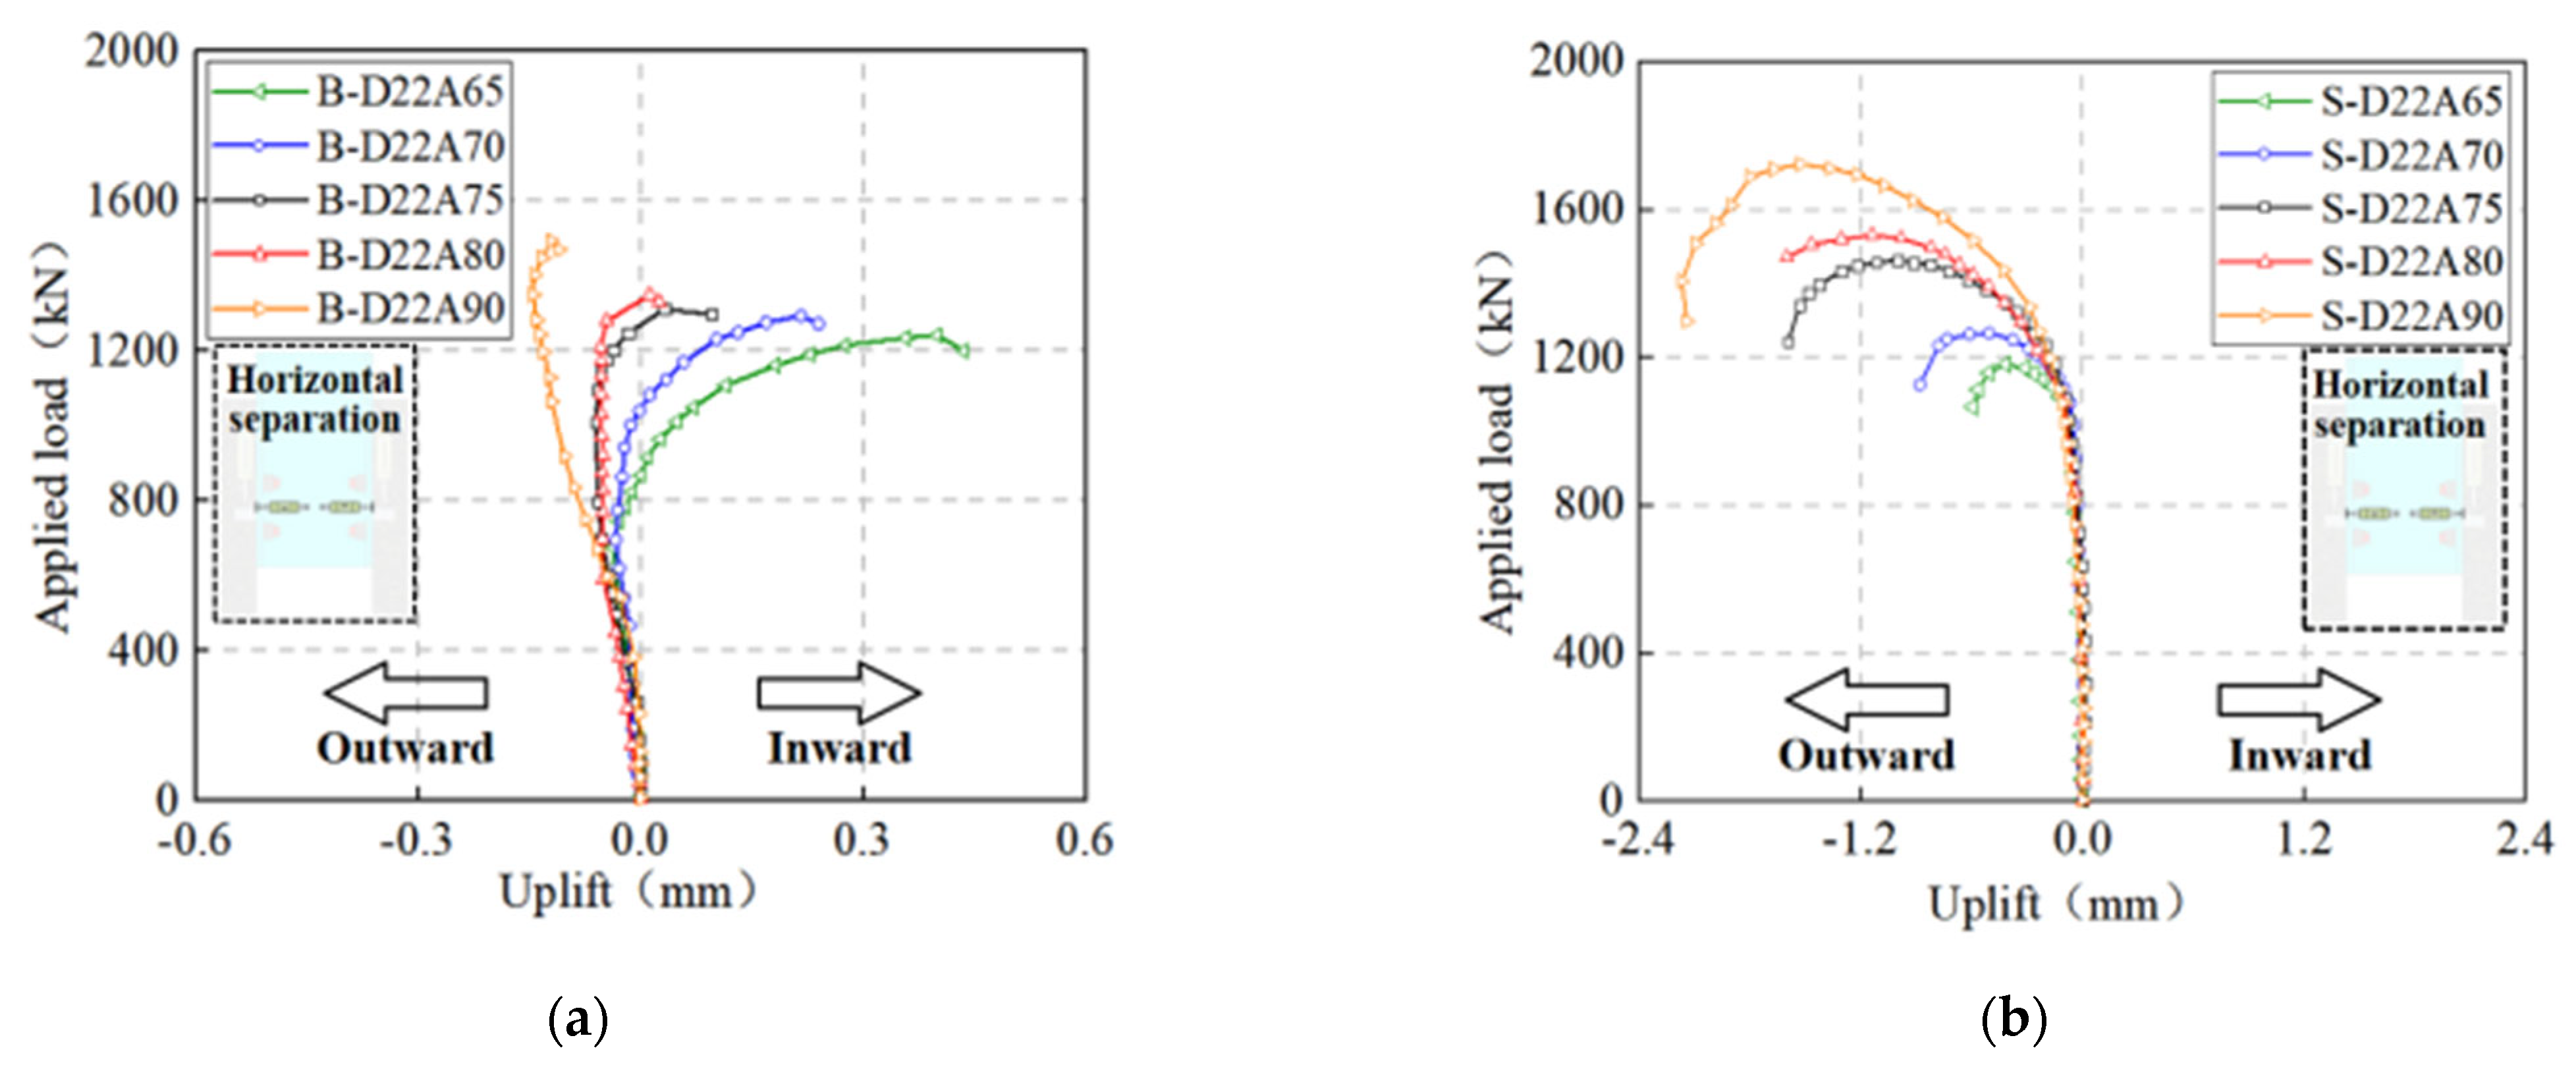
3.3. Relationship between Load and Interface Bulge

The load-uplift relations for all push-out tests are presented in Figure 8, and the uplifts (separations) at the ultimate shear capacity P u are also listed in Table 4. During the push-out tests, the slabs tended to lift from the beams, resulting in lateral separation from each other. Figure 8 shows the load-slab uplift relationship for all tests. Note that the uplifts here were averaged from the four horizontal LVDTs obtained as shown in Figure 5. In particular, positive and negative values corresponded to inward and outward slab rotation, respectively.
It could be found that most of the curves for the Series I samples expanded first in the negative direction and then in the positive direction as the load increased, indicating the first outward separation between the steel and concrete components. Subsequently, the precast panels exhibited an inward rotating tendency to separate due to the lateral separation of the bolts. Even with loads up to 0.8   P u , uplift was observed to range from a negative value of 0.2 mm to a positive value of 0.2 mm, which was less than 7% of the corresponding interfacial slip. However, except for the sample with a large angle (B-D22A90), the plate tended to rotate inward before reaching the peak load.
One possible explanation for this interesting phenomenon was that the lateral separation was limited by the normal action induced by the bolt pre-tension, which gradually increased with the development of interfacial slip [34]. However, the increase in pretension in sample B-D22A90 might not be able to resist lateral separation. As a result, the uplift in B-D22A90 (about −0.15 mm) at peak load was about 3% of the corresponding slip capacity. As the tension-to-shear ratio increased, the greater the normal tensile force applied to the Series I samples, the more significant the degree of transverse uplift of the concrete slabs at the ultimate shear load capacity.
Unlike the curves of the Series I samples, the curves of the Series II samples were all stretched in the negative direction, as depicted in Figure 8b, indicating the corresponding outward plate rotation between the steel and concrete components.
Conventional studs tended to segregate with outward rotation of the precast slab during interfacial slip due to the constraints of the weld ring. With an increase in the slope angle, the transverse buckling of the Series II samples at ultimate shear capacity increased. The rapid increase in uplift might be related to the sliding of the slab on the stud collar [57]. Therefore, the use of high-strength SENBs in precast slabs was an effective way to reduce lateral separation, which led to an unfavorable combination of tensile, shear, and bending effects of shear-resistant connectors.

3.4. Shear Properties of SENBs and Studs in Prefabricated Steel-UHPC Composite Beams

The evaluation of the shear behavior of SENBs and studs in prefabricated steel-UHPC composite beams was based on the experimental data from the push-out tests, as indicated in Table 4. Meanwhile, in order to facilitate analysis and perception, the Ishikawa causality diagram (Figure 9) was used for analysis. This paragraph reviewed the implications of tension/shear ratios and shear connector types on ultimate shear capacity, original shear stiffness, and slip capacity. The ultimate shear capacity P u was determined as the quotient of the peak load and the number of joints. To further assess the deformation capacity of the composite beams in service, initial shear stiffness was k introduced and calculated as the steepness of the tangent of the load-slip graph at 0.2 mm slip [7]. In addition, the shear connectors were assessed for their ability to slip capacity S u . Shear connectors with a slip capacity greater than 6 mm could be identified as being in ductile response to Eurocode 4 (2004). The slip capacity is suggested to be the maximum slip recorded at 90% of the shear-bearing capacity after breakage. Taking into account the instantaneous load loss due to the failure of bolted shear connectors, the slip capacity S u was assessed by measuring the relative vertical slip when loaded to peak, as adopted in previous studies.

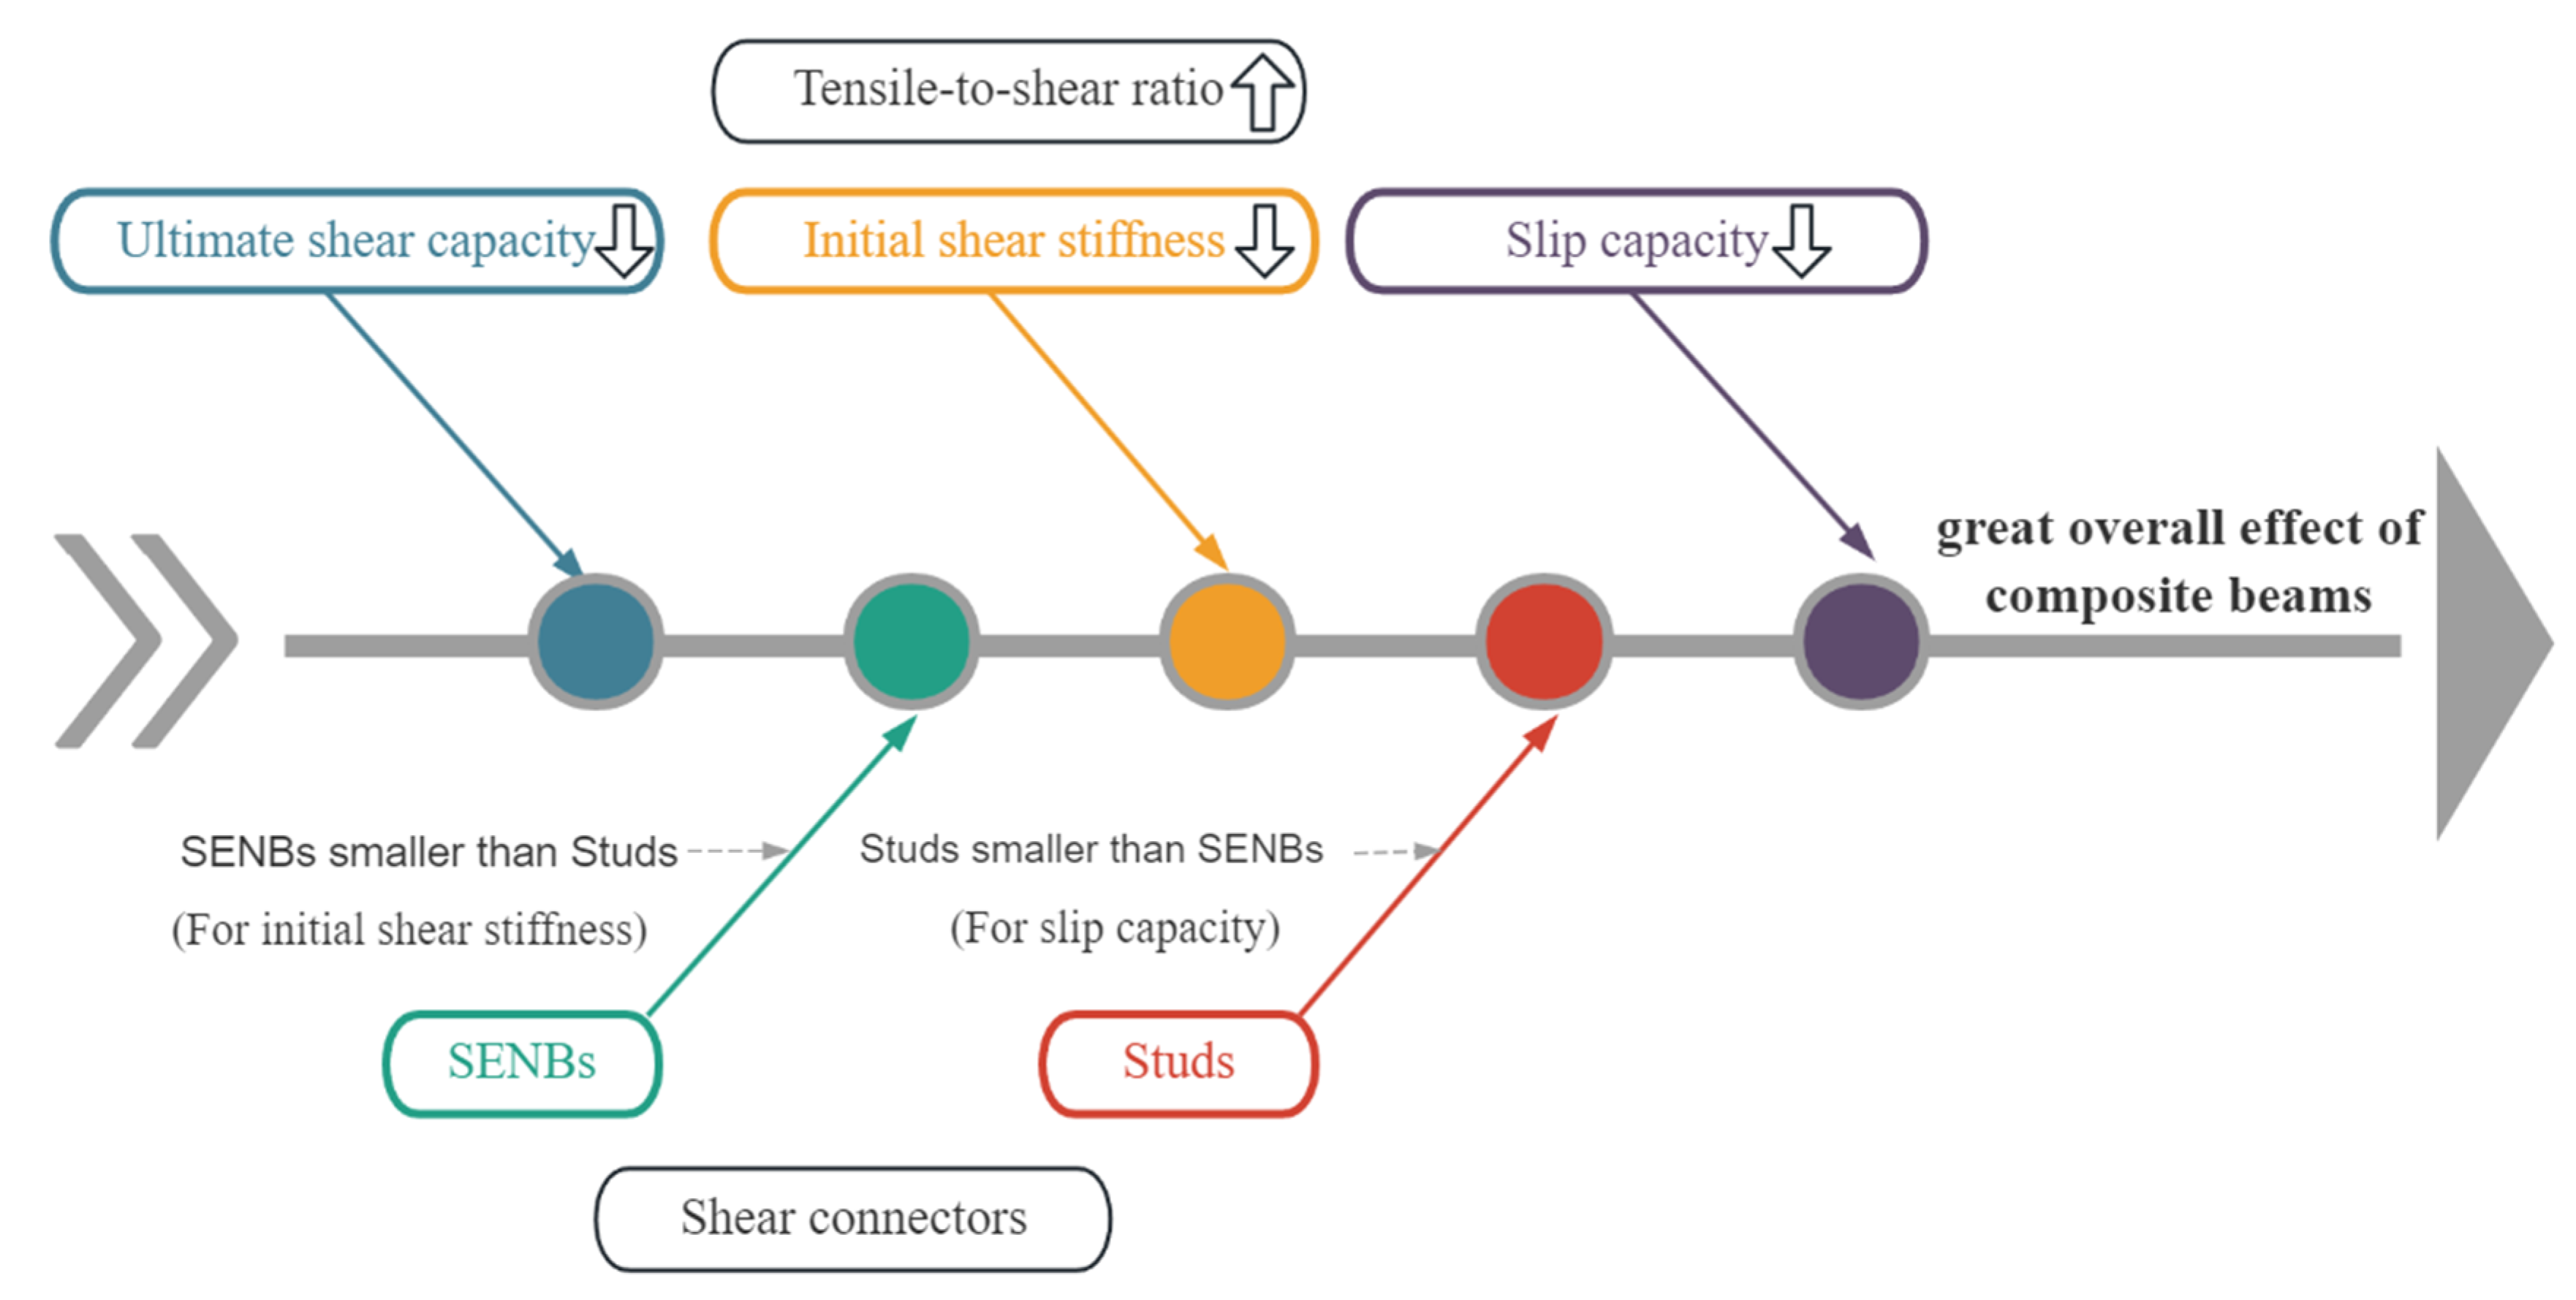
3.4.1. Comparison between SENBs and Studs

This section provided a comparison of the SENBs and studs under combined tension-shear loading. It was found that the deviation in ultimate shear bearing capacity between Series I and II samples having the same tensile-to-shear ratios (0, 0.18, 0.27, 0.36, and 0.47) was about 13%, 12%, 10%, 2%, and 5%, respectively.
The effective area of the bolt thread (B-D22A90, 303 mm2) was approximately 0.8 times that of the S-D22A90 (380 mm2), so a stud of the same diameter and inclination angle of the horizontal interface should have a greater bearing effect than a bolt. However, due to the deviation in material properties, the ultimate shear bearing capacity of specimens with different shear connectors and the same tensile shear ratio had not fully demonstrated this pattern. In addition, the ultimate shear capacities of the corresponding Series I samples were superior to those of the Series II samples for both tensile-to-shear ratios of 0.36 and 0.47, which could be attributed to the fact that the material properties of the studs were not as good as those of the SENBs.
In addition, a clear difference in the initial shear stiffness could be found in Figure 10b, where it could be observed that the initial shear stiffness of all Series I samples with the same angle of inclination from the horizontal interface was smaller than that of Series II samples.
However, the low initial shear stiffness of the SENBs was a result of the early onset of nonlinearity, which was mainly due to the overcoming of interfacial friction, the penetration of the bolt threads through the hole wall, and the reduction in the bearing capacity of the concrete ahead of the embedded nut [19].
As illustrated in Figure 10c, the slip capacities exhibited by the different shear connectors were also quite different. The slip capacities of the connectors in Series I were larger than those of the Series II samples with the same angle of inclination from the horizontal interface.
This was because the slip S u was the relative vertical slip under peak load. Due to the superior ductility of the bolts, the relative slip at bolt fracture was much greater than the relative vertical slip at peak load. In contrast, SENBs exhibited a brittle failure pattern, and the relative slip at fracture was not much different from the relative vertical slip at peak load. However, the shear connectors resulted in more severe concrete damage, which was not conducive to fully utilizing the constructive performance of the steel-concrete composite beams.

3.4.2. Effect of Sample Tensile Shear Ratio

This study considered five different angles (i.e., 90°, 80°, 75°, 70°, and 65°) to illustrate the effect of tension-shear ratio on the shear behavior of bolted shear connectors in prefabricated steel-UHPC composite beams under tension and shear loads. The ultimate shear bearing capacity of Series I samples with inclination angles of 80°, 75°, 70°, and 65° were 90.3%, 88.1%, 86.4%, and 83.1% of the 90° samples, respectively. The ultimate shear bearing capacity of the Series II samples with inclination angles of 80°, 75°, 70°, and 65°were 88.9%, 84.9%, 73.6%, and 68.7% of the 90° samples, respectively.
Table 4 and Figure 10 showed that the angle of inclination contributed significantly to the ultimate shear capacity of the UHPC precast slabs. For Series I samples, the change in ultimate shear capacity of the UHPC precast slabs began to decrease when the tensile shear ratio increased to 0.18 or above. Therefore, it was recommended to design SENB samples with a pull-to-shear ratio less than 0.18. For both series of push-out samples, the ultimate shear capacity decreased with an increasing angle of inclination from 90° to 65°.
As illustrated in Table 4, a decrease in the inclination angle from the horizontal interface caused a reduction in the initial shear stiffness. Compared to the 90° samples in Series I, the initial shear stiffness for samples with inclination angles of 80°, 75°, 70°, and 65° decreased by 8.4%, 15.7%, 20.7%, and 30.4%, respectively. For Series II samples with inclination angles of 80°, 75°, 70°, and 65°, the initial shear stiffness decreased by5.1%, 15.5%, 23.1%, and 33.2%, respectively, compared to the 90°samples.
When the reduction in the angle of inclination from the horizontal interface was large, the initial shear stiffness of the studs was significantly reduced because the presence of tensile force accelerated the destruction of the stud [58]. It was found that the tensile-shear ratio exerted a greater constraint on shear stiffness.
As mentioned in Table 4, the increase in inclination angle affected the ductility of the studs. For Series I samples with inclination angles of 80°, 75°, 70°, and 65°, the slip capacity was 90.6%, 83.7%, 80.6%, and 78.3% of those of the 90° samples, respectively. For Series II samples with inclination angles of 80°, 75°, 70°, and 65°, the slip capacities were 94.8%, 89.3%, 66.4%, and 58.1% of that of the 90° samples, respectively. When the corresponding tensile shear ratio changed from 0.27 to 0.36, the slip capacity significantly decreased. Therefore, it was recommended to design Studs samples with a pull-to-shear ratio less than 0.27.
It was found that the angle of inclination had a pronounced influence on the elongation of studs embedded in UHPC. The reduction in the angle of inclination from the horizontal was not significant. However, a noticeable decline in the slip capacity of the studs was noted at higher tension-shear ratios.

4. Design Recommendations

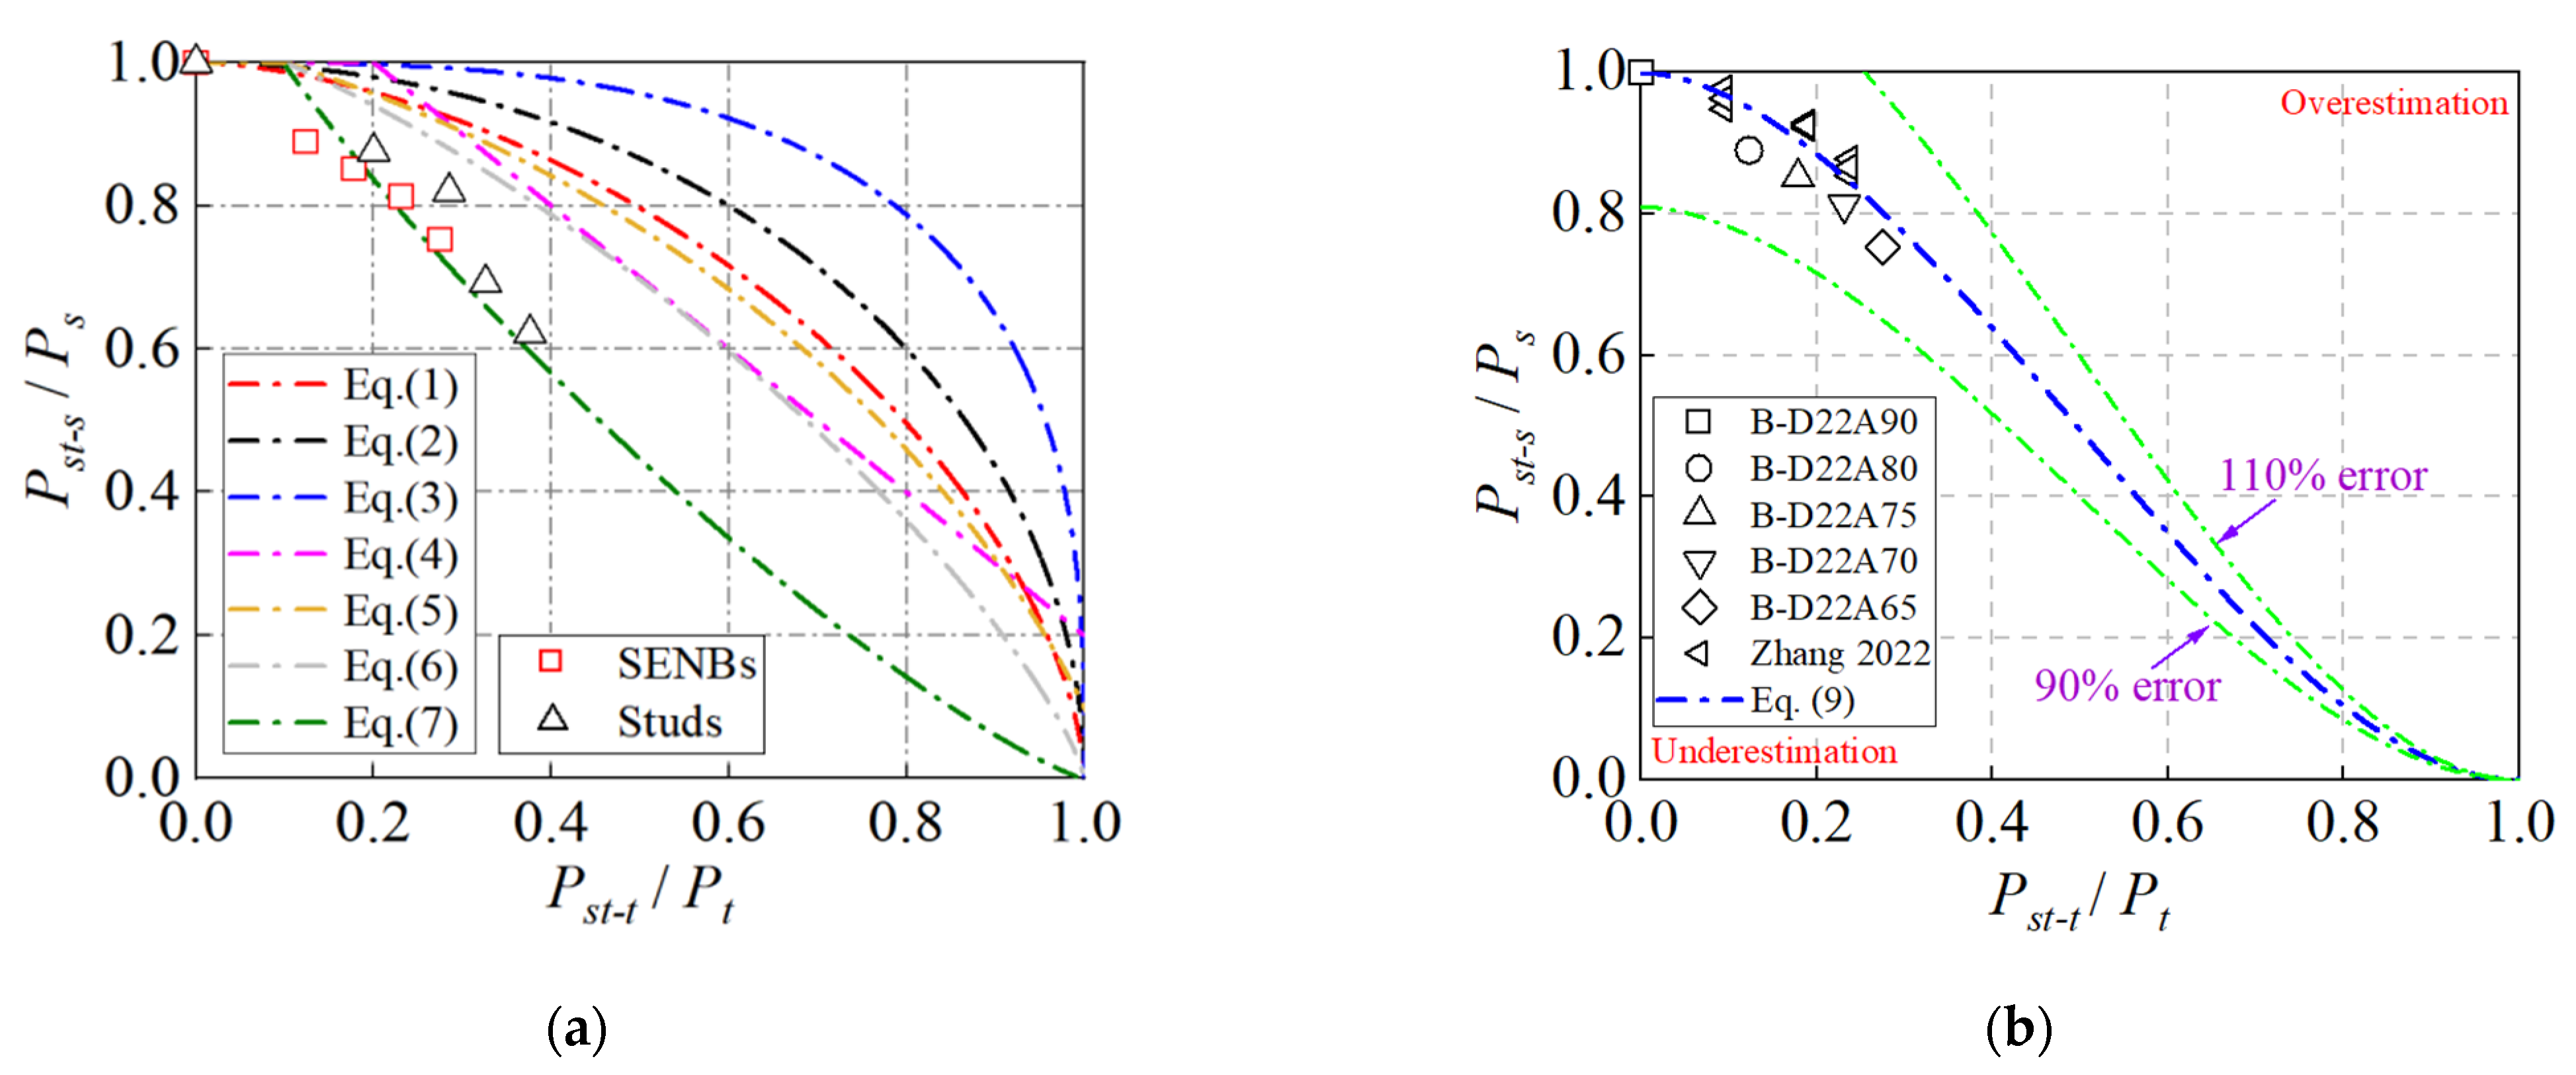
4.1. Ultimate Shear Capacity

The correlation between the tension ratio ( P s t t / P t ) and the shear ratio ( P s t s / P s ) was an essential factor in estimating the shear behavior of shear connectors under mixed tension and shear loads. P s t t and P s t s were the tensile component and shear component of the shear bond subjected to the combined tensile-shear load, respectively; P s t was the ultimate load carrying capacity of the push-out sample under the combined tensile-shear load; P s was the ultimate shear resistance of the push-out sample under a pure shear load; and P t was the ultimate tensile resistance of the push-out sample under a pure tensile load. In this study, the calculation method in PCI 5th was used, i.e. P t , the value was equal to 0.9 n A s c f u ; n was the number of bolts in the sample; A s c was the cross-sectional area of the shear connector embedded in the UHPC; and f u was the ultimate tensile strength of the shear connector.
In this study, the shear and tension forced on the studs in the MP samples were a priori determined by the tensile-shear ratio. Nevertheless, in the context of modeling the shear-tension in situ interactions of the studs, it was deemed advisable to establish the tension ratio and the shear force ratio based on the limit conditions of the shear connectors under tension, shear, and combined shear-tension loads. The tensile-to-shear ratio for each MP sample was converted to tensile and shear ratios, as summarized in Table 5.
To address the combination of shear and tension in studs, several design codes and prior studies have proposed various schemes, as outlined in Table 6. Equations (1) and (2) implied that interactions between shear and tension ought to be taken into account when studs were subjected to both tension and shear loads, irrespective of the magnitude of the shear or tensile forces. In addition, for high-strength bolts, Zhang et al. [59] proposed an equation (Equation (3)) that was more consistent with the combination of tension and shear in studs. However, the shear-tension combination could be neglected if the shear or tension load of studs under combined loading was under 20% of their ultimate tensile or shear strength, and therefore Bode et al. [43] proposed Equation (4). However, in an analytical experiment by Lin et al. [35], when a tensile load equal to 20% of the tensile strength of the joint was applied, a reduction in the shear capacity of the studs was still identified. Therefore, if the applicable shear or tension was under 10% of the ultimate strength under only shear or tension, it was possible to ignore the effect of interactions between variables, and Equation (5) was proposed to facilitate the design operation. Only when the stress ratio became lower than 0.1 could the effect of the stress on the shear capacity of the connectors be disregarded, and thus the bilinear interaction Equation (6) occurred. Ding et al. [60] found that the effectiveness of tension on shear capacity could be disregarded when the tension ratio was below 0.1. When the tensile ratio exceeded 0.1, the stud shear connector in the UHPC exhibited a different tensile-shear interaction relationship than the connector embedded in the NC, and therefore Equation (7) was proposed.
As shown in Figure 11a, none of the above design-oriented models could accurately predict the tensile-shear relationships of the two series of push-out samples with squared correlation coefficients, ranging from 0.75 to 0.95. Of these, Equation (7) had a squared correlation coefficient of 0.95, which was a better predictor of the experimental performance of the Series I and Series II samples. The squared correlation coefficient for other models ranged from 0.75–0.71. The existing models were inherently flawed due to their reliance on test results obtained from bolts subjected to mixed tensile and shear loads in a non-conforming environment (NC). In addition, Zhang et al. [59] conducted a study on the shear behavior of high-strength friction-type gripper bolts (HSFGB) under both tensile and shear loading, which also investigated the shear behavior of high-strength bolts and was similar to the tests on the Series I samples in this investigation. However, Equation (3) presented by Zhang et al. [59] was based on high-strength bolts embedded in NC, which differed from this study. Therefore, it was necessary to develop a more appropriate model for predicting the tension-shear relationship of SENBs in prefabricated steel-UHPC composite beams.
Therefore, an equation for accurate prediction of the coupling strength by a simplified design procedure has been proposed based on Equation (3). This equation (Equation (8)) quoted the exponential expression of Equation (3), where α and β were the undetermined coefficients. P s t t and P s t s were the tensile component and shear component of the shear bond subjected to the combined tensile-shear load, respectively; P s t was the ultimate load carrying capacity of the push-out sample under the combined tensile-shear load; P s was the ultimate shear resistance of the push-out sample under a pure shear load; and P t was the ultimate tensile resistance of the push-out sample under a pure tensile load. In this study, the calculation method in PCI 5th was used, i.e., P t , the value was equal to 0.9 n A s c f u ; n was the number of bolts in the sample, A s c was the cross-sectional area of the shear connector embedded in the UHPC, and f u was the ultimate tensile strength of the shear connector. The undetermined coefficients in the improvement equation were re-determined by fitting the regression analysis technique, and the final formula was obtained as shown in Equation (9).
P s t t P t α + P s t s P s β = 1
P s t t P t 1.75 + P s t s P s 0.50 = 1
The results of the prediction, as shown in Figure 11b, were generally acceptable. The errors of the points were in the range of 90–110%. The range of point error is 0 to 0.08, with an average error of 0.03. Even so, the applicability of this model had to be further evaluated. The relevant data from Zhang et al. [59] on the shear behavior of HSFGB under mixed tension-shear loading was employed to validate the proposed model. It could be seen from Figure 11b that the predicted results demonstrated an accurate representation of the observed data, with an error range of 90% to 110%. Therefore, the model presented in this study was applicable to the tension-shear relationship of SENBs under combined tension-shear loading.
Furthermore, Ding et al. [60] examined the shear characteristics of studs subjected to combined tension-shear loading, similar to the Series II samples in this study. The squared correlation coefficient between the test results of Series II samples and Equation (7) proposed by Ding et al. [60] was about 0.95, indicating that the test results of Series II samples were well fitted to Equation (7). Therefore, the tensile-shear relationship of studs in prefabricated steel-UHPC composite beams under mixed tensile and shear loading could be demonstrated by using Equation (7) proposed by Ding et al. [60].

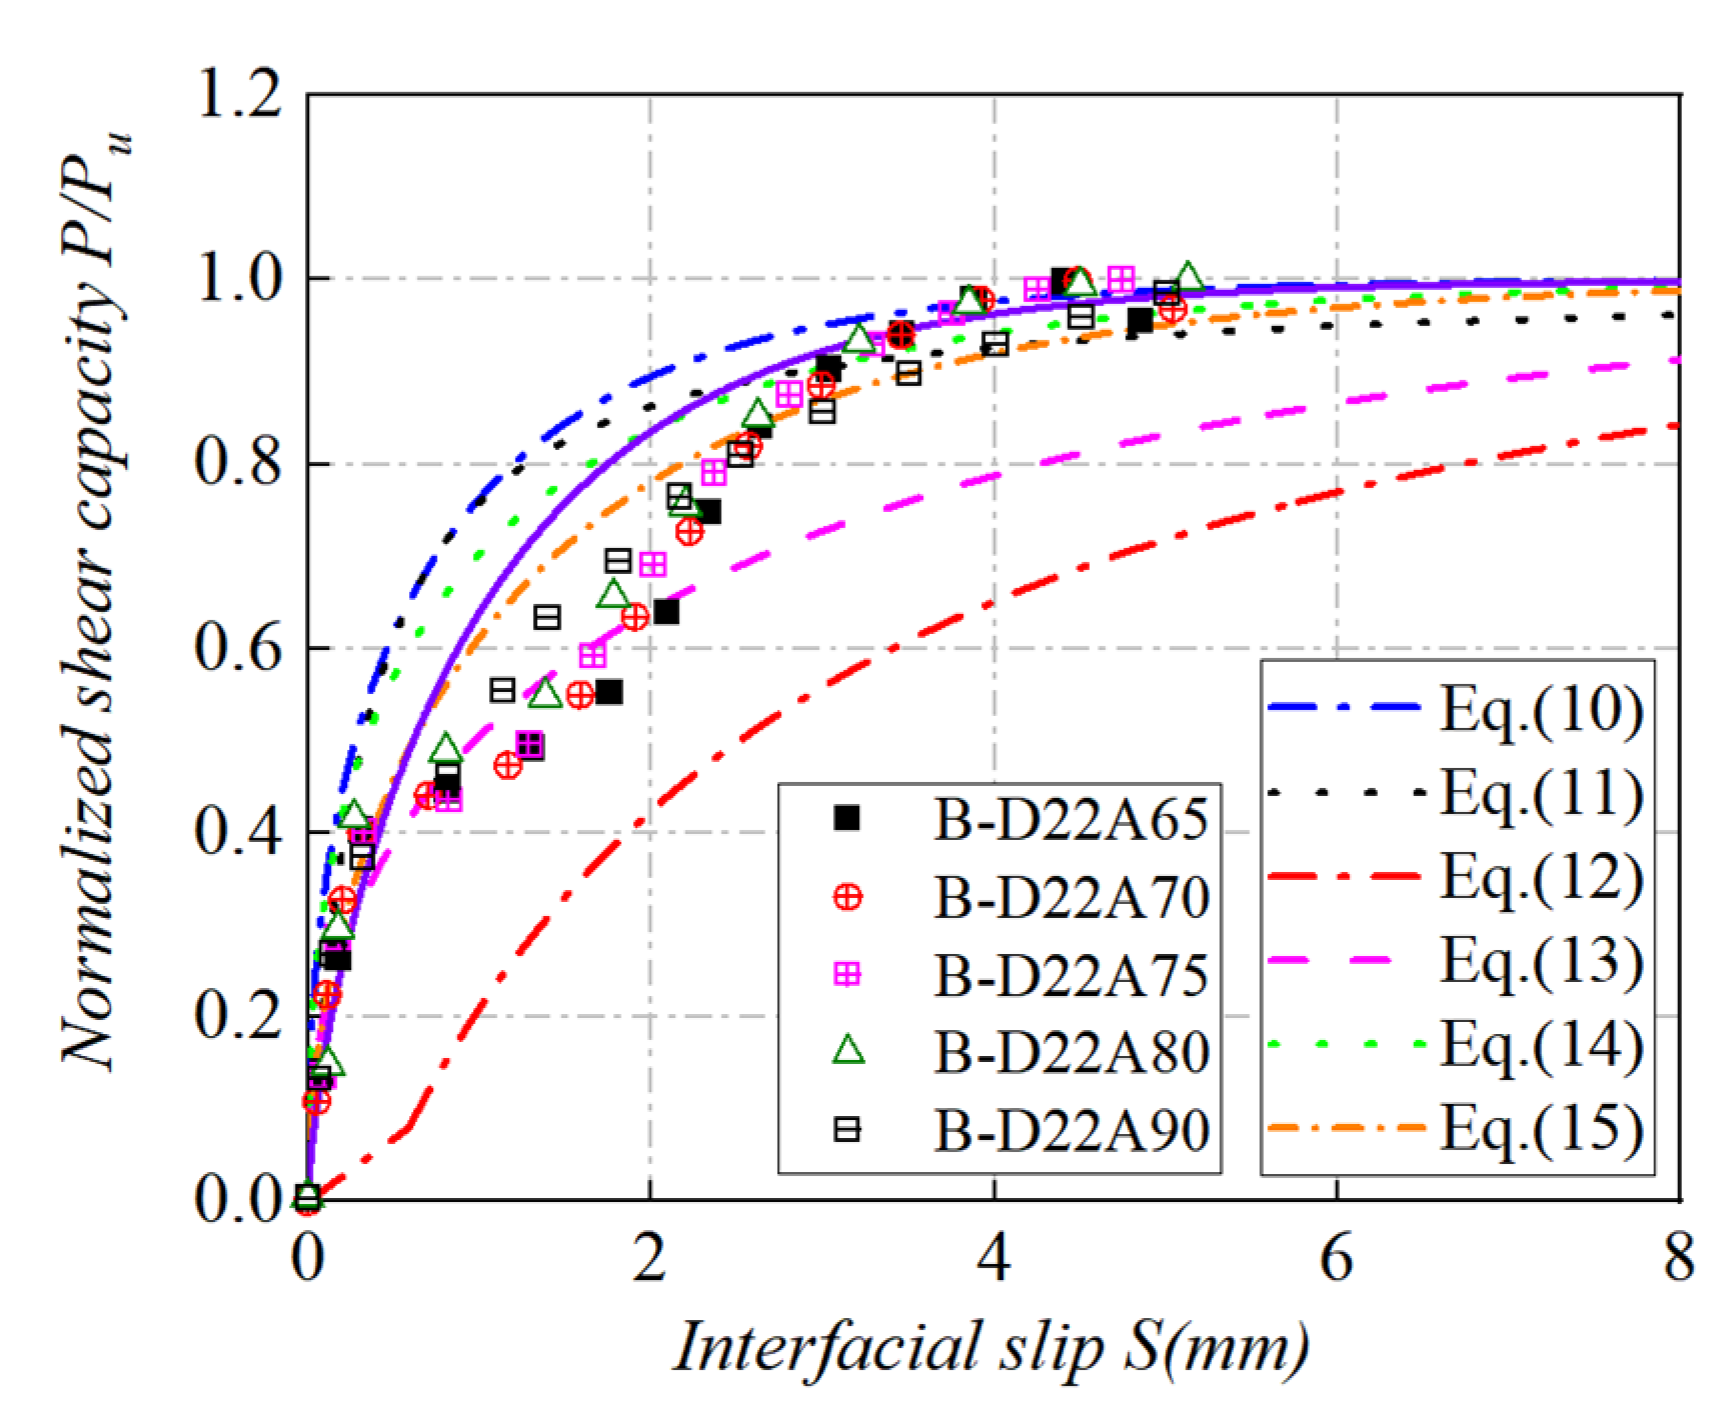
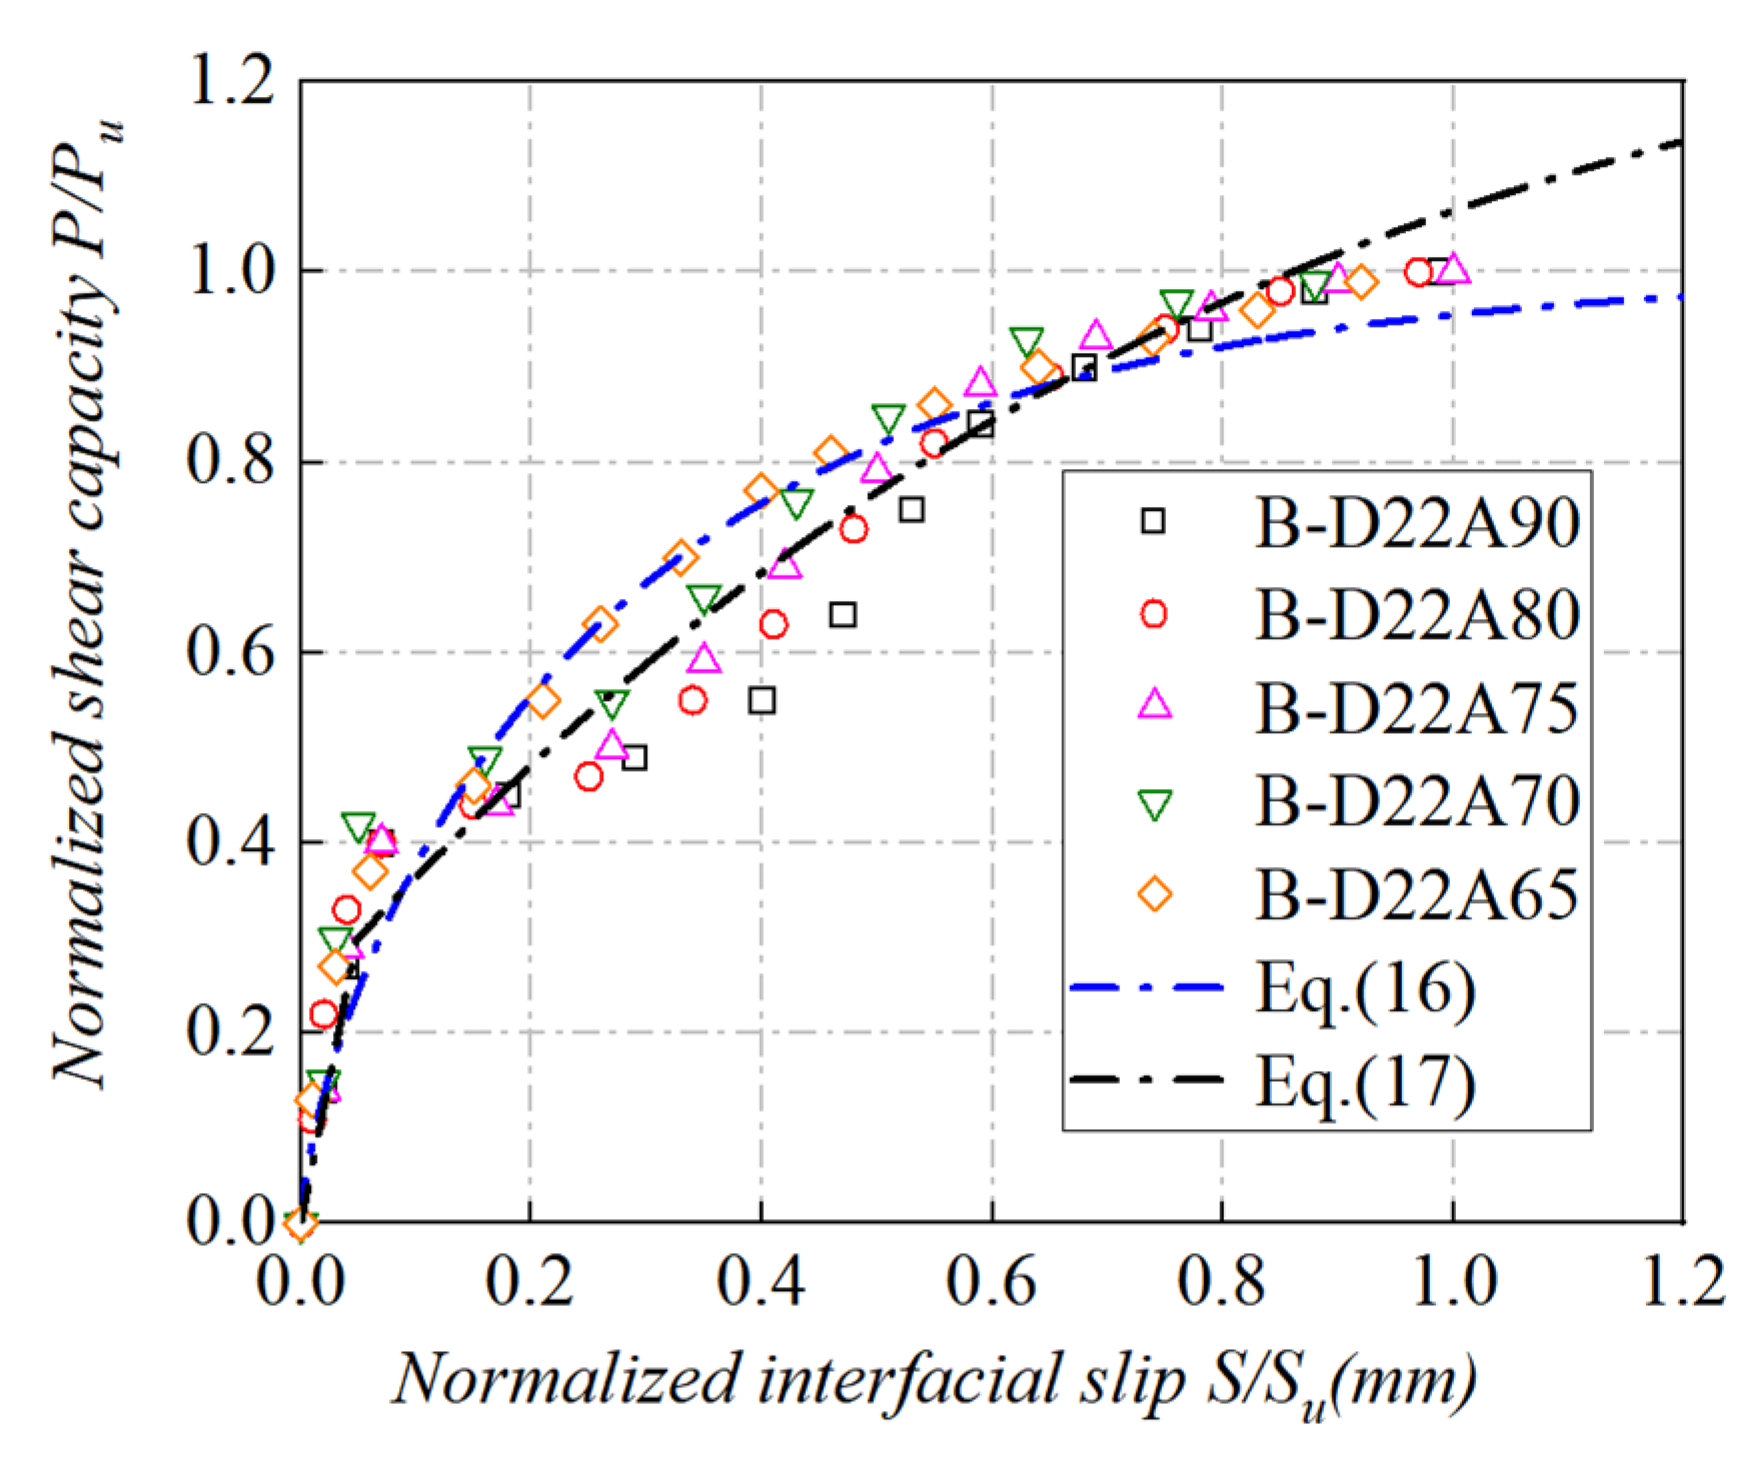
4.2. Load-Slip Relation

The correlation between load (P) and slip (S) was another critical indicator for evaluating the shear behavior of connectors in composite beams [64]. And the ultimate shear capacity P u was determined as the quotient of the peak load and the number of joints. Due to the different types of studs, the correlation between load and slip would be investigated separately for SENBs and studs in the following sections.

4.2.1. Load-Slip Relation for SENBs

To investigate the relationship between loading and slip for SENBs, several design codes and previous studies were proposed, as summarized in Table 7. The exponential design-oriented model (Equation (10)) presented by Ollgaard et al. [65] and the proportional correspondence model (Equation (11)) presented by Buttry et al. [66] had been widely used in previous studies. Using appropriate coefficients, these two classical models were also suitable for reflecting the load-slip relationships of bolted shear connectors. On the basis of data fitting, Yang et al. [64] developed a fractional construction-oriented model (Equation (12)) to simulate the load-slip curves of multiple HSFGBs in precast steel-NC composite beams. The load-slip curve of HSFGBs in precast steel-steel fiber reinforced concrete (SFRC) composite beams could be calculated by Equation (13) [14]. In addition, the modified exponential design-oriented model could be used to simulate the load-slip relation of Grade 8.8/10.9 HSFGBs (Equation (14)) or Grade 12.9 HSFGBs (Equation (15)) in prefabricated steel-UHPC composite beams [67].
The applicability of these models for the load-slip relationship of SENBs under combined tension-shear loading in this study still needed to be evaluated, as shown in Figure 12. The above design-oriented models could not accurately predict the load-slip curves of SENBs, and the average squared correlation coefficients of the Series I samples ranged from 0.93 to 0.98. This should be related to the fact that previous studies mainly concentrated on the shear behavior of SENBs under pure shear loading rather than under combined tensile-shear loading. Consequently, it was imperative to devise a more precise model to anticipate the load-slip relationship of SENBs in prefabricated steel-UHPC composite beams subjected to composite tension-shear loading.
It had been shown that almost identical predictions were obtained using expressions in exponential and fractional forms. Based on the comparison, the widely used exponential expressions were introduced. Fang et al. [18] used normalized load Pnorm (Pnorm =   P / P u ), normalized slip Snorm (Snorm= S / S u ), and regression analysis techniques to predict the load-slip relation of SENBs in prefabricated steel-UHPC composite beams (Equation (16)).
P / P u = 1 e 2.73 S / S u 0.68
As shown in Figure 13a, the normalized model exhibited a better fit in general, with the squared correlation coefficients ranging from 0.81 to 0.89. However, P / P u and S / S u exhibited a linear correlation before the SENBs overcame the preloading, as shown in Figure 12. Furthermore, the predictions based on Equations (10)–(14) still failed to adequately forecast the relationships between load and slip. Therefore, it was necessary to propose a more accurate and applicable predicted load-slip model for SENBs in prefabricated steel-UHPC composite beams, as presented by Equation (17).
P / P u = D 0.60 S / S u ,   S P s P t D = 0.048 P / P u = 1.30 e 1.40 S / S u 1.20 , S > P s P t D = 0.048
where D was the diameter of the bolt; P s was the ultimate shear capacity of the push-out sample under pure shear loading; and P t was the magnitude of the preload force applied on the individual bolts. The forecast output was shown in Figure 13, and the correlation coefficient was 0.99, which was better in terms of applicability and accuracy. In conclusion, the load-slip model proposed in this study was suitable to predict the load-slip relationship of SENBs in prefabricated steel-UHPC composite beams under combined tension-shear loading.

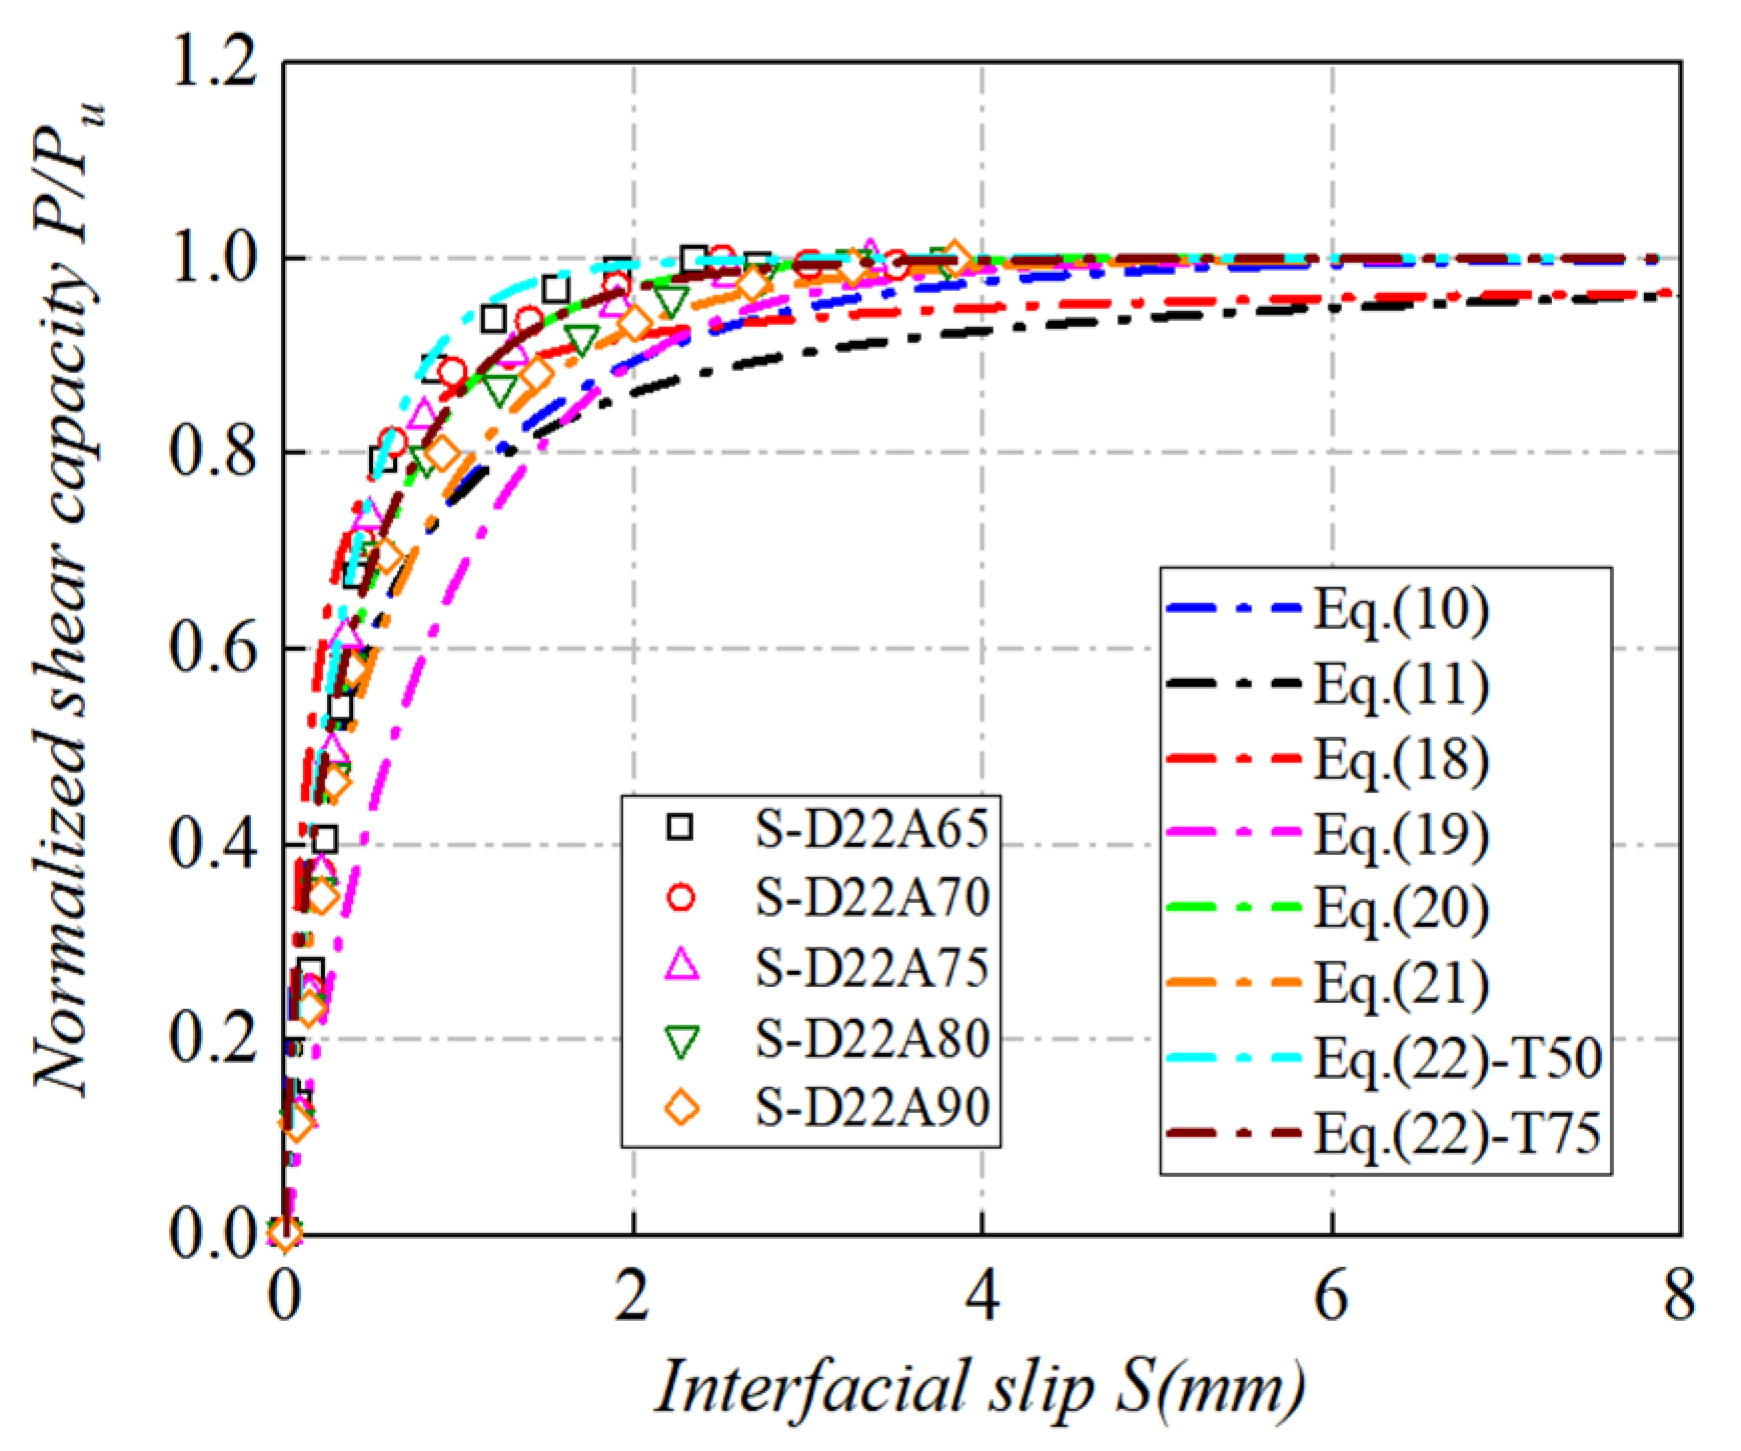
4.2.2. Load-Slip Relation for Studs

Load-slip relations for studs subjected to combined tension-shear loads in prefabricated steel-UHPC composite beams were important for analyzing their shear properties. The analytical results of this study were valid against seven representative load-slip models summarized in Table 8. Two of these models had been presented for studs in normal concrete [65,66] and others for studs in UHPC [66,67,68,69,70]. The exponential design-oriented model suggested by Ollgaard et al. [65] (Equation (10)) and the fractional counterpart suggested by Buttry et al. [66] (Equation (11)) were used. The latter five models were subjected to empirical analysis, with the results presented in Equations (18) and (19) by Wang et al. [7,67]. The remaining three models were derived empirically by Tong et al. [68] (Equation (20)), Ding et al. [69] (Equation (21)), and Fang et al. [70] (Equation (22)) for studs in precast steel-UHPC composite beams. It was important to note that the model suggested by Fang et al. [70] was specifically designed to investigate the influence of slab thickness and bolt diameter, which could be readily applied to situations involving grouped studs embedded in full-depth precast thin UHPC slabs.
In Figure 14, the capability of the above-mentioned formulas for the prediction of the load-slip curves in this study has been evaluated. Overall, some of the formulas were not accurate in predicting the push-out test outcomes in this research. Equations (10), (11), and (21) exhibited large deviations at the stage between P / P u = 0.6 and reaching the peak load because all three classical models of Equations (10), (11), and (21) reflected the load-slip relation of bolted connector shear connectors rather than studs. The empirical Equation (18) proposed by Wang et al. [67] for a single large bolted UHPC shear connector exhibited a large deviation at the stage between P / P u ≈0.9 and reaching the peak load. Their proposed empirical Equation (19) for grouped large stud-UHPC connections showed large deviations until the peak load was reached, which might be due to the different sizes selected for the stud shear connectors. In addition, the model proposed by Fang et al. [70] focused on the effect of slab thickness and bolted diameter. Equation (22) showed a small deviation but a larger prediction before reaching the peak load.
However, Equations (20) and (22) presented a trend that was ultimately similar to the test results. Tong et al. [68] examined the static characteristics of grouped shear connectors in prefabricated steel-UHPC composite beams with full depth thin slabs, similar to the Series II samples in the present study. It was worth mentioning that the study presented by Fang et al. [70] focused on the influence of slab thickness and stud diameter, and one of the UHPC slab thicknesses in this study was 75 mm, which was in line with the applicability conditions of the model suggested by Fang et al. (Equation (22)-T75) [70]. The objective of this study was to examine the shear properties of studs in prefabricated steel-UHPC composite beams subjected to composite tensile and shear loading. Tong et al. and Fang et al.’s research [68,70] was conducted under pure shear loading in studs. However, the mean squared correlation coefficient of the experimental test results of Series II samples with Equation (20) suggested by Tong et al. [68] and Equation (22)-T75 proposed by Fang et al. [70] was calculated to be as high as 0.99, which indicated that the experimental test results of Series II samples fitted well with Equation (20) and Equation (22)-T75. Therefore, the load-slip relation of studs in prefabricated steel-UHPC composite beams under composite tensile and shear loading could be demonstrated to be applicable by using Equation (22) suggested by Tong et al. [68] and Equation (22)-T75 proposed by Fang et al. [70].

5. Conclusions

This paper presented a study on the shear behavior of single embedded nut bolts and studs in prefabricated steel-UHPC composite beams under combined tensile and shear loading, with a total of 10 push-out tests. The effectiveness of shear connector type and inclination angle on the failure mode, load-slip relation, load-uplift relation, ultimate shear capacity, initial shear stiffness, and ductility were investigated. The inference that can be drawn from the evidence presented is as follows:
(1)
For the Series I samples, shear fracture occurred in single embedded nut bolts in precast UHPC slabs, and single embedded nut bolts with different tensile-to-shear ratios exhibited a four-stage load-slip behavior. As the tension-shear ratio increased, the shear force carried by the bolt holes decreased, the deformation on the bolt holes decreased, and the thread penetration on the steel beam was weakened.
(2)
For the Series II samples, there were no substantial variations in the damage patterns of the shear connectors with different tension-shear ratios. The damage on the precast slabs was dominated by compression collapse, with significant concrete crushing and localized spalling ahead of the bolt roots on the inner surface of the precast panels. As the tension-to-shear ratio and the tension force on the bolts increased, the crack development on the surface of the UHPC slab became more pronounced.
(3)
In the two series of compression test samples with the same tensile-to-shear ratio, there was a deviation of approximately 13%, 12%, 10%, 2%, and 5% between their ultimate shear capacities. The series I samples exhibited reduced shear rigidity compared to the series II samples. Furthermore, the series I samples exhibited greater slip values than the series II samples. A comparison of the shear rigidity of the two series of samples revealed that the original rigidity of Series I was less than that of Series II. Furthermore, the degree of slip exhibited by the former was observed to be greater than that observed in the latter series.
(4)
A significant negative correlation was observed between the tensile-shear ratio and the ultimate shear capacity, shear stiffness, and ductility of the samples. An increase in the tensile-shear ratio from 0 to 0.47 resulted in a 16.9% decline in the ultimate shear capacity, a 30.4% reduction in the initial shear stiffness, and a 21.7% decrease in the ductility of the Series I samples. However, an increase in the tensile-to-shear ratio of the Series II samples from 0 to 0.47 resulted in a 31.3% decline in ultimate shear strength, a 33.2% decline in initial shear stiffness, and a 41.9% decline in ductility.
(5)
The prevailing design-oriented models were unable to provide an accurately predictive framework for the test results of a single embedded nut bolt under tensile-shear loads. Based on the existing experimental data, more accurate models were derived to forecast the tension-shear relationships and load-slip characteristics of single embedded nut bolts in prefabricated steel-UHPC composite beams, with quadratic correlation coefficients R2, both of which are 0.99. In addition, the tension-shear relationships and load-slip curves of single embedded nut bolts in prefabricated steel-UHPC composite beams could be predicted by using the existing model for studs in prefabricated steel-UHPC composite beams.
(6)
In practical engineering, connectors with a small tensile-to-shear ratio were introduced, which could increase the shear strength, stiffness, and ductility. For crack patterns, insignificant concrete crushing and spalling were caused by SENBs, which could effectively exploit the material porosities of precast steel-UHPC composite beams. As a comparable connector, SENBs were recommended in practical engineering. Due to the deviation of the experiment, the results of this study should be verified further by more research. In the future, more and more specimens and test parameters should be introduced to investigate the shear performance of precast steel-UHPC composite beams under combined tension-shear loads.

Author Contributions

Conceptualization, S.F.; methodology, S.F.; software, G.W.; validation, G.W., B.X. and S.F.; formal analysis, G.W. and B.X.; investigation, G.W., B.X., F.M. and S.F.; resources, S.F.; data curation, G.W., B.X., and F.M.; writing—original draft preparation, G.W.; writing—review and editing, S.F.; visualization, G.W.; supervision, S.F.; project administration, S.F.; funding acquisition, S.F. All authors have read and agreed to the published version of the manuscript.

Funding

This research was funded by the National Natural Science Foundation of China with the grant number of 52208156, 52078150, and 51878196 and the Applied Basic Research Foundation of Guangdong Province with the grant number 2022A1515110394.

Data Availability Statement

The original contributions presented in the study are included in the article, further inquiries can be directed to the corresponding authors.

Conflicts of Interest

The authors declare no conflicts of interest.

Nomenclature

UHPCultra-high-performance concreteSENBssingle embedded nut bolts
NCnormal concreteABCaccelerated beam construction
HSFGBhigh-strength friction-grip boltsfccompressive strength
ftsplit tensile strengthEcmodulus of elasticity
vPoisson’s ratioEsmodulus of elasticity
fyyield strengthfucorresponding tensile strength
P u ultimate shear capacitykInitial shear stiffness
SuSilp capacityUuUplift at Pu
P s t t tensile component of the shear bond subjected to the combined tensile-shear load P s t s shear component of the shear bond subjected to the combined tensile-shear load
P s t ultimate load carrying capacity of the push-out sample under the combined tensile-shear load P s the ultimate shear resistance of the push-out sample under a pure shear load
P t ultimate tensile resistance of the push-out sample under a pure tensile load n number of bolts in the sample
A s c cross-sectional area of the shear connector embedded in the UHPCαundetermined coefficients
βundetermined coefficientsPload
SslipPnormnormalized load
Snormnormalized slip D diameter of the bolt

References

  1. Cao, X.Y.; Shi, J.Z.; Xu, J.G.; Ji, E.Y.; She, Y.B.; Wang, Z. The combined influence of bond–slip and joint-shear in the seismic upgrading via externally-attached BFRP-bar reinforced precast sub-frames. J. Build. Eng. 2023, 80, 107984. [Google Scholar] [CrossRef]
  2. He, S.H.; Huang, X.; Zou, L.Q.; Zheng, C.; Xin, H.H.; Liang, J.S. Performance assessment of channel beam bridges with hollow track bed decks. Structures 2024, 61, 105988. [Google Scholar] [CrossRef]
  3. He, S.H.; Lv, B.T.; Huang, X.; Zou, L.Q.; Zhou, D.F. Cracking performance in the hogging moment region of HSS-UHPC continuous composite girder bridges. Structures 2024, 61, 106081. [Google Scholar] [CrossRef]
  4. Yang, Z.M.; Pan, H.S.; Jiang, Z.X.; Lv, J.H.; Ruan, G.W.; Lai, H.M.; Lin, J.X. Pseudo strain-hardening alkali-activated composites with up to 100% rubber aggregate: Static mechanical properties analysis and constitutive model development. Constr. Build. Mater. 2024, 439, 137338. [Google Scholar] [CrossRef]
  5. Xiao, J.; Zeng, H.; Huang, H.; Liu, L.; Li, L.; Yuan, B.; Zhong, Z. Experimental Investigation on the Influence of Strength Grade on the Surface Fractal Dimension of Concrete under Sulfuric Acid Attack. Buildings 2024, 14, 713. [Google Scholar] [CrossRef]
  6. Cao, X.Y.; Feng, D.C.; Wang, C.L.; Shen, D.J.; Wu, G. A stochastic CSM-based displacement-oriented design strategy for the novel precast SRC-UHPC composite braced-frame in the externally attached seismic retrofitting. Compos. Struct. 2023, 321, 117308. [Google Scholar] [CrossRef]
  7. Wang, J.Q.; Xu, Q.Z.; Yao, Y.M.; Qi, J.N.; Xiu, H.L. Static behavior of grouped large headed stud-UHPC shear connectors in composite structures. Compos. Struct. 2018, 206, 202–214. [Google Scholar] [CrossRef]
  8. Zou, Y.; Zheng, K.D.; Zhou, Z.X.; Zhang, Z.Y.; Guo, J.C.; Jiang, J.L. Experimental study on flexural behavior of hollow steel-UHPC composite bridge deck. Eng. Struct. 2023, 274, 115087. [Google Scholar] [CrossRef]
  9. Cao, J.H.; Shao, X.D.; Deng, L.; Gan, Y.D. Static and fatigue behavior of short-headed studs embedded in a thin ultrahigh-performance concrete layer. J. Bridg. Eng. 2017, 22, 4017005. [Google Scholar] [CrossRef]
  10. Fang, S.; Zhang, S.F.; Cao, Z.P.; Zhao, G.F.; Fang, Z.C.; Ma, Y.H.; Jiang, H.B. Effects of stud aspect ratio and cover thickness on push-out performance of thin full-depth precast UHPC slabs with grouped short studs: Experimental evaluation and design considerations. J. Build. Eng. 2023, 67, 105910. [Google Scholar] [CrossRef]
  11. He, S.H.; Yang, G.; Jiang, Z.; Wang, Q.; Dong, Y. Effective width evaluation for HSS-UHPC composite beams with perfobond strip connectors. Eng. Struct. 2023, 295, 116828. [Google Scholar] [CrossRef]
  12. Lin, J.X.; Luo, R.H.; Su, J.Y.; Guo, Y.C.; Chen, W.S. Coarse synthetic fibers (PP and POM) as a replacement to steel fibers in UHPC: Tensile behavior, environmental and economic assessment. Constr. Build. Mater. 2024, 412, 134654. [Google Scholar] [CrossRef]
  13. Xiong, Z.; Wei, W.; He, S.H.; Liu, F.; Luo, H.W.; Li, L.J. Dynamic bond behaviour of fibre-wrapped basalt fibrereinforced polymer bars embedded in sea sand and recycled aggregate concrete under high-strain rate pull-out tests. Constr. Build. Mater. 2021, 276, 122195. [Google Scholar] [CrossRef]
  14. Zhang, Y.J.; Liu, A.R.; Chen, B.C.; Zhang, J.P.; Pi, Y.L.; Bradford, M.A. Experimental and numerical study of shear connection in composite beams of steel and steel-fibre reinforced concrete. Eng. Struct. 2020, 215, 110707. [Google Scholar] [CrossRef]
  15. Jiang, H.B.; Fang, H.Z.; Wu, J.P.; Fang, Z.C.; Fang, S.; Chen, G.F. Push-out tests on demountable high-strength friction-grip bolt shear connectors in steel-precast UHPC composite beams for accelerated bridge construction. Steel Compos. Struct. 2022, 45, 797–818. [Google Scholar]
  16. Fang, Z.C.; Hu, L.K.; Jiang, H.B.; Fang, S.; Zhao, G.F.; Jiang, H.B. Shear performance of high-strength friction-grip bolted shear connector in prefabricated steel–UHPC composite beams: Finite element modelling and parametric study. Case Stud. Constr. Mater. 2023, 18, e01860. [Google Scholar] [CrossRef]
  17. Dieng, L.; Marchand, P.; Gomes, F.; Tessier, C.; Toutlemonde, F. Use of UHPFRC overlay to reduce stresses in orthotropic steel decks. J. Constr. Steel Res. 2013, 89, 30–34. [Google Scholar] [CrossRef]
  18. Fang, Z.C.; Jiang, H.B.; Chen, G.F.; Dong, X.T.; Shao, T.F. Behavior of grouped stud shearconnectors between precast high-strength concrete slabs and steel beams. Steel Compos. Struct. 2020, 34, 837–854. [Google Scholar]
  19. Pavlovic, M.; Markovic, Z.; Veljkovic, M.; Bucfevac, D. Bolted shear connectors vs. headed studs behaviour in push-out tests. J. Constr. Steel Res. 2013, 88, 134–149. [Google Scholar] [CrossRef]
  20. Fang, Z.C.; Zhang, S.F.; Wu, J.P.; Ma, Y.H.; Fang, S.; Zhao, G.F.; Jiang, H.B. Experimental and numerical study on shear performance of grouped bolt-UHPC pocket connections under static loading. J. Build. Eng. 2023, 76, 106966. [Google Scholar] [CrossRef]
  21. Fang, Z.C.; Liang, W.B.; Fang, H.Z.; Jiang, H.B.; Wang, S.D. Experimental investigation on shear behavior of high-strength friction-grip bolt shear connectors in steel-precast UHPC composite structures subjected to static loading. Eng. Struct. 2021, 244, 112777. [Google Scholar]
  22. Fang, Z.C.; Wu, J.J.; Xu, X.Q.; Ma, Y.H.; Fang, S.; Zhao, G.F.; Jiang, H.B. Grouped rubber-sleeved studs–UHPC pocket connections in prefabricated steel–UHPC composite beams: Shear performance under monotonic and cyclic loading. Eng. Struct. 2024, 305, 117781. [Google Scholar] [CrossRef]
  23. Fang, Z.C.; Fang, H.Z.; Li, P.J.; Jiang, H.B.; Chen, G.F. Interfacial shear and flexural performances of steel-precast UHPC composite beams: Full-depth slabs with studs vs. demountable slabs with bolts. Eng. Struct. 2022, 260, 114230. [Google Scholar] [CrossRef]
  24. Semendary, A.A.; Stefaniuk, H.L.; Yamout, D.; Svecova, D. Static performance of stud shear connectors and UHPC in deck-to-girder composite connection. Eng. Struct. 2022, 255, 103917. [Google Scholar] [CrossRef]
  25. Zhang, Y.J.; Chen, B.C.; Liu, A.R.; Pi, Y.L.; Zhang, J.P.; Wang, Y.; Zhong, L.C. Experimental study on shear behavior of high strength bolt connection in prefabricated steelconcrete composite beam. Compos. Part B-Eng. 2019, 159, 481–489. [Google Scholar] [CrossRef]
  26. Zhang, S.; Jia, Y.M.; Ding, Y.X. Study on the Flexural Behavior of Steel-Concrete Composite Beams Based on the Shear Performance of Headed Stud Connectors. Buildings 2022, 12, 961. [Google Scholar] [CrossRef]
  27. Wu, F.W.; Tang, W.L.; Xue, C.F.; Sun, G.R.; Fen, Y.P.; Zhang, H. Experimental Investigation on the Static Performance of Stud Connectors in Steel-HSFRC Composite Beams. Materials 2021, 14, 2744. [Google Scholar] [CrossRef] [PubMed]
  28. Chen, J.; Wang, W.; Ding, F.X.; Xiang, P.; Yu, Y.J.; Liu, X.M.; Xu, F.; Yang, C.Q.; Long, S.G. Behavior of an Advanced Bolted Shear Connector in Prefabricated Steel-Concrete Composite Beams. Materials 2019, 12, 2958. [Google Scholar] [CrossRef]
  29. Deng, P.; Niu, Z.W.; Shi, Y.H.; Liu, Y.; Wang, W.L. Shear Performance of Demountable High-Strength Bolted Connectors: An experimental and Numerical Study Based on Reverse Push-Out Tests. Buildings 2024, 14, 1052. [Google Scholar] [CrossRef]
  30. Peng, K.; Liu, L.J.; Wu, F.W.; Wang, R.Z.; Lei, S.; Zhang, X.Y. Experimental and Numerical Analyses of Stud Shear Connectors in Steel–SFRCC Composite Beams. Materials 2022, 15, 4665. [Google Scholar] [CrossRef]
  31. Guo, J.; Zhou, Z.; Zou, Y.; Zhang, Z.; Jiang, J. Finite Element Analysis of Precast Concrete Deck-Steel Beam-Connection Concrete (PCSC) Connectors Using Ultra-High Performance Concrete (UHPC) for the Composite Beam. Buildings 2022, 12, 1402. [Google Scholar] [CrossRef]
  32. Xue, C.F.; Fan, Z.; Wu, F.W.; Liu, L.J.; He, L.Q.; Cui, X. Research on the Shear Behaviour of Composite Shear Connectors. Buildings 2022, 12, 1726. [Google Scholar] [CrossRef]
  33. Zhang, Z.; Jin, W.H.; Deng, E.F.; Yu, C.Y.; Wan, W.D.; Duan, C.Z.; Zhang, L.; Wang, S.B. Shear Behavior and Design of Innovative Stud-Reinforced Embedded Shear Connectors with Flanges. Buildings 2024, 14, 632. [Google Scholar] [CrossRef]
  34. Fang, Z.C.; Wu, J.P.; Xian, B.X.; Zhao, G.F.; Fang, S.; Ma, Y.H.; Jiang, H.B. Shear performance and design recommendations of single embedded nut bolted shear connectors in prefabricated steel–UHPC composite beams. Steel Compos. Struct. 2024, 50, 319–336. [Google Scholar]
  35. Lin, Z.; Liu, Y.; He, J. Behavior of stud connectors under combined shear and tension loads. Eng. Struct. 2014, 81, 362–376. [Google Scholar] [CrossRef]
  36. Mirza, O.; Uy, B. Effects of the combination of axial and shear loading on the behaviour of headed stud steel anchors. Eng. Struct. 2010, 32, 93–105. [Google Scholar] [CrossRef]
  37. Shen, M. Structural Behaviour of Shear Connection in Composite Structures Under Complex Loading. Ph.D. Thesis, The Hong Kong Polytechnic University, Hong Kong, China, 2013. Conditions. [Google Scholar]
  38. Shen, M.H.; Chung, K.F. Structural Behaviour of Stud Shear Connections with Solid and Composite Slabs Under Co-Existing Shear and Tension Forces. Structures 2017, 9, 79–90. [Google Scholar] [CrossRef]
  39. Varsani, H.; Tan, E.L.; Singh, B. Behaviour of innovative demountable shear connectors subjected to combined shear and axial tension. Ce/papers 2017, 1, 1948–1955. [Google Scholar] [CrossRef]
  40. Classen, M.; Herbrand, M.; Adam, V.; Kueres, D.; Sarac, M. Puzzle-shaped rib shear connectors subjected to combined shear and tension. J. Constr. Steel Res. 2018, 145, 232–243. [Google Scholar] [CrossRef]
  41. Wang, J.Y.; Guo, J.Y.; Jia, L.J.; Chen, S.M.; Dong, Y. Push-out tests of demountable headed stud shear connectors in steel-UHPC composite structures. Compos. Struct. 2017, 170, 69–79. [Google Scholar] [CrossRef]
  42. McMackin, P.J.; Slutter, R.G.; Fisher, J.W. Headed steel anchors under combined loading. Eng J AISC (Second Quart.) 1973, 10, 43–55. [Google Scholar] [CrossRef]
  43. Bode, H.; Roik, K. Headed studs-embedded in concrete and loaded in tension. Spec. Publ. 1987, 103, 61–88. [Google Scholar]
  44. PCI design handbook. In Precast and Prestressed Concrete, 6th ed.; Precast/Prestressed Concrete Institute: Chicago, IL, USA, 2004.
  45. ACI 318–08; Building Code Requirements for Structure Concrete (ACI 318–08) and commentary (ACI 318R–08). American Concrete Institute: Farmington Hills, MI, USA, 2008.
  46. JSCE. Standard Speciffcations for Hybrid Structures; Japan Society of Civil Engineers: Tokyo, Japan, 2009. (In Japanese) [Google Scholar]
  47. Johnson, R.P.; May, I.M. Partial-interaction design of composite beam. Struct. Eng. 1975, 53, 305–311. [Google Scholar]
  48. Fang, Z.; Fang, S.; Liu, F. Experimental and Numerical Study on the Shear Performance of Short Stud Shear Connectors in Steel–UHPC Composite Beams. Buildings 2022, 12, 418. [Google Scholar] [CrossRef]
  49. Eurocode 4; Design of Composite Steel and Concrete Structure. Part 2: General Rules for Bridge. European Committee for Standardization: Brussels, Belgium, 2004.
  50. ASTM C1437-15; Standard Test Method for Flow of Hydraulic Cement Mortar. ASTM International: West Conshohocken, PA, USA, 2015.
  51. ASTM C29/C29M-16; Standard Test Method for Bulk Density and Voids in Aggregate. ASTM International: West Conshohocken, PA, USA, 2016.
  52. ASTM C1231/C1231M-15; Standard Practice for Use of Unbond Caps in Determination of Compressive Strength of Hardened Cylindrical Concrete Specimens. ASTM International: West Conshohocken, PA, USA, 2015.
  53. ASTM C469/C469M-14; Standard Test Method for Static Modulus of Elasticity and Poisson’s Ratio of Concrete in Compression. ASTM International: West Conshohocken, PA, USA, 2014.
  54. ASTM C496/C496M-11; Standard Test Method for Splitting Tensile Strength of Cylindrical Concrete Specimens. ASTM International: West Conshohocken, PA, USA, 2011.
  55. Ataei, A.; Zeynalian, M.; Yazdi, Y. Cyclic behaviour of bolted shear connectors in steel-concrete composite beams. Eng. Struct. 2019, 198, 109455. [Google Scholar] [CrossRef]
  56. Yang, F.; Liu, Y.Q.; Jiang, Z.B.; Xin, H.H. Shear performance of a novel demountable steel-concrete bolted connector under static push-out tests. Eng. Struct. 2018, 160, 133–146. [Google Scholar] [CrossRef]
  57. Luo, Y.B.; Hoki, K.; Hayashi, K.; Nakashima, M. Behaviour and strength of headed stud–SFRCC shear connection. I: Experimental study. J. Struct. Eng. 2016, 142, 4015112. [Google Scholar]
  58. Li, W.C.; Liao, F.F.; Zhou, T.H.; Askes, H. Ductile fracture of Q460 steel: Effects of stress triaxiality and lode angle. J. Const. Steel Res. 2016, 123, 1–17. [Google Scholar] [CrossRef]
  59. Zhang, Y.J.; Zhang, J.P.; Liu, A.R.; Chen, B.C.; Safaei, B.; Yang, Z.C. Study on thebehavior of high-strength friction-grip bolts under combined shear and tensile forces. Structures 2022, 45, 854–866. [Google Scholar] [CrossRef]
  60. Ding, I.N.; Zhu, J.S.; Shi, T. Performance of grouped stud connectors in precast steel-UHPC composite bridges under combined shear and tension loads. Eng. Struct. 2023, 277, 115470. [Google Scholar] [CrossRef]
  61. Mcmackin, P.J.; Slutter, R.G.; Fisher, J.W. Headed steel anchor under combinedloading. Eng. J. 1973, 10, 43–52. [Google Scholar] [CrossRef]
  62. Takami, K.; Nishi, K.; Hamada, S. Shear strength of headed stud shear connector subjected to tensile load. J. Constr. Steel 2000, 7, 233–240. [Google Scholar]
  63. An, R.; Wang, Y.Z.; Zhou, L.; Xu, X.J. Experiment and analytical model of shear stud connectors uder combined tension and shear force. J. Chang. Univ. (Nat. Sci. Ed.) 2020, 40, 42–52. [Google Scholar]
  64. Yang, T.; Liu, S.Y.; Qin, B.X.; Liu, Y.Q. Experimental study on multi-bolt shear connectors of prefabricated steel-concrete composite beams. J. Constr. Steel Res. 2020, 173, 106260. [Google Scholar] [CrossRef]
  65. Ollgaard, J.; Slutter, R.; Fisher, J. Shear strength of stub connectors in lightweightand normal-weight concrete. AISC Eng. J. 1971, 8, 55–66. [Google Scholar] [CrossRef]
  66. Buttry, K. Behavior of Stud Shear Connectors in Lightweight and Normal-Weight Concrete; Report No. 68-6; Missouri Cooperative Highway Research Program, Missouri State Highway Department and University of Missouri: Columbia, MO, USA, 1965. [Google Scholar]
  67. Wang, J.Q.; Qi, J.N.; Tong, T.; Xu, Q.Z.; Xiu, H.L. Static behavior of large stud shear connectors in steel-UHPC composite structures. Eng. Struct. 2019, 178, 534–542. [Google Scholar] [CrossRef]
  68. Tong, L.W.; Chen, L.H.; Wen, M.; Xu, C. Static behavior of stud shear connectors in highstrength-steel–UHPC composite beams. Eng. Struct. 2020, 218, 110827. [Google Scholar] [CrossRef]
  69. Ding, J.N.; Zhu, J.S.; Kang, J.F.; Wang, X.C. Experimental study on grouped stud shear connectors in precast steel-UHPC composite bridge. Eng. Struct. 2021, 242, 112479. [Google Scholar] [CrossRef]
  70. Fang, Z.C.; Fang, H.Z.; Huang, J.X.; Jiang, H.B.; Chen, G.F. Static behavior of grouped stud shear connectors in steel–precast UHPC composite structures containing thin fulldepth slabs. Eng. Struct. 2022, 252, 113484. [Google Scholar] [CrossRef]
Figure 1. Full-depth precast steel-UHPC composite beams with grouped shear connectors.
Buildings 14 02425 g001
Figure 2. Sample extraction details (unit: mm). (a) Standard push-out sample (SP sample). (b) Modified push-out sample (MP sample).
Buildings 14 02425 g002
Figure 3. Key sample preparation procedures.
Buildings 14 02425 g003
Figure 4. Mechanical property testing for steel productions. (a) Compressive test for UHPC. (b) Splitting tensile test for UHPC. (c) Tensile test for steel productions.
Buildings 14 02425 g004
Figure 5. Test set-up and instrumentations.
Buildings 14 02425 g005
Figure 6. Failure modes of samples. (a) Crack patterns on outer slab surfaces. (b) Crack patterns on inner slab surfaces. (c) Installation position of shear connectors on steel beams.
Buildings 14 02425 g006
Figure 7. Relationships between the load and interfacial slip of push-out samples. (a) Series I SENBs. (b) Series II Studs.
Buildings 14 02425 g007
Figure 8. Relationships between the load and interfacial uplift of push-out samples. (a) Series I SENBs. (b) Series II Studs.
Buildings 14 02425 g008
Figure 9. Ishikawa cause-and-effect diagram.
Buildings 14 02425 g009
Figure 10. Influences of angle on the shear behavior of connectors. (a) Ultimate shear capacity. (b) Initial shear stiffness. (c) Slip capacity.
Buildings 14 02425 g010
Figure 11. The shear-tension interaction strength behavior for connectors embedded in concrete. (a) Fitting of experimental results. (b) Analysis of fitting curve error [59].
Buildings 14 02425 g011
Figure 12. Performance of existing load–slip models for SENBs embedded in UHPC.
Buildings 14 02425 g012
Figure 14. Performance of existing load-slip models for studs embedded in UHPC.
Buildings 14 02425 g013
Figure 13. Performance of proposed load-slip models for connectors embedded in UHPC.
Buildings 14 02425 g014
Table 1. Specifications of push-out tests.
SeriesSpecimenConnector TypeAngle (°)Ratio of Tension to Shear
IB-D22A90SENB900.00
B-D22A80800.18
B-D22A75750.27
B-D22A70700.36
B-D22A65650.47
IIS-D22A90Stud900.00
S-D22A80800.18
S-D22A75750.27
S-D22A70700.36
S-D22A65650.47
Table 2. Material characteristics of UHPC in both fresh and hardened conditions.
Mechanical Propertiesfc (MPa)ft (Mpa)Ec (Mpa)v
Precast slab172.0818.42504570.232
Shear pocket174.8218.46457180.215
Table 3. Mechanical properties of steel productions.
TypesEs (GPa)fy (MPa)fu (MPa)
Diameter 22 stud211.08388.96486.67
Diameter 22 bolt202.20642.38877.93
Steel beam202.11274.65462.66
Table 4. Test result summary.
SpecimensUltimate Shear Capacity
(kN)
Initial Shear Stiffness
(kN/mm)
Silp Capacity
(mm)
Uplift at Pu
(mm)
P u k S u U u
B-D22A90187.10311.055.66−0.12
B-D22A80168.88284.815.130.09
B-D22A75164.89262.174.740.17
B-D22A70161.69246.564.560.19
B-D22A65155.40216.494.430.40
S-D22A90215.50358.453.84−1.52
S-D22A80191.63340.123.64−1.28
S-D22A75183.00302.843.43−1.00
S-D22A70158.63275.372.54−0.48
S-D22A65148.00239.322.23−0.43
Table 5. Ultimate strength of the test.
Specimen P s
(kN)
P t
(kN)
P s t
(kN)
P s t s
(kN)
P s t s / P s P s t t
(kN)
P s t t / P t
B-D22A901496--
B-D22A8014961915.271351.011330.740.88235.080.12
B-D22A7514961915.271319.081274.230.82341.640.18
B-D22A7014961915.271293.501215.890.69442.380.23
B-D22A6514961915.271243.191126.330.62525.870.27
S-D22A901724--
S-D22A8017241331.951532.711509.720.89266.690.2
S-D22A7517241331.951464.141414.360.85379.210.29
S-D22A7017241331.951269.191193.040.81434.060.33
S-D22A6517241331.951184.141072.830.75500.890.38
Table 6. Summaries of the shear-tension interaction models in previous studies.
ResearchersCalculation ModelsPros or cons of Formulas
Mcmakin et al. [61] ( P s t t P t ) 5 3 + ( P s t s P s ) 5 3 = 1      (1)The existing models had significant errors because the formulas were based on the concrete type obtained using NC.
Talami et al. [62] ( P s t t P t ) 2 + ( P s t s P s ) 2 = 1      (2)
Zhang et al. [59] ( P s t t P t ) 3 + ( P s t s P s ) 3 = 1      (3)
Bode and Roik [43] P s t s P s = 1 ,   P s t t P t 0.2      (4)
P s t t P t = 1 ,   P s t s P s 0.2 P s t t P t + P s t s P s = 1.2 , P s t t P t > 0.2 ,   P s t s P s > 0.2
Lin et al. [35] P s t s P s = 1 ,   P s t t P t 0.1      (5)
P s t t P t = 1 ,   P s t s P s 0 . 1
P s t t P t + 0.5 2 + P s t s P s + 0.5 2 = 2.61 , P s t t P t > 0.1 , P s t s P s > 0.1
An et al. [63] P s t s P s = 1 ,   P s t t P t 0.1      (6)
P s t t P t 1.3 + 0.95 P s t s P s 1.3 = 1 , P s t t P t > 0.1
Ding et al. [60] P s t s P s = 1 ,   P s t t P t 0.1      (7)
1.17 P s t t P t 0.83 + P s t s P s 0.83 = 1 , P s t t P t > 0.1
Despite Equation (7) having a squared correlation coefficient of 0.95, its accuracy was still insufficient.
Table 7. Summary of load-slip relation models from previous related studies.
ResearchersCalculation Models
Ollgaard [65] P / P u = 1 e 0.71 S 0.40      (10)
Buttry [66] P / P u = 3.15 S / 1 + 3.15 S      (11)
Yang [64] P / P u = 0.137 S  for  S 0.59   m m      (12)
P / P u = S 0.38 / 2.08 + 0.87 S
Zhang [14] P / P u = 1 e 0.20 S 0.4      (13)
Fang [67] P / P u = 1 e 0.47 S 0.36      (14)
Fang [67] P / P u = 1 e 0.47 S 0.5      (15)
Table 8. Summary of load-slip relation models from previous related studies.
ResearchersCalculation Models
Ollgaard [65] P / P u = 1 e 0.71 S 0.40      (10)
Buttry [66] P / P u = 3.15 S / 1 + 3.15 S      (11)
Wang [67] P / P u = ( S / d ) / 0.006 + 1.02 S / d      (18)
Wang [7] P / P u = 1 e 1.1 S 0.96      (19)
Tong [68] P / P u = 1 e 1.55 S 0.64      (20)
Ding [69] P / P u = 1 e 1.08 S 0.6      (21)
Fang [70] P / P u = 1 e 1176 S / d 2 0.76 For 50 mm UHPC slab      (22)
P / P u = 1 e 1.47 S 0.57 For 75 mm UHPC slab
Disclaimer/Publisher’s Note: The statements, opinions and data contained in all publications are solely those of the individual author(s) and contributor(s) and not of MDPI and/or the editor(s). MDPI and/or the editor(s) disclaim responsibility for any injury to people or property resulting from any ideas, methods, instructions or products referred to in the content.

