Abstract
Adding cement to soft soils may lead to brittle behavior and the occurrence of sudden damage. Methods to further improve the tensile and flexural properties of cemented clay are noteworthy topics. This paper mainly focuses on the effect of cement and moisture content on the strength and flexural properties of cemented clay reinforced by PVA fiber. The selected clayey soil was a kaolin with cement content of 5%, 10%, and 15% and moisture content of 50%, 56%, 63%, and 70%. The results show that the incorporation of 0.6% fiber can effectively improve the deformability of cemented clay in unconfined compression tests (UCS). The strengthening effect of fiber, as seen in the peak strength and post-peak strength of UCS, was significantly related to cement content. As the water content increased, the compressive strength of the fiber-reinforced cemented clay decreased, but its load-bearing capacity enhanced. When the cement content was 15%, the splitting tensile strength of fiber-reinforced cemented specimens increased by 11% compared to cemented soil, but the deformability of the specimens became poor. In the cement-content interval from 5% to 10%, the bending toughness was significantly improved. Sufficient cement addition ensures the enhancement of PVA fibers on strength and flexural properties of cement-stabilized clayey soil.
1. Introduction
Construction of buildings, embankments, coastal engineering works, and other civil engineering structures on soft soils may cause problems, including differential settlement, poor shear strength, high compressibility, and even structural failure [1,2,3,4,5,6]. To prevent these problems, improvement of certain desirable properties, such as the load-bearing capacity and compressibility of soft soils, can be undertaken with chemical soil stabilization [7,8,9,10,11]. Mixing cement with soft soils to enhance their engineering properties is a common method of soil improvement, which usually results in increased stiffness and compressive strength [12,13,14]. However, it may also cause brittle behavior and sudden failure [15,16,17,18]. In the event of large horizontal displacement of the structure (slope and pit support, etc.), violent bending and tension cracking damage may occur, which injects greater uncertainty into project safety. How to further improve the comprehensive performance of cemented soil has thus become a focus of interest in recent years [6,19,20,21].
Inspired by the natural phenomenon that plant roots consisting of fibers randomly embedded in a soil matrix can effectively stabilize the slope [22,23], discrete randomly distributed fibers are typically applied to improve the engineering characteristics of soft soil [24,25,26,27,28]. Unlike traditional geosynthetic reinforcement materials like geogrid, geotextile, and geocell, the main advantages of using discrete short fibers are the maintenance of strength isotropy and the prevention of weak planes developing along the geosynthetic-soil interface [29,30,31,32,33]. By increasing fiber inclusion, the soil became more homogenous and isotropic [34]. Adequate amounts of distributed discrete fibers act as a spatial three-dimensional network to interlock soil grains and resist soil displacement [35], resulting in the brittleness behavior caused by adding cement being reduced. Furthermore, engineering characteristics, including shear strength, compressive strength, and load-bearing capacity, were also improved by fiber reinforcement [18,36,37,38,39,40,41,42,43,44,45], as well as tensile and flexural performance [46,47,48,49]. Previous studies have shown that preparation parameters like cement content and water content affect fiber reinforcement [50,51,52]. However, most of these earlier investigations have focused on reinforcement materials only and limited studies have been attempted about the comprehensive effects of cement content, water content, and curing time using unconfined compression tests, split tensile tests, and flexural tests.
Fiber-reinforcing effects are also affected by fiber properties. Synthetic fibers are widely used as reinforcement materials due to their corrosion resistance, non-toxicity, high tensile strength, and stiffness [53,54]. Among various types of synthetic fibers used as soil reinforcement are glass fiber, polypropylene (PP) fiber, polyvinyl alcohol fiber (PVA), nylon fiber, and polyester fiber. Since PVA fiber outperforms PP fiber in terms of weather durability, chemical resistance (particularly alkaline resistance), and tensile strength, it has lately been employed in fiber-reinforced concrete. Compared to nylon and/or polyester, PVA fiber shrinks considerably less from heat and possesses strong anti-alkali properties and good cement adhesive properties. Experiments indicated that the application of 1% PVA fiber to cemented sand resulted in a doubling of both the UCS and the axial strain at peak strength and a quadrupling of ductility, as compared to non-fiber-reinforced specimens [16,37]. The UCS of cemented sandy soil increased with an increase in PVA fiber content, and this rise was greater in low-cement-content soils [55]. Past studies show that the energy absorption capacity of cemented soil improves, and its elasticity modulus falls when PVA fibers are added [56]. When compared to other fibers under the same cementation, the addition of PVA fiber seems to create more effective strength and ductility in reinforcement, which makes it appropriate for use as a soil reinforcement component.
Based on the discussion above, it can be hypothesized that adding fibers to cement-cured soils is a way to improve the toughness, and one of the potentially good choices is PVA fibers. Fiber-reinforced cemented soil has attracted much interest and has promising application prospects. However, limited studies have been attempted regarding the engineering characteristics of PVA fiber-reinforced cemented clay and the effect of parameters like cement content, water content, and curing time. The objective of this investigation is to comprehend the mechanical behavior of cemented clay mixed with short discrete PVA fibers. A series of tests—including unconfined compression tests, split tensile tests, and flexural tests—were carried out on specimens with different percentages of cement and other inclusions. According to the experimental results, the effects of the factors on the strength and flexural properties of fiber-reinforced cemented soil were investigated.
2. Materials and Experimental Program
2.1. Materials
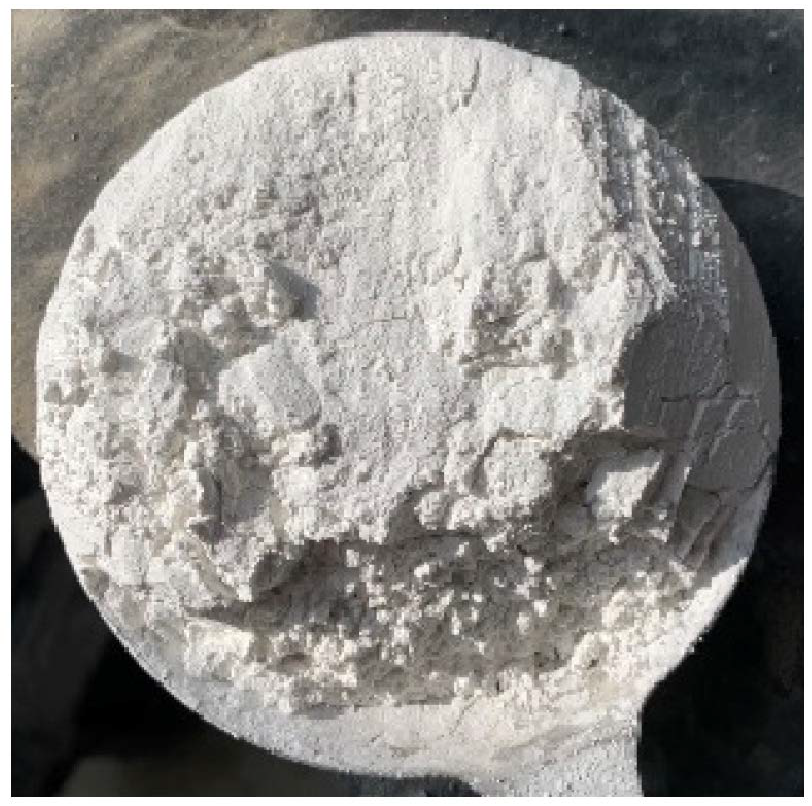
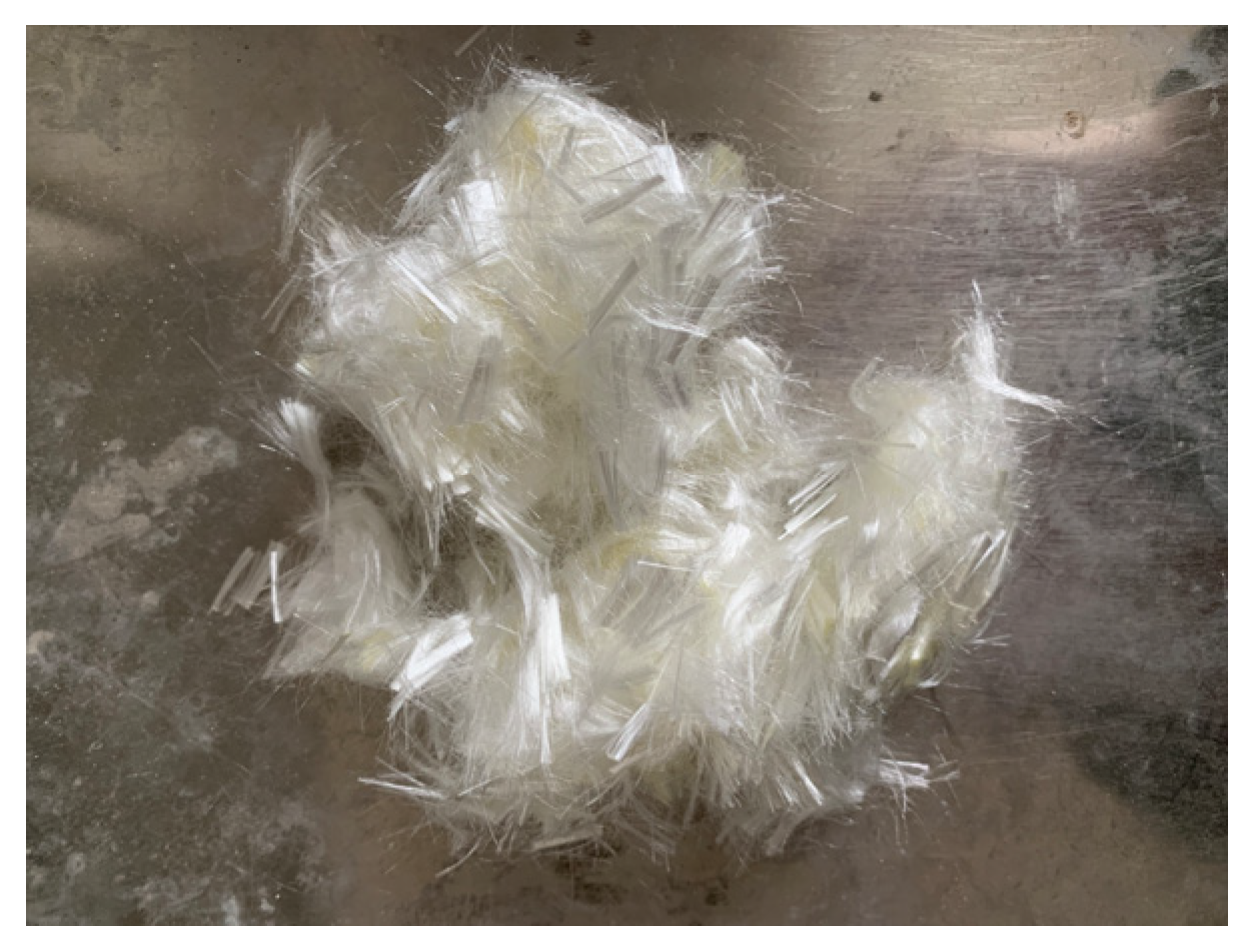
Commercial kaolin clay obtained from Hebei, China, was selected to reduce the variability of experiment results, the ground and sieved sample of kaolin as shown in Figure 1. The characteristics of kaolin clay are presented in Table 1 according to appropriate ASTM standards. Based on the Unified Soil Classification System (USCS), kaolin clay is classified as CL. The chemical composition of the sample, determined with XRF analysis, is presented in Table 2. PVA fibers are shown in Figure 2, and their properties are presented in Table 3. The cement used in the tests was ordinary Portland cement.
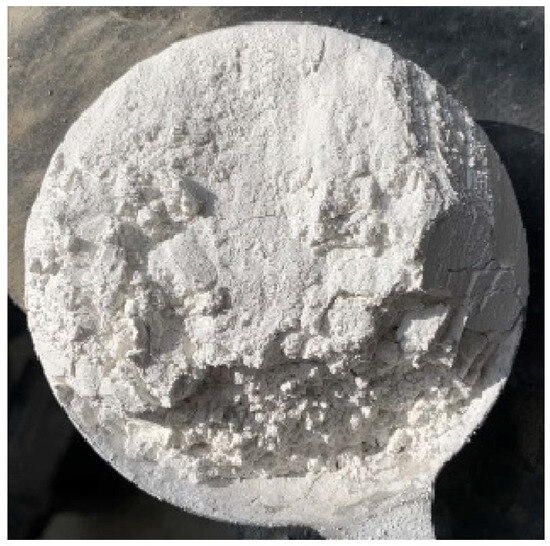
Figure 1.
Kaolin.

Table 1.
Physical characteristics of soil samples.
Table 2.
Soil sample composition analysis result.
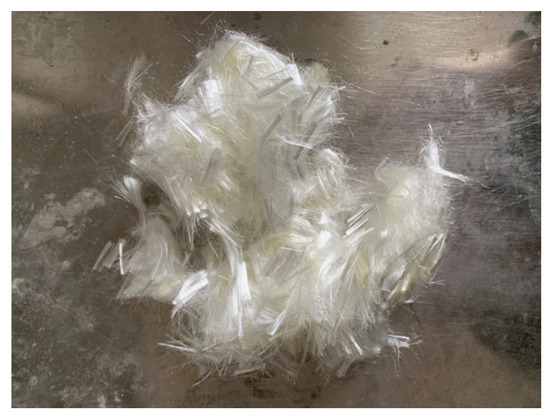
Figure 2.
PVA fiber.
Table 3.
Mechanical properties of PVA fiber.
2.2. Preparation of Samples
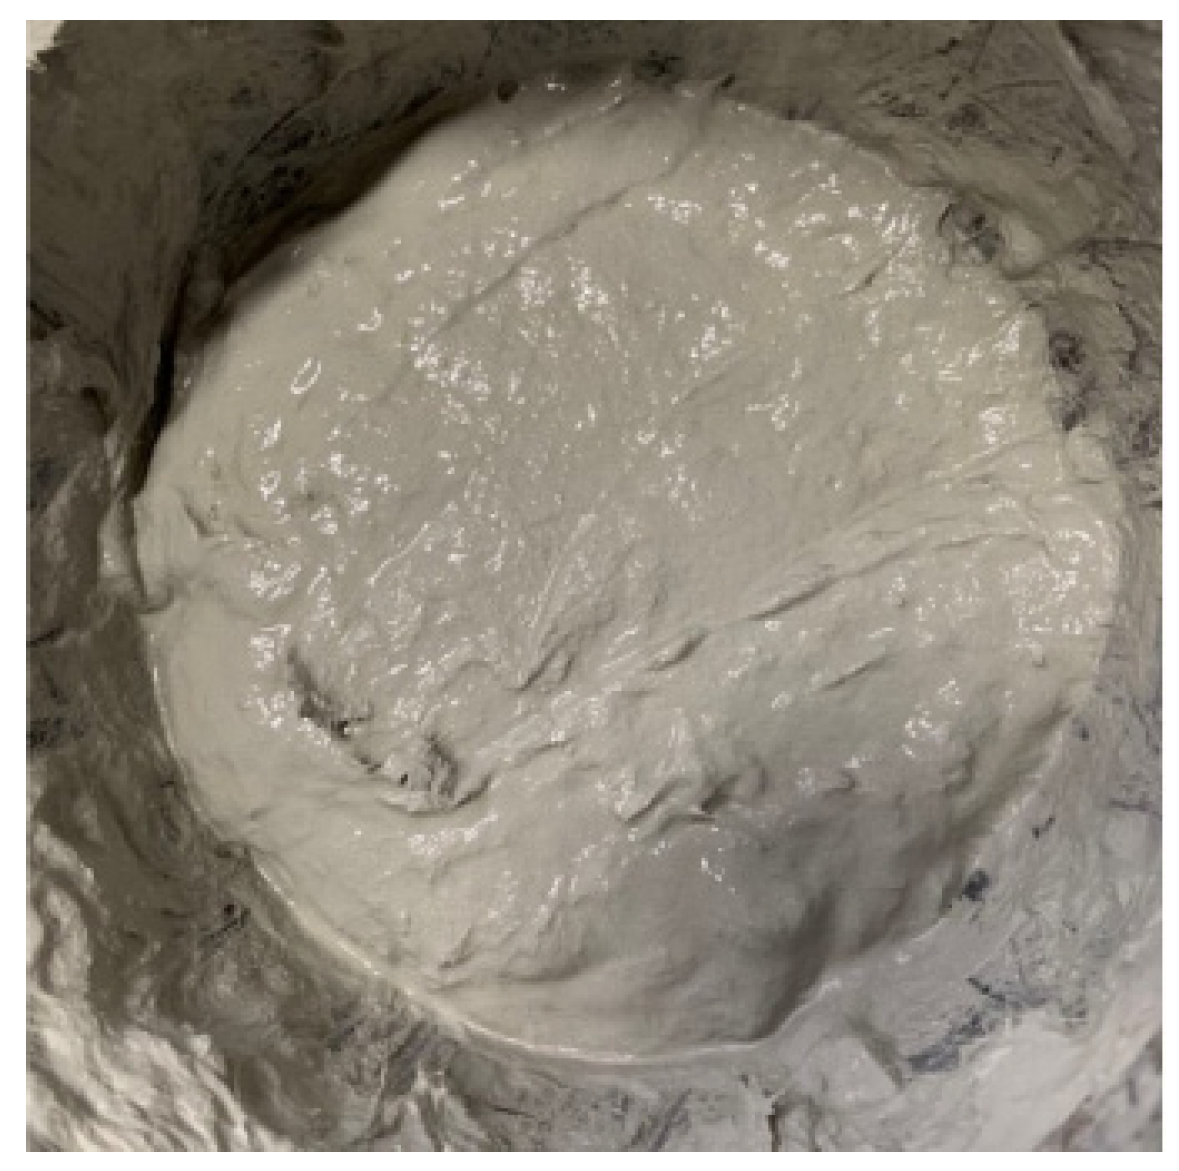
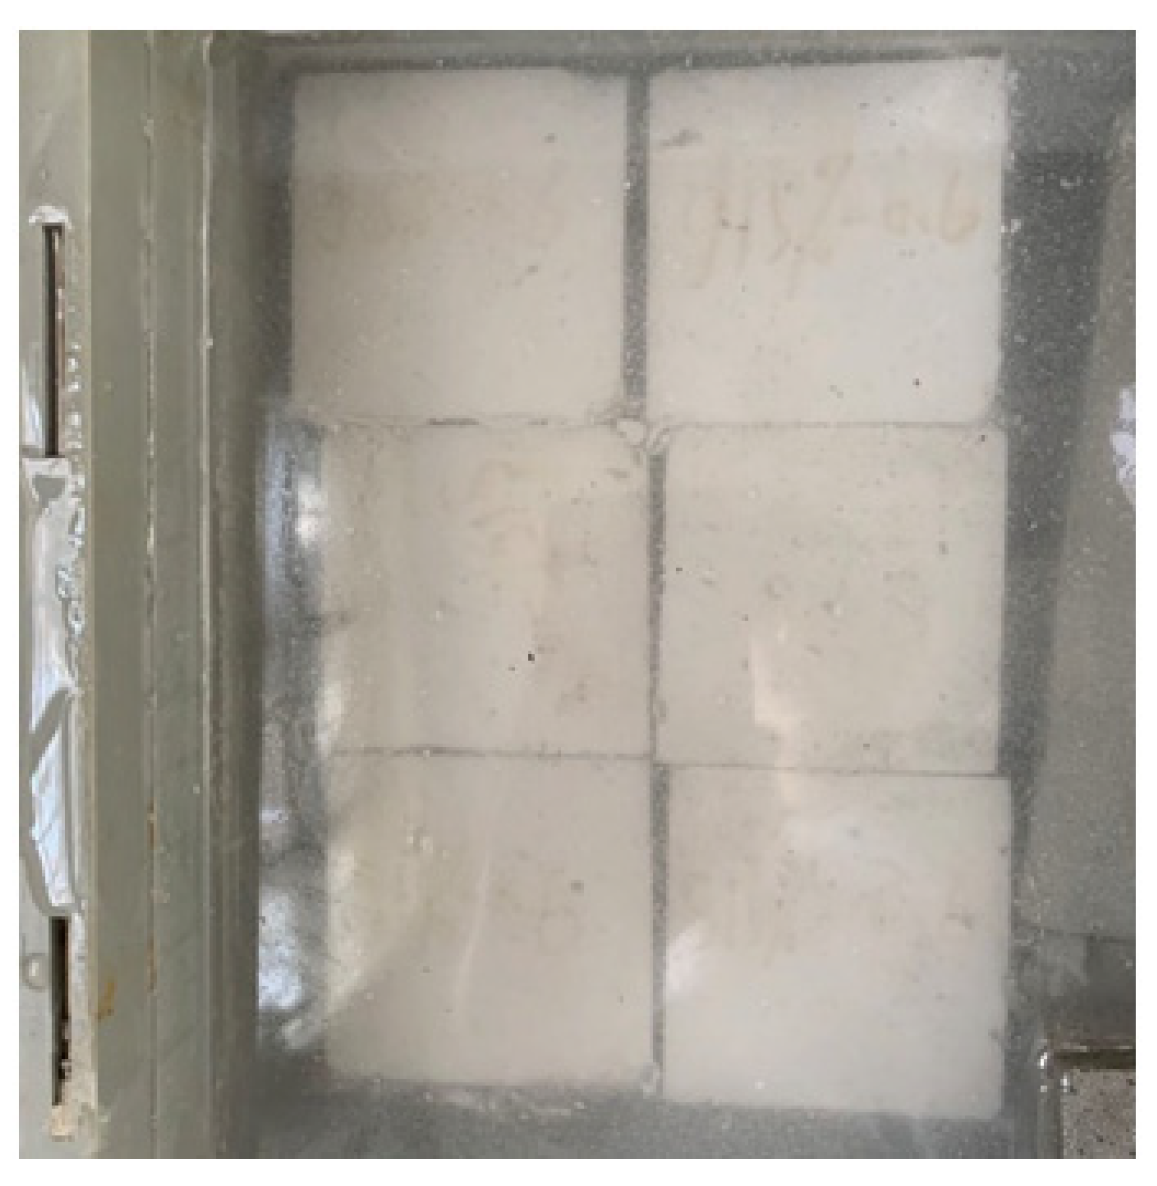
The wet-mix method, which is conducive to uniform fiber dispersion, was used with the specimens. After calculating and weighing the amount of kaolin, cement, water, and PVA fibers required to prepare the sample, kaolin clay and cement were initially dry-mixed by mixer for 2 min and, subsequently, water was gradually added and mixing continued for 3 min to achieve a uniform mixture (Figure 3). Then, PVA fiber was added to the mixed soil sample and stirred for 3 min until the fibers were well dispersed. The mixed fiber-reinforced cemented samples were loaded into the mold, inserted and pounded, leveled, rested(48h), and demolded. The molded specimens were cured in water at a temperature of 20° ± 2° for 7, 14, 28, and 90 days before testing, as shown in Figure 4.
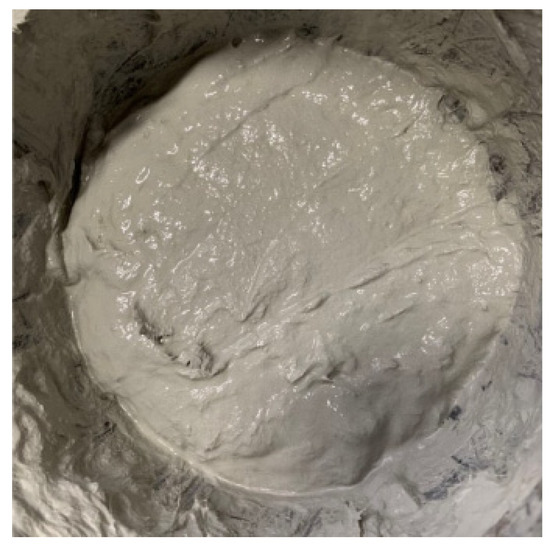
Figure 3.
Mix.

Figure 4.
Curing.
2.3. Testing Program
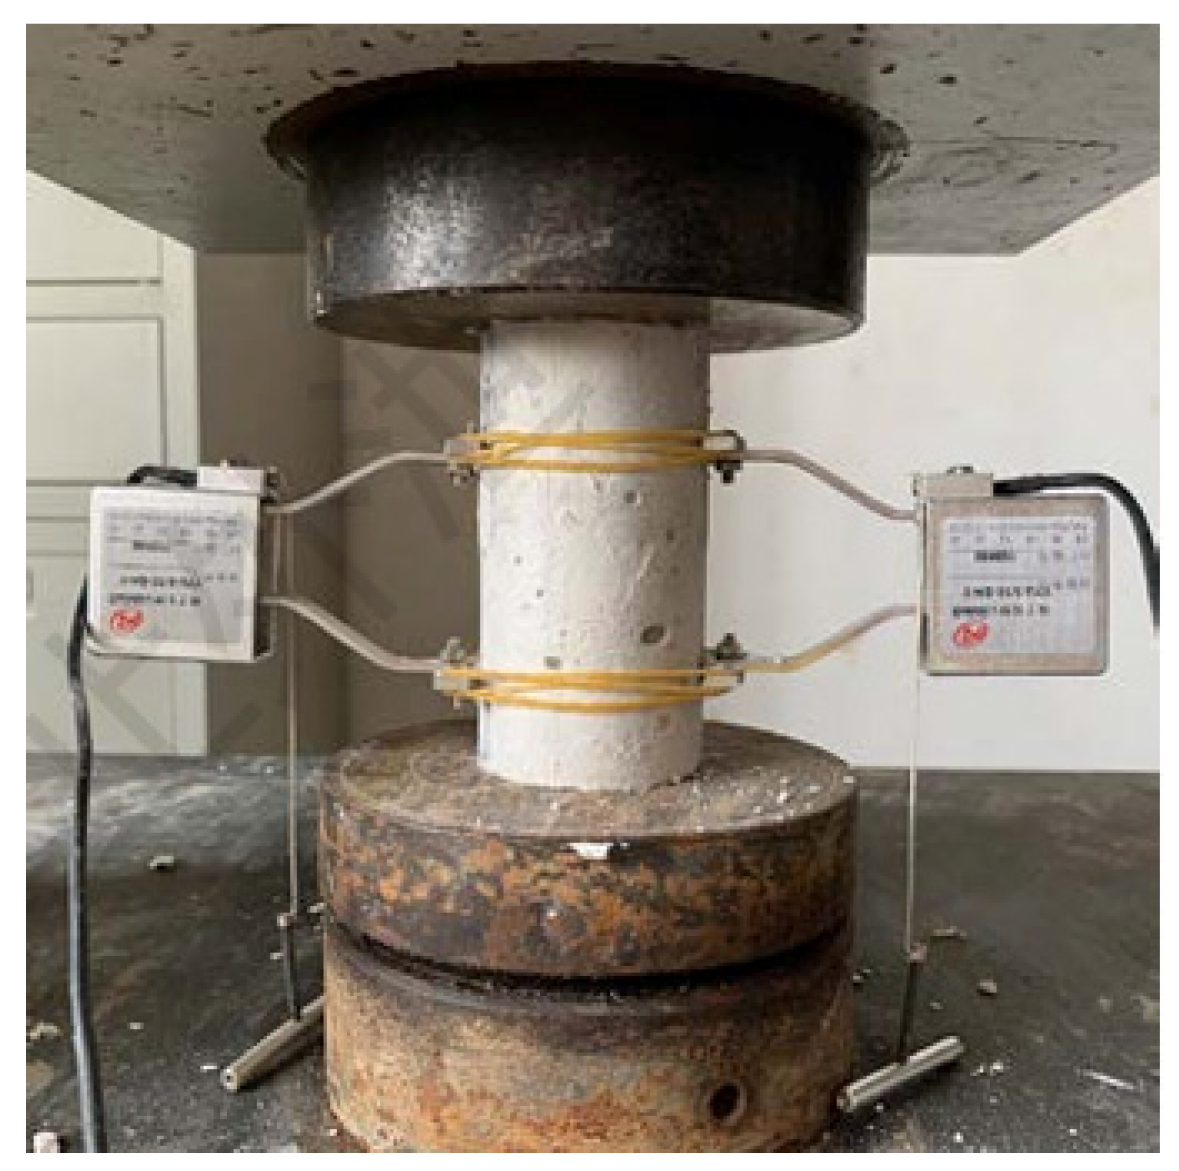
Laboratory work included unconfined compressive strength (UCS) tests, splitting tensile strength (STS) tests, and flexural tests. Cylindrical specimens of size φ50 mm × 100 mm were used for the unconfined compression tests and were loaded at a speed of 1 mm/min according to Chinese code (JTG E51-2009 [57]), as shown in Figure 5. The splitting tensile tests were conducted using 70.7 mm cubes and a rate of 1 mm/min by displacement control until the specimen was damaged (GBT50081-2002 [58]). The four-point flexural test was performed on prisms of 160 mm × 40 mm × 40 mm with a span length of 120 mm and a distance between loading points of 40 mm. A constant loading rate of 1 mm/min was used throughout until the failure of samples, as shown in Figure 6. Three parallel specimens were prepared for each test program, and the accuracy of the deformation measurement was 0.01 mm.

Figure 5.
Unconfined compressive strength test.
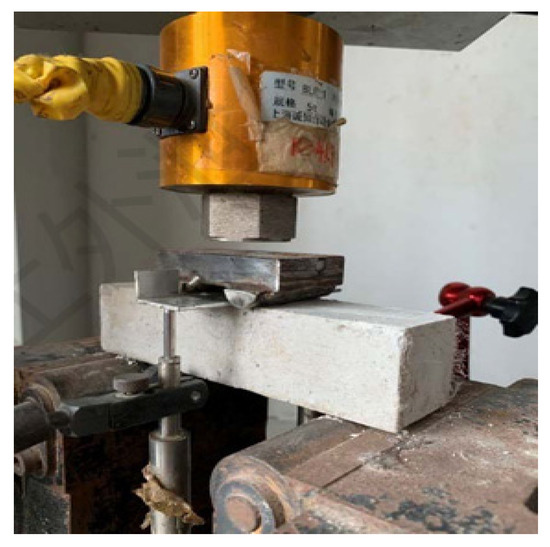
Figure 6.
Flexural test.
The tests were performed on kaolin clay with varied water content (αw) of 50% (close to the liquid limit), 56%, 63%, and 70% by dry weight of soil. The different values adopted in the present study for cement content (αc) were 5%, 10%, and 15%. The fiber content was set at 0.6%, and the content of 0% was set as the control group. Specimens were named as c5/10/15-f0/0.6-7/14/28/90, where c5/10/15 denoted cement content of 5%, 10%, and 15%, f0/0.6 denoted fiber content of 0% and 0.6%, and 7/14/28/90 was the curing age. Dry density (ρd) and density (ρ) of samples are listed in Table 4.
Table 4.
Dry density and density of specimen.
2.4. Parameters Describing the Behavior of FRCS
According to JTG E51-2009, the unconfined compressive strength of cement-cured soil () is calculated by Equation (1):
Referring to GBT50081-2002, the splitting tensile strength of cement-cured soil () is calculated by Equation (2):
The nominal flexural strength fu at the peak flexural load can be obtained using Equation (3):
where P is the peak load, A is the cross-sectional area of the specimen, L is the span, and b and h are the width and height of the specimen, both taken as 40 mm. The flexural toughness of fiber hydro-mulch was evaluated according to ASTM C1069 [59], with two displacement points, i.e., L/(2L) and L/(0.5L), being considered. In order to better evaluate the specimens’ toughness characteristics, three additional displacement points were further considered in this study. Thus, a total of five displacement points were used for toughness evaluation—i.e., L/240 (0.5 mm), L/120 (1 mm), L/60 (2 mm), L/40 (3 mm), L/30 (4 mm)—as shown in Figure 7. The area enclosed by the load-deflection curves at different deflections was used to represent the flexural toughness of the specimen, referred to as A0.5, A1, A2, A3, and A4, respectively. The larger the area, the larger the energy absorption value, indicating greater flexural toughness of specimens.
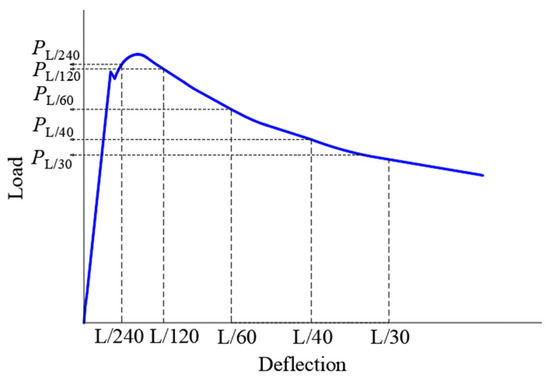
Figure 7.
Toughness calculation chart (ASTM C1069).
3. Results and Discussion
3.1. Effect of Cement and Moisture Content on Unconfined Compressive Strength
3.1.1. Failure Modes
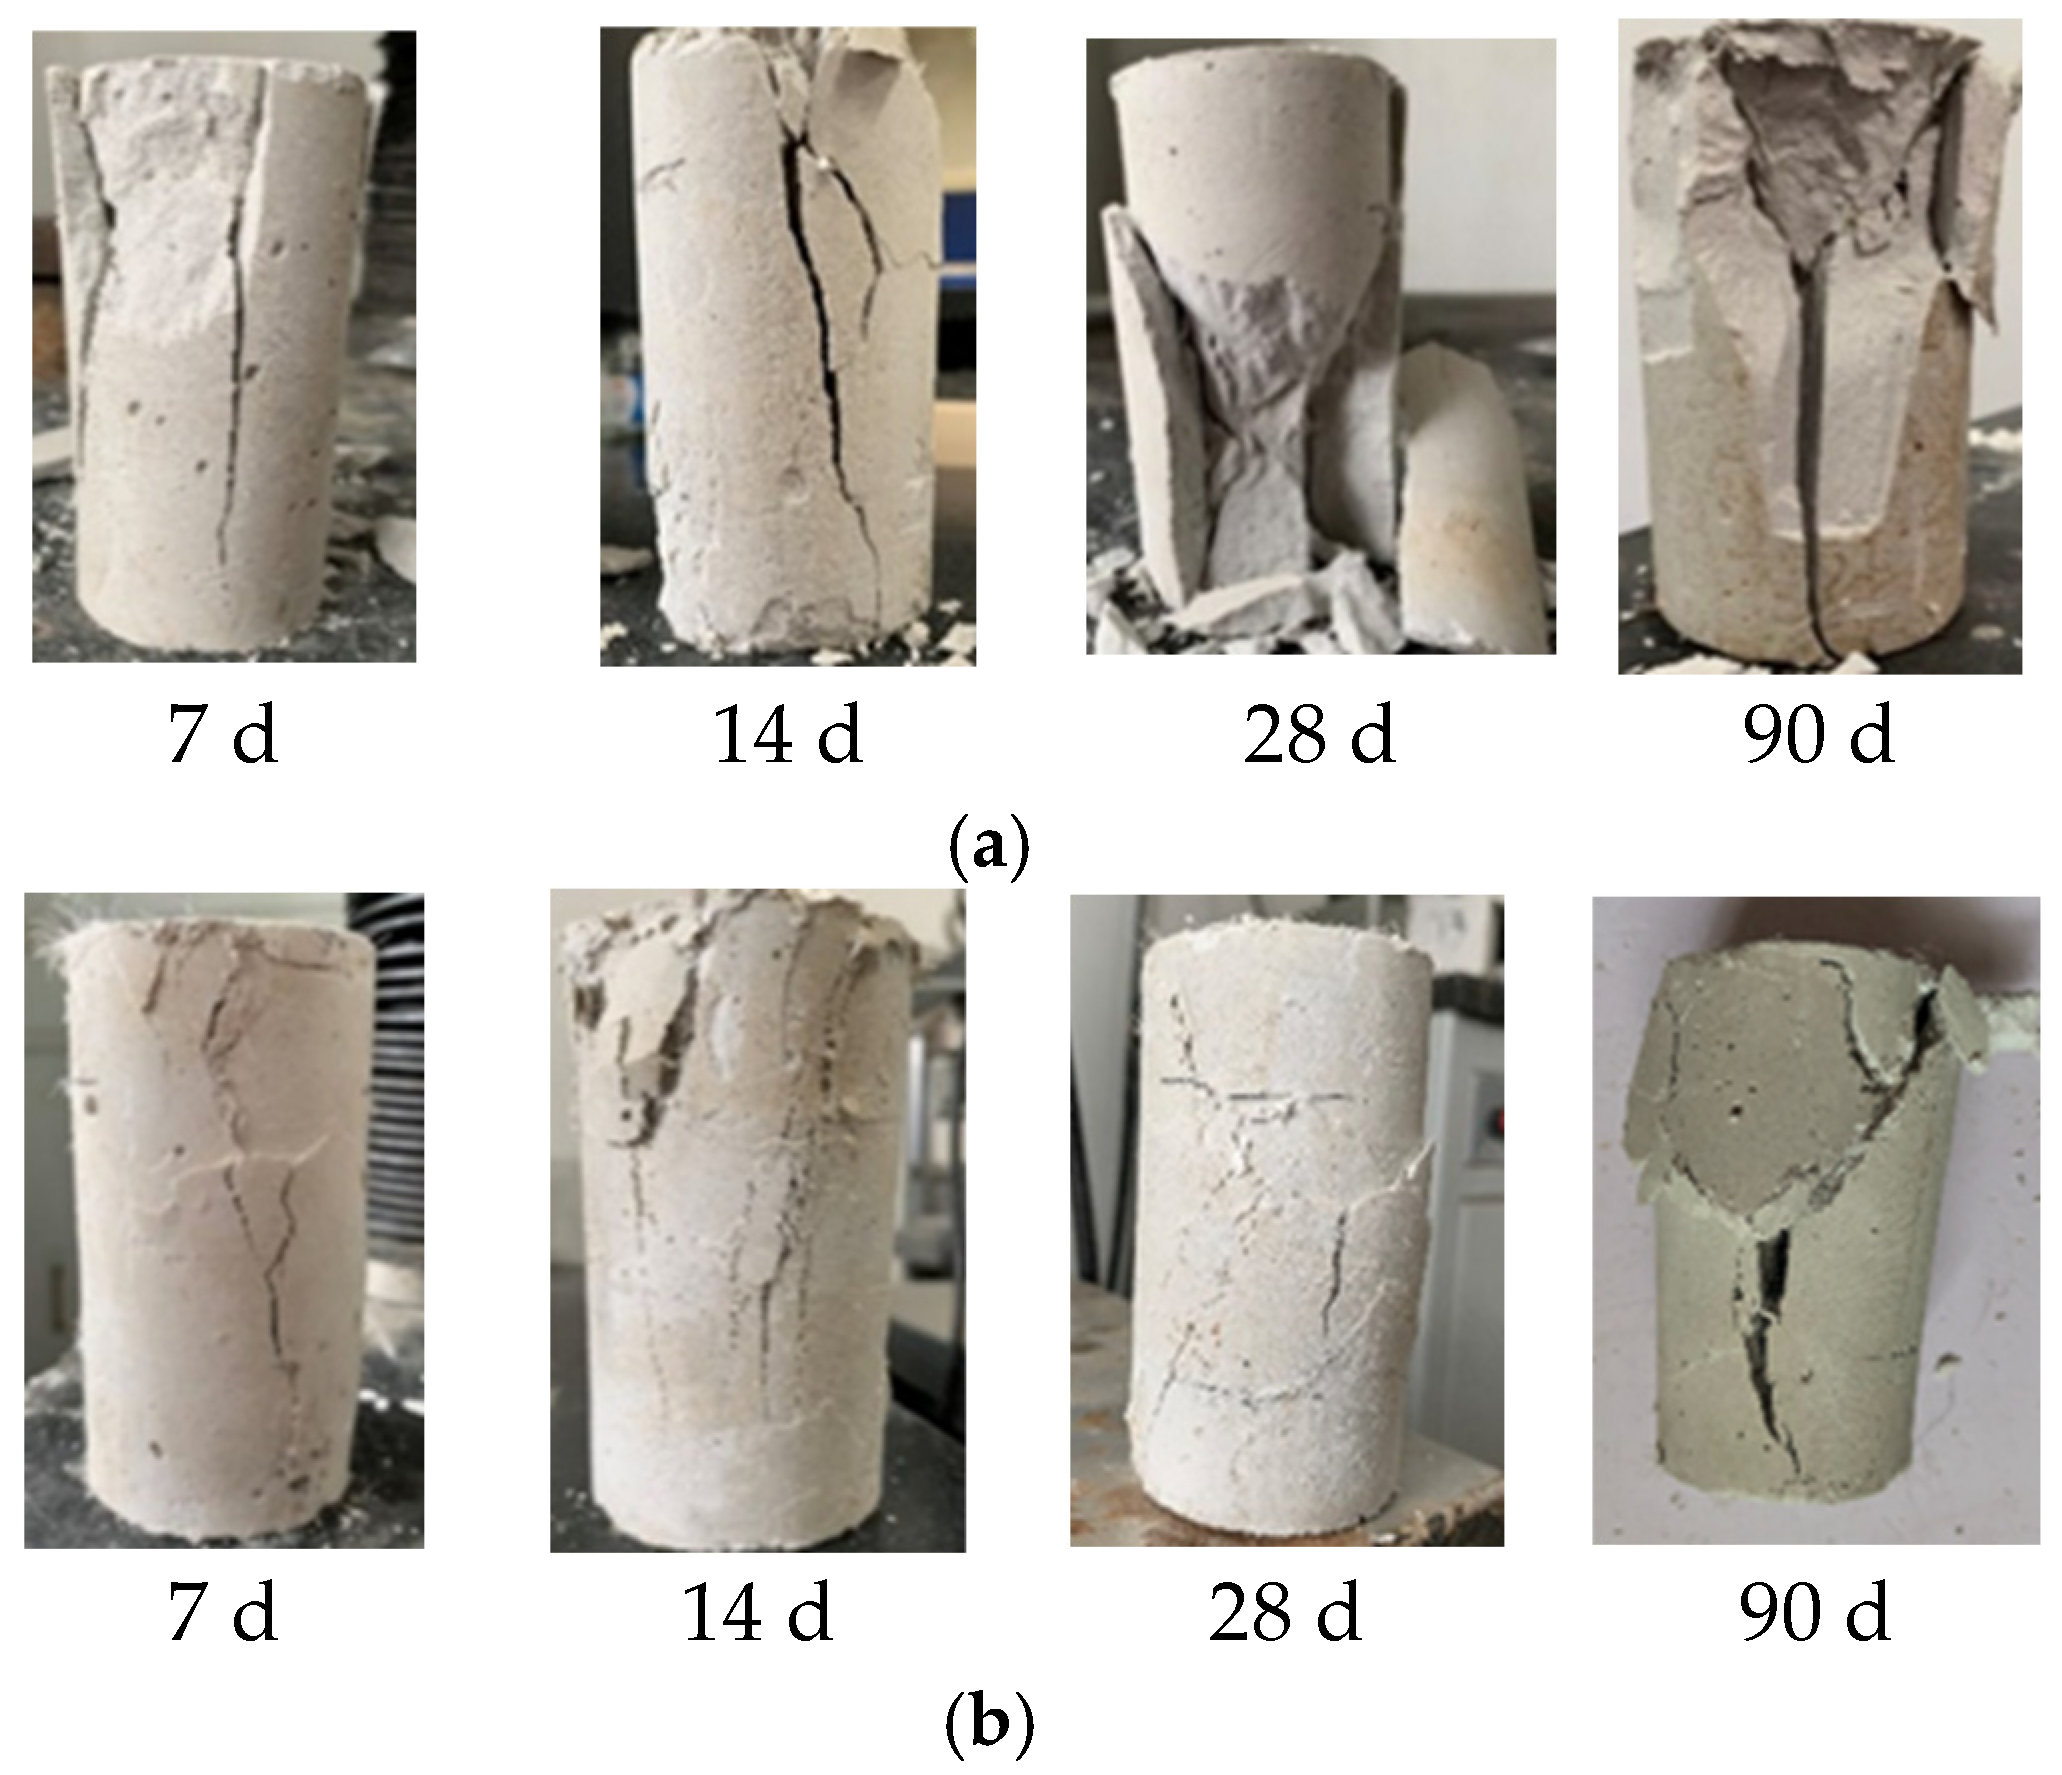
Figure 8 shows the compressive failure modes of cemented clay at different maintenance ages at αc = 10%. Compared with cemented clay, after a curing time of 7 days, cracks in PVA fiber-reinforced specimens extended, but they were still able to maintain their cylindrical shape. As the curing time increased, the integrity of the specimens gradually decreased, followed by cracking of entire specimens, with severe spalling (90 d). In contrast, the cracks in the PVA fiber-reinforced specimens developed and extended, and some of the fibers were pulled out at the cracks, but the restraining effect of the fibers kept the specimens in good integrity (90 d). It can be seen that the failure modes of PVA fiber-reinforced cemented clay in unconfined compression tests exhibited plastic shear damage, and the addition of fibers could effectively improve the ability of cemented soil to deform and avoid brittle damage.
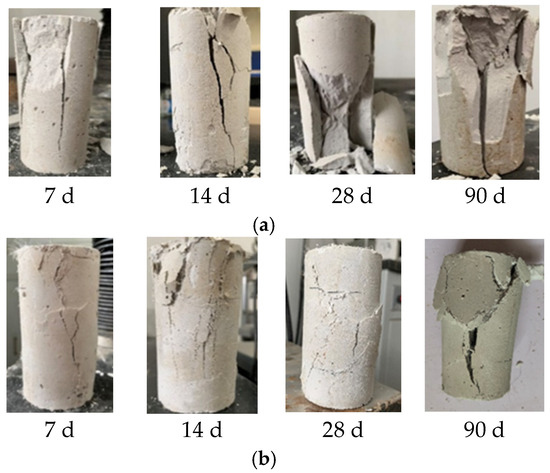
Figure 8.
Compressive failure modes of cemented clay at different ages: (a) αc = 10%, αf = 0%, αw = 50%; (b) αc = 10%, αf = 0.6%, αw = 50%.
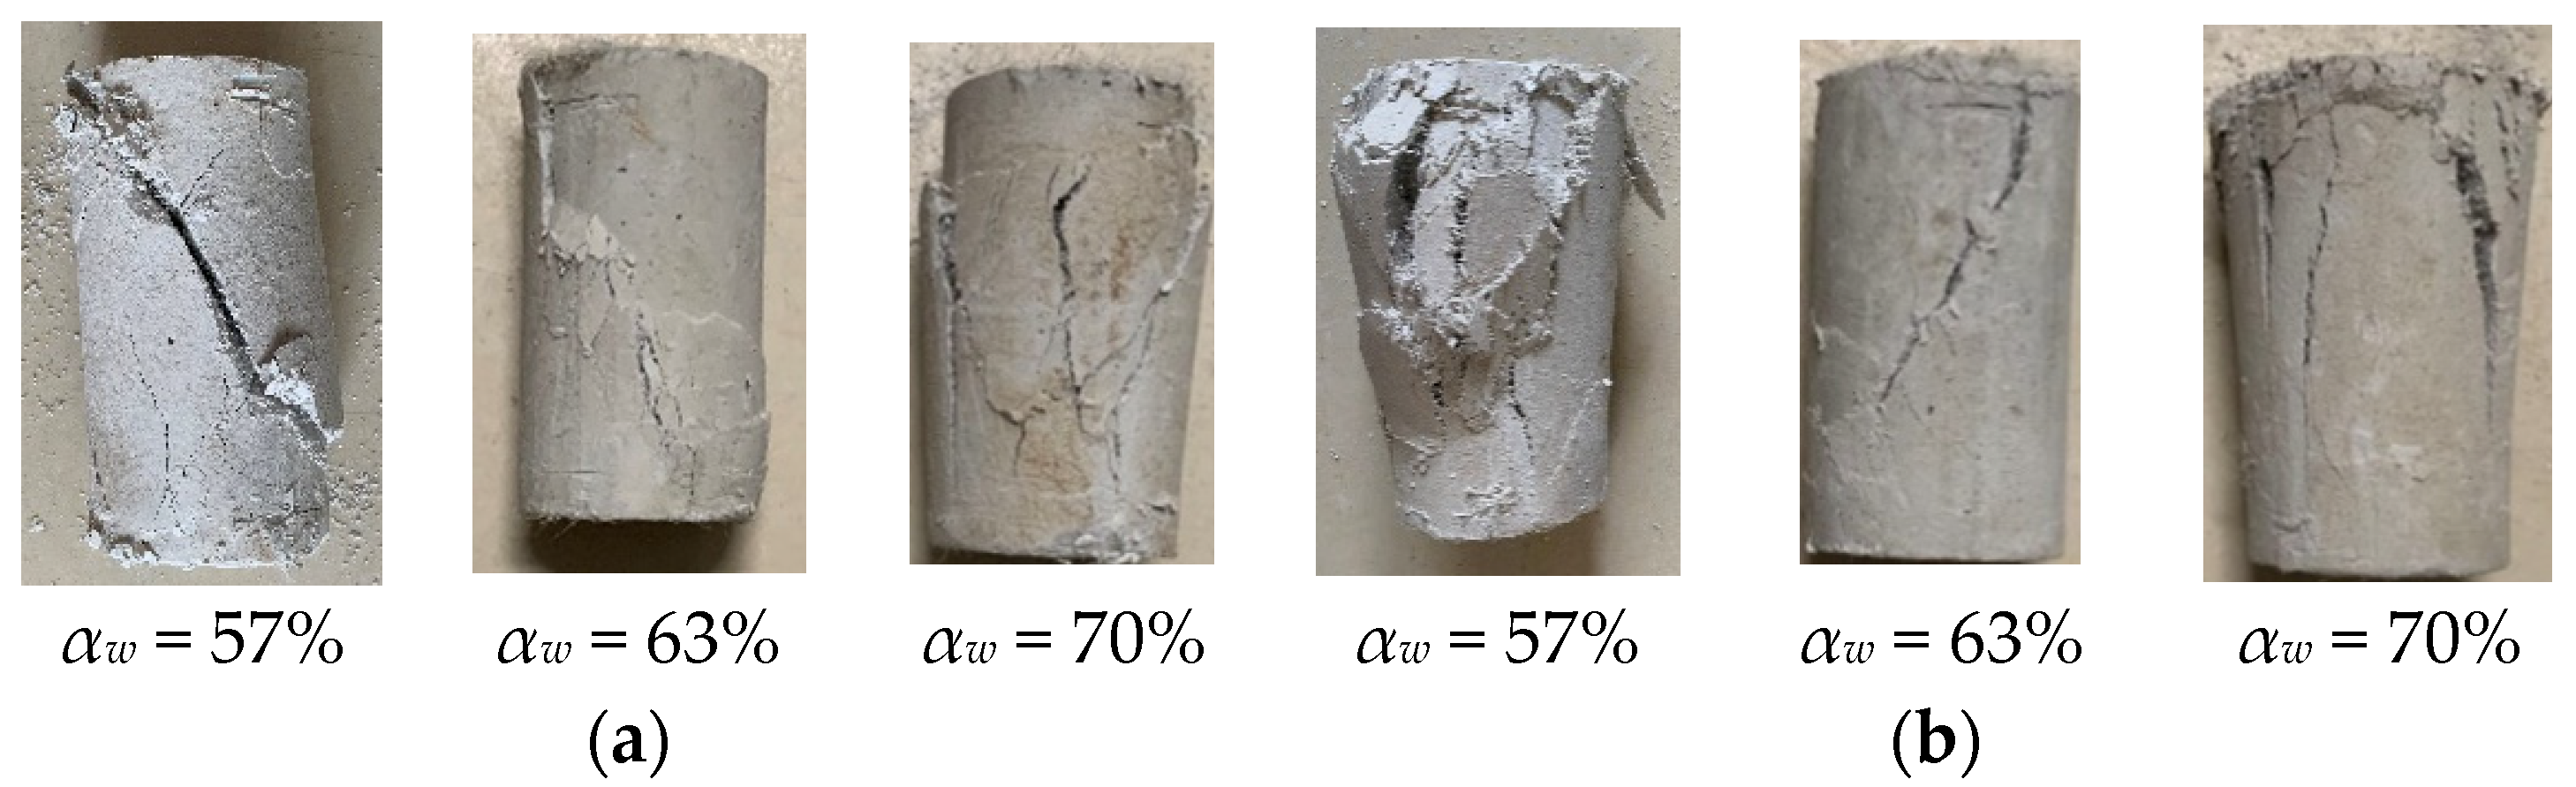
Figure 9 illustrates the compressive failure modes of cemented clay with different water contents. With the gradual increase of water content, the specimen with αf = 0.6% showed ductile failure modes at the end of compressive loading, and the overall failure appeared at the top of the specimen. Because the hydration reaction was not sufficient at low water content, resulting in a weak bond between the fibers and the soil, the reinforcing effect of fiber was not obvious. As the water content increased, more hydration products were generated, and the bond between the fiber and the cement was stronger, which made the fiber effectively disperse and transfer the stress during loading. For example, the specimens with αc = 10% exhibited a transition from macroscopic shear diagonal cracks to multiple vertical cracks, and the integrity of the specimens was maintained by the bridging action of the fibers at the failure stage. As the cement content increased from 10% to 15%, the deformation modulus of the PVA fiber-reinforced cemented clay increased, weaken of deformability and cracking during damage tended to be significant.
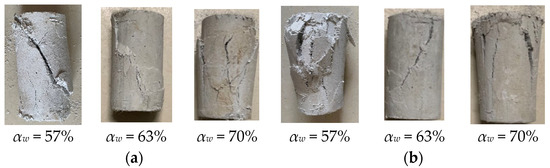
Figure 9.
Compressive failure modes of cemented clay with different water contents: (a) αc = 10%, αf = 0.6%, t = 28 d; (b) αc = 15%, αf = 0.6%, t = 28 d.
3.1.2. Stress-Strain Curves
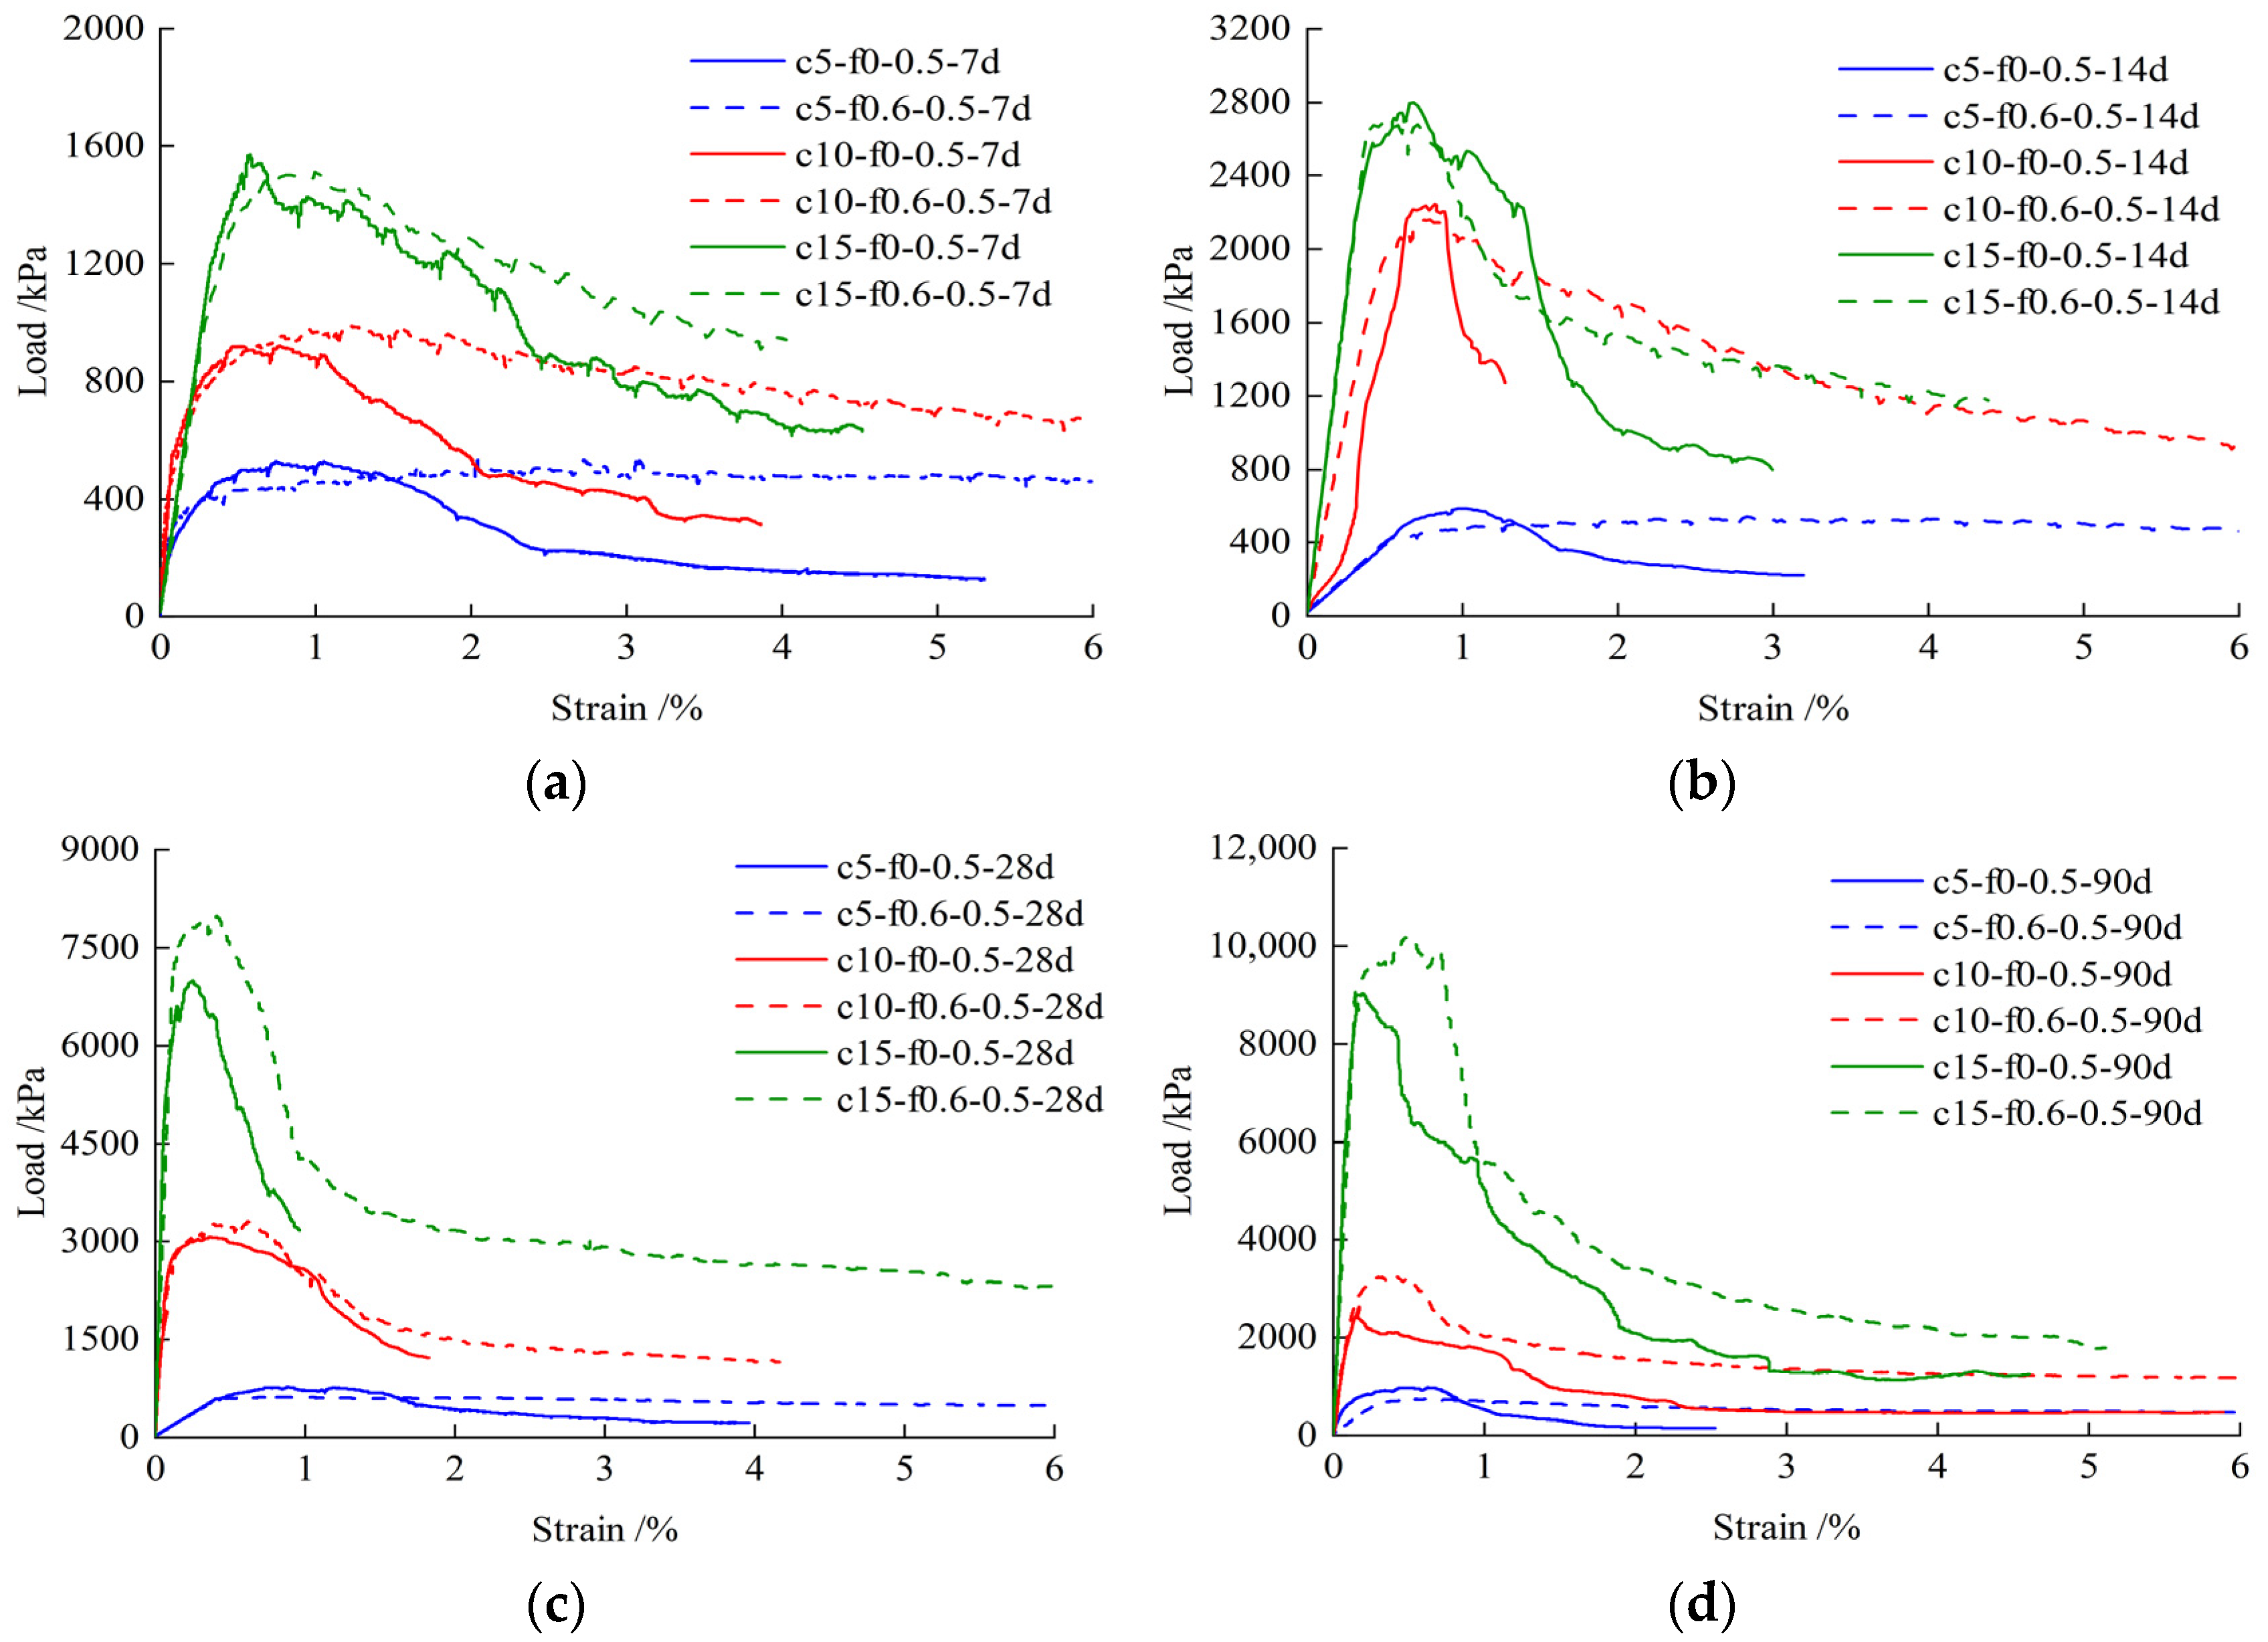
Figure 10 shows the stress-strain curves for the specimens with different curing times, t. The enhancement effect of the PVA fiber with αf = 0.6% upon compressive strength tends to become more significant with the increase of curing time. For example, the UCS of the fiber-reinforced specimens with αc = 15% increased to 15%, 56% at t = 28 d, 90 d. This is because fuller hydration reactions within the cemented soil led to higher interfacial bond strength, helping the fibers to prevent the movement of soil particles and play a bridging role. In addition, the fibers contributed to compressive ductility (the total strain at failure or the strain corresponding to the peak stress) and post-peak strength at the strain of 4%. Curves for the fiber-reinforced specimens also showed a smaller rate of decrease than that of cemented soil after peak strength, indicating that fiber inhibited crack development and the specimens showed greater toughness and resistance to deformation. In addition, the ductility of the specimens showed a gradual decrease with increasing cement content. The compressive strength at 4% strain(qucs-4%) at 28 days were 533 kPa, 1152 kPa, and 2667 kPa for the fiber-reinforced specimens with 5%, 10%, and 15% cement content, respectively. qucs-4% increased dramatically with cement content, but the brittleness increased, and the descending part of the curve steepened at the same time. Figure 10 demonstrates that residual strength ratios between the specimens with different cement contents grew with curing time, e.g., the qucs-4% ratio of 15% and 5% cement content increased from 2.4 at age 7 d to 4.5 at age 90 d.
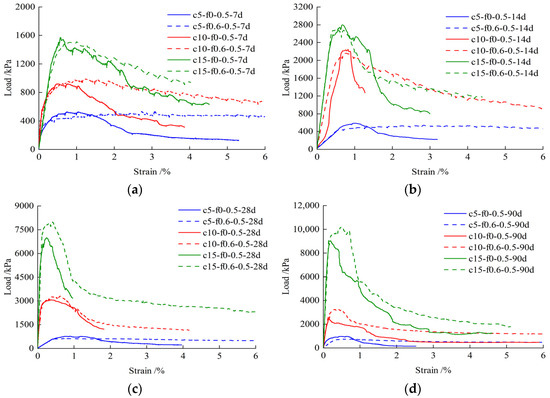
Figure 10.
Stress–strain curves of the specimens with different curing times:(a) t = 7 d; (b) t = 14 d; (c) t = 28 d; (d) t = 90 d.
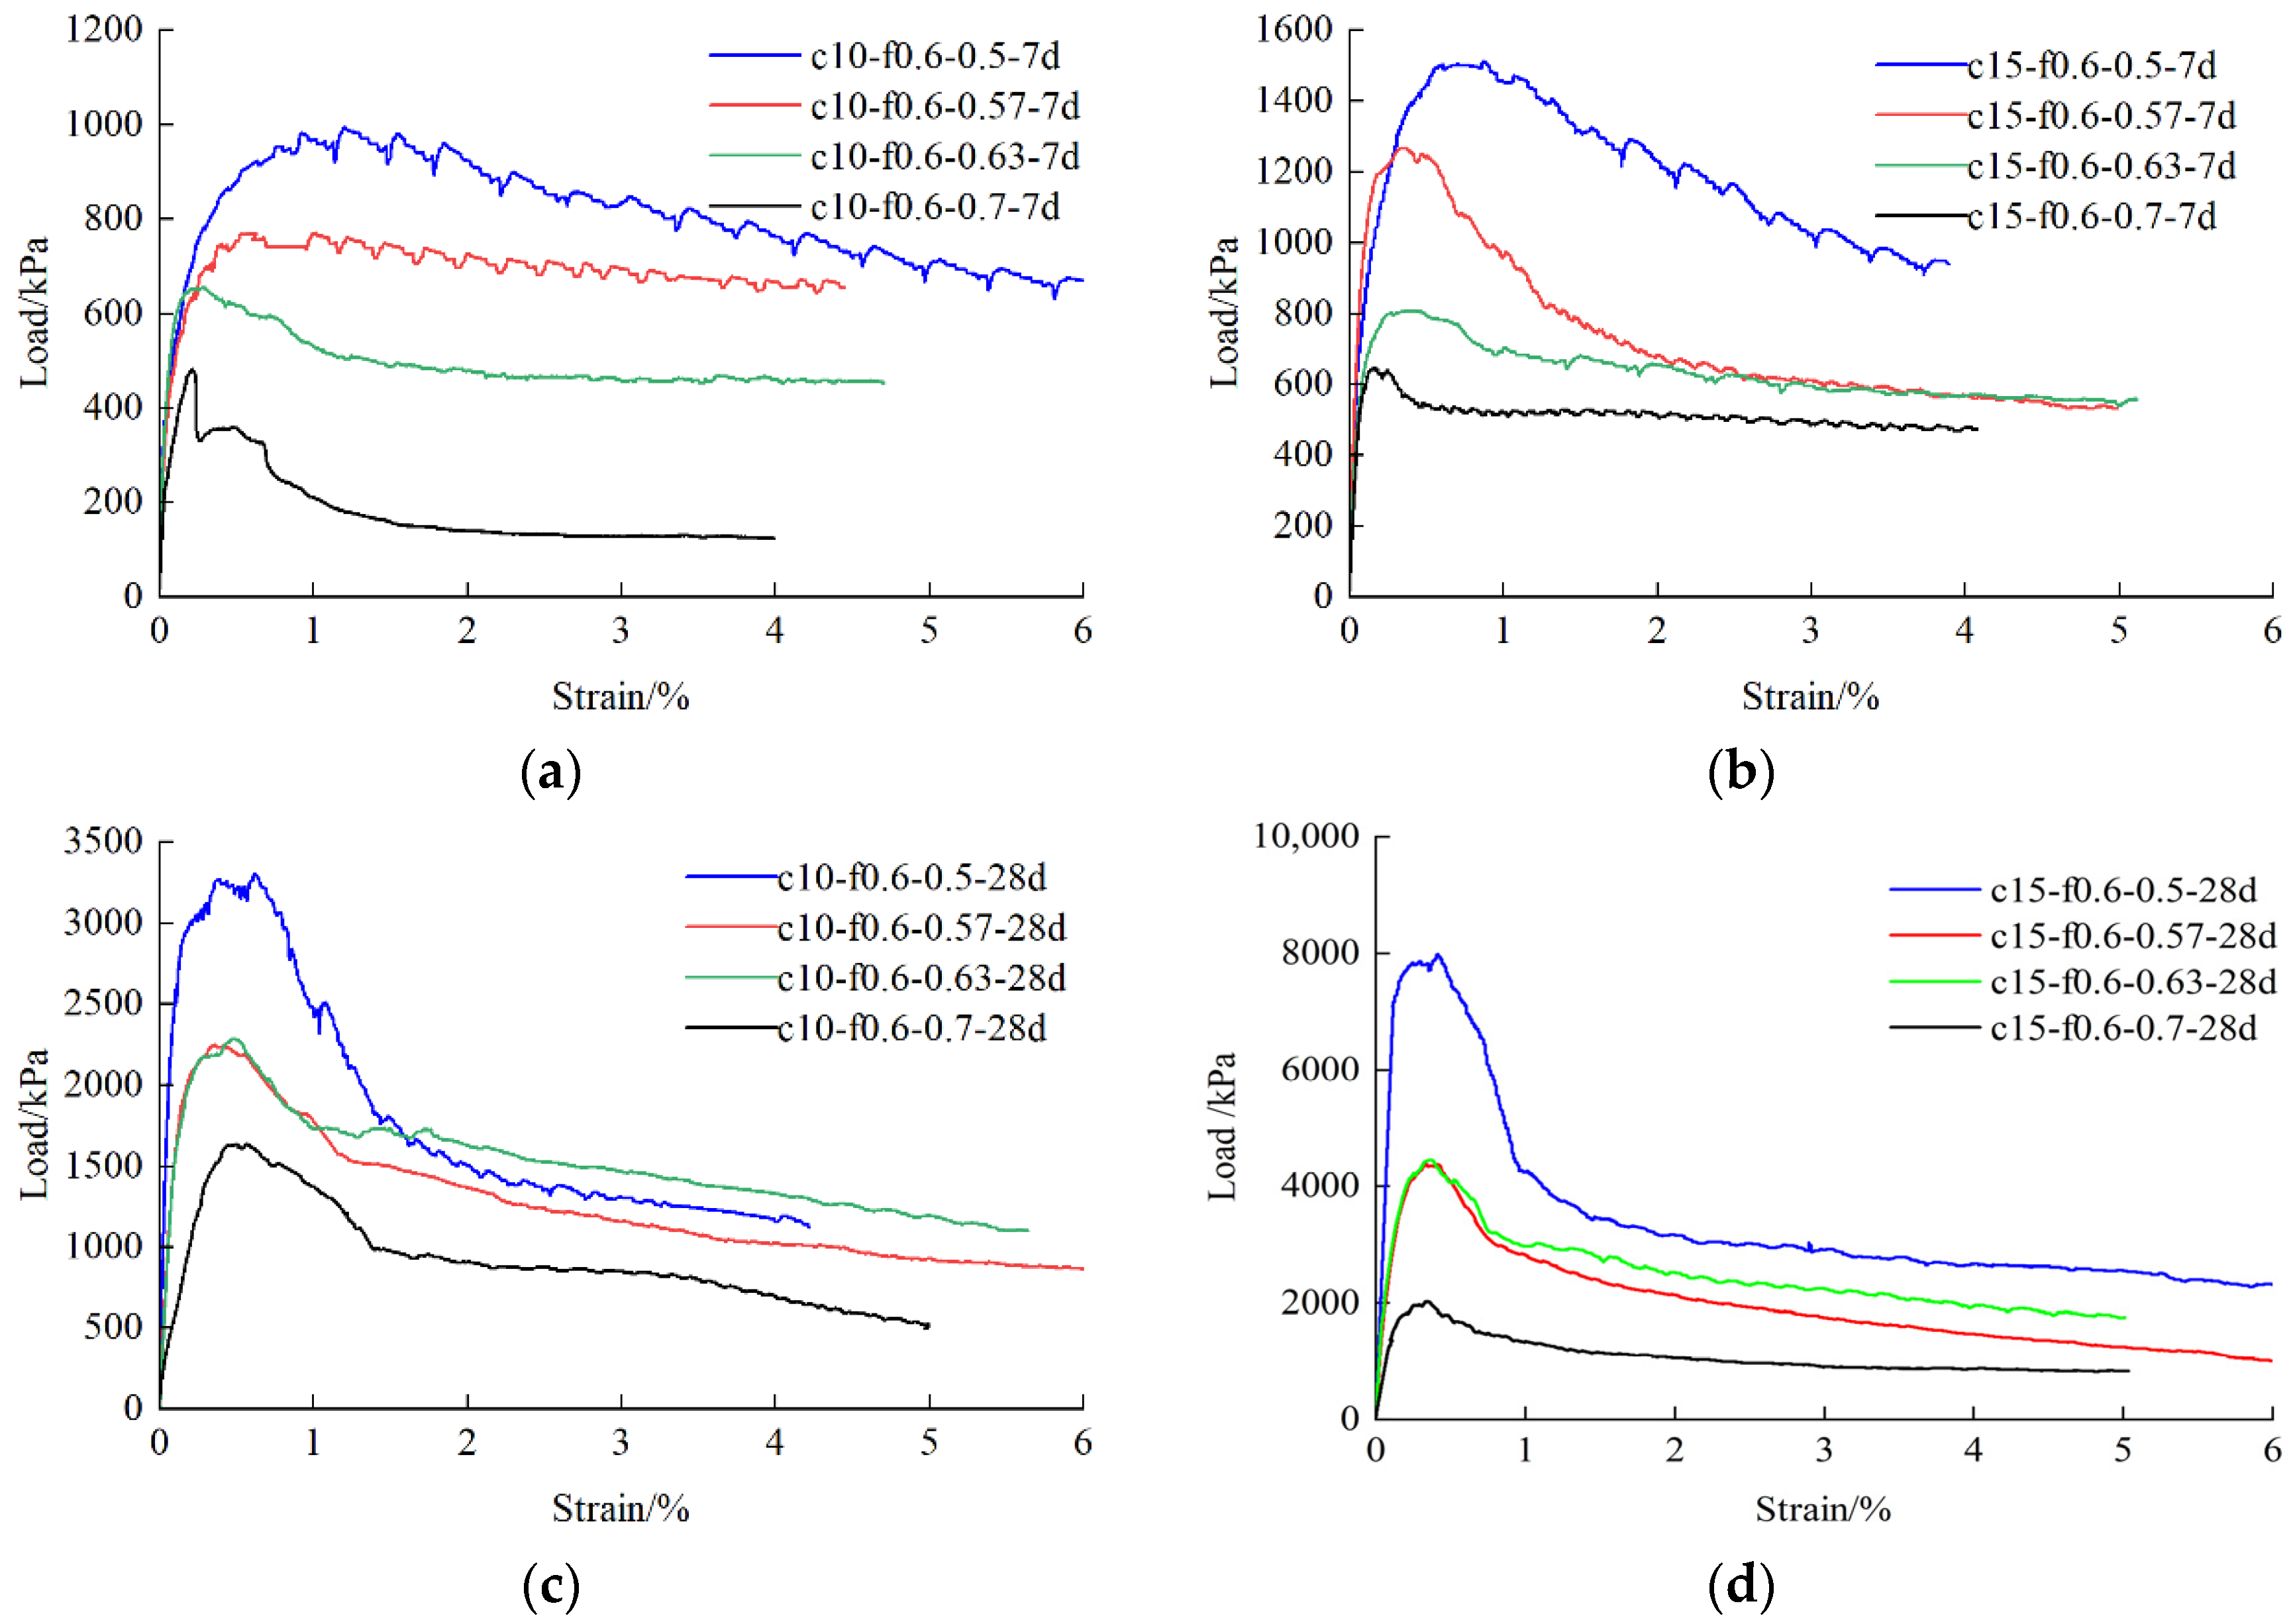
Figure 11 shows the stress-strain curves of the specimens with different moisture contents in the tests. It can be seen that the higher the moisture content of the PVA fiber-reinforced cemented clay, the lower its compressive strength at a given cement content. The specimens with low strength demonstrated a flatter descending segment of the curve. The compressive strength of cemented specimens at t = 7 d was low overall because the hydration reaction of the cement was only partially carried out at the age of 7 d. In addition, the UCS of the specimens differed similarly from each other, indicating a significant effect of moisture content at a given curing time. As the curing time increased to 28 d, the stress-strain curve of the specimen with αw = 57% was close to that of the specimen with αw = 63%, while the stress–strain curve of the specimen with αw = 70% was significantly lower than the above two. The higher moisture content causes the specimens to bleed during sample preparation, resulting in the two specimens with αw = 57% (ρ = 1.72 g/m3) and 63% (ρ = 1.68 g/m3) having similar actual moisture content, leading to similar strengths at 28 days. The specimens with αw = 70% (ρ = 1.63 g/m3) bled more severely, resulting in the loss of some cementitious material and causing a significant further reduction in the strength of the cemented soil.

Figure 11.
Stress–strain curves of the specimens with different moisture contents: (a) αc = 10%, t = 7 d; (b) αc = 15%, t = 7 d; (c) αc = 10%, t = 28 d; (d) αc = 15%, t = 28 d.
3.1.3. UCS
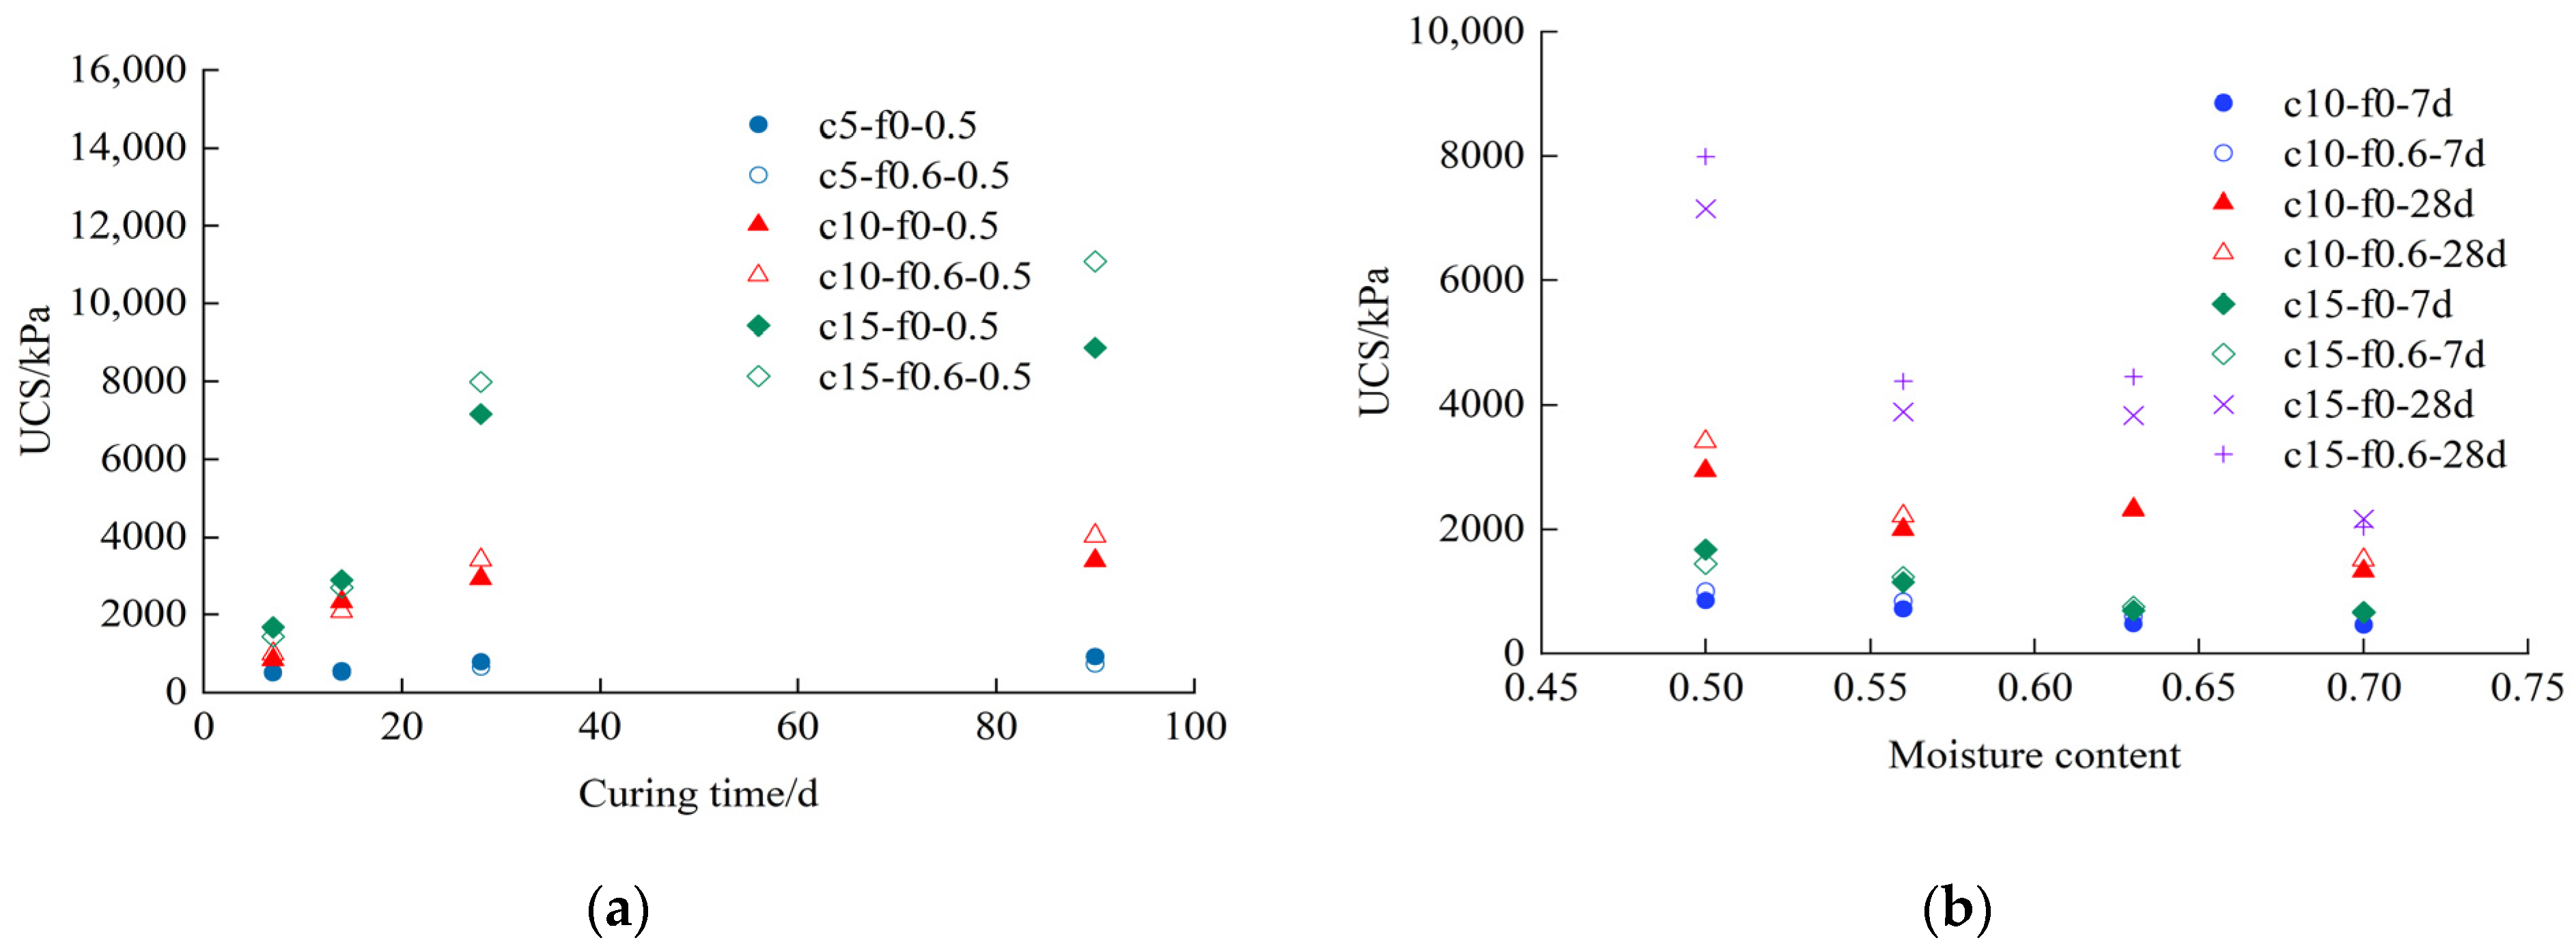
Figure 12a illustrates the variation of compressive strengths at different curing times. The compressive strength of cemented soil increased with the increase of curing age, which increased rapidly in the early stage in general and slowed down in the later stage, especially after 28 days. This is because that hydration reaction was mainly carried out 28 days ago, and the hydration products were filled between the matrix, which improved the compactness of the structure so that the strength of cement soil grows rapidly. Figure 12a also demonstrates the effect of fiber on UCS. At a low cement content of 5%, UCS decreased with the addition of fibers in ratios that varied from 3% to 19%. The low content of cement hydration led to poor bonding properties at the fiber-matrix interface. The incorporation of fiber increased the number of weak interfaces within the matrix. When the influence of weak interfaces was stronger than the reinforcing effect of PVA fibers, the result was a decrease in UCS. However, fiber increased UCS significantly when cement content was higher. For example, the UCS of the specimens with αc = 15% and t = 28 d increased by 15%. The cement hydration within the matrix increased with cement content, resulting in a stronger bond at the fiber–matrix interface. The randomly distributed fibers within the matrix form effective bridging connections, which enhance the overall performance of the cemented soil well.
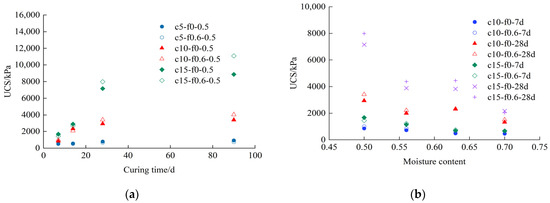
Figure 12.
Effect of curing time and moisture content on UCS: (a) Relation between UCS and curing time; (b) Relation between UCS and moisture content.
The relation between UCS and moisture content is given in Figure 12b. All specimens exhibited an overall trend of UCS decreasing with increasing moisture content. The fiber-reinforced cemented specimens with high cement content were more sensitive to moisture content. For example, when the moisture content was up to 0.7, the strength of αc = 15% fiber cement-cured soil specimens decreased by 75%, while the decrease in strength of αc = 10% cement-cured soil specimens was only 46%. The weakening effect of water content on UCS diminished with decreasing cement content because of the decreasing loss of cementitious materials. In addition, the specimens with moisture content between 0.5 and 0.56 exhibited greater variations of UCS. Because the cementitious materials were diluted and lost when the water content exceeded the liquid limit. The interior of the matrix was not dense enough, resulting in a decrease in strength.
3.2. Effect of Cement and Moisture Contents on STS
3.2.1. Failure Modes
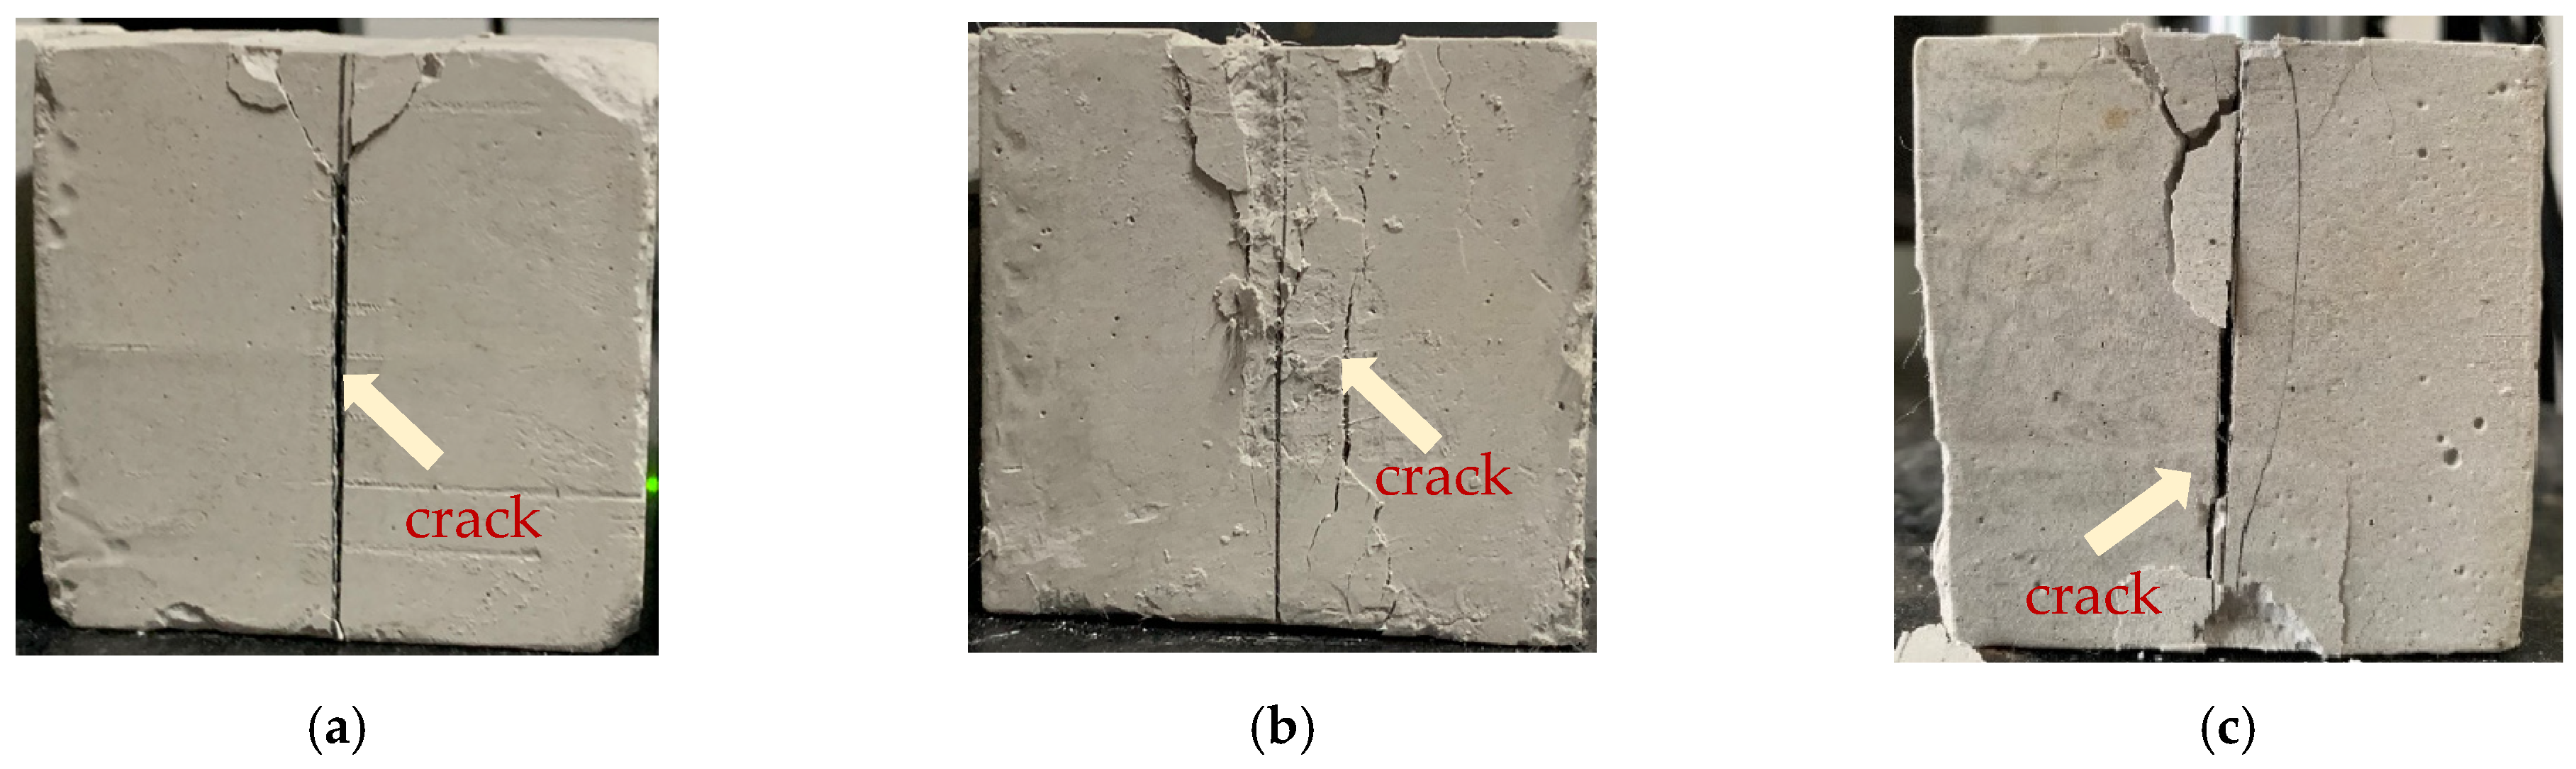
Figure 13 shows the failure modes of specimens in the split tensile tests. The cemented specimens were subjected to pressure on their upper and lower surfaces, and the whole specimen cracked when it reached the limit state (Figure 13a). The fiber-reinforced cemented specimens showed splitting cracks without brittle fracture. The fibers at the cracks were partially pulled or broken, but the specimen remained intact (Figure 13b). This suggests that the incorporation of fiber can increase the load-bearing capacity of cemented soils and limit crack development. In addition, the cracks in the fiber-reinforced cemented specimens with lower water content were similar to those in the cemented soil without fiber. However, those cemented specimens still maintained a certain degree of integrity in the wider crack state because of the participation of fibers (Figure 13c).
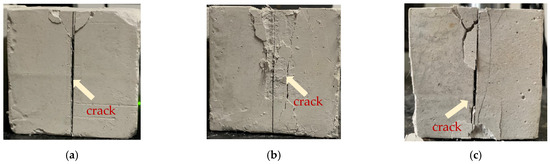
Figure 13.
Failure modes of specimens under splitting tension load: (a) αc = 15%, αf = 0%, αw = 63%; (b) αc = 15%, αf = 0.6%, αw = 63%; (c) αc = 15%, αf = 0.6%, αw = 50%.
3.2.2. STS
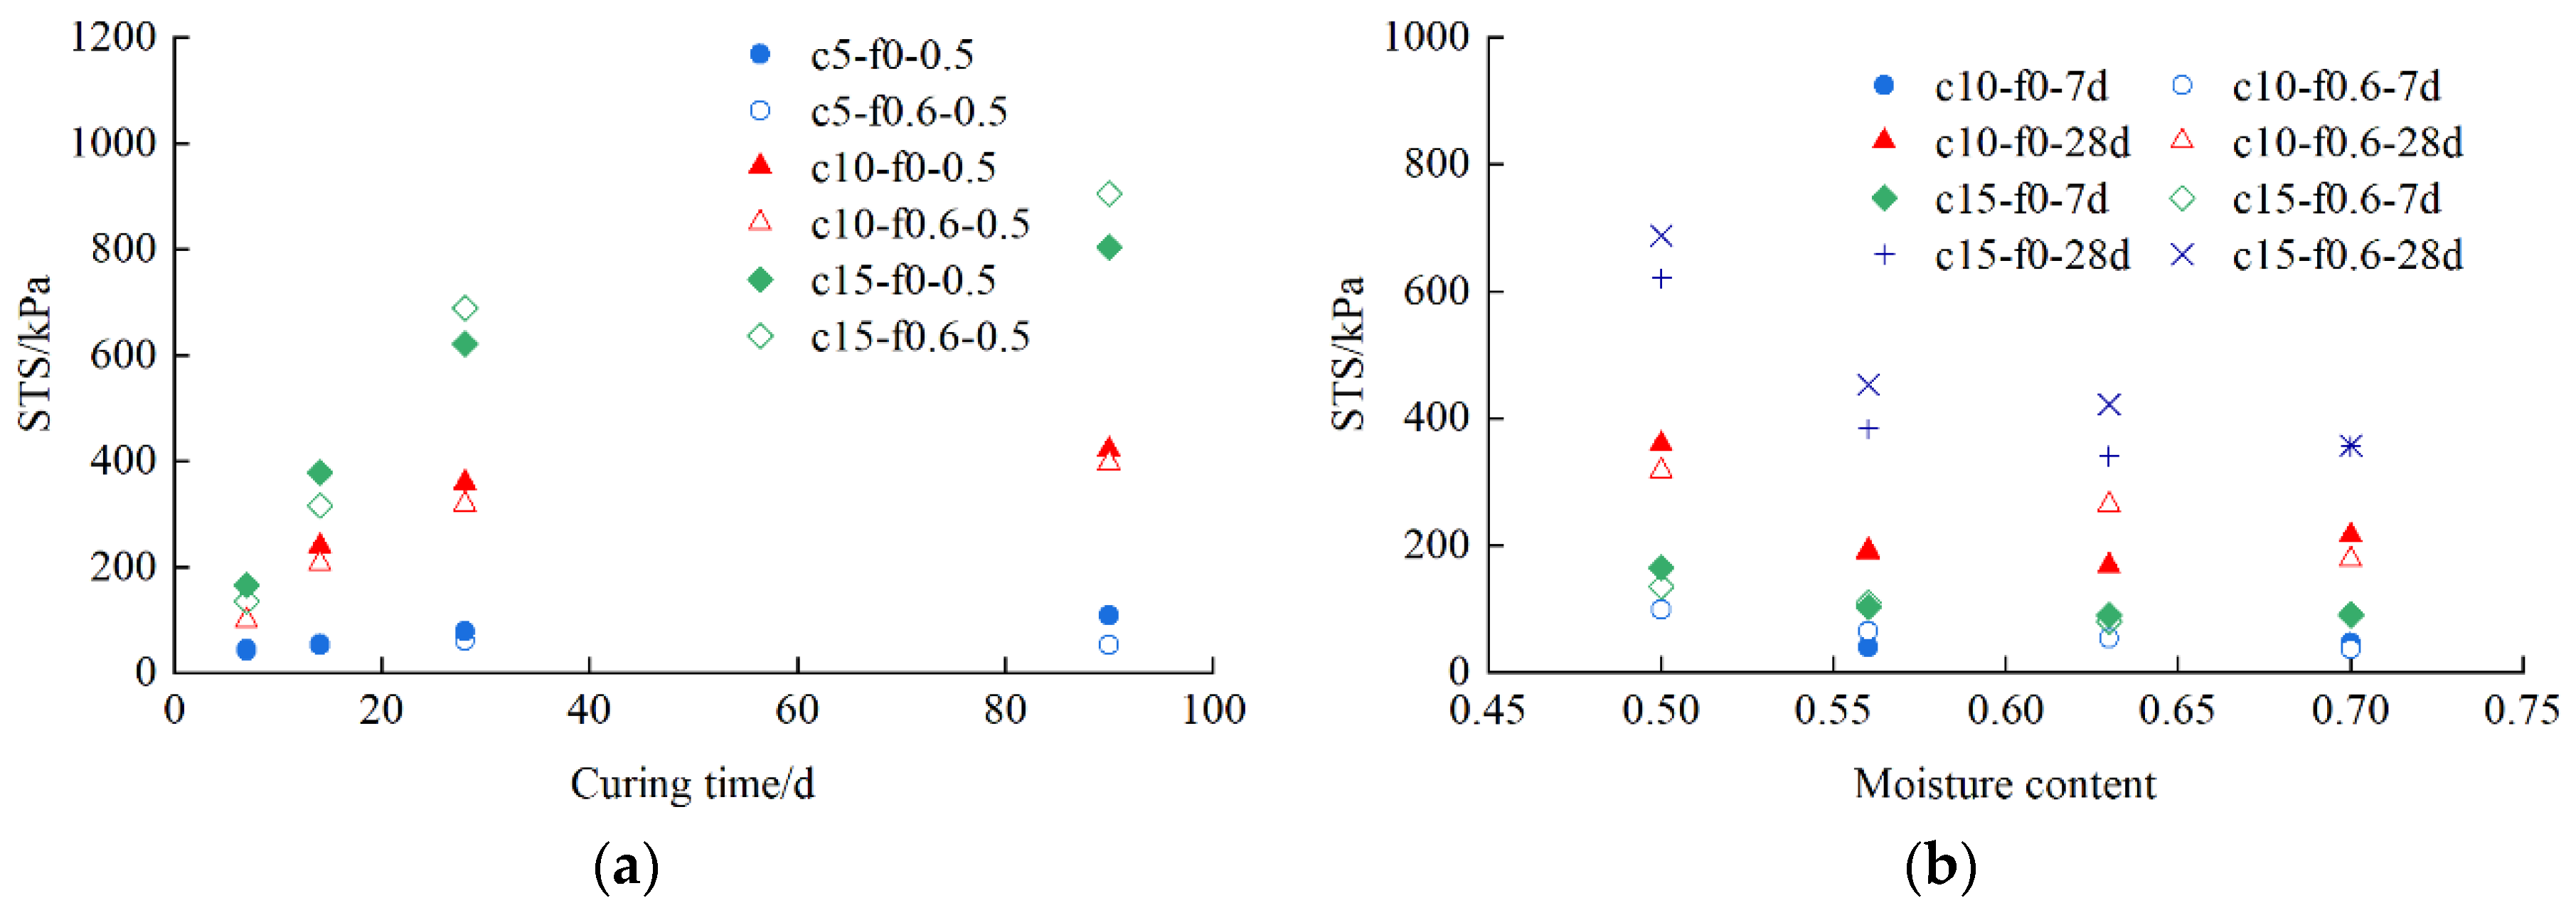
Figure 14 shows the variations of the specimens’ STS with different curing times and moisture contents. In Figure 14a, STS of fiber-reinforced cemented specimens with αc = 15% can be seen to increase by −18%, −17%, 11%, and 13%, respectively, compared to cemented soil when curing time was increased from 7 d to 28 d. The hydration reaction produced more gelling material to fill in the matrix and improve the densification of the cemented soil because of the prolonged curing time. As a result, bond strength between fibers and matrix was improved with high cement content. However, when the cement content was lower than 15%, the STS showed a decreasing trend, and the tensile strength of the fibers was not significantly exerted, but the overall strength of the matrix decreased. In Figure 14b, a negative correlation can be seen between STS and water content, e.g., STS of specimens with αc = 15% decreased significantly with increased water content, which weakened the fiber reinforcement. This is because the bond strength at the fiber-matrix interface decreased, and the fibers slipped and failed to function effectively under localized tensile stresses. When the cement content is low and the curing time is short, the fibers increase the number of weak interface bonds and lead to a slight decrease in STS. If the tensile strength of the cement soil wall is not enough during pit and slope support works, it is easy to crack and expand, which in turn indirectly affects the safety of the project.
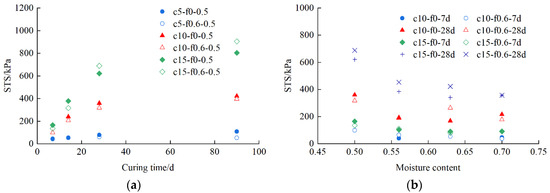
Figure 14.
Effect of curing time and moisture content on STS: (a) Relation between STS and curing time; (b) Relation between STS and moisture content.
3.3. Effect of Cement and Moisture Content on Flexural Behavior
3.3.1. Failure Modes
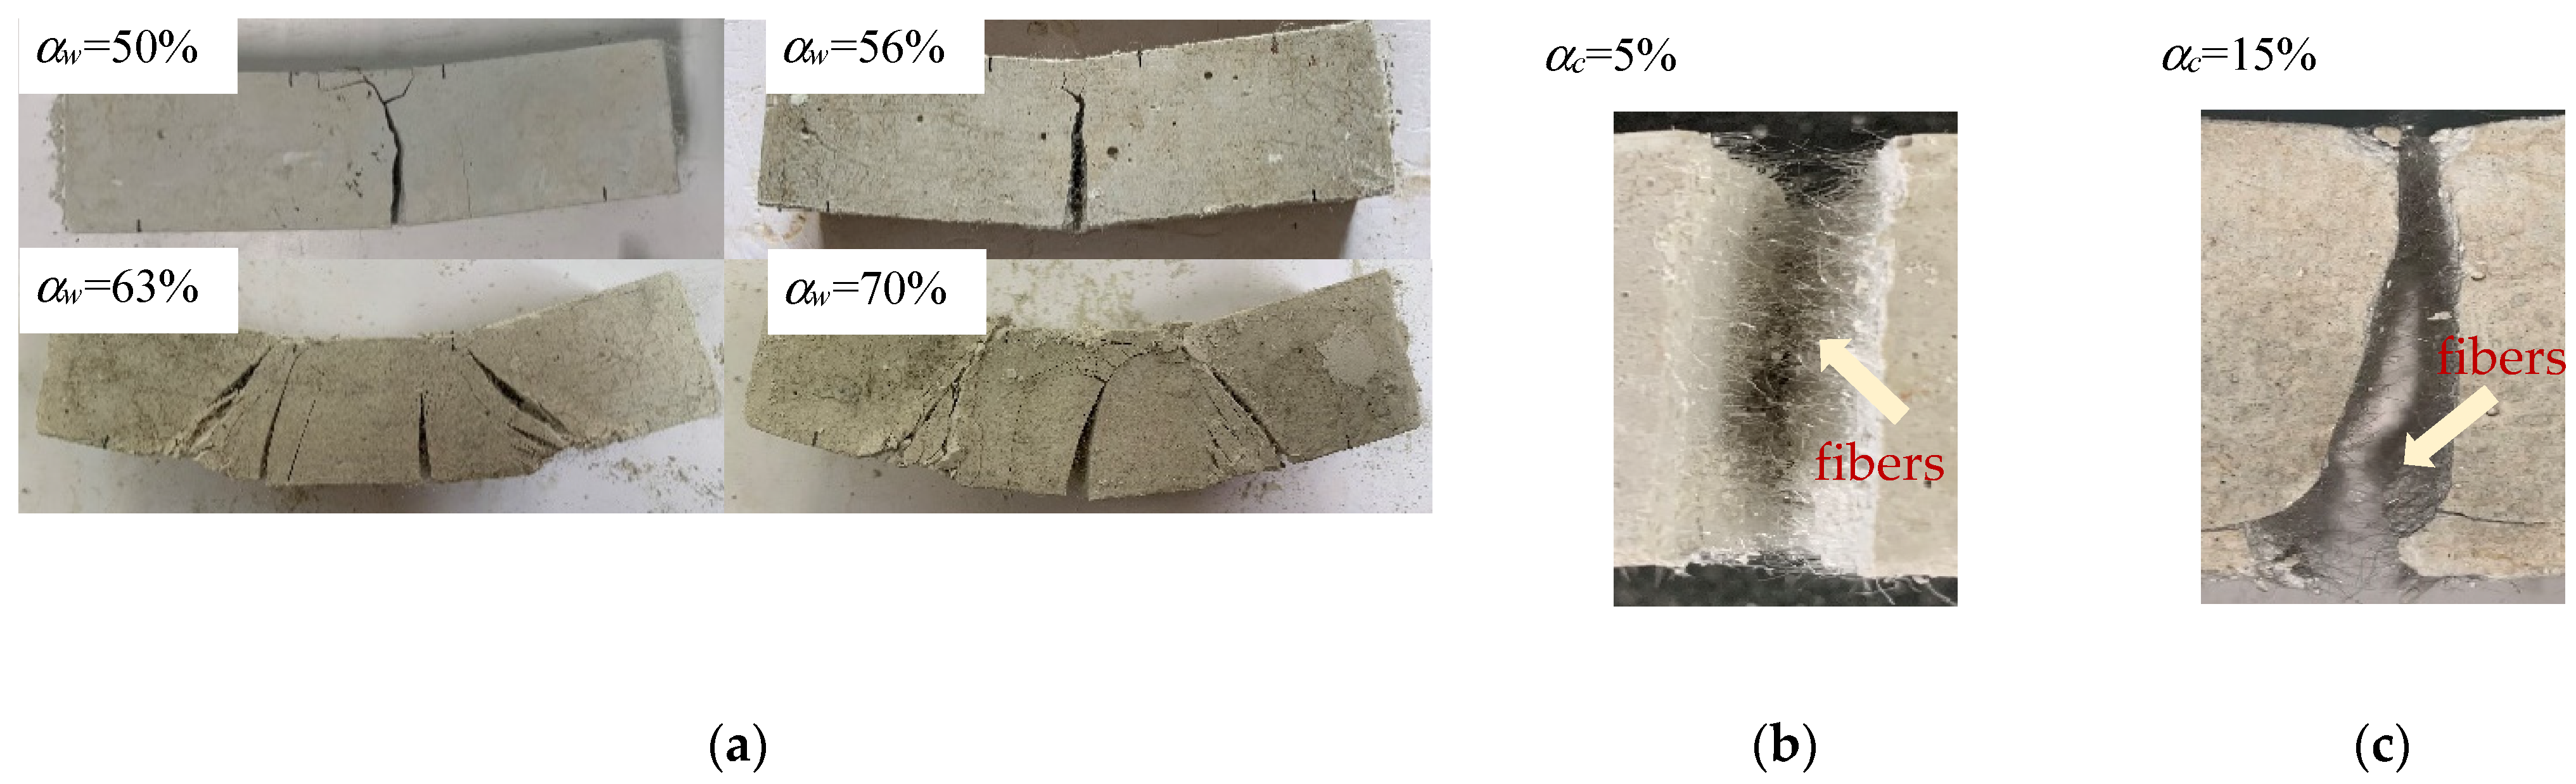
Figure 15 shows the failure patterns of fiber-reinforced cemented specimens under bending. As shown in Figure 15a, the specimens cracked in a bending process without brittle fracture. The tensile stresses continued to be carried by the fibers after cracking, which presented as a gradually expanding mid-span bending crack. As the water content increased, the failure modes of the specimens changed from a single main crack to a multiple-crack extension pattern. This is because when the water content was low, the brittle failure characteristics of the specimen were more obvious, and the crack was single. After the gradual increase of water content, the specimen was more ductile and had better deformation ability. The smaller cracks developed after bending damage, and the lower flexural strength of specimens with high water content was also one of the reasons for the development of small cracks. As shown in Figure 15b, when the cement content was low (αc = 5%), the adhesion of fiber-matrix interfaces was poor, and most of the fibers were pulled out after small cracks. When the cement content was raised to 15%, the interfacial bond was better, and flexural strength was larger. After the specimen cracked, the fibers continued to carry the load until the creaks expanded, and most of the fibers were pulled off.
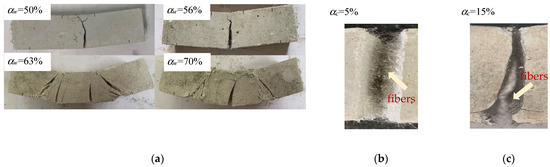
Figure 15.
Flexural failure modes of fiber-reinforced cemented specimens: (a) αc = 15%, αf = 0.6%, t = 28 d; (b) αf = 0.6%, αw = 50%, t = 90 d; (c) αf = 0.6%, αw = 50%, t = 90 d.
3.3.2. Flexural Strength
Flexural strength has a significant effect on the cracking resistance of structures such as cement-cured soil retaining walls as well as foundation liners. Table 5 shows the flexural strength of the fiber-reinforced cemented clay at t = 28 d. The flexural strength at αw = 50% increased with the cement content. After matrix cohesion and fiber interfacial bonding increased, the bridging effect of fibers was exerted. It is noteworthy that the growth rate of flexural strength of the fiber-reinforced cemented specimens compared to that of the cemented specimens decreased as the cement content increased from 5% to 15%, e.g., the growth rate of specimens with αf = 0.6% fiber decreased from 370% to 141%. When the fibers’ interfacial bonding increased, the fibers were beginning to be pulled off after cracking under the bending load, and the enhancement effect of fiber bridging was fully functional.
Table 5.
Bending capacity (αf = 0.6%, 28 d).
Table 5 also shows the correlation between the flexural strength of the fiber-reinforced cemented specimens and their water content. Flexural strength decreased with increasing water content and the same cement content. The growth rate of the flexural strength of the fiber-reinforced cemented specimens decreased from 262% to 174% when their moisture content was increased from 0.5 to 0.7. However, the fibers were still beneficial in improving the flexural strength of the specimens compared to the cement-cured soil specimens.
3.3.3. Load–Deflection Curves
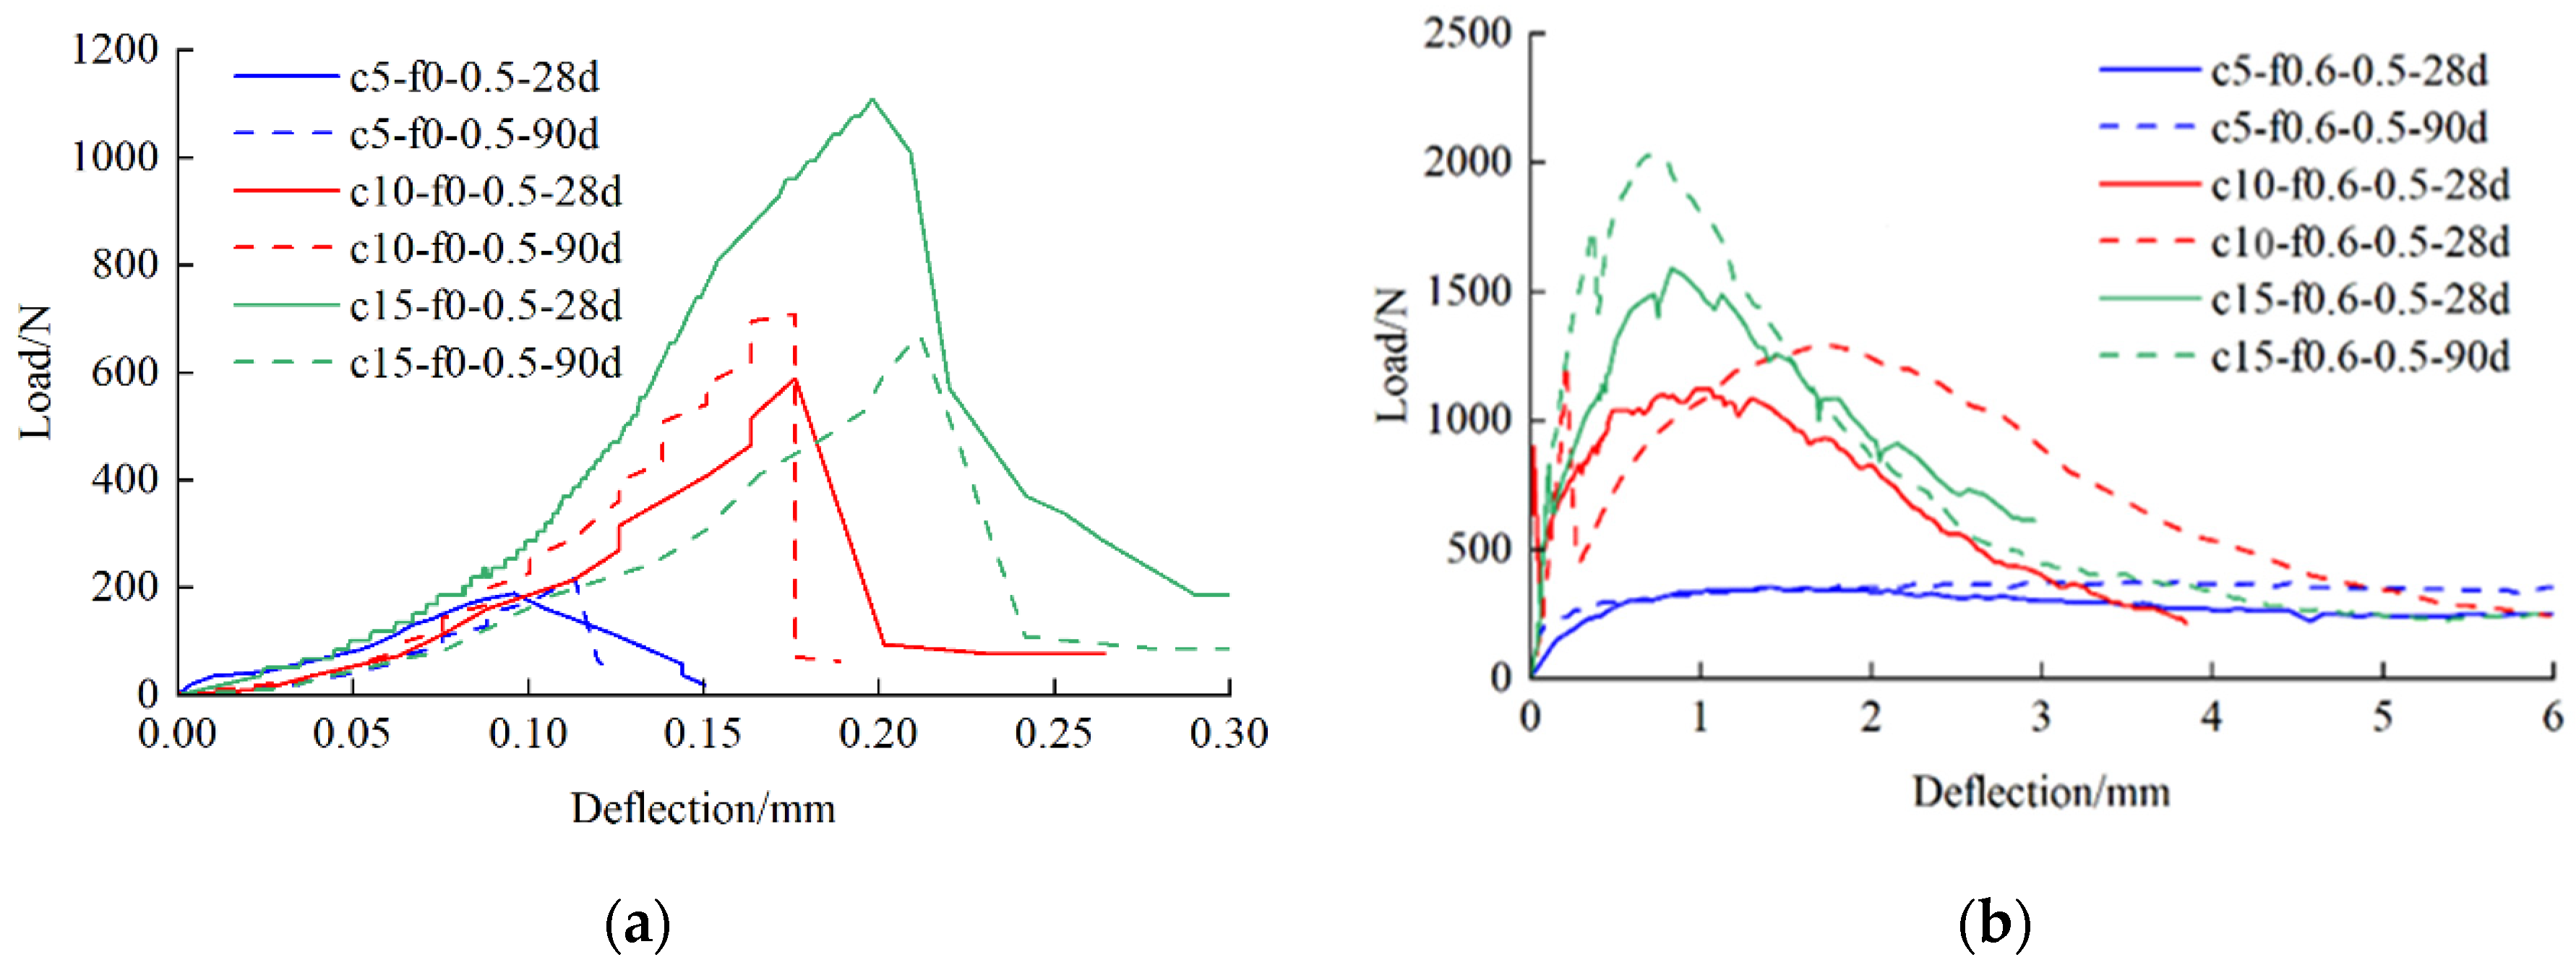
Figure 16 shows the load-deflection curves of specimens at t = 28 d and t = 90 d. Compared to the cemented soil specimen (Figure 16a), the flexural strength and deformability of the cemented soil were greatly improved by adding fiber (Figure 16b), exhibiting an obvious bending-hardening phase. Figure 16b also shows that cracking load, peak strength, and residual resistance gradually increased with increased cement content. The specimens with αc = 5% had flatter curves and showed greater plasticity at the deflection interval of 6 mm without significant peak loads. When αc increased to 15%, the peak load was greatly enhanced due to the action of the fiber. However, the deformability of the specimens became poor because the fibers were pulled off instead of pulled out. Considering the effect of cement content on flexural strength and cracking during hardening, it is recommended to select a cement content of 10%.
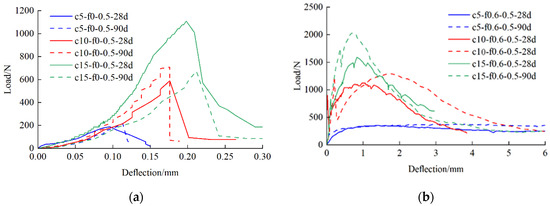
Figure 16.
Bending curves of the specimens with different curing times: (a) αf = 0%, αw = 50%; (b) αf = 0.6%, αw = 50%.
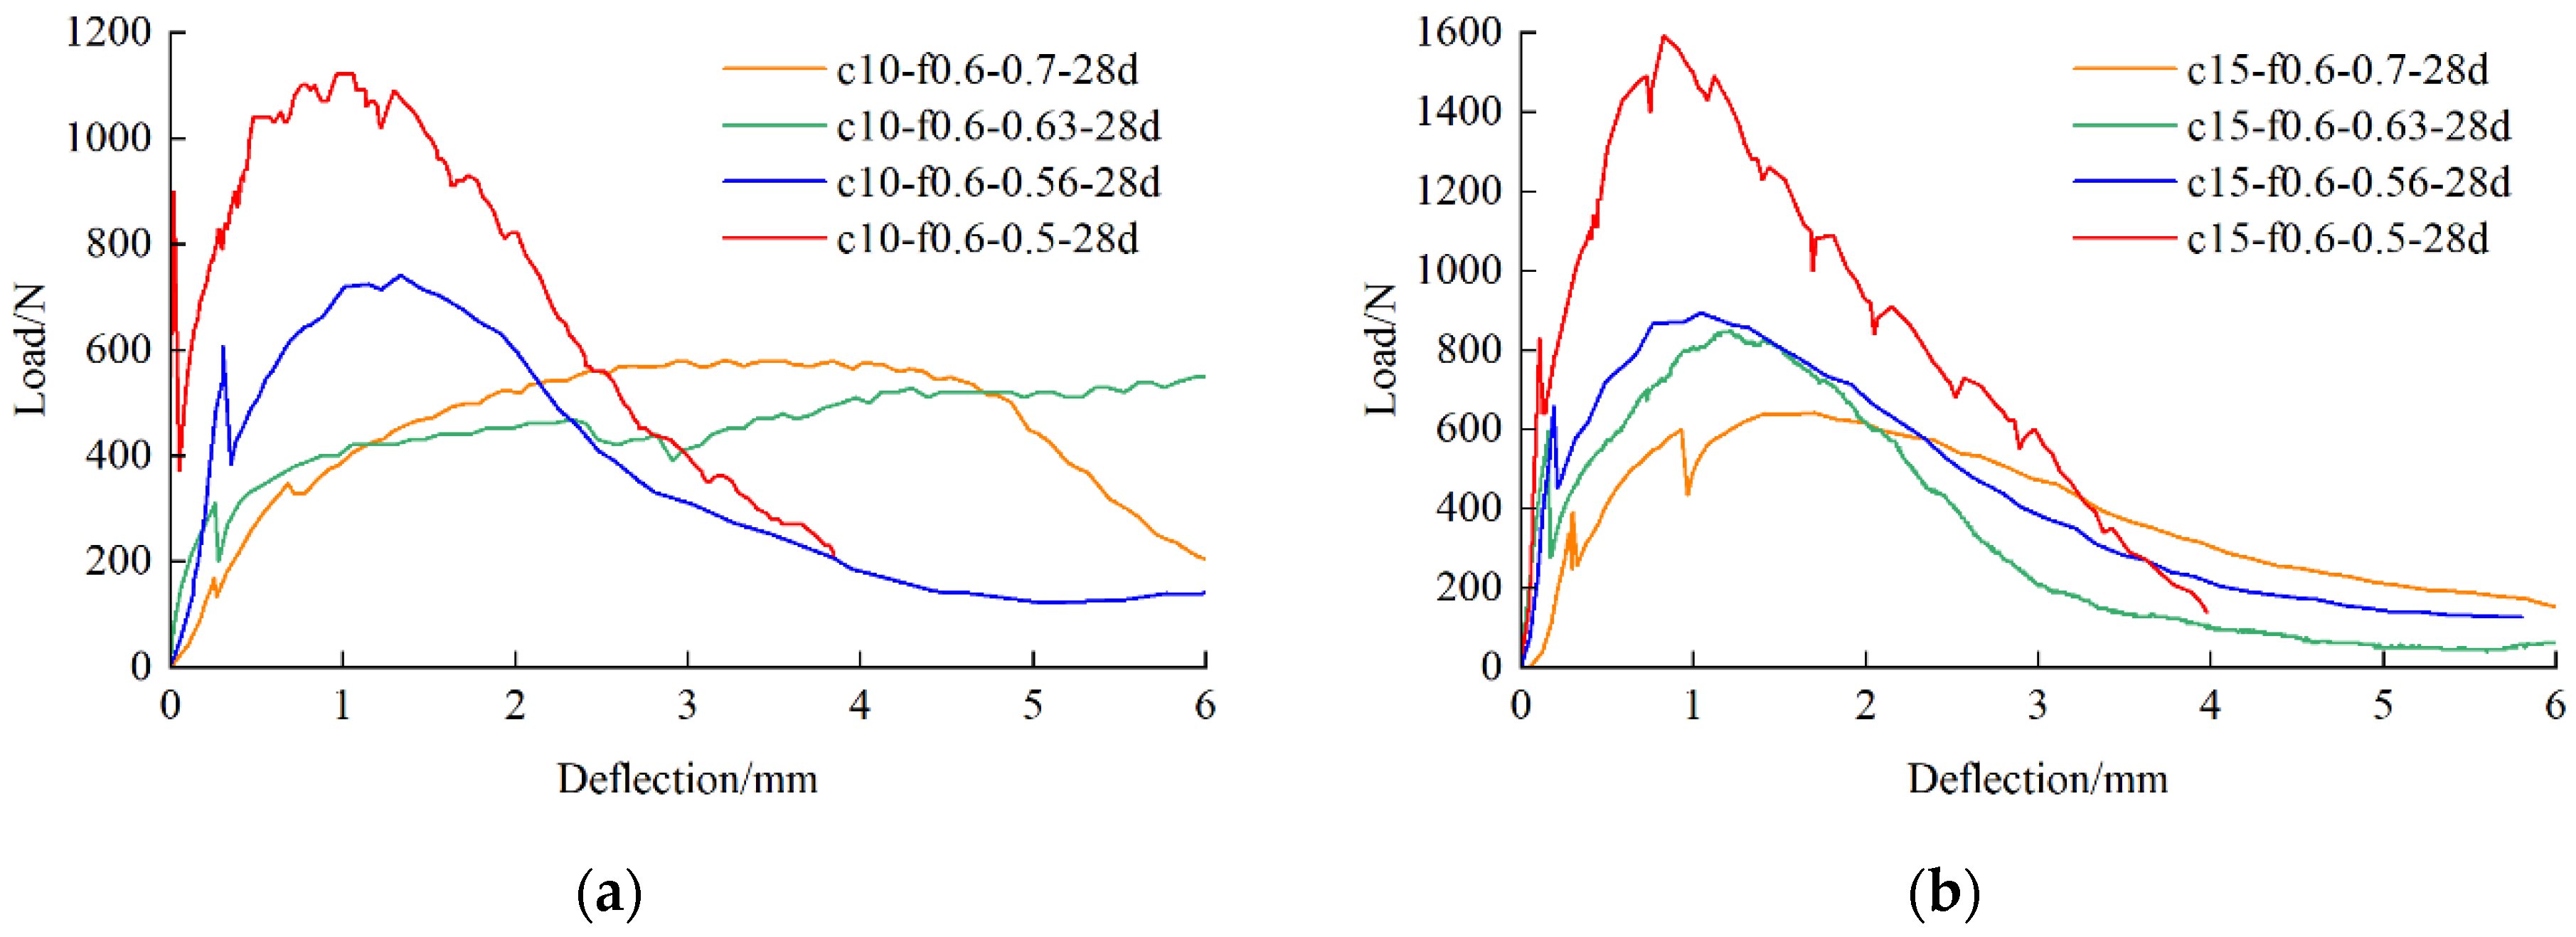
Figure 17 gives the load–deflection curves of specimens with different moisture contents. As the moisture content increased from 50% to 70%, the cracking load and peak load tended to decrease, the deformability of the specimens increased, and the load–deflection curve tended to flatten out. Increased water content reduced the strengthening phase after cracking. The weakening effect of moisture content on peak strength increased when αc = 15%, especially in the 50%–56% moisture content interval, where it was most pronounced because in this interval of moisture content, the bearing mechanism of fibers at the limit-state of the specimen shifted from pullout to pulloff. In contrast, the cracking load was relatively little affected by the water content.
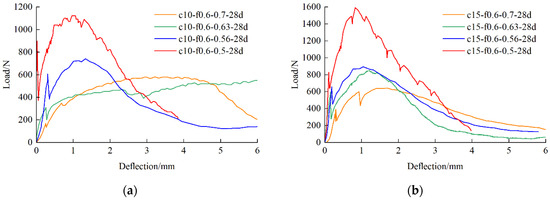
Figure 17.
Bending curves of specimens with different moisture contents: (a) αc = 10%, αf = 0.6%; (b) αc = 15%, αf = 0.6%.
3.3.4. Toughness Analysis
Figure 18 illustrates the bending toughness indexes of the specimens at different curing times. The results indicated that the bending toughness of the specimens increased with curing time. For example, when curing time increased from 28 d to 90 d, A(0.5) of the specimen with αc = 5% increased by 41%, whereas the specimen with αc = 15% increased by 47%. In general, the cement content was the main factor affecting the flexural energy consumption of the specimens, especially in the interval of αc = 5% to αc = 10%; the growth of bending toughness was significant. With the increase in cement dosage, the bond between the cement-cured soil matrix and the fibers becomes stronger. The tensile strength of the fiber itself could be gradually played, delaying the expansion of cracks, which in turn was expressed as an increase in bending toughness.
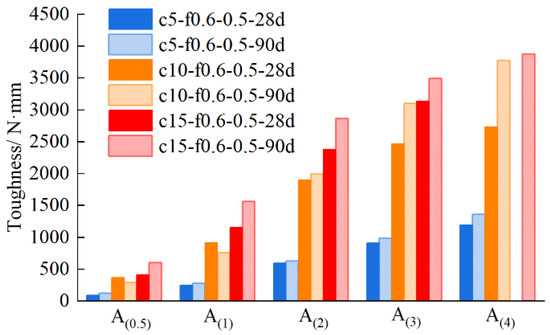
Figure 18.
Toughness indexes at different curing times.
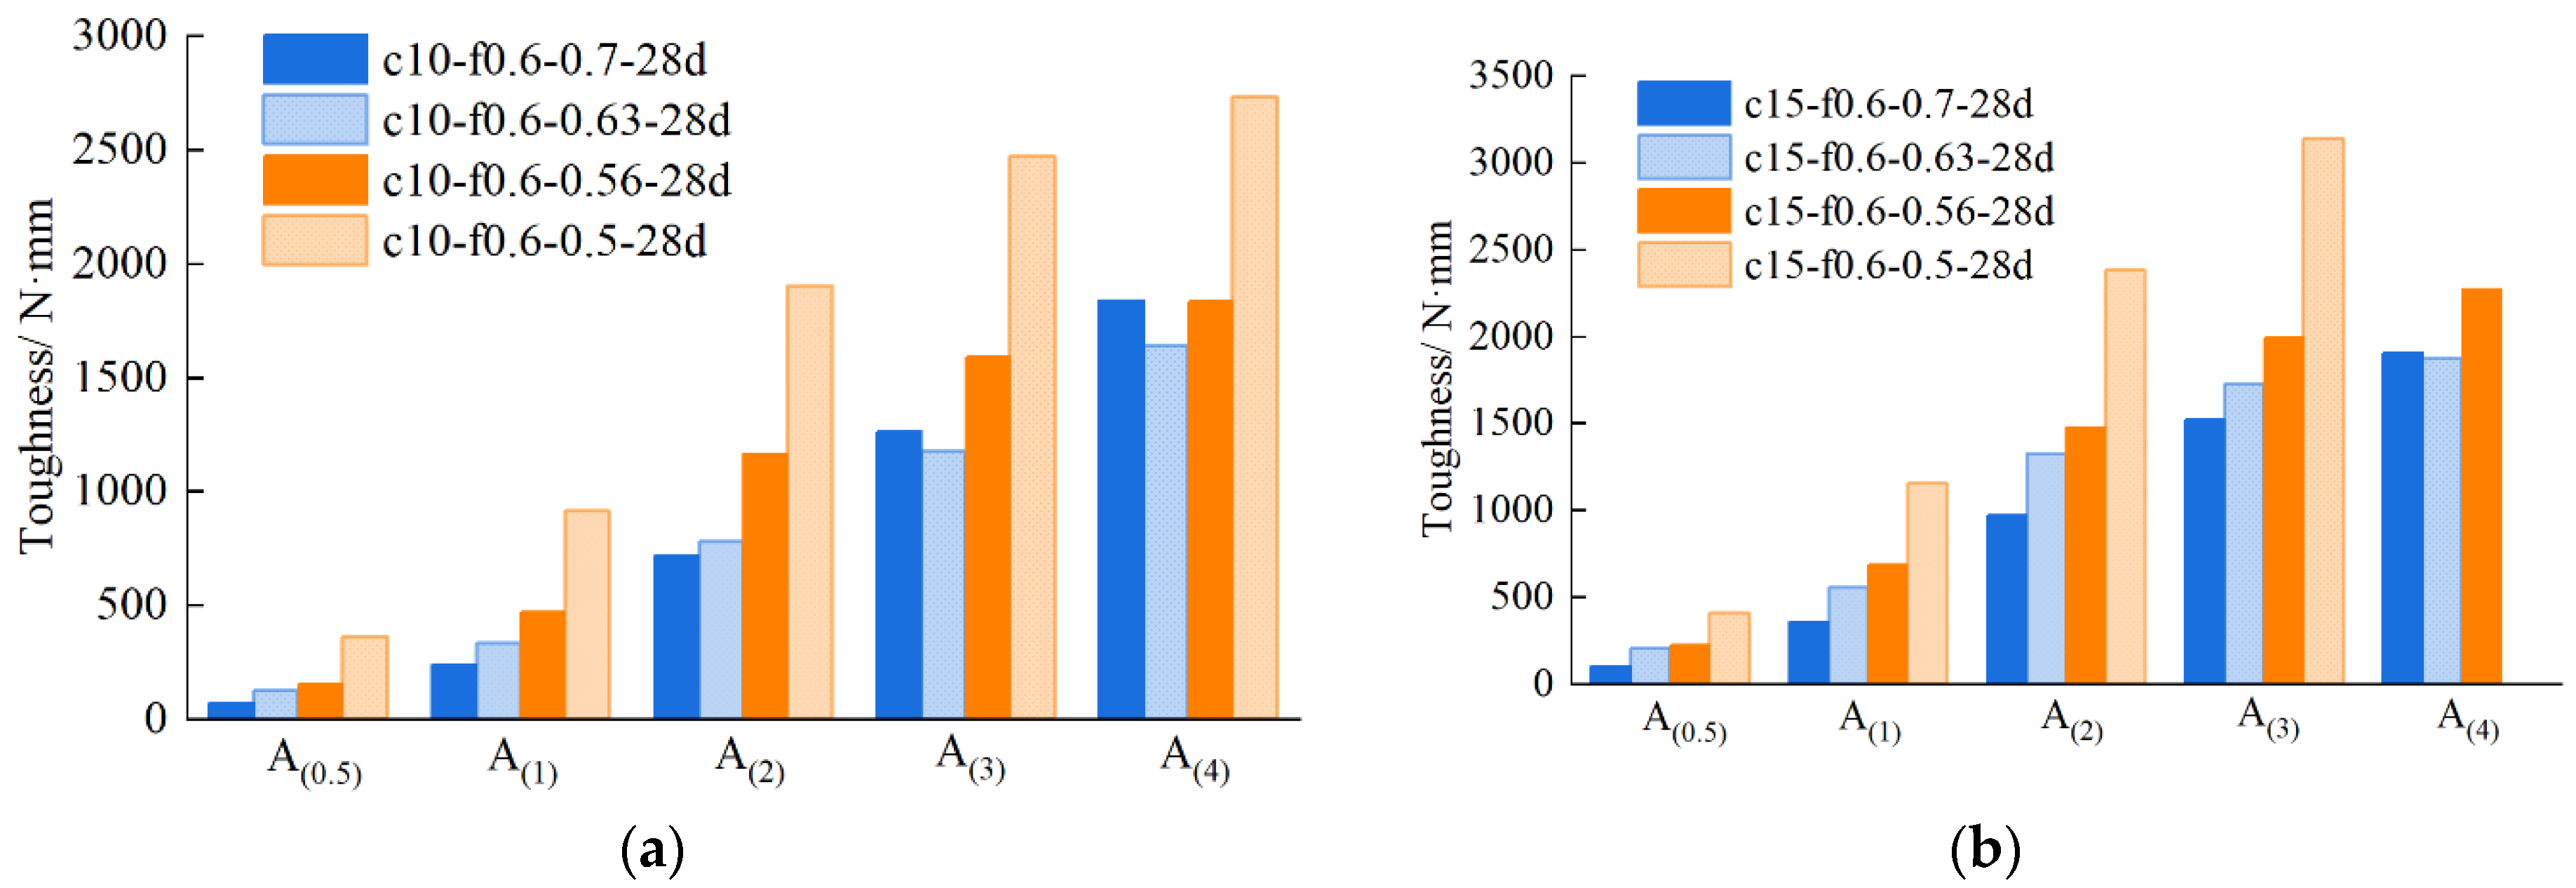
Figure 19 shows the variation of bending toughness indexes with water content. Toughness basically has a negative correlation with water content. Lower moisture content resulted in higher matrix strength, which has a significant enhancement effect on cracking loads (see Figure 17a). In the ensuing strengthening phase, the fibers were involved in tensile resistance, leading to the continuous growth of bending toughness, as shown in Figure 19b, which shows that the effect of water content on toughness reflected a more regular negative correlation when the cement content was raised to 15%. The toughness of the specimens with αw = 50% showed a notable advantage, and the greater interfacial adhesion ensured the enhancing effect of the fiber.
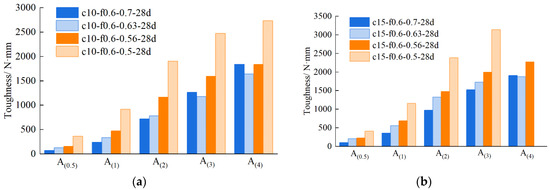
Figure 19.
Toughness indexes with different moisture contents: (a) αc = 10%; (b) αc = 15%.
4. Conclusions
The experimental work presented in this paper was designed to study the mechanical properties of PVA fiber-reinforced cemented kaolin clay. Unconfined compression tests, split tensile tests, and flexural tests were conducted. The conclusions achieved are as follows:
- (a)
- The fibers can effectively improve the deformability of cement-cured soil during unconfined compression tests due to the bridging effect. With increasing cement content, the enhancement of peak and post-peak strength of UCS by fiber tended to become more significant with curing time, but ductility decreased. Simultaneously, the weakening effect of water content on UCS tended to become more obvious. The lower-strength specimens had better load-holding capacity;
- (b)
- The fiber-reinforced cemented specimens showed splitting cracks without brittle fracture. The fibers at the cracks were partially pulled or broken, but the specimen remained intact. STS of fiber-reinforced cemented specimens with αc = 15% increased by 11% compared to cemented soil when the curing time was increased to 28 d;
- (c)
- As the water content increased, the failure modes of the specimens changed from a single main crack to a multiple crack extension pattern in the bending process because of the low strength. Cracking load, peak, and post-peak strength gradually increased with the increase in cement content, but the deformability of the specimens became poor. Thus, 10% cement content is recommended for this soil;
- (d)
- Cement content and curing time improve the overall cracking resistance of fiber-reinforced cemented specimens under varies loading. Cement is the main factor affecting bending toughness. Especially in the interval of αc = 5% to αc = 10%, the growth of bending toughness was significant, and the enhancing effect of the fiber began to be seen. The toughness advantage of the specimen with αw = 50% is obvious, and the best reinforcement of the fiber is achieved.
Author Contributions
Conceptualization, T.H.; Methodology, T.H.; Software, T.H.; Validation, L.H.; Formal analysis, T.H.; Resources, L.H.; Writing—original draft, Z.Y.; Writing—review & editing, C.X.; Supervision, L.H. and G.D.; Funding acquisition, T.H. and G.D. All authors have read and agreed to the published version of the manuscript.
Funding
This research was funded by the National Natural Science Foundation of China, Grant No. 52178201.
Data Availability Statement
The original contributions presented in the study are included in the article material; further inquiries can be directed to the corresponding author.
Conflicts of Interest
The authors declare no conflicts of interest.
References
- Ling, H.I.; Leshchinsky, D.; Tatsuoka, F. Reinforced Soil Engineering: Advances in Research and Practice; Marcel Dekker Inc.: Boca Raton, FL, USA, 2003. [Google Scholar] [CrossRef]
- Prabakar, J.; Dendorkar, N.; Morchhale, R.K. Influence of fly ash on strength behavior of typical soils. Constr. Build. Mater. 2004, 18, 263–267. [Google Scholar] [CrossRef]
- Cai, Y.; Shi, B.; Ng, C.W.W.; Tang, C.S. Effect of polypropylene fibre and lime admixture on engineering properties of clayey soil. Eng. Geol. 2006, 87, 230–240. [Google Scholar] [CrossRef]
- Chen, D.; Liao, Y.D.; Jiang, C.H.; Feng, X.G. The Mechanical Properties of Coastal Soil Treated with Cement. J. Wuhan Univ. Technol. 2013, 28, 1155–1160. [Google Scholar] [CrossRef]
- Ghadakpour, M.; Choobbasti, A.J.; Kutanaei, S.S. Experimental study of impact of cement treatment on the shear behavior of loess and clay. Arab. J. Geosci. 2020, 13, 184–194. [Google Scholar] [CrossRef]
- Yazici, M.F.; Keskin, S.N. A review on soil reinforcement technology by using natural and synthetic fibers. J. Sci. Technol. 2021, 14, 631–663. [Google Scholar] [CrossRef]
- Aiban, S.A. A study of sand stabilization in eastern saudi arabia. Eng. Geol. 1994, 38, 65–97. [Google Scholar] [CrossRef]
- Kolias, S.; Kasselouri-Rigopoulou, V.; Karahalios, A. Stabilisation of clayey soils with high calcium fly ash and cement. Cem. Concr. Compos. 2005, 27, 301–313. [Google Scholar] [CrossRef]
- Allahverdi, A.; Mahinroosta, M. A model for prediction of compressive strength of chemically activated high phosphorous slag content cement. Int. J. Civ. Eng. 2014, 12, 481–487. [Google Scholar]
- Gumuşer, C.; Senol, A. Effect of fly ash and different lengths of polypropylene fibers content on the soft soils. Int. J. Civ. Eng. 2014, 12, 168–178. [Google Scholar]
- Kobayashi, M.; Issa, U.H.; Ahmed, A. On the compressive strength and geo-environmental properties of MC-clay soil treated with recycled bassanite. Int. J. Civ. Eng. 2015, 13, 54–61. [Google Scholar]
- Abdi, M.R.; Mirzaeifar, H. Effects of Discrete Short Polypropylene Fibers on Behavior of Artificially Cemented Kaolinite. Int. J. Civ. Eng. 2016, 14, 253–262. [Google Scholar] [CrossRef]
- Wang, Y.X.; Guo, P.P.; Ren, W.X.; Yuan, B.X.; Yuan, H.P.; Zhao, Y.L.; Shan, S.B.; Cao, P. Laboratory Investigation on Strength Characteristics of Expansive Soil Treated with Jute Fiber Reinforcement. Int. J. Geomech. 2017, 17, 04017101. [Google Scholar] [CrossRef]
- Ghadakpour, M.; Choobbasti, A.J.; Kutanaei, S.S. Investigation of the Kenaf fiber hybrid length on the properties of the cement-treated sandy soil. Transp. Geotech. 2020, 22, 100301. [Google Scholar] [CrossRef]
- Basha, E.A.; Hashim, R.; Mahmud, H.B.; Muntohar, A.S. Stabilization of residual soil with rice husk ash and cement. Constr. Build. Mater. 2005, 19, 448–453. [Google Scholar] [CrossRef]
- Park, S.S. Effect of fiber reinforcement and distribution on unconfined compressive strength of fiber-reinforced cemented sand. Geotext. Geomembr. 2009, 27, 162–166. [Google Scholar] [CrossRef]
- Wang, Q.; Tang, R.; Cheng, Q.; Wang, X.K.; Liu, F.L. Research on Static Triaxial Mechanical Properties of New CementSoil Reinforced with Polypropylene Fiber. Adv. Mater. Sci. Eng. 2014, 2014, 532327. [Google Scholar] [CrossRef]
- Kumar, A.; Gupta, D. Behavior of cement-stabilized fiber-reinforced pond ash, rice husk ash–soil mixtures. Geotext. Geomembr. 2016, 44, 466–474. [Google Scholar] [CrossRef]
- Kazemian, S.; Huat, B.B.; Arun Prasad, A.P.; Barghchi, M. A review of stabilization of soft soils by injection of chemical grouting. 2010. Aust. J. Basic Appl. Sci. 2010, 4, 5862–5868. [Google Scholar]
- Wonglert, A.; Jongpradist, P. Impact of reinforced core on performance and failure behavior of stiffened deep cement mixing piles. Comput. Geotech. 2015, 69, 93–104. [Google Scholar] [CrossRef]
- Li, Q.; Chen, J.H.; Hu, H.X. The tensile and swelling behavior of cement-stabilized marine clay reinforced with short waste fibers. Mar. Georesour. Geotechnol. 2019, 37, 1236–1246. [Google Scholar] [CrossRef]
- Veylon, G.; Ghestem, M.; Stokes, A.; Bernard, A. Quantification of mechanical and hydric components of soil reinforcement by plant roots. Can. Geotech. J. 2015, 52, 1839–1849. [Google Scholar] [CrossRef]
- Wan, Y.; Xue, Q.; Liu, L.; Zhao, L.Y. The role of roots in the stability of landfill clay covers under the effect of dry-wet cycles. Environ. Earth Sci. 2016, 75, 71. [Google Scholar] [CrossRef]
- Ismail, S.; Yaacob, Z. Properties of laterite brick reinforced with oil palm empty fruit bunch fibres. Pertanika J. Sci. Technol. 2011, 19, 33–43. [Google Scholar]
- Hejazi, S.M.; Sheikhzadeh, M.; Abtahi, S.M.; Zadhoush, A. A simple review of soil reinforcement by using natural and synthetic fibers. Constr. Build. Mater. 2012, 30, 100–116. [Google Scholar] [CrossRef]
- Ramkrishnan, R.; Sruthy, M.R.; Sharma, A.; Karthik, V. Effect of random inclusion of sisal fibres on strength behavior and slope stability of fine grained soils. Mater. Today Proc. 2018, 5, 25313–25322. [Google Scholar] [CrossRef]
- Soleimani-Fard, H.; König, D.; Goudarzy, M. Plane strain shear strength of unsaturated fiber-reinforced fine-grained soils. Acta Geotech. 2022, 17, 105–118. [Google Scholar] [CrossRef]
- Maher, M.H. Static and Dynamic Force Response of Sands Reinforced with Discrete, Randomly Distributed Fibers. Ph.D. Thesis, University of Michigan, Ann Arbor, MI, USA, 1988. [Google Scholar]
- Gray, D.H.; Maher, M.H. Admixture stabilization of sands with random fibers. In Proceedings of the 12th International Conference on Soil Mechanics and Foundation Engineering, Rio de Janeiro, Brazil, 13–18 August 1989; A.A. Balkema: Rotterdam, The Netherland, 1989; pp. 1363–1366. [Google Scholar]
- Maher, M.H.; Gray, D.H. Static response of sands reinforced with randomly distributed fibers. J. Geotech. Engrg. 1990, 116, 1661–1677. [Google Scholar] [CrossRef]
- Yetimoglu, T.; Salbas, O. A study on shear strength of sands reinforced with randomly distributed discrete fibers. Geotext. Geomembr. 2003, 21, 103–110. [Google Scholar] [CrossRef]
- Ahmad, F.; Bateni, F.; Azmi, M. Performance evaluation of silty sand reinforced with fibres. Geotext. Geomembr. 2010, 28, 93–99. [Google Scholar] [CrossRef]
- Marandi, M.; Bagheripour, H.; Rahgozar, R.; Zare, H. Strength and ductility of randomly distributed palm fibers reinforced silty-sand soils. Am. J. Appl. Sci. 2008, 5, 209–220. [Google Scholar] [CrossRef]
- Tang, C.S.; Shi, B.; Gao, W.; Chen, F.J.; Cai, Y. Strength and mechanical behavior of short polypropylene fiber reinforced and cement stabilized clayey soil. Geotext. Geomembr. 2007, 25, 194–202. [Google Scholar] [CrossRef]
- Maher, M.; Ho, Y. Mechanical properties of kaolinite/fiber soil composite. Geotech. Eng. 1994, 120, 1381–1393. [Google Scholar] [CrossRef]
- Attom, M.F.; Al-Akhras, N.M.; Malkawi, A.I.H. Effect of fibres on the mechanical properties of clayey soil. Proc. Inst. Civ. Eng.-Geotech. 2009, 162, 277–282. [Google Scholar] [CrossRef]
- Park, S.S. Unconfined compressive strength and ductility of fiber-reinforced cemented sand. Constr. Build. Mater. 2011, 25, 1134–1138. [Google Scholar] [CrossRef]
- Pradhan, P.K.; Kar, R.K.; Naik, A. Effect of random inclusion of polypropylene fibers on strength characteristics of cohesive soil. Geotech. Geol. Eng. 2012, 30, 15–25. [Google Scholar] [CrossRef]
- Hejazi, S.M.; Sheikhzadeh, M.; Abtahi, S.M.; Zadhoush, A. Shear modeling of fiber reinforced soil composite on the base of fiber pull-out test. Fibers Polym. 2013, 14, 277–284. [Google Scholar] [CrossRef]
- Jamei, M.; Villard, P.; Guiras, H. Shear Failure Criterion Based on Experimental and Modeling Results for Fiber-Reinforced Clay. Int. J. Geomech. 2013, 13, 882–893. [Google Scholar] [CrossRef]
- Kanchi, G.M.; Neeraja, V.S.; Babu, G.L.S. Effect of Anisotropy of Fibers on the Stress-Strain Response of Fiber-Reinforced Soil. Int. J. Geomech. 2015, 15, 06014016. [Google Scholar] [CrossRef]
- Qu, J.; Sun, Z. Strength behavior of shanghai clayey soil reinforced with wheat straw fibers. Geotech. Geol. Eng. 2016, 34, 515–527. [Google Scholar] [CrossRef]
- Devi, D.; Jempen, B. Shear strength behaviour of bamboo fiber reinforced soil. Int. Res. J. Eng. Technol. 2016, 3, 433–437. [Google Scholar]
- Wang, Y.X.; Guo, P.P.; Li, X.; Lin, H.; Liu, Y.; Yuan, H.P. Behavior of Fiber-Reinforced and Lime-Stabilized Clayey Soil in Triaxial Tests. Appl. Sci. 2019, 9, 900. [Google Scholar] [CrossRef]
- Correia, A.A.S.; Oliveira, P.J.V.; Custódio, D.G. Effect of polypropylene fibres on the compressive and tensile strength of a soft soil, artificially stabilised with binders. Geotext. Geomembr. 2015, 43, 97–106. [Google Scholar] [CrossRef]
- Anggraini, V.; Asadi, A.; Syamsir, A.; Huat, B.B.K. Three point bending flexural strength of cement treated tropical marine soil reinforced by lime treated natural fiber. Measurement 2017, 111, 158–166. [Google Scholar] [CrossRef]
- Ayeldeen, M.; Kitazume, M. Using fiber and liquid polymer to improve the behaviour of cement-stabilized soft clay. Geotext. Geomembr. 2017, 45, 592–602. [Google Scholar] [CrossRef]
- Tang, C.S.; Shi, B.; Zhao, L.Z. Interfacial shear strength of fiber reinforced soil. Geotext. Geomembr. 2010, 28, 54–62. [Google Scholar] [CrossRef]
- Consoli, N.C.; Zortéa, F.; de Souza, M.; Festugato, L. Studies on the Dosage of Fiber-Reinforced Cemented Soils. J. Mater. Civ. Eng. 2011, 23, 1624–1632. [Google Scholar] [CrossRef]
- Consoli, N.C.; de Moraes, R.R.; Festugato, L. Parameters Controlling Tensile and Compressive Strength of Fiber-Reinforced Cemented Soil. J. Mater. Civ. Eng. 2013, 25, 1568–1573. [Google Scholar] [CrossRef]
- Festugato, L.; Menger, E.; Benezra, F.; Kipper, E.A.; Consoli, N.C. Fibre-reinforced cemented soils compressive and tensile strength assessment as a function of filament length. Geotext. Geomembr. 2017, 45, 77–82. [Google Scholar] [CrossRef]
- Festugato, L.; da Silva, A.P.; Diambra, A.; Consoli, N.C.; Ibraim, E. Modelling tensile/compressive strength ratio of fibre reinforced cemented soils. Geotext. Geomembr. 2018, 46, 155–165. [Google Scholar] [CrossRef]
- Taha, M.M.M.; Feng, C.P.; Ahmed, S.H.S. Influence of Polypropylene Fibre (PF) Reinforcement on Mechanical Properties of Clay Soil. Adv. Polym. 2020, 2020, 9512839. [Google Scholar] [CrossRef]
- Soğanci, A. The effect of polypropylene fiber in the stabilization of expansive soils. World Acad. Sci. Technol. 2015, 9, 994–997. [Google Scholar] [CrossRef]
- Kutanaei, S.S.; Choobbasti, A.J. Experimental Study of Combined Effects of Fibers and Nanosilica on Mechanical Properties of Cemented Sand. J. Mater. Civ. 2016, 28, 06016001. [Google Scholar] [CrossRef]
- Kutanaei, S.S.; Choobbasti, A.J. Effects of Nanosilica Particles and Randomly Distributed Fibers on the Ultrasonic Pulse Velocity and Mechanical Properties of Cemented Sand. J. Mater. Civ. 2017, 29, 04016230. [Google Scholar] [CrossRef]
- JTG E51-2009; Test Methods of Materials Stabilized with Inorganic Binders for Highway Engineering. China Communications Press: Beijing, China, 2009.
- GB/T 50081-2002; Standard for Test Method of Mechanical Properties on Ordinary Concrete. China Architecture & Building Press: Beijing, China, 2002.
- ASTM C1609/C1609M-12; Standard Test Method for Flexural Performance of Fiber-Reinforced Concrete (Using Beam with Third-Point Loading). ASTM International: West Conshohocken, PA, USA, 2012.


Disclaimer/Publisher’s Note: The statements, opinions and data contained in all publications are solely those of the individual author(s) and contributor(s) and not of MDPI and/or the editor(s). MDPI and/or the editor(s) disclaim responsibility for any injury to people or property resulting from any ideas, methods, instructions or products referred to in the content. |
© 2024 by the authors. Licensee MDPI, Basel, Switzerland. This article is an open access article distributed under the terms and conditions of the Creative Commons Attribution (CC BY) license (https://creativecommons.org/licenses/by/4.0/).