
Influence Analysis of Material Parameter Uncertainties on the Stability Safety Factor of Concrete Gravity Dams: A Probabilistic Method
Abstract
:1. Introduction
2. Overview of the ASF for Concrete Dams
3. Probabilistic Anti-Sliding Stability Evaluation Methods
3.1. Definition of SF
3.2. Probabilistic Evaluation Method for the Safety Factors in Dams
4. Illustrative Example
4.1. Project Specifications
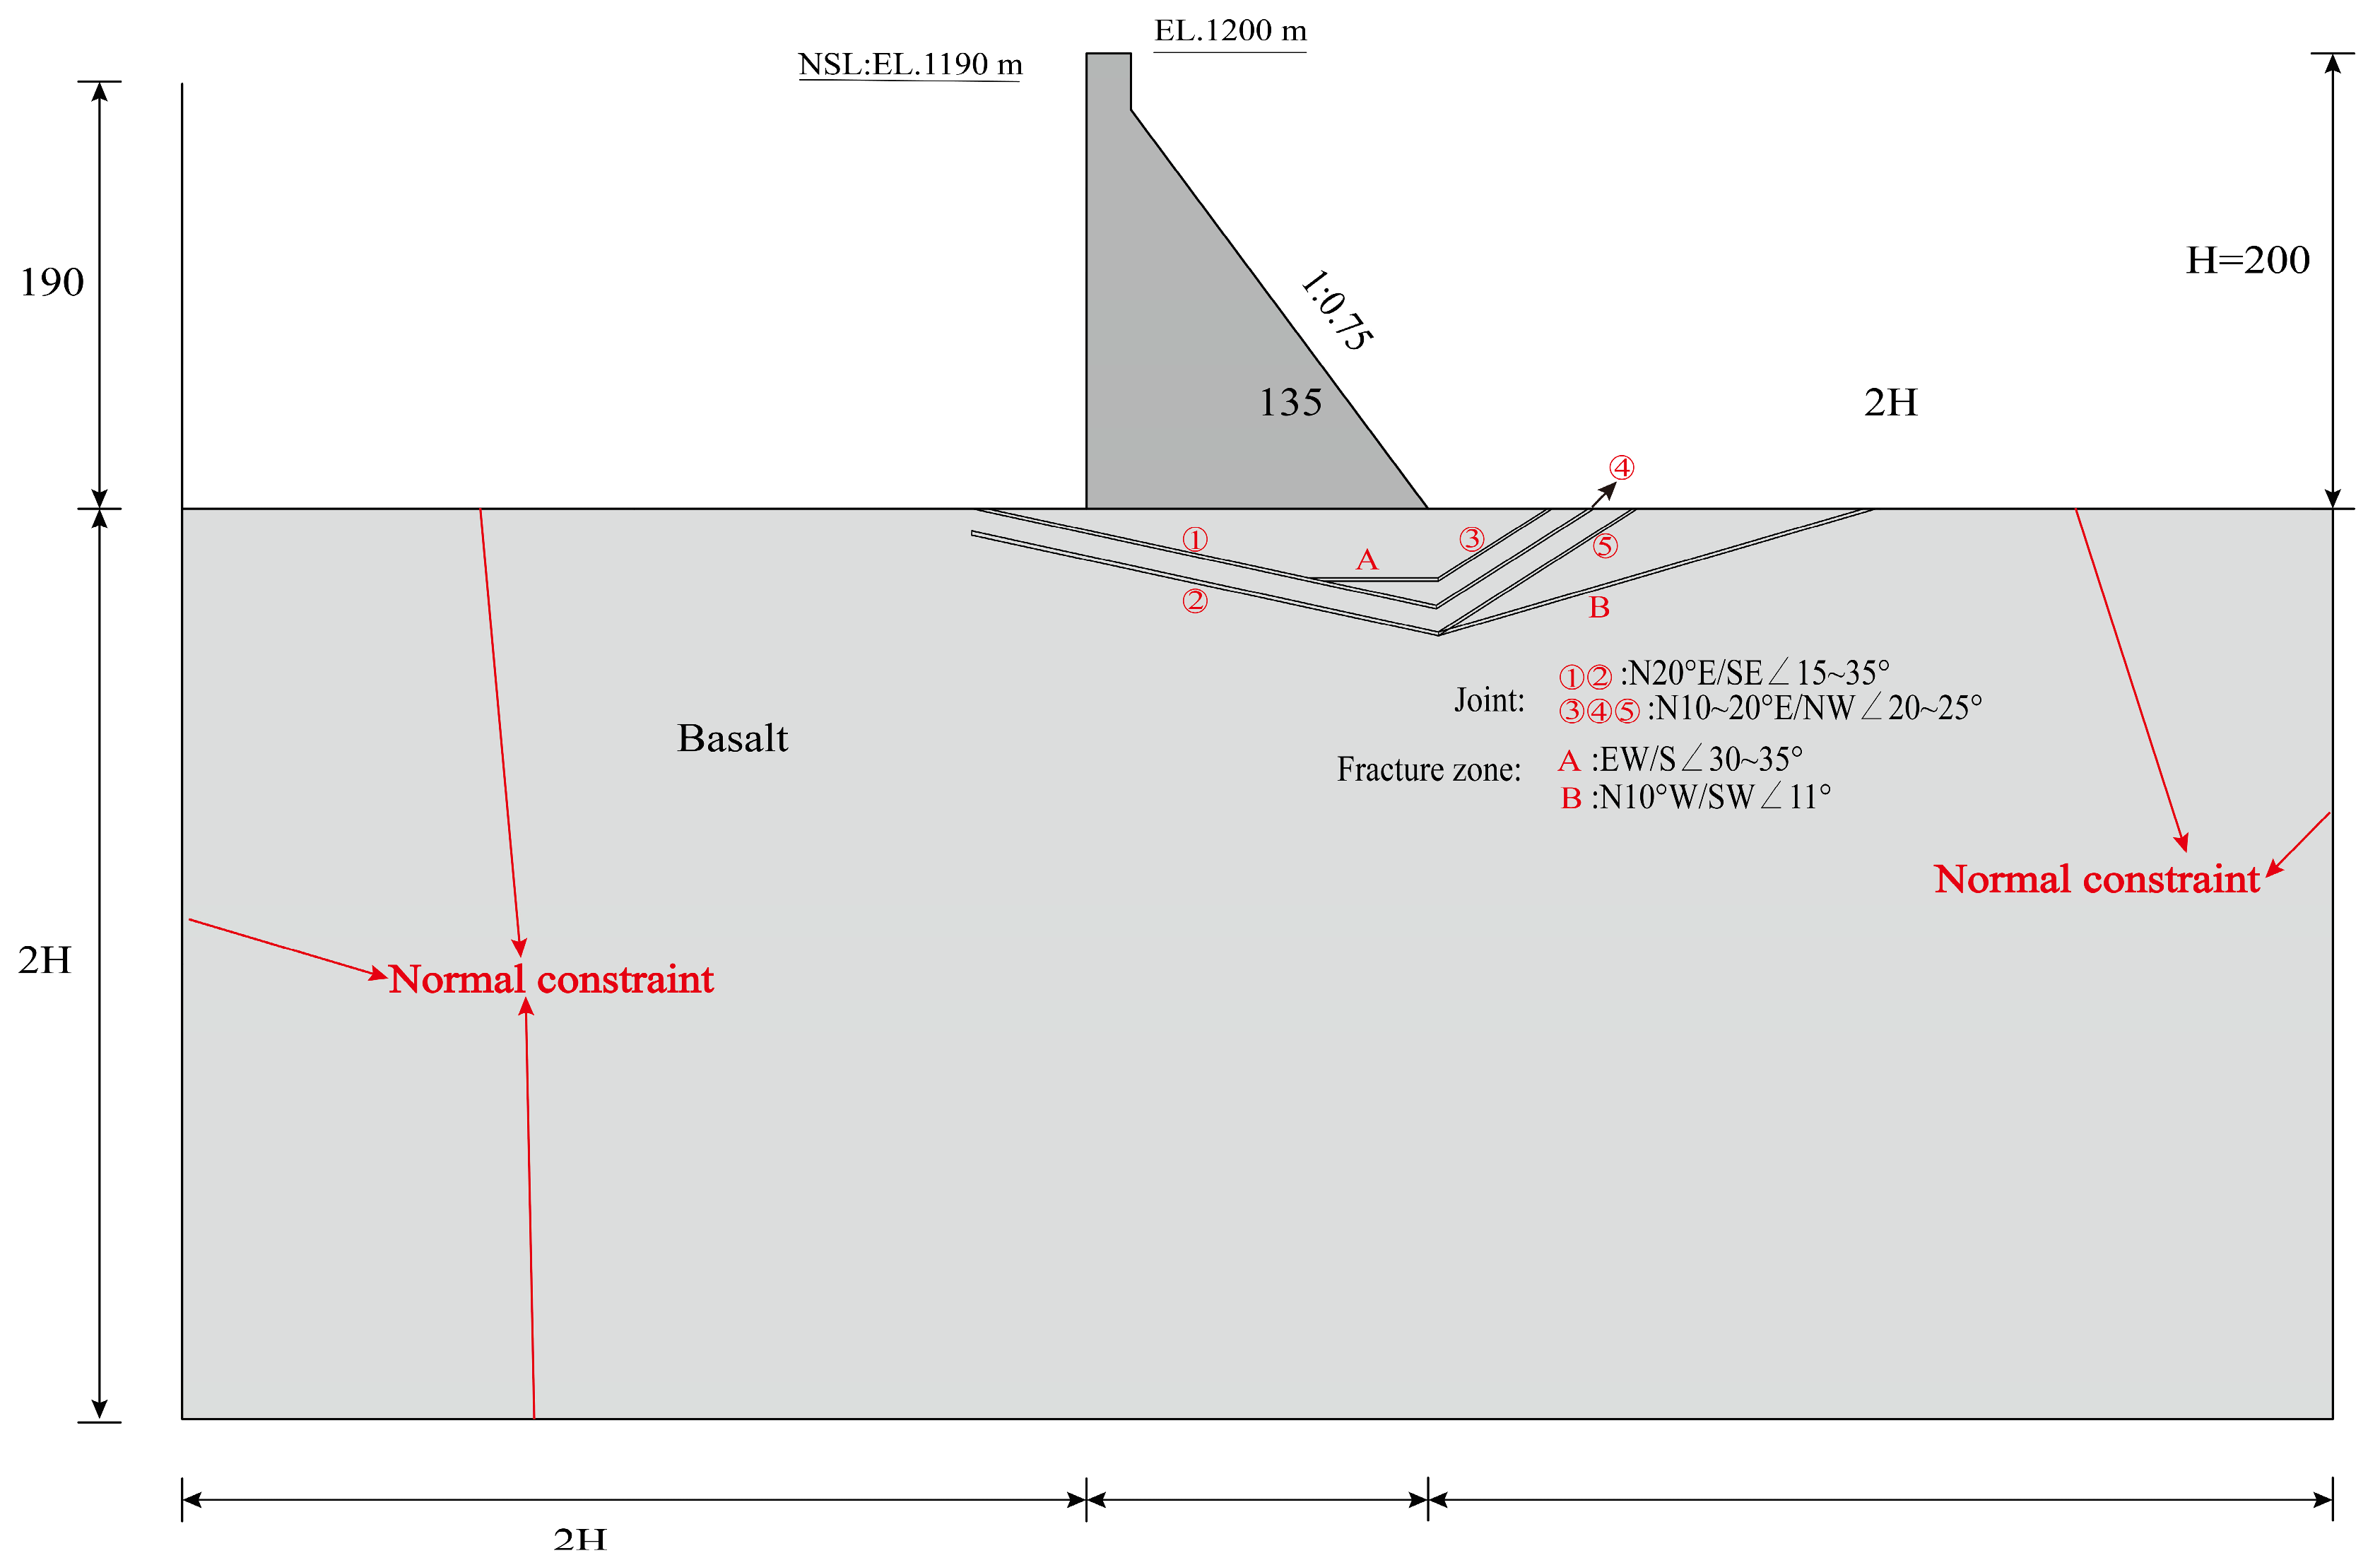
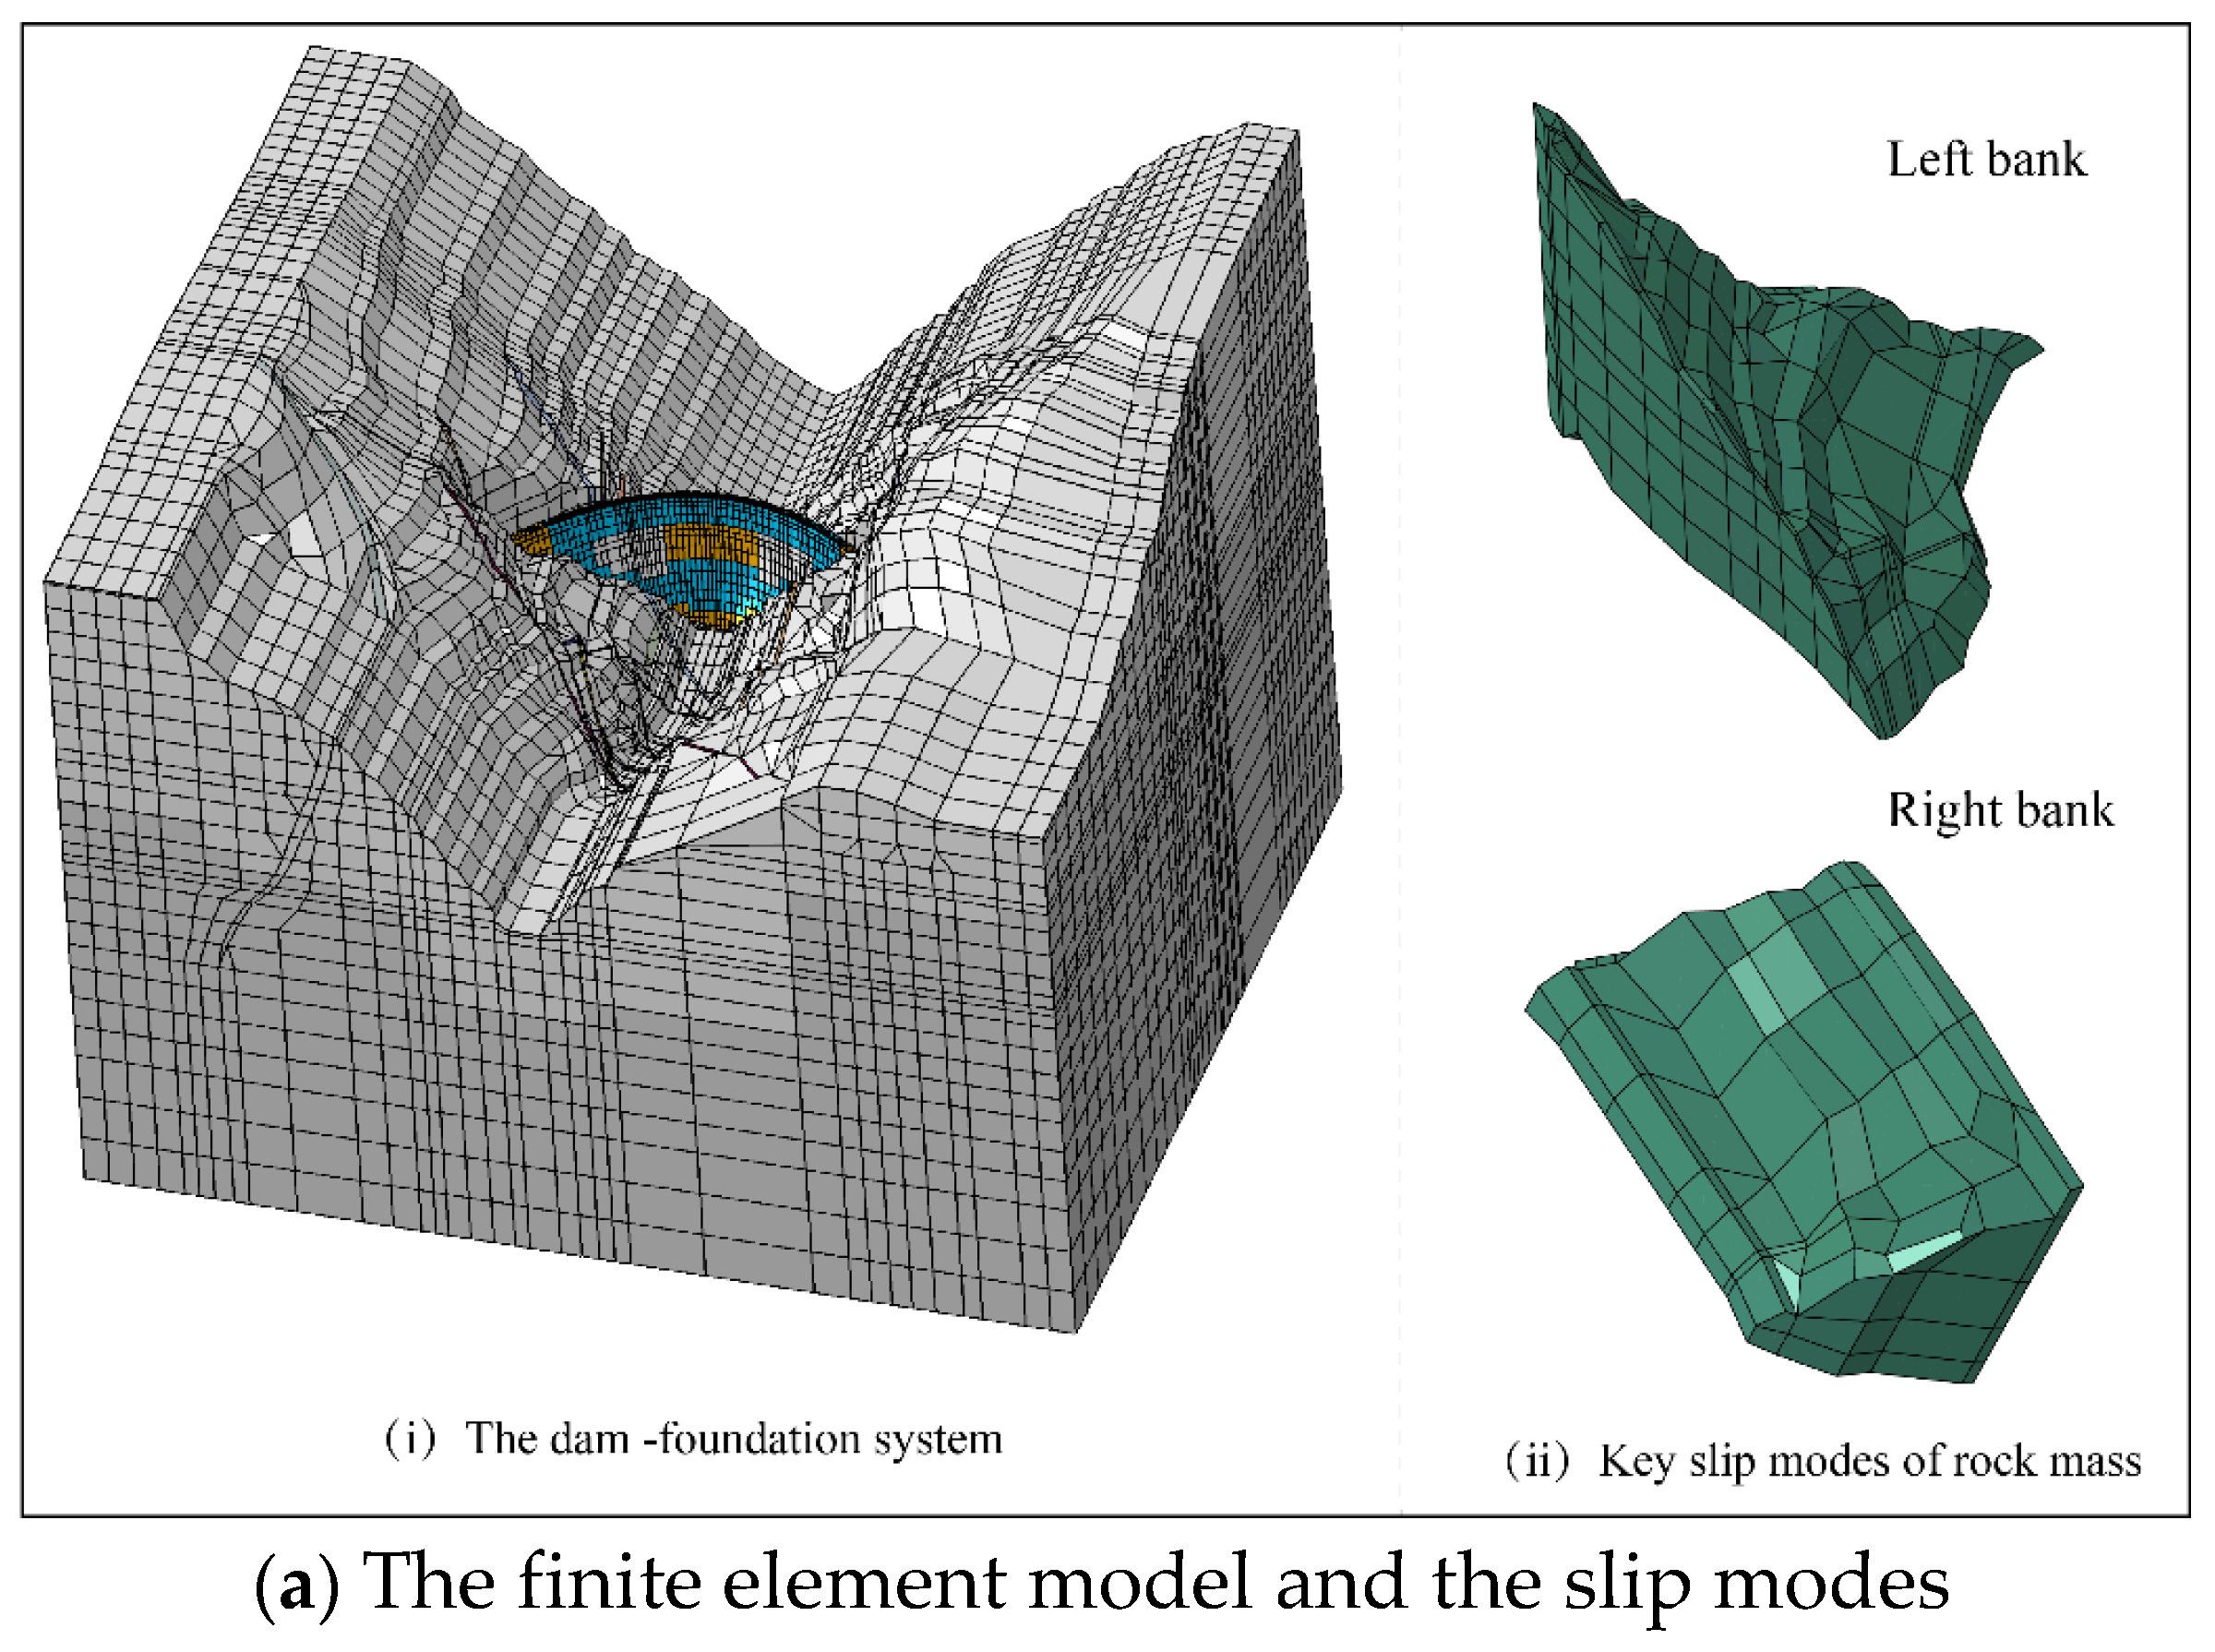
4.2. Dam-Foundation System Model and Parameters
4.3. Analysis of Safety Factor
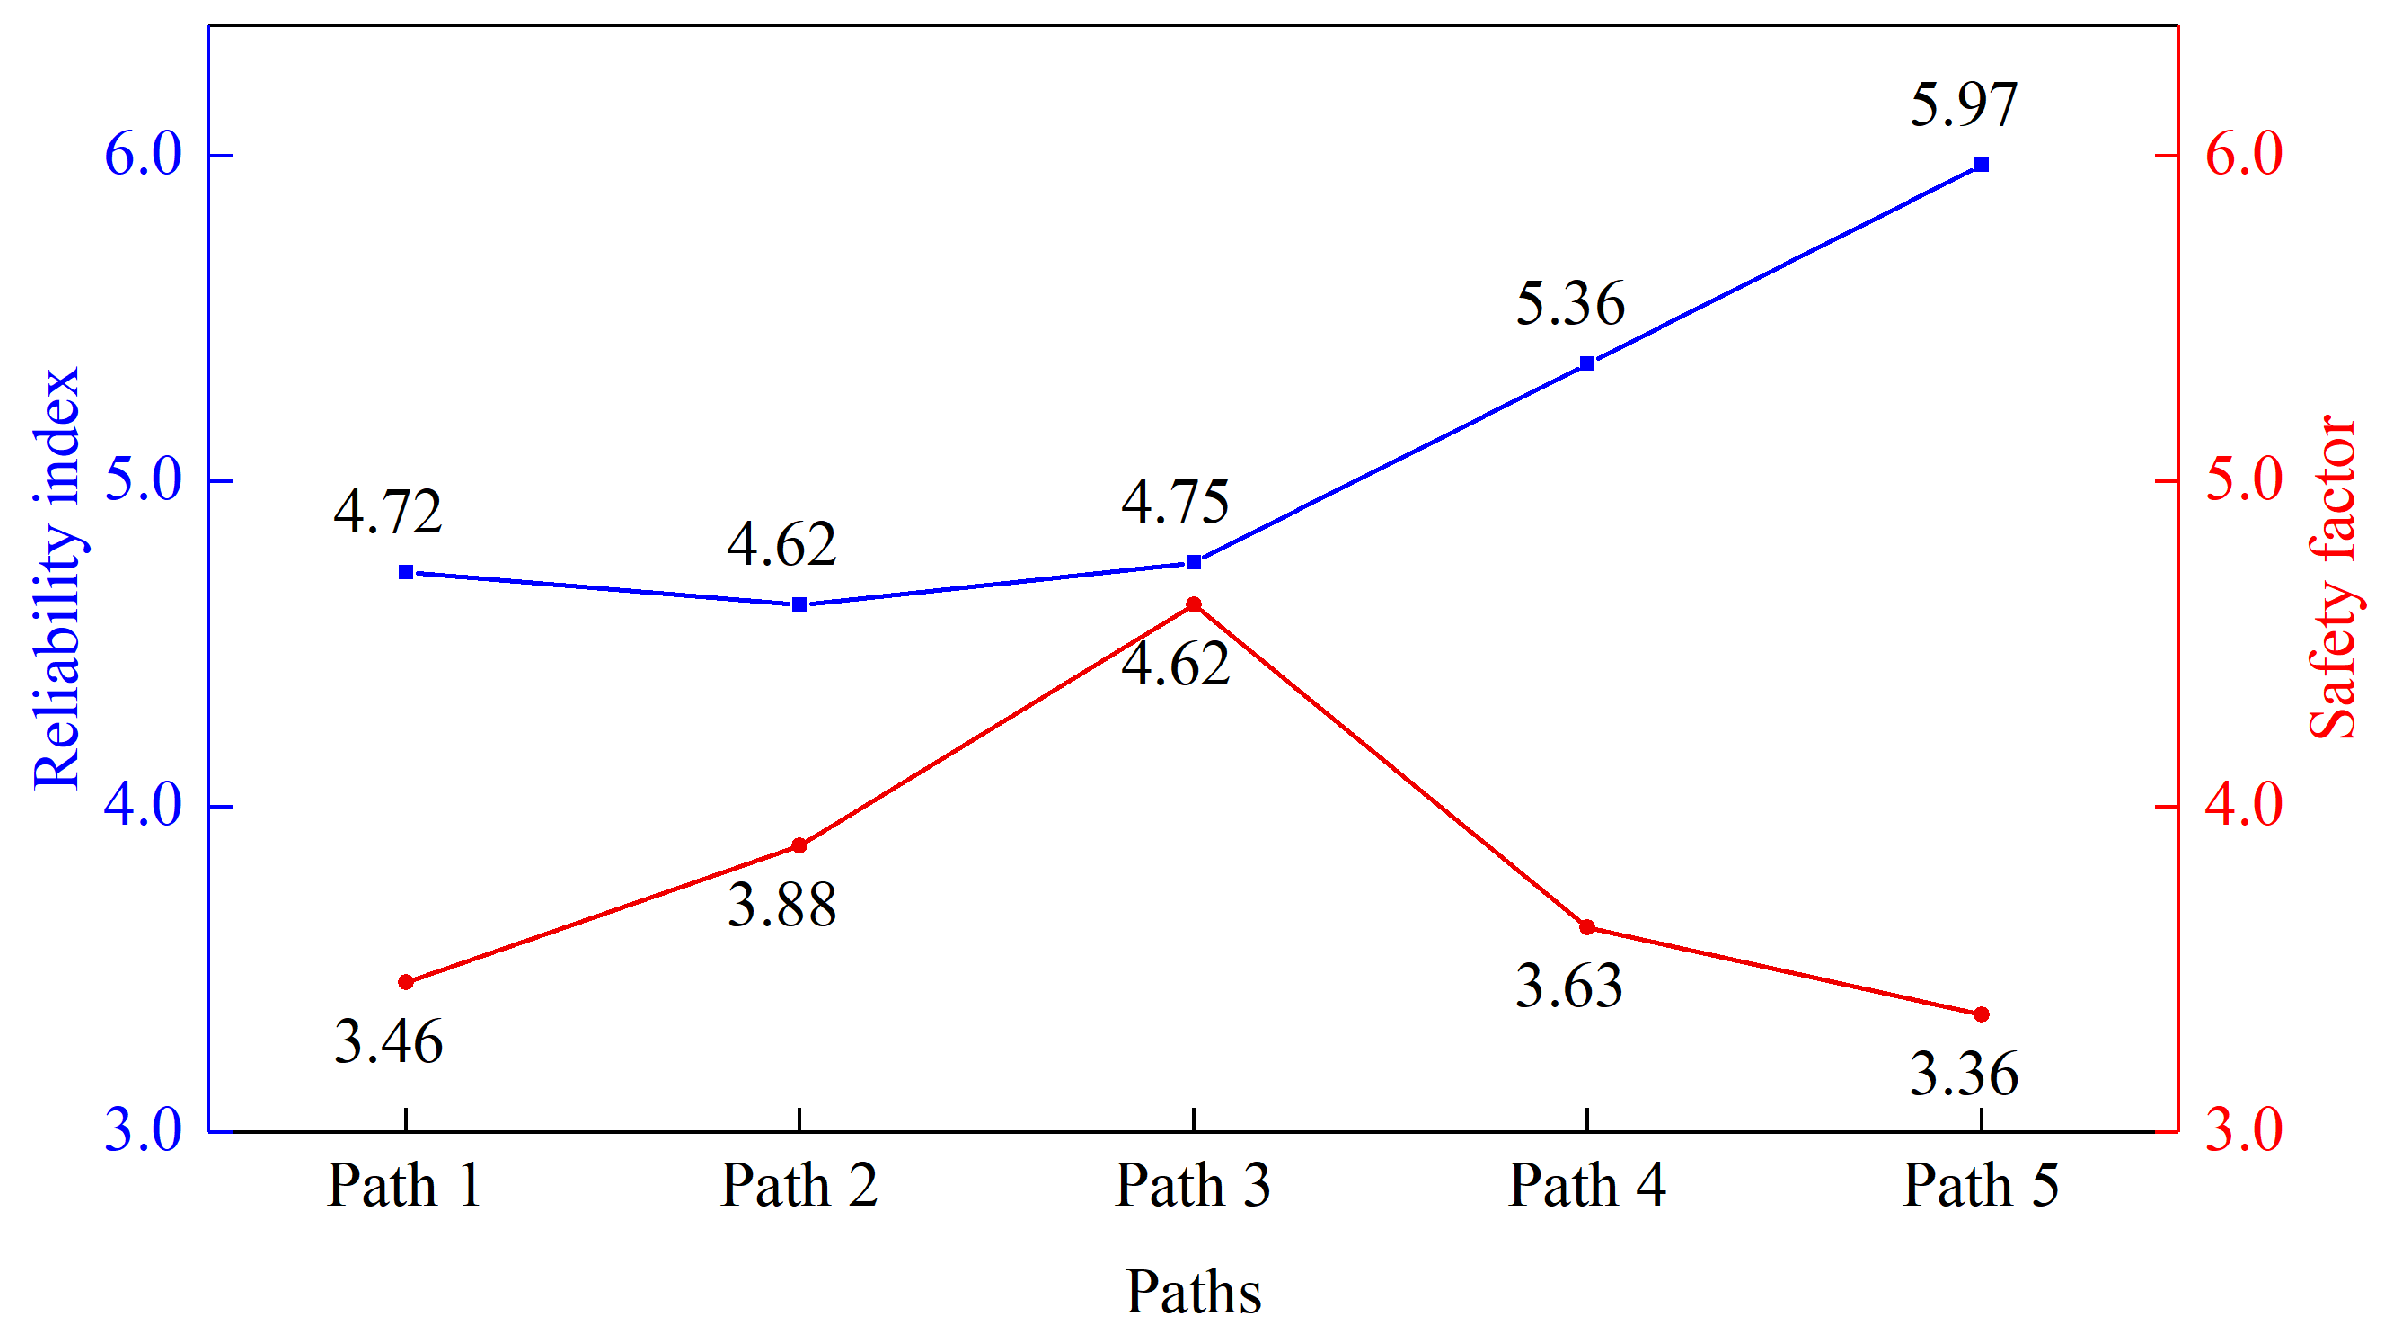
4.3.1. Safety Factor of Anti-Sliding Stability
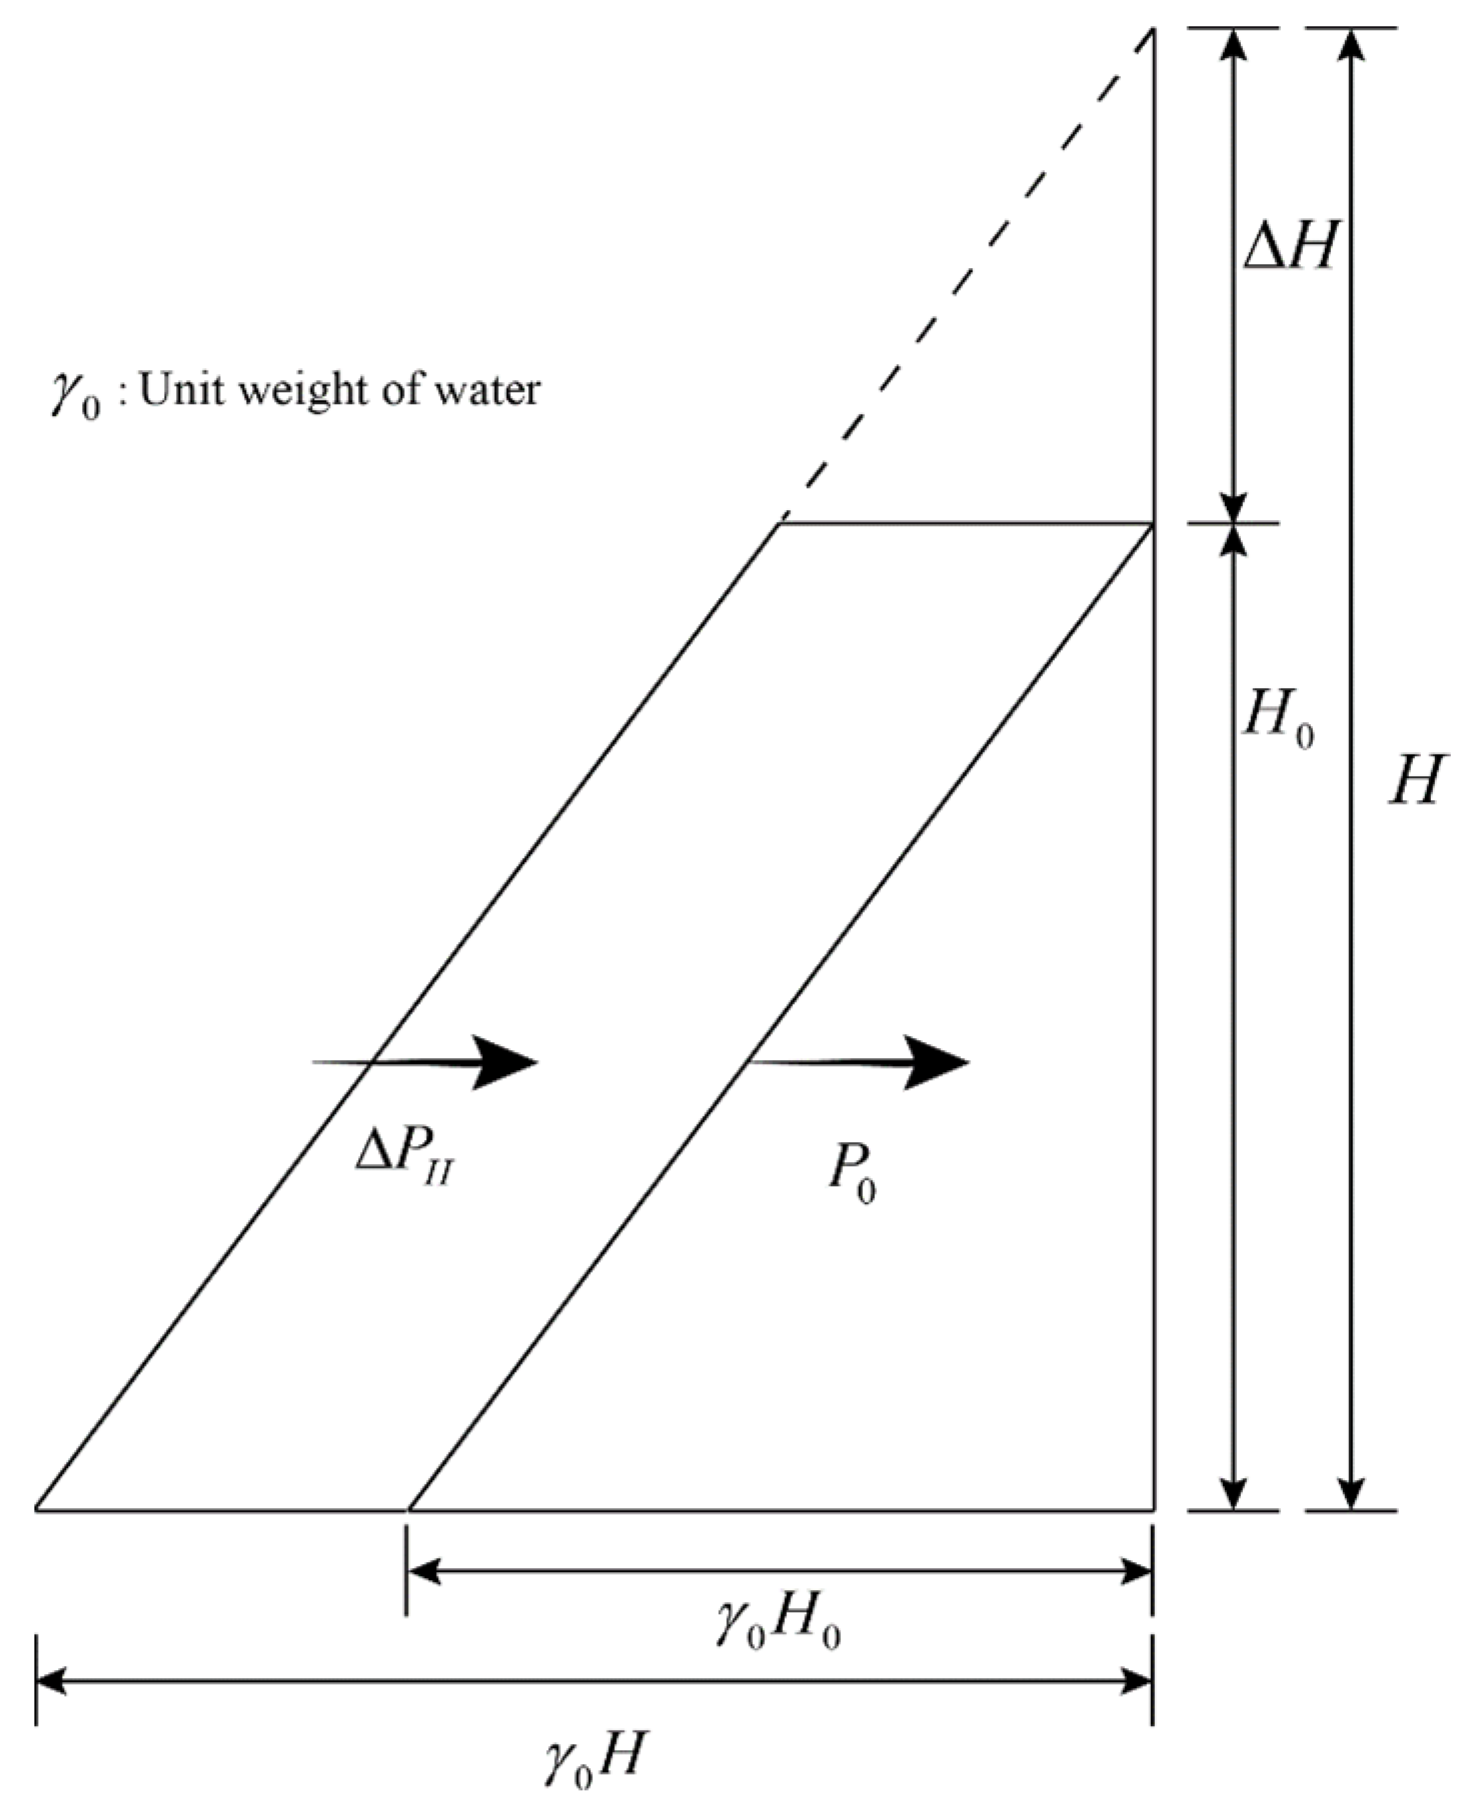
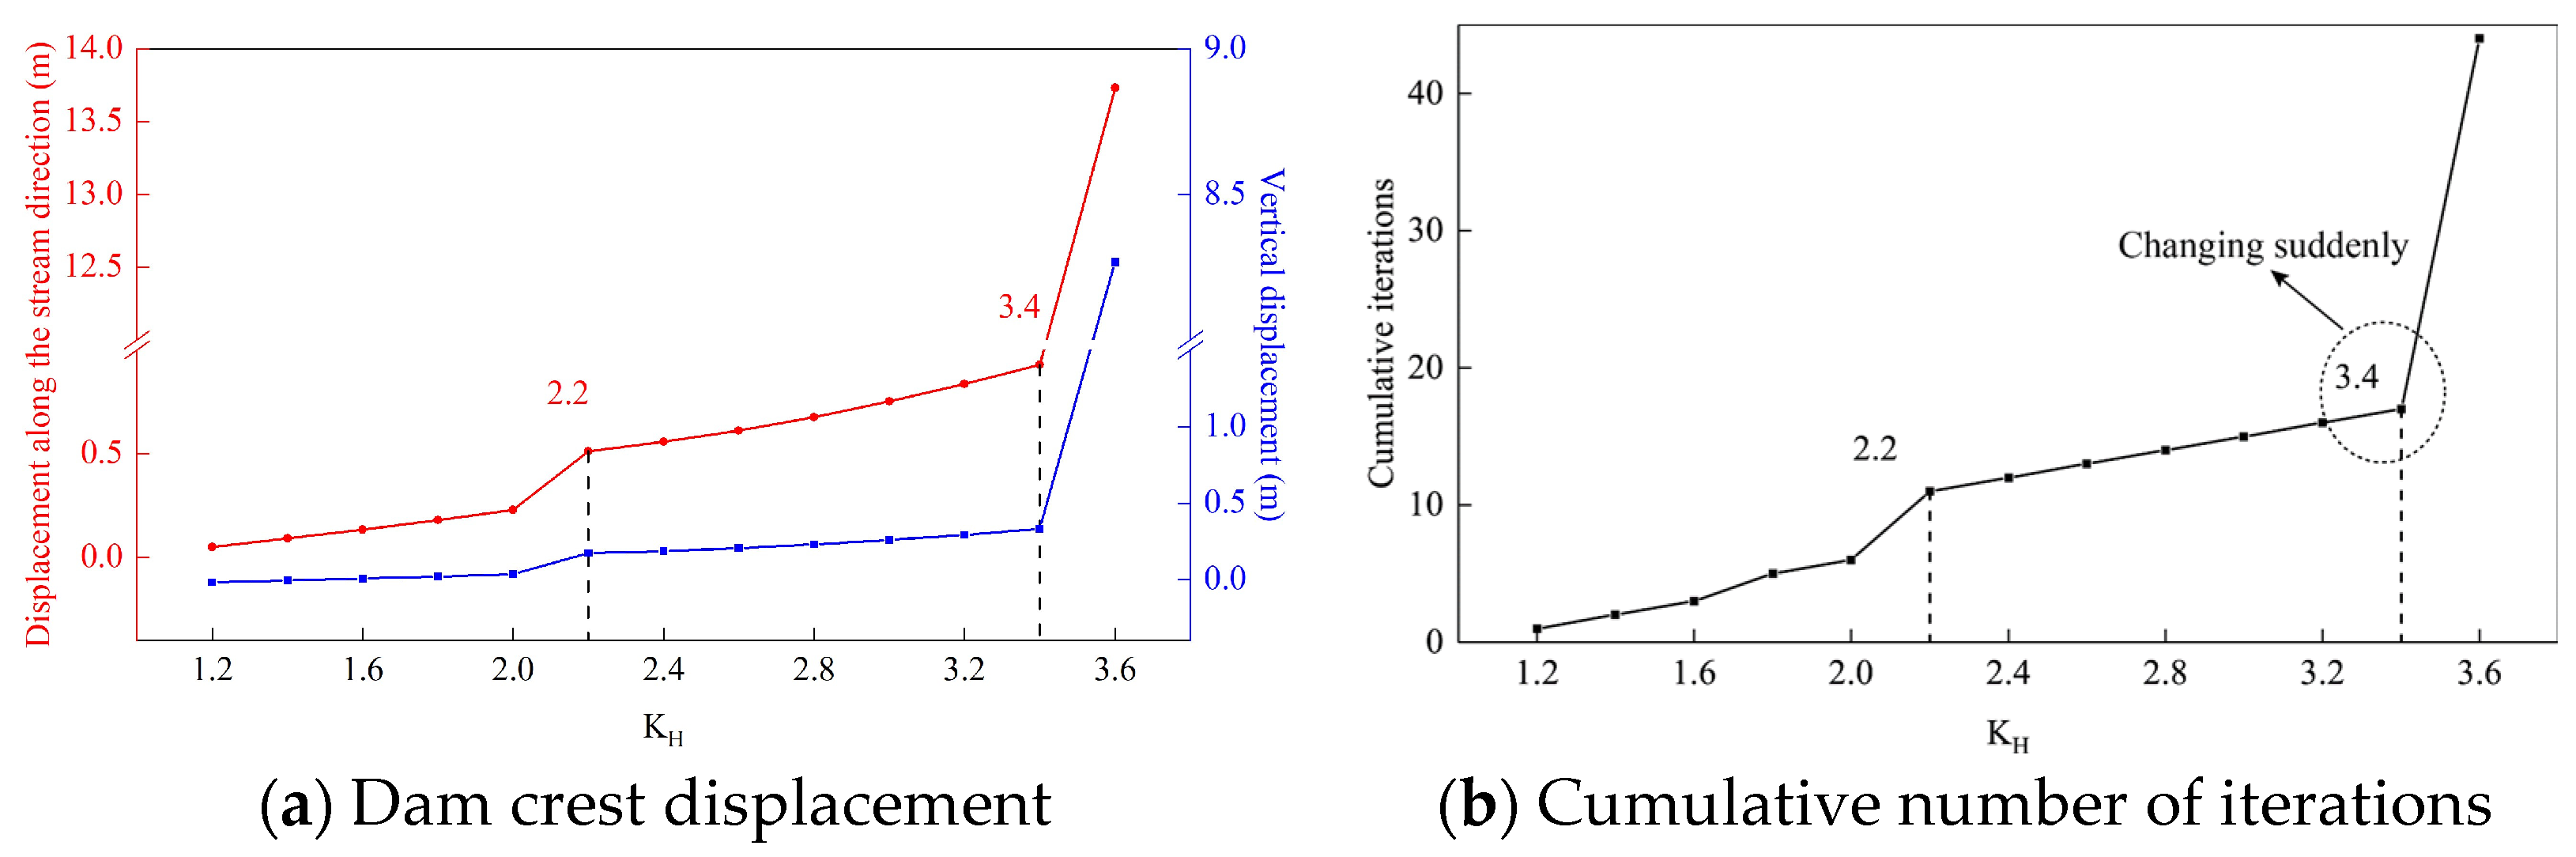
4.3.2. Overload Safety Factor
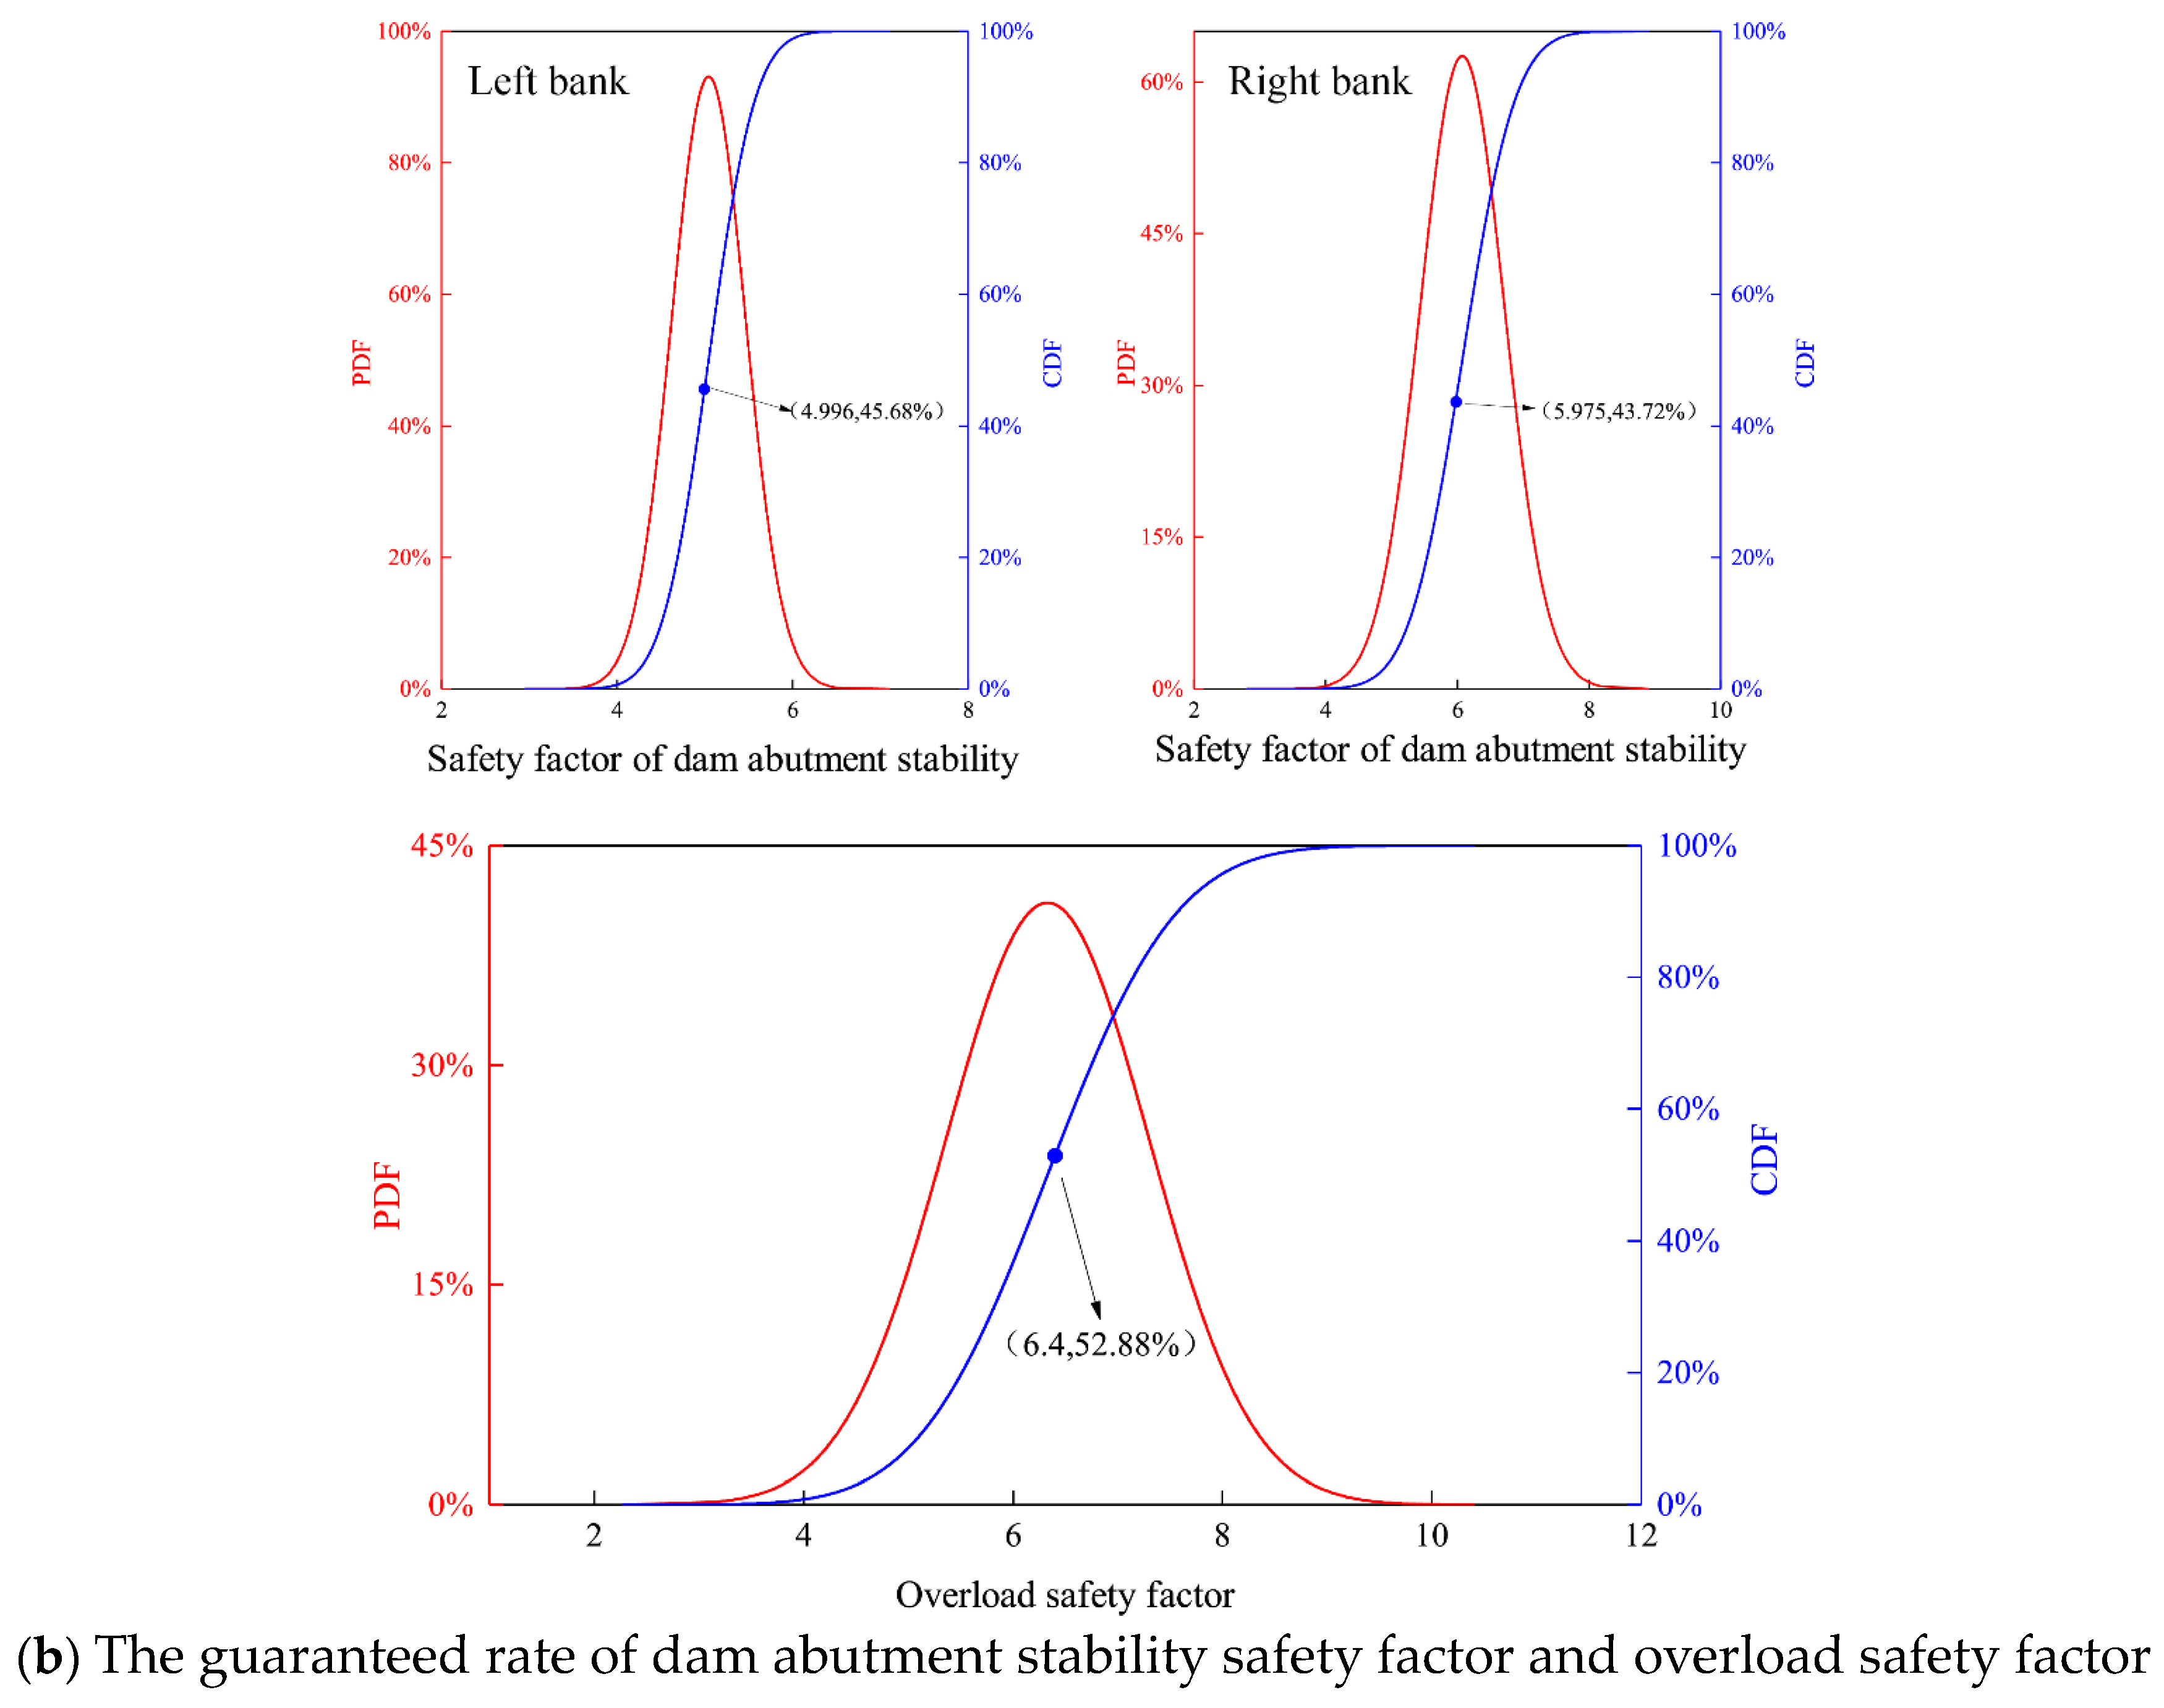
4.4. Probability Analysis of Safety Factor
4.5. Sensitivity Analysis of Material Parameters
4.5.1. Influence of Shear Resistance Parameter Distribution Type on the Guaranteed Rate
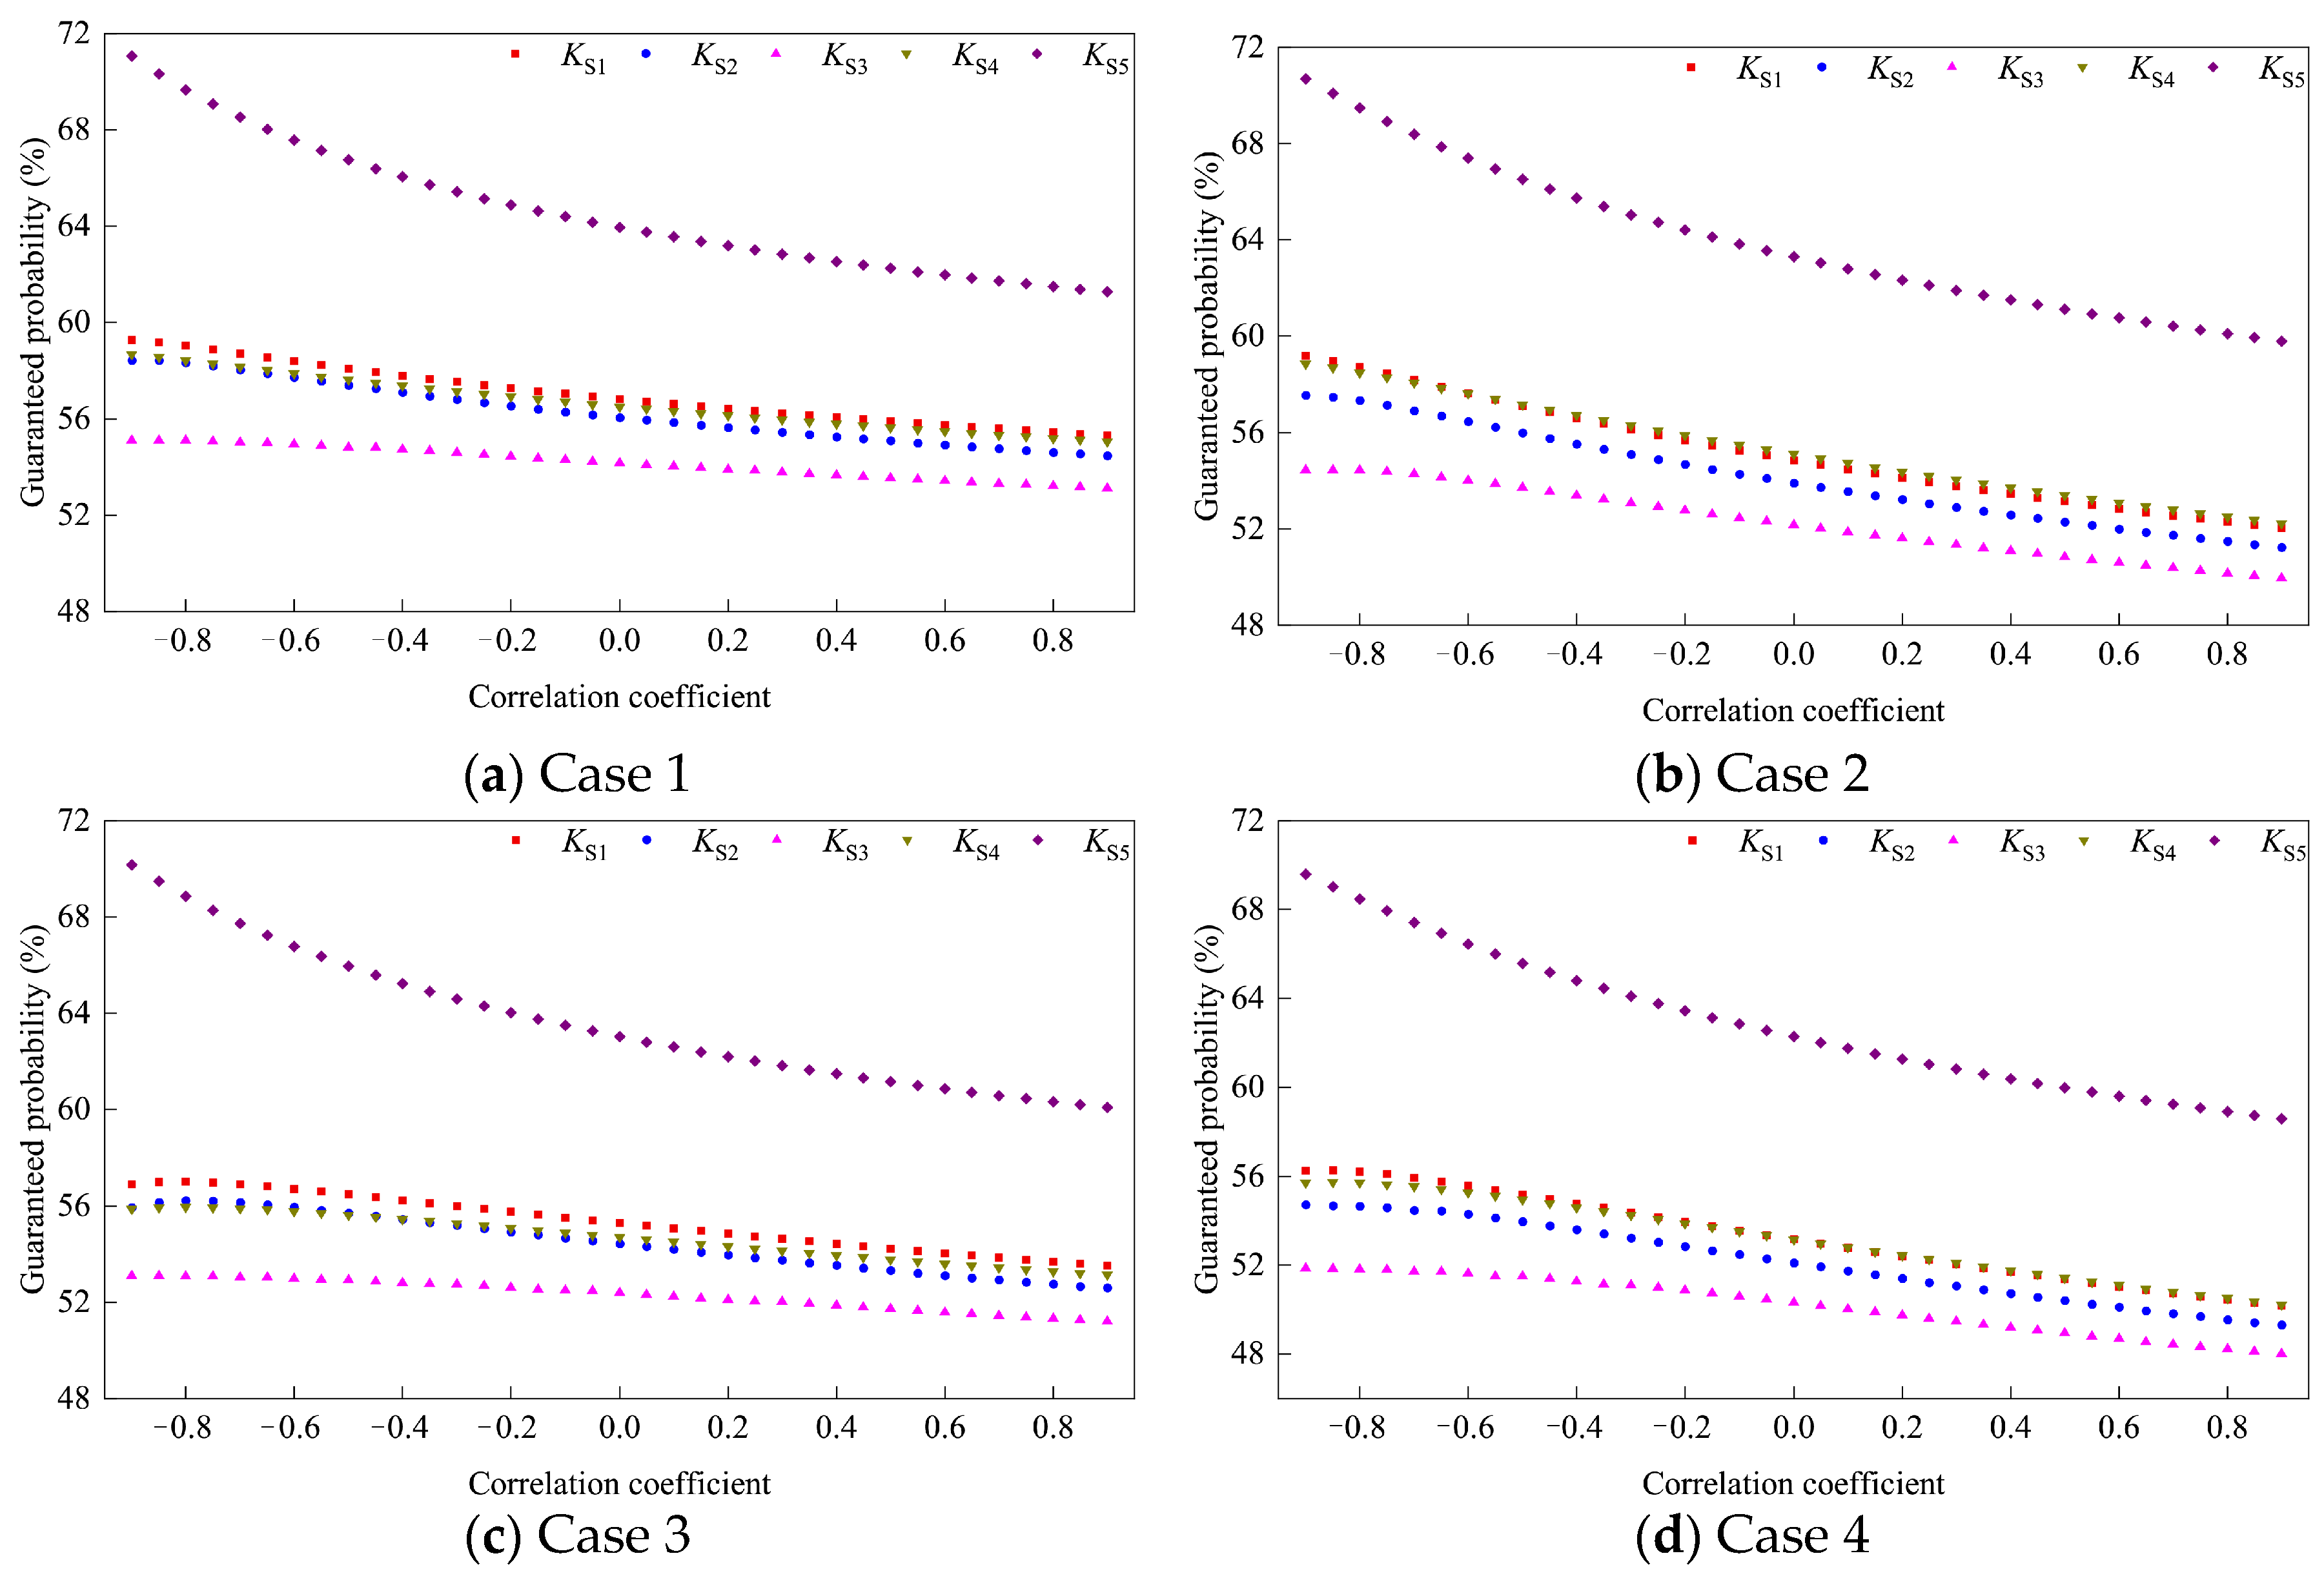
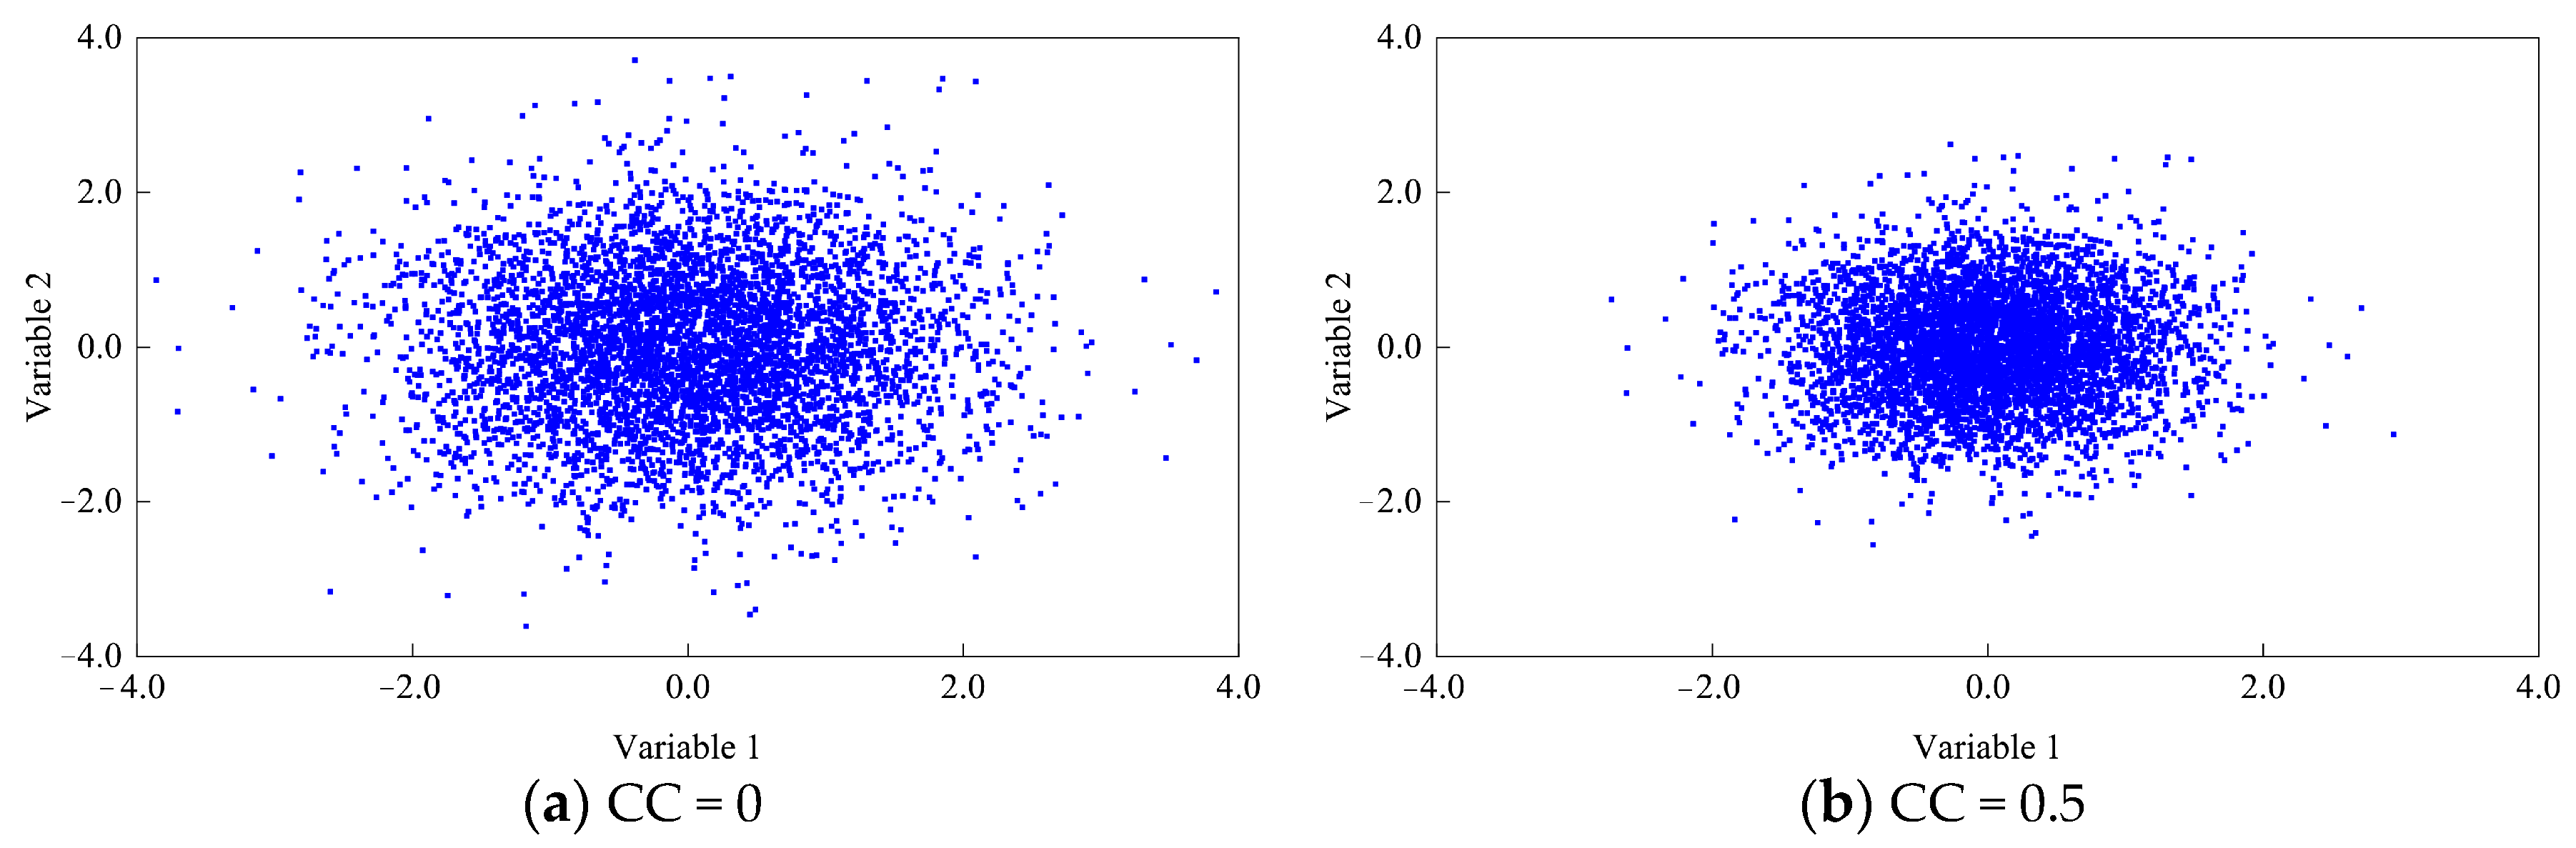
4.5.2. Influence of Correlation of Shear Resistance Parameters on the Guaranteed Rate
5. Discussion
5.1. Difference of Discrimination Criteria for Anti-Sliding Stability
5.2. Future Research Directions
6. Conclusions
- (1)
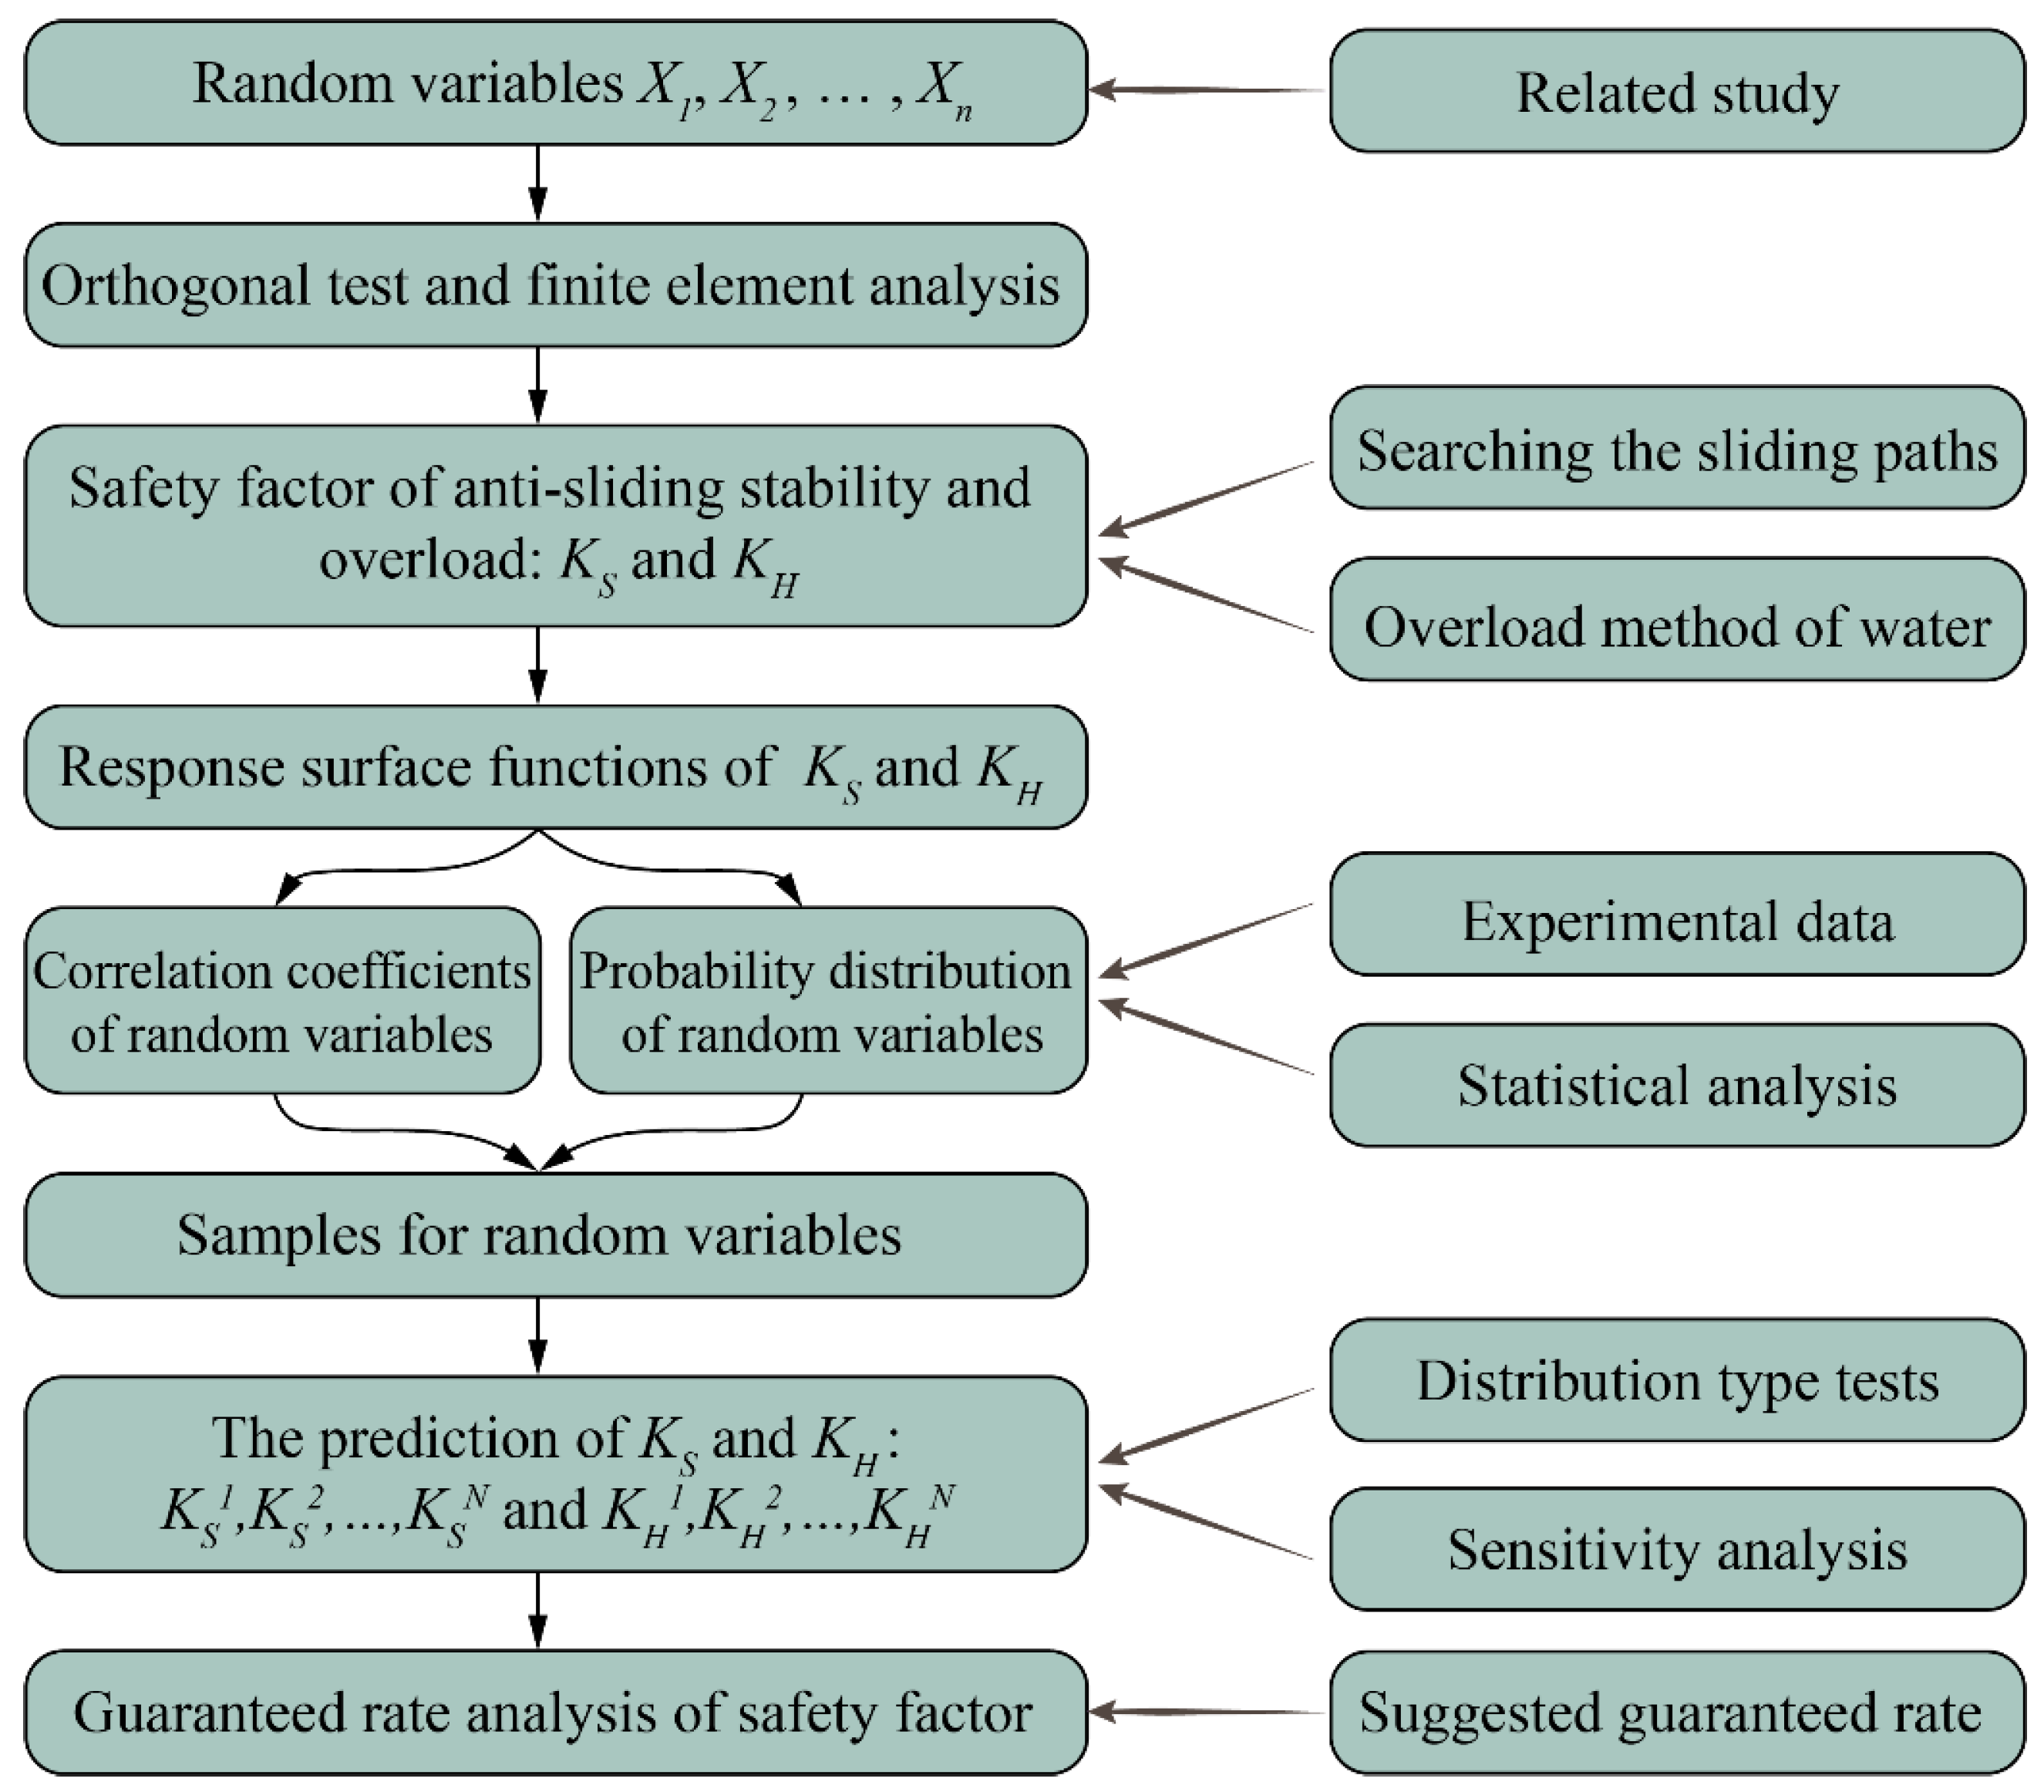
- Taking the uncertain parameters as random variables, the sequences of safety factors and their distribution types were obtained using the RSEs and MC method, respectively, and a probabilistic evaluation method for the ASS-SF in the gravity dams was proposed.
- (2)
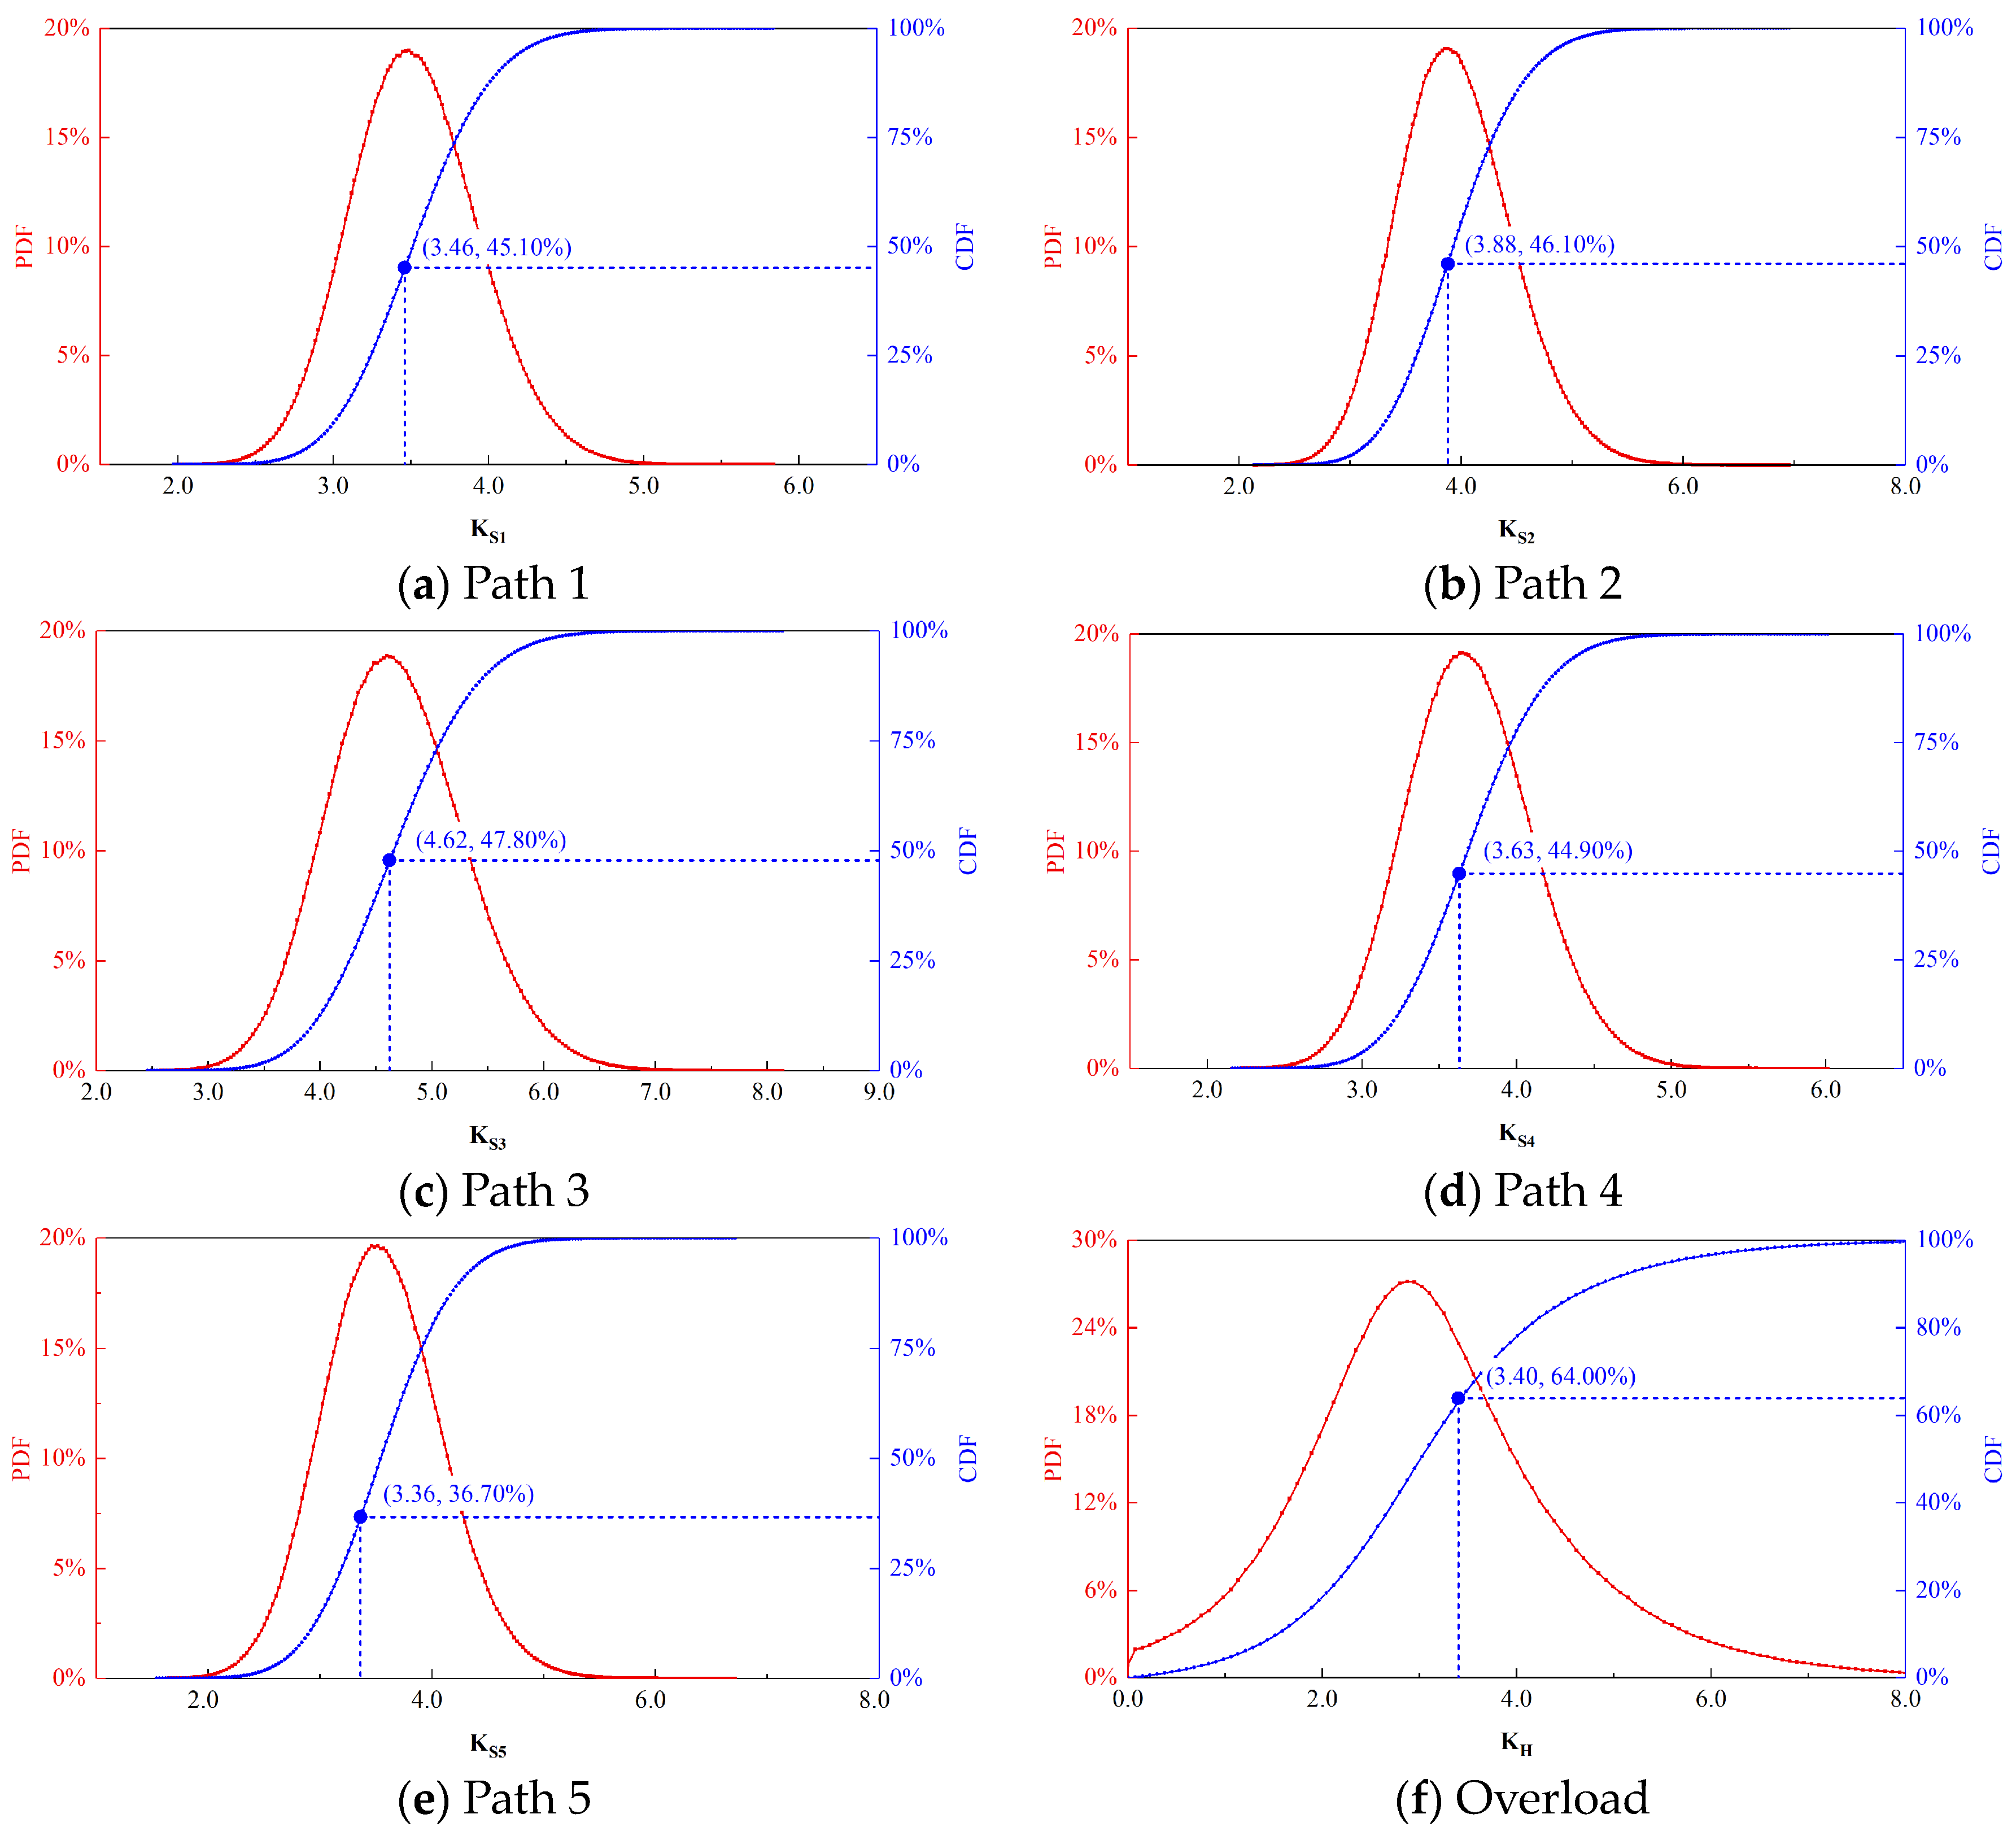
- The case study shows that both the ASS-SF and the overload safety factor in gravity dams obeyed the normal distribution, considering the uncertainties of parameters. The guaranteed rates for the ASS-SF and the OSF were 86.66% and 36.00%, respectively. The distribution type combinations and the correlation between f′ and c′ had a certain impact on the guaranteed rate of the Ks in the gravity dams.
- (3)
- It is indicated that the probability that a determined and unique safety factor that is greater than the ASF during the safety evaluation of concrete dams may not necessarily be 100%. The impact of material parameter uncertainty is not unique but rather depends on the type of dam, failure mode, and material characteristics.
Author Contributions
Funding
Data Availability Statement
Conflicts of Interest
References
- Tao, Z.; Liu, Y.; Yang, Q.; Wang, S. Study on the nonlinear deformation and failure mechanism of a high arch dam and foundation based on geomechanical model test. Eng. Struct. 2020, 207, 110287. [Google Scholar] [CrossRef]
- Shi, C.; Yang, W.; Chu, W.; Shen, J.; Kong, Y. Study of anti-sliding stability of a dam foundation based on the fracture flow method with 3D discrete element code. Energies 2017, 10, 1544. [Google Scholar] [CrossRef]
- Lu, X.; Wu, Z.; Pei, L.; He, K.; Chen, J.; Li, Z.; Yang, Z. Effect of the spatial variability of strength parameters on the dynamic damage characteristics of gravity dams. Eng. Struct. 2019, 183, 281–289. [Google Scholar] [CrossRef]
- Ran, C.; Zhou, Z.; Pei, L.; Lu, X.; Gong, B.; He, K. A method for evaluating systematic risk in dams with random field theory. Appl. Sci. 2024, 14, 4349. [Google Scholar] [CrossRef]
- Khiavi, M.; Ferdousi, A.; Khiavi, A. A probabilistic model for evaluation of the dynamic behavior of a concrete gravity dam considering the fluid-structure interaction. Adv. Civ. Eng. 2023, 2023, 9927608. [Google Scholar] [CrossRef]
- Hariri-Ardebili, M.A.; Seyed-Kolbadi, S.M.; Saouma, V.E.; Salamon, J.; Rajagopalan, B. Random finite element method for the seismic analysis of gravity dams. Eng. Struct. 2018, 171, 405–420. [Google Scholar] [CrossRef]
- Li, Y.; Zhao, E.; Zhang, J.; Shao, C.; Li, Z. Hybrid reliability evaluation of arch dam during long-term service with multi-dimensional parallelepiped convex model. Eng. Fail. Anal. 2024, 157, 107937. [Google Scholar] [CrossRef]
- Chen, J.; Jia, Q.; Xu, Q.; Fan, S.; Liu, P. The PDEM-based time-varying dynamic reliability analysis method for a concrete dam subjected to earthquake. Structures 2021, 33, 2964–2973. [Google Scholar] [CrossRef]
- Wu, Z.Y.; Chen, C.; Lu, X.; Pei, L.; Zhang, L.M. Discussion on the allowable safety factor of slope stability for high rockfill dams in China. Eng. Geol. 2020, 272, 105666. [Google Scholar] [CrossRef]
- Zhou, X.; Xu, Q.; Chen, S. Penetrated damage effects and safety control of arch dam (III): Early warning index of dam body. Eng. J. Wuhan Univ. 2023, 56, 1033–1040. [Google Scholar] [CrossRef]
- Han, X.; Zhao, P.; Mao, Z.; Yang, C. Research on safety control indicators for the design of Dashixia extra high earth rock dam in Xinjiang. Water Resour. Plan. Des. 2022, 3, 89–95. [Google Scholar] [CrossRef]
- Wang, L.; Wu, C.; Liu, H.; Mei, G.; Zhang, W. Probabilistic stability analysis of earth dam slope under transient seepage using multivariate adaptive regression splines. Bull. Eng. Geol. Environ. 2020, 79, 2763–2775. [Google Scholar] [CrossRef]
- Siacara, A.T.; Napa-García, G.F.; Beck, A.T.; Futai, M.M. Reliability analysis of earth dams using direct coupling. J. Rock Mech. Geotech. Eng. 2020, 12, 366–380. [Google Scholar] [CrossRef]
- Li, J.; Su, H. Anti-sliding stability reliability-based approach determining the early-warning value of deformation safety for gravity dam. HydroSci. Eng. 2023, 1, 34–42. [Google Scholar] [CrossRef]
- Gao, J.; Han, X.; Han, W.; Dang, F.; Ren, J.; Xue, H.; Fang, J. Research on the slip deformation characteristics and improvement measures of concrete-faced rockfill dams on dam foundations with large dip angles. Sci. Rep. 2024, 14, 8665. [Google Scholar] [CrossRef] [PubMed]
- Xu, B.; Wang, S. Sensitivity analysis of factors affecting gravity dam anti-sliding stability along a foundation surface using Sobol method. Water Sci. Eng. 2023, 16, 399–407. [Google Scholar] [CrossRef]
- Hariri-Ardebili, M.A.; Saouma, V.E. Probabilistic seismic demand model and optimal intensity measure for concrete dams. Struct. Saf. 2016, 59, 67–85. [Google Scholar] [CrossRef]
- Pouraminian, M.; Pourbakhshian, S.; Noroozinejad Farsangi, E. Reliability assessment and sensitivity analysis of concrete gravity dams by considering uncertainty in reservoir water levels and dam body materials. Civ. Environ. Eng. Rep. 2020, 1, 1–17. [Google Scholar] [CrossRef]
- Hariri-Ardebili, M.A. Quantifying modeling uncertainties in seismic analysis of dams: Insights from an international benchmark study. Earthq. Eng. Struct. Dyn. 2023, 53, 1168–1194. [Google Scholar] [CrossRef]
- Leclerc, M.; Le’ger, P.; Tinawi, R. Computer aided stability analysis of gravity dams-CADAM. Adv. Eng. Softw. 2003, 34, 403–420. [Google Scholar] [CrossRef]
- Cordier, M.; Léger, P. Structural stability of gravity dams: A progressive assessment considering uncertainties in shear strength parameters. Georisk Assess. Manag. Risk Eng. Syst. Geohazards 2018, 12, 109–122. [Google Scholar] [CrossRef]
- Hao, N.; Li, X.; Li, Y.; Jia, S.; Gao, L. A novel reliability-based method of calibrating safety factor: Application to the cemented sand and gravel dams. Eng. Geol. 2022, 306, 106719. [Google Scholar] [CrossRef]
- Bao, T.; Xu, B.; Zheng, X. Hybrid method of limit equilibrium and finite element internal force for analysis of arch dam stability against sliding. Sci. China Technol. Sci. 2011, 54, 793–798. [Google Scholar] [CrossRef]
- Cabrera, M.; Senent, S.; Rafael Jimenez, O. Sliding stability analysis of gravity dam founded on rock mass with impersistent joint set. Can. Geotech. J. 2015, 52, 1668–1684. [Google Scholar] [CrossRef]
- Shole, D.; Belayneh, M. The effect of side slope and clay core shape on the stability of embankment dam: Southern Ethiopia. Int. J. Environ. Sci. Technol. 2019, 16, 5871–5880. [Google Scholar] [CrossRef]
- Johari, A.; Momeni, M.; Javadi, A. An analytical solution for reliability of rock slopes using jointly distributed random variables method. Iran. J. Sci. Technol. Trans. Civ. Eng. 2015, 39, 351–363. [Google Scholar] [CrossRef]
- Wang, S.; Ni, P. Application of block theory modeling on spatial block topological identification to rock slope stability analysis. Int. J. Comput. Methods 2014, 11, 1350044. [Google Scholar] [CrossRef]
- Rochim, A.; Pratikso. Characterization of landslide and its earthwork solutions. J. Phys. Conf. Ser. 2020, 1517, 012035. [Google Scholar] [CrossRef]
- Kim, K.; Park, H.; Lee, S.; Woo, I. Geographic Information System (GIS) based stability analysis of rock cut slopes. Geosci. J. 2004, 8, 391–400. [Google Scholar] [CrossRef]
- Lazarte, C.; Robinson, H.; Gomez, J.; Baxter, A.; Cadden, A.; Berg, R.; Berg, R. Geotechnical Engineering Circular No. 7 Soil Nail Walls Reference Manual; National Highway Institute (US): Arlington, VA, USA, 2015.
- RDSO Guidelines for Earthwork in Railway Projects; Guidelines no. GE: G-1; Ministry of Railways, Govt. of India, Geotechnical Engineering Directorate, Research Designs and Standards Organization: Lucknow, India, 2003.
- USBR Design of Gravity Dams; United States Bureau of Reclamation: Denver, CO, USA, 1976.
- USACE Gravity DamDesign; USACE: Washington, DC, USA, 1995.
- FERC Engineering Guidelines for the Evaluation of Hydropower Projects; Federal Energy Regulatory Commission: Washington, DC, USA, 2002.
- Ministry of Water Resources of the People’s Republic of China. Chinese Code: Design Specification for Concrete Gravity Dams; China Water & Power Press: Beijing, China, 2018.
- CDA Dam Safety Guidelines; Canadian Dam Association: Edmonton, AB, Canada, 2007.
- ANCOLD Guidelines on Design Criteria for Concrete Gravity Dams; Australian National Committee on Large Dams: Hobart, Australia, 2013.
- USACE Stability Analysis of Concrete Structures; USACE: Washington, DC, USA, 2005.
- Li, Z.; Lu, D.; Gao, X. Optimization of mixture proportions by statistical experimental design using response surface method—A review. J. Build. Eng. 2021, 36, 102101. [Google Scholar] [CrossRef]
- Pouraminian, M.; Ekranejad, H. Reliability analysis of concrete arch dam under stage construction and hydrostatic pressure by MCS and RS methods. Sharif Civ. Eng. J. 2021, 37, 135–145. [Google Scholar] [CrossRef]
- Liu, J.; Luan, M.; Xu, C.; Wang, J.; Yuan, F. Study on parametric characters of Drucker-Prager criterion. Chin. J. Rock Mech. Eng. 2006, 25, 4010–4015. [Google Scholar]
- Wang, X.; Chen, M.; Chang, X.; Zhou, W.; Yuan, Z. Studies of application of Drucker-Prager yield criteria to stability analysis. Rock Soil Mech. 2009, 30, 3733–3738. [Google Scholar]
- Altarejos-García, L.; Escuder-Bueno, I.; Serrano-Lombillo, A.; Gómez de Membrillera-Ortuño, M. Methodology for estimating the probability of failure by sliding in concrete gravity dams in the context of risk analysis. Struct. Saf. 2012, 36–37, 1–13. [Google Scholar] [CrossRef]
- PowerChina Chengdu Engineering Corporation Limited (PCECL). Special Report of Determination of Dam Foundation Surface and Review of Anti-Sliding Stability of the Gravity Dam; PCECL: Chengdu, China, 2010. [Google Scholar]
- Pei, L.; Chen, C.; He, K.; Lu, X. System reliability of a gravity dam-foundation system using Bayesian networks. Reliab. Eng. Syst. Saf. 2022, 218, 108178. [Google Scholar] [CrossRef]
- DL5108-1999; Design Specification for Concrete Gravity Dams. State Economic and Trade Commission of the People’s Republic of China (SETC): Beijing, China, 1999.
- Tai, S.; Sun, Y.; He, J. Applied Mathematical Statistic; Wuhan University Press: Wuhan, China, 2005; pp. 204–231. [Google Scholar]
- Yuan, Y.; Guo, Q.; Zhou, Z.; Wu, Z.; Chen, J.; Yao, F. Back analysis of material parameters of high core rockfill dam considering parameters correlation. Rock Soil Mech. 2017, 38, 463–470. [Google Scholar] [CrossRef]


| No. | Types | Methods | Allowable Safety Factor | Country | Ref. |
|---|---|---|---|---|---|
| 1 | GD | RLEM | Peak sliding factor: 3.0 Residual sliding factor: 1.5 Overturning factor: 1.2 Uplifting factor: 1.2 | Canada | [20] |
| 2 | GD | RLEM | Usual, no material tests: 3.0 Usual, with material tests/unusual, no material tests: 2.0 Unusual, with material tests: 1.5 Extreme, no material tests: 1.3 Extreme, with material tests: 1.1 | Canada | [21] |
| 3 | CSGD | RLEM | Structure grades I: 2.9 Structure grades II: 2.6 Structure grades III: 2.2 | China | [22] |
| 4 | AD | RLEM FEM | 2.5 | China | [23] |
| 5 | GD | RLEM | Usual: 1.5 Unusual: 1.2 Extreme: 1.0 | Spain | [24] |
| 6 | ED | RLEM | At end of construction: 1.3 At steady state: 1.5 During sudden drawdown: 1.3 | Ethiopia | [25] |
| 7 | S | RLEM | 1.0 and 1.5 | Iran | [26] |
| 8 | S | RLEM | 1.3 | China | [27] |
| 9 | S | SRE | 1.0 and 1.5 | Indonesia | [28] |
| 10 | S | / | 1.0 | Korea | [29] |
| 11 | S | SRE | 1.35 | USA | [30] |
| 12 | S | / | 1.4 | India | [31] |
| Working Condition | Allowable Safety Factors | |||
|---|---|---|---|---|
| USBR [32] | USACE [33] | FERC [34] | China [35] | |
| Usual | 3.0 | 2.0 | 3.0 | 3.0 |
| Unusual | 2.0 | 1.7 | 2.0 | 2.5 |
| Extreme | 1.0 | 1.3 | / | 2.3 |
| Working Condition | Allowable Safety Factors | |||||
|---|---|---|---|---|---|---|
| CAD [36] | ANCOLD [37] | USACE [38] | ||||
| A Priori Information or Not | No | Test of Strength Parameters | Not Well Defined | Well Defined | Well Defined | Ordinary |
| Usual | 3.0 | 2.0 | 3.0 | 2.0 | 2.0 | 1.7 |
| Unusual | 2.0 | 1.5 | 2.0 | 1.5 | 1.5 | 1.3 |
| Extreme | 1.31 | 1.1 | 1.5 | 1.3 | 1.1 | 1.1 |
| Code | Component | Safety Factor |
|---|---|---|
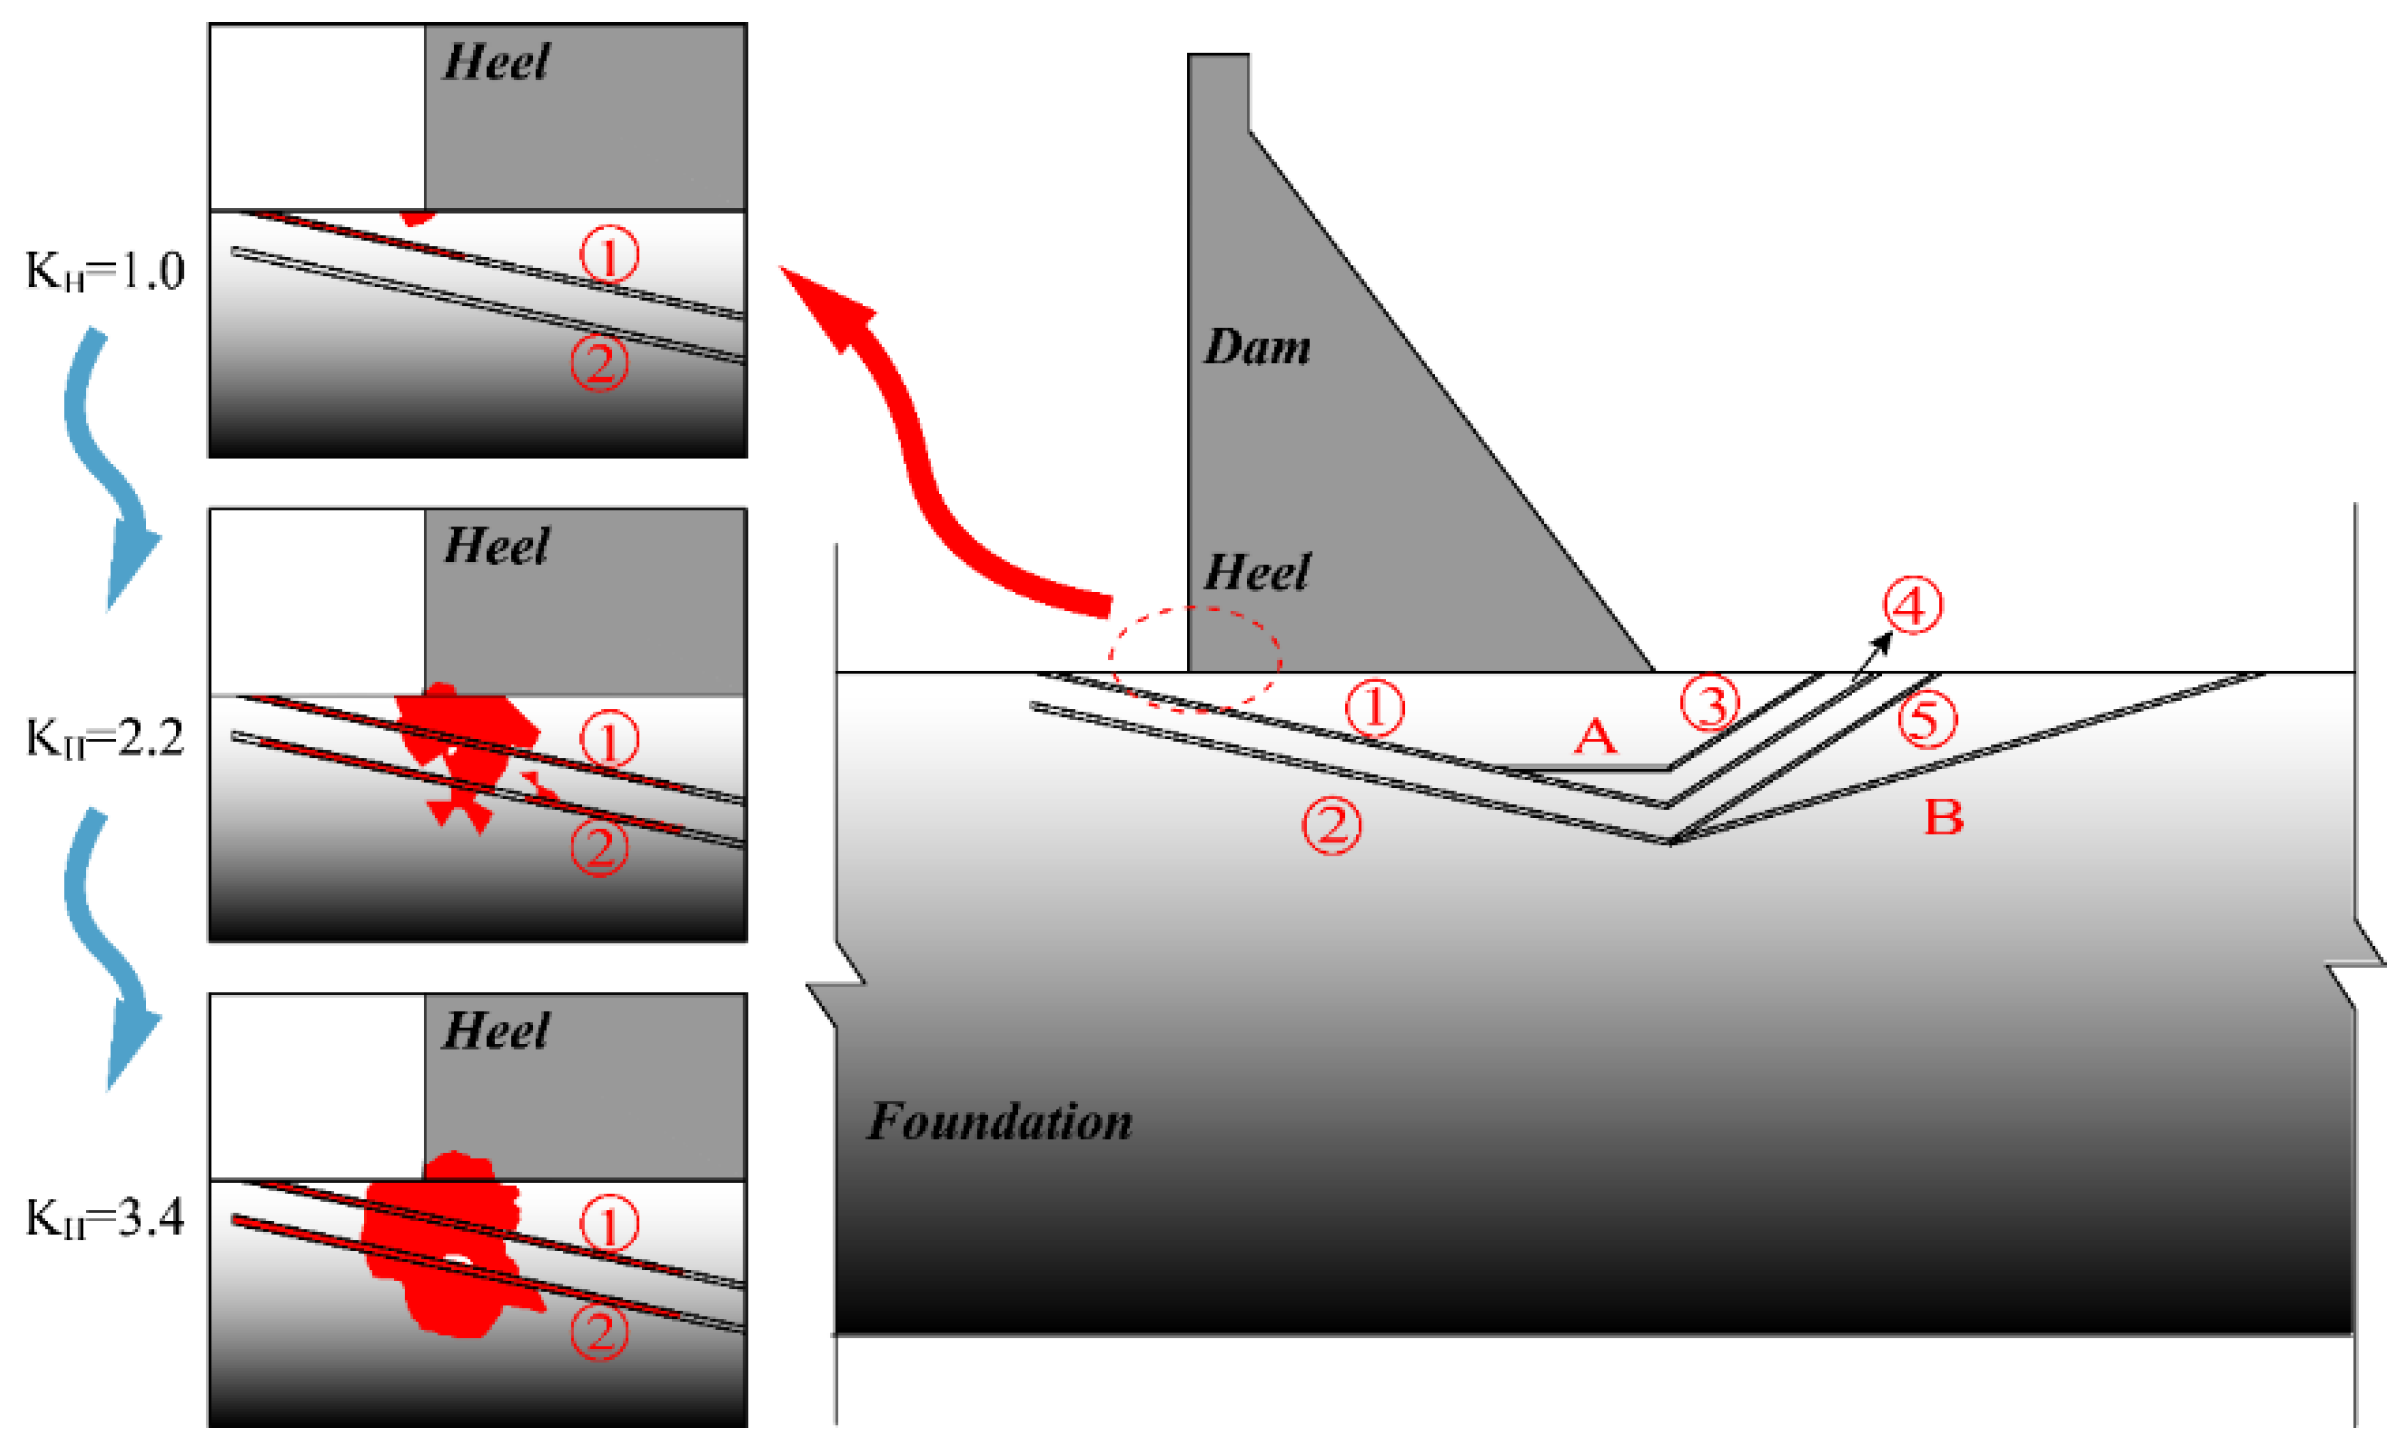
| Path 1 | ➀, A, ➂, ➃; | KS1 |
| Path 2 | ➀, ➃ | KS2 |
| Path 3 | ➁, ➄ | KS3 |
| Path 4 | ➁, B | KS4 |
| Path 5 | Foundation surface | KS5 |
| Location | E (GPa) | Poisson Ratio | Density (kg/m3) | (MPa) | Note | |
|---|---|---|---|---|---|---|
| Dam | 28.00 | 0.20 | 2400 | 1.20 | 1.20 | |
| Foundation | 20.00 | 0.22 | 2800 | 2.00 | 1.40 | |
| Fracture zone | 0.50 | 0.35 | 2000 | 0.10 | 0.60 | |
| Joint | / | / | 2800 | 0.20 | 0.80 | Connectivity rate is 60% |
| Location | Material Parameter | Distribution Type | Mean Value | Variation Coefficient |
|---|---|---|---|---|
| Dam | E (GPa) | Lognormal | 28.00 | 0.10 |
| (MPa) | Lognormal | 1.20 | 0.25 | |
| Normal | 1.20 | 0.15 | ||
| Foundation | E (GPa) | Lognormal | 20.00 | 0.15 |
| (MPa) | Lognormal | 2.00 | 0.30 | |
| Normal | 1.40 | 0.20 | ||
| Fracture zone | E (GPa) | Lognormal | 0.50 | 0.25 |
| (MPa) | Lognormal | 0.10 | 0.35 | |
| Normal | 0.60 | 0.25 | ||
| Joint | (MPa) | Lognormal | 0.20 | 0.35 |
| Normal | 0.80 | 0.25 | ||
| Upstream water level (m) | Normal | 190.00 | 0.05 | |
| Statistical Parameters | KS1 | KS2 | KS3 | KS4 | KS5 | KH |
|---|---|---|---|---|---|---|
| Mean | 3.53 | 3.96 | 4.68 | 3.70 | 3.56 | 2.03 |
| Standard deviation | 0.41 | 0.51 | 0.61 | 0.41 | 0.53 | 0.7 |
| Guaranteed rate | 54.90% | 53.90% | 52.20% | 55.10% | 63.30% | 36.00% |
| Guaranteed rate for | 89.99% | 96.77% | 99.72% | 95.84% | 86.66% | / |
| Sig. (K-S inspection) | 0.13 | 0.06 | 0.12 | 0.11 | 0.06 | 0.09 |
| Parameters | Distribution | |||
|---|---|---|---|---|
| Case 1 | Case 2 | Case 3 | Case 4 | |
| Normal | Log-normal | Normal | Log-normal | |
| Normal | Normal | Log-normal | Log-normal | |
| Terms | Gravity Dams | Arch Dams |
|---|---|---|
| Overload safety factor | 3.4 | 6.4 |
| Guaranteed rate | 36% | 47.12% |
| Overload safety factor with a guaranteed rate of 85% | 1.82 | 5.32 |
Disclaimer/Publisher’s Note: The statements, opinions and data contained in all publications are solely those of the individual author(s) and contributor(s) and not of MDPI and/or the editor(s). MDPI and/or the editor(s) disclaim responsibility for any injury to people or property resulting from any ideas, methods, instructions or products referred to in the content. |
© 2024 by the authors. Licensee MDPI, Basel, Switzerland. This article is an open access article distributed under the terms and conditions of the Creative Commons Attribution (CC BY) license (https://creativecommons.org/licenses/by/4.0/).
Share and Cite
Wang, D.; Lu, X.; Zheng, C.; Gong, K.; Pan, L.; Pei, L.; Zhao, Z. Influence Analysis of Material Parameter Uncertainties on the Stability Safety Factor of Concrete Gravity Dams: A Probabilistic Method. Buildings 2024, 14, 2435. https://doi.org/10.3390/buildings14082435
Wang D, Lu X, Zheng C, Gong K, Pan L, Pei L, Zhao Z. Influence Analysis of Material Parameter Uncertainties on the Stability Safety Factor of Concrete Gravity Dams: A Probabilistic Method. Buildings. 2024; 14(8):2435. https://doi.org/10.3390/buildings14082435
Chicago/Turabian StyleWang, Daquan, Xiang Lu, Chengzhi Zheng, Ke Gong, Litan Pan, Liang Pei, and Zepeng Zhao. 2024. "Influence Analysis of Material Parameter Uncertainties on the Stability Safety Factor of Concrete Gravity Dams: A Probabilistic Method" Buildings 14, no. 8: 2435. https://doi.org/10.3390/buildings14082435