
Internal Damping Ratio of Normal- and High-Strength Concrete Considering Mechanical Damage Evolution

 , , , , , and
Abstract
:1. Introduction
2. Experimental Program
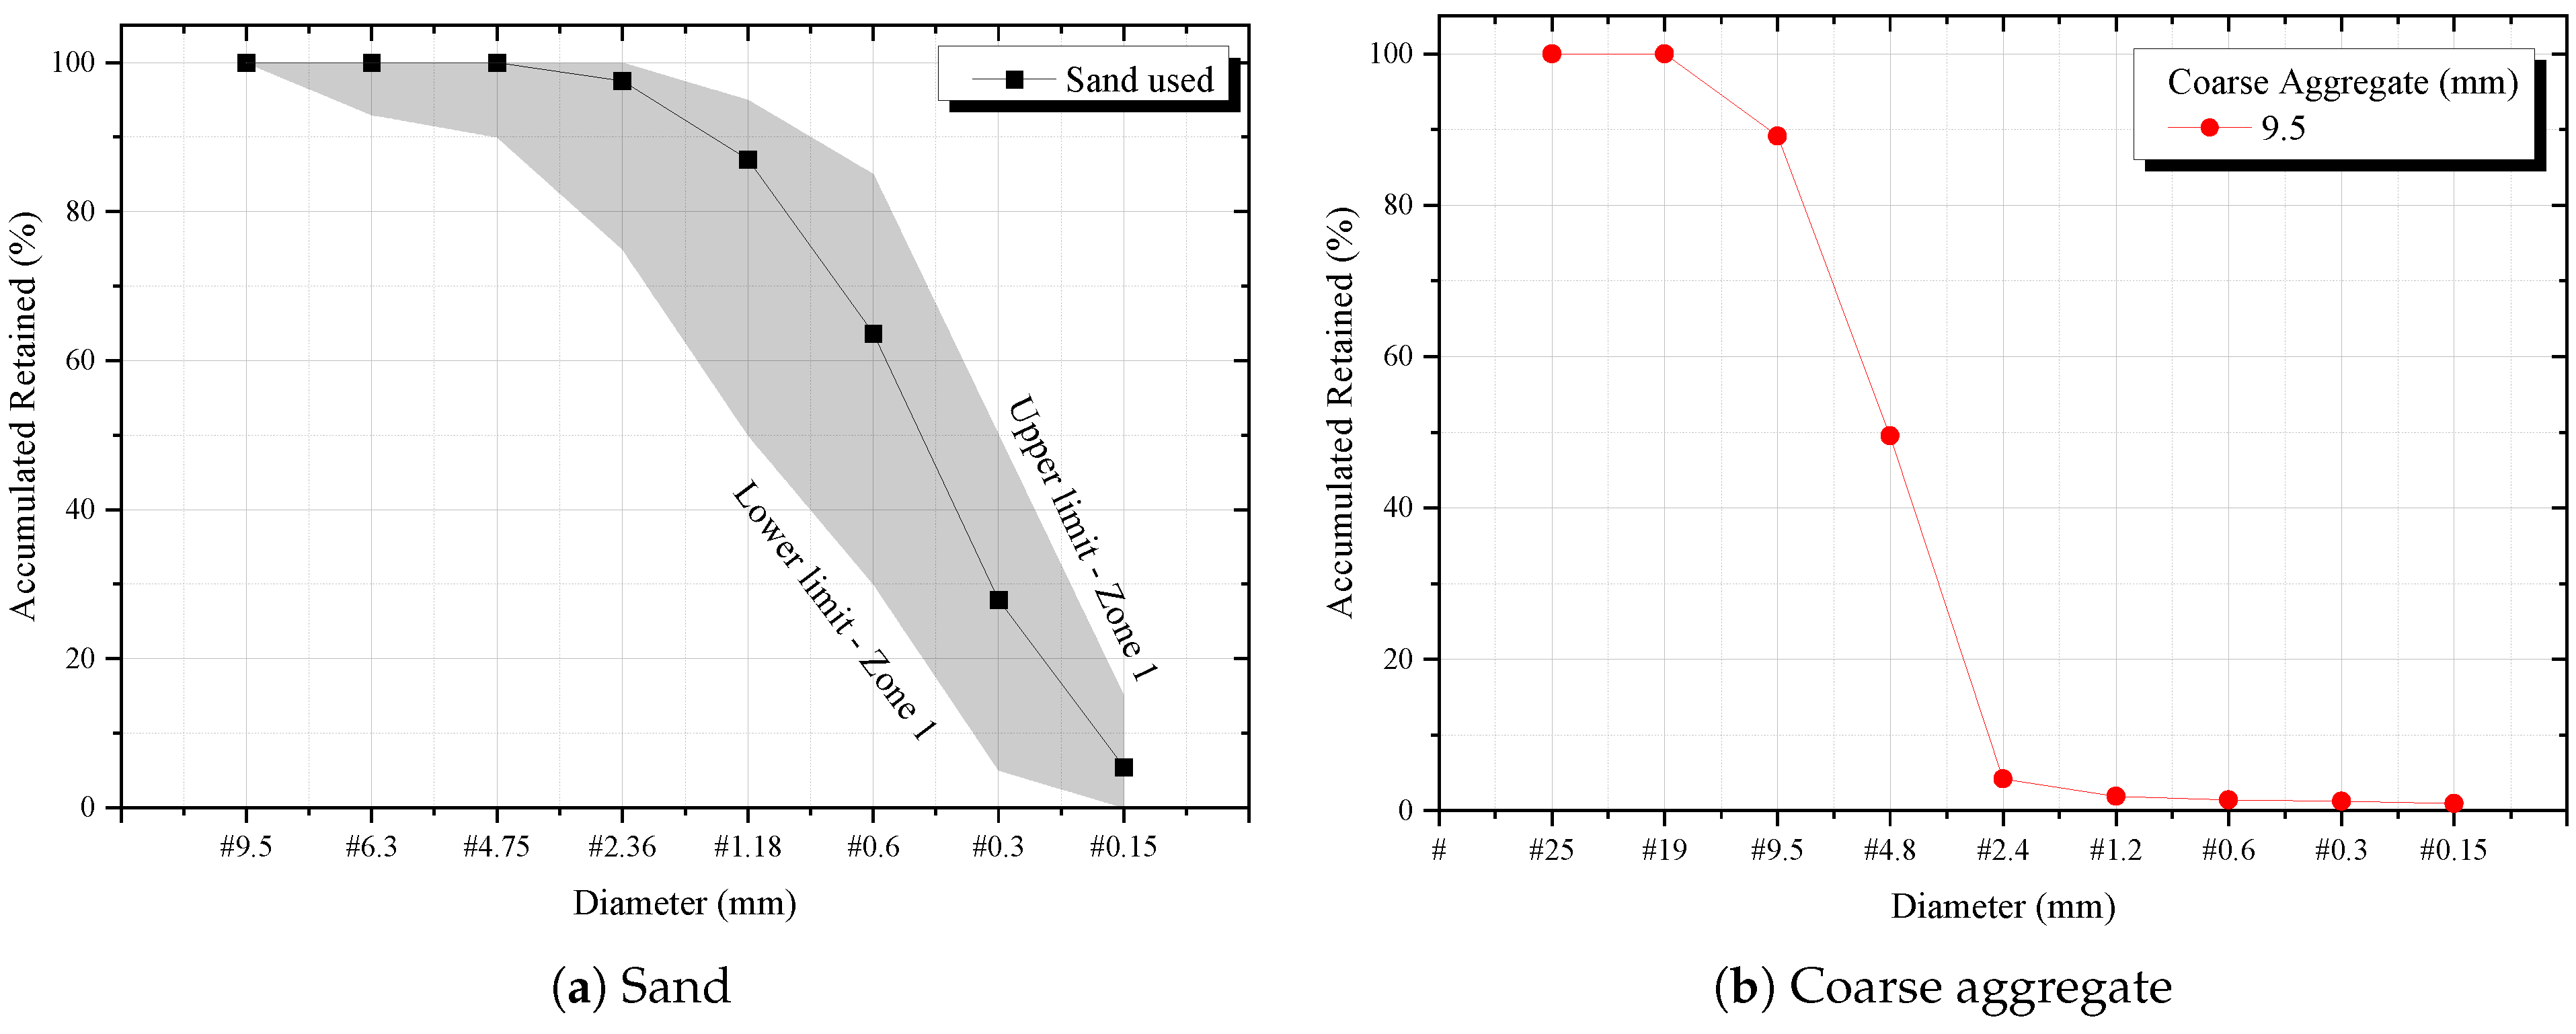
2.1. Materials and Mixtures
2.2. Cyclic Tests
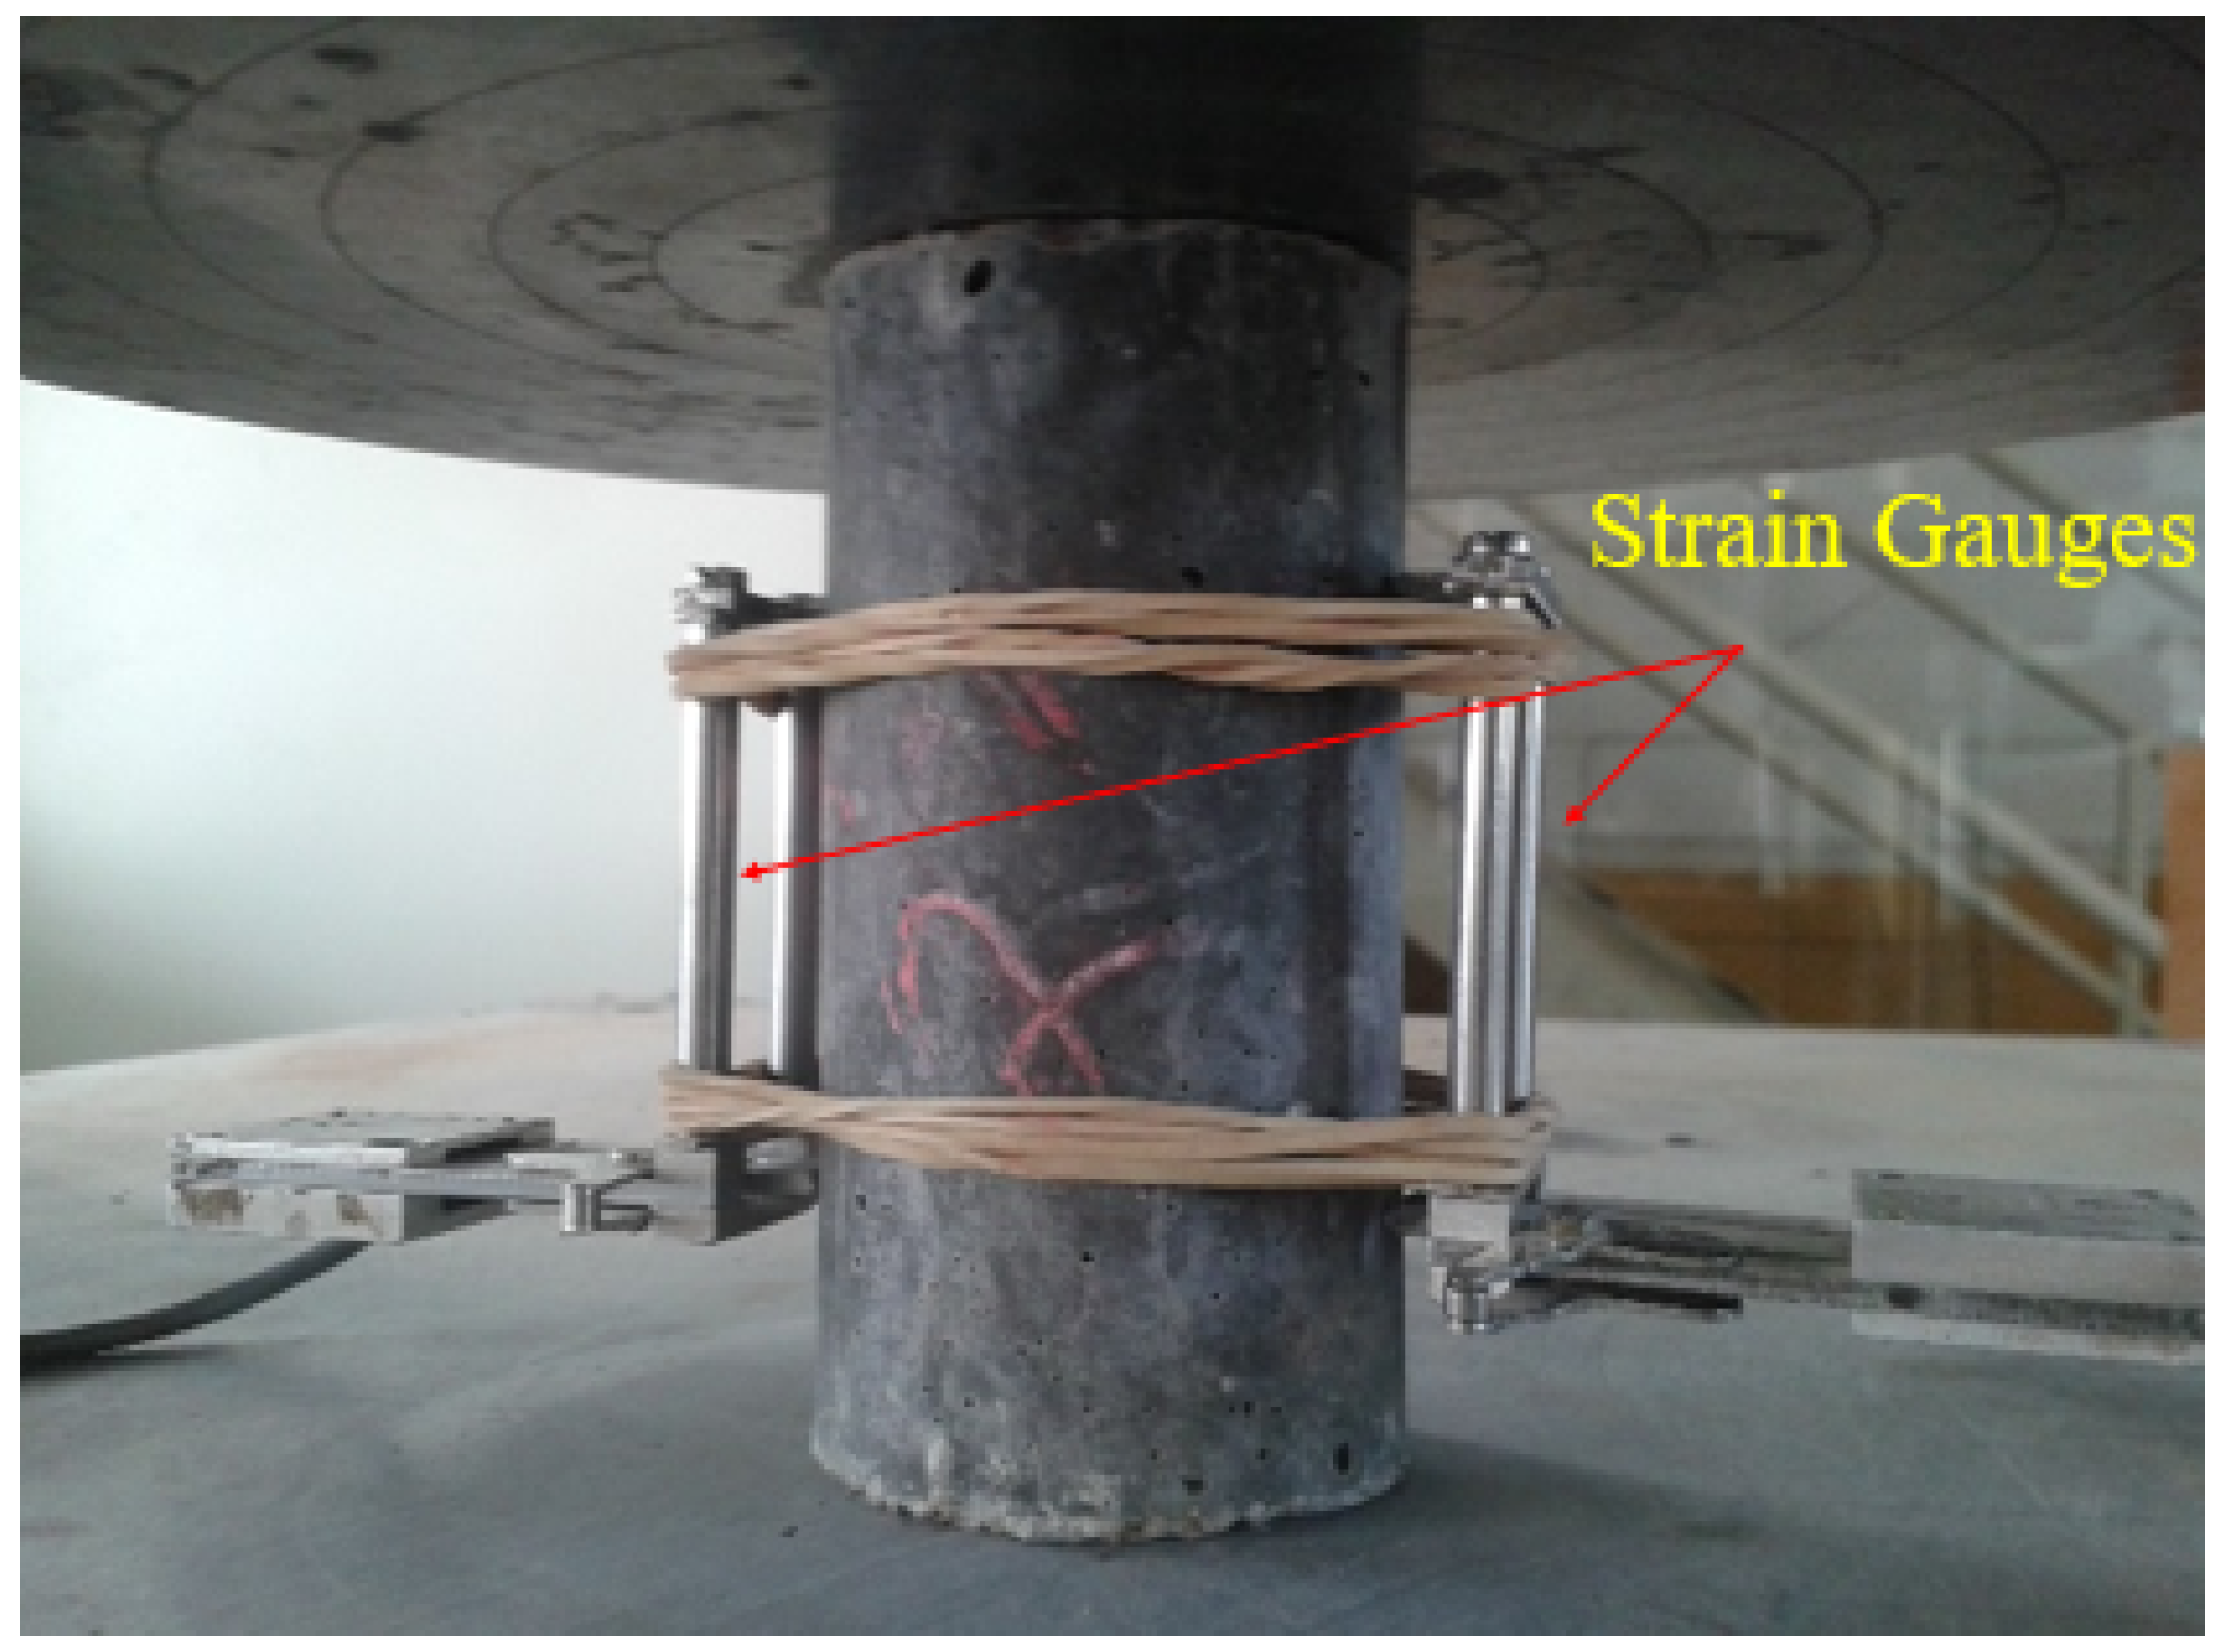
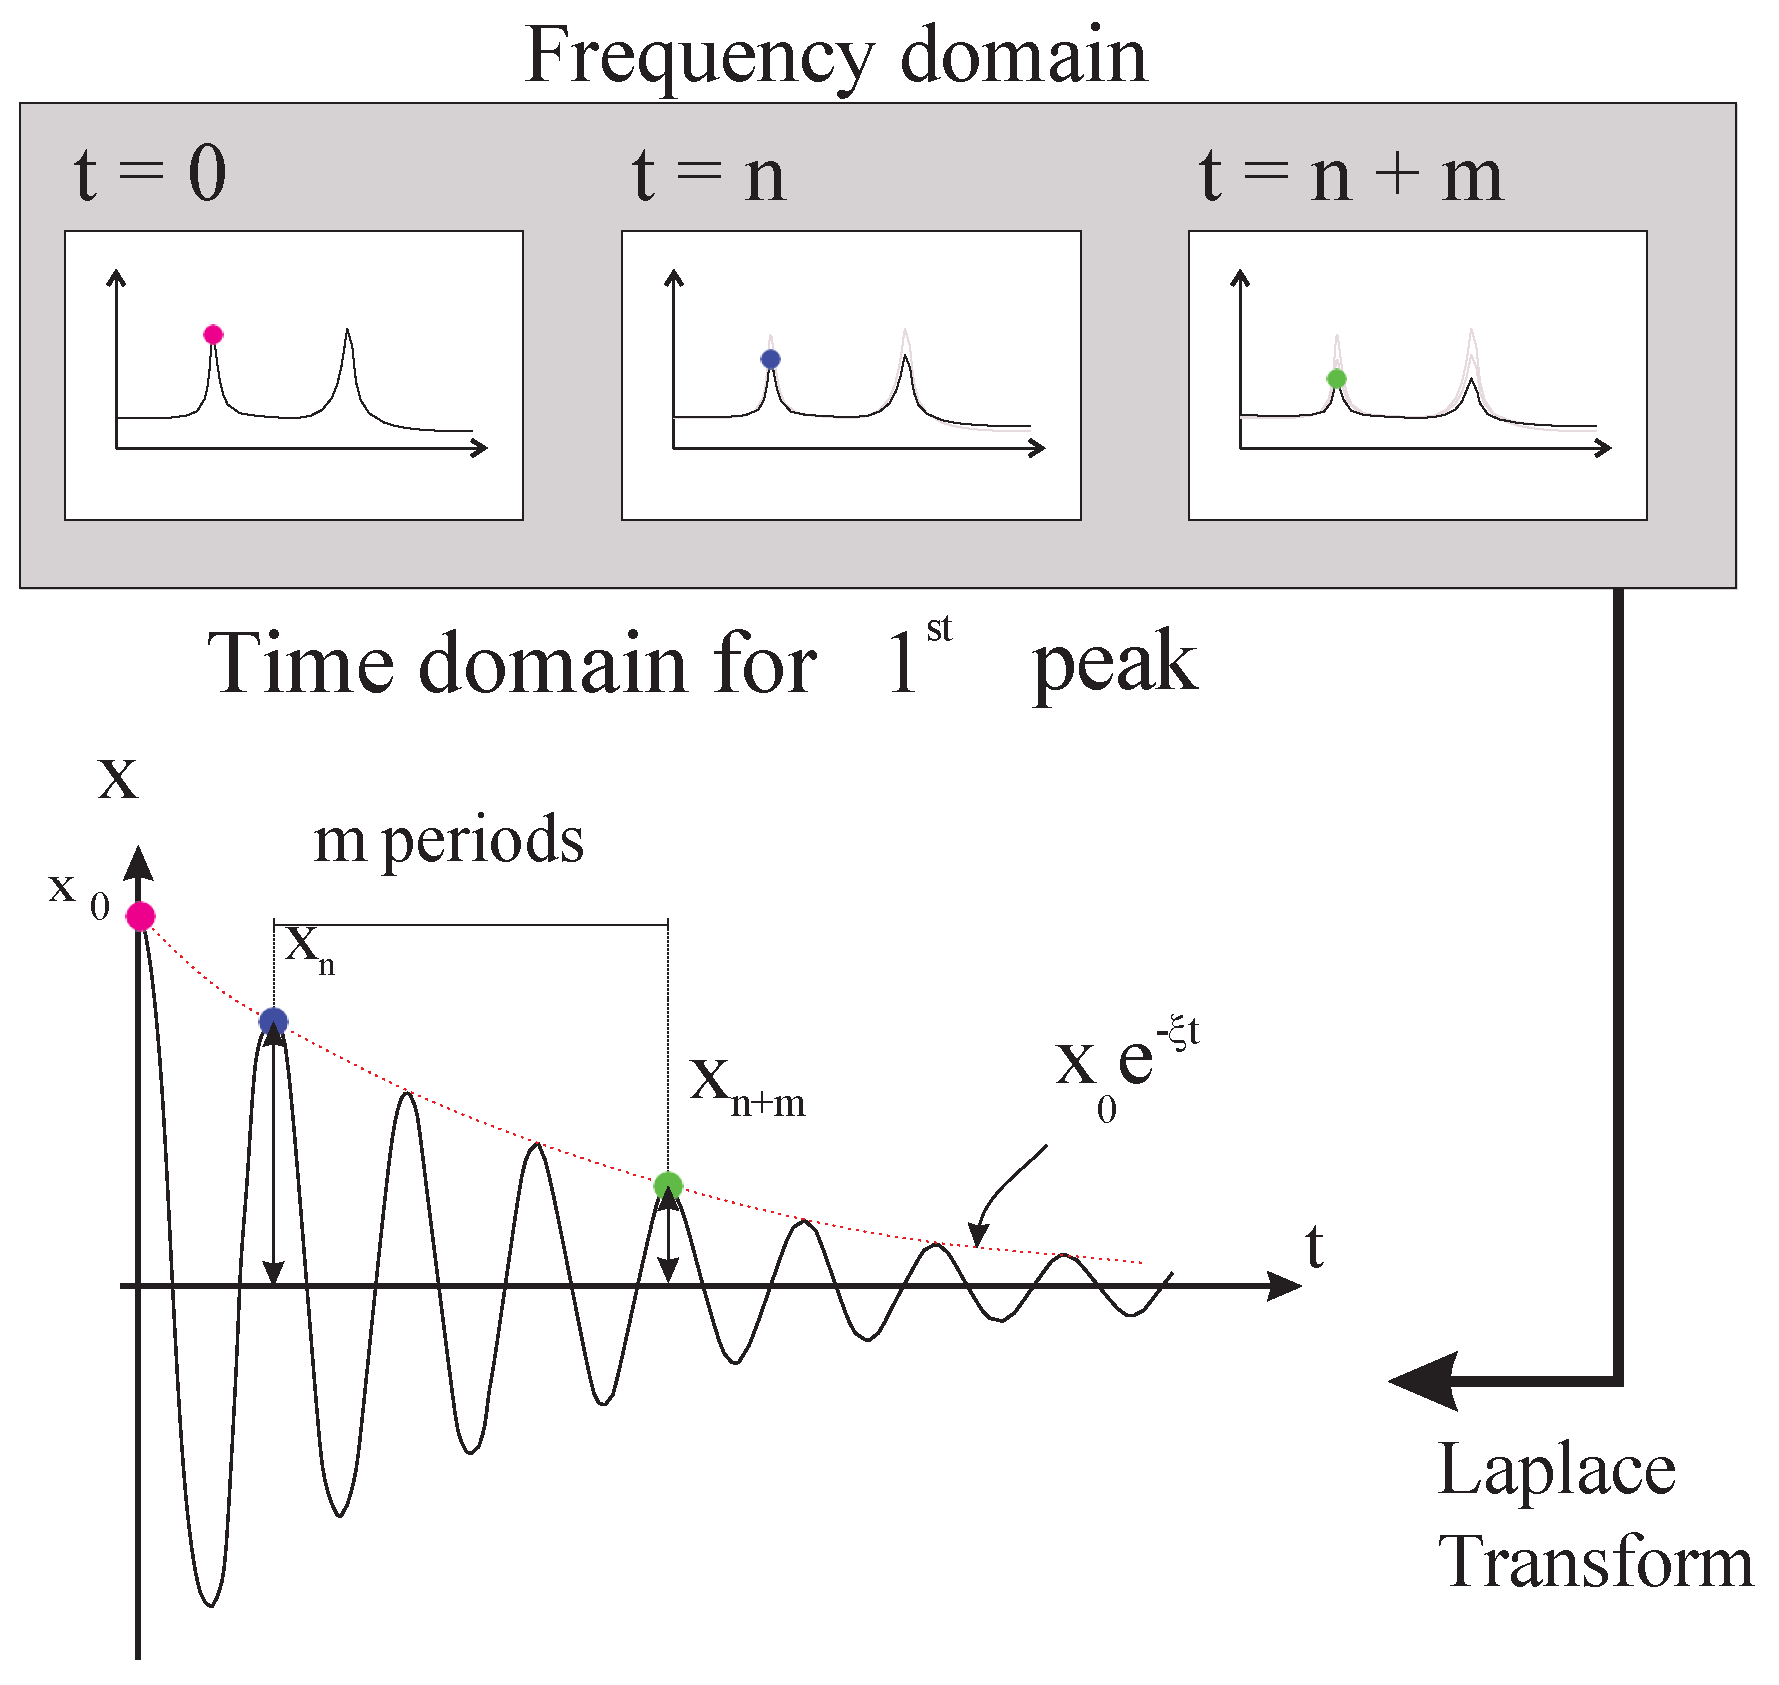
2.3. Acoustic Tests
3. Results
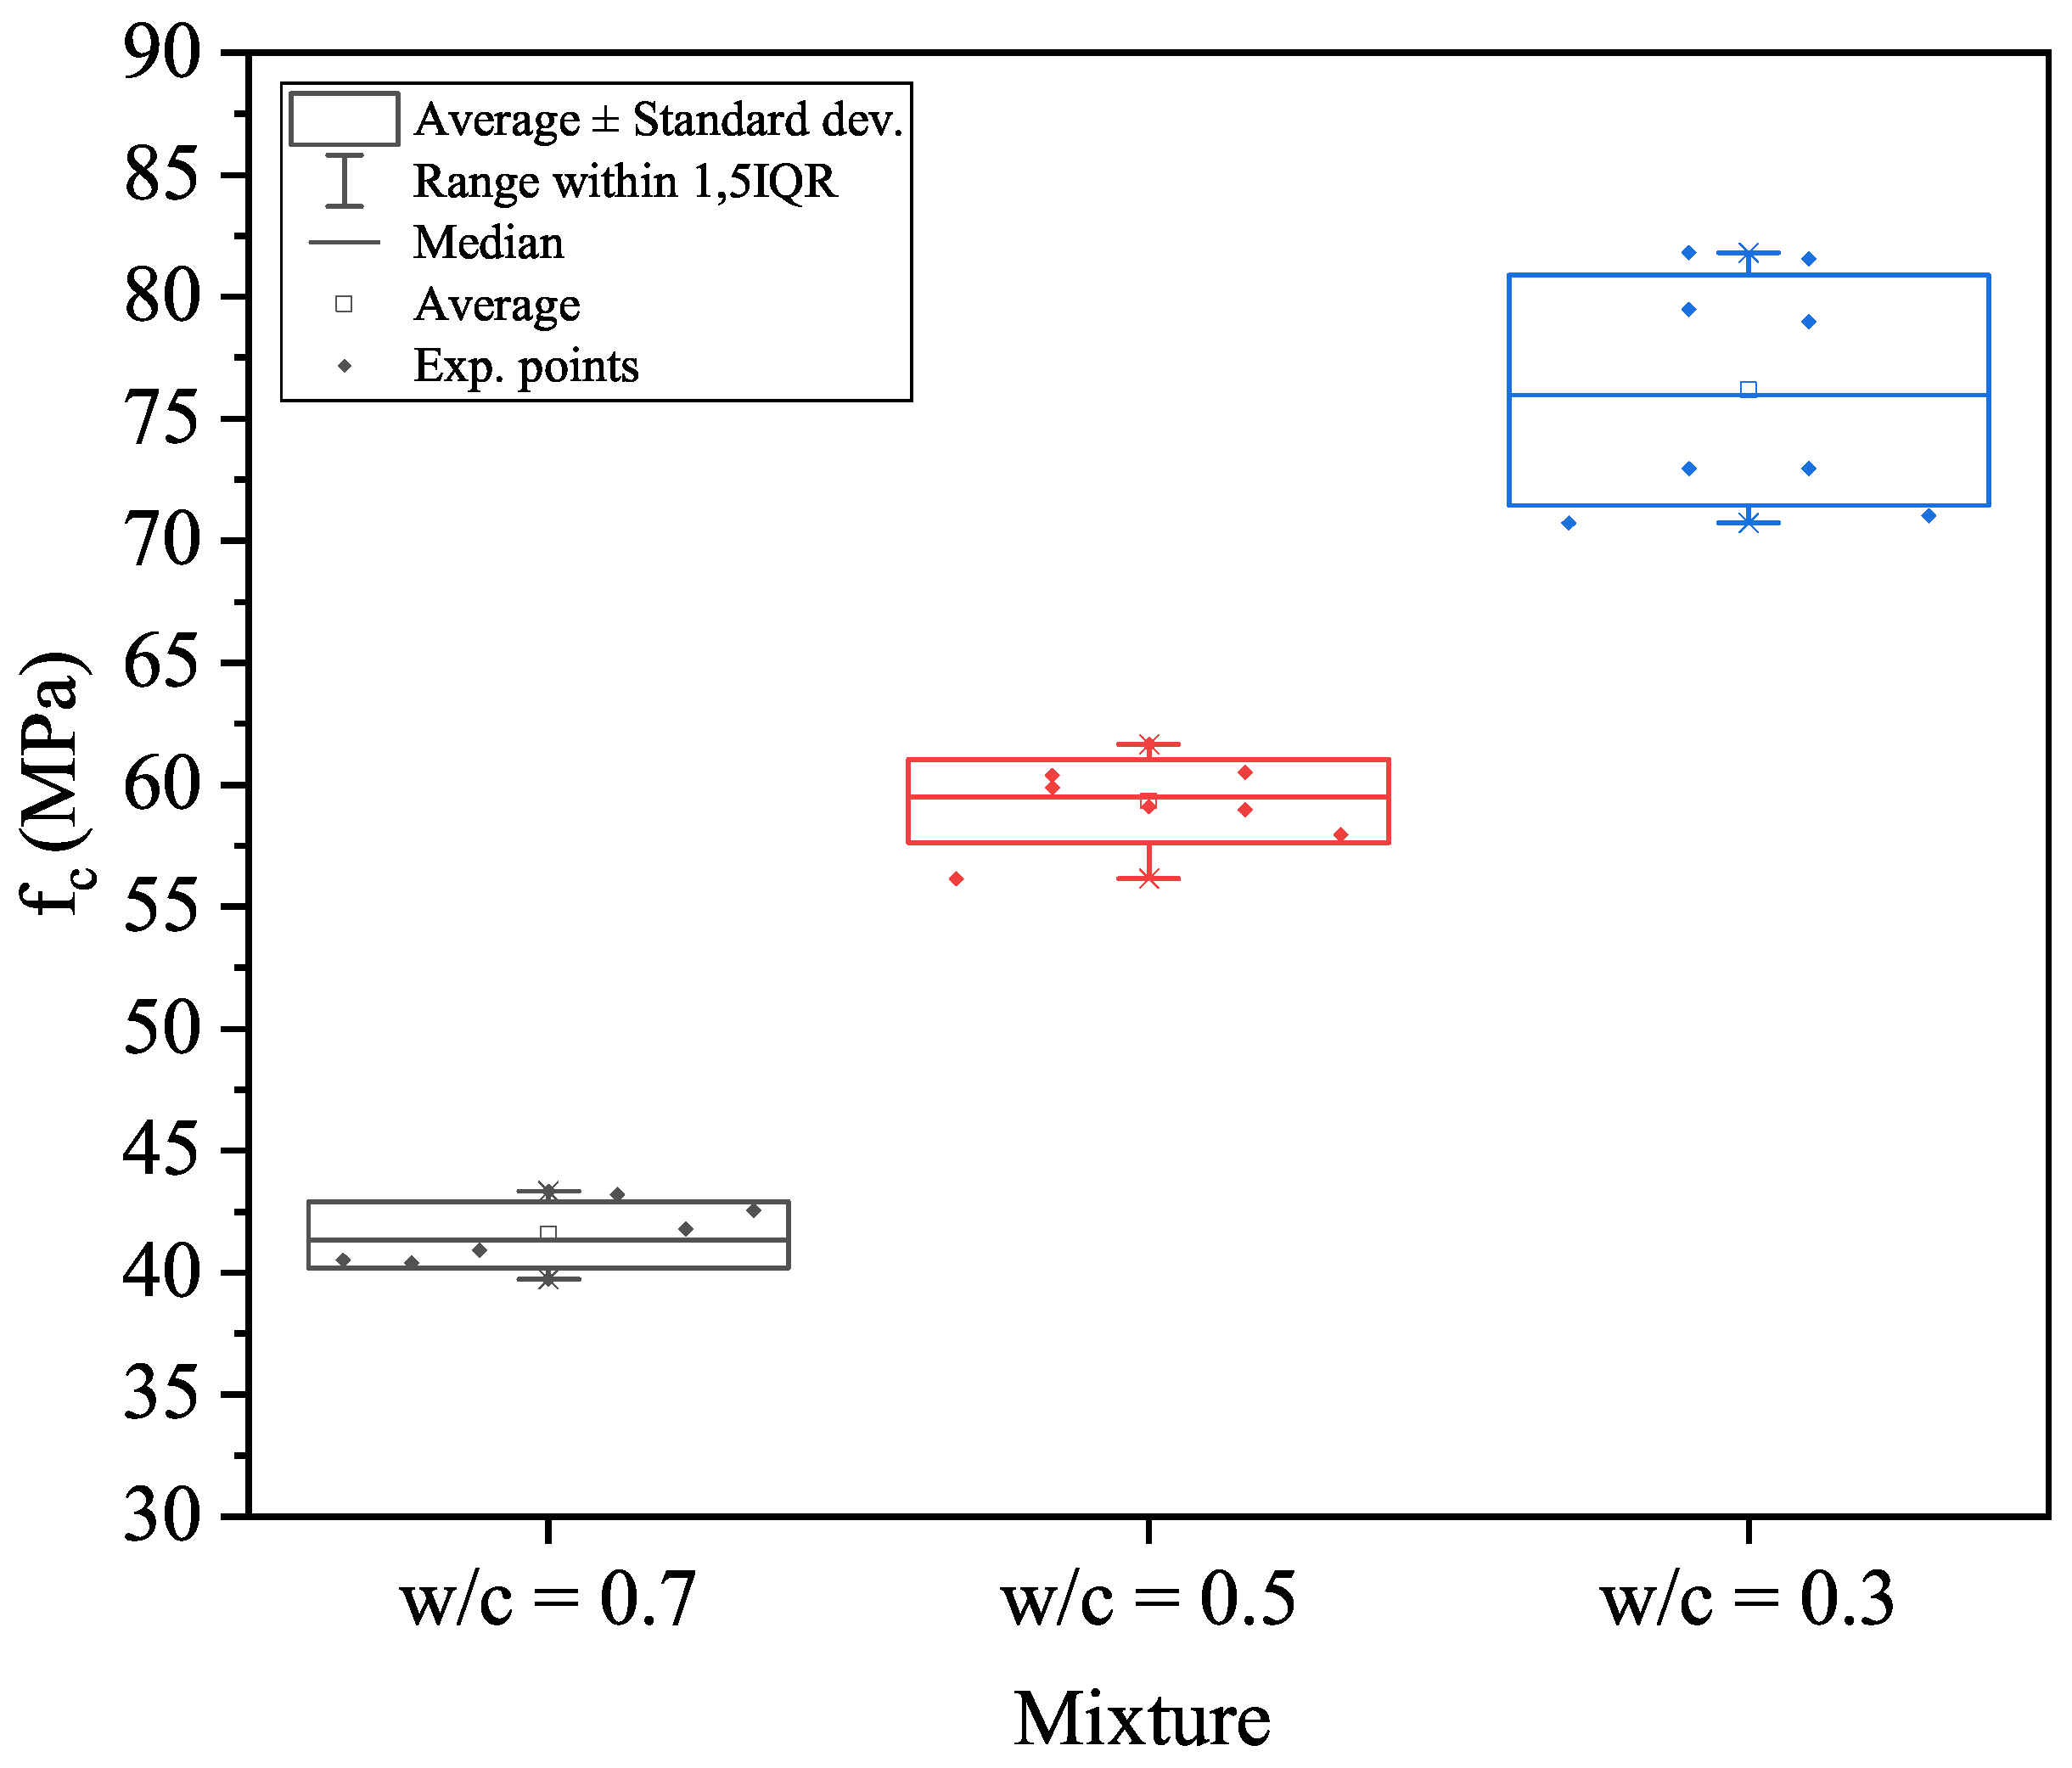
3.1. Uniaxial Compressive Strength
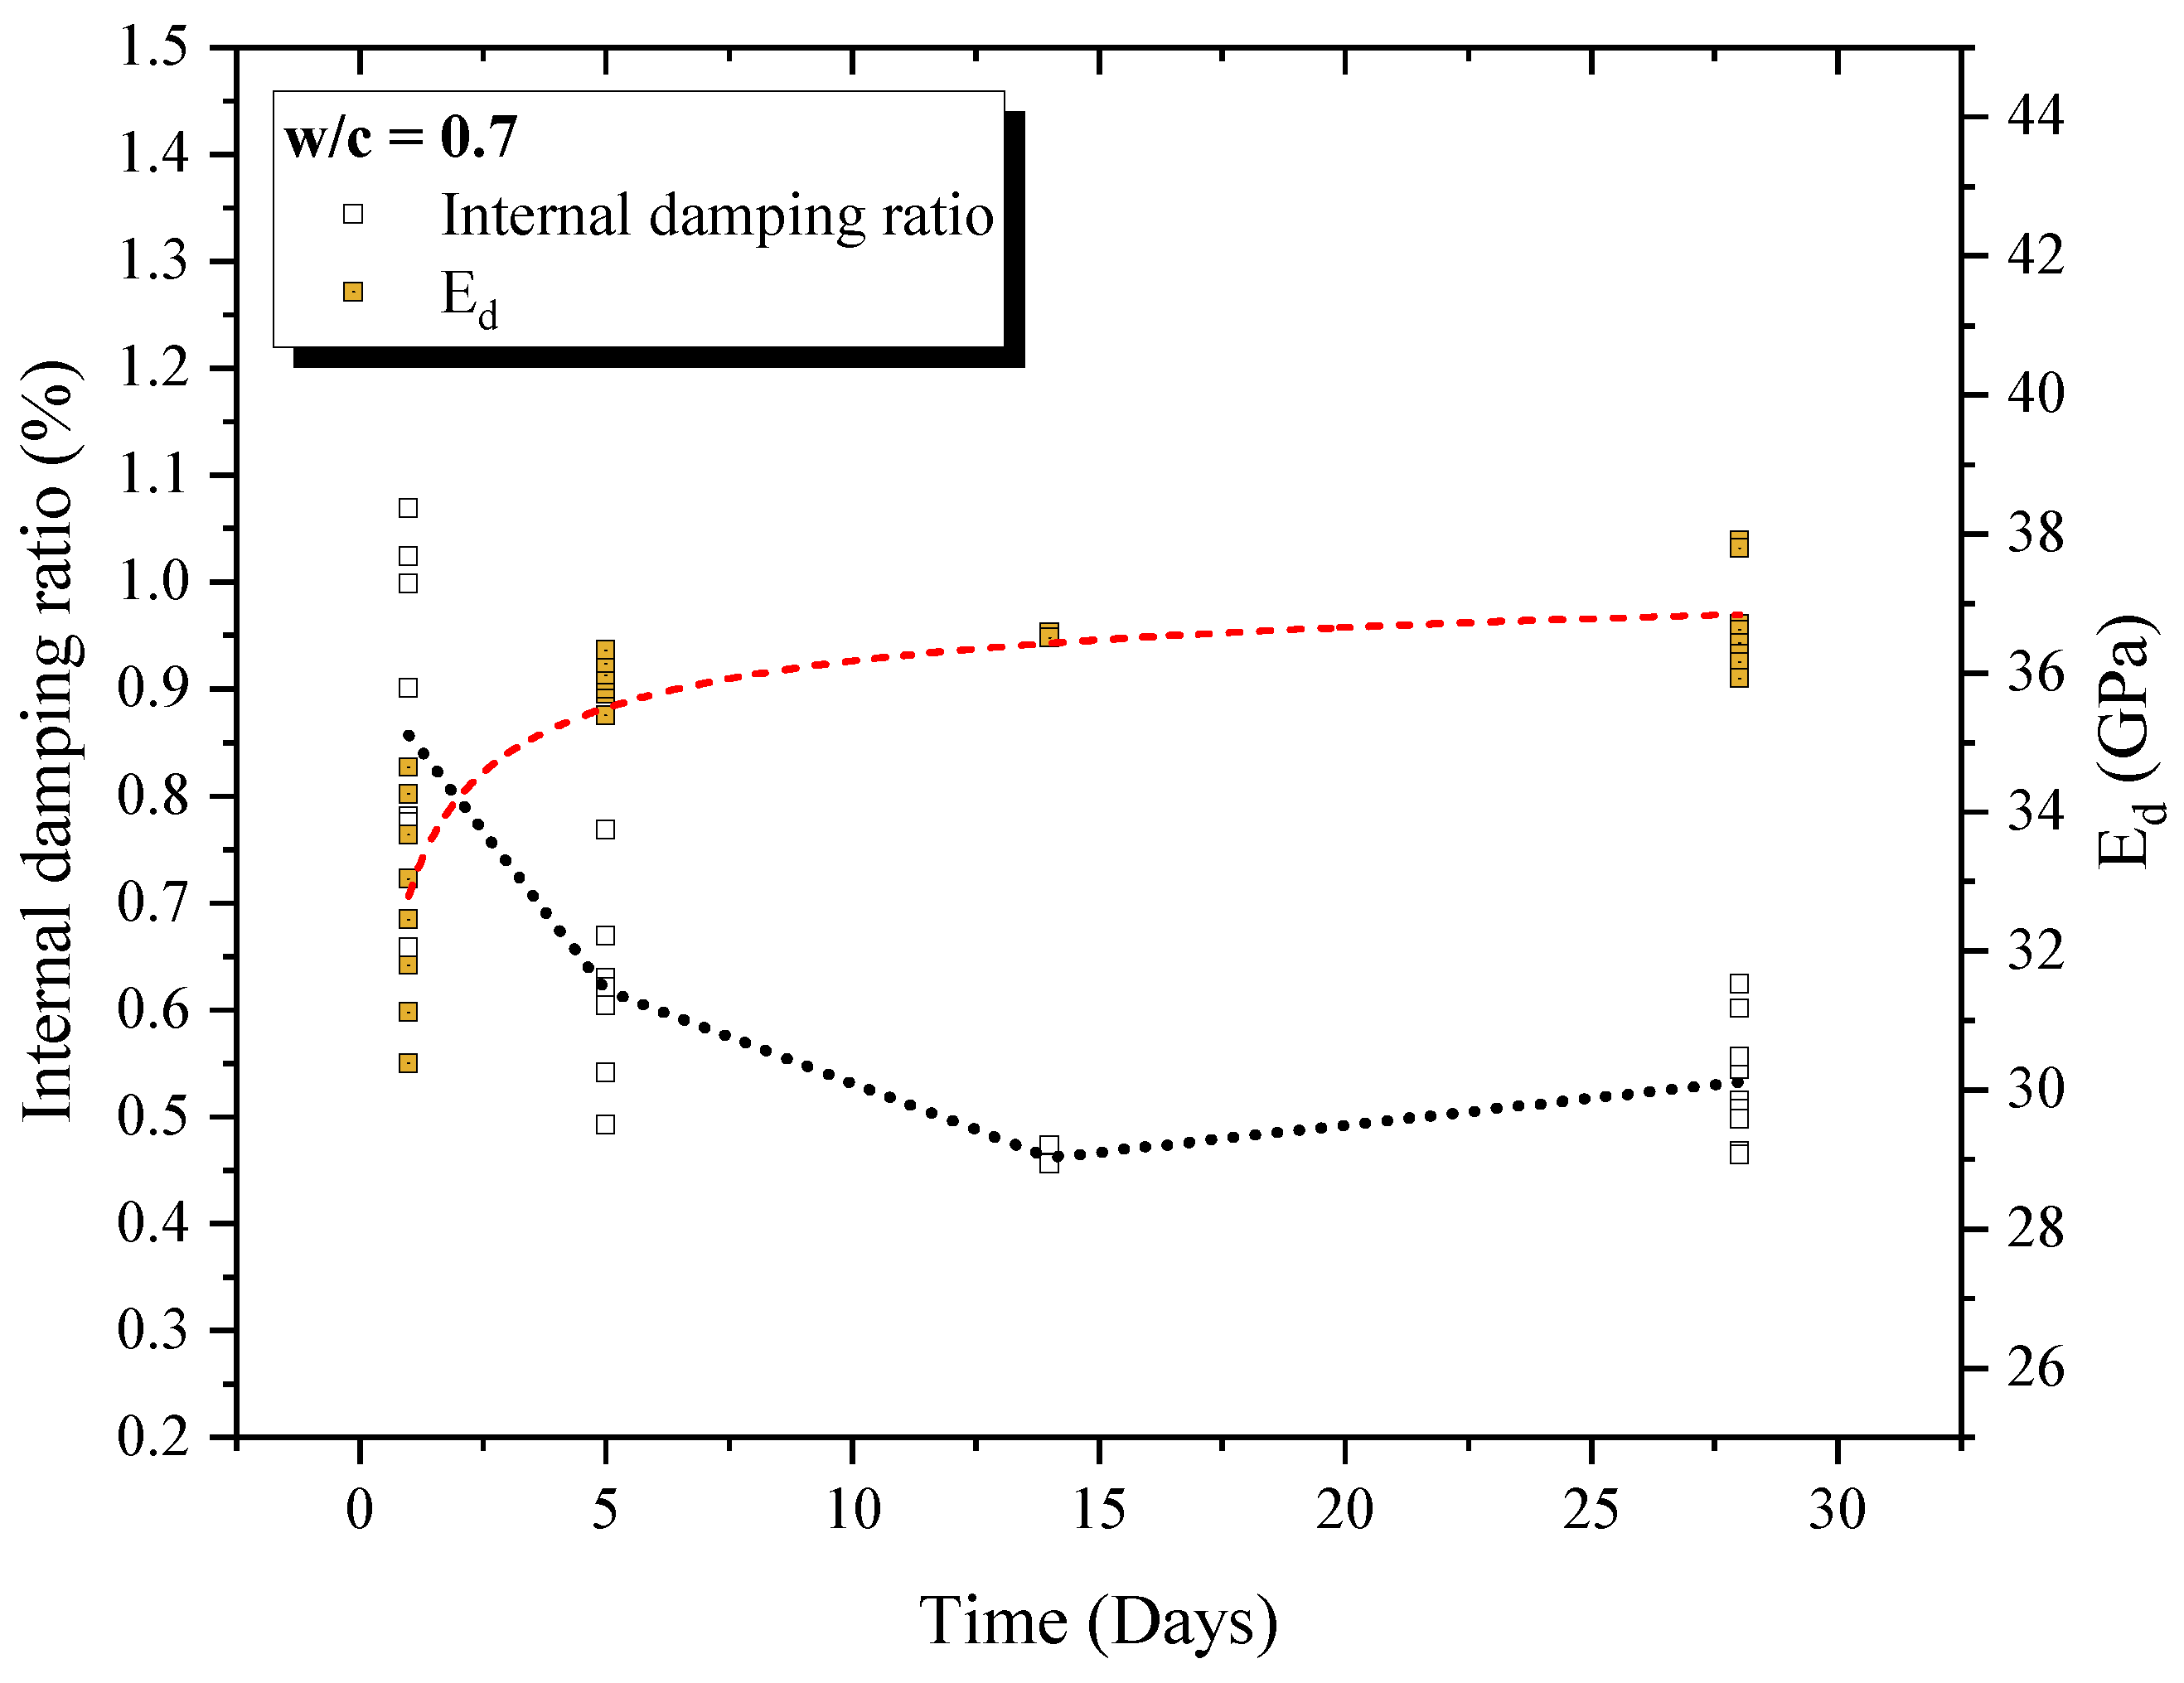
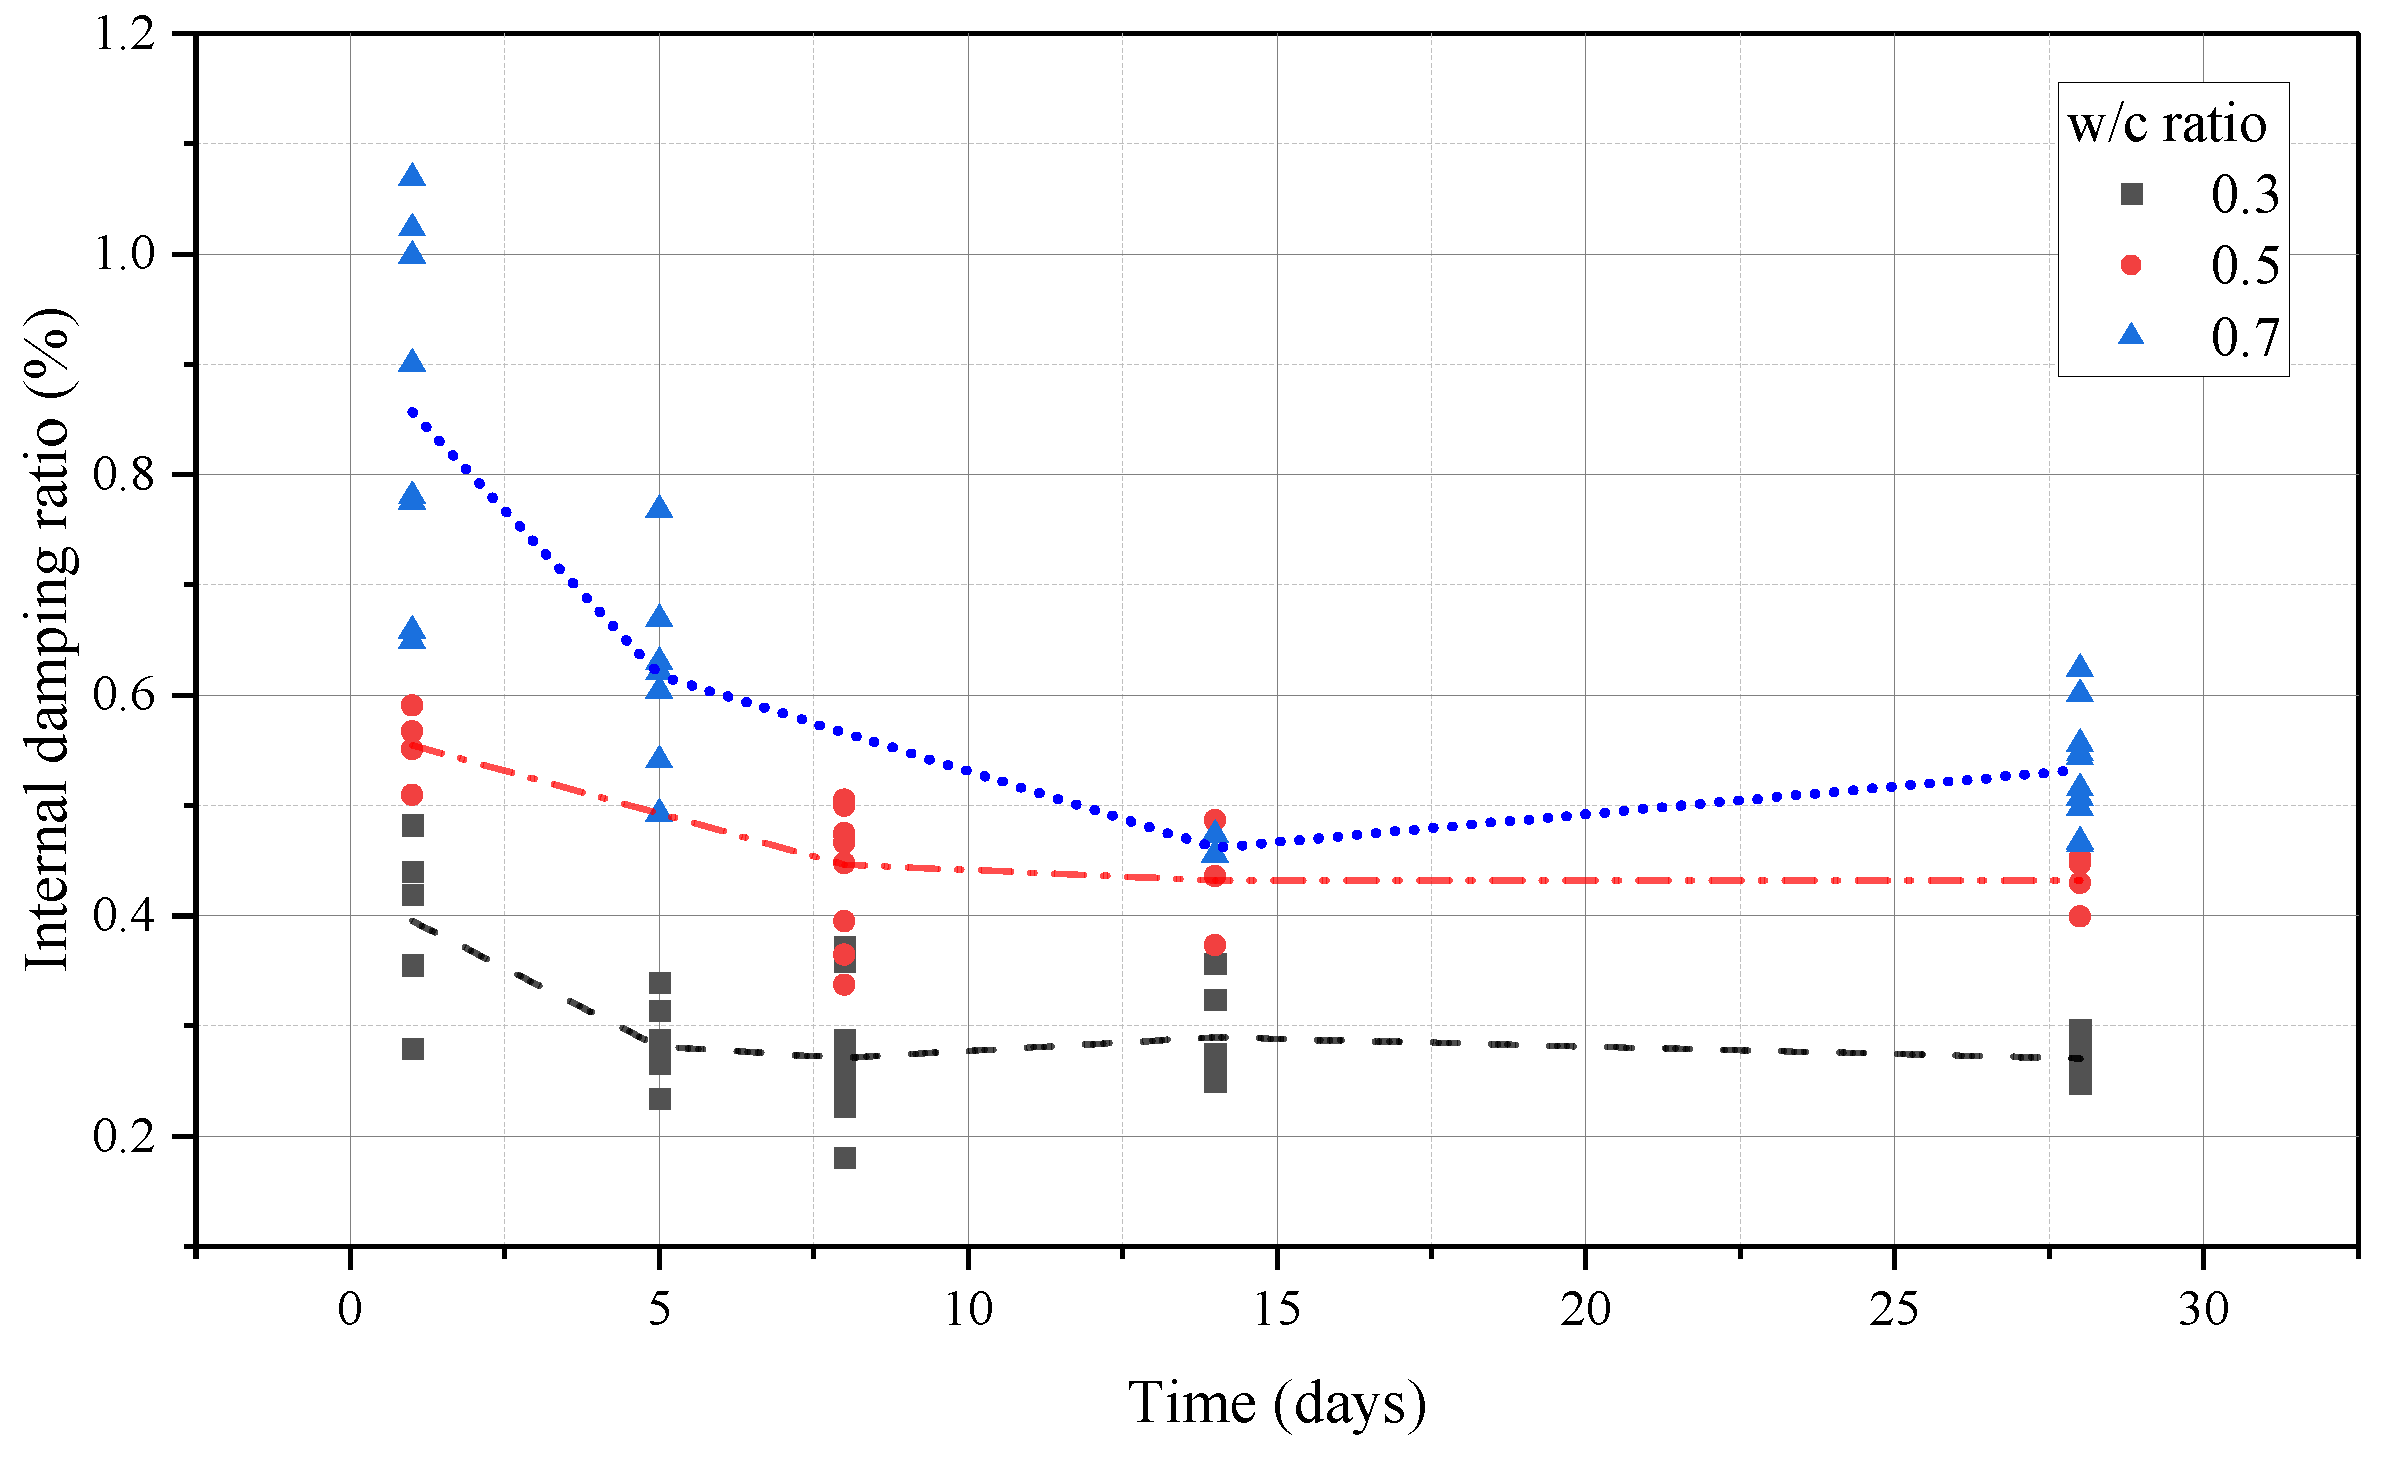
3.2. Undamaged Samples
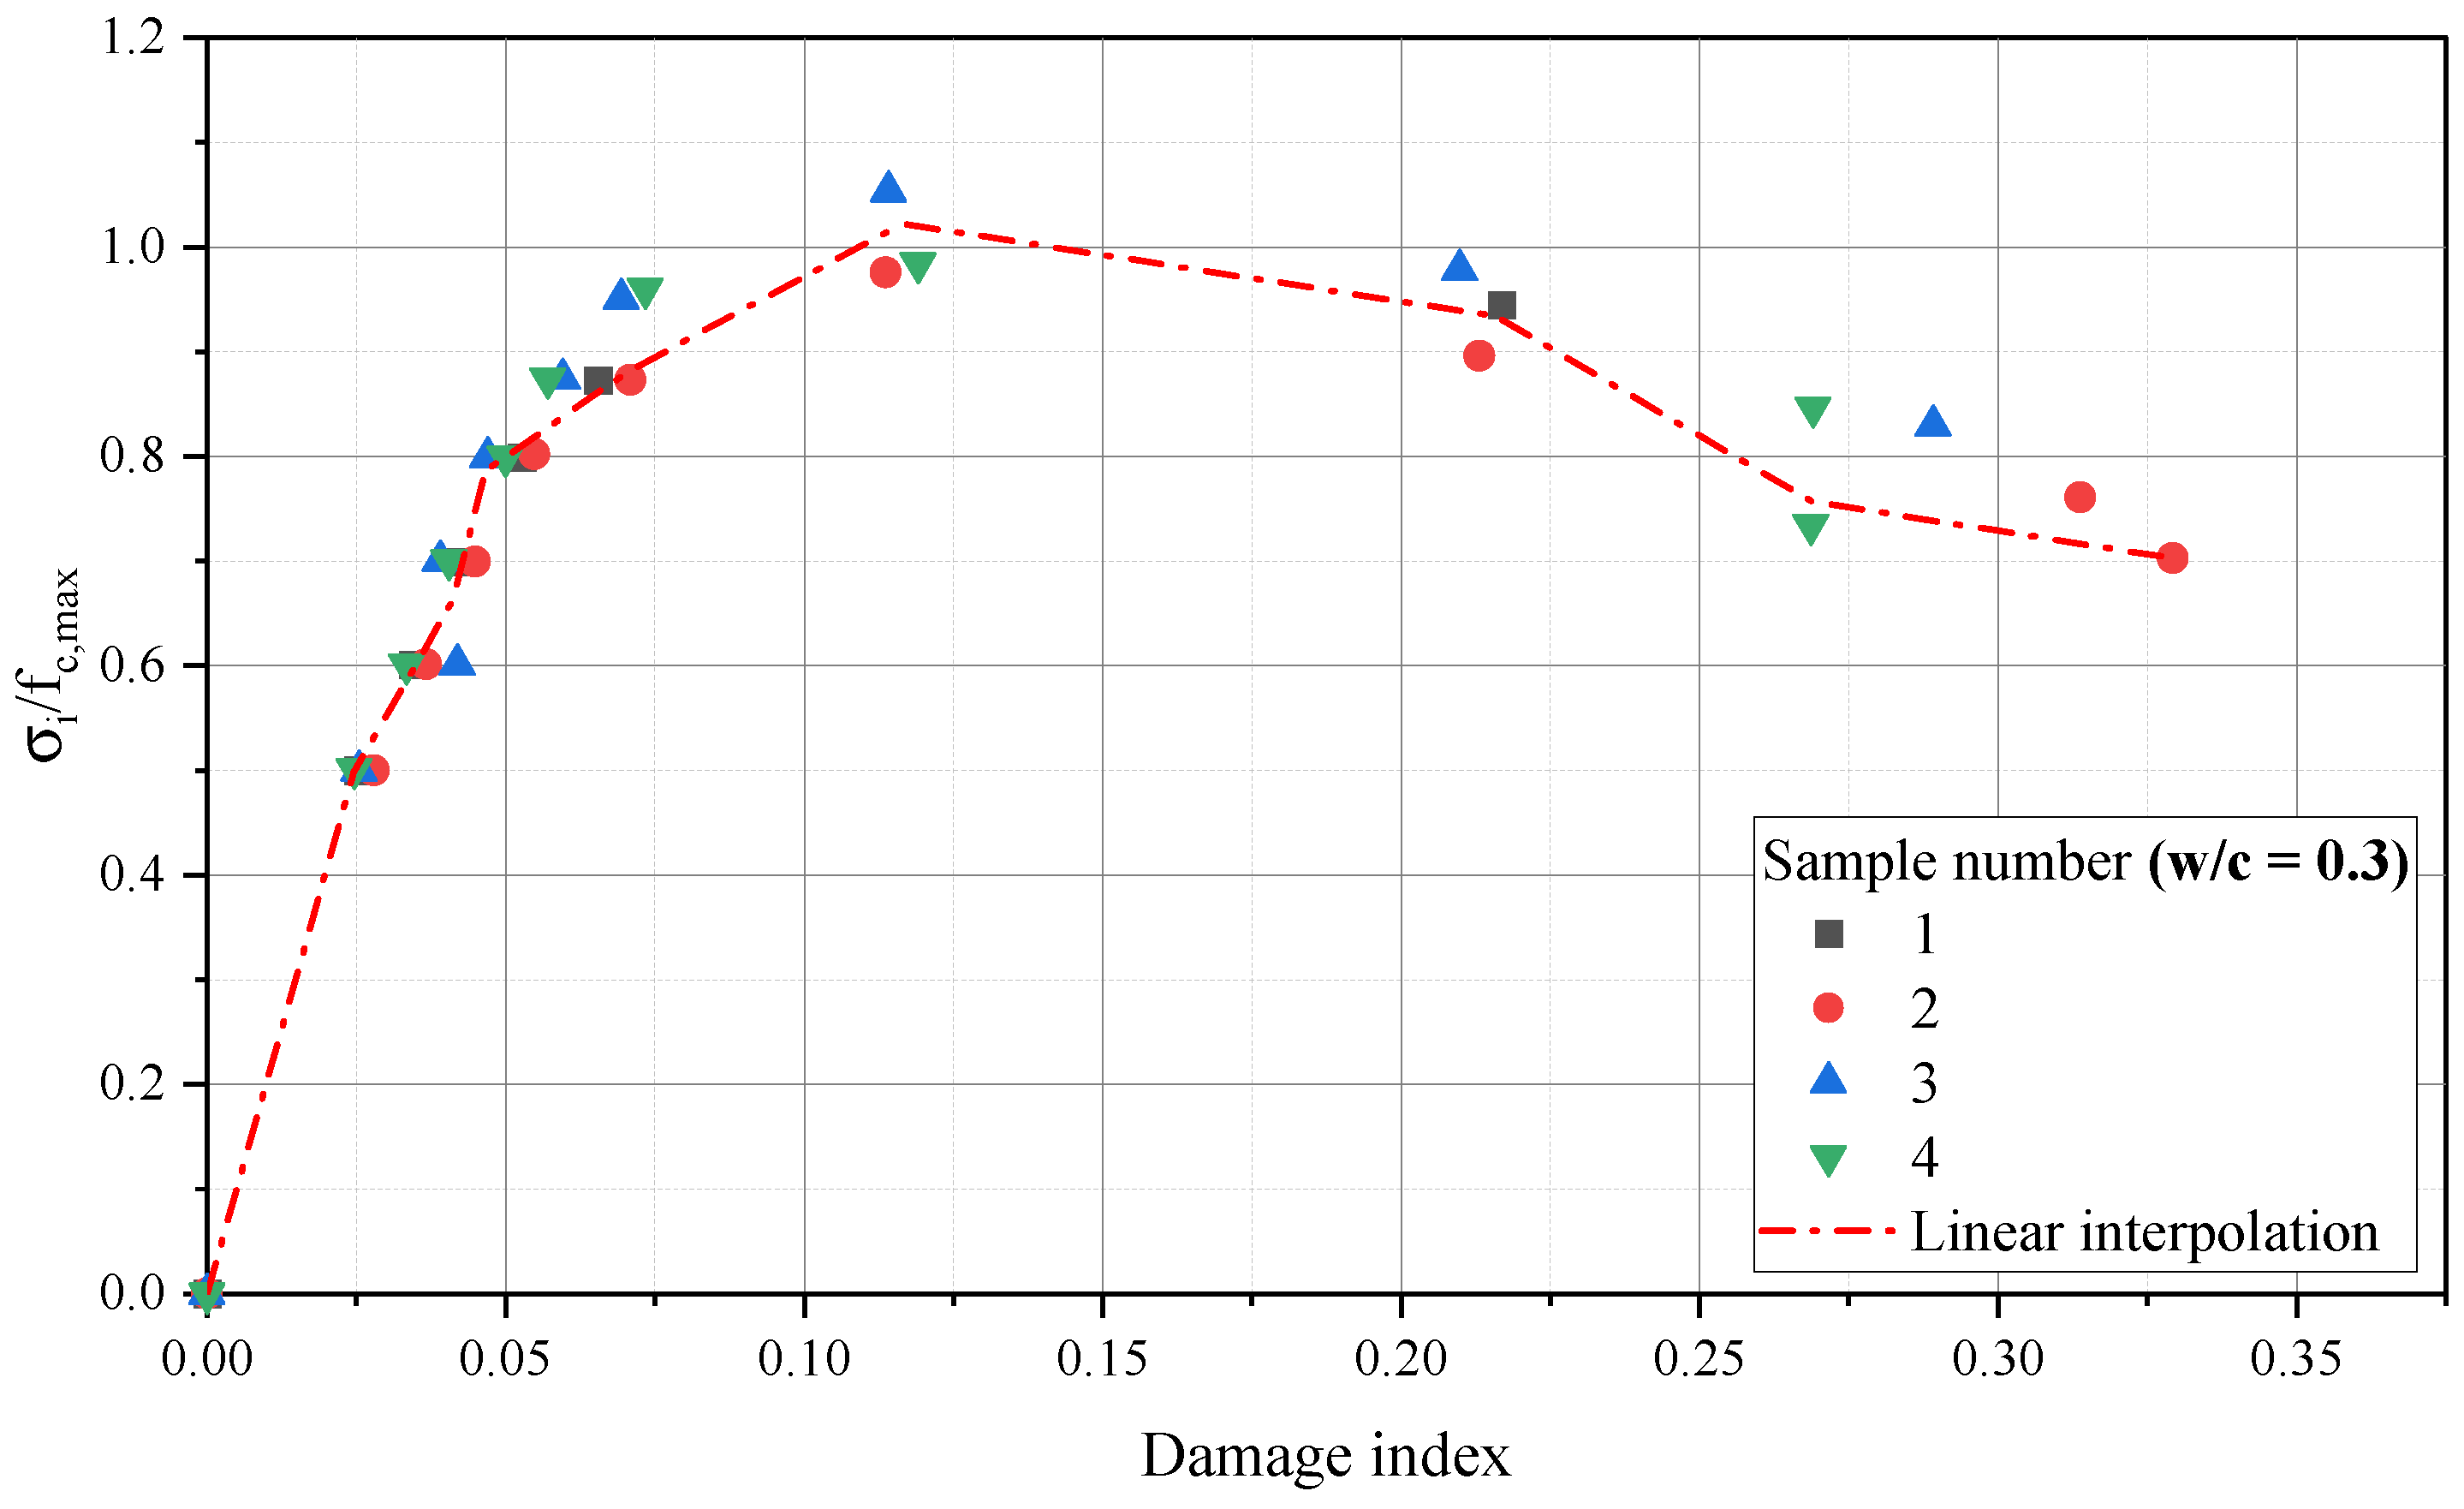
3.3. Damaged Samples
4. Conclusions
- The internal damping ratio is correlated with the water–cement (w/c) ratio, maturity, and dynamic modulus of elasticity. As the maturity increases, pore closure reduces viscous damping. C-S-H hydration reactions increase the material density, reducing internal dissipation and acoustic wave attenuation.
- Damage affects the damping ratio by increasing the Coulomb damping component, which improves internal damping. This phenomenon was observed for both the NSC and HSC mixtures at different scales.
- Microstructural factors, such as the initial porosity, early microcracking, and the transition zone, significantly affect the damage response and internal damping evolution. Higher w/c ratios lead to greater damage and higher internal damping and acoustic wave dissipation.
- The internal damping ratio is sensitive to microstructural changes and is closely related to damage progression.
- Few studies have quantified and understood internal damping under cyclic loading damage. This approach improves our understanding of concrete behaviour under dynamic excitation, particularly in impact scenarios.
Author Contributions
Funding
Data Availability Statement
Conflicts of Interest
References
- Paultre, P. Dynamics of Structures; ISTE ltd.: London, UK; Wiley: Hoboken, NJ, USA, 2011. [Google Scholar]
- Chopra, A.K. Dynamics of Structures: Theory and Applications to Earthquake Engineering; Prentice Hall: Hoboken, NJ, USA, 2017. [Google Scholar]
- Ewins, D.J. Modal Testing: Theory, Practice and Application; Research Studies Press: Brookline, MA, USA, 2000. [Google Scholar]
- Chambreuil, C.; Giry, C.; Ragueneau, F.; Léger, P. Identification methods of material-based damping for cracked reinforced concrete beam models. Earthq. Eng. Struct. Dyn. 2023, 52, 2156–2178. [Google Scholar] [CrossRef]
- Bachmann, H.; Ammann, W.J.; Eisenmann, J.; Floegl, I.; Hirsch, G.H.; Klein, G.K.; Lande, G.J.; Mahrenholtz, O.; Natke, H.G.; Nussbaumer, H.; et al. Vibration Problems in Structures-Practical Guidelines; Springer Science & Business Media: Berlin/Heidelberg, Germany, 1995. [Google Scholar]
- Sugimoto, K.; Sugimoto, T.; Utagawa, N.; Kuroda, C.; Kawakami, A. Detection of internal defects of concrete structures based on statistical evaluation of healthy part of concrete by the noncontact acoustic inspection method. Jpn. J. Appl. Phys. 2018, 57, 07LC13. [Google Scholar] [CrossRef]
- Zahedi, A.; Saliba, L.; Sanchez, L.F.M.; Boyd, A.J. Reliability of the Damage Rating Index to Assess Condition of Concrete Affected by External Sulfate Attack. Mag. Concr. Res. 2022, 75, 135–148. [Google Scholar] [CrossRef]
- Smirnov, V.A.; Smolyakov, M. Experimental method for structural concrete damping properties evaluation. Int. J. Comput. Civ. Struct. Eng. 2022, 18, 14–22. [Google Scholar] [CrossRef]
- Boccaccini, D.N.; Romagnoli, M.; Kamseu, E.; Veronesi, P.; Leonelli, C.; Pellacani, G.C. Determination of thermal shock resistance in refractory materials by ultrasonic pulse velocity measurement. J. Eur. Ceram. Soc. 2007, 27, 1859–1863. [Google Scholar] [CrossRef]
- Pereira, A.H.; Fortes, G.M.; Schickle, B.; Tonnesen, T.; Musolino, B.; Maciel, C.D.; Rodrigues, J.A. Correlation between changes in mechanical strength and damping of a high alumina refractory castable progressively damaged by thermal shock. Ceramica 2010, 56, 311–314. [Google Scholar] [CrossRef]
- Curadelli, R.O.; Riera, J.D.; Ambrosini, D.; Amani, M.G. Damage detection by means of structural damping identification. Eng. Struct. 2008, 30, 3497–3504. [Google Scholar] [CrossRef]
- Pavese, A. Damping Estimation in Concrete Structures. Struct. Health Monit. 2014, 13, 1051–1063. [Google Scholar]
- Salzmann, A. Damping Characteristics of Reinforced and Prestressed Normal-and High-Strength Concrete Beams. Ph.D. Thesis, Griffith University-Gold Coast Campus, Southport, Australia, 2002. [Google Scholar]
- Salzmann, A.; Fragomeni, S.; Loo, Y.C. The Damping Analysis of Experimental Concrete Beams under Free-Vibration. Adv. Struct. Eng. 2003, 6, 53–64. [Google Scholar] [CrossRef]
- Jordan, R.W. The effect of stress, frequency, curing, mix and age upon the damping of concrete. MAgazine Concr. Res. 1980, 32, 195–205. [Google Scholar] [CrossRef]
- Kovacs, T. Microstructural Effects on Damping in Concrete. Cem. Concr. Compos. 2002, 24, 125–132. [Google Scholar]
- Pyeon, S.; Kim, G.; Lee, S.; Nam, J. Internal Curing Effect of Waste Glass Beads on High-Strength Cement Composites. Appl. Sci. 2022, 12, 8385. [Google Scholar] [CrossRef]
- Liu, K.; Long, Y.; Chen, L.; Ling, X.; Yu, R.; Shui, Z.; Fei, S.; Yu, W.; Li, C.; Ge, K. Mechanisms of autogenous shrinkage for Ultra-High Performance Concrete (UHPC) prepared with pre-wet porous fine aggregate (PFA). J. Build. Eng. 2022, 54, 104622. [Google Scholar] [CrossRef]
- Gheorghiu, C.; Rhazi, J.E.; Labossiere, P. Impact resonance method for fatigue damage detection in reinforced concrete beams with carbon fibre reinforced polymer. Can. J. Civ. Eng. 2005, 32, 1093–1102. [Google Scholar] [CrossRef]
- Ndambi, J.M.; Vantomme, J.; Harri, K. Damage assessment in reinforced concrete beams using eigenfrequencies and mode shape derivatives. Eng. Struct. 2002, 24, 501–515. [Google Scholar] [CrossRef]
- Hosseinzadehfard, E.; Mobaraki, B. Investigating concrete durability: The impact of natural pozzolan as a partial substitute for microsilica in concrete mixtures. Constr. Build. Mater. 2024, 419, 135491. [Google Scholar] [CrossRef]
- Bawa, N.; Graft-Johnson, J. Effect of Mix Proportion, Water-Cement Ratio, Age and Curing Conditions on the Dynamic Modulus of Elasticity of Concrete. Build. Sci. 1969, 3, 171–177. [Google Scholar]
- Swamy, R. Damping Mechanisms in Cementitious Systems. In Proceedings of the Conference on Dynamic Waves in Civil Engineering, Swansea, UK, 7–9 July 1970; pp. 521–542. [Google Scholar]
- Eiras, J. Microstructural Influences on Damping in Concrete. J. Mater. Sci. 2015, 50, 2345–2356. [Google Scholar]
- Gidrão, G.d.M.S.; Krahl, P.A.; Carrazedo, R. Internal damping ratio of Ultra-High-Performance Fiber-Reinforcement Concrete (UHPFRC) considering the effect of fiber content and damage evolution. J. Mater. Civ. Eng. 2020, 32. [Google Scholar] [CrossRef]
- Haug, K. Cracking Effects on Damping in Concrete. Mater. Struct. 2018, 51, 234–245. [Google Scholar]
- Swamy, N.; Rigby, G. Dynamic properties of hardened paste, mortar and concrete. Matériaux Constr. 1971, 4, 13–40. [Google Scholar] [CrossRef]
- Swamy, R.N. Dynamic Poisson’s Ratio of Portland Cement Paste, Mortar and Concrete. Cem. Concr. Res. 1971, I, 559–583. [Google Scholar] [CrossRef]
- Tian, Y.; Lu, D.; Zhou, J.; Yang, Y.; Wang, Z. Damping Property of Cement Mortar Incorporating Damping Aggregate Yaogang. Materials 2020, 13, 792. [Google Scholar] [CrossRef] [PubMed]
- Tian, Y.; Yan, X.; Zhang, M.; Yang, T.; Zhang, J.; Wang, Z. Effect of the characteristics of lightweight aggregates presaturated polymer emulsion on the mechanical and damping properties of concrete. Constr. Build. Mater. 2020, 253, 119154. [Google Scholar] [CrossRef]
- Li, N.; Long, G.; Fu, Q.; Wang, X.; Ma, K.; Xie, Y. Effects of freeze and cyclic flexural load on mechanical evolution of filling layer self-compacting concrete. Constr. Build. Mater. 2019, 200, 198–208. [Google Scholar] [CrossRef]
- Seracino, R. Damping in Concrete with Rubber Additives. Constr. Build. Mater. 2007, 21, 123–132. [Google Scholar] [CrossRef]
- Wang, X.; Zhou, C. Numerical investigation for the flexural strengthening of reinforced concrete beams with external prestressed HFRP sheets. Constr. Build. Mater. 2018, 189, 804–815. [Google Scholar] [CrossRef]
- ASTM C150-04; Standard Specification for Portland Cement. ASTM: West Conshohocken, PA, USA, 2011; Volume 4, pp. 1–7.
- ABNT NBR 7211; Agregados para Concreto-Especificação. ABNT: Rio de Janeiro, Brazil, 2009.
- ASTM C215-02; Standard Test Method for Fundamental Transverse, Longitudinal, and Torsional Resonant Frequencies of Concrete Specimens. ASTM: West Conshohocken, PA, USA, 2003; pp. 1–7.
- ASTM E1876-01; Standard Test Method for Dynamic Young’s Modulus, Shear Modulus, and Poisson’s Ratio by Impulse Excitation of Vibration. ASTM: West Conshohocken, PA, USA, 2001.
- Krahl, P.A.; Gidrão, G.D.M.S.; Carrazedo, R. Compressive behavior of UHPFRC under quasi-static and seismic strain rates considering the effect of fiber content. Constr. Build. Mater. 2018, 188, 633–644. [Google Scholar] [CrossRef]
- Krahl, P.A.; Gidrão, G.d.M.S.; Carrazedo, R. Cyclic behavior of UHPFRC under compression. Cem. Concr. Compos. 2019, 104, 103363. [Google Scholar] [CrossRef]
- Haach, V.G.; Carrazedo, R.; Oliveira, L.M.; Corrêa, M.R. Application of acoustic tests to mechanical characterization of masonry mortars. NDT E Int. 2013, 59, 18–24. [Google Scholar] [CrossRef]
- Pickett, G. Equations for Computing Elastic Constants from Flexural and Torsional Resonant Frequencies of Vibration of Prisms and Cylinders. Proc. Am. Soc. Test. Mater. 1945, 45, 846–866. [Google Scholar]
- Pereira, A.H.A.; Otani, L.B.; De Anchieta Rodrigues, J.; Traon, N.; Tonnesen, T.; Telle, R. The influence of nonlinear elasticity on the accuracy of thermal shock damage evaluation by the impulse excitation technique. InterCeram Int. Ceram. Rev. 2011, 98–102. [Google Scholar]
- Pereira, A.H.A.; Musolino, B.; Maciel, C.D.; Rodrigues, J.A. Algorithm to determine the damping of ceramic materials by the impulse excitation technique ceramic materials by the impulse excitation technique. Ceramica 2012, 58, 229–237. [Google Scholar] [CrossRef]


| ID | w/c (kg/kg) | Cement (kg/kg) | Sand (kg/kg) | Aggregate (kg/kg) | (mm) | SP. (% in Cement Mass) |
|---|---|---|---|---|---|---|
| 1 | 0.7 | 1 | 2 | 3 | 9.5 | 0 |
| 2 | 0.5 | 1 | 2 | 3 | 9.5 | 0 |
| 3 | 0.3 | 1 | 2 | 3 | 9.5 | 2 |
| Comparison | F-Value | p-Value | Significance |
|---|---|---|---|
| w/c = 0.7 vs w/c = 0.5 | 222.55 | 4.52 | Significant difference |
| w/c = 0.7 vs w/c = 0.3 | 1267.10 | 3.32 | Significant difference |
| w/c = 0.5 vs w/c = 0.3 | 109.60 | 1.95 | Significant difference |
| Comparison | F-Value | p Value | Interpretation |
|---|---|---|---|
| w/c = 0.7 vs w/c = 0.5 | 21.18 | Significant difference | |
| w/c = 0.7 vs w/c = 0.3 | 39.17 | Significant difference | |
| w/c = 0.5 vs w/c = 0.3 | 33.13 | Significant difference |
Disclaimer/Publisher’s Note: The statements, opinions and data contained in all publications are solely those of the individual author(s) and contributor(s) and not of MDPI and/or the editor(s). MDPI and/or the editor(s) disclaim responsibility for any injury to people or property resulting from any ideas, methods, instructions or products referred to in the content. |
© 2024 by the authors. Licensee MDPI, Basel, Switzerland. This article is an open access article distributed under the terms and conditions of the Creative Commons Attribution (CC BY) license (https://creativecommons.org/licenses/by/4.0/).
Share and Cite
Gidrão, G.d.M.S.; Krahl, P.A.; Bosse, R.M.; Silvestro, L.; Ribeiro, R.S.; Lima, G.T.d.S.; Carrazedo, R. Internal Damping Ratio of Normal- and High-Strength Concrete Considering Mechanical Damage Evolution. Buildings 2024, 14, 2446. https://doi.org/10.3390/buildings14082446
Gidrão GdMS, Krahl PA, Bosse RM, Silvestro L, Ribeiro RS, Lima GTdS, Carrazedo R. Internal Damping Ratio of Normal- and High-Strength Concrete Considering Mechanical Damage Evolution. Buildings. 2024; 14(8):2446. https://doi.org/10.3390/buildings14082446
Chicago/Turabian StyleGidrão, Gustavo de Miranda Saleme, Pablo Augusto Krahl, Rúbia Mara Bosse, Laura Silvestro, Rodrigo S. Ribeiro, Geannina Terezinha dos Santos Lima, and Ricardo Carrazedo. 2024. "Internal Damping Ratio of Normal- and High-Strength Concrete Considering Mechanical Damage Evolution" Buildings 14, no. 8: 2446. https://doi.org/10.3390/buildings14082446
APA StyleGidrão, G. d. M. S., Krahl, P. A., Bosse, R. M., Silvestro, L., Ribeiro, R. S., Lima, G. T. d. S., & Carrazedo, R. (2024). Internal Damping Ratio of Normal- and High-Strength Concrete Considering Mechanical Damage Evolution. Buildings, 14(8), 2446. https://doi.org/10.3390/buildings14082446