Abstract
Freeze–thaw damage significantly contributes to the degradation of concrete structures. A critical precondition for concrete to experience frost damage is reaching its critical saturation level. This study conducted freeze–thaw experiments on concrete specimens under both open and sealed moisture conditions to elucidate the mechanisms of freeze–thaw damage and the pivotal role of moisture. The research assessed concrete’s water absorption, ultrasonic pulse velocity, and compressive strength under restricted water conditions to study damage accumulation patterns. The findings indicate that implementing water limitation measures during freeze–thaw cycles can regulate concrete’s water absorption rate, reduce the loss of ultrasonic pulse velocity, and minimize strength degradation, with an observed strength increase of up to 36.22%. Consequently, these measures protect concrete materials from severe frost damage. Furthermore, a predictive model for concrete freeze–thaw deterioration was established based on regression analysis and relative dynamic modulus theory, confirming the critical role of water limitation in extending the service life of concrete structures in cold regions.
1. Introduction
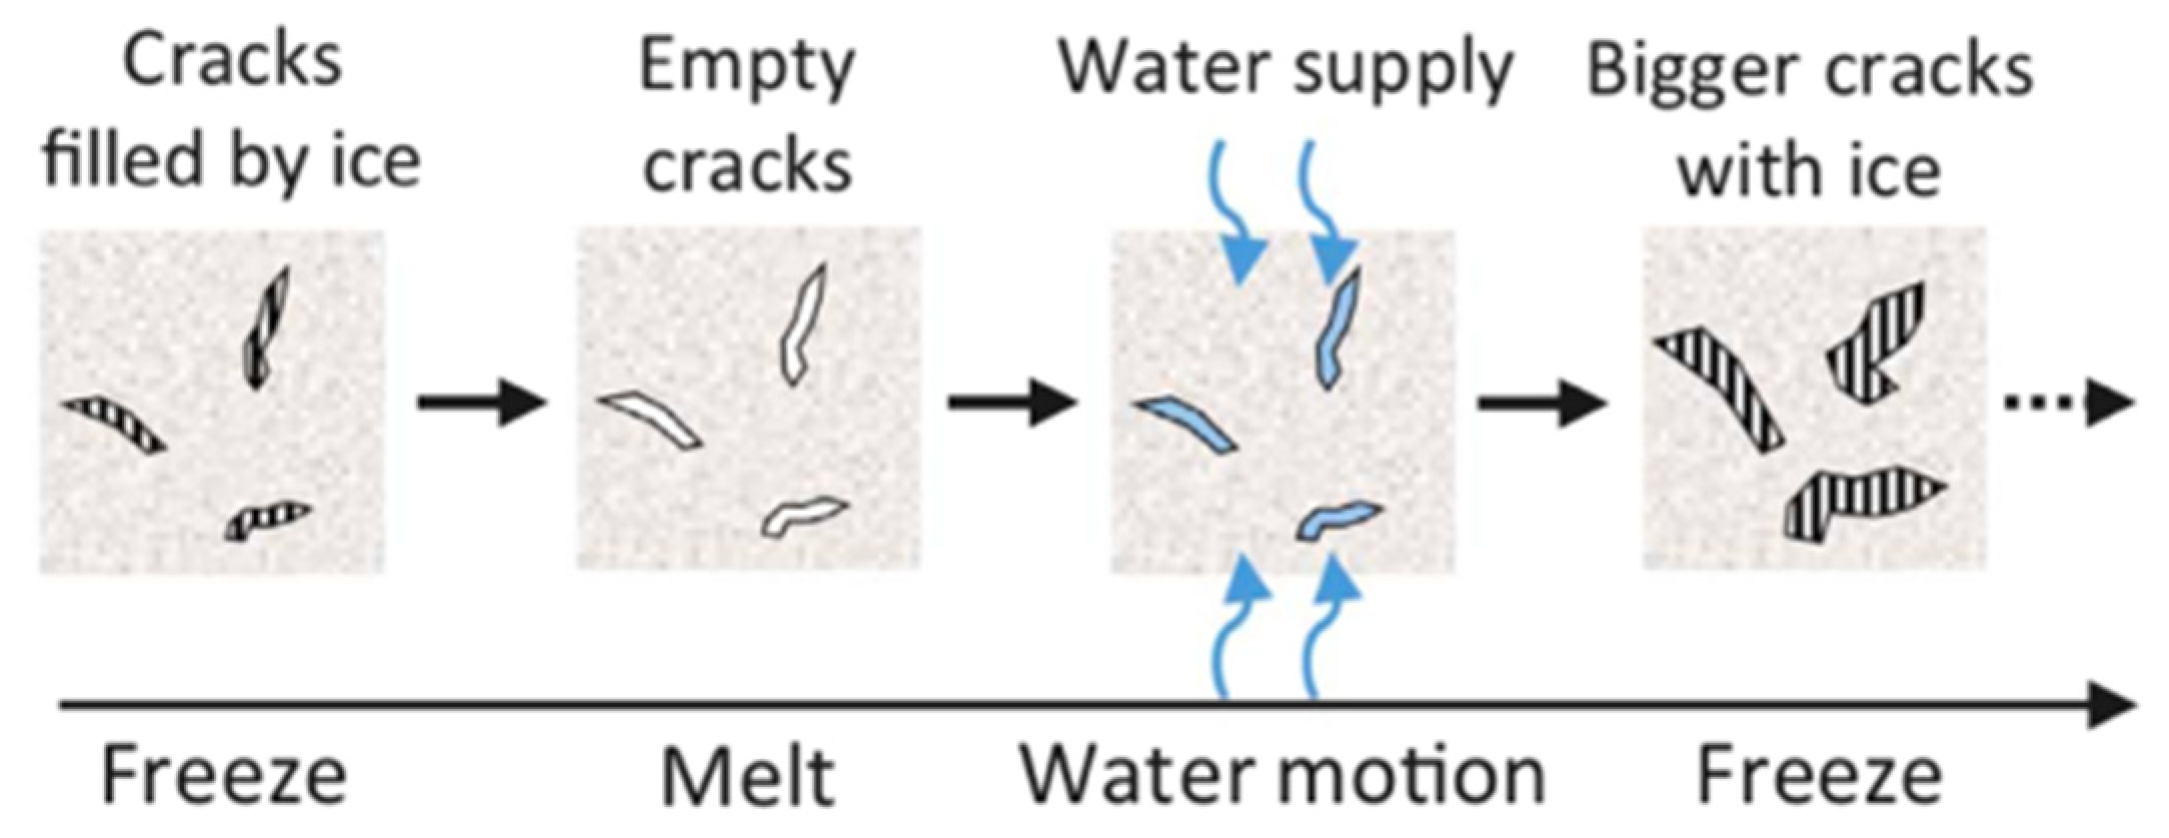
Frost damage is the primary cause of concrete deterioration in cold and humid regions. As the temperature decreases, water within the concrete pores freezes, generating pore pressure that acts on the pore walls and other solid components. When this stress exceeds the material’s strength, microcracks form [1,2,3,4,5,6]. As the temperature continues to drop, water and ice gradually infiltrate the micro-pores and microcracks. Consequently, with an increasing number of freeze–thaw cycles (FTCs), the internal pores of the concrete expand [7], penetrate, and interconnect, leading to the continuous accumulation of micro-damage, as shown in Figure 1 [8]. These defects further accelerate the intrusion of moisture and harmful ions, such as chloride and sulfate ions, exacerbating other durability problems, including carbonation and steel corrosion [9,10,11,12]. Consequently, this accelerates the overall deterioration of concrete structures due to the compounded effects of multiple factors. Therefore, studying the frost damage mechanism of concrete is crucial for assessing the durability and service life of concrete structures in cold regions.
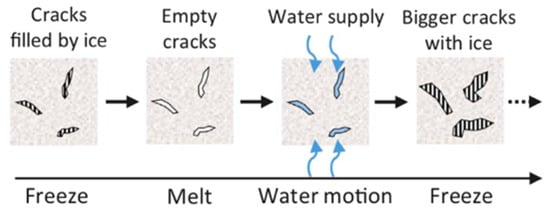
Figure 1.
Diagram of moisture and crack development.
Concrete durability is closely related to water intrusion, which is both a primary cause of concrete damage and a transport medium for harmful substances [13,14,15,16]. Concrete structures are often exposed to environments with abundant water; consequently, with increasing FTCs, water is continuously replenished, expansion strain damage accumulates, and the degree of frost damage deepens [17,18,19]. In open freeze–thaw experiments (allowing water intake) conducted by Hasan et al. [20], the strain continued to increase even up to 300 FTCs. However, concrete typically does not suffer from frost damage until after a certain number of FTCs [21,22,23]. Sicat et al. [24] conducted a closed (no water supplied) freeze–thaw experiment on both dry and saturated mortar samples. The results showed that the strain of dry samples remained steady and did not increase with FTCs. In contrast, saturated samples developed positive strains within the first few cycles, reaching maximum strain within 2–4 cycles, while the elastic modulus ceased to decrease after 3–5 cycles. Bentz et al. [25,26] developed a model based on water absorption tests, utilizing the secondary stage absorption rate to predict the time for concrete to reach critical saturation. This model serves as a foundation for predicting the service life of concrete. Furthermore, Maekawa et al. [27] studied the impact of water kinetics under moving loads, monitoring the history of pore water pressure and principal strain in concrete. Their results indicated that high pore water pressure leads to the development of internal stress within the concrete, thereby accelerating its deterioration.
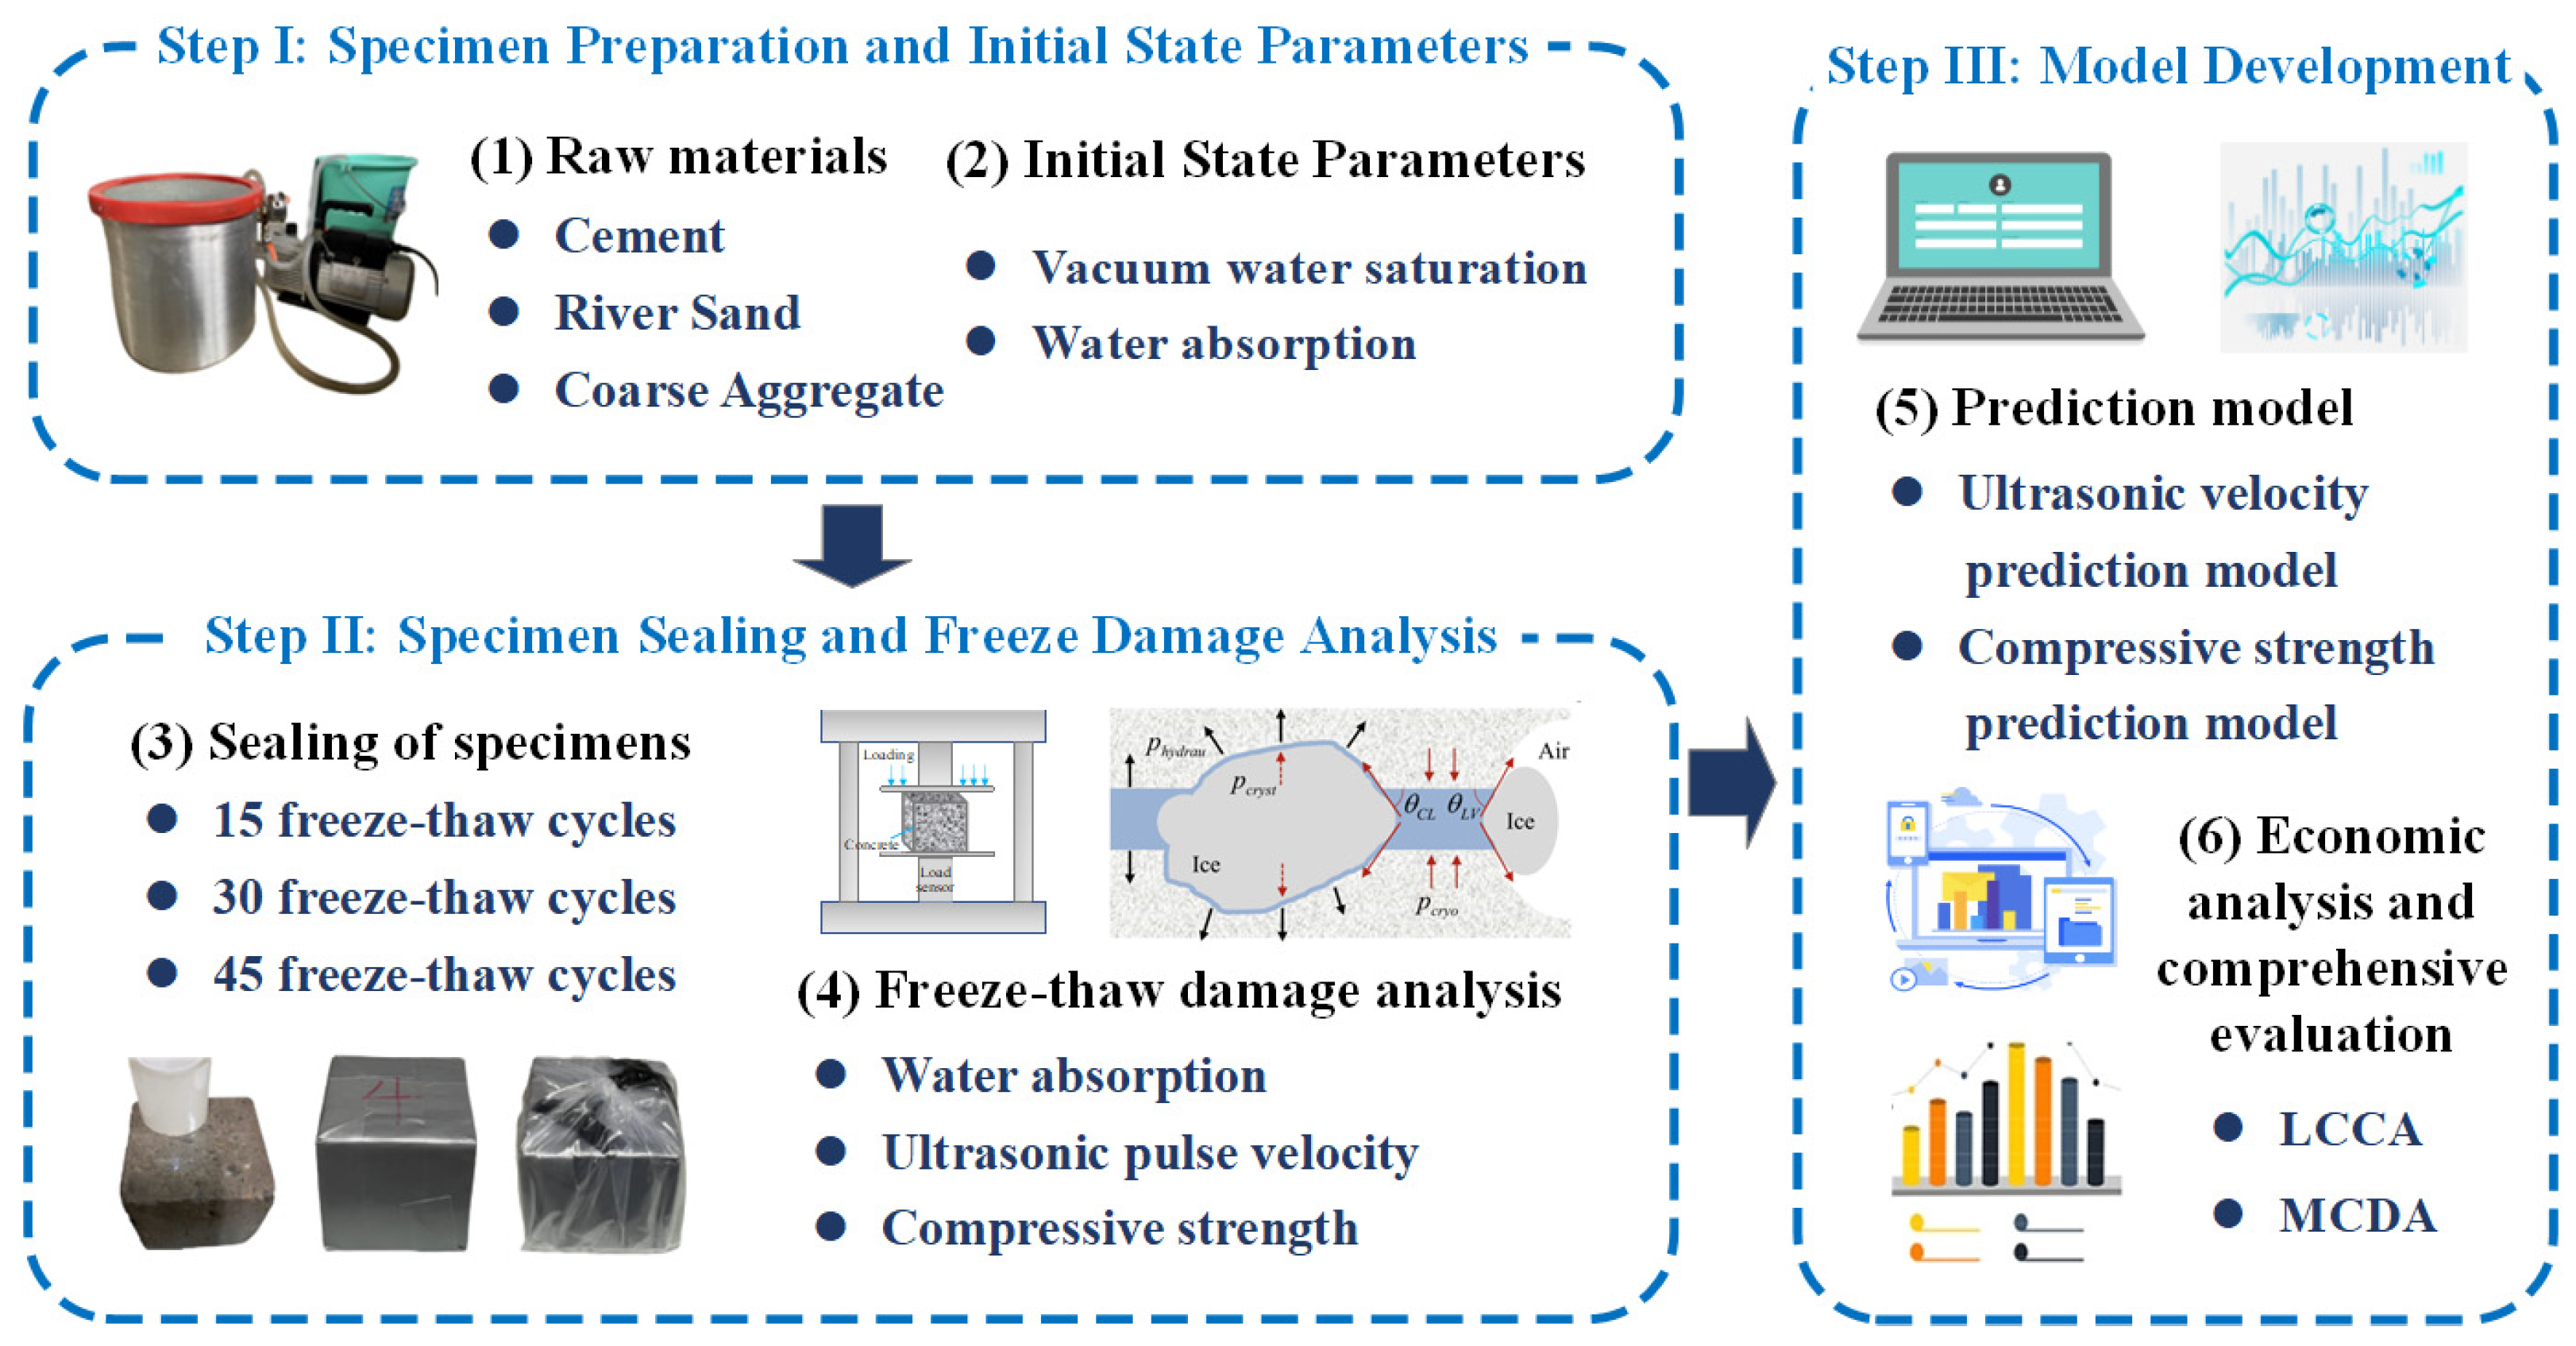
Previous research has utilized small-scale concrete specimens to establish freeze–thaw models [28]. Recently, significant progress has been made in studying the non-uniform frost damage of reinforced concrete members, including the simulation of mechanical properties of frost-damaged components such as reinforced concrete beams, columns, and shear walls [29,30,31,32,33,34]. In actual engineering, frost damage to structural members is influenced by many factors, including the size effect, hydrothermal boundaries, and reinforcement distribution, often resulting in non-uniform frost damage distribution [35,36,37]. To assess the performance of concrete in complex freezing–thawing environments, it is crucial to establish a link between microscopic local damage and macroscopic structural performance. In practical applications, concrete structures often experience frost damage before any curing measures are implemented. Research on water limitation measures for concrete remains incomplete. This study investigates the accumulation of freeze–thaw damage in concrete under varying humidity conditions using freeze–thaw cycle tests. Key indicators such as the water absorption rate, ultrasonic pulse velocity, and compressive strength were tested to evaluate the effectiveness of water limitation. Additionally, a concrete freeze–thaw deterioration prediction model was established using regression analysis and relative dynamic modulus theory. This model confirms the crucial role of water limitation in extending the service life of concrete structures in cold regions. This research aims to enhance understanding of the role of water in the deterioration of concrete during FTCs. Figure 2 delineates the workflow of this study.
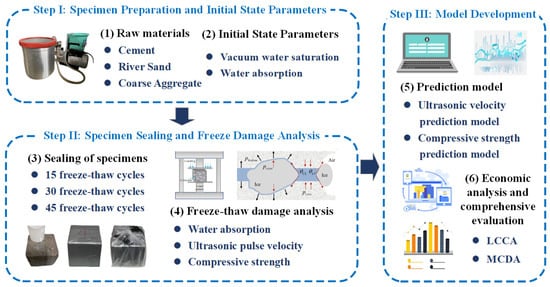
Figure 2.
The flowchart of the study.
2. Experimental Program
2.1. Materials
Ordinary Portland cement (P·O 32.5) was used, meeting the requirements of “General Portland Cement” (GB 175-2020) [38]. The fine aggregate was medium river sand with a moisture content of 3%. The coarse aggregate was continuously graded crushed stone with a maximum particle size of less than 20 mm and a moisture content of 1.4%. Tap water, complying with the “Standard for Water Used in Concrete” (JGJ 63-2006) [39], was used for mixing and curing.
2.2. Mixture Proportions and Specimen Preparation
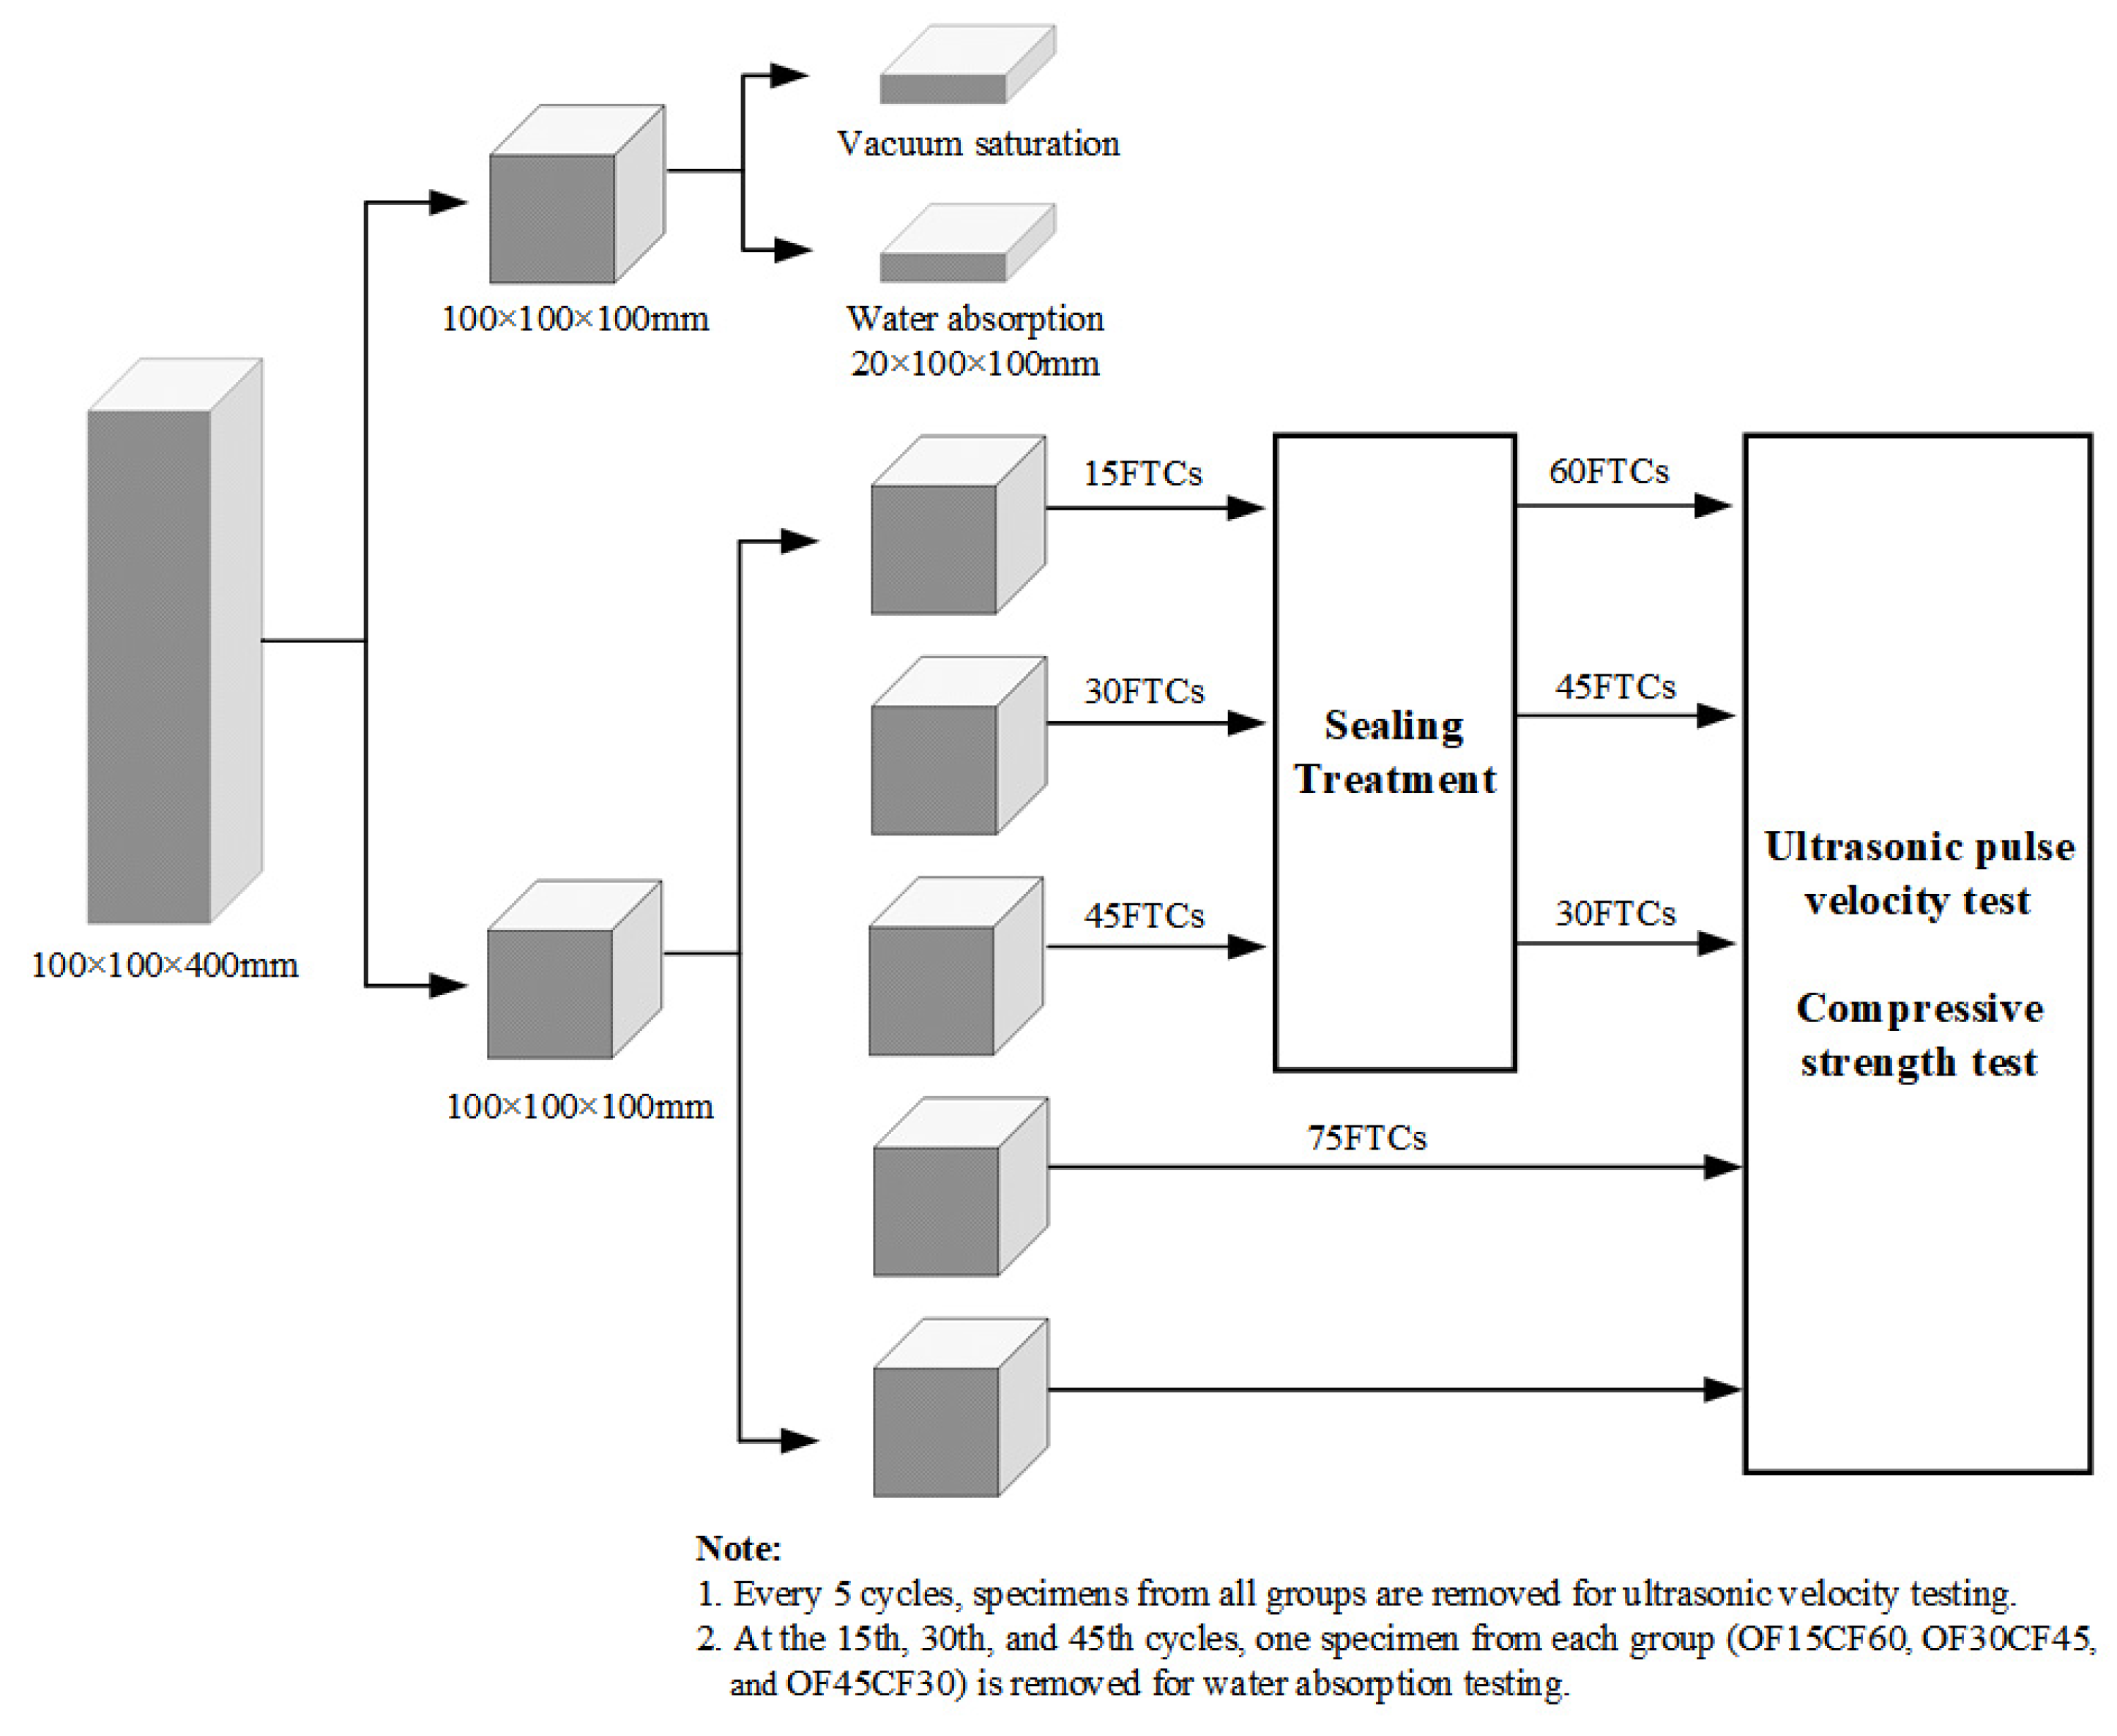
The concrete specimens used in this experiment measured 100 mm × 100 mm × 100 mm, with the mix proportions listed in Table 1. The specimens were divided into four groups: OF15CF60, OF30CF45, OF45CF30, OF75, and NS (“OF” denotes open FTCs, “CF” denotes closed FTCs, and the “NS” group comprises original specimens that have not undergone FTCs). Specimens in the experimental groups OF15CF60, OF30CF45, and OF45CF30 were sealed at different numbers of FTCs (i.e., at the 15th, 30th, and 45th cycles, respectively) to prevent further water absorption and create a closed environment. Specimens in the OF75 group did not receive any special treatment (Table 2). The entire experimental process is illustrated in Figure 3.

Table 1.
Mix proportion of concrete (1 m3).
Table 2.
Assignment of specimens for different procedures and tests (1 m3).
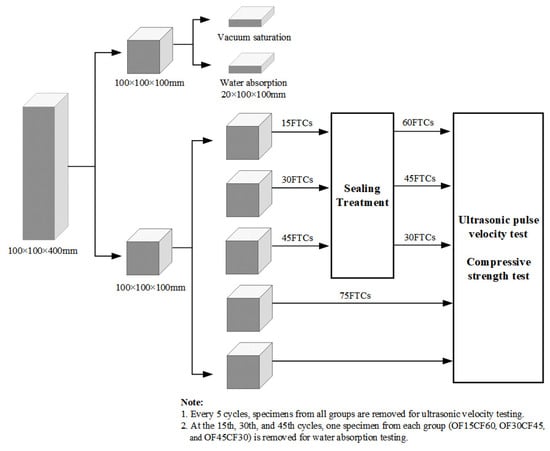
Figure 3.
Specimen groups and treatment during FTCs.
2.3. Vacuum Water Saturation Test
Before the freeze–thaw cycle test, a 100 mm × 100 mm × 100 mm specimen was selected and cut into four 20 mm × 100 mm × 100 mm pieces, labeled 1 to 4. Pieces 1 and 2 were used to determine the bilinear water absorption curve, while pieces 3 and 4 were used for the vacuum water saturation test. The initial mass of each slice was recorded as m1, the dried mass as m2, and the mass after water absorption/saturation as m3. The specimen saturation degree was calculated using Equation (1).
2.4. Water Absorption Test
The water absorption test was conducted using specimens with dimensions of 20 mm × 100 mm × 100 mm. The timer was started after adding water to the predetermined height and the mass of the slices was measured at the specified intervals according to the American standard [40] and Table 3. To ensure data accuracy, we avoided measuring the mass after 60 s of water absorption due to the large number of slices.
Table 3.
Measurement times and tolerances for water absorption test.
The capillary water absorption rate, S, is defined as the coefficient between the absorbed water mass (ML−2) and the square root of time (T1/2), thus expressed in units of ML−2 T1/2 [41]. In this experiment, the water absorption rate, I, is represented by Equation (2) [42].
where I represents the water absorption rate of the sample in mm, mt represents the mass change of the sample in grams, a represents the area of the absorbing surface in mm2, and d represents the density of water in 1000 g/mm3.
2.5. Sealing of Specimens
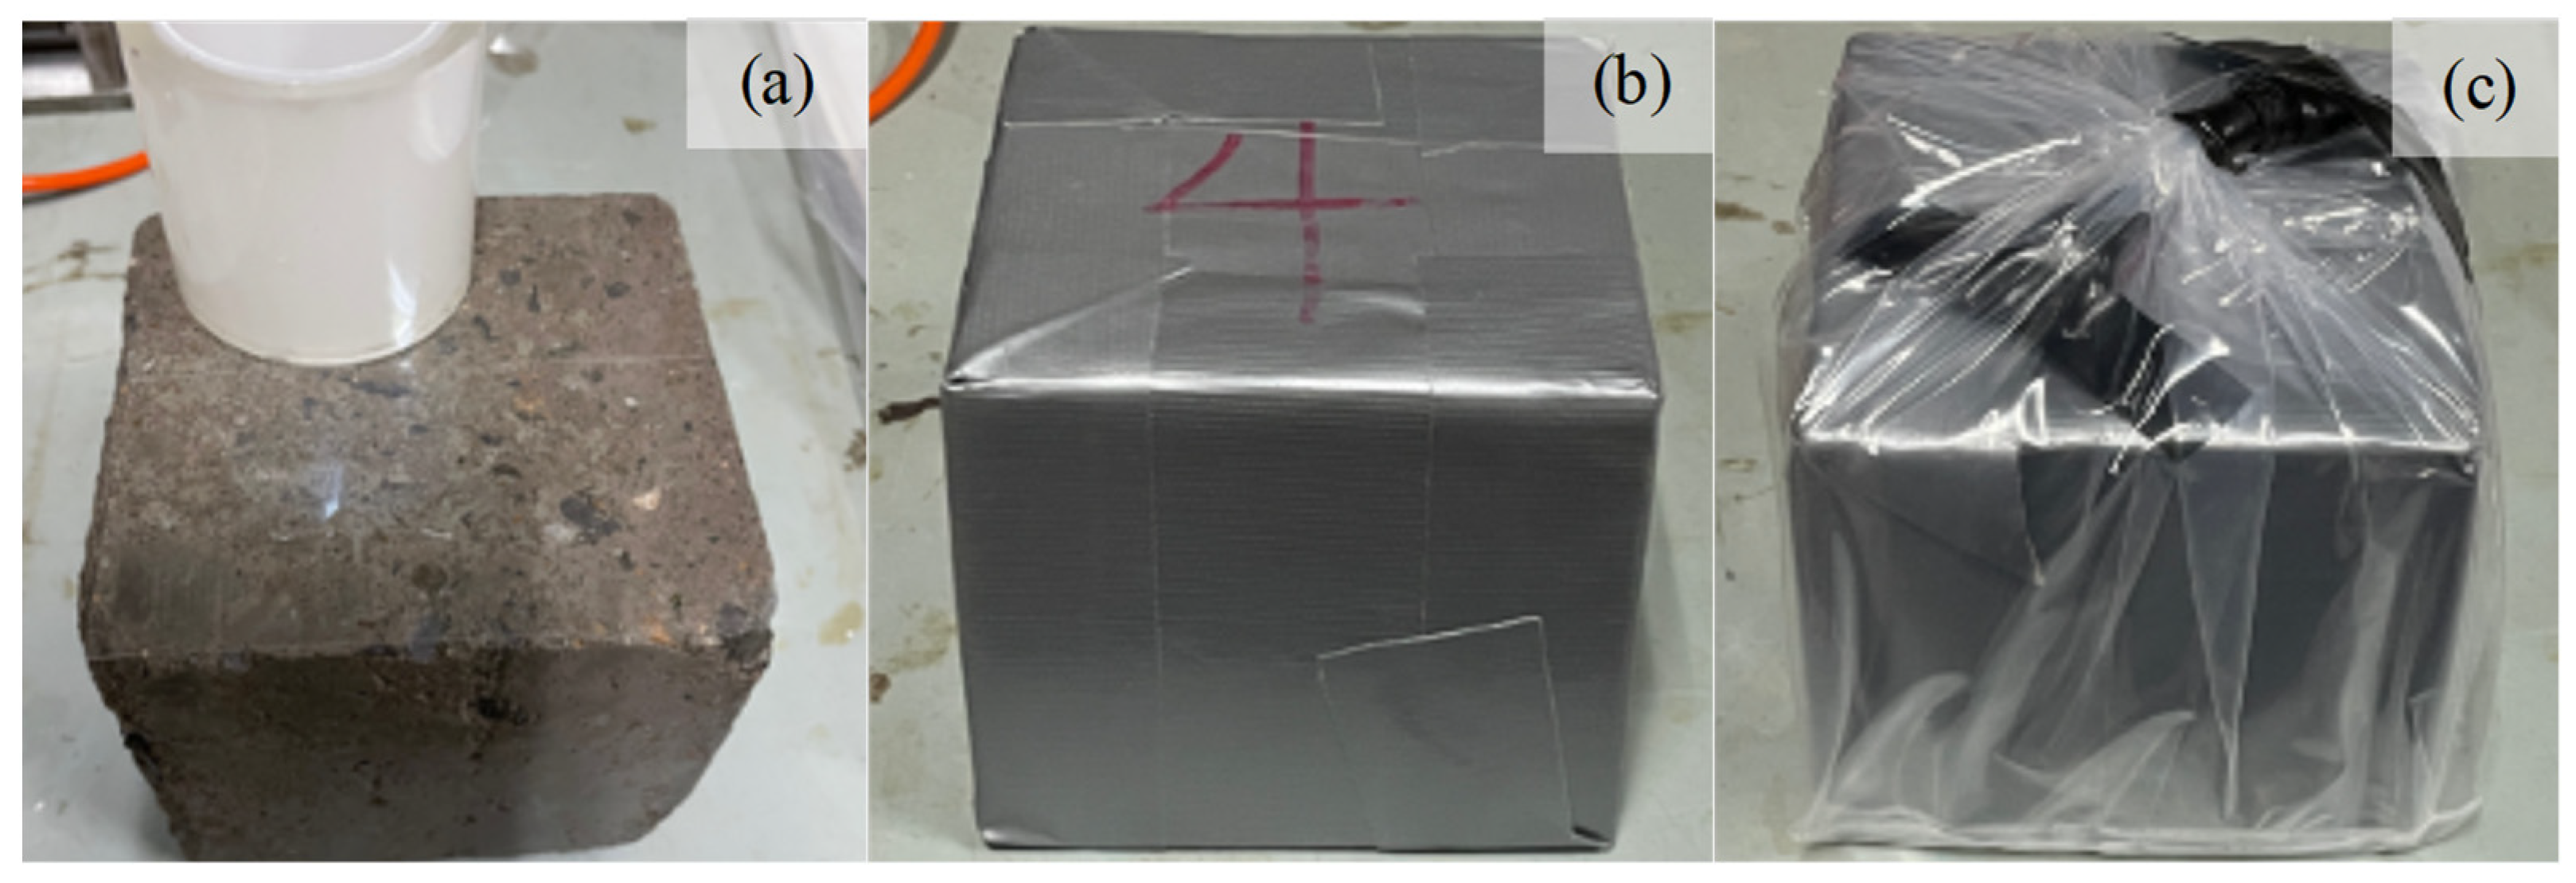
Specimens in groups OF15CF60, OF30CF45, and OF45CF30 were sealed in waterproof bags at the end of the 15th, 30th, and 45th cycles (Figure 4). Before the main experiment, a backup specimen underwent a pre-experiment: its initial mass was recorded before undergoing five FTCs. After returning to room temperature, the specimen’s mass was checked again, with a mass difference of less than 0.1 g, confirming the sealing method’s effectiveness in maintaining constant water content within the concrete. Throughout the freezing–thawing experiment, the mass of each specimen was measured at the end of each cycle to ensure the continued effectiveness of the waterproofing method.
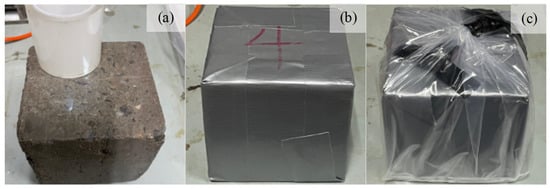
Figure 4.
Specimen sealing process: (a) waterproof plastic sheet; (b) waterproof electrical tape; (c) waterproof plastic bag.
2.6. Freeze–Thaw Cycle Test
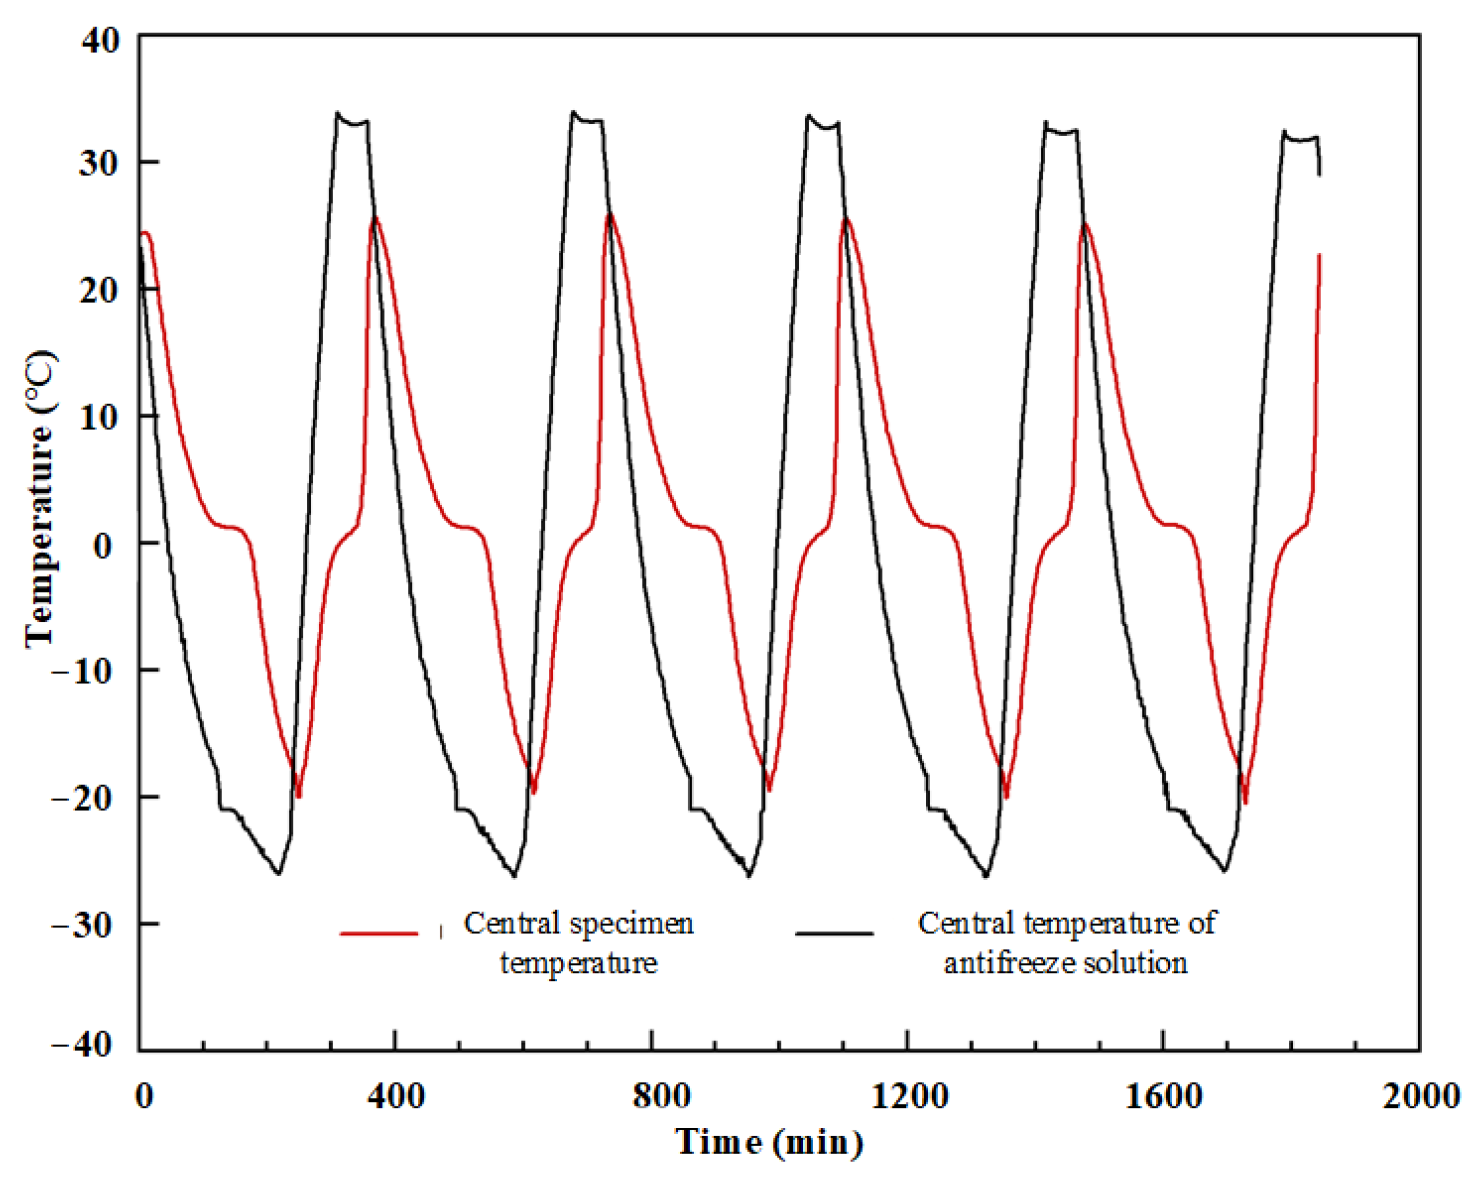
Specimens were grouped into sets of three and placed in specialized boxes filled with tap water, ensuring a 5 mm water level above the specimens. The boxes were then placed in a freeze–thaw chamber, initiating the cycles. The temperature was monitored with sensors, with each stage comprising five cycles, as shown in Figure 5. Every five cycles, specimens were removed for mass and ultrasonic pulse velocity measurements, then returned to the chamber. The experiment ended after 75 cycles for all specimens.
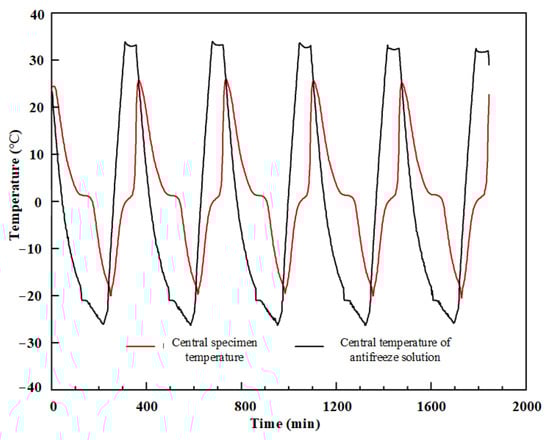
Figure 5.
Temperature changes in individual freeze−thaw cycle stages (5 cycles).
2.7. Ultrasonic Pulse Velocity Test
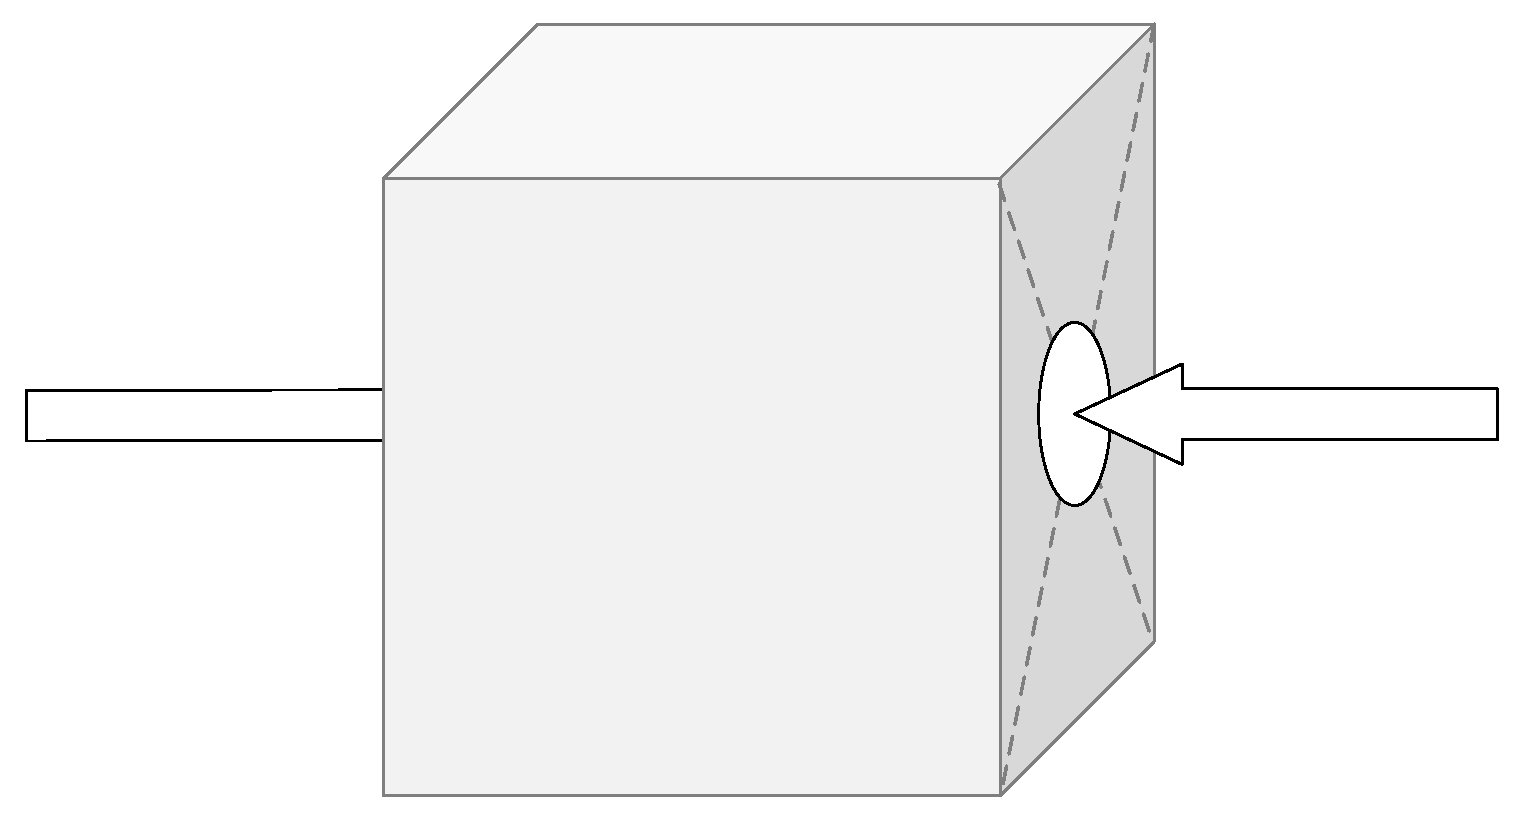
The ultrasonic velocity test was conducted using specimens with dimensions of 100 mm × 100 mm × 100 mm. The ultrasonic velocity of cement mortar samples was measured using a ZBL-U5200 non-metallic ultrasonic detector from Beijing ZhiBoLian Technology Co. (Beijing, China). After each freeze–thaw stage, ultrasonic pulse velocity measurements were conducted on all specimens. We connected the ultrasonic testing device to the main unit and the transducer, then calibrated the zero time to 5.90 μs. The sampling parameters were set as follows: sampling interval, 0.05 μs; sampling length, 2048; and transmission voltage, 500 V. Using the through-transmission method (Figure 6), three measurements were taken at the center of the test surface, and the average value was recorded.
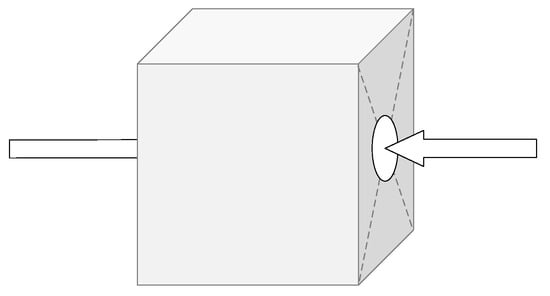
Figure 6.
Schematic diagram of ultrasonic pulse velocity testing method.
Considering the uncertainties and material losses during specimen preparation, we measured the distance between the testing surfaces of each specimen with a micrometer before starting the FTCs. After recording the pulse velocity displayed, we calculated the ultrasonic pulse velocity using Equation (3).
where v represents the ultrasonic pulse velocity in km/s, l represents the distance between the transducers in mm, and t represents the ultrasonic travel time in μs.
2.8. Compressive Strength Test
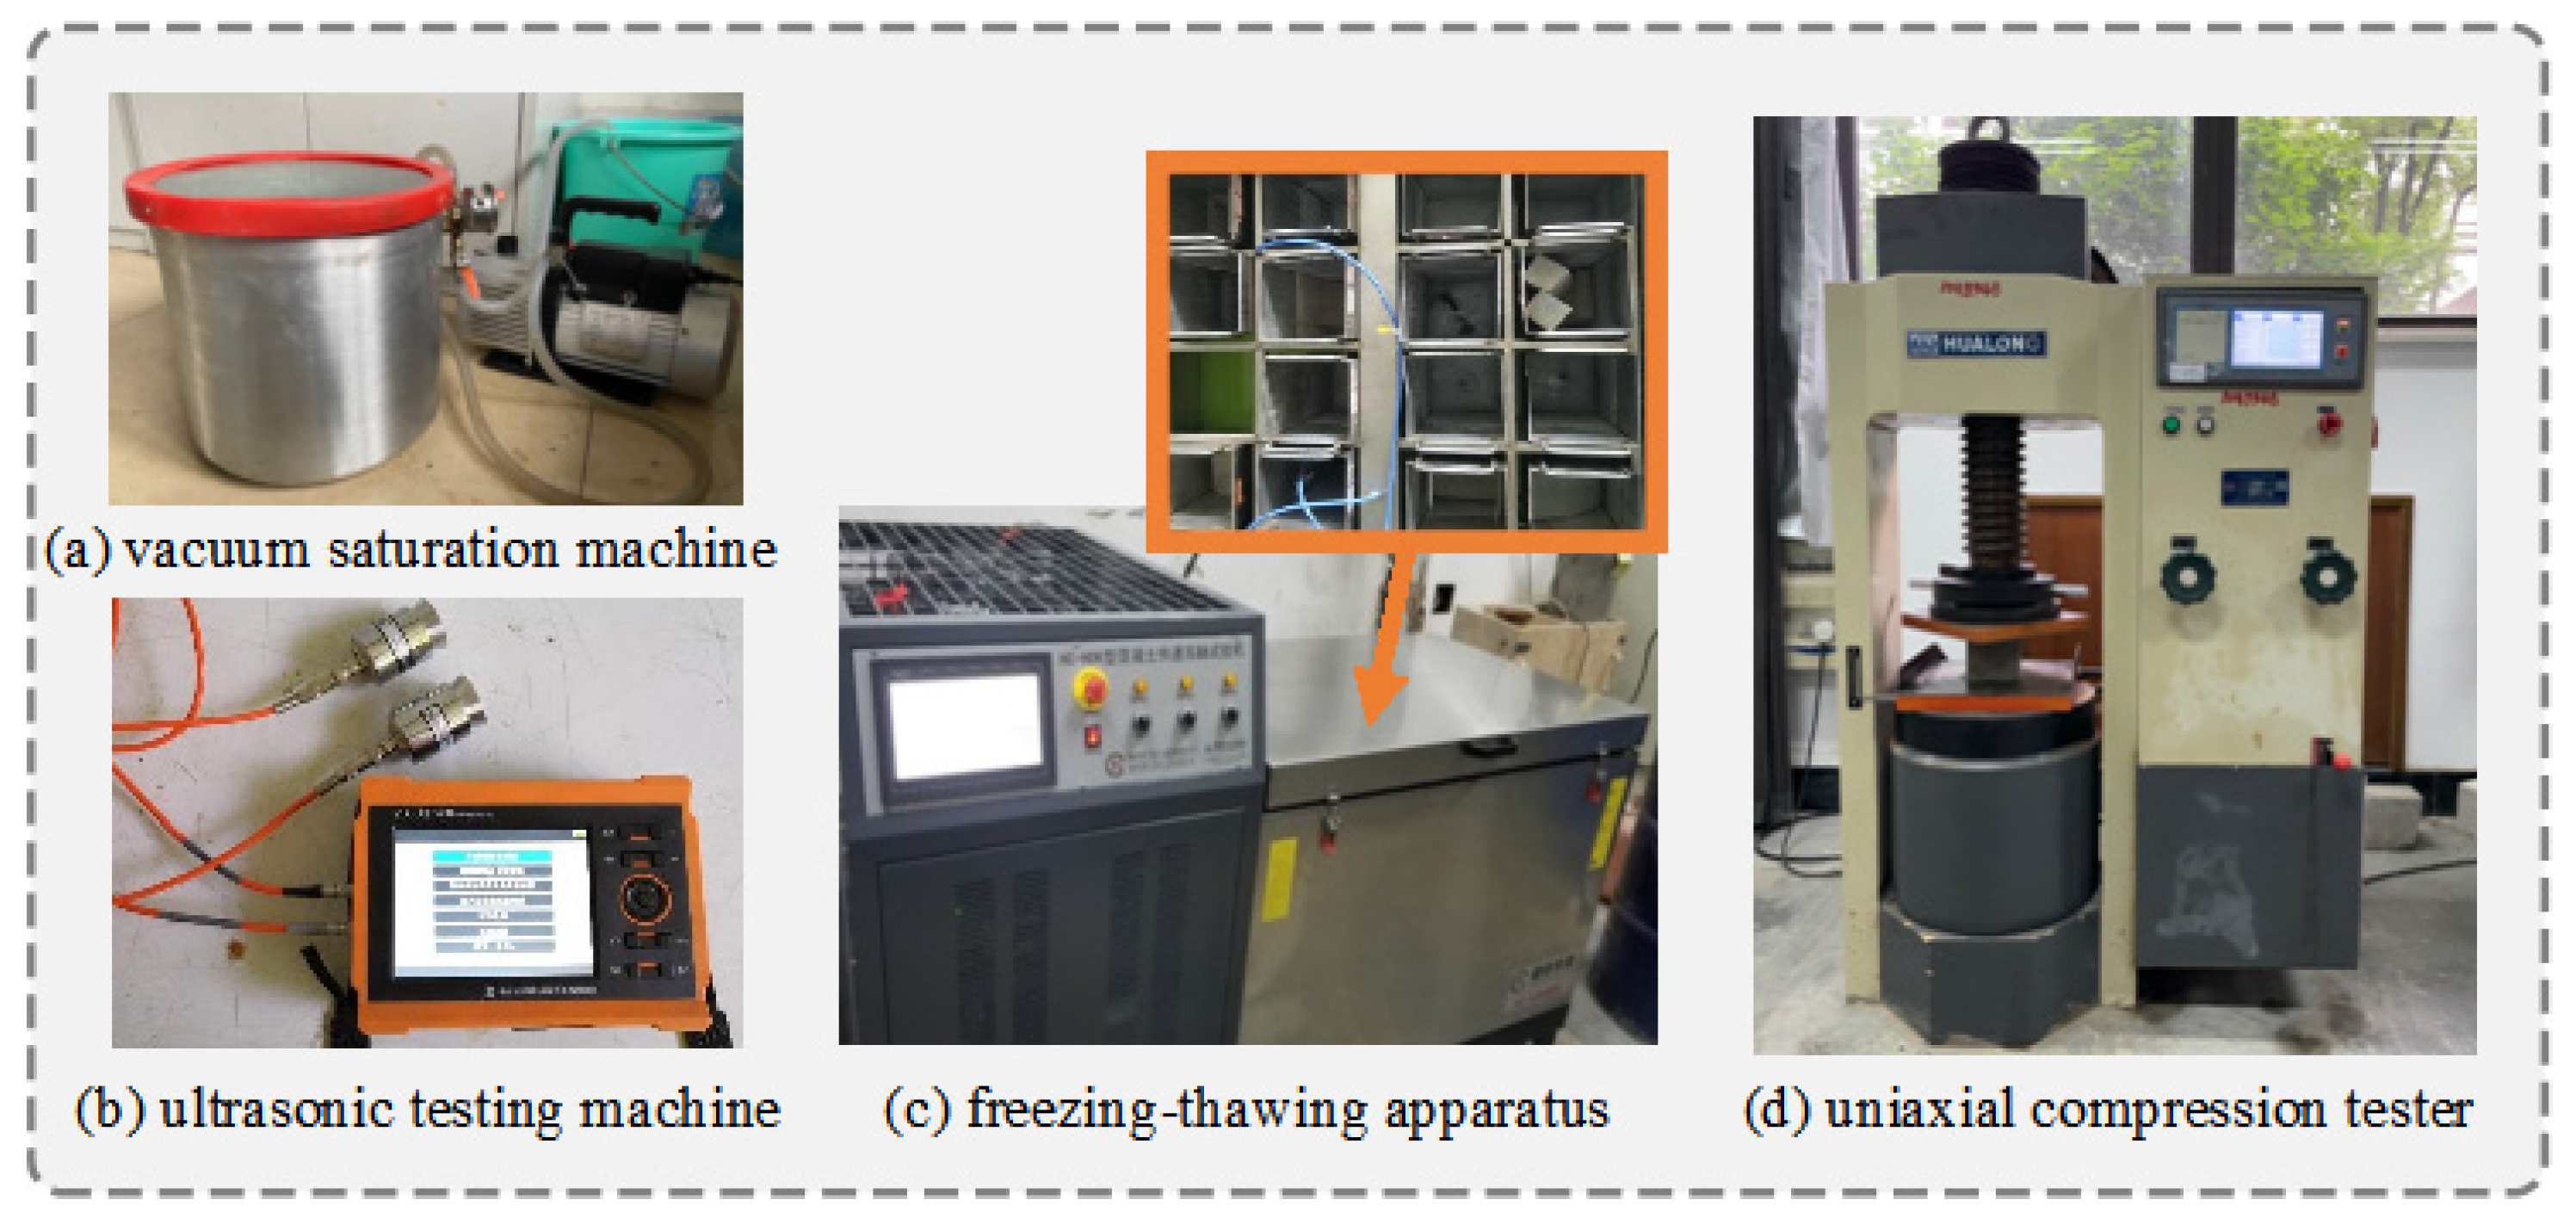
Compression strength tests were conducted using specimens with dimensions of 100 mm × 100 mm × 100 mm. The loading rate of the compression testing machine was set between 0.3 and 0.5 MPa/s, approximately 4 kN/s. The compressive strength of the cube was calculated using Equation (4). Given that the cube specimen size is 100 mm, which is non-standard for compressive strength tests, the calculated compressive strength was multiplied by a conversion factor of 0.95. The main apparatuses used in the experiment are shown in Figure 7.
where fcu represents the compressive strength of the specimen in MPa, F represents the maximum load at failure in N, and A represents the load-bearing area in mm2.
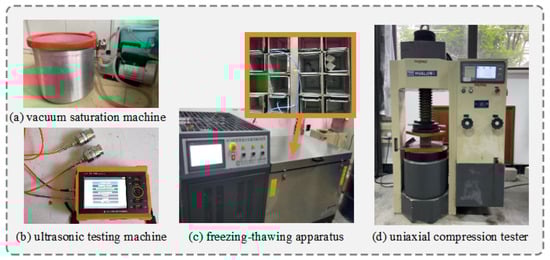
Figure 7.
Experiment apparatuses.
3. Results and Discussion
3.1. Initial State Parameters of Specimens
Table 4 presents the mass changes of specimens after initial vacuum saturation and water absorption tests, including initial mass, oven-dried mass, and mass after water absorption or saturation. Using the mass data from Table 4 and Equation (1), the initial saturation degrees of the specimens were determined as Sr3 = 90.03% and Sr4 = 93.29%, with an average saturation degree of 91.66%.
Table 4.
Masses of specimens in vacuum saturation and water absorption tests.
The air content of ordinary concrete (without entrained air) is approximately 2%. It is assumed that aggregates are essentially free of air bubbles, which are all present in cement mortar [43,44,45,46]. Given the mix proportions of the concrete used in this experiment and the densities of tap water (1000 kg/m3), ordinary Portland cement (3000 kg/m3), coarse aggregates (1700 kg/m3), and fine aggregates (1600 kg/m3) [47,48], the volume proportion of cement mortar in the concrete is approximately 52.6% (Equation (5)). Consequently, the air content in the cement mortar is calculated to be approximately 3.8% (2%/52.6% ≈ 3.8%). By comparing the vacuum saturation results of slices 3 and 4, it can be inferred that the specimens were not fully saturated prior to the experiment, as air bubbles remained in voids.
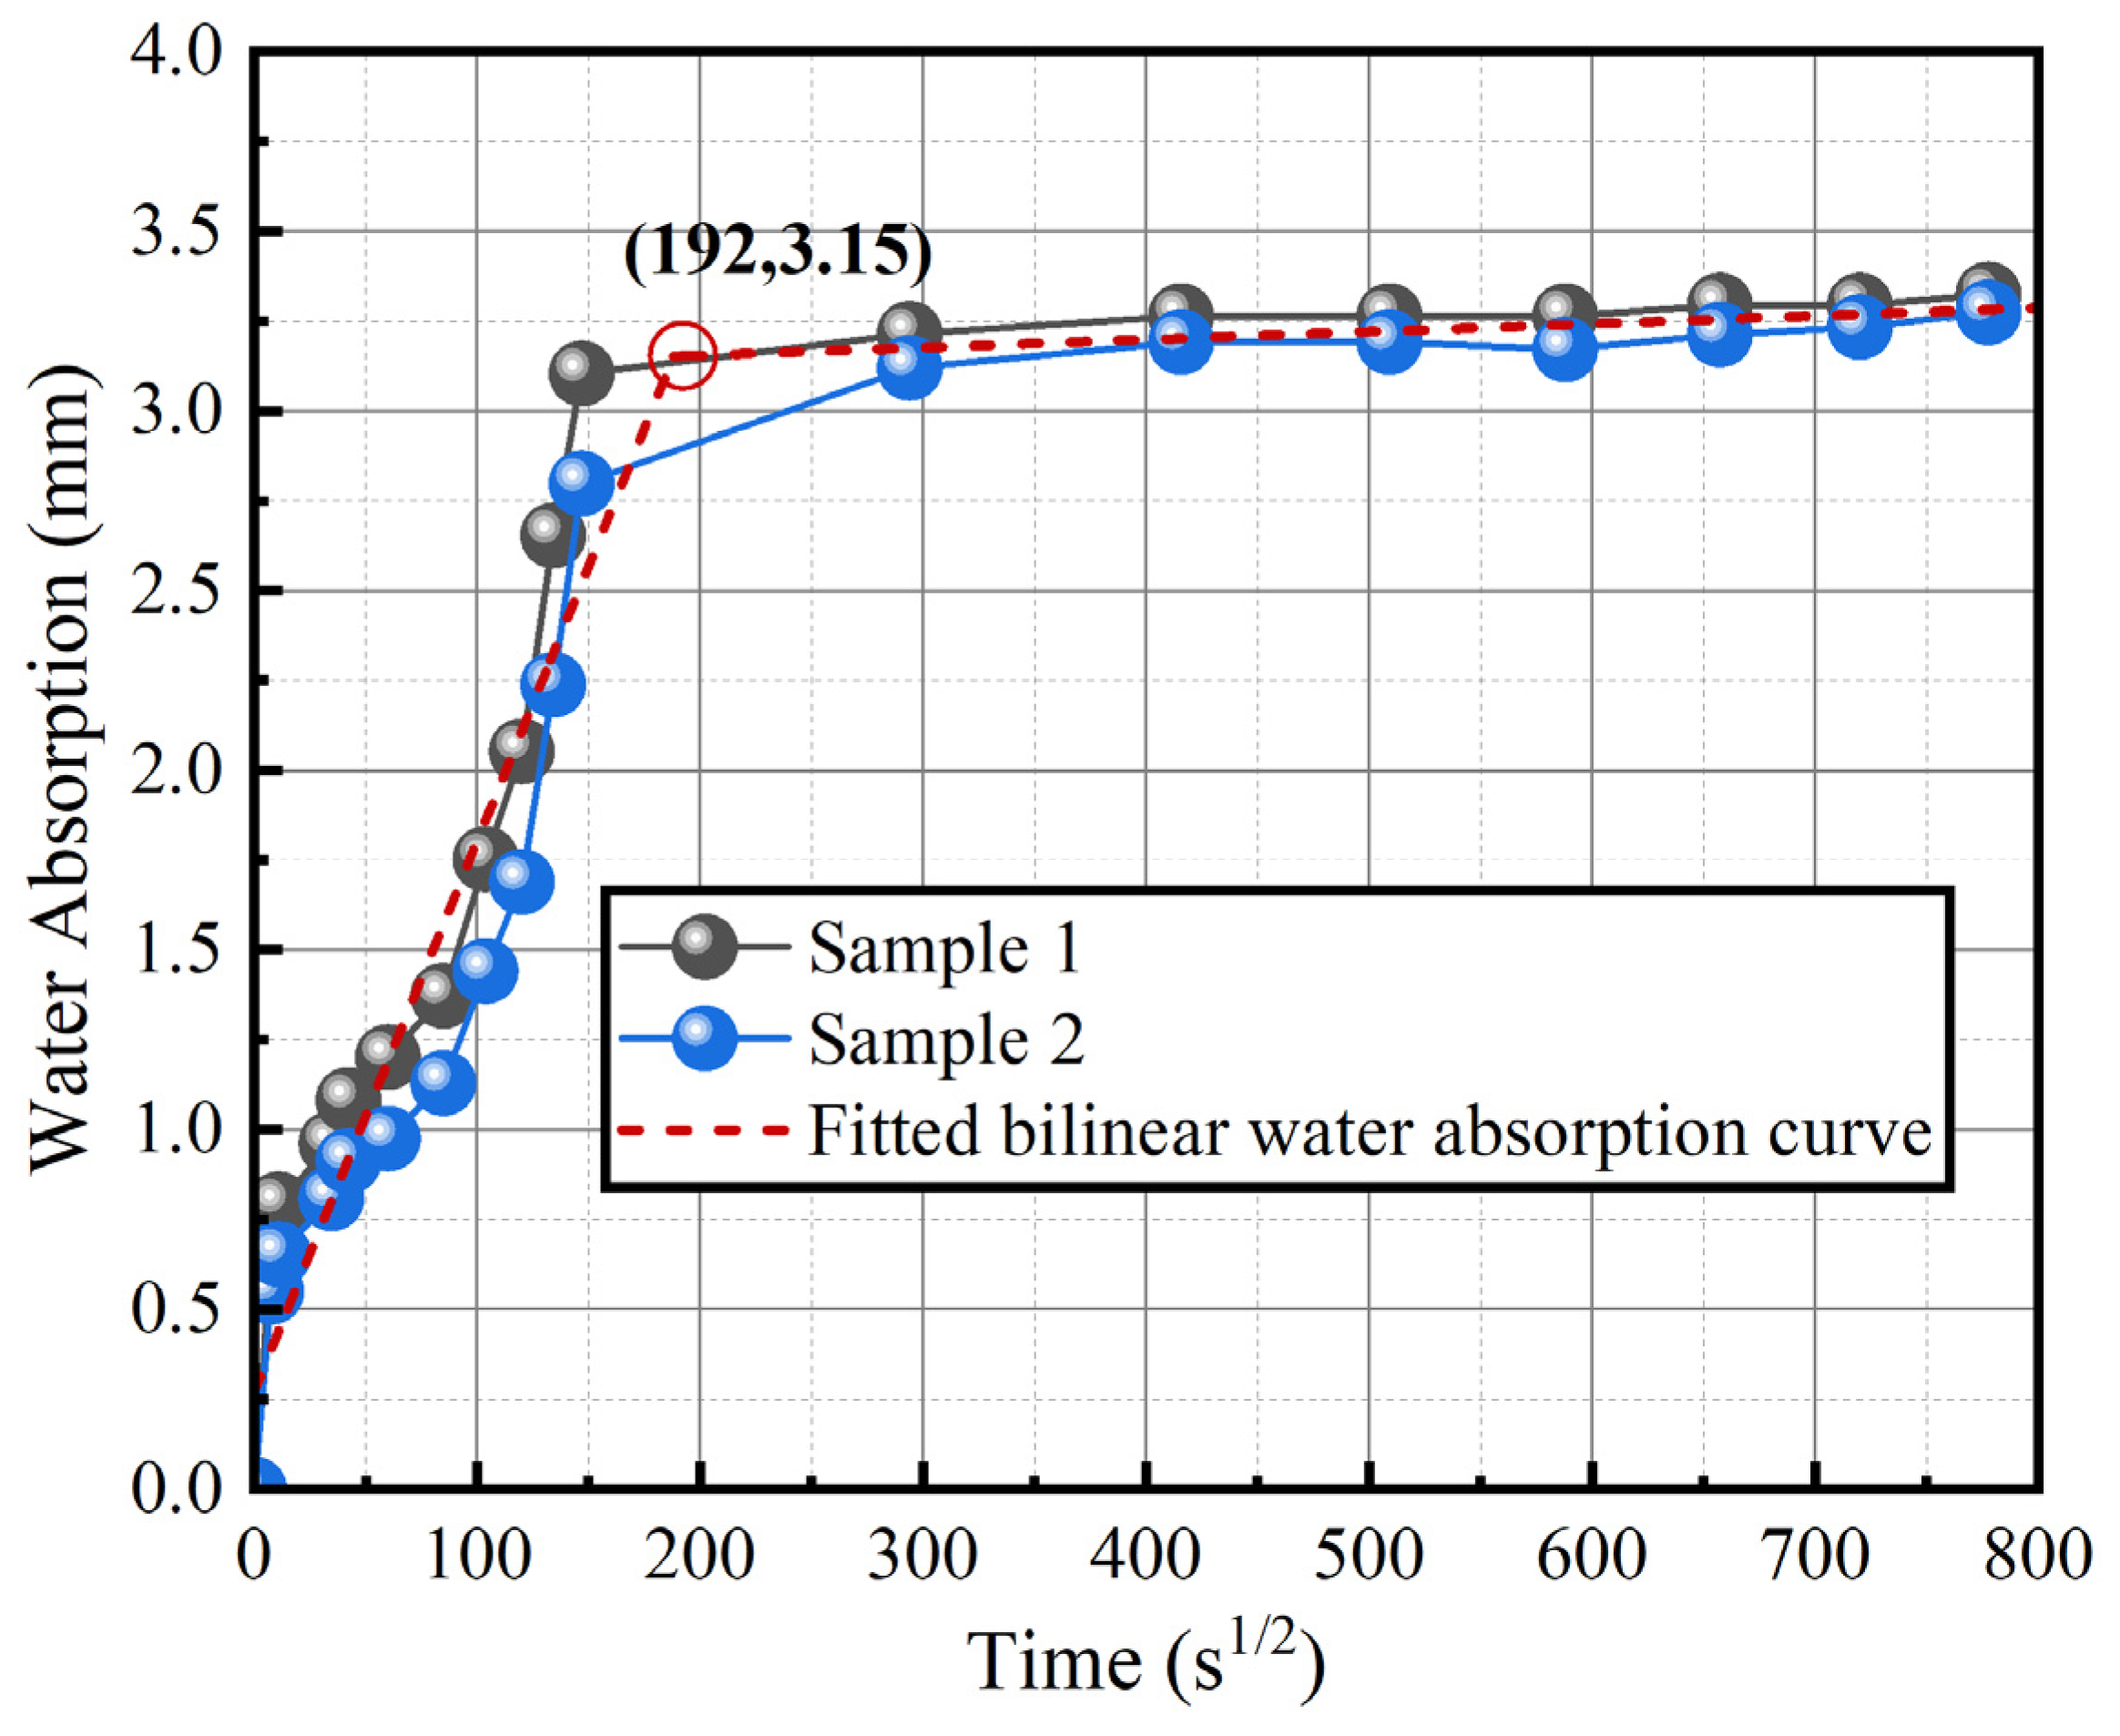
Figure 8 illustrates the water absorption curves for slices 1 and 2 in their initial state. The actual water absorption process of cement-based materials is divided into two stages, marked by a distinct inflection point [49,50,51]. The first stage involves capillary water absorption, influenced by the water to cement ratio, the degree of cement hydration, and the material’s permeability. This stage concludes approximately 2–3 days after the onset of water absorption. The second stage involves the gradual filling of air voids by displacing air, a process that takes significantly longer and is typically measured in years. The water absorption amount (I) is normalized to the cross-sectional area exposed to water, as specified by ASTM C1585. Based on the bilinear fitted water absorption curves in the figure, the initial masses (m1) of slices 1 and 2 correspond to water absorption times of 46 days and 33 days, respectively. It can be concluded that the specimens are still in the early phase of the second water absorption stage.

Figure 8.
Initial state specimen water absorption curve.
A thorough analysis of the water absorption tests for slices 1 and 2, coupled with the vacuum saturation tests for slices 3 and 4, indicates that the specimens were in the early phase of the second stage of water absorption before commencing the freeze–thaw cycle experiments. Specifically, the capillary and gel pores within the material were nearly saturated, indicating thorough infiltration of moisture into the microstructure of the specimens [52,53,54]. However, experimental results also revealed significant air voids within the specimens, suggesting incomplete saturation.
Partially saturated specimens may exhibit distinct damage mechanisms and failure modes during freeze–thaw processes compared to fully saturated ones [55,56,57]. The presence of air voids can influence ice formation and expansion, potentially impacting the structural integrity to varying degrees. Additionally, partially saturated specimens may experience reduced freeze–thaw damage due to lower expansion pressure within the air voids. Thus, subjecting all specimens to multiple FTCs before the main experiments is crucial to eliminate air voids and achieve full saturation. This step ensures the accuracy and reproducibility of the experimental outcomes.
3.2. Water Absorption
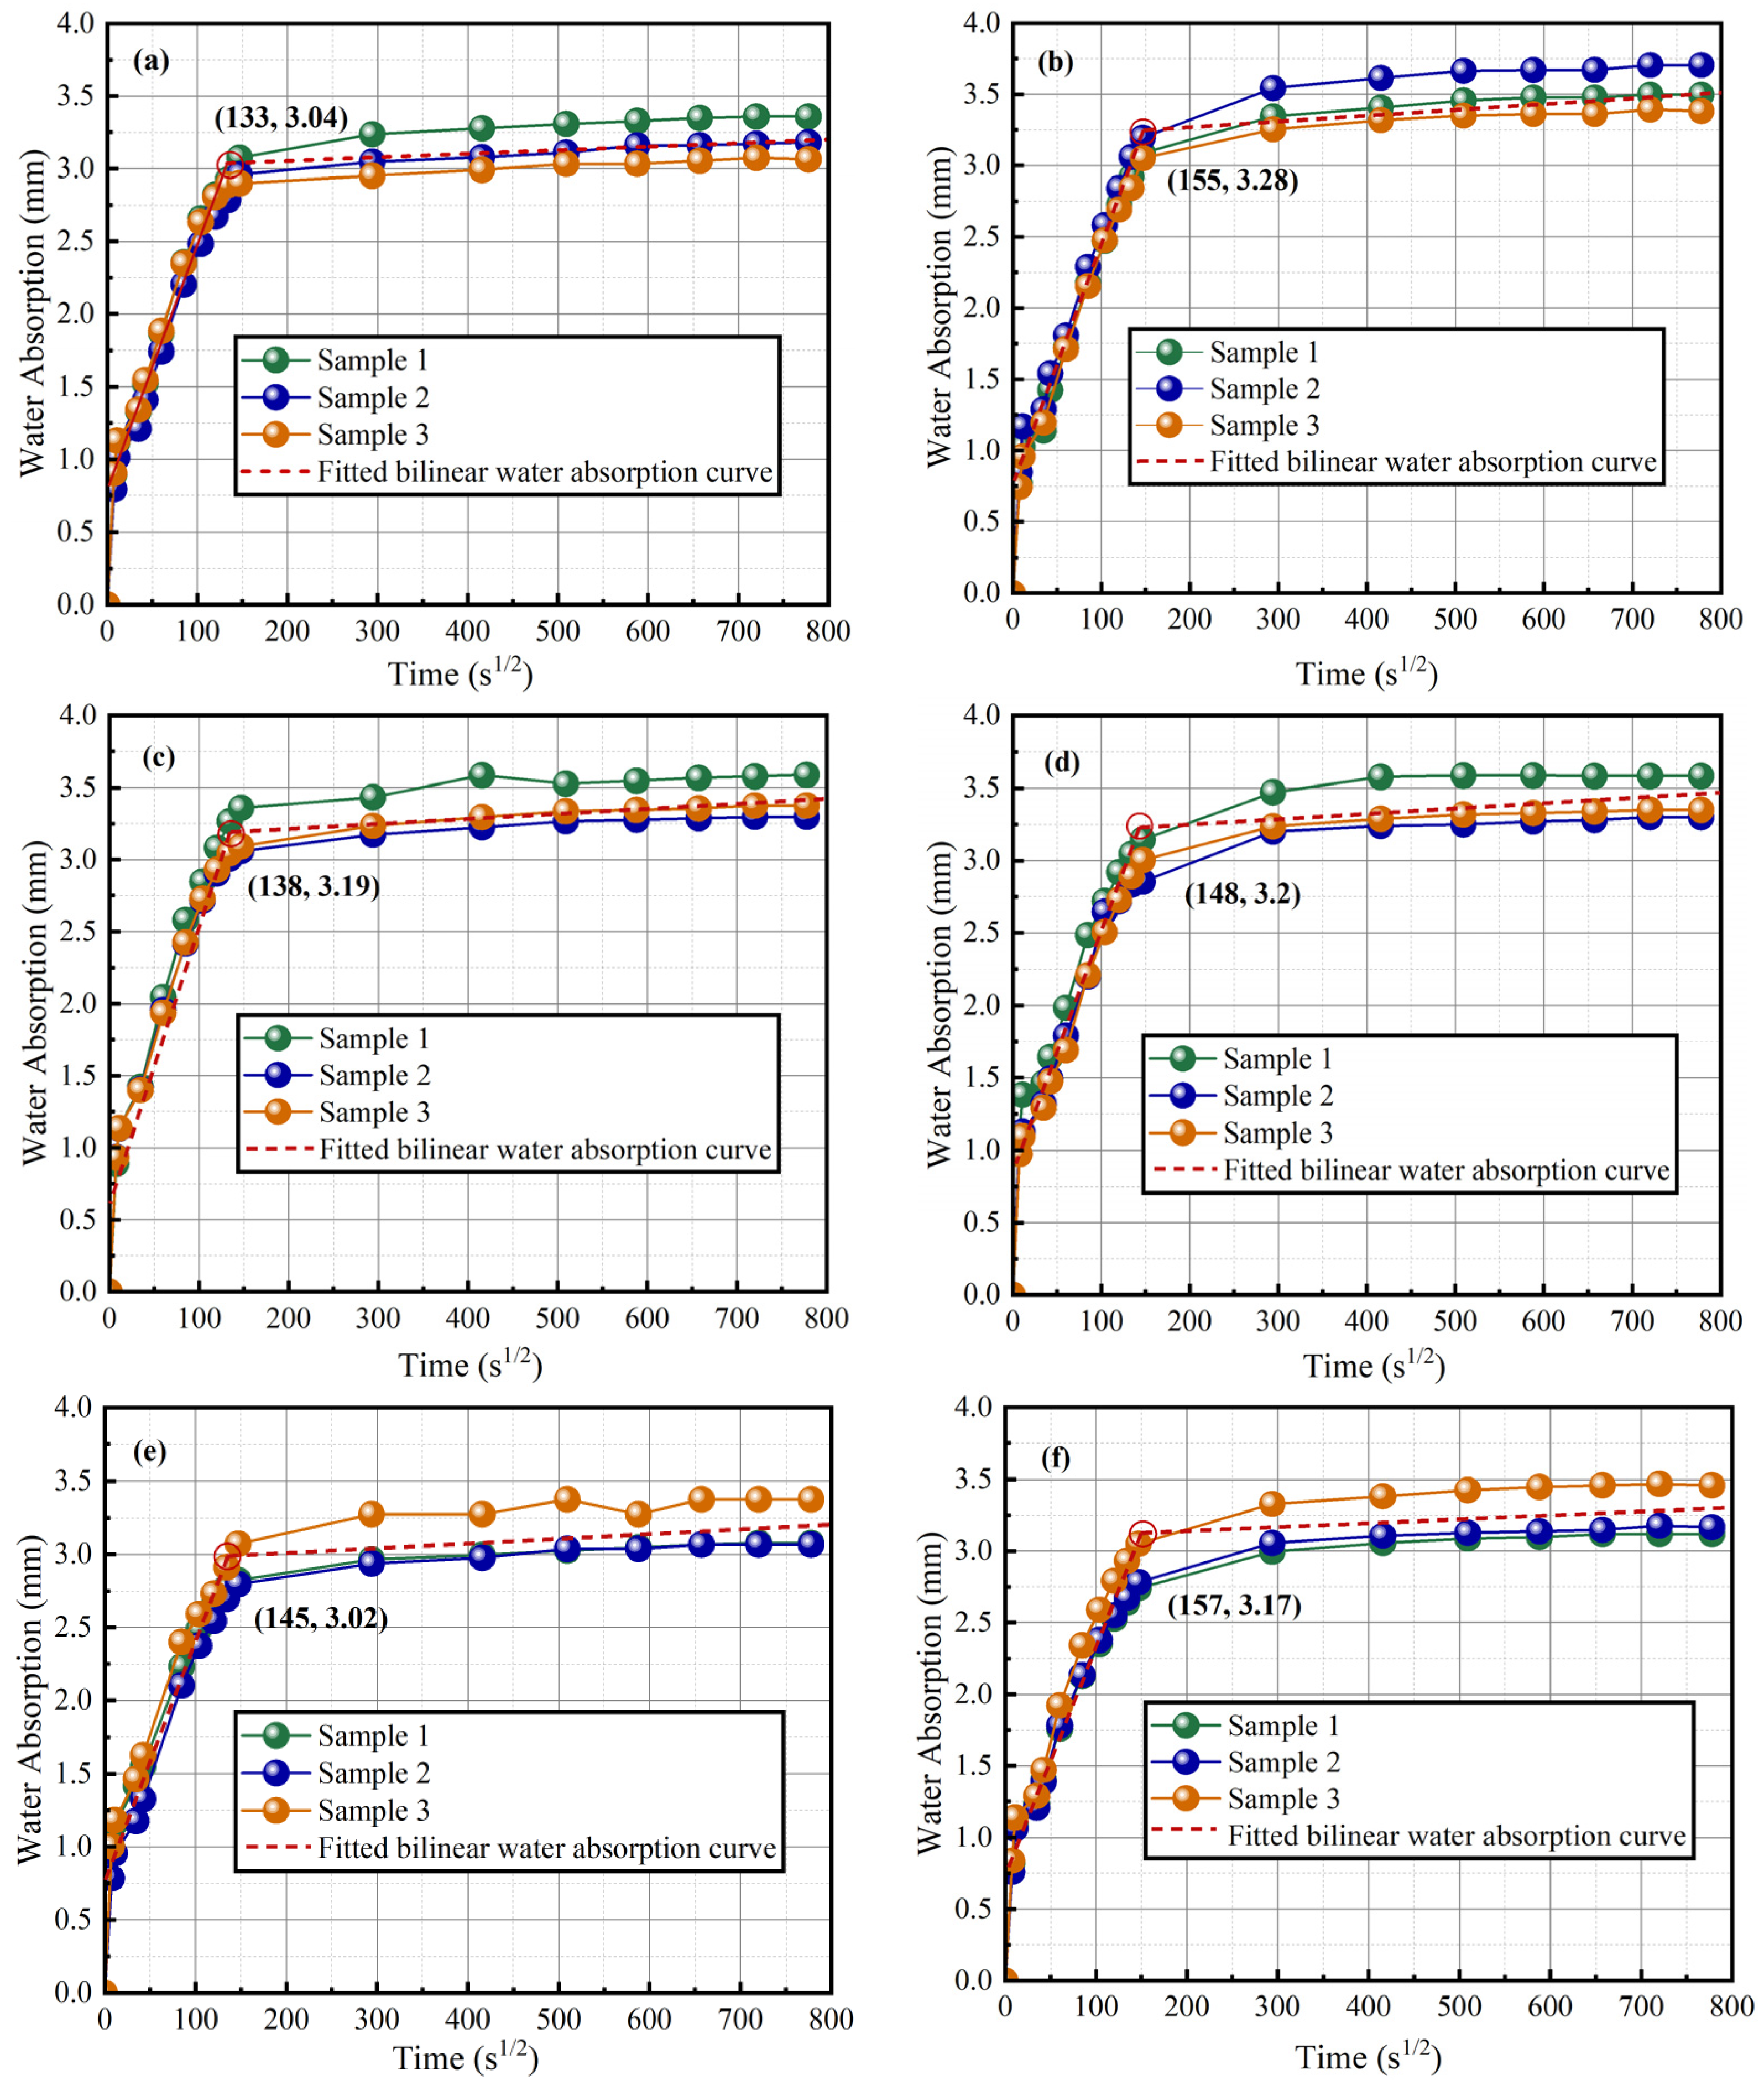
Figure 9 illustrates the variation in water absorption rates of the specimens over different sealing times. In this freeze–thaw cycle experiment, six specimens were taken at various stages, sliced, and subjected to water absorption tests. Each set of water absorption curves, labeled 1–3, represents slices obtained from the same specimen.
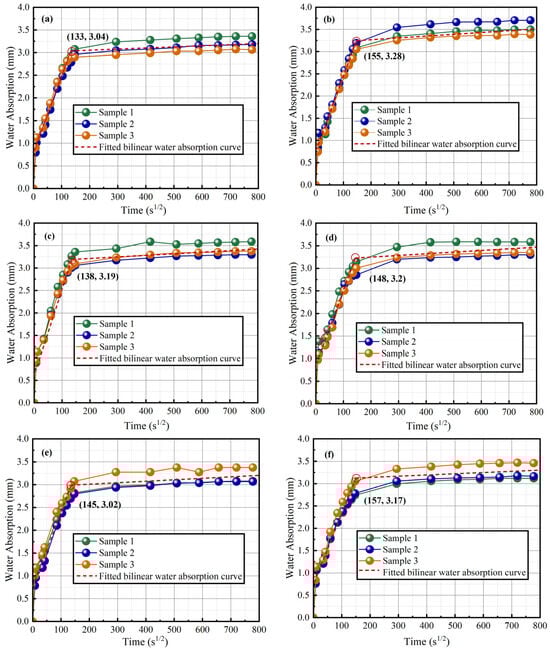
Figure 9.
Effect of different sealing times on specimen water absorption: (a) OF15; (b) OF15CF15; (c) OF15CF30; (d) OF30; (e) OF30CF15; (f) OF45. Note: “OF” denotes open FTCs; “CF” denotes closed FTCs.
The graph shows a bilinear relationship between water absorption and the square root of time. The transition from the first stage occurs within the range of 133 s1/2 to 160 s1/2, corresponding to approximately 5–7 h, which aligns closely with the ASTM standard of 6 h for the end of the first stage of water absorption. This consistency indicates the high accuracy and reliability of the experimental water absorption data. The bilinear absorption characteristic aids in understanding the moisture migration behavior in concrete materials under different sealing conditions [58,59]. Specifically, the first stage of water absorption is predominantly governed by capillary action, during which the absorption rate is high as water quickly infiltrates the capillary and gel pores of the specimen. Over time, as the process enters the second stage, the absorption rate significantly decreases. This reduction occurs as the capillary action diminishes once the larger pores become saturated. At this point, absorption is primarily driven by the expulsion of air from the pores, with water gradually filling the finer pore structures. This transition reflects a change from rapid capillary-driven absorption to a more gradual process where water permeates the denser network of smaller pores and voids.
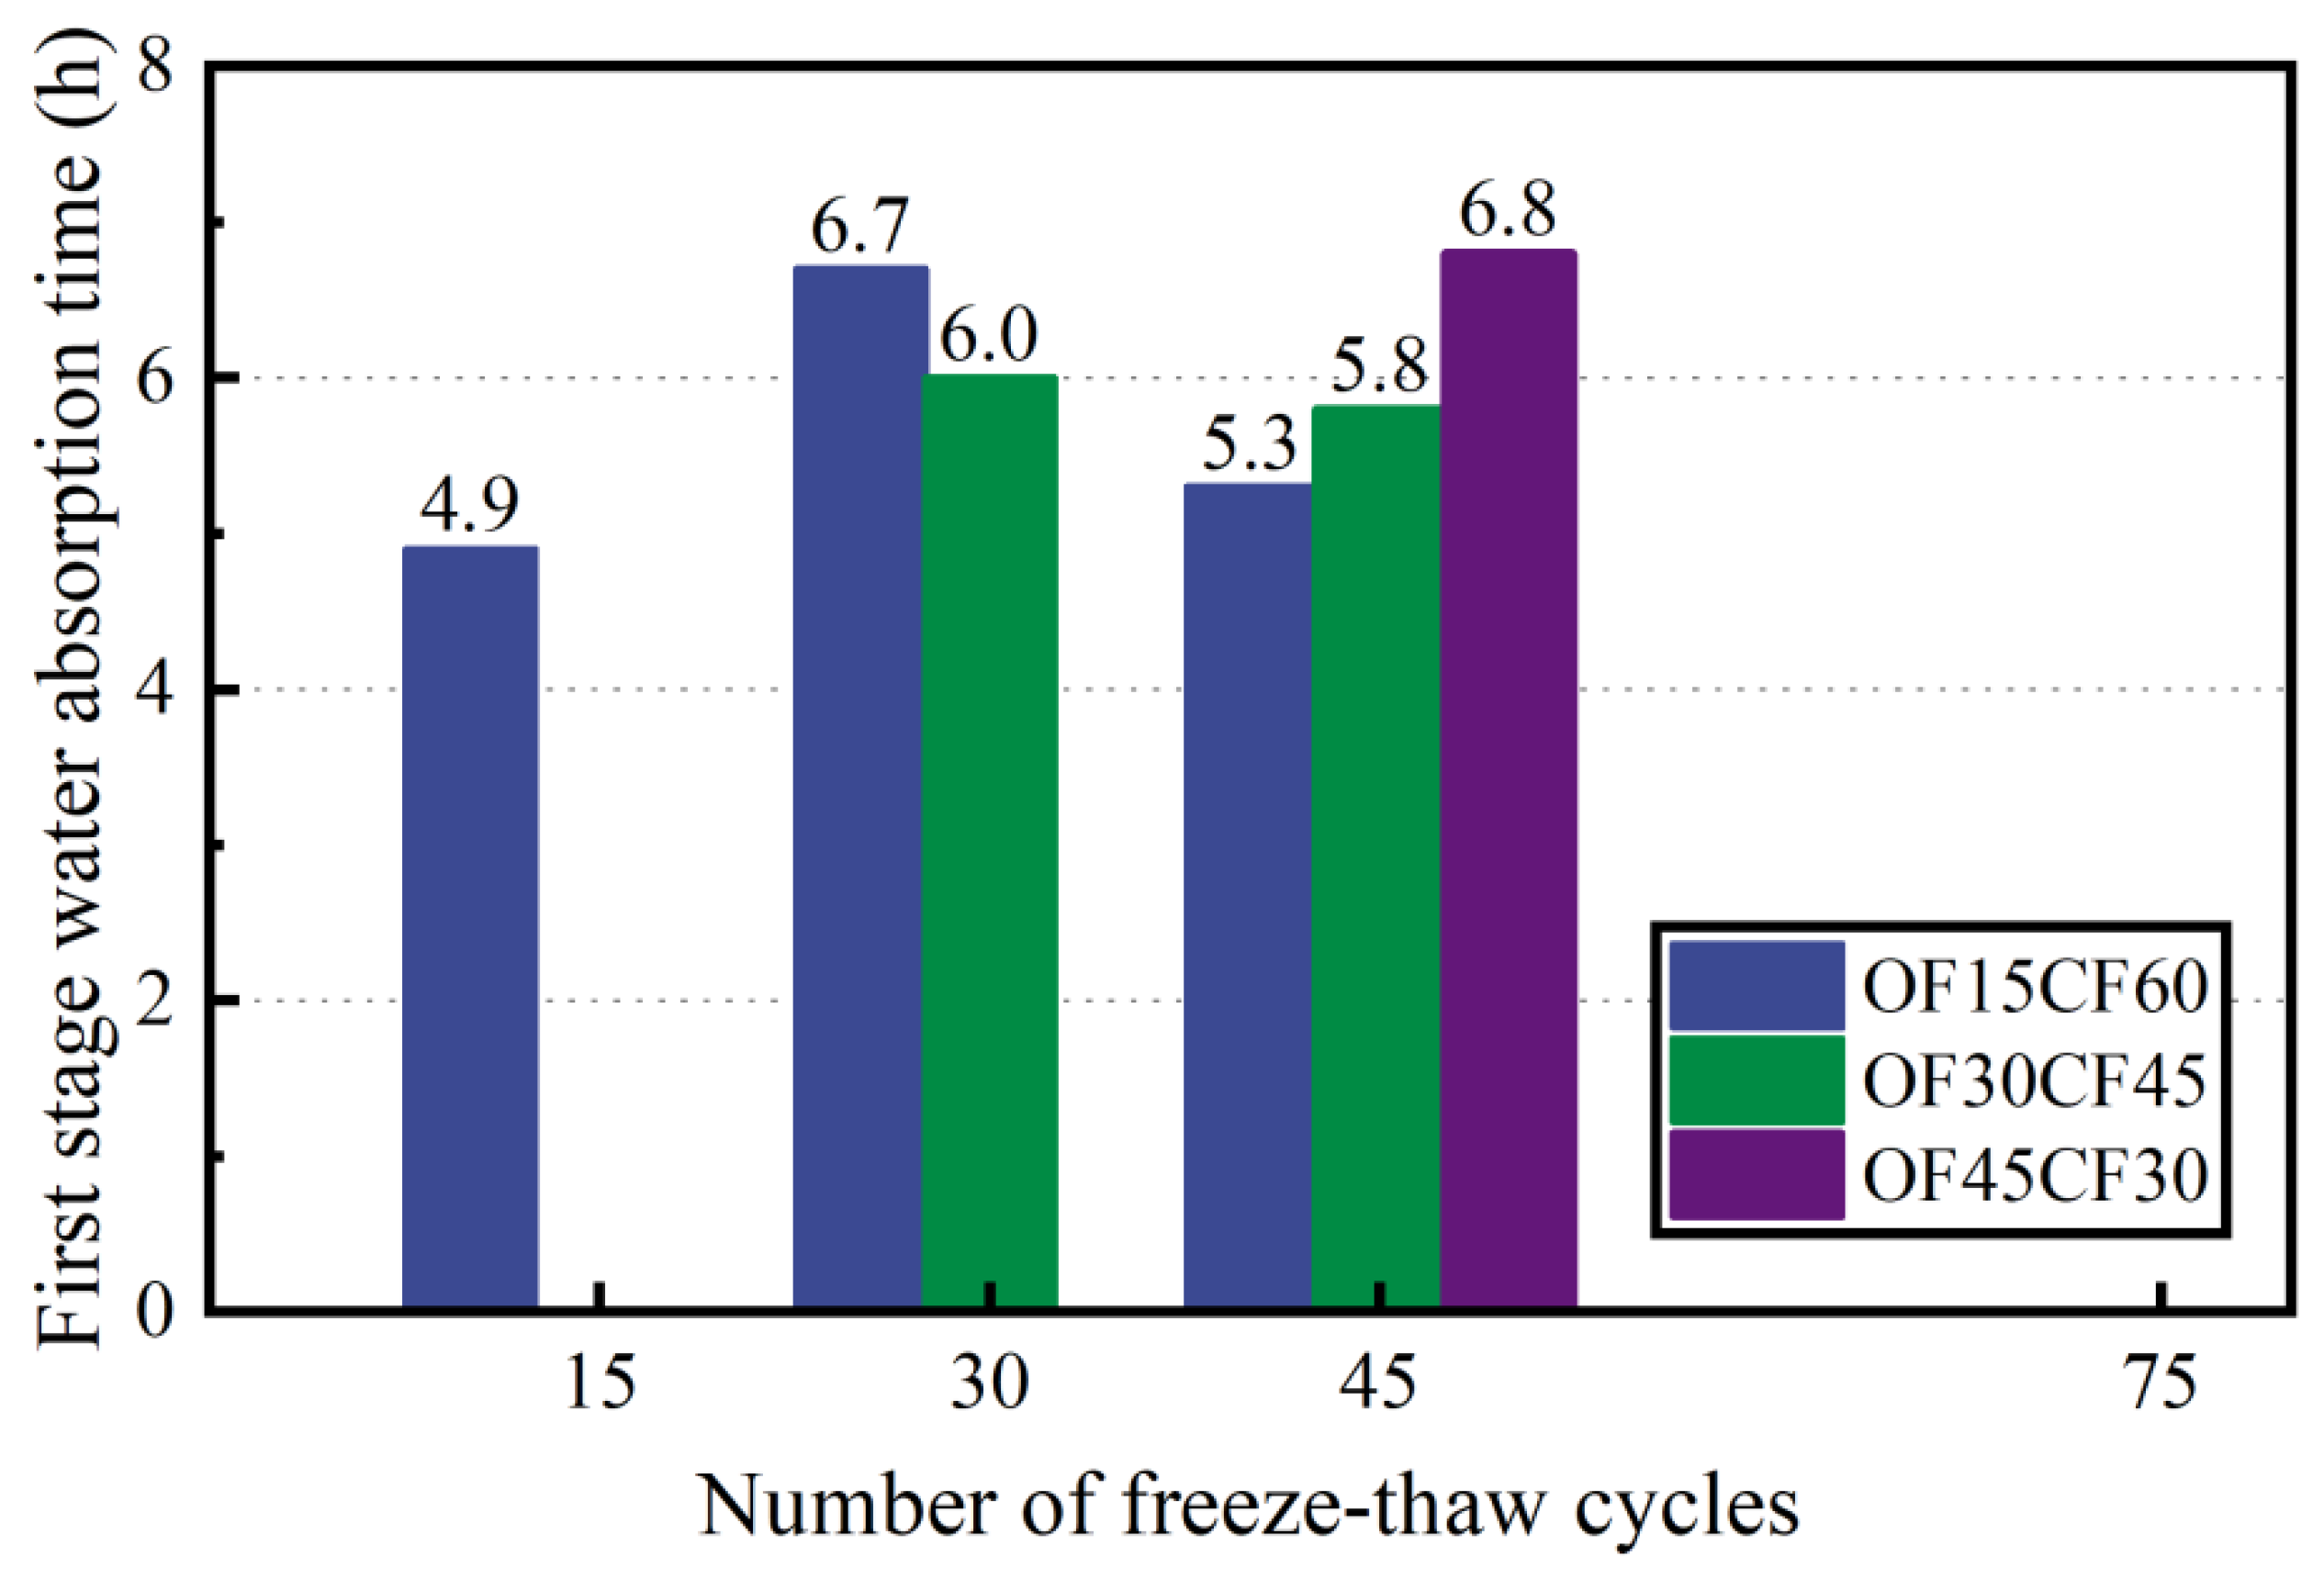
Figure 10 illustrates the duration of the first stage of water absorption for samples at different sealing stages. The figure shows that this duration varies among different slices at various stages. Comparing the water absorption curves of different sample groups (OF15CF60, OF30CF45, and OF45CF30) at the same freeze–thaw cycle stage (FTC45), it is observed that the inflection point between the first and second stages of water absorption appears earliest for the OF15CF60 group, at 5.3 h. This is followed by the OF30CF45 group at 5.8 h, and the OF45CF30 group with the longest duration of 6.8 h. As the number of FTCs in an open water environment increases, the inflection points for the transition between the first and second stages of water absorption are progressively delayed.
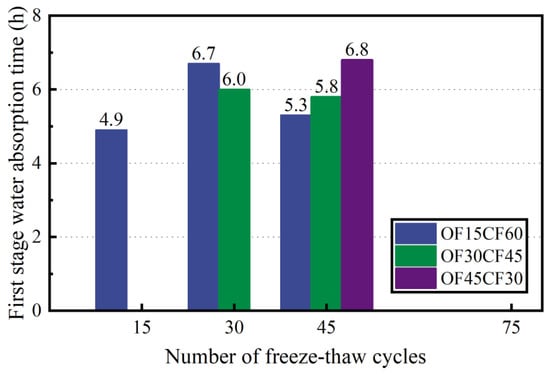
Figure 10.
First stage water absorption times of specimens at different sealing stages.
The first stage of water absorption is primarily dominated by capillary and gel pore absorption. Therefore, the delay in the inflection point between the first and second stages reflects changes in the pore structure. This delay indicates that with the progression of FTCs, the volume or number of capillary and gel pores may increase [60,61,62]. This observation aligns with changes in the pore structure induced by FTCs. As the number of FTCs increases, significant changes occur in the pore structure of the samples. These changes may include the expansion of capillary and gel pores and the formation of new pores. During the freezing phase, the water inside the pores expands due to the formation of ice, exerting pressure on the pore walls and leading to their widening. This expansion is often accompanied by the development of new microcracks, which further disrupt the existing pore structure. As the thawing phase occurs, the ice melts and the water contracts, leading to additional stress on the pore walls and potentially causing the formation of new cracks. Such structural alterations are likely due to the formation and development of microcracks caused by the expansion and contraction of water during FTCs. These microcracks increase the total porosity within the material, thereby extending the duration of the first stage of water absorption.
3.3. Ultrasonic Pulse Velocity
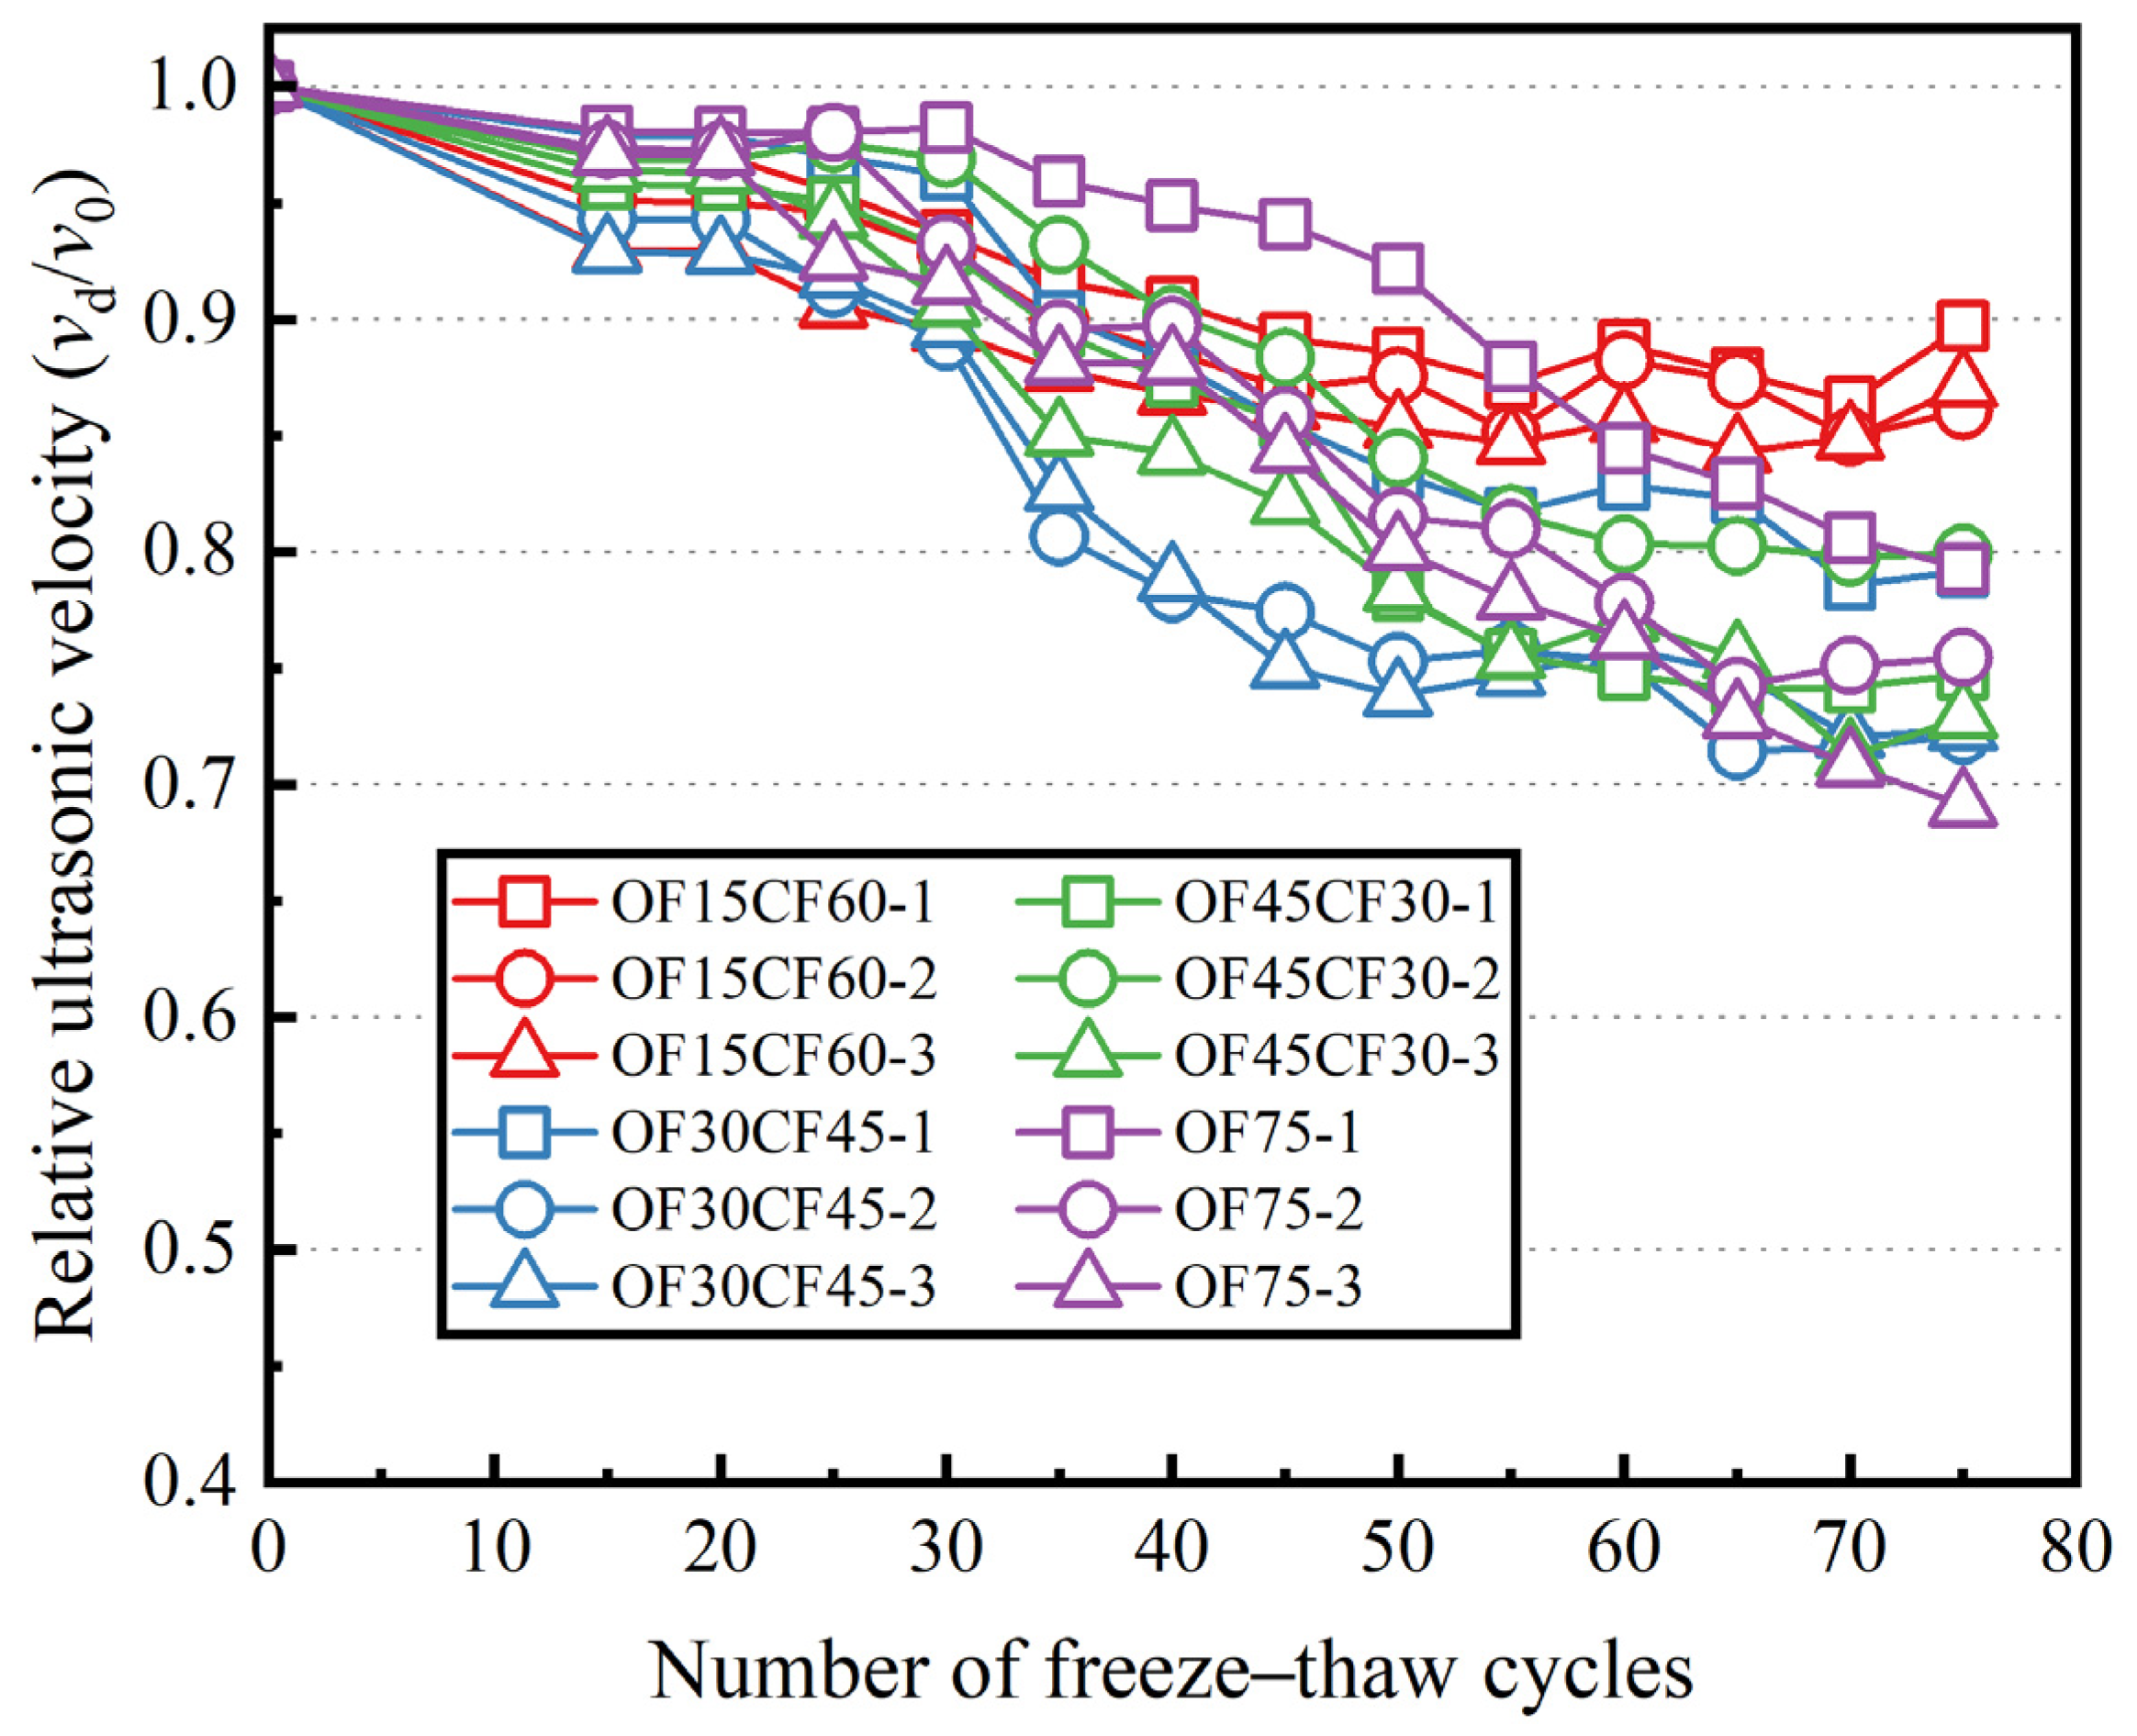
Figure 11 illustrates the trend in ultrasonic velocity loss in concrete specimens during FTCs. After sealing treatment, the ultrasonic velocity of groups OF15CF60, OF30CF45, and OF45CF30 initially decreases and then stabilizes. This observation aligns with the findings of Sicat et al. [24], where the total internal water content of the samples remained constant throughout the cycles. In their study, after several FTCs, the maximum strain of the samples reached a stable value, and the residual strain also stabilized.
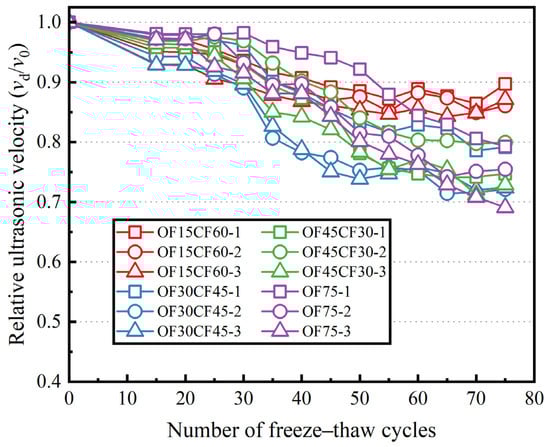
Figure 11.
Ultrasonic velocity losses of concrete specimens during FTCs.
Water content significantly affects the transmission time of ultrasonic waves [4]. The ultrasonic velocity of the same sample varies under different saturation levels or moisture contents [63]. When ultrasonic waves pass through specimens that have been fully dried after freeze–thaw damage, their velocity significantly decreases. This is because the cracks and pores formed during the FTCs contain almost no water after the specimens are completely dried, causing the propagation speed of sound waves in the air-filled cracks to slow down. Conversely, in specimens subjected to FTCs in a sealed water environment (OF15CF60, OF30CF45, and OF45CF30), the ultrasonic velocity slightly increases after being unsealed and re-immersed in water. During the FTCs, the pore stress generated by freezing exceeds the tensile strength of the concrete material, leading to the development of existing internal defects and the formation of new cracks [64,65,66]. When the specimens are fully dried, the cracks contain almost no water. The drying process causes the water within the pores and cracks to evaporate, leaving behind air-filled voids. However, after re-immersion in water, the previously unfilled pores and cracks are replenished. The propagation medium in the cracks changes from air to water, resulting in an increase in ultrasonic velocity. Consequently, the re-filling of cracks with water leads to an increase in the measured ultrasonic velocity, which reflects the enhanced efficiency of wave propagation through the water-saturated pores. These experimental results support the theory of ultrasonic wave propagation, which states that sound waves travel faster in water-filled cracks and pores due to the higher propagation speed in the water medium.
3.4. Compressive Strength
Figure 12 displays the compressive strength of concrete specimens from different groups at the conclusion of FTCs. The figure reveals a close correlation between the compressive strength of concrete specimens post-FTCs and the sealing time. Groups OF15CF60, OF30CF45, and OF45CF30 underwent sealing treatments at varying freeze–thaw stages, while group OF75 remained under open water supply conditions. After 75 FTCs, the average residual compressive strengths of the OF15CF60, OF30CF45, OF45CF30, OF75, and NS specimen groups were 32.3 MPa, 29.6 MPa, 26.1 MPa, 20.6 MPa, and 29.5 MPa, respectively. The residual compressive strength of the OF15CF60 group was 36.22% higher than that of the OF75 group.
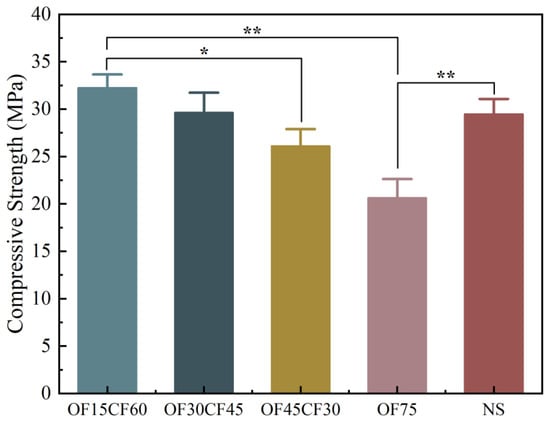
Figure 12.
Compressive strengths of concrete specimens at the end of FTCs. Note: “*” denotes p–value ≤ 0.05 (significant); “**” denotes p–value ≤ 0.01 (extreme significant).
With an increase in the number of FTCs under open conditions, the compressive strength of the specimens gradually declines. This research outcome underscores that implementing water restriction measures earlier results in less severe frost damage to concrete structures and higher levels of protection for concrete materials. Specifically, early sealing effectively reduces moisture intrusion during FTCs, thereby decelerating the expansion of internal pores and cracks and mitigating the adverse impact of frost damage on concrete strength [67,68]. By controlling moisture entry at an early stage, the expansion of internal pores and cracks is slowed down. This delay in pore and crack expansion has a direct positive impact on the durability and structural integrity of concrete. When the internal pore structure remains more stable, the material’s resistance to freeze–thaw cycles is enhanced, leading to a significant reduction in frost damage. Moreover, these findings underscore the critical role of sealing treatments in enhancing concrete durability. Early sealing not only alleviates pore pressure due to moisture migration but also inhibits ice formation and expansion, thus reducing microstructural damage induced by FTCs.
4. Prediction Model for Concrete Freeze–Thaw Deterioration
4.1. Theoretical Basis
To provide a clearer and more rational explanation of the differences in concrete freeze–thaw damage under conditions of open and closed boundaries—specifically that the degree of concrete freeze–thaw damage is greater when boundaries are open compared to when they are closed—this paper conducts a theoretical analysis at this juncture.
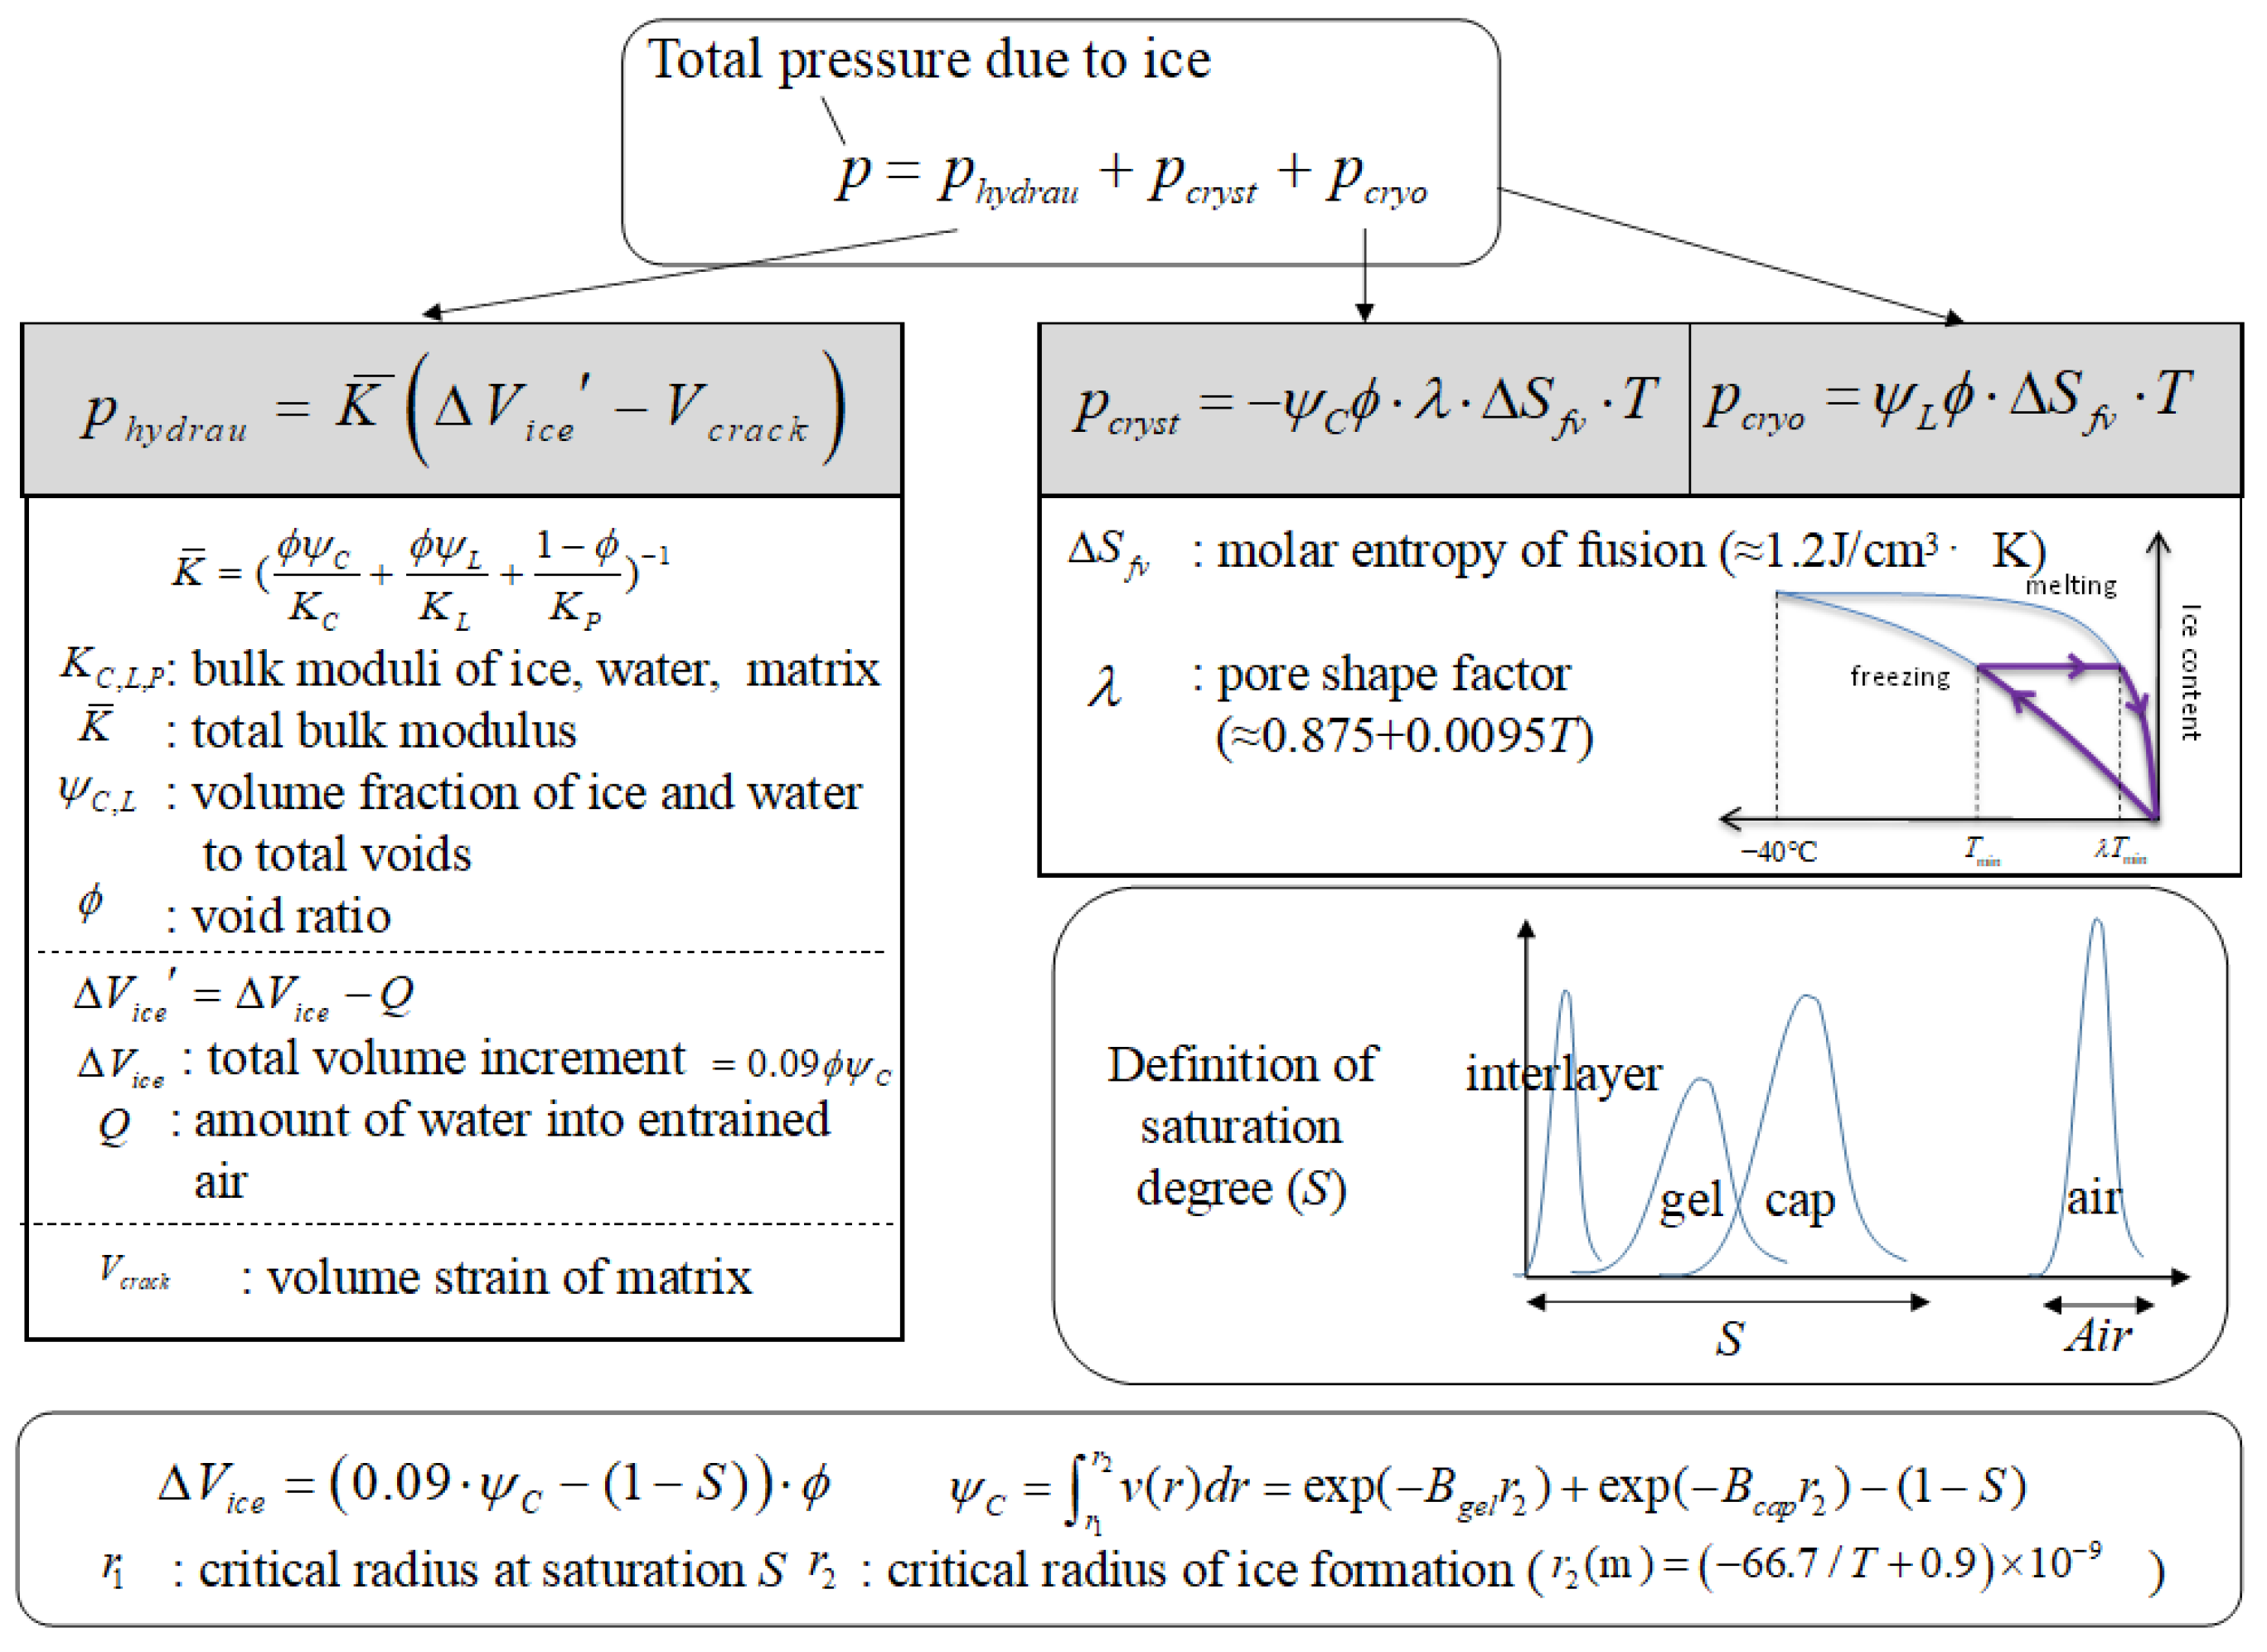
Firstly, the freezing pressure of concrete can be assumed to be composed of Ph, Pl, and Pc, which are related to pore size distribution and the lowest freezing temperature. The quantitative models for Ph, Pl, and Pc are illustrated in Figure 13. The initial water absorption is primarily dominated by capillary and gel pores. Therefore, the delay in the inflection between the first and second stages reflects changes in pore structure. This delay suggests that the volume or quantity of capillary and gel pores may increase as FTCs progress. This observation aligns with changes in pore structure induced by FTCs. With an increasing number of FTCs, significant alterations occur in the pore structure of the samples. These changes may include the expansion of capillary and gel pores as well as the formation of new pores. Such structural changes are likely attributed to the formation and development of microcracks due to the expansion and contraction of water during FTCs. These microcracks increase the overall porosity within the material, thereby prolonging the duration of water absorption in the first stage.
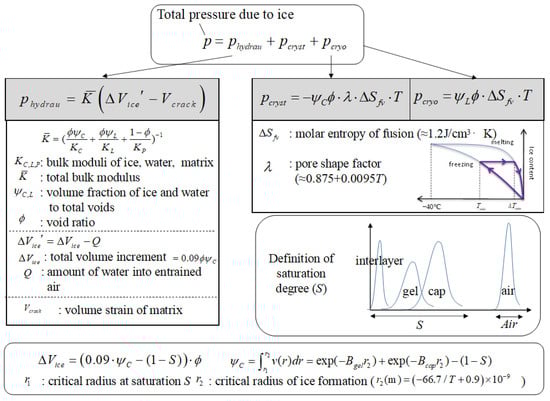
Figure 13.
Calculation approach of freezing pressure due to ice.
The magnitude of hydraulic pressure is closely related to the flow and transport of moisture. Concrete undergoes damage and can develop cracks after experiencing FTCs because the pore pressure generated by freezing exceeds the tensile strength of the concrete material, leading to the development of existing internal defects and the formation of new cracks. When the specimen is completely dry, the cracks contain almost no water. However, upon re-immersion in water, previously unfilled pores and cracks are replenished. Additionally, the formation of cracks during freezing provides more pore space for unfrozen water to flow, thereby reducing hydraulic pressure. Ultimately, due to the flow of moisture transport, the hydraulic pressure in the pores of cracked concrete tends towards zero, differing from the hydraulic pressure before and after frost heave cracking, as illustrated in Figure 14. Simultaneously, the crystallization pressure and cryo-suction pressure after cracking can be considered as additives to the hydraulic pressure, collectively influencing its magnitude.
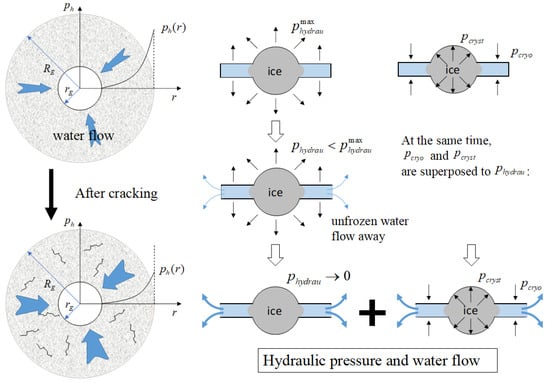
Figure 14.
Difference in hydraulic pressure and water flow after cracking.
Based on the above findings, it is evident that the differences in concrete freeze–thaw damage under open and closed boundary conditions can be explored through variations in hydraulic pressure and moisture transport. The specific distinctions between open and closed boundaries are illustrated in Figure 15. It is observed that open and closed boundary conditions correspond to whether there is additional moisture replenishment during the FTCs. When there is no additional moisture replenishment, the hydraulic pressure in the internal pores of concrete tends towards zero, with some cracks remaining unfilled with water, known as empty cracks. However, during FTCs in an open boundary condition, external moisture can continuously flow into the concrete, leading to the retention of additional ice crystals within cracks and thereby increasing the hydraulic pressure. This results in differences in concrete freeze–thaw damage compared to closed boundary conditions. Effective boundary sealing significantly reduces moisture ingress during FTCs, thereby mitigating the expansion of internal pores and cracks and reducing the adverse effects of frost on concrete. Furthermore, sealing not only alleviates pore pressure caused by moisture migration but also inhibits ice formation and expansion, thereby reducing microstructural damage induced by FTCs. The results indicate that implementing water control measures can reduce severe frost damage to concrete structures and enhance the protection level of concrete materials.

Figure 15.
Differences in concrete damages in open and closed environments. The blue arrow represents the direction of water flow.
4.2. Degradation of Ultrasonic Velocity
Figure 11 illustrates an approximate linear decline in relative ultrasonic velocity with an increase in the number of FTCs. Notably, significant changes in the decay rates of the sealed OF15CF60, OF30CF45, and OF45CF30 groups before and after the sealing treatment are evident, highlighting the considerable impact of sealing timing on the ultrasonic velocity decay rate. The formula (Equation (6)) derived from the regression analysis effectively fits the measured results of ultrasonic velocity, as depicted by the fitted curve in Figure 16. In this formula, k0 represents relative ultrasonic velocity, with N0 set at 15 to indicate the initial state of damage accumulation after 15 FTCs, and N1 represents the number of FTCs completed at the time of sealing treatment.
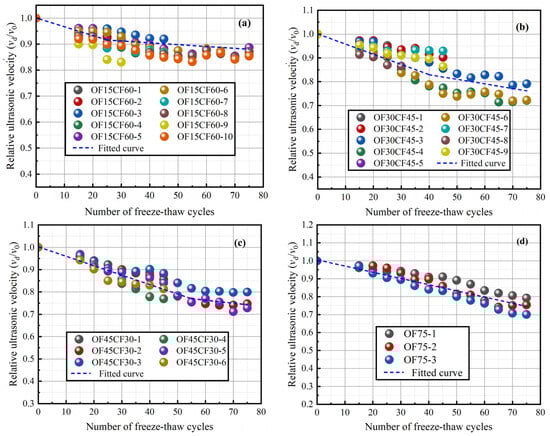
Figure 16.
Prediction model of ultrasonic pulse velocity for frost-damaged concrete: (a) OF15CF60; (b) OF30CF45; (c) OF45CF30; (d) OF75.
According to the regression formula, the damage accumulation rates for the OF15CF60, OF30CF45, and OF45CF30 groups after sealing were reduced by 27.98%, 10.66%, and 10.28%, respectively, compared to the OF75 group. This outcome underscores the significant impact of early sealing treatment in decelerating freeze–thaw damage accumulation. Sealing treatment restricts internal water exchange within specimens, thus inhibiting stress concentration resulting from moisture migration during FTCs, and consequently reducing the rate of expansion of internal microcracks in the material. The notable reduction in damage accumulation rates in sealed specimens indicates that the sealing treatment effectively postpones the physical damage induced by FTCs. The strong agreement between Equation (6) and the experimental results further validates the efficacy of the sealing treatment in delaying concrete freeze–thaw damage.
4.3. Correlation between Compressive Strength and Ultrasonic Pulse Velocity
Figure 17 presents a scatter plot of relative strength against the square of relative ultrasonic velocity, fitted with a linear model. The fitting outcomes reveal a highly linear correlation between these variables, as expressed by the correlation formula in Equation (7). Here, fc represents the initial compressive strength, fc,d denotes the residual compressive strength, v0 indicates the initial ultrasonic velocity, and vd represents the damaged ultrasonic velocity. The coefficient of determination R2 = 0.99 indicates an exceptionally strong correlation between ultrasonic velocity decay and concrete compressive strength degradation.
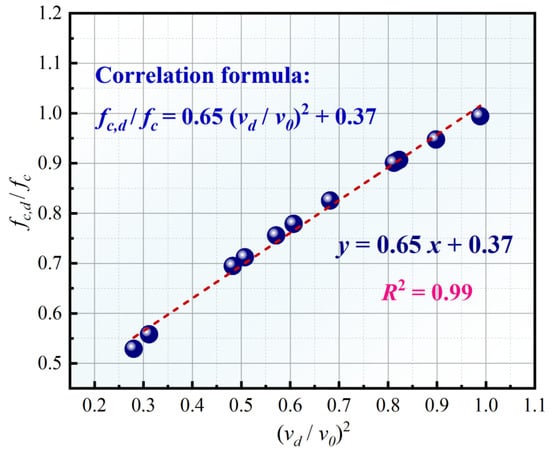
Figure 17.
Fitting of relative strength and relative ultrasonic pulse velocity squared for frost-damaged concrete.
Upon comparing the ultrasonic velocity and compressive strength data of various specimens pre and post FTCs, a significant decline in concrete compressive strength is observed with decreasing ultrasonic velocity. This observation suggests that ultrasonic velocity can serve as a vital indicator for assessing internal damage in concrete. The high R2 value further affirms the reliability and predictability of the linear relationship between ultrasonic velocity and compressive strength. Additionally, the study findings reveal that with an escalation in FTCs, ultrasonic velocity declines linearly, accompanied by a gradual reduction in compressive strength. A distinct correlation is evident between the residual compressive strength of different specimens post FTCs and the degree of ultrasonic velocity decay.
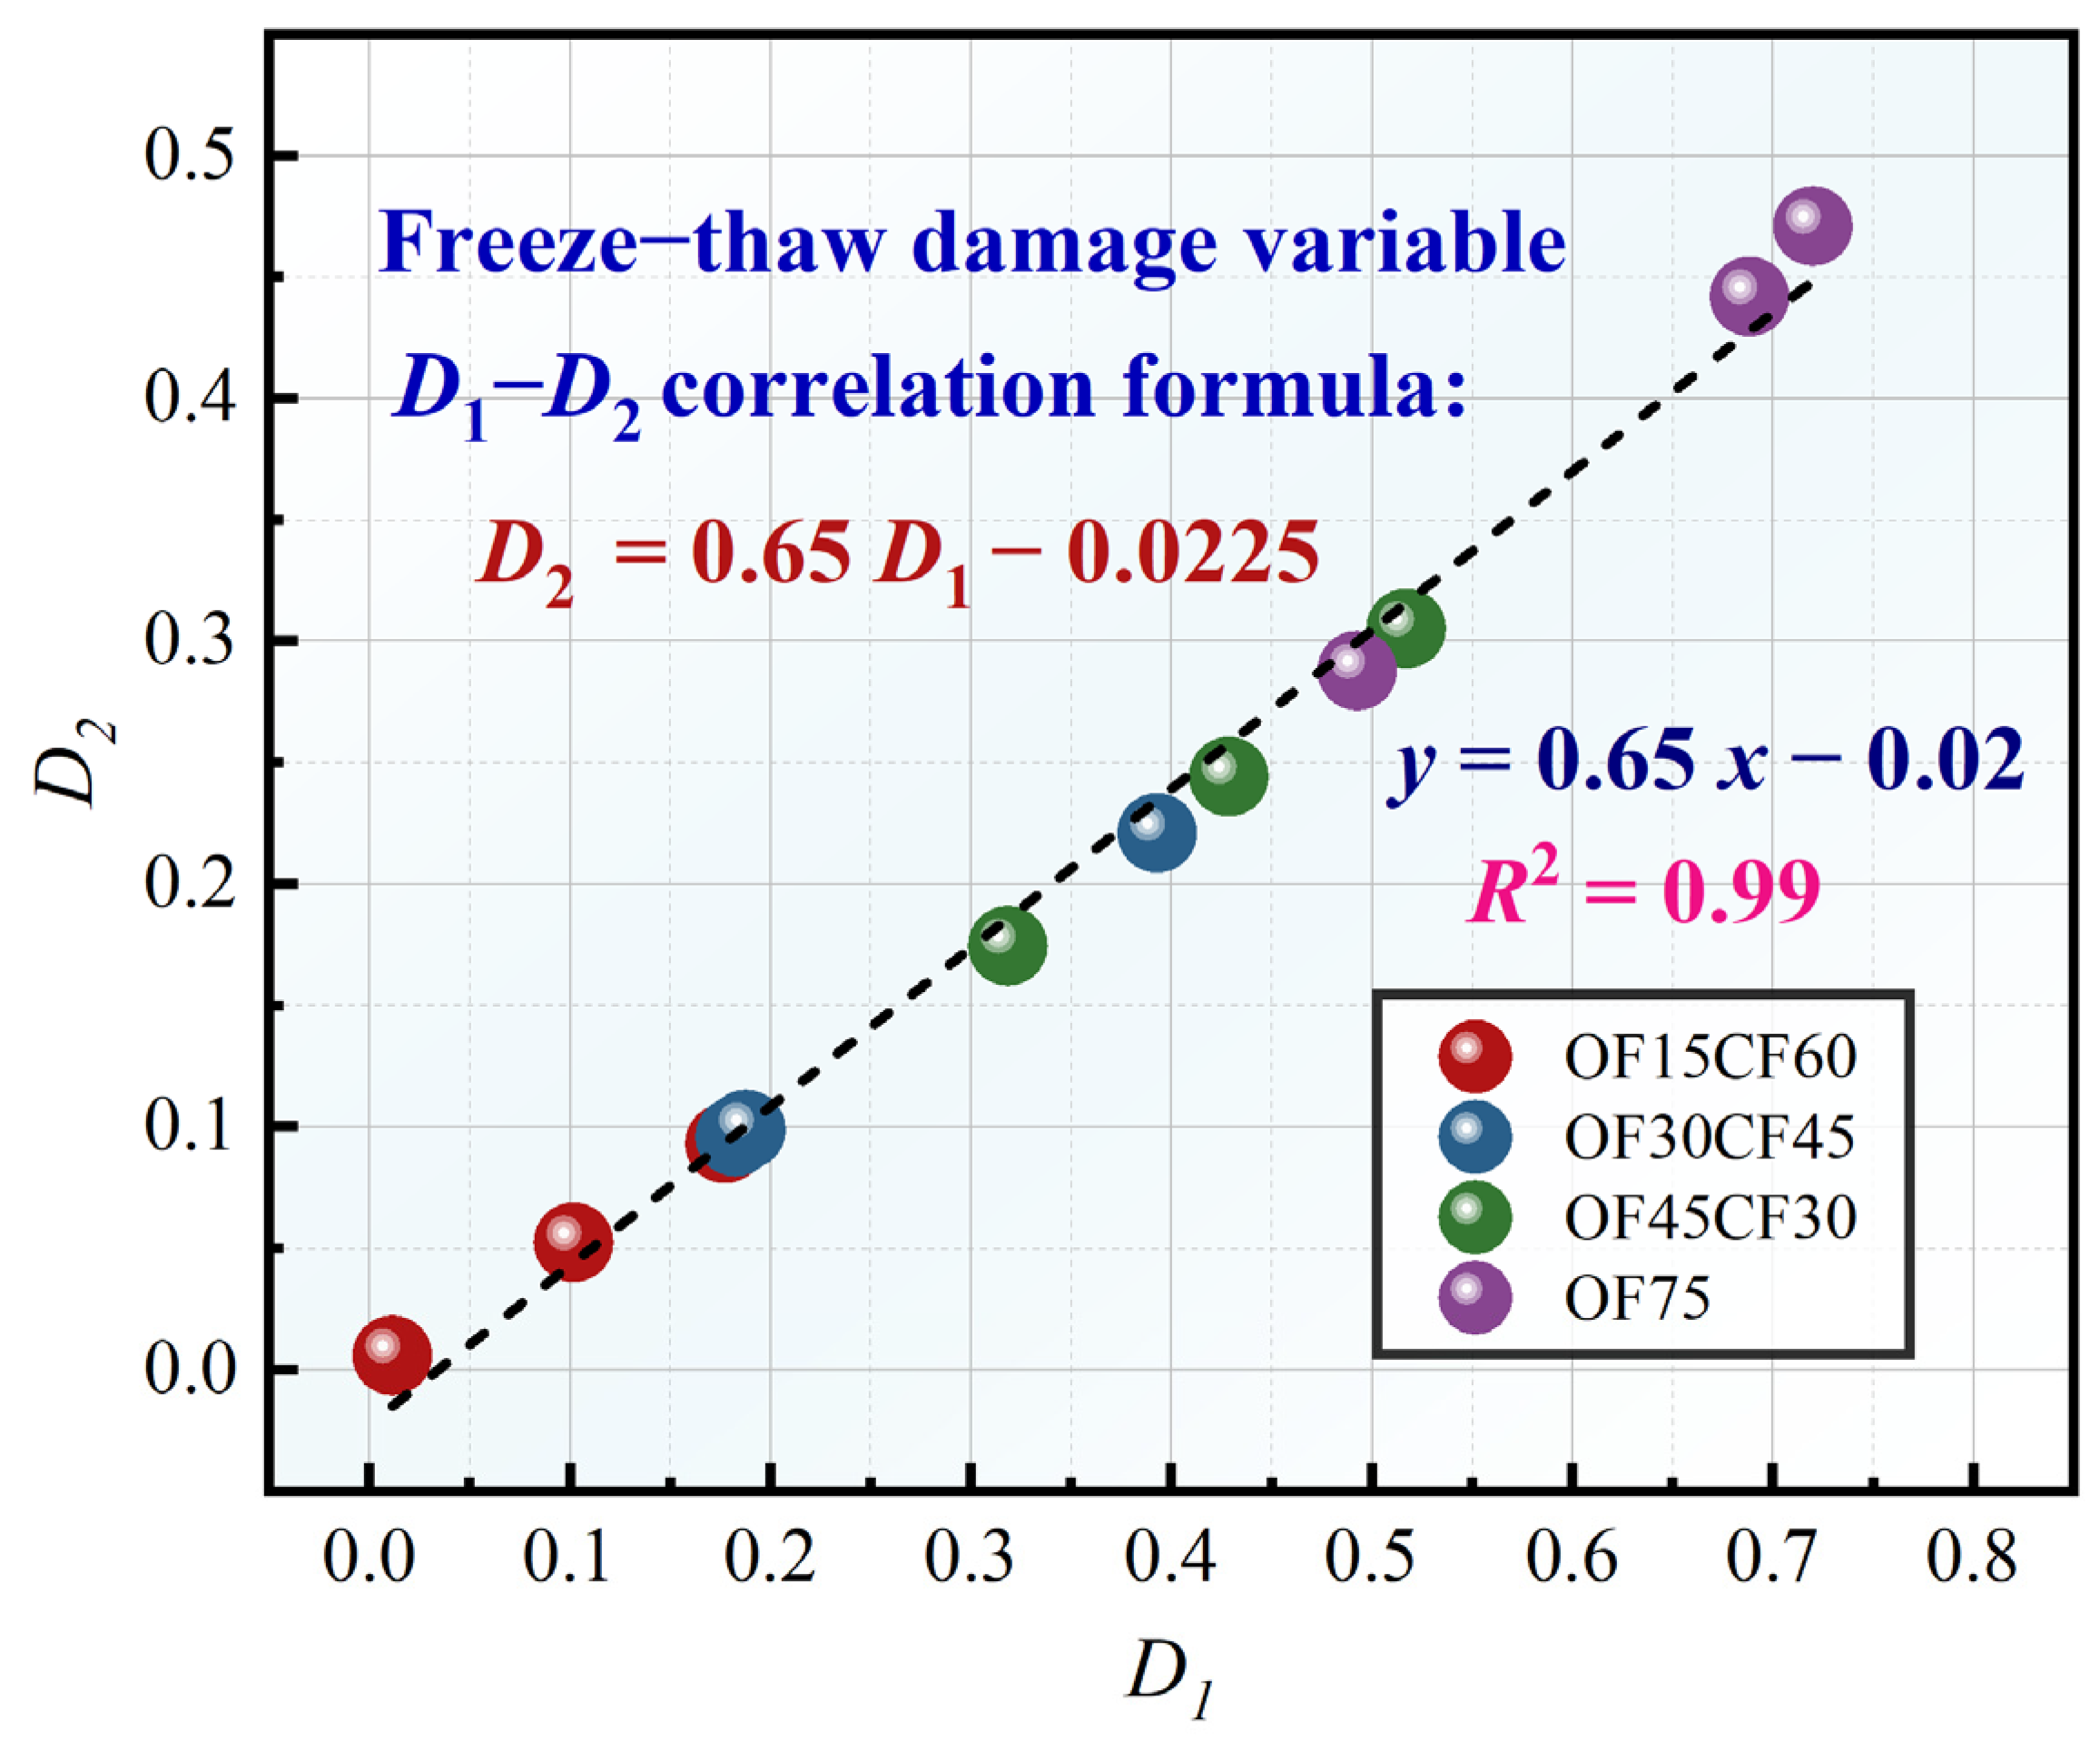
We define the damage variables D1 and D2 as shown in Equations (8) and (9), respectively. We also plot the corresponding scatter diagrams and fit the relationship between these variables as a linear function. By combining the data from the OF15CF60, OF30CF45, OF45CF30, and OF75 specimens, the resulting correlation formula is expressed in Equation (10). The fitting results, illustrated in Figure 18, yield a coefficient of determination R2 = 0.99, indicating a strong correlation between the two damage variables. This result demonstrates that the constructed damage variables D1 and D2 effectively characterize the actual damage accumulation in concrete during FTCs.
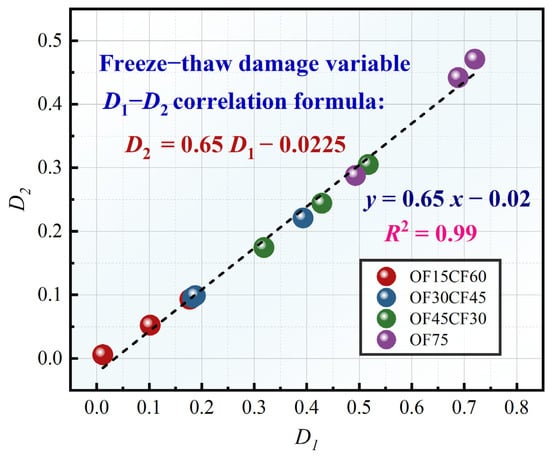
Figure 18.
Relationship between compressive strength and ultrasonic velocity.
Analyzing the data of the OF15CF60, OF30CF45, OF45CF30, and OF75 specimens at different freeze–thaw stages reveals a high consistency in their performance on the fitted function. This indicates that the constructed damage model has a significant level of applicability. Whether the specimens underwent early sealing treatment (OF15CF60, OF30CF45), late sealing treatment (OF45CF30), or remained under open water supply conditions (OF75), their damage variables are well described by the fitting formula. In practical engineering, monitoring changes in damage variables D1 and D2 enables a more accurate assessment of damage accumulation in concrete structures under freeze–thaw conditions. This provides a scientific basis for structural maintenance and repair.
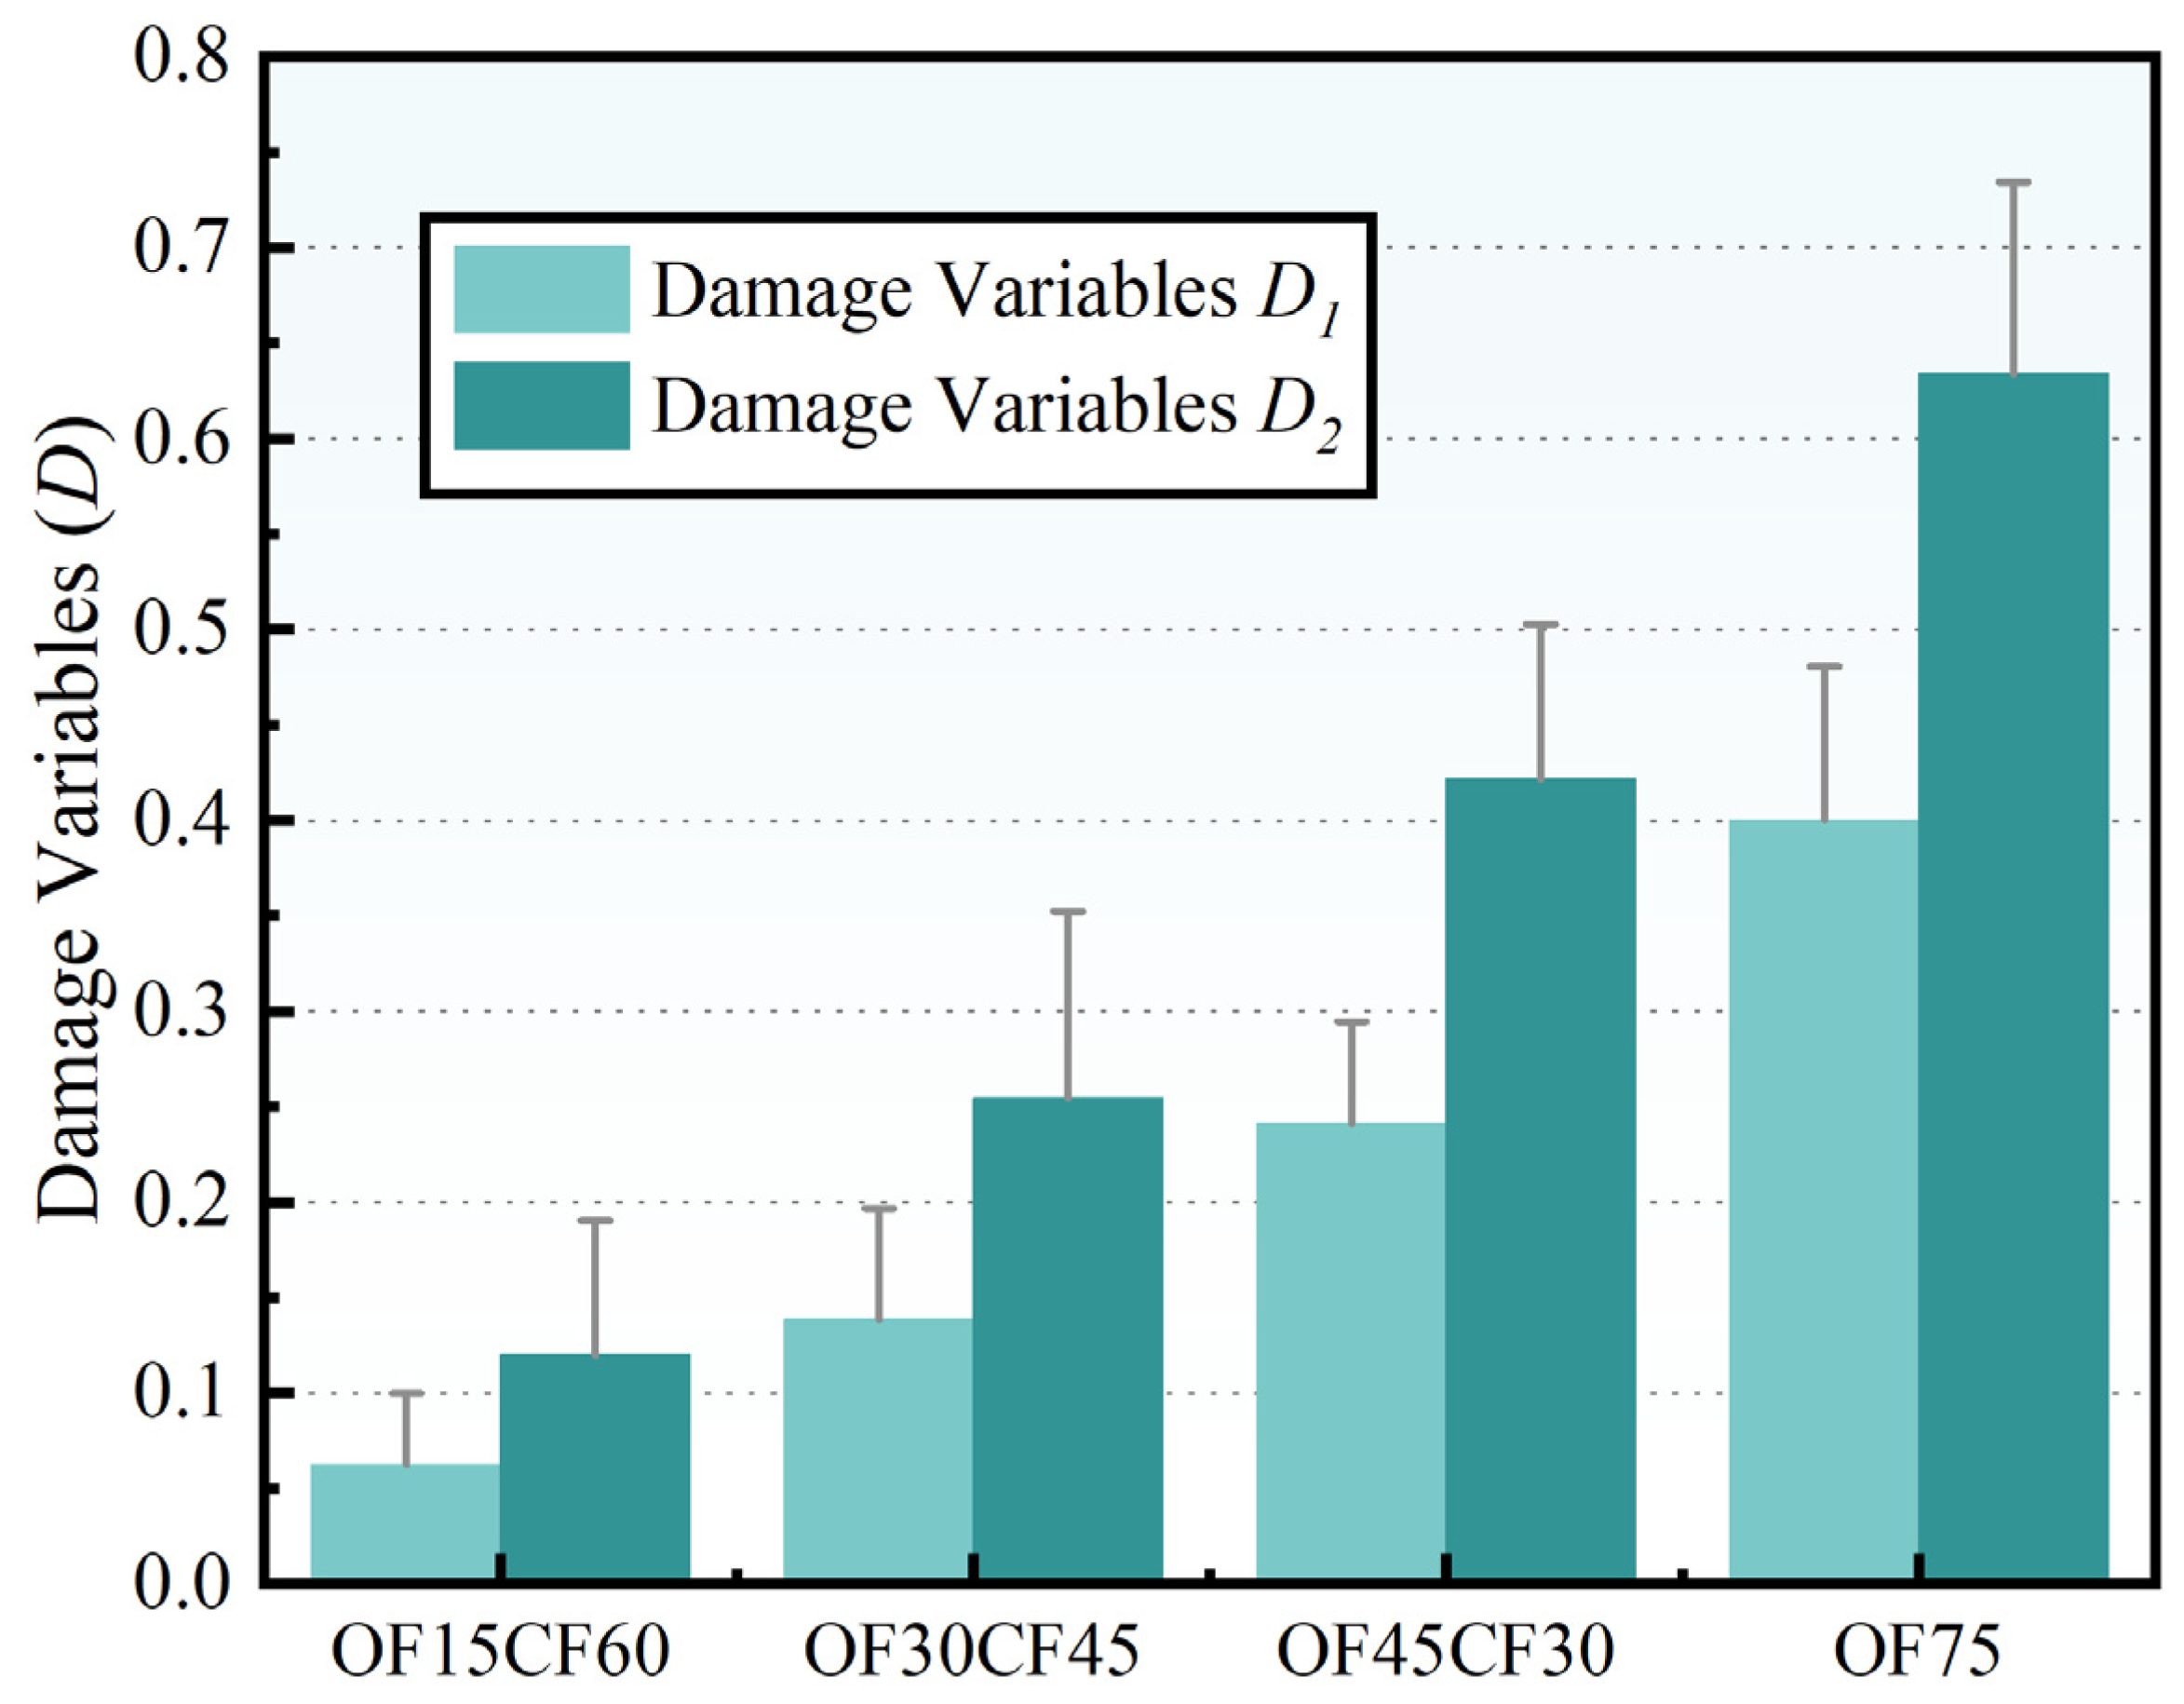
Further calculations are conducted to determine the average values for the damage variables D1 and D2, and corresponding bar charts are generated, as depicted in Figure 19. The fitting results reveal that the degradation of compressive strength and the attenuation of ultrasonic velocity both depict variations in damage accumulation among different experimental groups, and these patterns remain consistent. This implies that the experimental group OF15CF60, which restricted moisture exchange earlier compared to the later-sealed experimental groups OF30CF45 and OF45CF30, as well as the continuous open condition group OF75, achieved more effective damage control.

Figure 19.
Damage variables of OF15CF60, OF30CF45, OF45CF30, and OF75.
Upon computing and comparing the average values of damage variables D1 and D2 for each group of specimens, it was evident that group OF15CF60 exhibited superior performance in controlling freeze–thaw damage, signifying the significant efficacy of early sealing treatment. Groups OF30CF45 and OF45CF30 followed suit, while the OF75 group under continuous open conditions performed the least effectively. This further confirms the pivotal role of sealing treatment in mitigating concrete freeze–thaw damage. Furthermore, within the two damage variables D1 and D2, the values of D2 are generally smaller than D1 (Figure 18), and D2 exhibits less dispersion, indicating higher stability and consistency compared to D1 and making it a better indicator for evaluating and predicting concrete freeze–thaw damage.
The bar chart in Figure 19 illustrates the distribution of damage variables among different experimental groups. The early-sealed group OF15CF60 exhibits significantly lower average values for both D1 and D2, with smaller fluctuations, indicating lower damage accumulation during FTCs. Conversely, groups OF30CF45 and OF45CF30 display higher average values for damage variables and larger fluctuations, suggesting the reduced effectiveness of damage control with the delayed sealing treatment. The OF75 group shows the highest average values for damage variables, with the greatest dispersion, indicating the most severe damage during FTCs under continuous open conditions.
4.4. Damage Prediction Model
In this experiment, the concrete specimens underwent two stages: the first stage involved ample water supply, while the second stage involved reduced water supply. Figure 18 illustrates that the two primary indicators of concrete freeze–thaw damage, compressive strength, and ultrasonic velocity are closely related, demonstrating a strong linear correlation between fc,d/fc and (vd/v0)2 (Equation (7)). Based on this correlation, the formula for the degradation of the compressive strength of freeze-damaged concrete after the sealing treatment can be further derived, as expressed in Equation (11). The experimental results indicate that the damage accumulation process for the three groups of concrete specimens can be divided into two stages: (1) the initial 10 FTCs before the sealing treatment and immediately after the sealing treatment (0 ~ N0 + 10) and (2) the FTCs after the sealing treatment (N0 + 10 ~).
Prior to the sealing treatment, the concrete specimens continued to absorb water, with the capillary pores and gel pores reaching saturation. The formation of ice and subsequent expansion inside the specimens led to a continuous increase in pore stress, accelerating damage accumulation. However, after the sealing treatment, the water supply inside the specimens significantly decreased, and the water in the pores gradually transitioned to air, reducing the pore stress during ice formation and effectively slowing down the rate of freeze–thaw damage accumulation. Further analysis reveals that during the initial 10 FTCs after sealing treatment (0 ~ N0 + 10), the degradation rate of the compressive strength and ultrasonic velocity of the specimens significantly decreased. During this period, the internal structure of the specimens stabilized gradually, and the accumulation of damage to the compressive strength and ultrasonic velocity became more gradual. In the subsequent FTCs (N0 + 10 ~), although damage continued to accumulate, the rate of damage accumulation in the specimens subjected to early sealing treatment was significantly lower than those without sealing treatment. This indicates that specimens subjected to the early sealing treatment exhibit better damage control, further confirming the critical role of the sealing treatment in controlling concrete freeze–thaw damage.
5. Conclusions
This study investigated the influence of limited water availability on concrete frost damage using freeze–thaw experiments conducted under open and sealed moisture conditions. We conducted comprehensive tests on the physical and mechanical properties of concrete and developed a predictive model for concrete freeze–thaw deterioration using experimental data. The following conclusions can be drawn:
- (1)
- Continuous water replenishment in concrete expands existing internal cracks and initiates new ones. Although complete damage prevention is unattainable, limiting water can partially reduce the rate of damage. Water limitation measures can extend the service life of concrete structures and reduce the frequency of repairs.
- (2)
- The pore structure characteristics are influenced by the water supply. In open conditions, unrestricted water ingress increases the capillary pore volume and extends the initial water absorption stage. Conversely, in closed conditions, pore structure disruption is minimal.
- (3)
- Ultrasonic velocity and compressive strength tests confirm that limiting water absorption effectively mitigates freeze–thaw damage, thereby protecting concrete from severe frost damage.
- (4)
- A predictive model for concrete freeze–thaw deterioration, developed using regression analysis and relative dynamic modulus theory, forecasts ultrasonic pulse velocity and compressive strength during hydration based on the number of FTCs experienced under open and closed conditions.
Author Contributions
Conceptualization, W.W. and F.G.; methodology, Z.H.; software, D.Z.; validation, P.L., P.X. and W.W.; formal analysis, D.Z.; investigation, P.X.; resources, Z.H.; data curation, F.G.; writing—original draft preparation, W.W.; writing—review and editing, Z.H.; visualization, D.Z.; supervision, F.G.; project administration, P.L.; funding acquisition, F.G. All authors have read and agreed to the published version of the manuscript.
Funding
This research was funded by the Open Research Fund Program of the State Key Laboratory of Hydroscience and Engineering (Grant No. sklhse-2023-C-05), Zhejiang Provincial Natural Science Foundation of China (Grant No. LR24E080001) and National Natural Science Foundation of China (Grant No. 52378267).
Data Availability Statement
The data presented in this study are available on request from the corresponding author.
Conflicts of Interest
The authors declare no conflicts of interest.
References
- Gong, F.Y.; Sicat, E.; Ueda, T.; Zhang, D.W. Meso-scale mechanical model for mortar deformation under freeze thaw cycles. J. Adv. Concr. Technol. 2013, 11, 49–60. [Google Scholar] [CrossRef]
- Gong, F.Y.; Sicat, E.; Zhang, D.W.; Ueda, T. Stress analysis for concrete materials under multiple freeze-thaw cycles. J. Adv. Concr. Technol. 2015, 13, 124–134. [Google Scholar] [CrossRef]
- Gong, F.Y.; Wang, Y.; Zhang, D.; Ueda, T. Mesoscale simulation of deformation for mortar and concrete under cyclic freezing and thawing stress. J. Adv. Concr. Technol. 2015, 13, 291–304. [Google Scholar] [CrossRef]
- Bao, J.W.; Wei, J.; Zhang, P.; Zhuang, Z.J.; Zhao, T.J. Experimental and theoretical investigation of chloride ingress into concrete exposed to real marine environment. Cem. Concr. Compos. 2022, 130, 104511. [Google Scholar] [CrossRef]
- Li, P.F.; Wang, H.Y.; Nie, D.; Wang, D.Y.; Wang, C.Z. A method to analyze the long-term durability performance of underground reinforced concrete culvert structures under coupled mechanical and environmental loads. J. Intell. Constr. 2023, 1, 9180011. [Google Scholar] [CrossRef]
- Sun, X.J.; Wang, S.Q.; Jin, J.P.; Wang, Z.; Gong, F.Y. Computational methods of mass transport in concrete under stress and crack conditions: A review. J. Intell. Constr. 2023, 1, 9180015. [Google Scholar] [CrossRef]
- Sun, W.J.; Ma, J.Z.; Jin, J.X.; Li, S.H.; Liu, Q.; Wang, H.B. Quantitative study of the failure characteristics of sandstone with freeze–thaw damage: Insight into the cracking behavior. Rock Mech. Rock Eng. 2024, 1–20. [Google Scholar] [CrossRef]
- Gong, F.Y.; Ren, M.Q.; Maekawa, K.J.E.S. Simulation of spatially non-uniform frost damage in RC beams under various exposure and confining conditions. Eng. Struct. 2018, 176, 859–870. [Google Scholar] [CrossRef]
- Su, H.Z.; Xu, X.Y.; Zuo, S.L.; Zhang, S.; Yan, X.Q. Research progress in monitoring hydraulic concrete damage based on acoustic emission. J. Intell. Constr. 2023, 1, 9180024. [Google Scholar] [CrossRef]
- Wang, Z.; Yaseen, S.A.; Maekawa, K.; Leung, C.K.; Poon, C.S.; Li, Z.J. Performance assessment of sea-water fly ash cement paste with integrated physicochemical-geochemical simulation platform and experimental validation. J. Build. Eng. 2023, 79, 107802. [Google Scholar] [CrossRef]
- Zhang, Q.; Chen, M.H.; Gu, X.L.; Li, Y.Z.; Li, W.J.; Gong, J.X. Low-cycle fatigue properties and model for flexure-shear critical reinforced concrete columns considering cyclical damage effects. ASCE J. Struct. Eng. 2024, 150, 04024071. [Google Scholar] [CrossRef]
- Gong, F.Y.; Jacobsen, S. Modeling of water transport in highly saturated concrete with wet surface during freeze/thaw. Cem. Concr. Res. 2019, 115, 294–307. [Google Scholar] [CrossRef]
- Li, X.X.; Chen, S.H.; Xu, Q.; Xu, Y. Modeling capillary water absorption in concrete with discrete crack network. J. Mater. Civ. Eng. 2018, 30, 04017263. [Google Scholar] [CrossRef]
- Mao, J.H.; Xu, J.; Zhang, J.; Wu, K.; He, J.M.; Fan, W.J. Recycling methodology of chloride-attacked concrete based on electrochemical treatment. J. Clean. Prod. 2022, 340, 130822. [Google Scholar] [CrossRef]
- Wang, Y.; Xie, S.; Wang, Z.; Li, X.D.; Gong, F.Y.; Nagai, K.; Deng, J.; Ueda, T.; Hu, W.G. Experimental investigation on electrical response and mechanical performance of cementitious materials at low temperatures. Cem. Concr. Compos. 2023, 143, 105264. [Google Scholar] [CrossRef]
- Xia, P.; Yang, L.; Wang, S.Q.; Gong, F.Y.; Cao, W.L.; Zhao, Y.X. Improved freeze-thaw modification of recycled concrete aggregate originally from frost resistive concrete. Cem. Concr. Compos. 2023, 144, 105302. [Google Scholar] [CrossRef]
- Gong, F.Y.; Sun, X.J.; Takahashi, Y.; Maekawa, K.; Jin, W.L. Computational modeling of combined frost damage and alkali–silica reaction on the durability and fatigue life of RC bridge decks. J. Intell. Constr. 2023, 1, 9180001. [Google Scholar] [CrossRef]
- Xia, P.; Huang, Z.; Wang, S.Q.; Mao, J.H.; Liu, L.; Zhao, Y.X.; Gong, F.Y. A complete thermo-poromechanical model for freeze-thaw modification of recycled coarse aggregate considering deterioration of each component. Constr. Build. Mater. 2024, 421, 135626. [Google Scholar] [CrossRef]
- Chen, K.Y.; Wang, S.Q.; Wang, Y.; Wei, J.Y.; Wang, Q.H.; Du, W.; Jin, W.L. Intelligent design of limit states for recycled aggregate concrete filled steel tubular columns. Structures 2023, 58, 105338. [Google Scholar] [CrossRef]
- Hasan, M.; Okuyama, H.; Sato, Y.; Ueda, T. Stress-strain model of concrete damaged by freezing and thawing cycles. J. Adv. Concr. Technol. 2004, 2, 89–99. [Google Scholar] [CrossRef]
- Liu, D.; Tu, Y.; Sas, G.; Elfgren, L. Freeze-thaw damage evaluation and model creation for concrete exposed to freeze–thaw cycles at early-age. Constr. Build. Mater. 2021, 312, 125352. [Google Scholar] [CrossRef]
- Wang, S.Q.; Xia, P.; Wang, Z.; Meng, T.; Gong, F.Y. Intelligent mix design of recycled brick aggregate concrete based on swarm intelligence. J. Build. Eng. 2023, 71, 106508. [Google Scholar] [CrossRef]
- Yu, Z.X.; He, J.Y.; Wang, Y.; He, S.H.; Ueda, T. Accuracy analysis on CFRP-RC interfacial defects detected using electrical measurement: Influence of steel reinforcement. Constr. Build. Mater. 2024, 418, 134977. [Google Scholar] [CrossRef]
- Sicat, E.; Gong, F.Y.; Zhang, D.W.; Ueda, T. Change of the coefficient of thermal expansion of mortar due to damage by freeze thaw cycles. J. Adv. Concr. Technol. 2013, 11, 333–346. [Google Scholar] [CrossRef]
- Bentz, J.; Ferraris, D.P.; Wingpigler, C.F. Technical basis for CONCLIFE—Sorptivity testing and computer models building and fire research laboratory. In Service Life Prediction for Concrete Pavements and Bridge Decks Exposed to Sulfate Attack and Freeze-Thaw Deterioration; Building and Fire Research Laboratory, National Institute of Standards and Technology: Gaithersburg, MD, USA, 2001; Volume II. [Google Scholar]
- Bentz, D.P.; Ehlen, M.A.; Ferraris, C.F.; Garboczi, E.J. Sorptivity-based service life predictions for concrete pavements. In Proceedings of the 7th International Conference on Concrete Pavements, Orlando, FL, USA, 9–13 September 2001; pp. 181–193. [Google Scholar]
- Maekawa, K.; Fujiyama, C. Rate-dependent model of structural concrete incorporating kinematics of ambient water subjected to high-cycle loads. Eng. Comput. 2013, 30, 825–841. [Google Scholar] [CrossRef]
- Coussy, O.; Monteiro, P.J.M. Poroelastic model for concrete exposed to freezing temperatures. Cem. Concr. Res. 2008, 38, 40–48. [Google Scholar] [CrossRef]
- Hanjari, K.Z.; Kettil, P.; Lundgren, K. Modelling the structural behaviour of frost-damaged reinforced concrete structures. Struct. Infrastruct. Eng. 2013, 9, 416–431. [Google Scholar] [CrossRef]
- Qin, Q.; Zheng, S.S.; Li, L.; Dong, L.G.; Zhang, Y.X.; Ding, S. Experimental study and numerical simulation of seismic behavior for RC columns subjected to freeze-thaw cycles. Adv. Mater. Sci. Eng. 2017, 2017, 7496345. [Google Scholar] [CrossRef]
- Zhang, Q.; Wei, Z.Y.; Gu, X.L.; Yang, Q.C.; Li, S.Y.; Zhao, Y.S. Confinement behavior and stress-strain response of square concrete columns strengthened with carbon textile reinforced concrete (CTRC) composites. Eng. Struct. 2022, 266, 114592. [Google Scholar] [CrossRef]
- Bao, J.W.; Zheng, R.; Wei, J.; Zhang, P.; Xue, S.B.; Liu, Z.L. Numerical and experimental investigation of coupled capillary suction and chloride penetration in unsaturated concrete under cyclic drying-wetting condition. J. Build. Eng. 2022, 51, 104273. [Google Scholar] [CrossRef]
- Wang, Z.; Gong, F.Y.; Maekawa, K. Multi-scale and multi-chemo–physics lifecycle evaluation of structural concrete under environmental and mechanical impacts. J. Intell. Constr. 2023, 1, 9180003. [Google Scholar] [CrossRef]
- Mao, J.H.; Deng, R.Z.; Wang, Q.Y.; Wang, P.S.; Shi, Q.; He, J.M.; Jin, L.B. Chloride ion control of under-constructing concrete structure based on ECE with different electric field intensities. Constr. Build. Mater. 2023, 369, 130516. [Google Scholar] [CrossRef]
- Wang, S.Q.; Xia, P.; Chen, K.Y.; Gong, F.Y.; Wang, H.; Wang, Q.; Zhao, Y.; Jin, W. Prediction and optimization model of sustainable concrete properties using machine learning, deep learning and swarm intelligence: A review. J. Build. Eng. 2023, 80, 108065. [Google Scholar] [CrossRef]
- Xia, P.; Wang, S.Q.; Chen, K.Y.; Meng, T.; Chen, X.; Gong, F.Y. A recycling approach of natural stone from crushed concrete based on freeze-thaw modification and usage of spalling mortar as recycled fine aggregate. Constr. Build. Mater. 2024, 416, 135287. [Google Scholar] [CrossRef]
- Zhang, Q.; Zheng, N.H.; Gu, X.L.; Wei, Z.Y.; Zhang, Z. Study of the confinement performance and stress-strain response of RC columns with corroded stirrups. Eng. Struct. 2022, 266, 114476. [Google Scholar] [CrossRef]
- GB 175-2020; Common Portland Cement. China Standards Press: Beijing, China, 2020.
- JGJ 63-2006; Standards for Water Use in Concrete. China Architecture and Building Press: Beijing, China, 2006.
- ASTM C1585-04; Standard Test Method for Measurement of Rate of Absorption of Water by Hydraulic-Cement Concretes. ASTM International: West Conshohocken, PA, USA, 2004.
- Hall, C.; Yau, M.H.R. Water movement in porous building materials—IX. The water absorption and sorptivity of concretes. Build. Environ. 1987, 22, 77–82. [Google Scholar] [CrossRef]
- Li, W.; Pour-Ghaz, M.; Castro, J.; Weiss, J. Water absorption and critical degree of saturation relating to freeze-thaw damage in concrete pavement joints. J. Mater. Civ. Eng. 2012, 24, 299–307. [Google Scholar] [CrossRef]
- Fonseca, P.; Scherer, G. An image analysis procedure to quantify the air void system of mortar and concrete. Mater. Struct. 2015, 48, 3087–3098. [Google Scholar] [CrossRef]
- Quattrone, M.; Cazacliu, B.; Angulo, S.; Hamard, E.; Cothenet, A. Measuring the water absorption of recycled aggregates, what is the best practice for concrete production? Constr. Build. Mater. 2016, 123, 690–703. [Google Scholar] [CrossRef]
- Lao, J.C.; Huang, B.T.; Fang, Y.; Xu, L.Y.; Dai, J.G.; Shah, S.P.J.C. Research, Strain-hardening alkali-activated fly ash/slag composites with ultra-high compressive strength and ultra-high tensile ductility. Cem. Concr. Res. 2023, 165, 107075. [Google Scholar] [CrossRef]
- Duan, Z.H.; Li, B.; Xiao, J.Z.; Guo, W. Optimizing mix proportion of recycled aggregate concrete by readjusting the aggregate gradation. Struct. Concr. 2021, 22, E22–E32. [Google Scholar] [CrossRef]
- JGJ 55-2011; Specification for Mix Proportion Design of Ordinary Concrete. Ministry of Housing and Urban-Rural Development of the People’s Republic of China: Beijing, China, 2011.
- JGJ 52-2006; Standard for Technical Requirements and Test Method of Sand and Crushed Stone (or Gravel) for Ordinary Concrete. Ministry of Construction of the People’s Republic of China: Beijing, China, 2006.
- Smith, S.H.; Qiao, C.; Suraneni, P.; Kurtis, K.E.; Weiss, W.J. Service-life of concrete in freeze-thaw environments: Critical degree of saturation and calcium oxychloride formation. Cem. Concr. Res. 2019, 122, 93–106. [Google Scholar] [CrossRef]
- Wu, Z.; Wong, H.S.; Chen, C.; Buenfeld, N.R. Anomalous water absorption in cement-based materials caused by drying shrinkage induced microcracks. Cem. Concr. Res. 2019, 115, 90–104. [Google Scholar] [CrossRef]
- Chen, Y.L.; Tong, J.Z.; Li, Q.H.; Xu, S.L.; Gao, W.; Liu, X. Flexural behavior of novel profiled steel-UHTCC assembled composite bridge decks. J. Constr. Steel Res. 2024, 212, 108258. [Google Scholar] [CrossRef]
- Dong, H.; Gao, P.; Ye, G. Characterization and comparison of capillary pore structures of digital cement pastes. Mater. Struct. 2017, 50, 154. [Google Scholar] [CrossRef]
- Wang, S.Q.; Xia, P.; Gong, F.Y.; Zeng, Q.; Chen, K.Y.; Zhao, Y.X. Multi objective optimization of recycled aggregate concrete based on explainable machine learning. J. Clean. Prod. 2024, 445, 141045. [Google Scholar] [CrossRef]
- Fan, Q.X.; Jiang, X.C.; Wang, K.X.; Huang, C.X.; Li, G.; Wei, P.C. Cement grouting online monitoring and intelligent control for dam foundations. J. Intell. Constr. 2023, 1, 9180005. [Google Scholar] [CrossRef]
- Fakhri, M.; Siyadati, S.; Aliha, M. Impact of freeze–thaw cycles on low temperature mixed mode I/II cracking properties of water saturated hot mix asphalt: An experimental study. Constr. Build. Mater. 2020, 261, 119939. [Google Scholar] [CrossRef]
- Lao, J.C.; Ma, R.Y.; Xu, L.Y.; Li, Y.; Shen, Y.N.; Yao, J.; Wang, Y.S.; Xie, T.; Huang, B. Fly ash-dominated high-strength engineered/strain-hardening geopolymer composites (HS-EGC/SHGC): Influence of alkalinity and environmental assessment. J. Clean. Prod. 2024, 447, 141182. [Google Scholar] [CrossRef]
- Zhang, Q.; Cheng, G.; Zhao, H.T.; Li, W.J.; Zhu, H.Y.; Zhang, H.; Gu, X.L. Bond properties between polyvinyl chloride (PVC) tubes and wrapped textile reinforced fine concrete (TRC) shells. Constr. Build. Mater. 2024, 431, 136594. [Google Scholar] [CrossRef]
- Saladi, N.; Montanari, L.; Varga, I.; Spragg, R.; Graybeal, B. Assessing durability properties of ultra-high performance concrete-class materials. Mater. Struct. 2023, 56, 155. [Google Scholar] [CrossRef]
- Yu, C.Q.; Tong, G.S.; Tong, J.Z.; Zhang, J.W.; Li, X.G.; Xu, S.L. Experimental and numerical study on seismic performance of L-shaped multi-cellular CFST frames. J. Constr. Steel Res. 2024, 213, 108360. [Google Scholar] [CrossRef]
- Lu, J.; Liu, J.; Yang, H.; Wan, X.; Gao, J.; Zhang, J.; Li, P. Experimental investigation on the mechanical properties and pore structure deterioration of fiber-reinforced concrete in different freeze-thaw media. Constr. Build. Mater. 2022, 350, 128887. [Google Scholar] [CrossRef]
- Zhi, D.; Xia, P.; Wang, S.Q.; Gong, F.Y.; Cao, W.L.; Wang, D.M.; Ueda, T. RBSM-based mesoscale study of mechanical properties and frost damage behaviors for recycled fine aggregate concrete. Constr. Build. Mater. 2024, 416, 135136. [Google Scholar] [CrossRef]
- Zhang, Q.; Yang, Q.C.; Gu, X.L.; Jiang, Y. Study on axial compression properties of concrete columns wrapped with basalt textile-reinforced fine concrete (BTRC) jackets. Constr. Build. Mater. 2023, 363, 129809. [Google Scholar] [CrossRef]
- ASTM C597-09; Standard Test Method for Pulse Velocity through Concrete. ASTM International: West Conshohocken, PA, USA, 2009.
- Wang, R.J.; Zhang, Q.J.; Li, Y. Deterioration of concrete under the coupling effects of freeze–thaw cycles and other actions: A review. Constr. Build. Mater. 2022, 319, 126045. [Google Scholar] [CrossRef]
- Bao, J.W.; Wang, Y.W.; Zhang, H.R.; Li, S.G.; Zhang, P.; Qin, L.; Song, Q. Effect of loading-induced damage on chloride ingress behavior of recycled aggregate concrete: A comprehensive review. Cem. Concr. Compos. 2023, 141, 105123. [Google Scholar] [CrossRef]
- Zhao, Y.; Lian, S.L.; Bi, J.; Wang, C.L. Study on freezing-thawing damage mechanism and evolution model of concrete. Theor. Appl. Fract. Mech. 2022, 121, 103439. [Google Scholar] [CrossRef]
- Wang, Z.; Gong, F.Y.; Zhang, D.W.; Wang, Y.; Ueda, T. RBSM based analysis on mechanical degradation of non-air entrained concrete under frost action—A general prediction with various water cement ratio, lowest temperatures and FTC numbers. Constr. Build. Mater. 2019, 211, 744–755. [Google Scholar] [CrossRef]
- Zhao, H.D.; Yang, F.; Qian, X.; Tian, Y.; Yang, H.; Li, M.X.; Fang, Y.; Wang, J.L.; Ling, J.M. A bio-inspired mineral precipitation method to improve the freeze-thaw resistance of cement concrete pavement. J. Clean. Prod. 2023, 419, 138277. [Google Scholar] [CrossRef]

Disclaimer/Publisher’s Note: The statements, opinions and data contained in all publications are solely those of the individual author(s) and contributor(s) and not of MDPI and/or the editor(s). MDPI and/or the editor(s) disclaim responsibility for any injury to people or property resulting from any ideas, methods, instructions or products referred to in the content. |
© 2024 by the authors. Licensee MDPI, Basel, Switzerland. This article is an open access article distributed under the terms and conditions of the Creative Commons Attribution (CC BY) license (https://creativecommons.org/licenses/by/4.0/).