Abstract
Hard rock tunnel boring machines (TBMs) are increasingly widely used in tunnel construction today; however, TBMs are deeply buried underground and have a low perception of the underground surrounding rock conditions and excavation parameters. In order to ensure the safety of TBM digging, this paper describes the research carried out relating to the accurate prediction of TBM digging parameters and the precise prediction of tunnel surrounding rock grades. Based on the on-site excavation parameters and geological data of a certain water diversion project in Xinjiang, the thrust, torque, rotational speed, net excavation speed, construction speed, and excavation specific energy of the stable section of TBM excavation are selected as the input parameters for the model. A convolutional neural network optimized–long short-term time series prediction model (CNN-LSTM model) is established to predict the excavation parameters under various levels of surrounding rock conditions. The research results indicate that the CNN-LSTM model has a high prediction accuracy, with most data having a relative prediction error rate (Er) within 10%, root mean square error (RMSE) within 5%, mean absolute percentage error (MAPE) within 10%, and goodness of fit (R2) above 0.9. The model can assist in parameter setting, engineering planning and disposal of high-risk holes in the TBM digging process, and improve the safety level of TBM digging.
1. Introduction
Tunnel hard rock tunneling machines (TBMs) are increasingly widely used in the construction of ultra long tunnels [1]. Compared with traditional drilling and blasting methods, TBMs have the advantages of low safety risk, fast construction speed, small environmental disturbance, good construction conditions, and high engineering quality [2]. However, TBMs have weak adaptability to different geological conditions during the excavation process of deep buried tunnels, which puts higher operational requirements on the TBM drivers [3]. The drivers need to adjust the mechanical parameters based on personal experience, which often leads to the problem of mismatch between driving operations and geological conditions, affecting TBM excavation efficiency, and even damaging the cutterhead and causing safety accidents such as tunnel rock collapse [4]. Therefore, the accurate prediction of TBM excavation parameters and the accurate prediction of tunnel surrounding rock grade are of great significance for improving TBM excavation efficiency and safety levels, and also for laying the foundation for achieving intelligent TBM excavation [5].
In practical engineering, the most common method for adjusting TBM excavation parameters is for the main operator to manually adjust the advance speed based on real-time conditions such as torque, thrust, cutterhead vibration, and mucking efficiency, according to their experience. This approach allows for timely decision-making based on site conditions but relies heavily on operator experience and results in inefficiencies in human resource utilization. The research of many scholars and practical engineering experiences have led to the development of numerous empirical formulas and numerical models for determining and predicting TBM excavation parameters. These methods offer strong intuitiveness and interpretability, and they have low computational costs. However, their applicability is limited, and they generally lack precision and flexibility [6,7,8].
In the field of TBM excavation parameter prediction, many scholars have introduced machine learning and deep learning algorithms into their research, achieving good results. Gao et al. used several backpropagation neural network models (RNNs) to predict the TBM excavation parameters, and compared the predictive performance of this model with LSTM, SVR, RF, and other models. Through comparison, it was found that RNN models have the best predictive performance under comprehensive conditions [9]. Liu et al. established a BP neural network model to predict the real-time parameters of TBM excavation [10]. At the same time, the grey wolf optimization algorithm (GWO) and the genetic algorithm (GA) were introduced into the optimization process of the model to improve the prediction accuracy of the BP model. Hou et al. introduced a long short-term time series prediction (LSTM) model to accurately predict the excavation parameters of the TBM in the stable section, and introduced the model to TBM tunnel collapse prediction, providing new ideas for TBM to avoid collapse areas [11]. To improve the prediction accuracy of TBM excavation parameters, Zhang et al. introduced particle swarm optimization (PSO) into the bidirectional long short-term time series prediction model (Bi LSTM), and compared with the traditional LSTM model, its prediction accuracy improved by more than 10% [12]. In the Jilin Pine Diversion Project, Zhang et al. introduced the least squares–support vector machine (LS-SVM) algorithm into the prediction of TBM excavation parameters, which has a good prediction effect on the stable section parameters of the TBM excavation process [13]. Qiu et al. established an LSTM model to predict six parameters such as TBM excavation thrust and torque, and found that the lower the grade of the surrounding rock, the lower the prediction accuracy of the LSTM model [14]. Man et al. established a CNN-LSTM model for TBM excavation parameters, which has the best prediction effect on torque in TBM excavation parameter prediction [15]. In the field of rock mass grade prediction, Ma et al. [16] established a KNN prediction model combined with a CNN rock mass occurrence state recognition algorithm, and the accuracy of predicting the rock mass grade of tunnel face reached 90%. Hou [17] collected big data on TBM excavation of diversion engineering and established an integrated learning model for rock mass classification recognition. The success rate of the model’s prediction reached over 90%, which is higher in accuracy compared to traditional machine learning models and more efficient in model operation. Latif et al. [18] proposed a digital twin-driven framework for TBM performance prediction through machine learning, visualization, and monitoring. This novel approach combines machine learning and real-time performance data to predict, visualize, and monitor tunnel construction progress. Afradi et al. [19] used artificial neural networks (ANNs) and support vector machines (SVMs) to predict the penetration rate and the number of disc cutters consumed by the tunnel boring machine (TBM) based on a case study of a water transfer tunnel project in Beshtabad, Iran. Latif et al. proposed a digital twin-driven framework for TBM performance prediction, visualization, and monitoring through machine learning [20]. The existing research mainly focuses on the prediction of a single parameter or single model, and there is less prediction research into the fusion model. Therefore, establishing a fusion prediction model based on the actual TBM digging parameters to establish rock machine parameters, so as to gather the advantages of each model and improve the prediction accuracy, will be the focus of the next research.
The long short-term series-adaptive boost prediction model (LSTM-AdaBoost) has the best effect on the long-time fluctuation sequence data; meanwhile, the deep learning algorithm optimizes the LSTM model to further improve the prediction accuracy of the TBM digging parameters and the enclosing rock grade. Based on this, this paper adopts the TBM boring field data and geological data of a water diversion project in Xinjiang, and establishes a new convolutional neural network (CNN) optimized long and short-term series-adaptive lifting fusion prediction (CNN-LSTM-AdaBoost) model, so as to identify and predict the relevant parameters of the TBM as well as the enclosing rock grades of the tunnels, and evaluates and analyzes the prediction results of the fused model.
2. CNN-LSTM Parameter Prediction Model
TBM excavation data are data that continuously change over a period of time and can be used as input parameters for machine learning models. The TBM excavation parameter data are recorded and exported from the TBM control room, and the exported data are applied as a data sample to the machine learning model. In the field of machine learning, long short-term temporal models (LSTMs) have good predictive performance on continuously changing data. Compared to nonlinear prediction models such as support vector machine (SVM) and random forest (RF), LSTM models have higher accuracy in predicting linear changes in TBM excavation parameters [21]. The excavation parameter prediction model developed based on the LSTM model has a better processing effect on long sequence data. Compared with existing methods for predicting TBM excavation parameters classification, the proposed CNN-LSTM-AdaBoost model demonstrates improvements in both prediction accuracy and efficiency.
2.1. CNN Optimization Algorithm
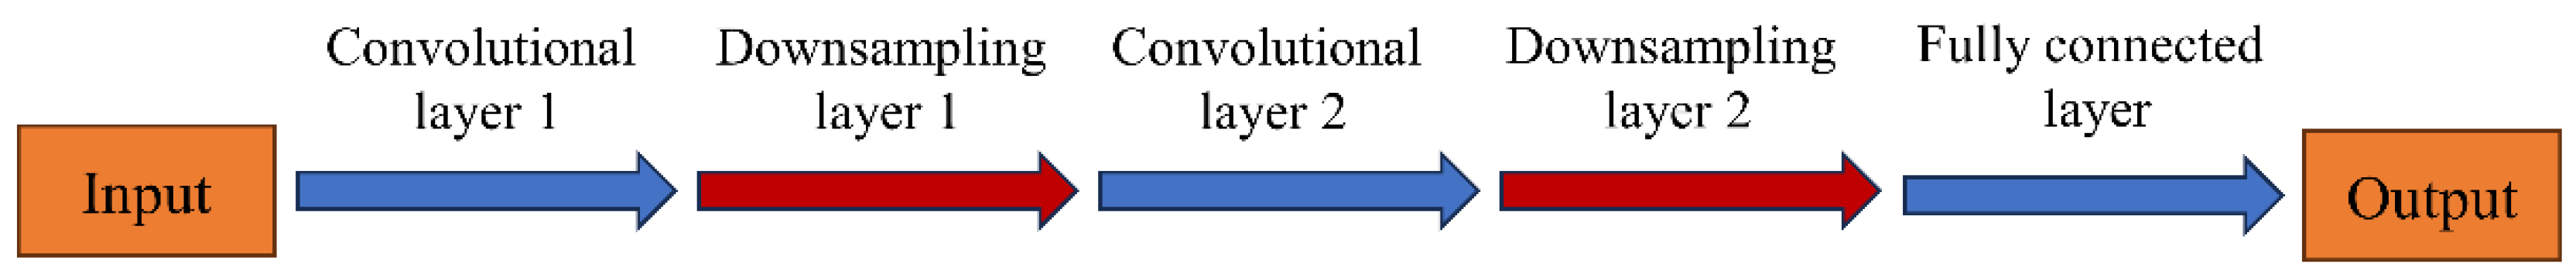
A general CNN model consists of the following three parts: convolutional layer, pooling layer, and fully connected layer. The data enter the convolutional layer to calculate feature values and extract feature variables. The pooling layer filters some feature values to achieve a reduction in data dimensionality, while the fully connected layer achieves a data classification function. The connection functions of the fully connected layer are generally the ReLU activation function, sigmoid activation function, and tanh activation function. In this study, the TBM had a large number of input parameters and a long excavation time, and the ReLU activation function was used. The CNN algorithm model, as a feedforward deep learning model, can extract the feature variables of the input parameters to achieve multi-classification of data. Therefore, it is widely used in processing temporal data and image classification and recognition. TBM excavation data, as temporal data, are suitable for one-dimensional CNN models. CNN optimization algorithms are applied to LSTM temporal prediction models for TBM excavation parameters and geological environment parameters. The CNN model structure is shown in Figure 1. The input layer receives the raw data and the convolution layer takes the data and convolution kernel and performs a convolution operation. Complex features are learnt by applying activation functions to introduce nonlinearity. Higher level features are obtained by stacking multiple layers. Finally, the fully connected layer transforms the extracted feature mapping into the final output of the network.

Figure 1.
CNN model structure.
2.2. Principles of LSTM Networks
Traditional RNN models, when dealing with long sequence data, often suffer from gradient explosion issues, leading to unstable training and the inability to effectively learn the long-term dependencies. Utilizing techniques like “Backpropagation Through Time” (BPTT) or “Real-Time Recurrent Learning” (RTRL) can result in weight oscillations and excessively long learning times [22]. To overcome the drawback of gradient explosion in traditional RNN networks processing long sequence data and improve the performance of RNN networks, scholars have introduced gate units into the hidden layer nodes of RNN networks, resulting in the LSTM network model [23].
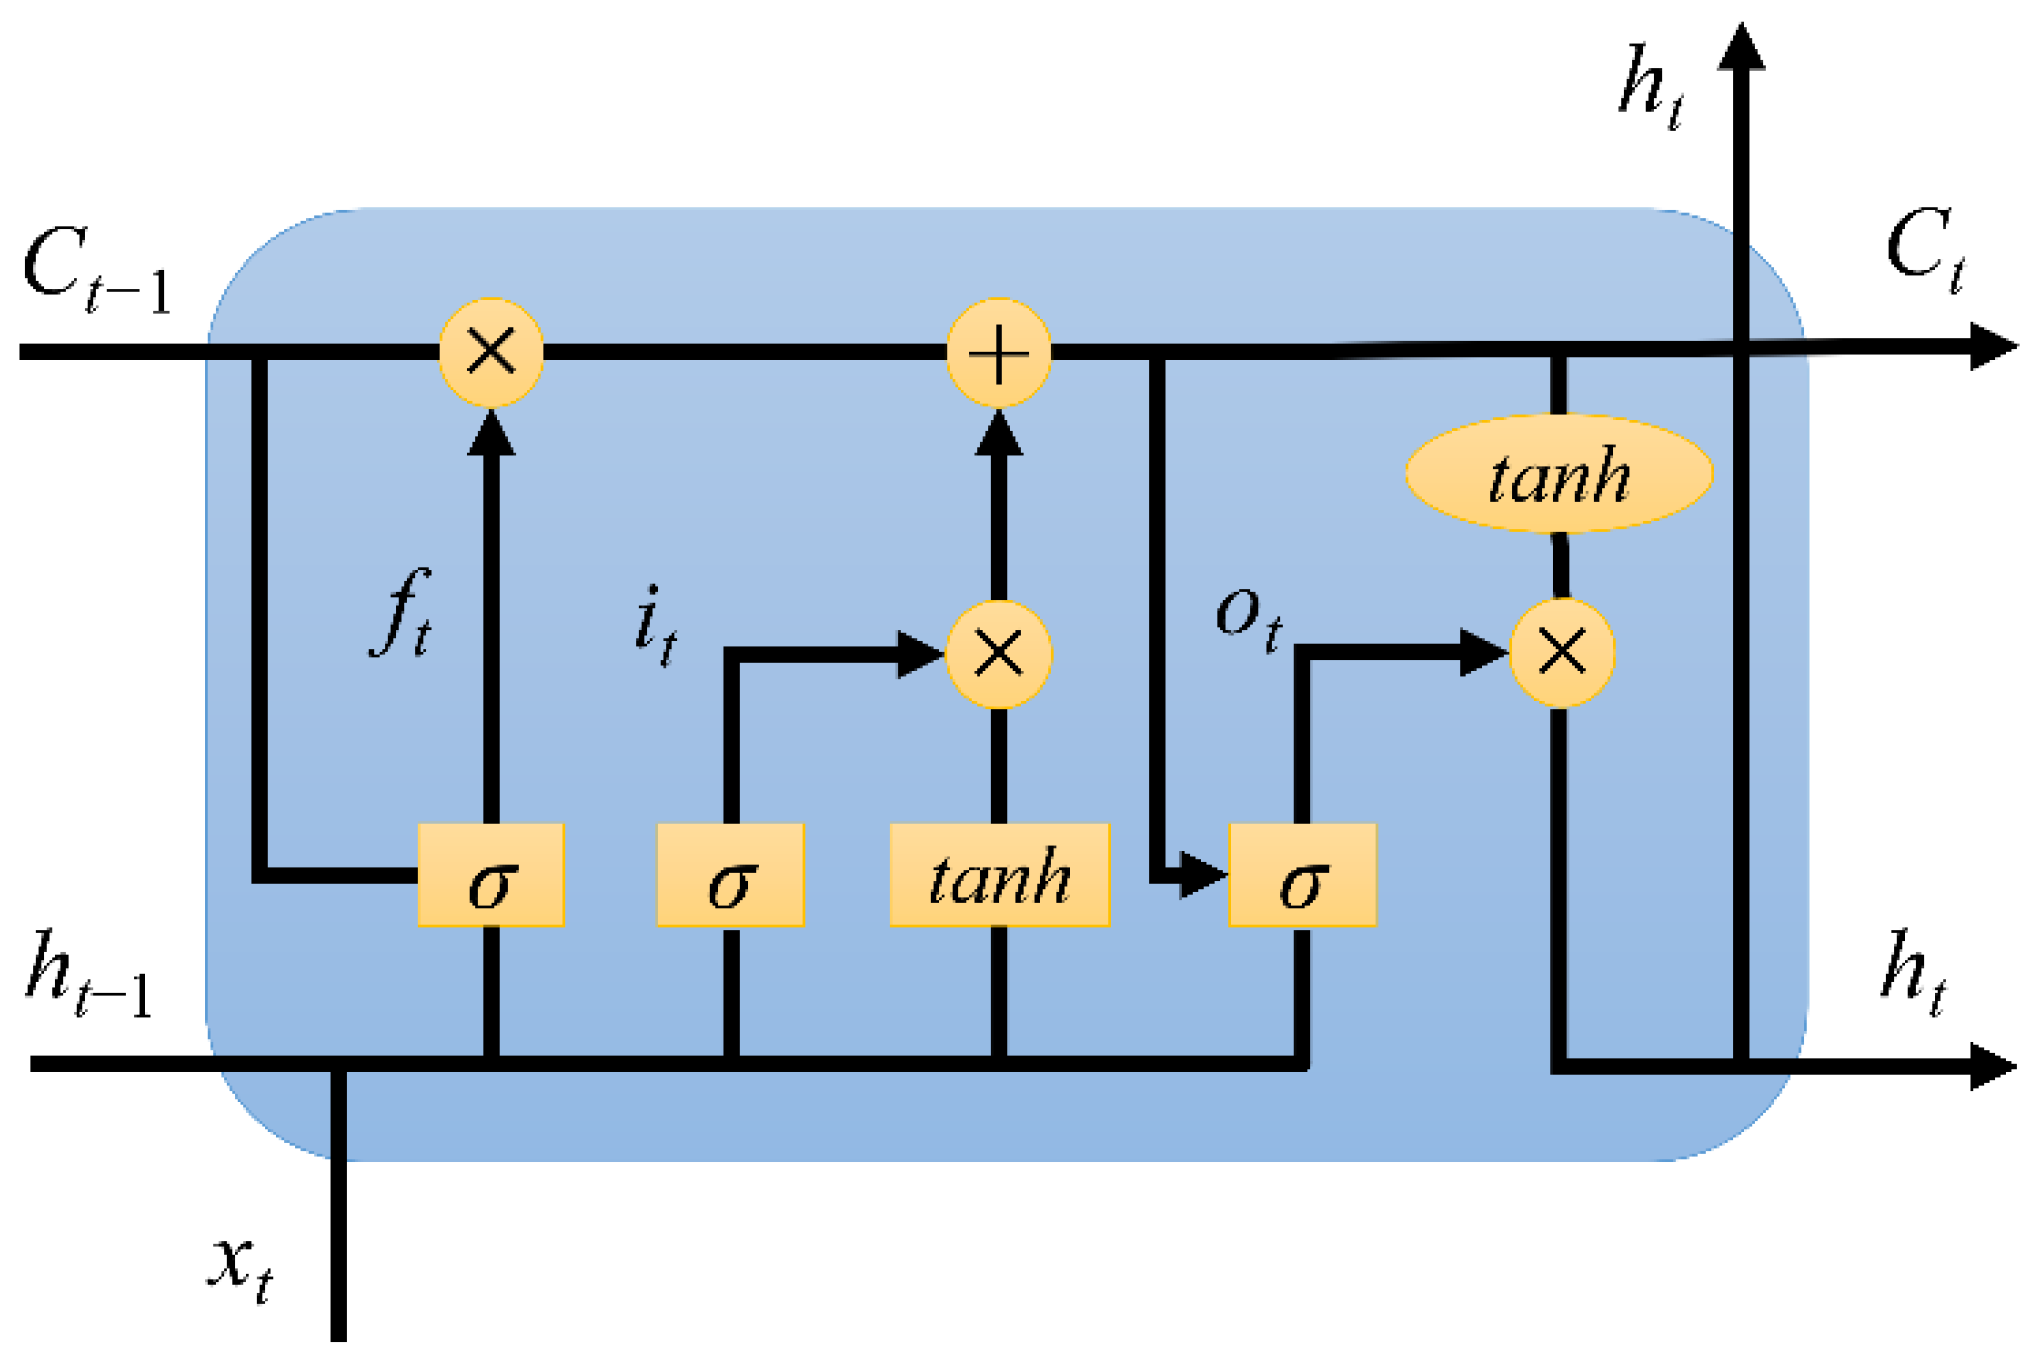
The LSTM model is mainly composed of three gating units, the input gate, forget gate, and output gate. The gating unit controls the flow of the hidden interlayer variable data. The hidden layer structure of the LSTM is shown in Figure 2, where ht is the output parameter of the LSTM model at time t and z is the input parameter of the LSTM model [16].
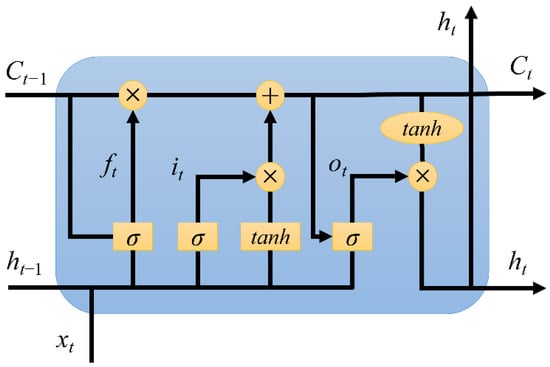
Figure 2.
LSTM model structural unit.
The forward variable processing process of the model is as follows:
In the formula, subscripts i, f, and o represent the input gates, forget gates, and output gates, respectively, and c represents the data cell elements; W is the variable coefficient matrix; σ represents the sigmoid function; t represents the current LSTM block; and t − 1 represents the previous LSTM block.
2.3. CNN-LSTM Excavation Parameter Prediction Model
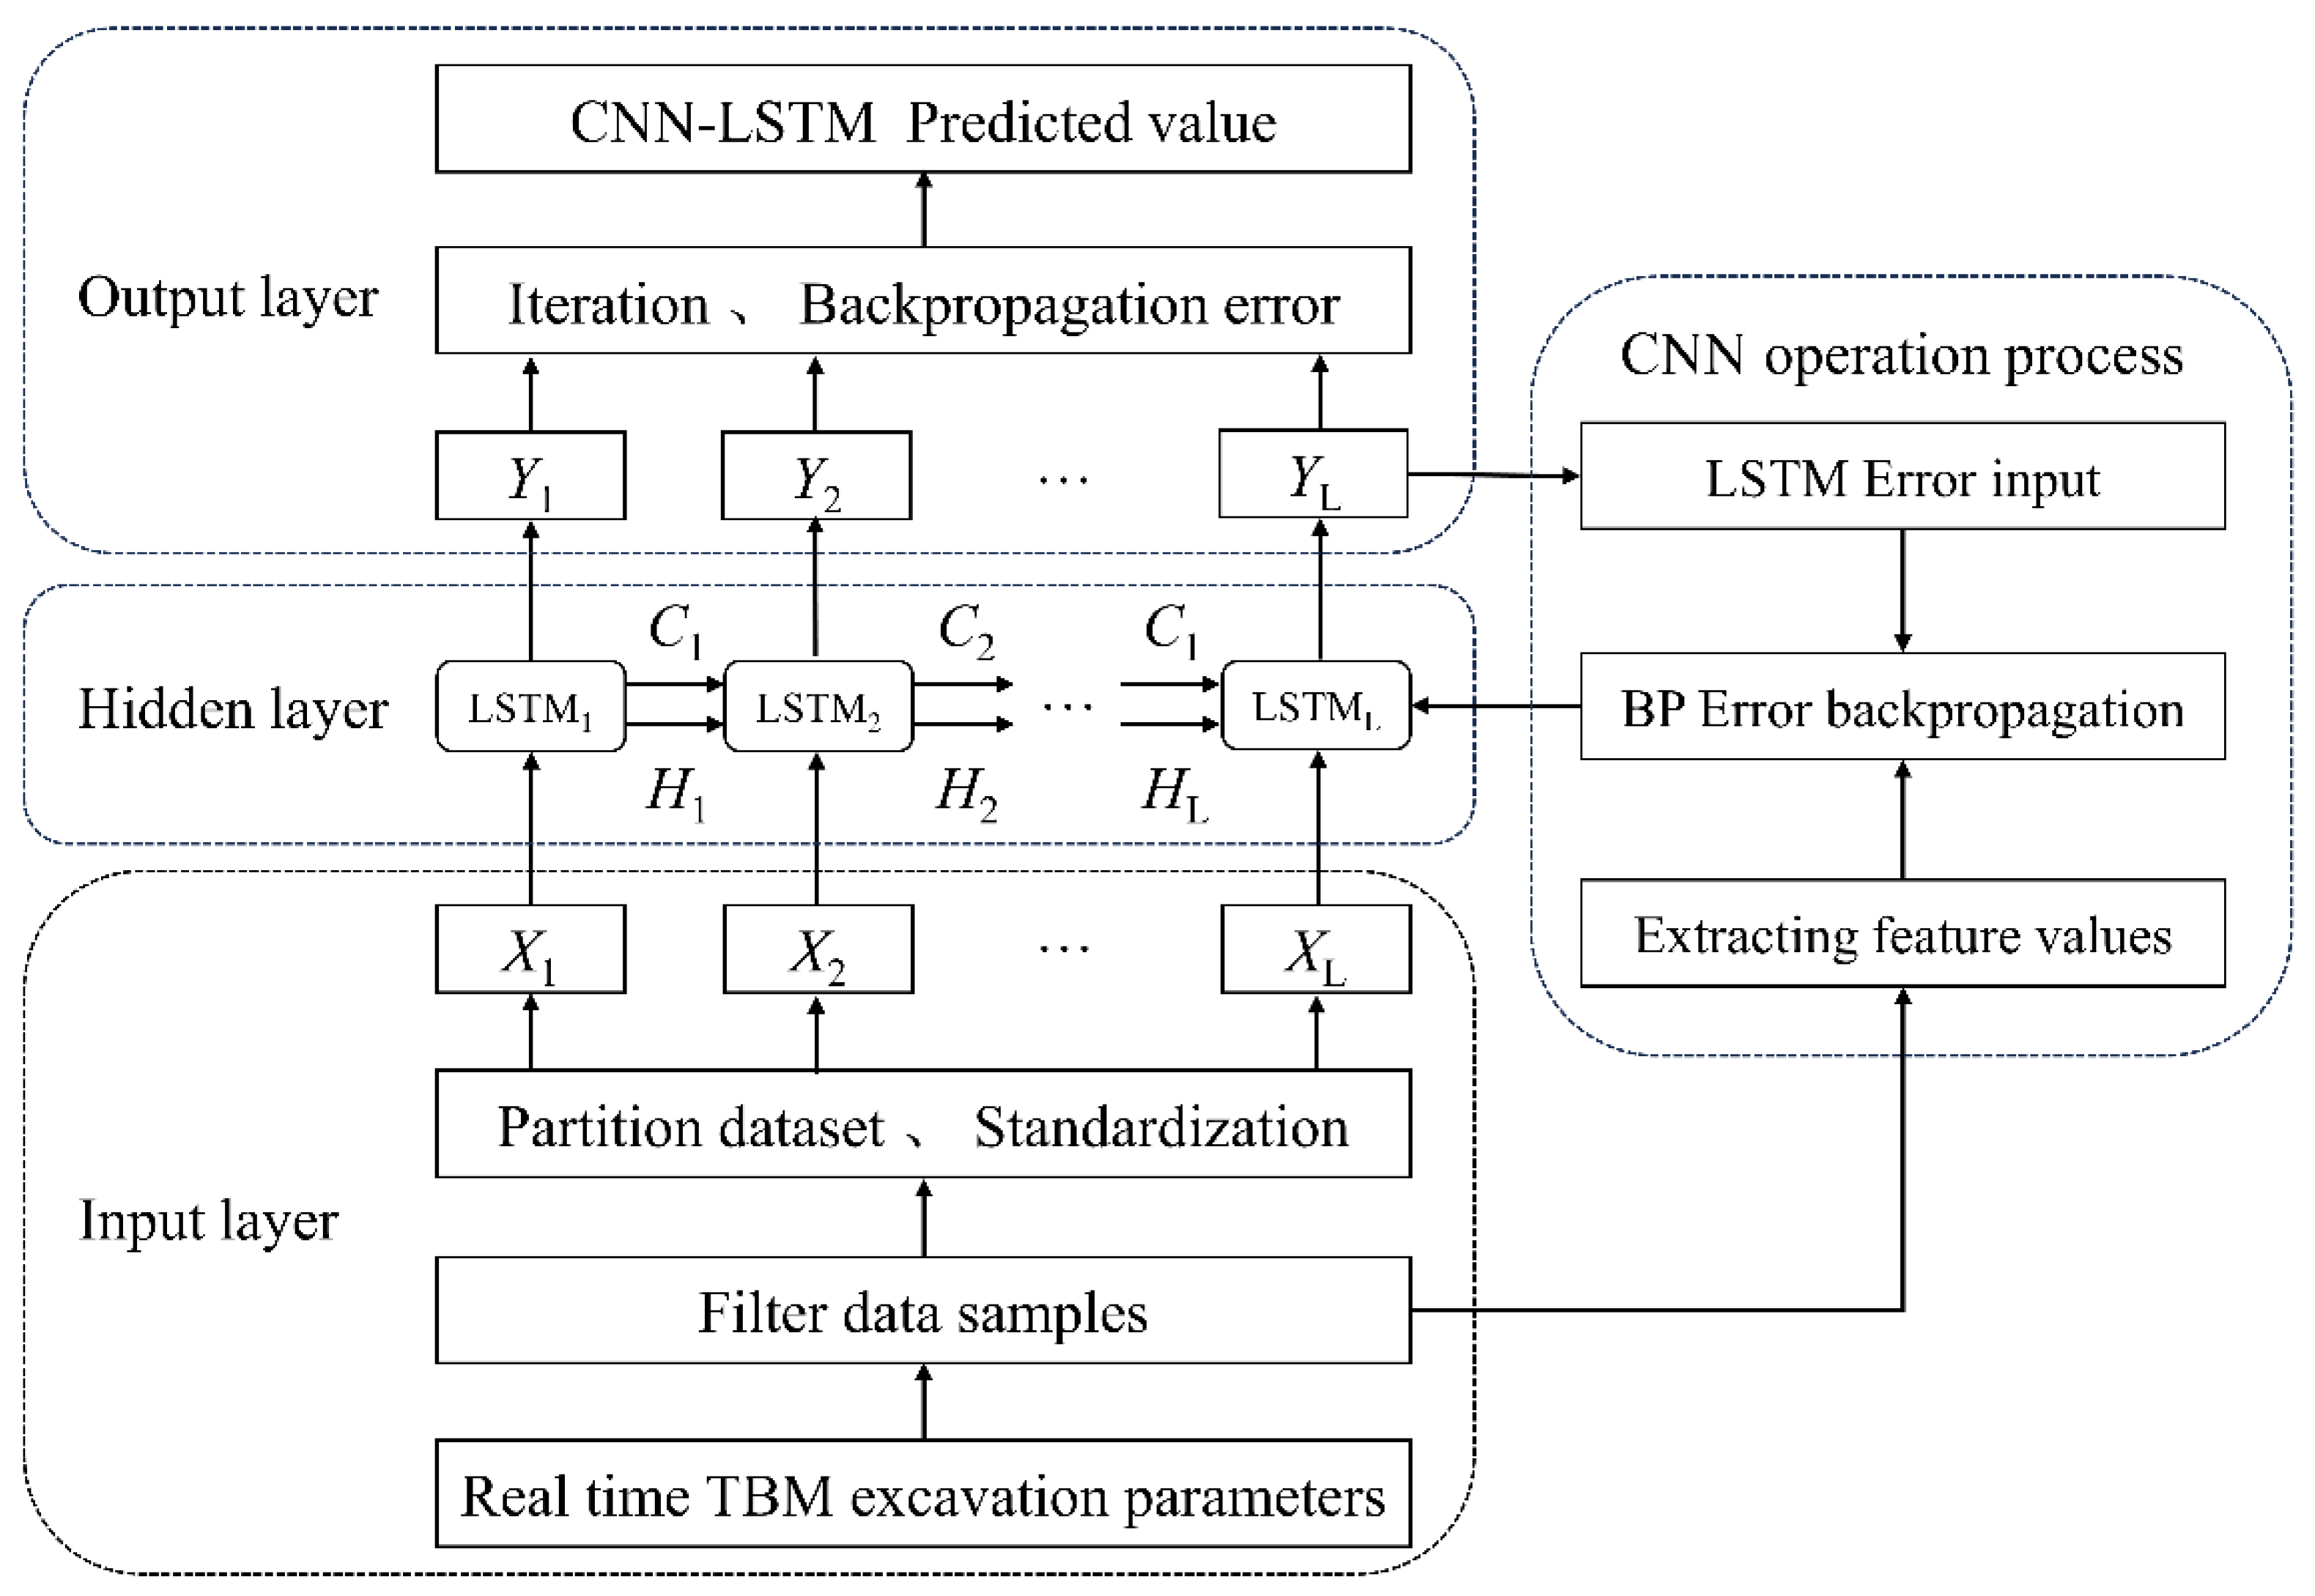
Using the convolutional neural network algorithm to process the geological information, such as rock mass grade in TBM excavation parameters to improve the prediction accuracy of long short-term time series prediction models, a CNN-LSTM prediction model for excavation parameter prediction is obtained. Inputting the TBM excavation parameter time series data as the model training data, the CNN algorithm extracts the input data feature values, which enter the LSTM model gating unit for feature fusion calculation, and reverse feedback error to reduce the dimensionality of the data feature values. The fused feature data enter the model classifier to achieve the prediction effect. The running process of the CNN-LSTM model is shown in Figure 3. The CNN-LSTM model overcomes the limitations of LSTM’s poor spatial processing capability and CNN’s insensitivity to temporal sequences. It possesses a strong generalization ability and the comprehensive capability to handle both spatial and temporal features.
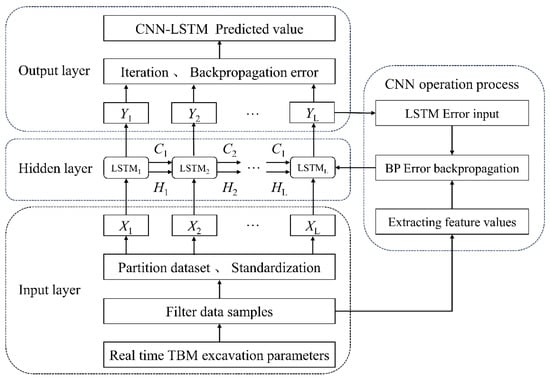
Figure 3.
TBM excavation parameter prediction model based on CNN-LSTM model.
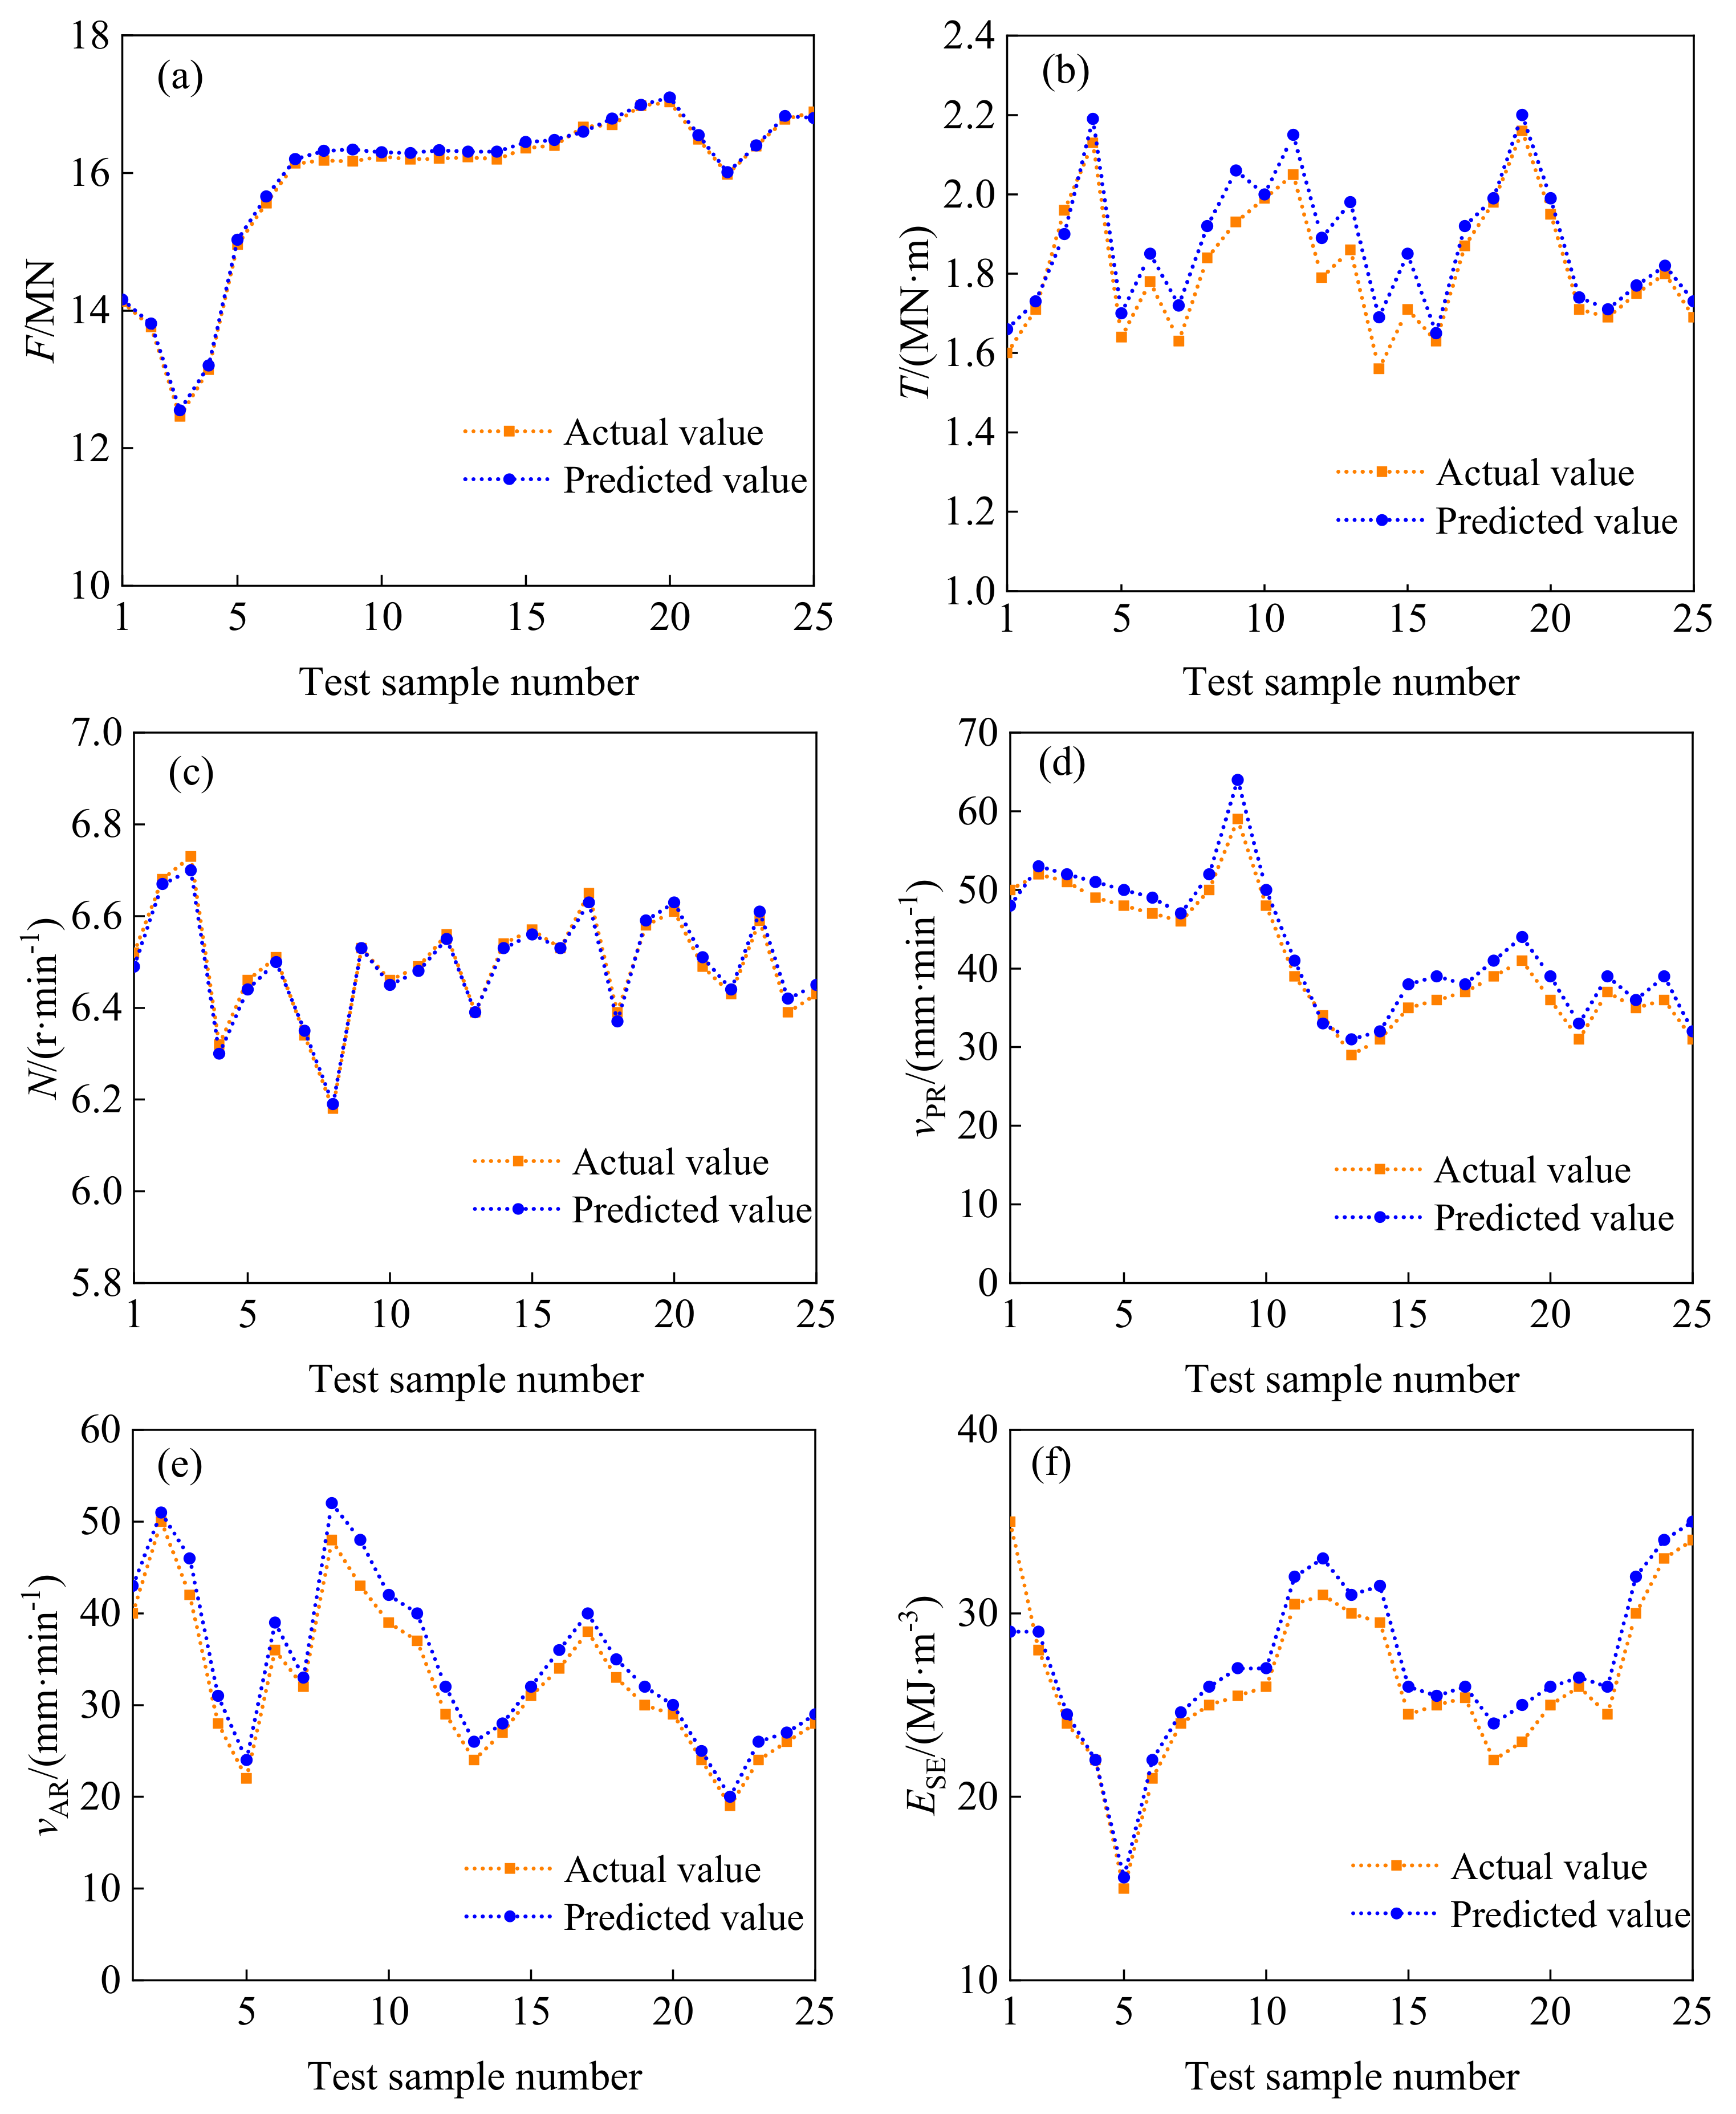
The important parameters in the TBM excavation process mainly include two aspects. First, the control parameters of the cutterhead during the TBM excavation process, including cutterhead thrust F, cutterhead torque T, and cutterhead speed N and second, the geological data of the tunnel surrounding rock mass, including the rock grade and TBM excavation specific energy ESE. The parameters that reflect the TBM excavation process mainly include the construction speed vAR and net excavation speed vPR. The prediction research of these six parameters is of great significance for tunnel construction progress prediction, schedule planning, and safety plan formulation. Therefore, in this study, F, T, N, vPR, vAR, and ESE were selected as the input and output parameters of the machine learning model to compare the predictive performance of the model under various rock mass levels.
2.4. Model Evaluation Indicators
Establish a CNN-LSTM model to evaluate the relative error rate (Er), root mean square error (RMSE), mean absolute percentage error (MAPE), and goodness of fit (R2) for predicting excavation parameters, the calculation method is as follows:
In the formula, n is the number of samples, yi is the measured value of the samples, f (xi) is the predicted value of the samples, and is the average value of the samples.
3. Prediction of TBM Excavation Parameters
3.1. Engineering Background
The data for this practice originate from the TBM tunnel construction project of a water diversion project in Xinjiang. The tunnel has a large burial depth and a long crossing distance, and the burial depth of the tunnel is generally between 300 and 500 m. The entire construction section of the data sample is 43.861 km, and the excavation surface diameter is 8 m. The TBM construction section crosses the Huali granite or granite gneiss strata, and some tunnel sections have high pressure characteristics.
According to the preliminary survey data of the construction tunnel section and the specifications for hydropower survey and design, it is usually necessary to consider factors such as the integrity and uniformity of the rock mass, the mechanical properties of the rock, groundwater conditions, and in situ stress conditions. The tunnel surrounding rock grade is generally divided into the following four levels of Grade II, Grade III, Grade IV, and Grade V. Among the four types of surrounding rocks, the proportion of Grade III and Grade IV surrounding rocks is relatively large, and the construction section of Grade V surrounding rocks is relatively short. The research data were collected from the underground tunnel section where TBM No. 17 is located. One set of data represents the average value of the stable section of the TBM excavation cycle. A total of 1150 sets of excavation parameters for four levels of surrounding rock were collected, including 250 sets, 550 sets, 200 sets, and 150 sets of data for the level II, III, IV, and V surrounding rock. Due to the significant impact of extreme temperatures on TBM operation and efficiency, specifically when temperatures exceed 50 °C or drop below −10 °C, the TBM operations generally ensure normal temperature conditions. For instance, high temperatures can lead to increased cutter wear, while low temperatures may cause material brittleness. Therefore, accurately predicting tunnel surrounding rock grade and excavation parameters at normal temperatures, typically between 25 °C and 35 °C, is crucial for improving TBM excavation efficiency.
3.2. Prediction Results of Excavation Parameters
Establish a CNN-LSTM excavation parameter prediction model by using 90% of the TBM excavation data under four levels of surrounding rock, namely levels II, III, IV, and V, as the model training dataset and 10% as the model testing dataset. The maximum number of iterations for LSTM structural units is 1000, with an initial learning rate of 0.005. The CNN structure is a single-layer convolution. After 20 repetitions, the damage function decreased to 0.1. Using roulette wheel selection as the validation technique, the validation frequency is once every 40 iterations, and the gate control unit adopts ten-fold cross validation.
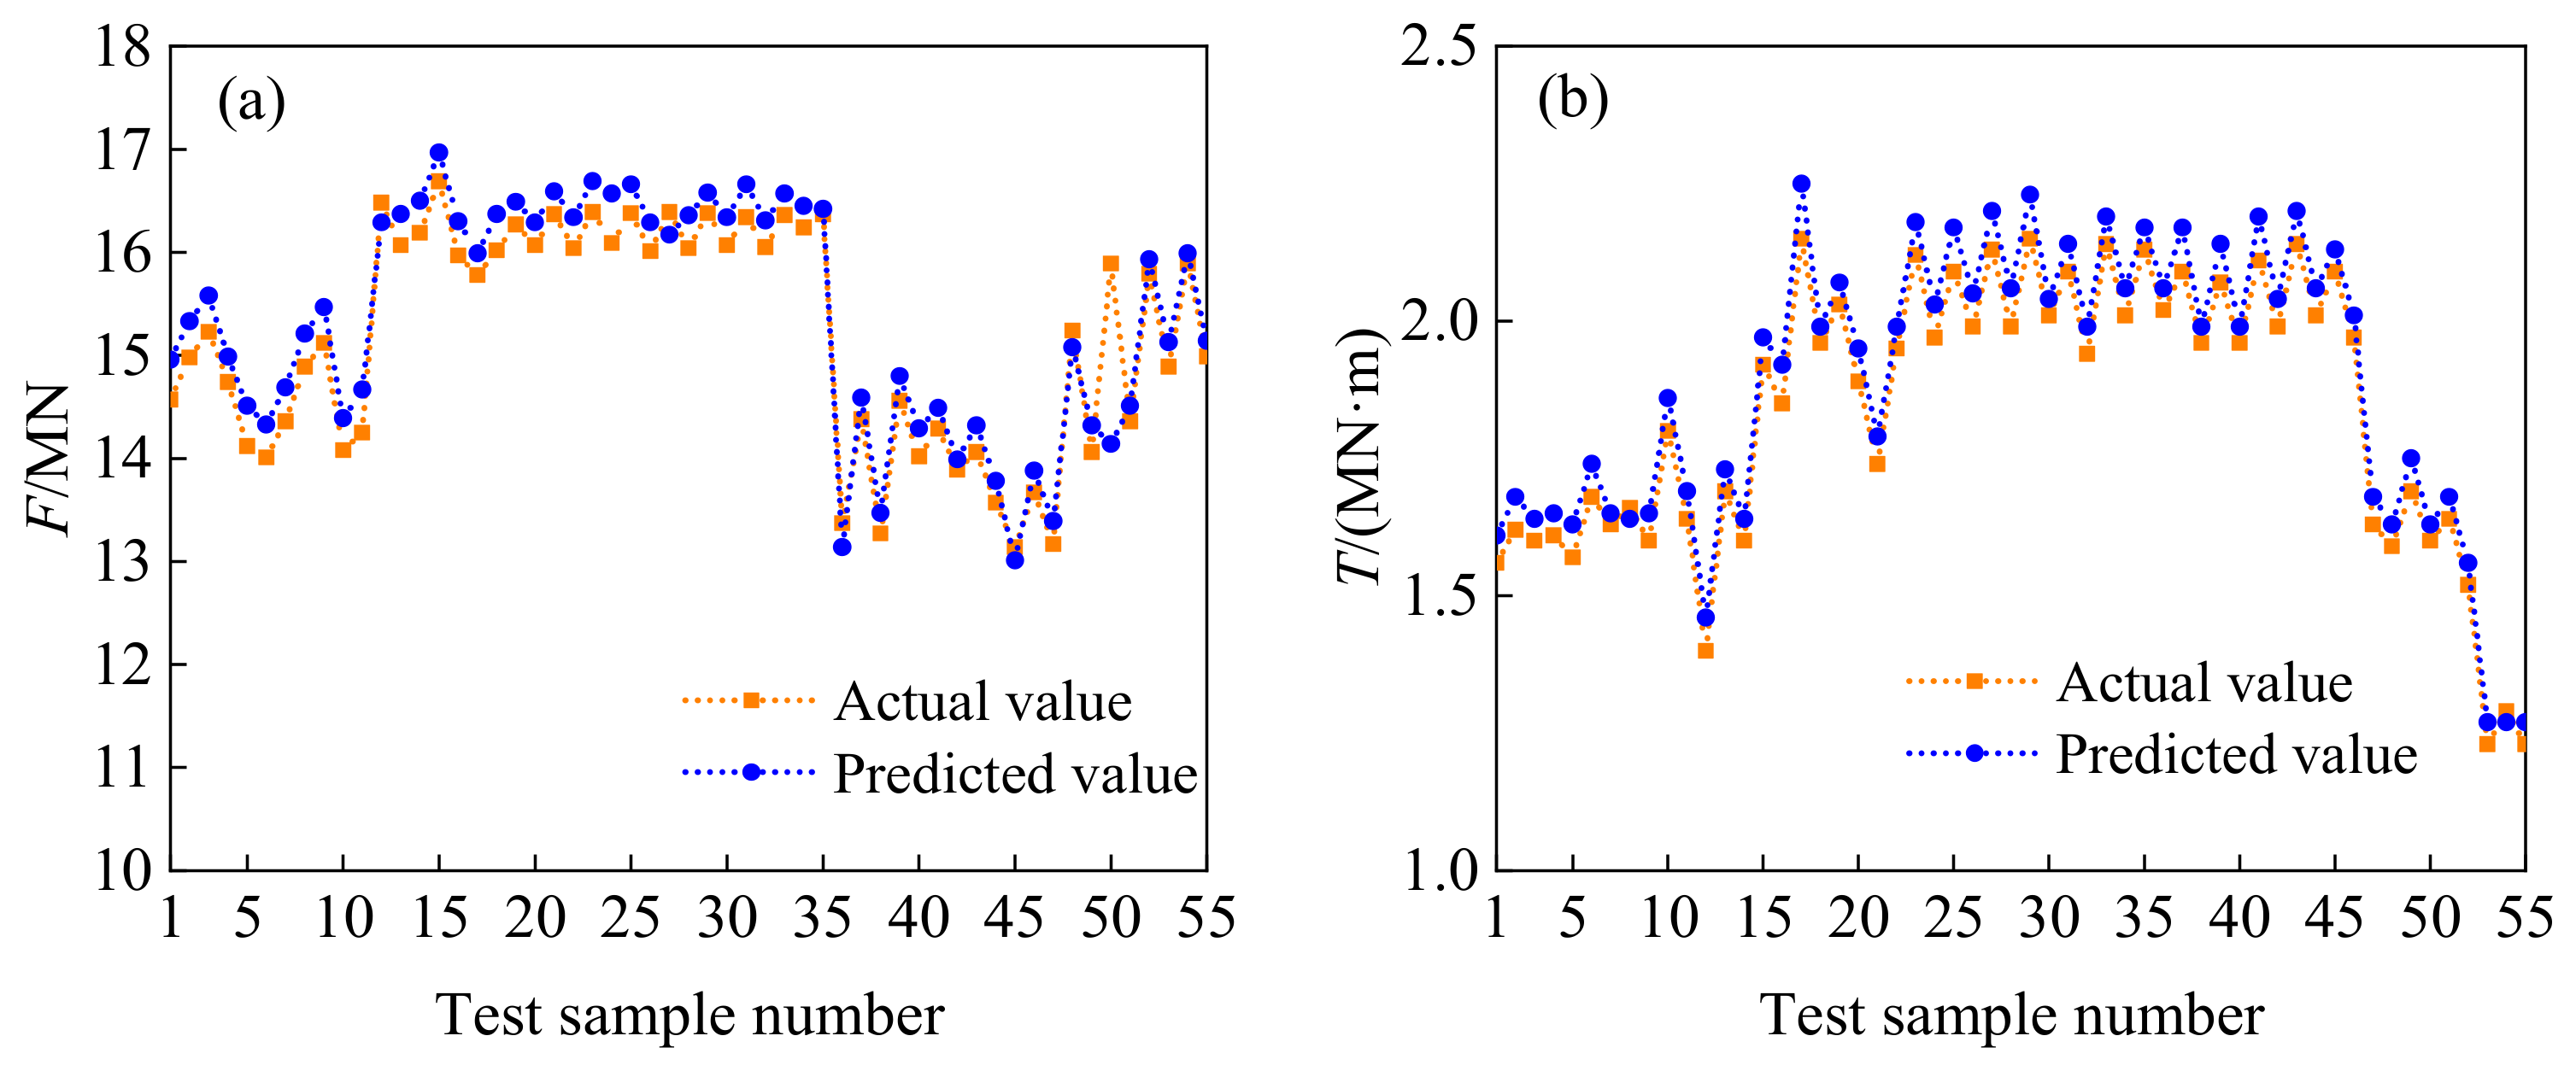
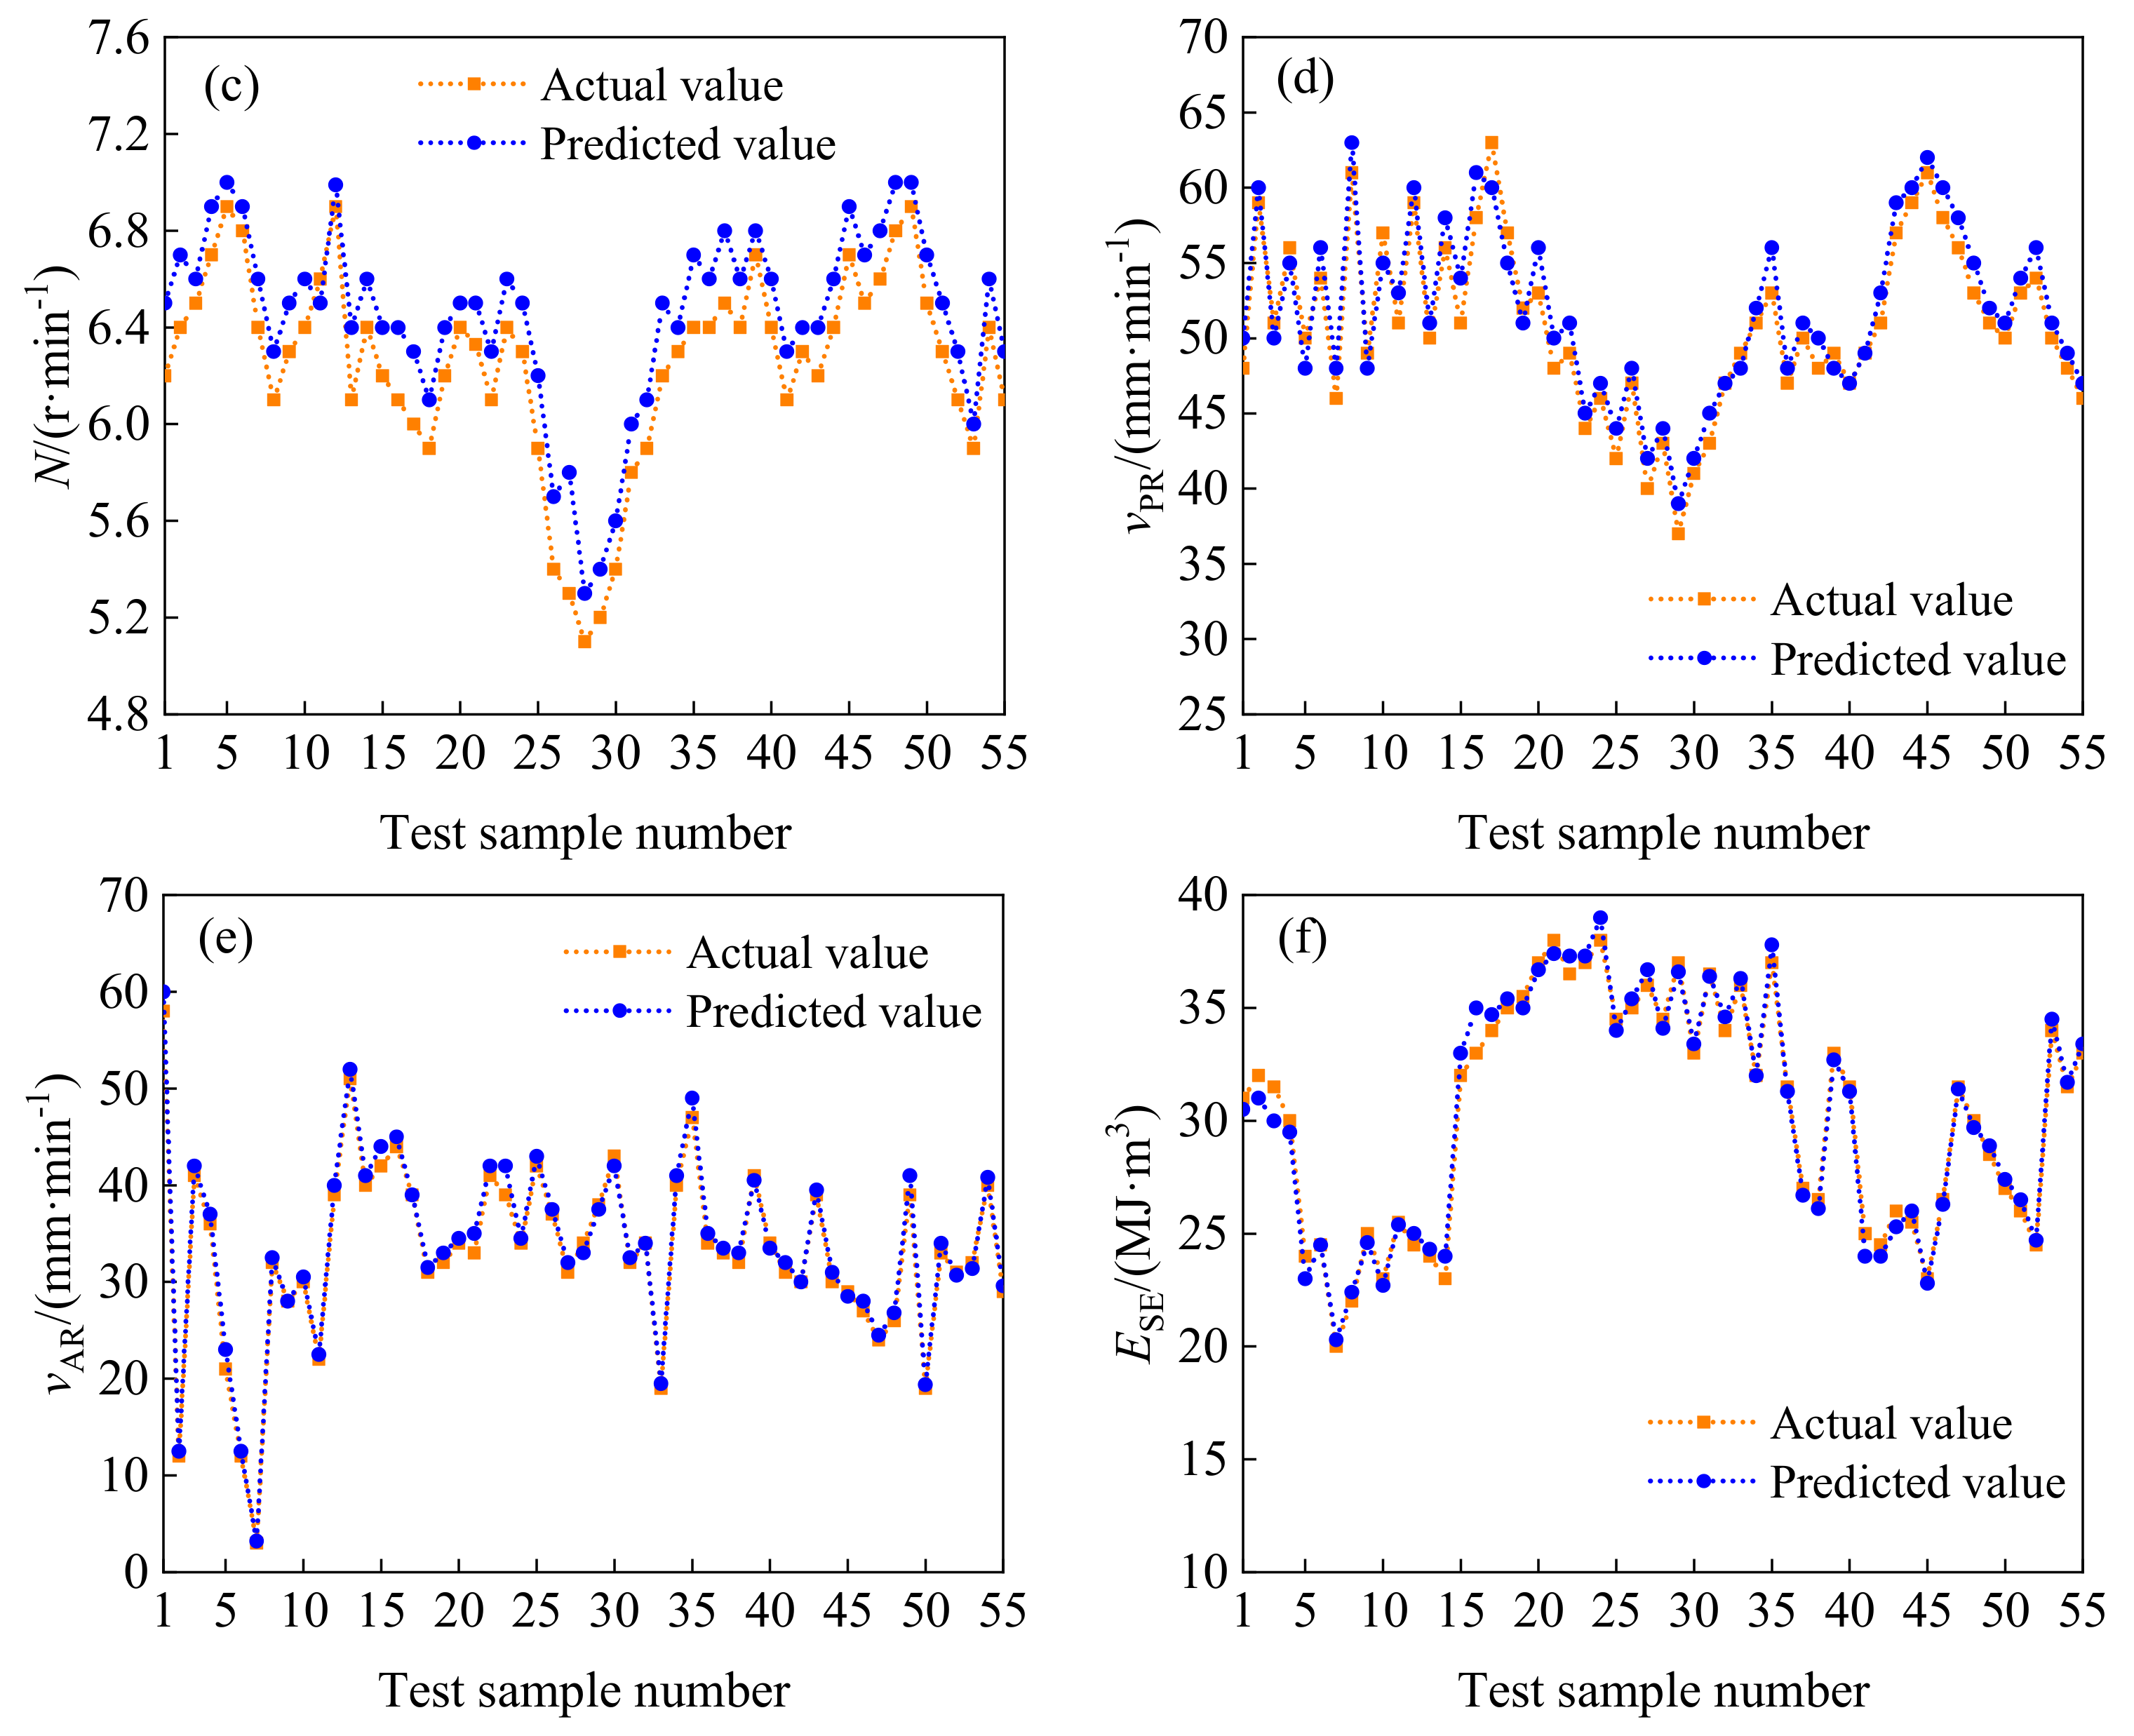
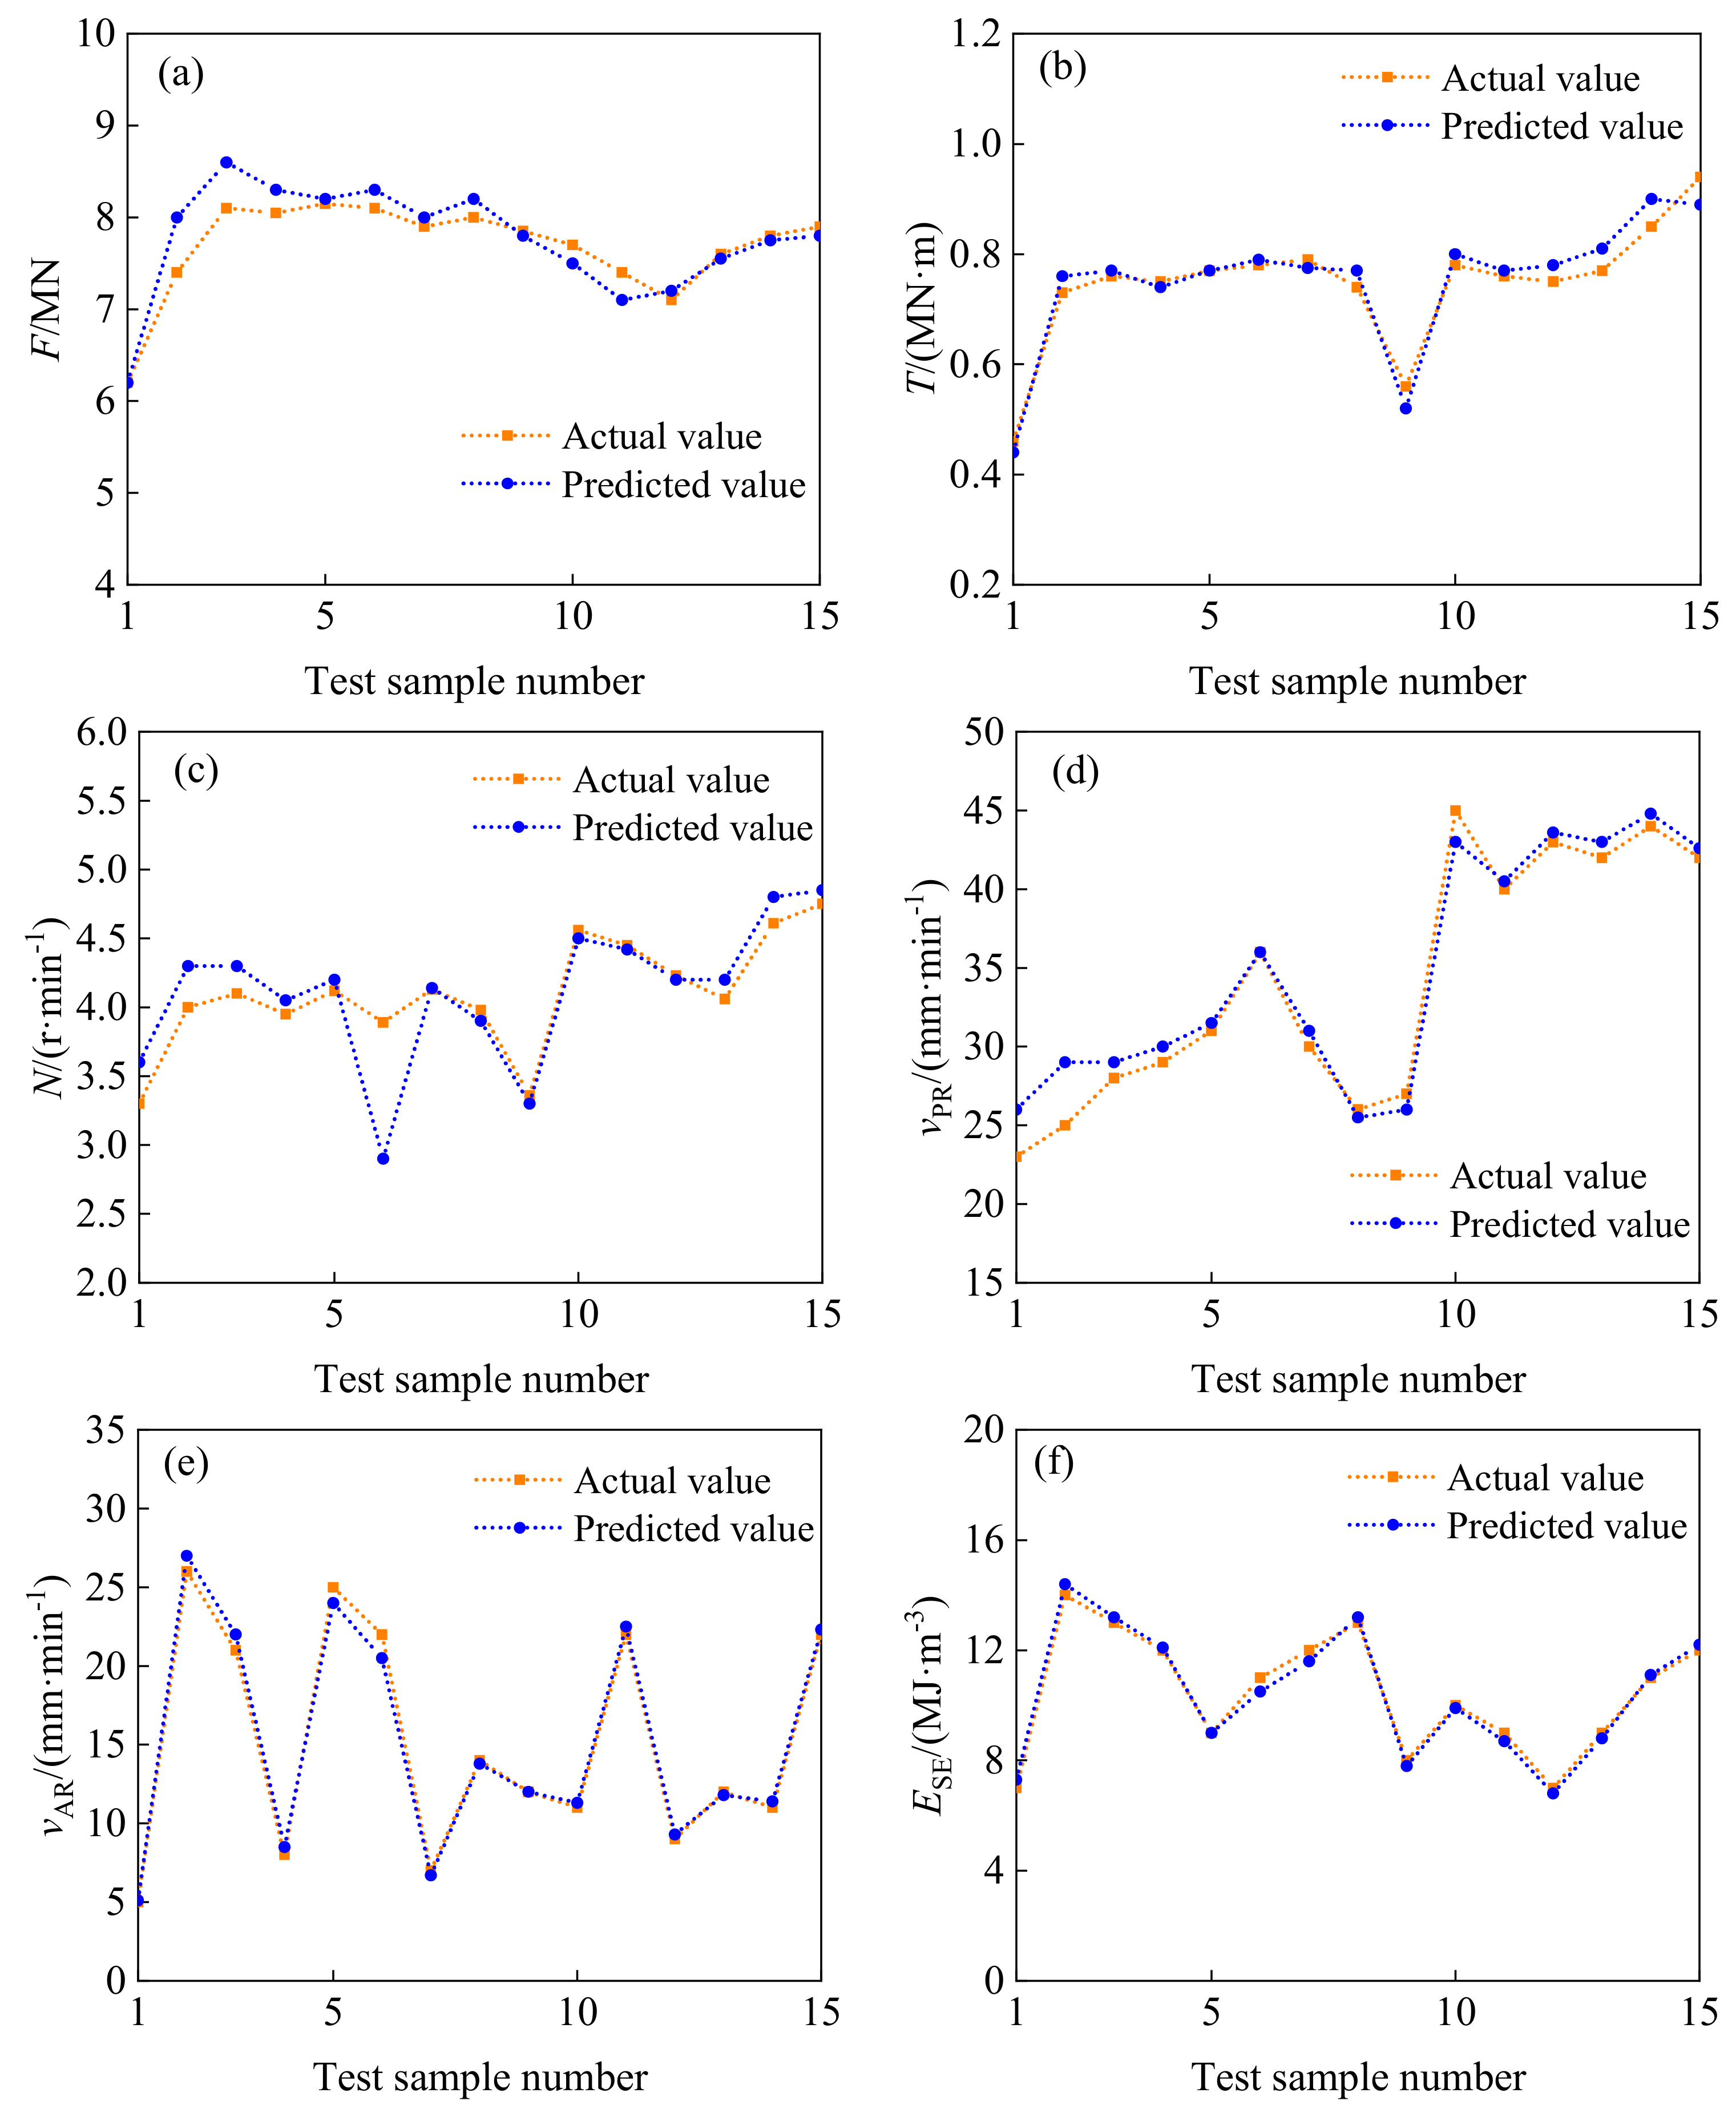
Establish a training set for the CNN-LSTM model based on the excavation parameters F, T, N, vAR, vPR, and ESE under four levels of surrounding rock, input them into the model training model, and sequentially output one of the excavation parameters. After multiple training sessions, the prediction accuracy of the model is improved. The prediction results of the model are shown in Figure 4, Figure 5, Figure 6, Figure 7 and Figure 8.
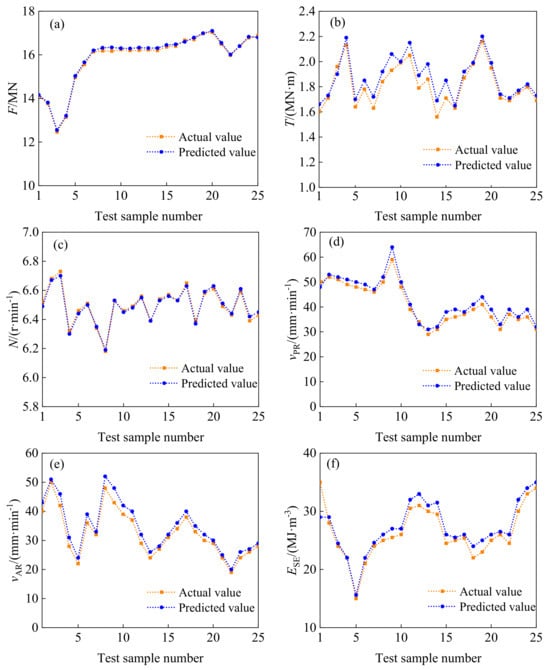
Figure 4.
The predicted and actual values of TBM driving parameters of Class II surrounding rock. (a) F; (b) T; (c) N; (d) vPR; (e) vAR; (f) ESE.
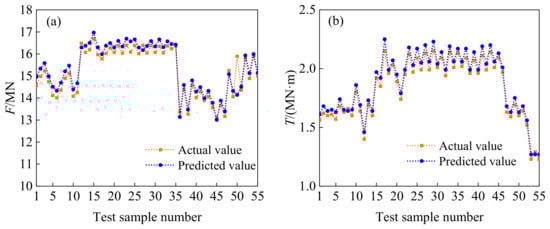
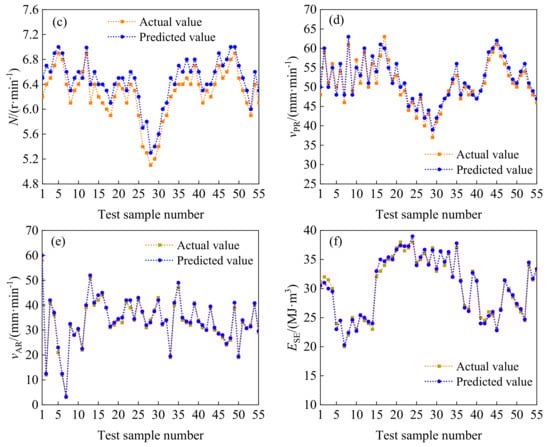
Figure 5.
The predicted and actual values of TBM driving parameters of Class III surrounding rock. (a) F; (b) T; (c) N; (d) vPR; (e) vAR; (f) ESE.
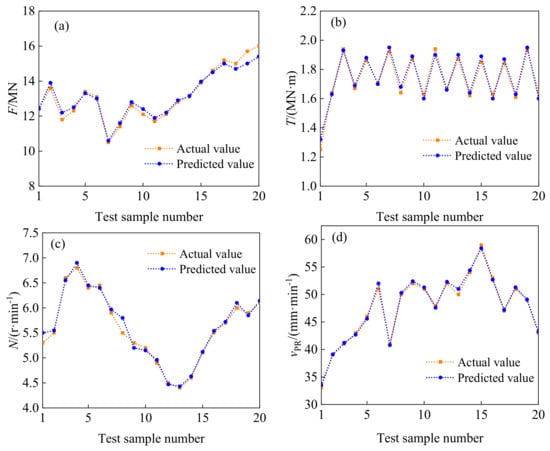
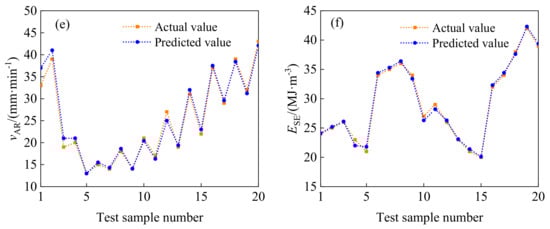
Figure 6.
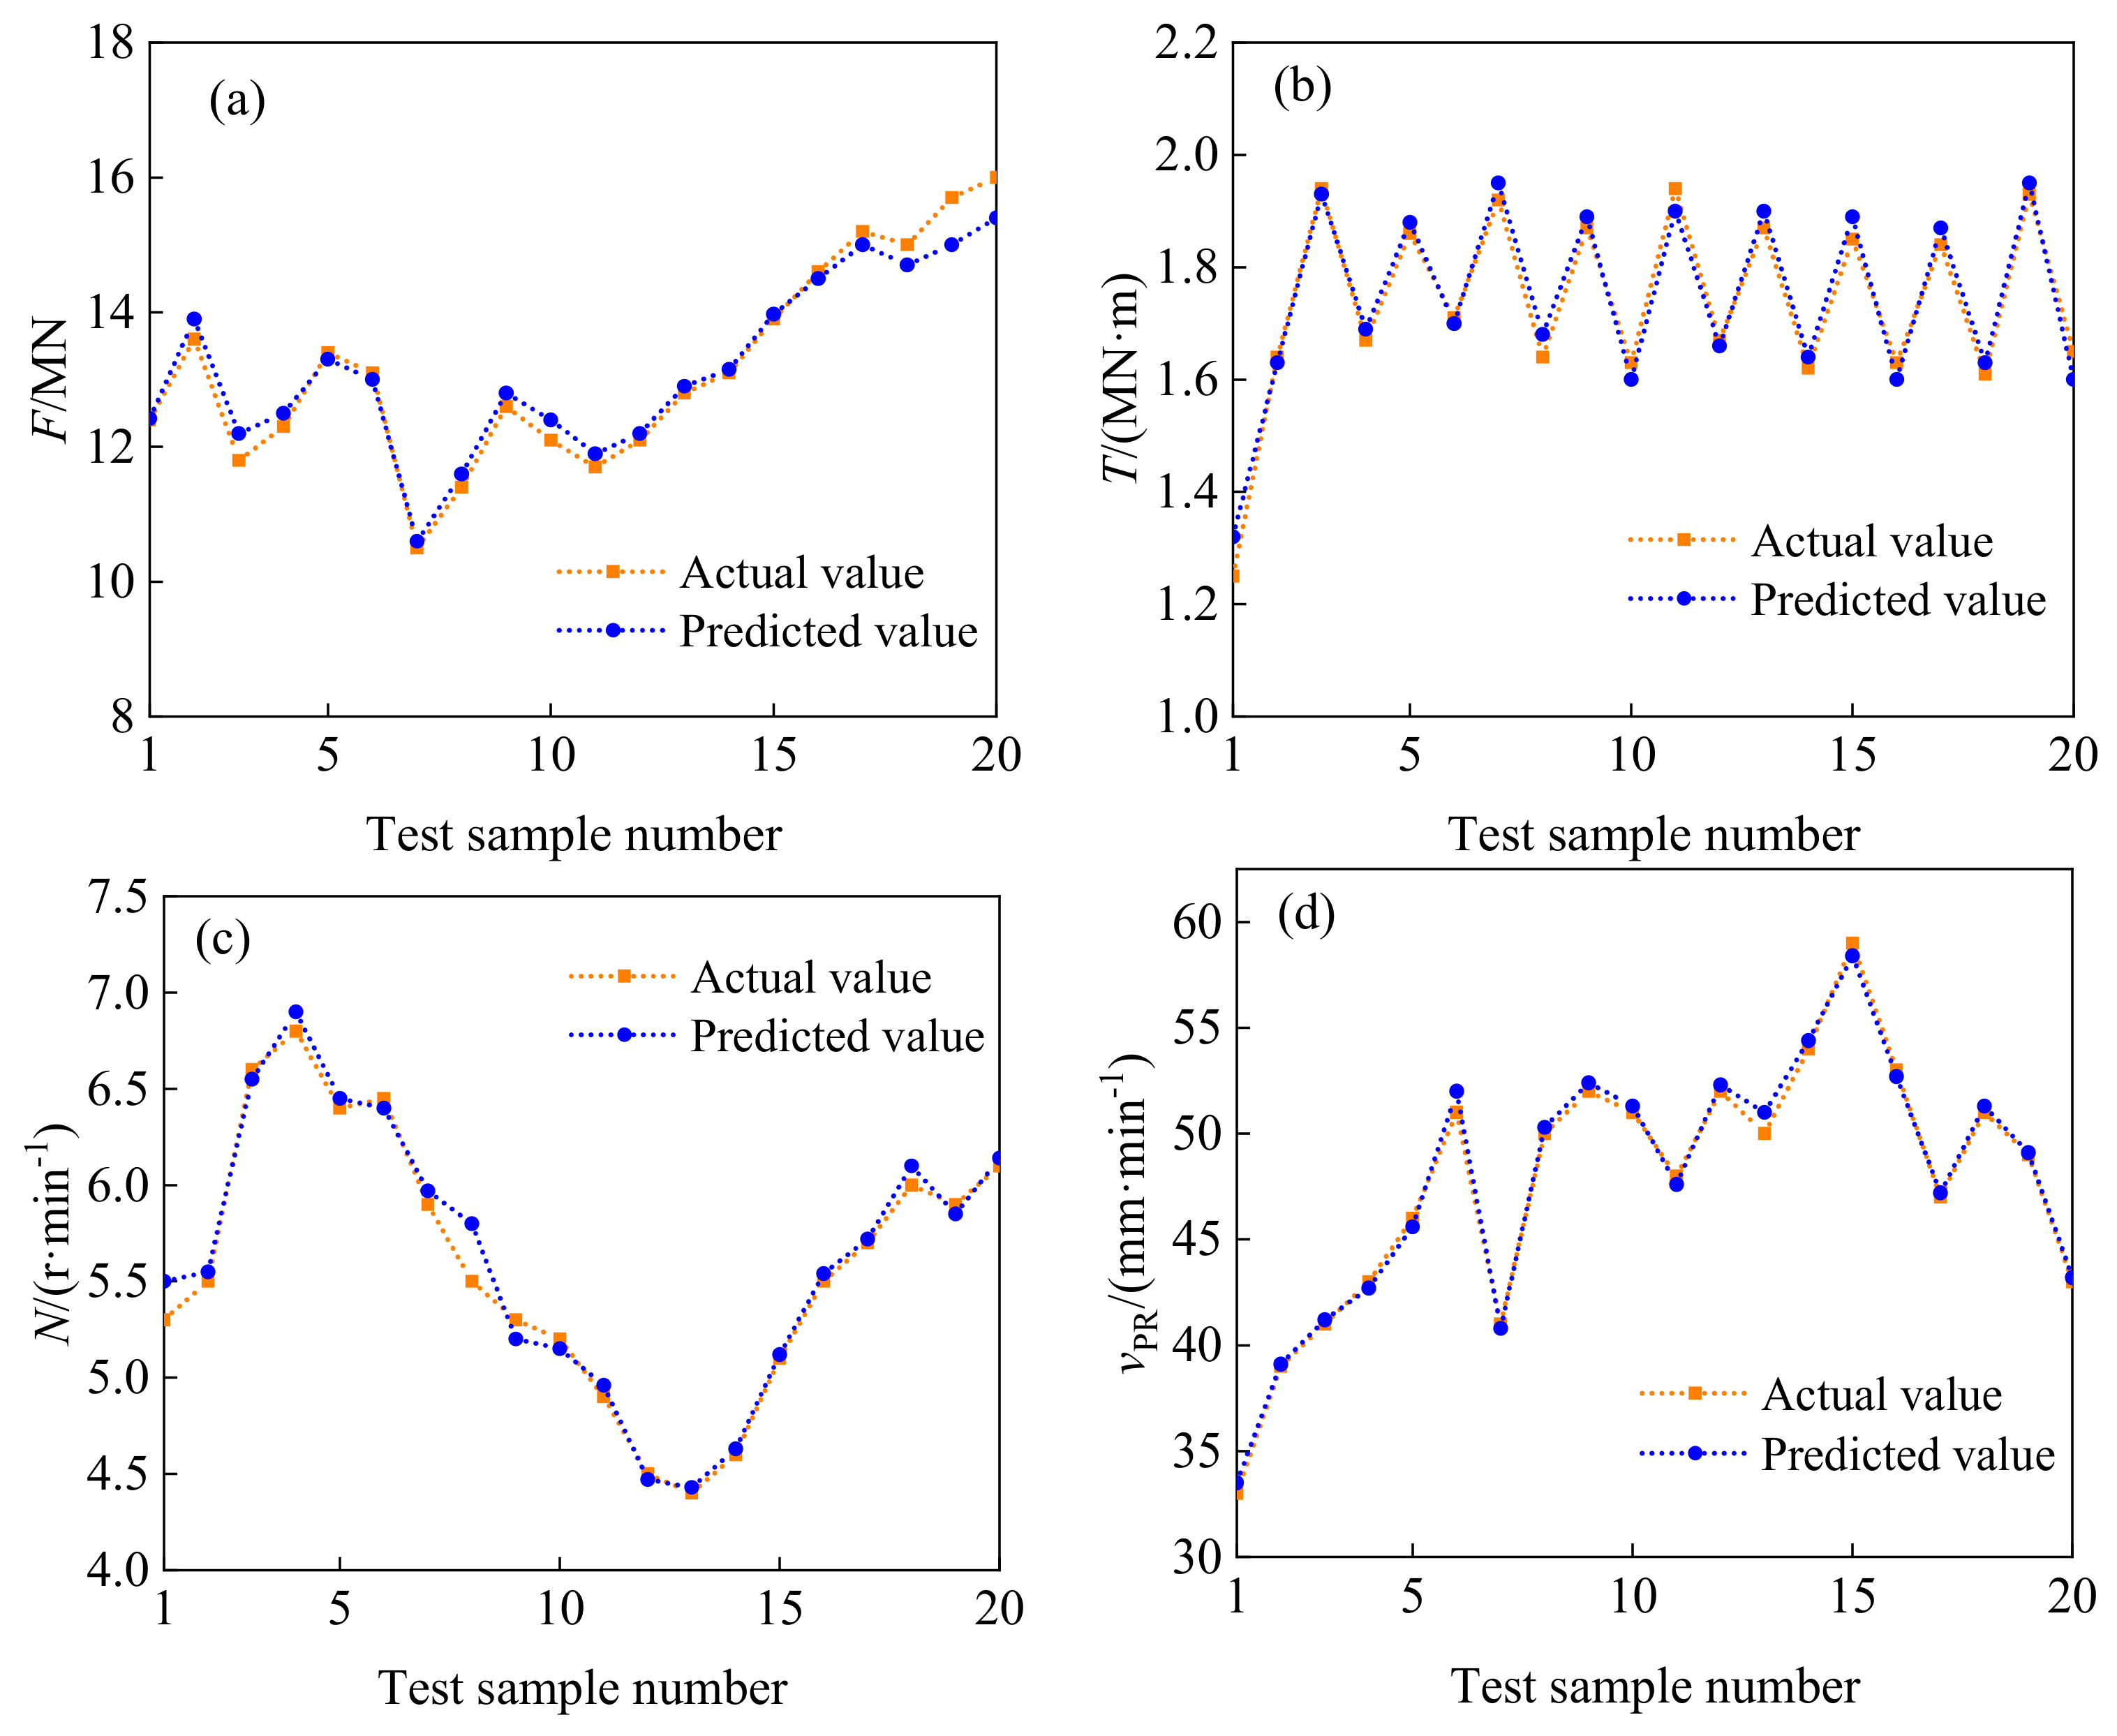
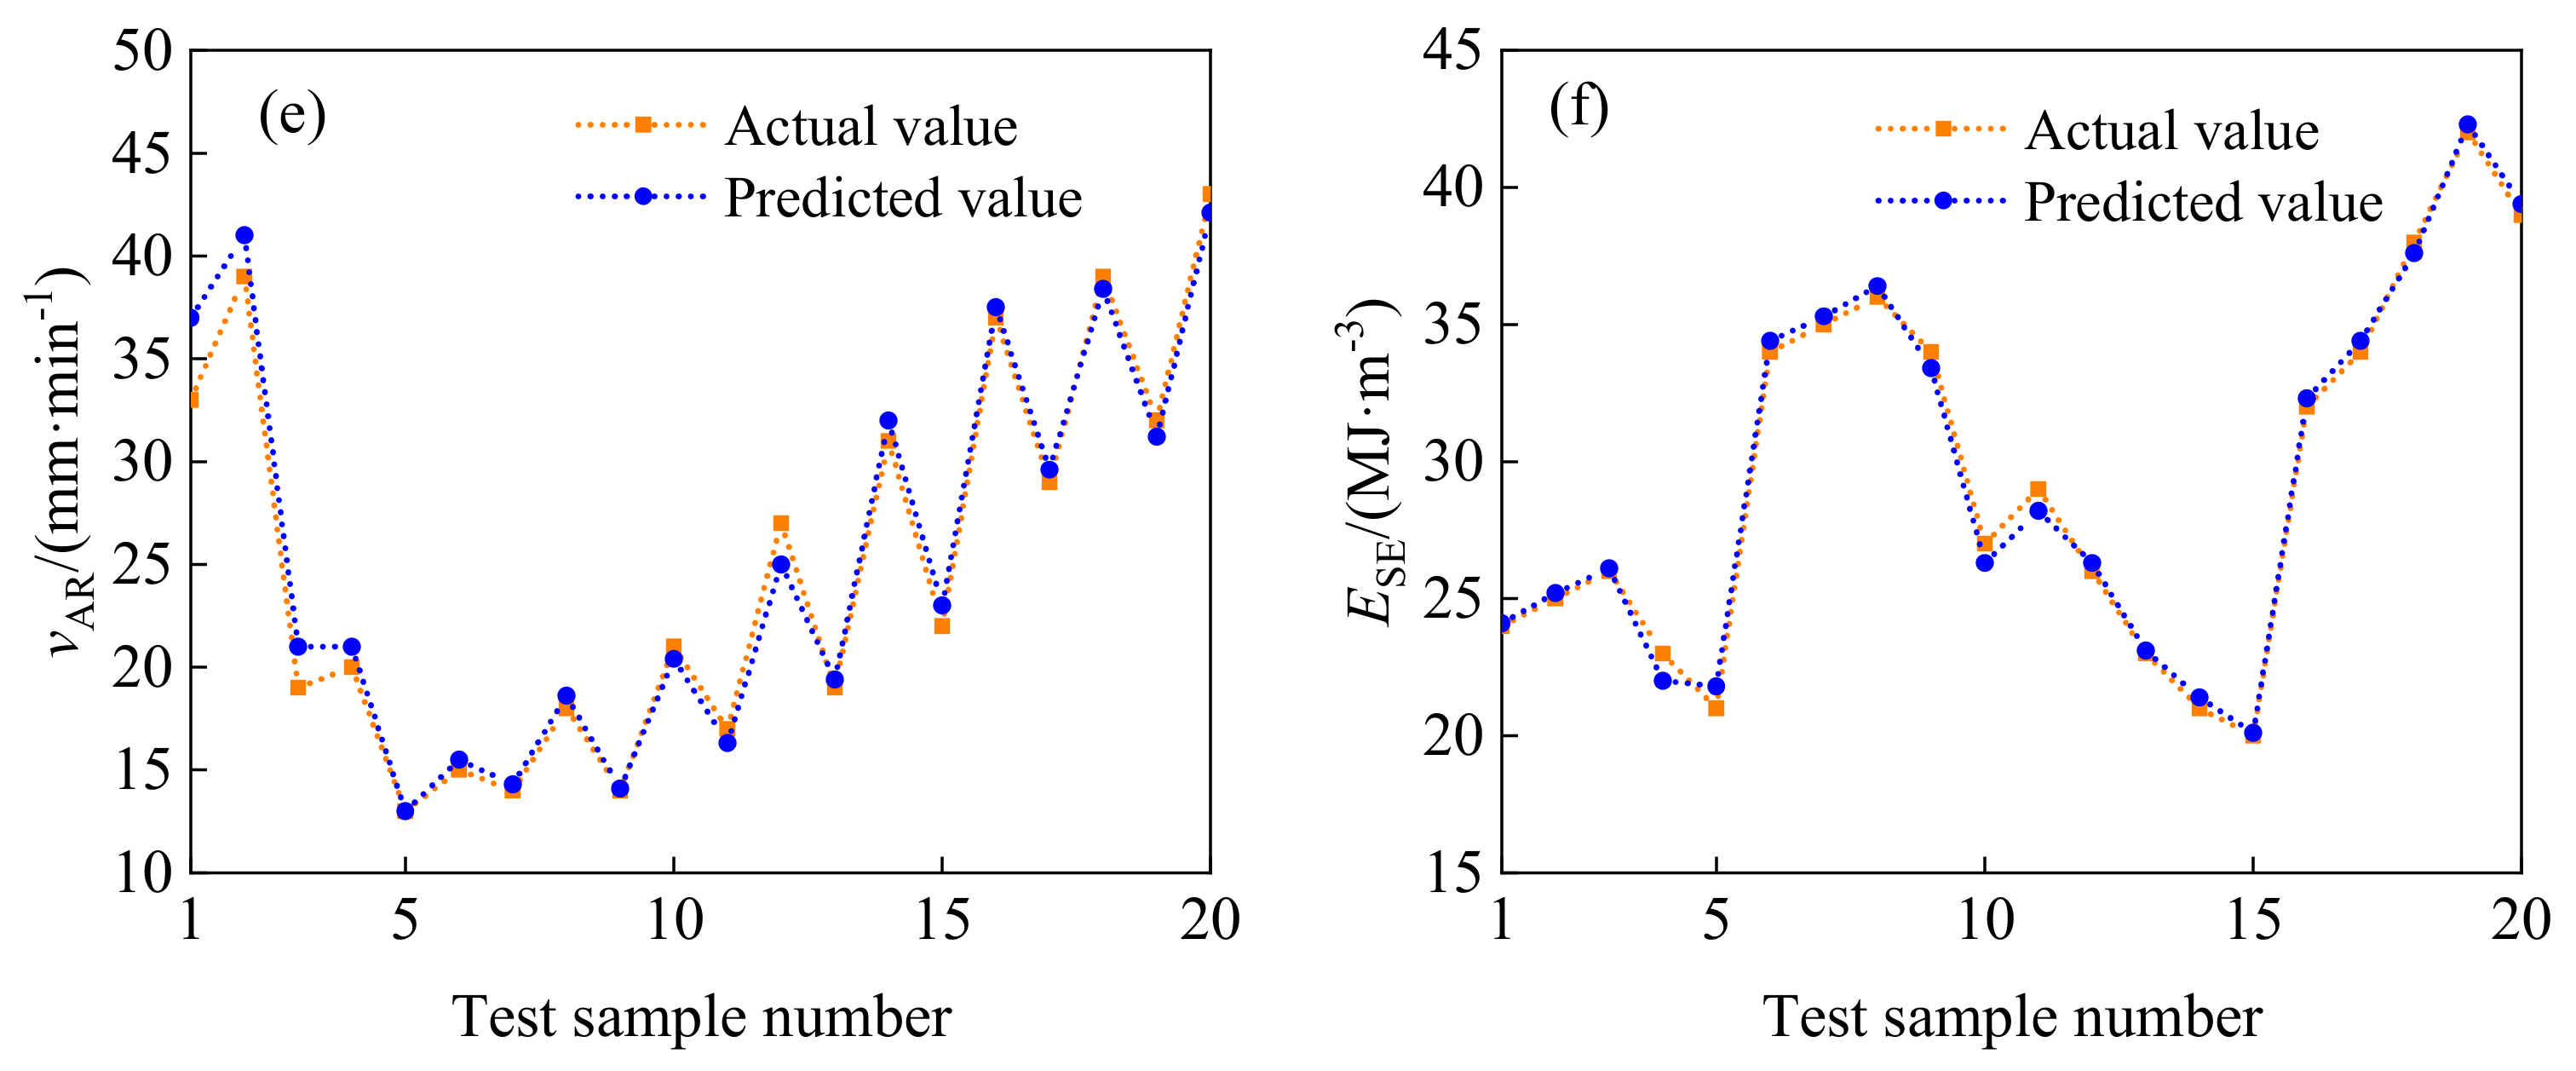
The predicted and actual values of TBM driving parameters of Class IV surrounding rock. (a) F; (b) T; (c) N; (d) vPR; (e) vAR; (f) ESE.
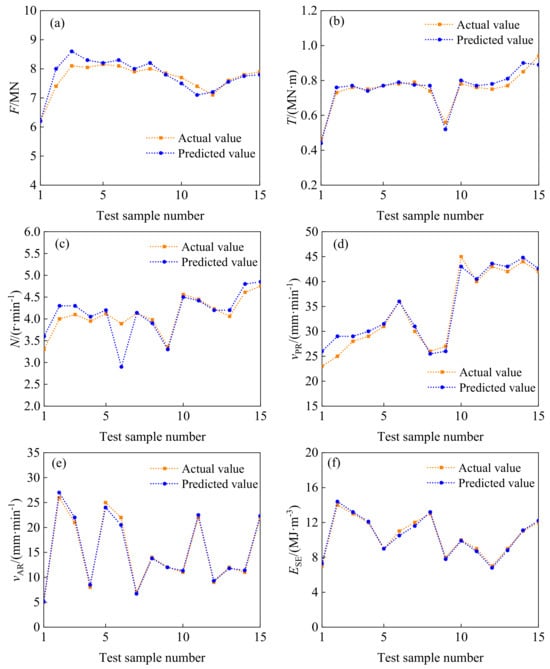
Figure 7.
The predicted and actual values of TBM driving parameters of Class V surrounding rock. (a) F; (b) T; (c) N; (d) vPR; (e) vAR; (f) ESE.
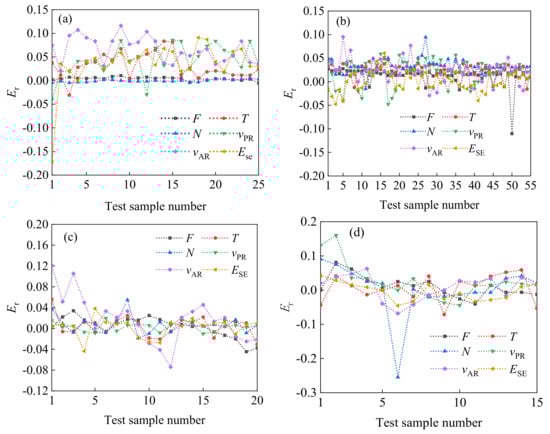
Figure 8.
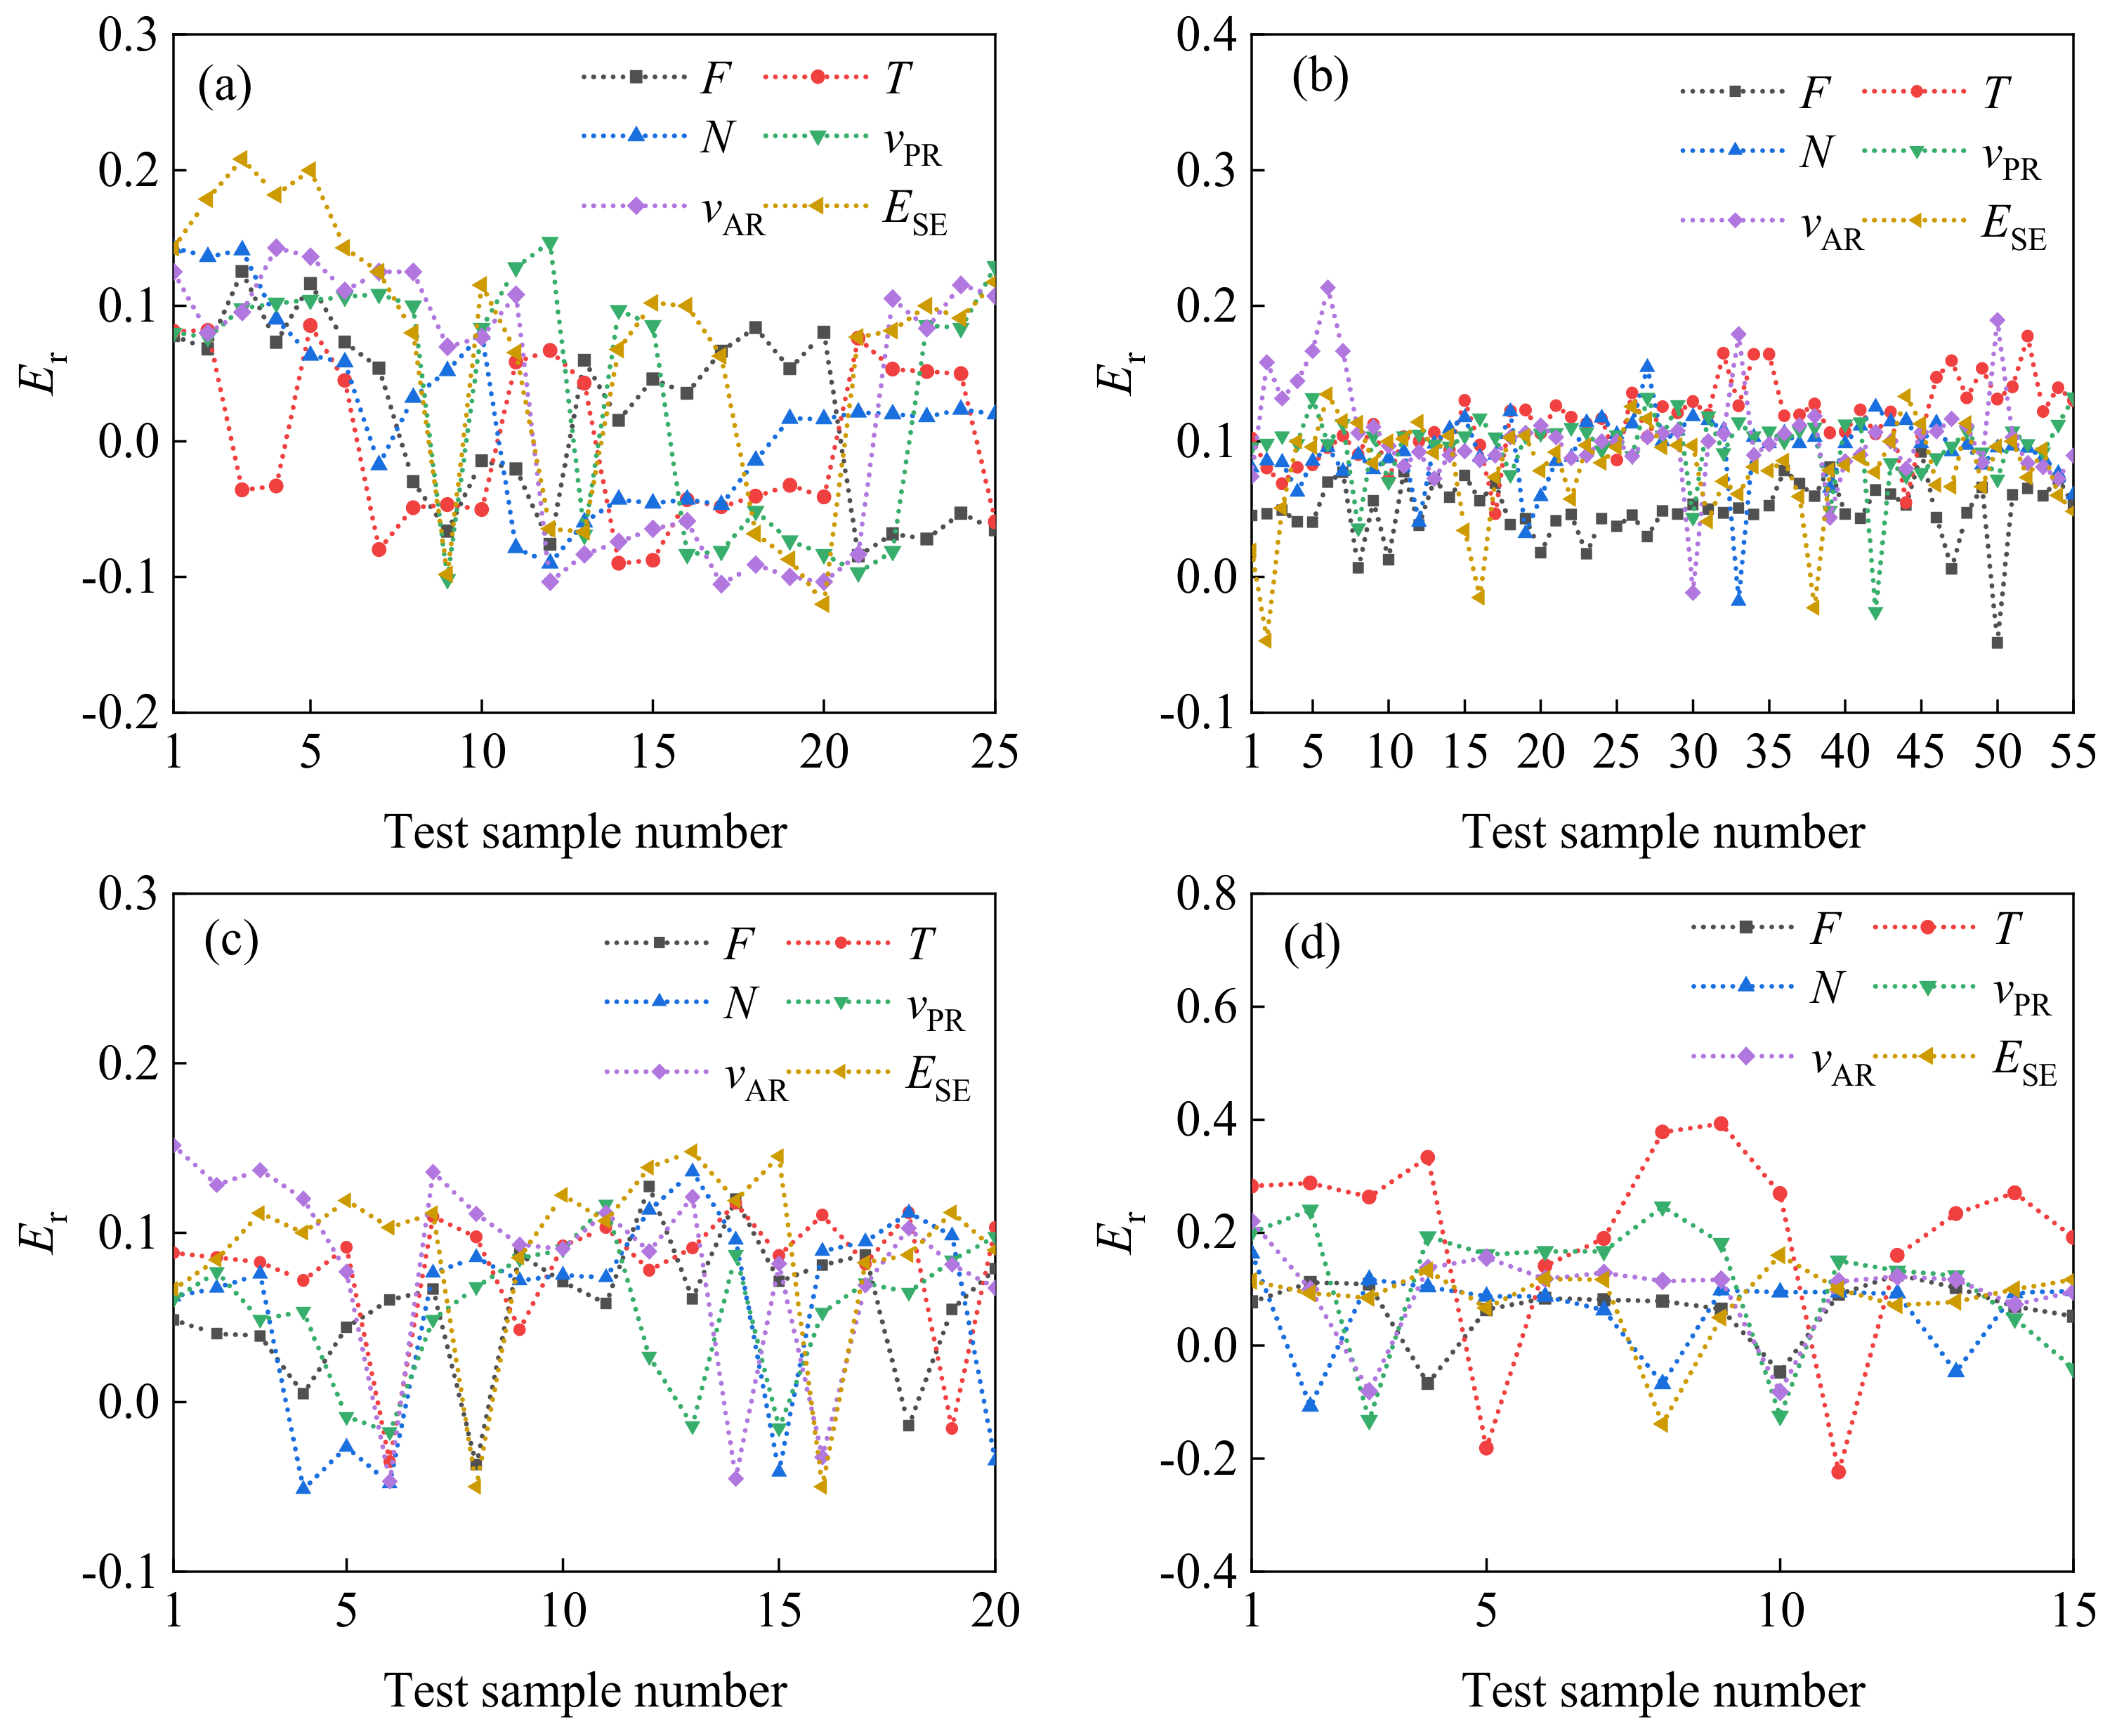
Relative error rate of excavation parameter predictions for various levels of surrounding rock. (a) Grade II surrounding rock; (b) Grade III surrounding rock; (c) Grade IV surrounding rock; (d) Grade V surrounding rock.
3.3. Analysis of Model Prediction Results
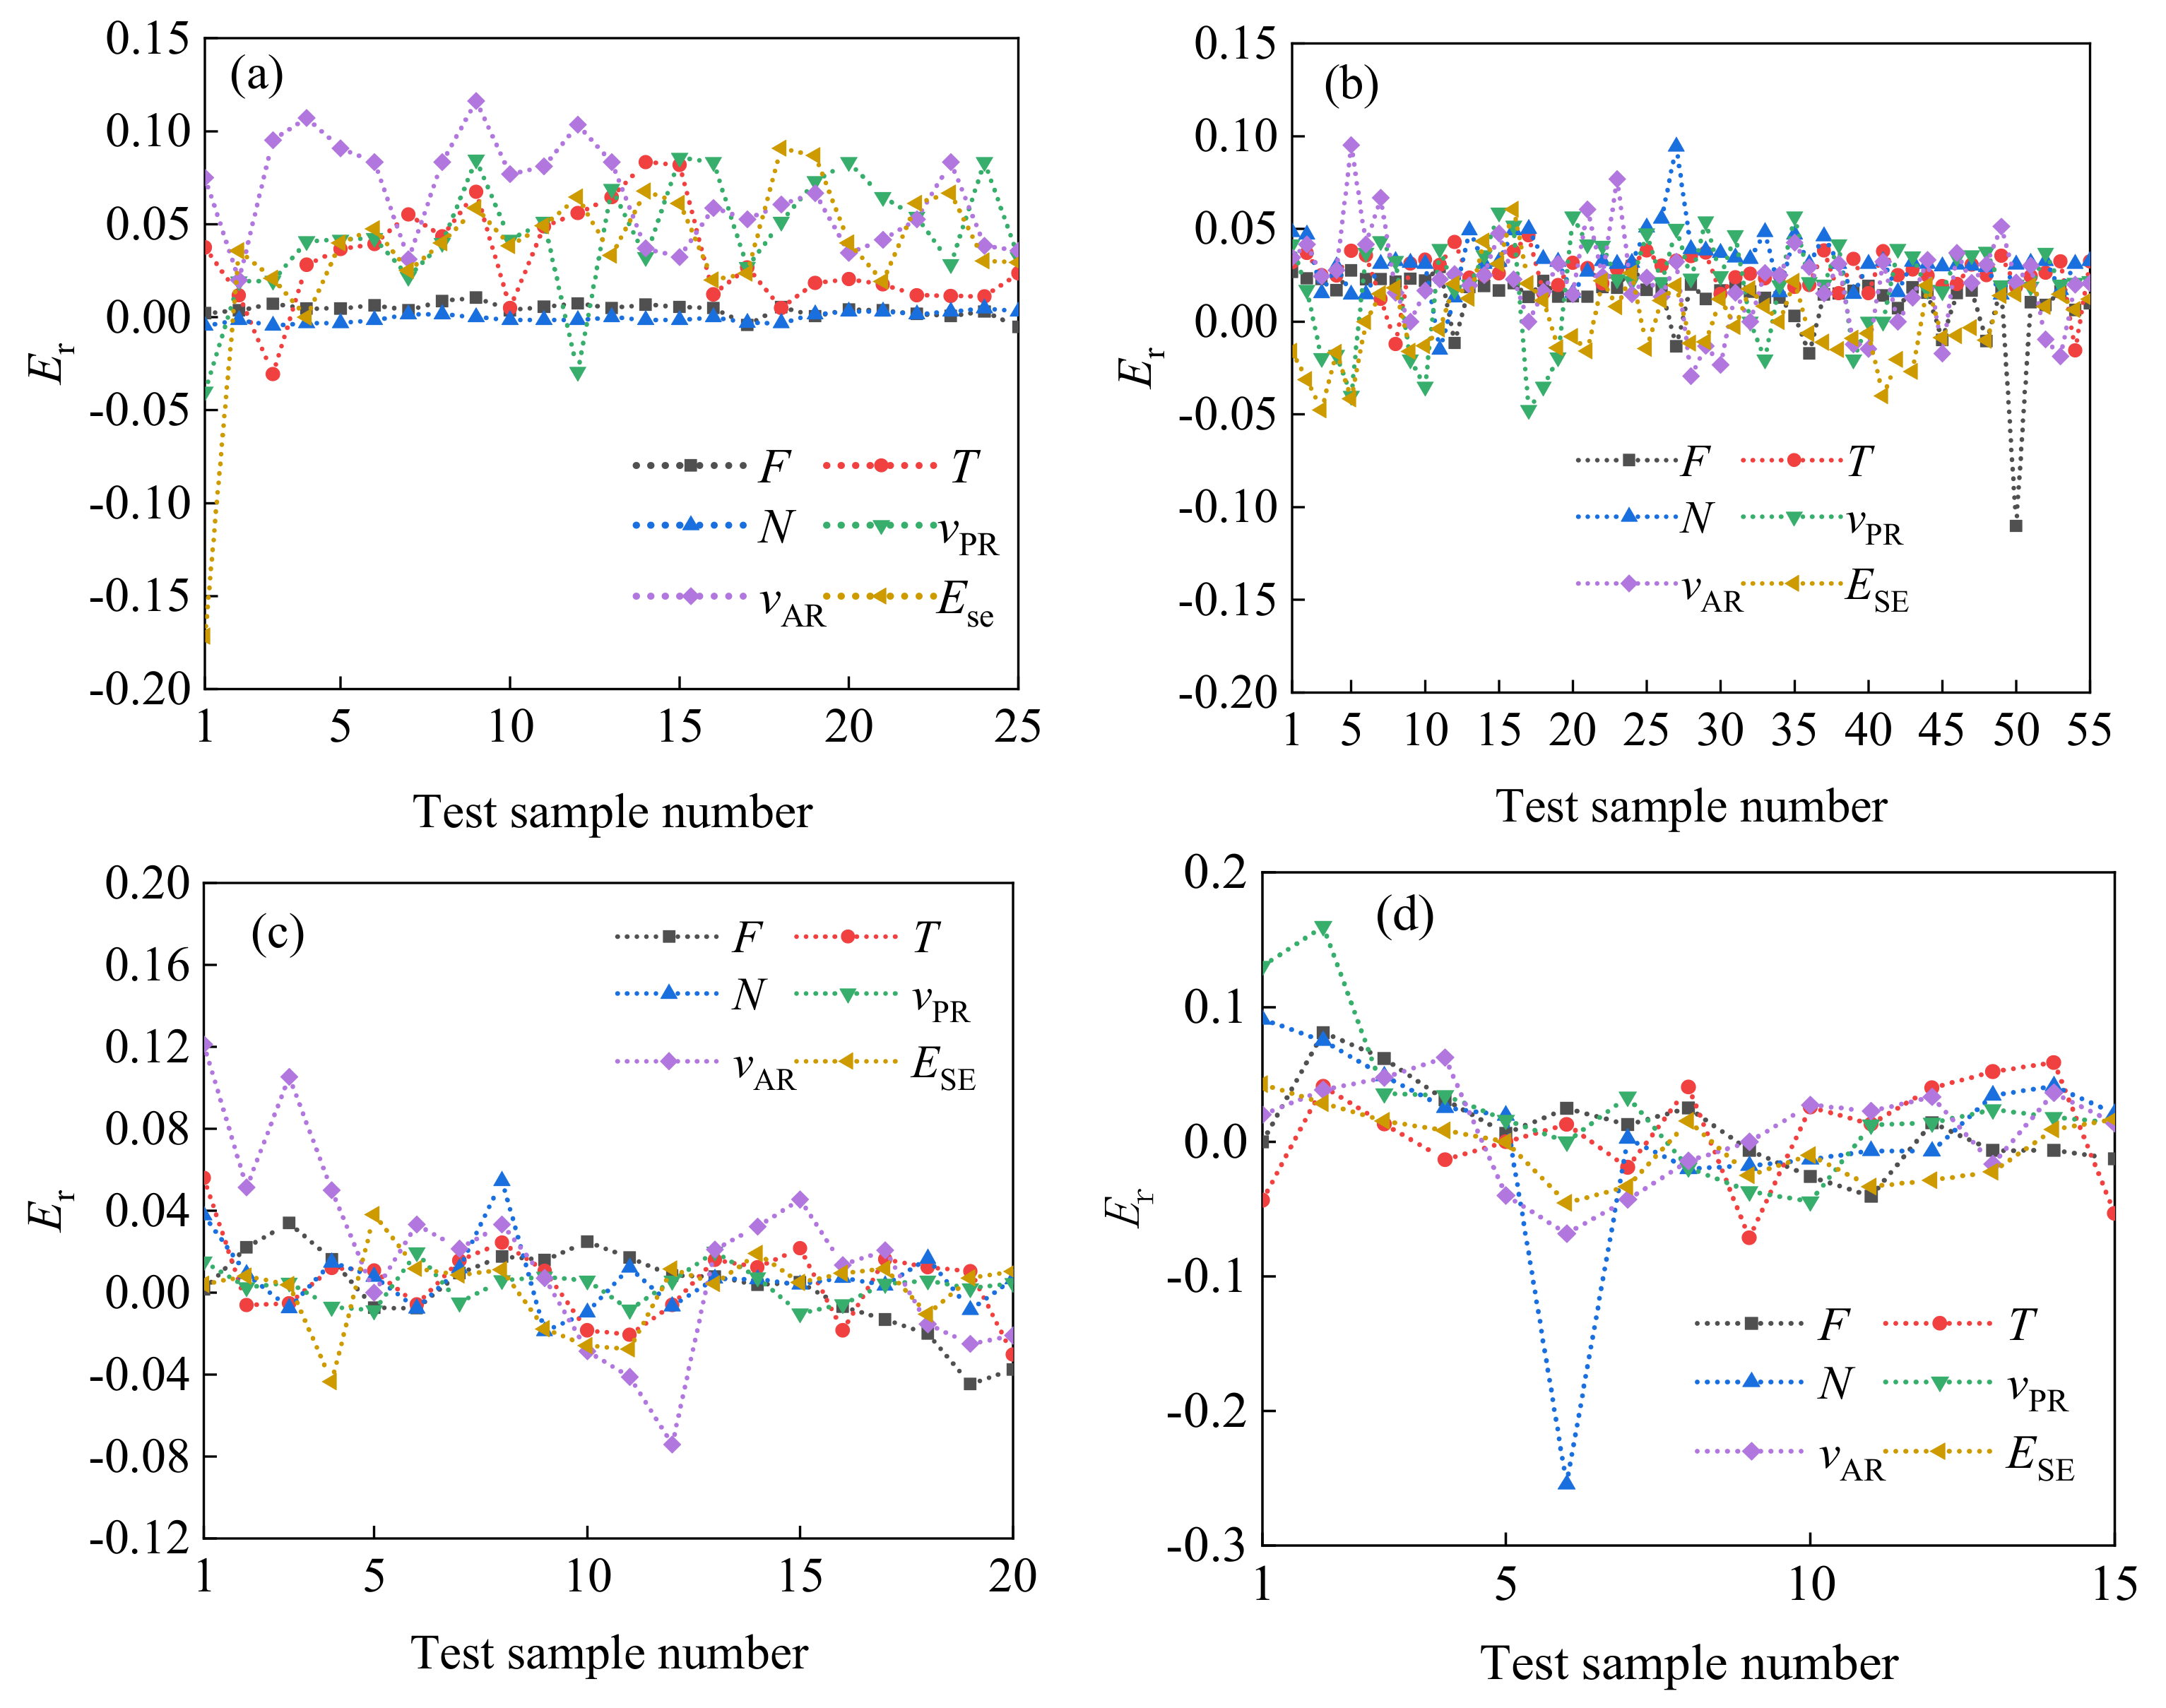
The CNN-LSTM model predicts the TBM excavation parameters by outputting the following four indicators, Er, RMSE, MAPE, and R2. The four indicators analyze the accuracy and goodness of fit of the model in predicting the TBM excavation parameters. The calculation results of the prediction relative error rate of the model under four levels of surrounding rock are shown in Figure 9, and the calculation results of RMSE, MAPE, and R2 are shown in Table 1.
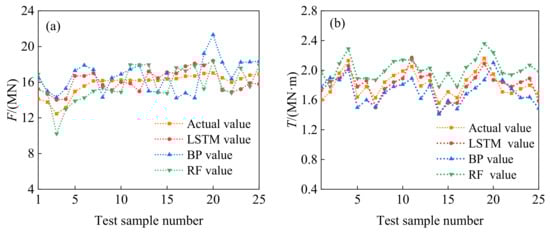
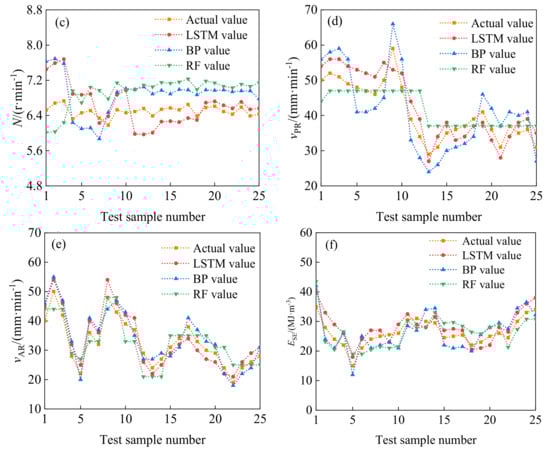
Figure 9.
The predicted and actual values of TBM driving parameters of Class II surrounding rock. (a) F; (b) T; (c) N; (d) vPR; (e) vAR; (f) ESE.

Table 1.
Error analysis of CNN-LSTM model prediction results.
The overall error calculation results of various excavation parameters remain at a low level, indicating that the CNN-LSTM model has a good predictive effect on TBM excavation parameters and plays an important role in guiding TBM engineering practice.
From the relative error rate results in Figure 9, it can be seen that in the Class II surrounding rock, the absolute values of Er predicted by some vAR in TBM excavation parameters are greater than 0.1, with an average Er of 0.064. The absolute values of Er for other parameters are all less than 0.1; in the Class III surrounding rock, the absolute values of Er for some F and vAR are greater than 0.1, and the average Er for F and vAR is 00678 and 0.0713. The predicted absolute values of Er for other parameters are all less than 0.1; in the fourth level surrounding rock, the predicted absolute values of Er for all TBM excavation parameters except for vAR are less than 0.1, and some of the absolute values of Er for vAR are greater than 0.1. The average Er for vAR is 0.074; in Class V surrounding rock, the absolute Er values of some N and vPR are greater than 0.1, and the average Er values of N and vPR are 0.0685 and 0.0724, respectively. The predicted absolute Er values of other TBM excavation parameters are all less than 0.1. As the grade of the surrounding rock decreases, the relative error rate of the model in predicting various excavation parameters increases, indicating that the surrounding rock conditions have a certain impact on the accuracy of the model’s prediction.
Through comparison, it can be found that among the six TBM excavation parameters, the relative error rate of vPR prediction is the highest among all parameters, and the fluctuations in parameter prediction are also large, indicating that the model has a low prediction accuracy. Considering the actual working conditions of the TBM site, the construction speed is not only related to the TBM excavation situation, but also to factors such as the construction progress of the connecting sections between tunnels, worker response to emergencies, TBM step changes, and stuck machine rescue. These factors are not closely related to the TBM excavation parameters, so they have a significant impact on the accuracy of the model’s prediction. As the grade of surrounding rock decreases, the value of R2 predicted by the model also decreases, indicating that the model has higher accuracy in predicting excavation parameters for stable geological conditions of surrounding rock. Meanwhile, among the four types of surrounding rock, the average MAPE value of the Grade V surrounding rock is 4.995%, indicating that the lower the level of the surrounding rock, the greater the prediction error of the CNN-LSTM model for excavation parameters. Meanwhile, as the stability of the surrounding rock decreases, the predicted RMSE value of the CNN-LSTM model will also increase, indicating that human factors have an increased impact on rock–machine interaction, leading to a decrease in the prediction accuracy of the machine learning model. On the other hand, there are limited data on tunnel sections with lower rock mass grades, which affects the training accuracy of the machine learning models and reduces the accuracy of the parameter prediction. In the four types of surrounding rock, the RMSE value predicted for excavation parameters decreases with the decrease in surrounding rock grade, indicating that the prediction error of the model for excavation parameters in weak surrounding rock sections will increase.
4. Discussion
4.1. Traditional Machine Learning Models
- (1)
- BP model
A typical back propagation (BP) neural network model usually consists of the following three layers: the input layer, hidden layer, and output layer. The input data enter the input layer, and then the function selection relationship between the input parameters is established through the hidden layer. The error is calculated through the reverse transmission of information flow between layers, and the model parameter connections are modified to make the model error converge to the set value. Finally, the model operation result is output through the output layer. Establish a nonlinear mapping relationship between the input parameters of the model, that is, between the input parameters X = (x1, x2,…, xn) and the output parameters Y = (y1, y2,…, yn).
- (2)
- RF model
The random forest (RF) algorithm is an ensemble learning algorithm proposed by Professor Leo Breiman based on bagging and decision tree theories. To ensure the randomness of the random forest model prediction, the selection of raw data is based on the bootstrap method for sampling, and the decision tree forest is generated according to the decision tree algorithm. The RF model can establish a larger scale tree to achieve higher algorithm accuracy when setting up decision trees. At the same time, the data mining process has a supervision mechanism, which reduces the volatility of handling multivariate abnormal data and can avoid overfitting that may occur in data retrospective prediction. It has high efficiency in handling high-dimensional data.
4.2. Model Prediction Results and Error Analysis
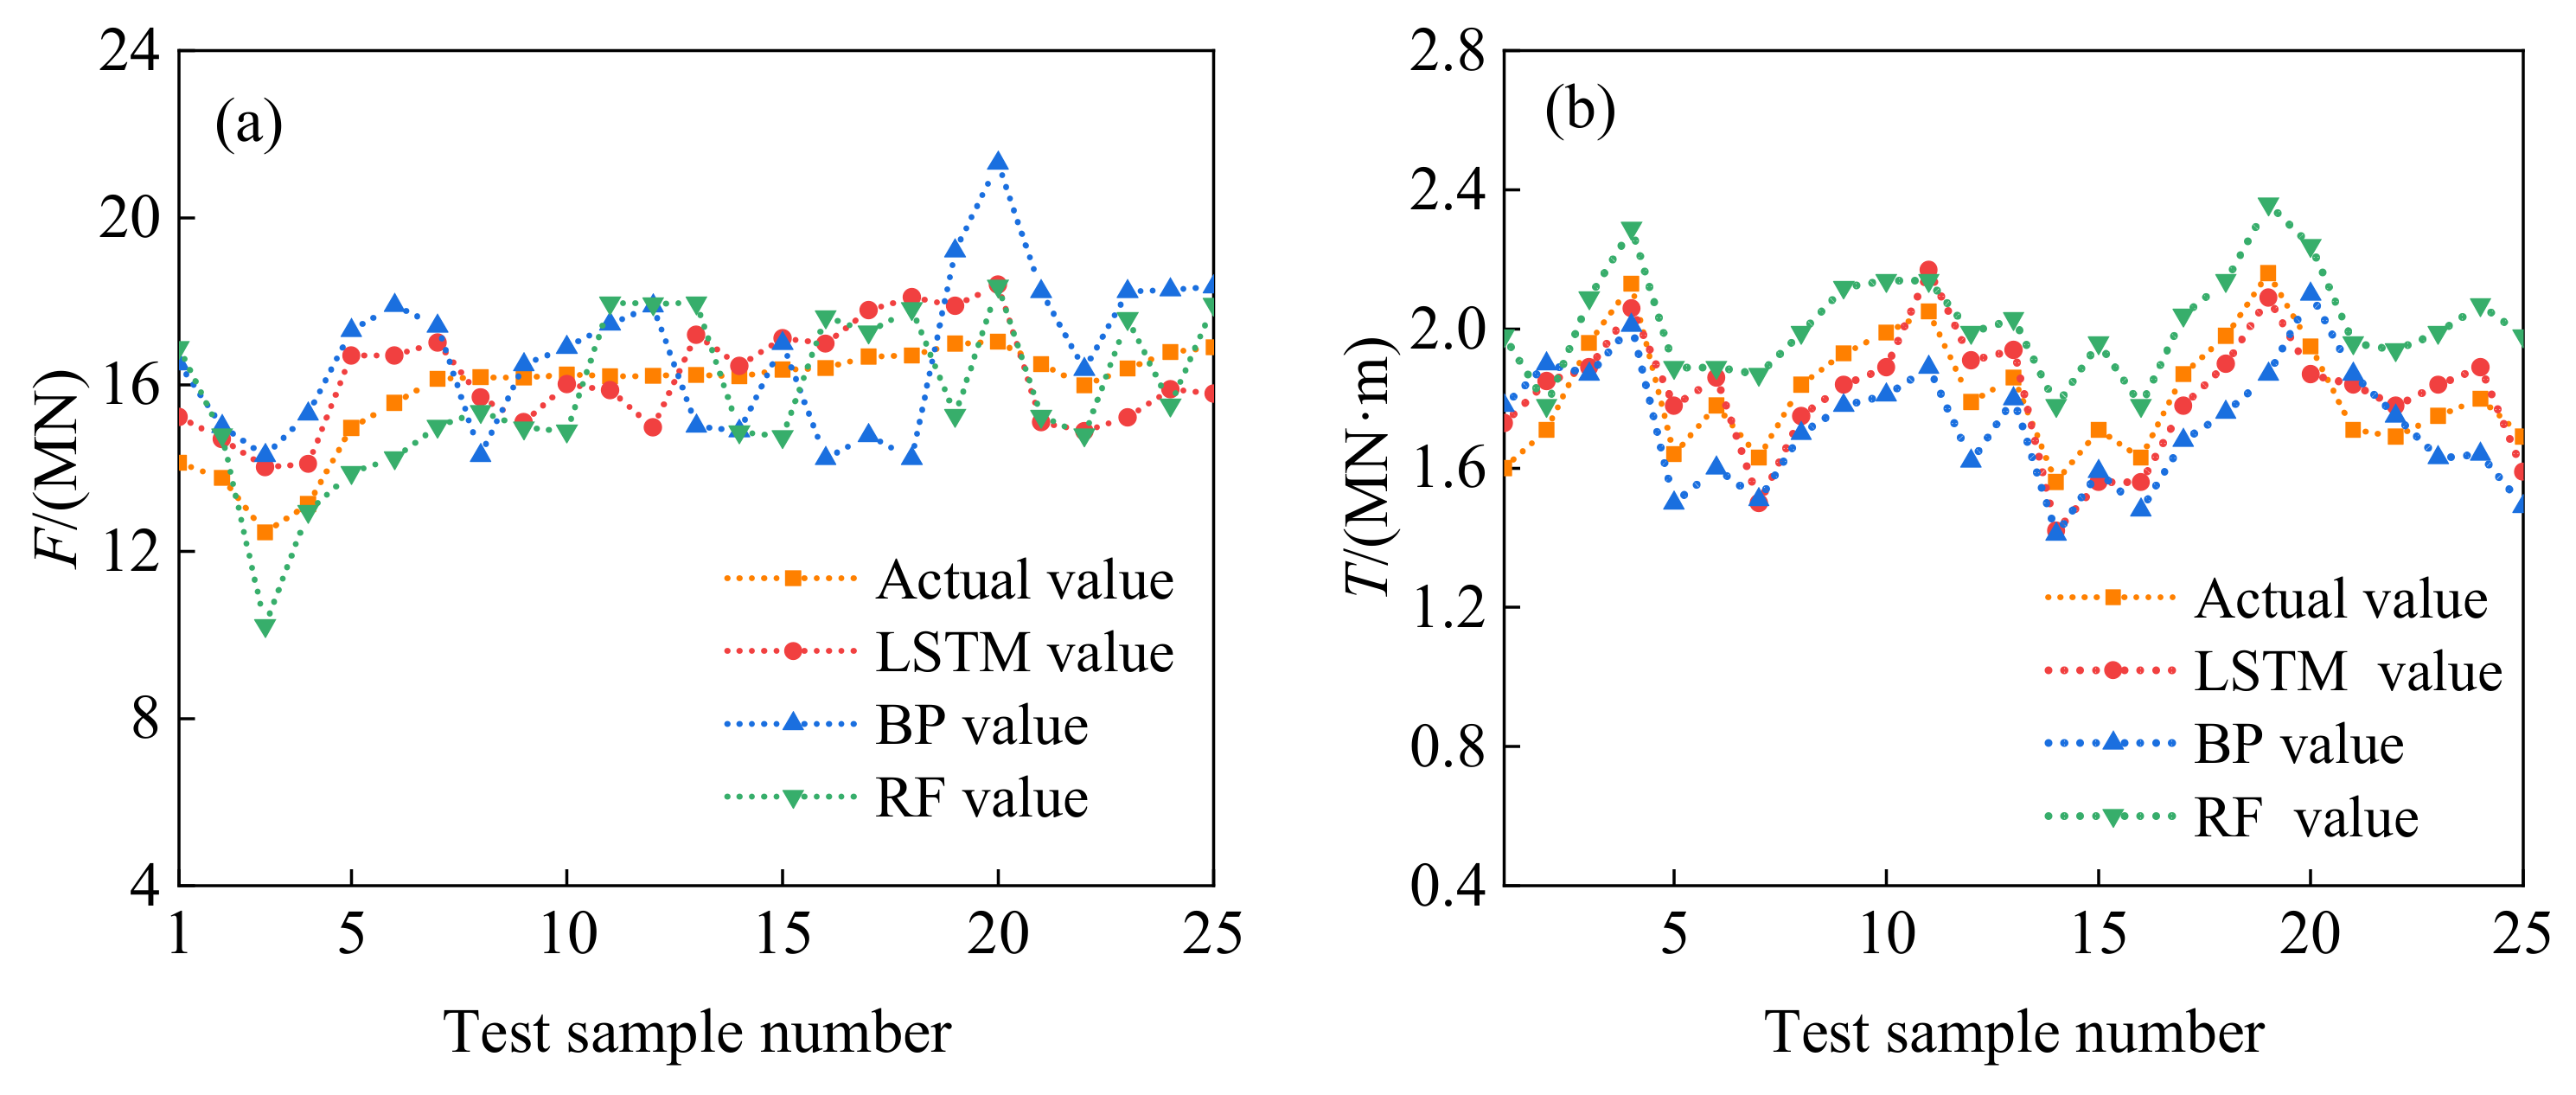
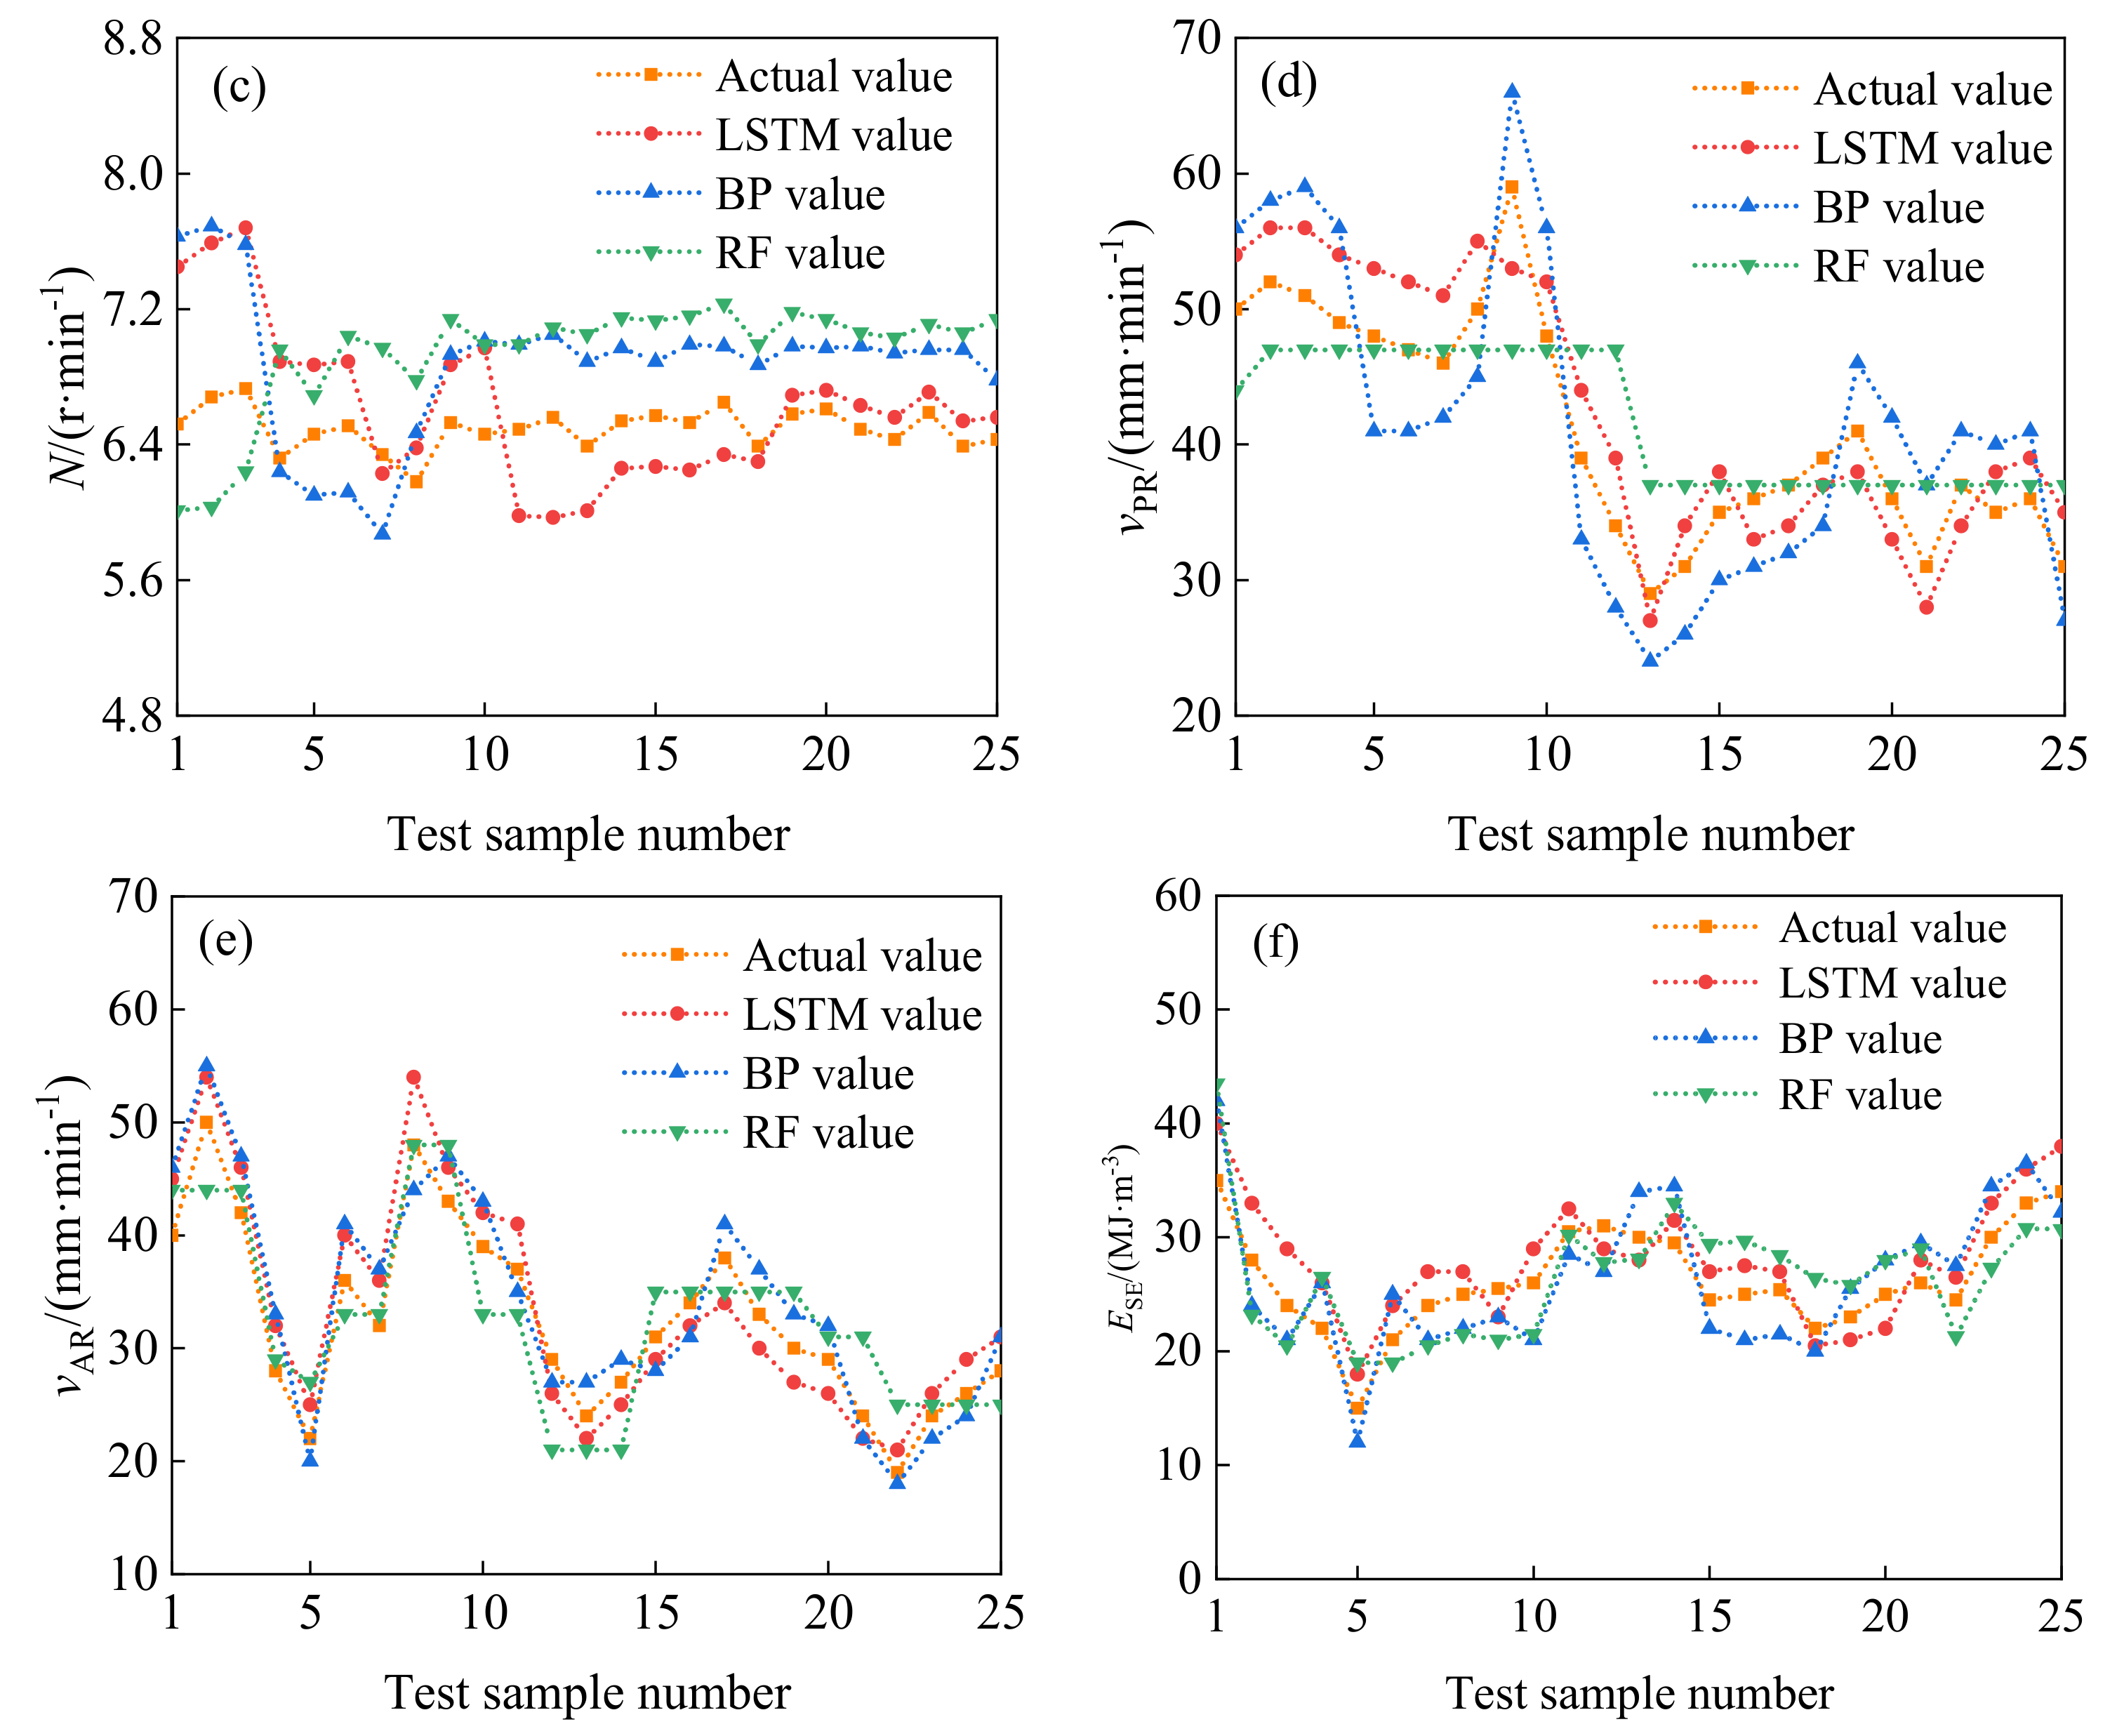
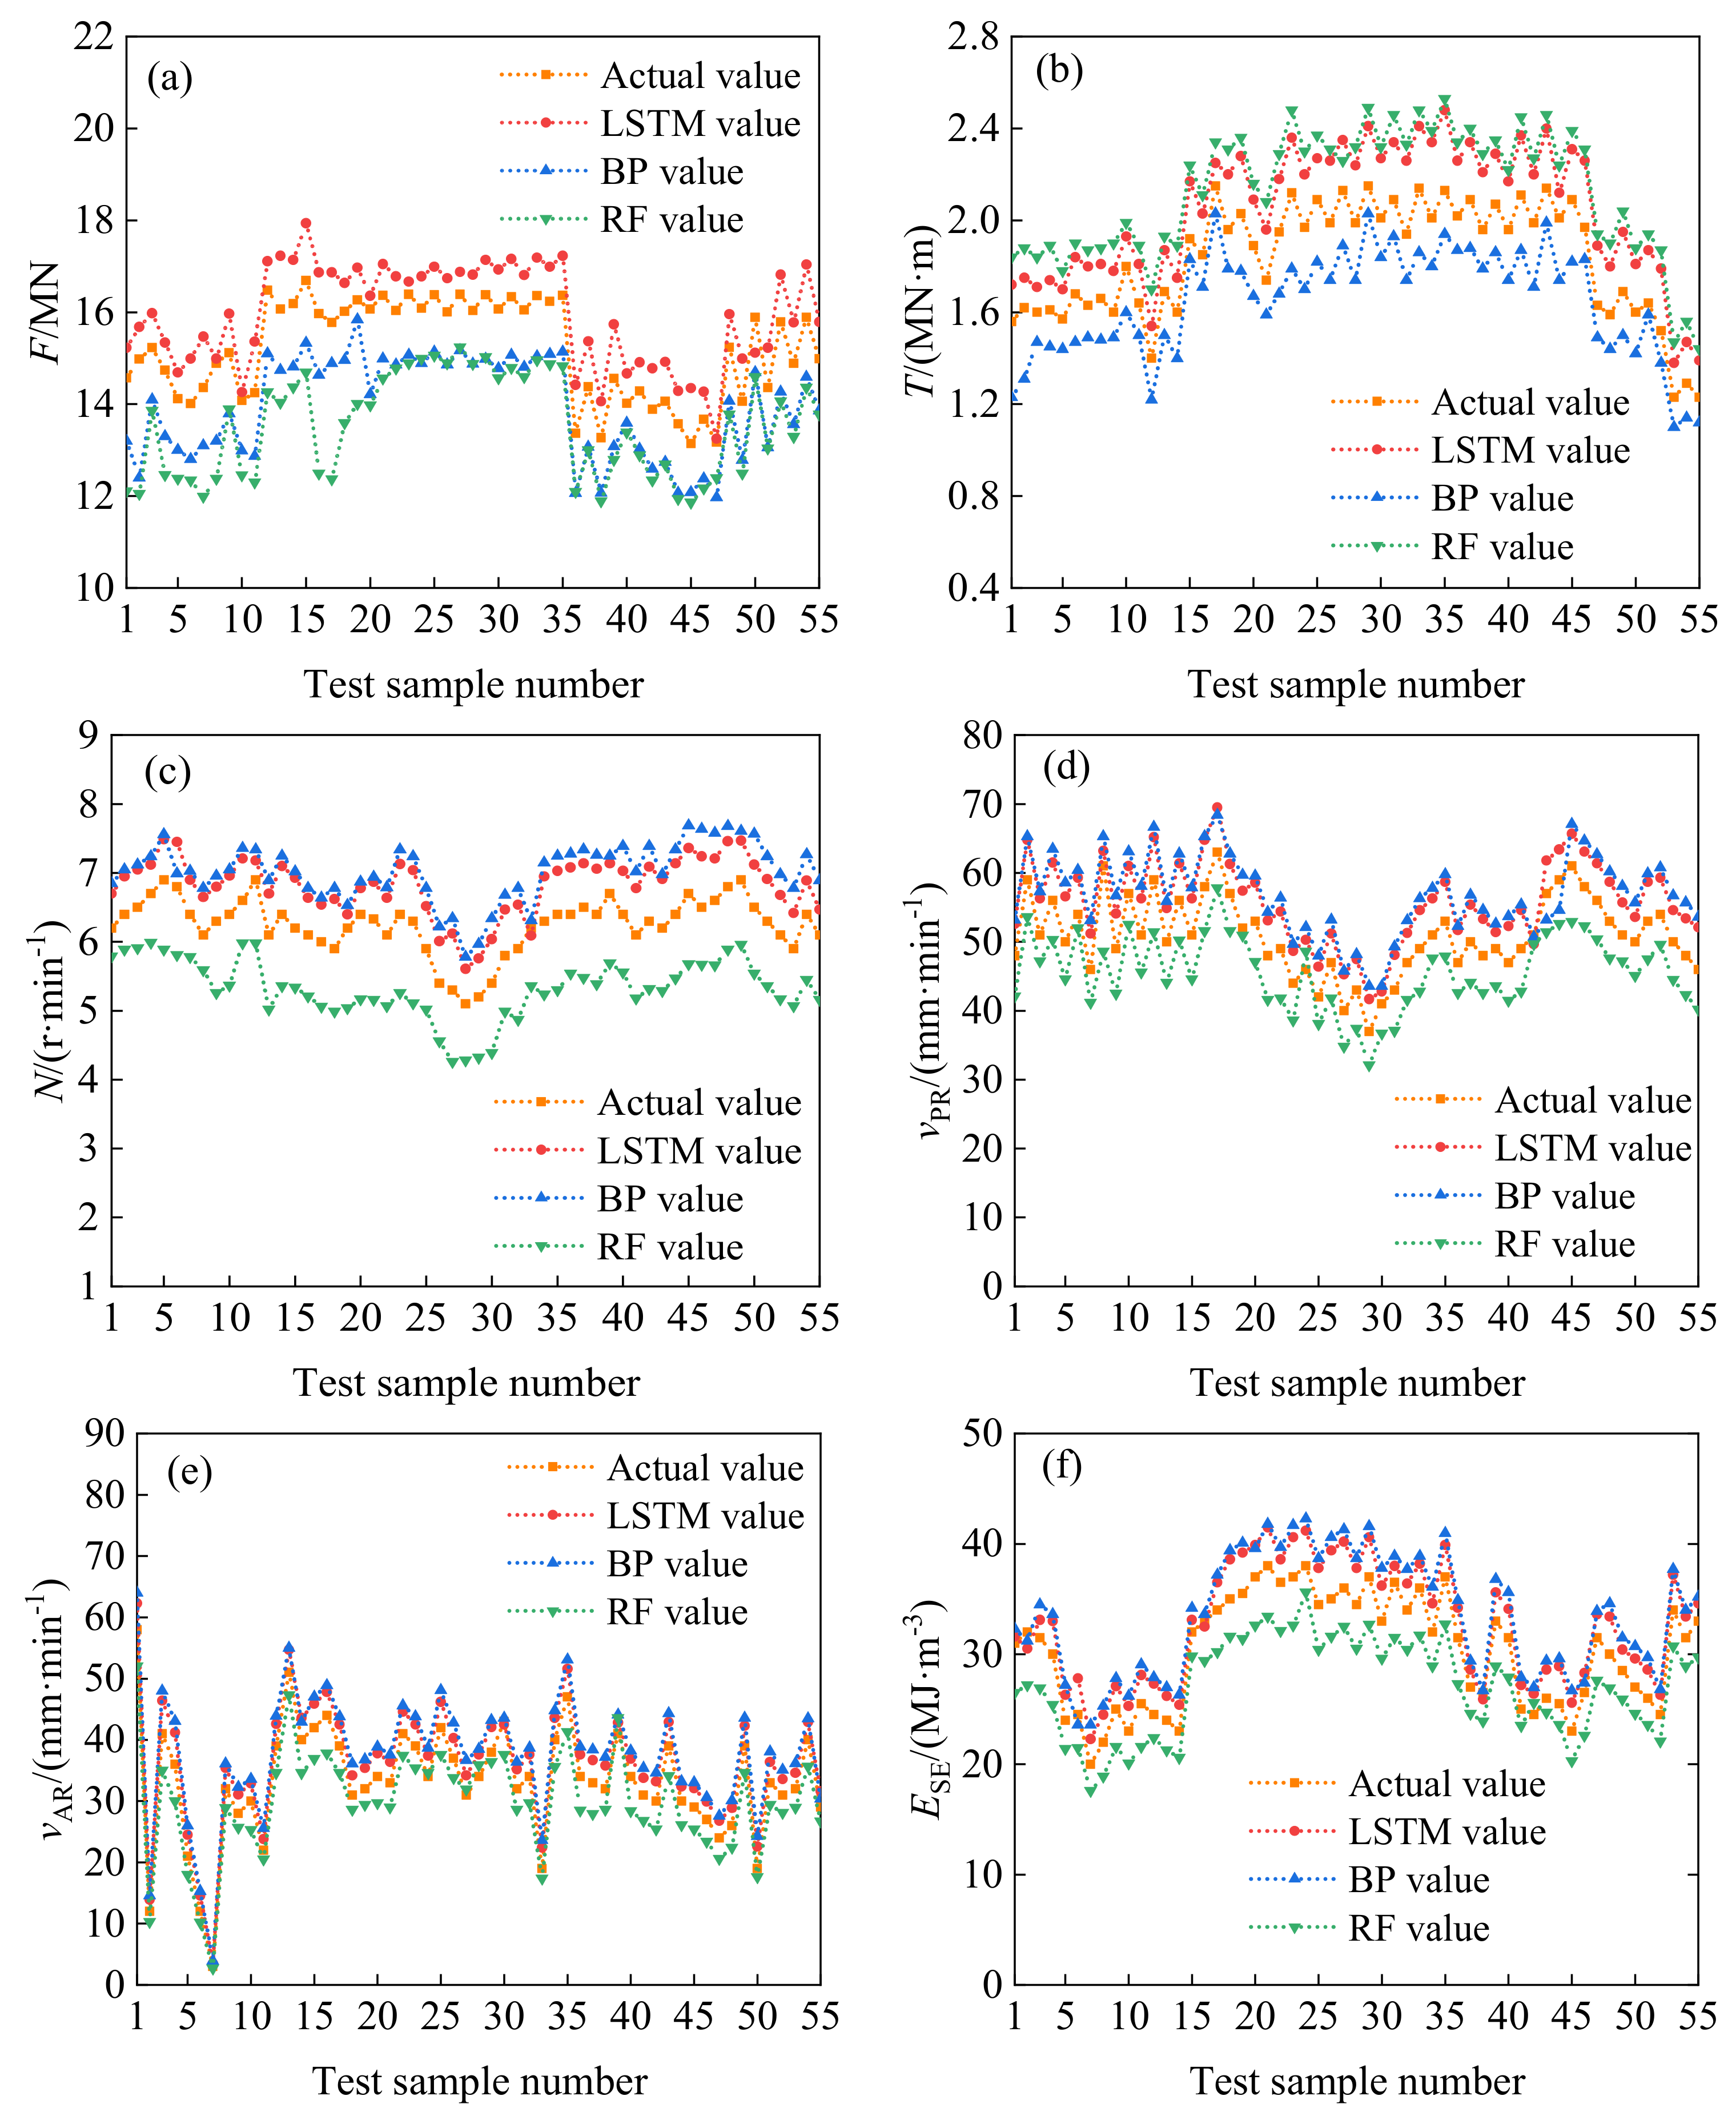
Select the last 25 groups of the Grade II surrounding rock sample sequence, the last 55 groups of the Grade III surrounding rock sample sequence, the last 20 groups of the Grade IV surrounding rock sample sequence, and the last 15 groups of the Grade V surrounding rock sample sequence as the test set, and input the remaining time series excavation data as the training set into the LSTM model, BP model, and RF model. For each level of surrounding rock, F, T, N, vPR, vAR, and ESE are used as the input variables for the model, and one of these six parameters is sequentially taken as the output variable. The predicted results of the model are shown in Figure 9, Figure 10, Figure 11 and Figure 12. The MAPE value of each excavation parameter for three models under different levels of surrounding rock is shown in Table 2.
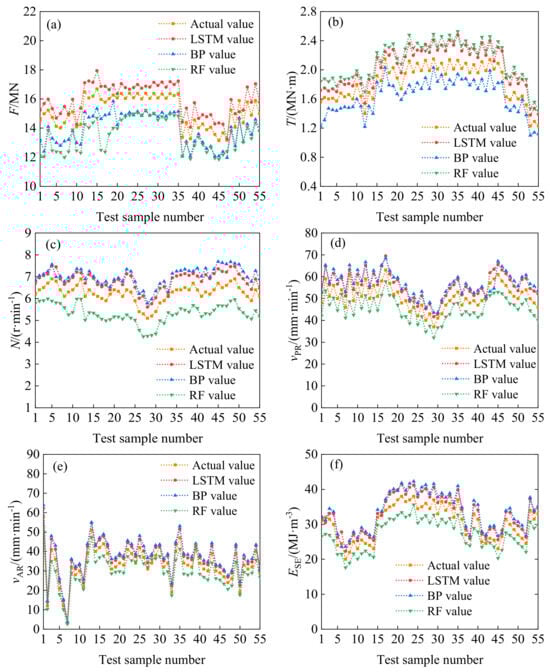
Figure 10.
The predicted and actual values of TBM driving parameters of Class III surrounding rock. (a) F; (b) T; (c) N; (d) vPR; (e) vAR; (f) ESE.
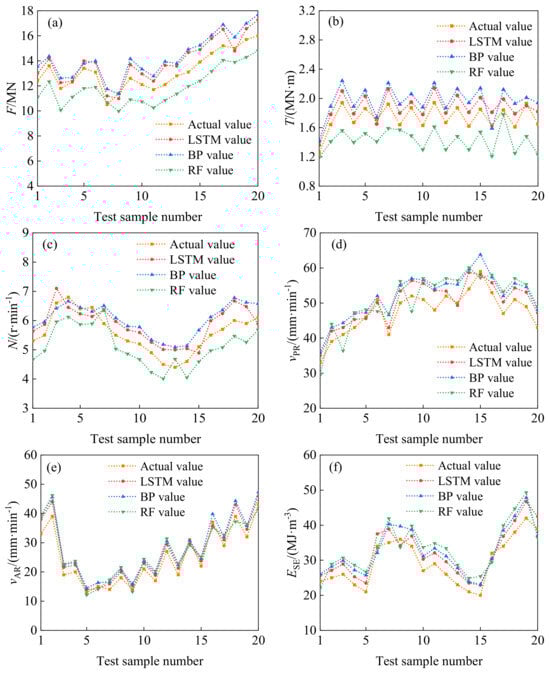
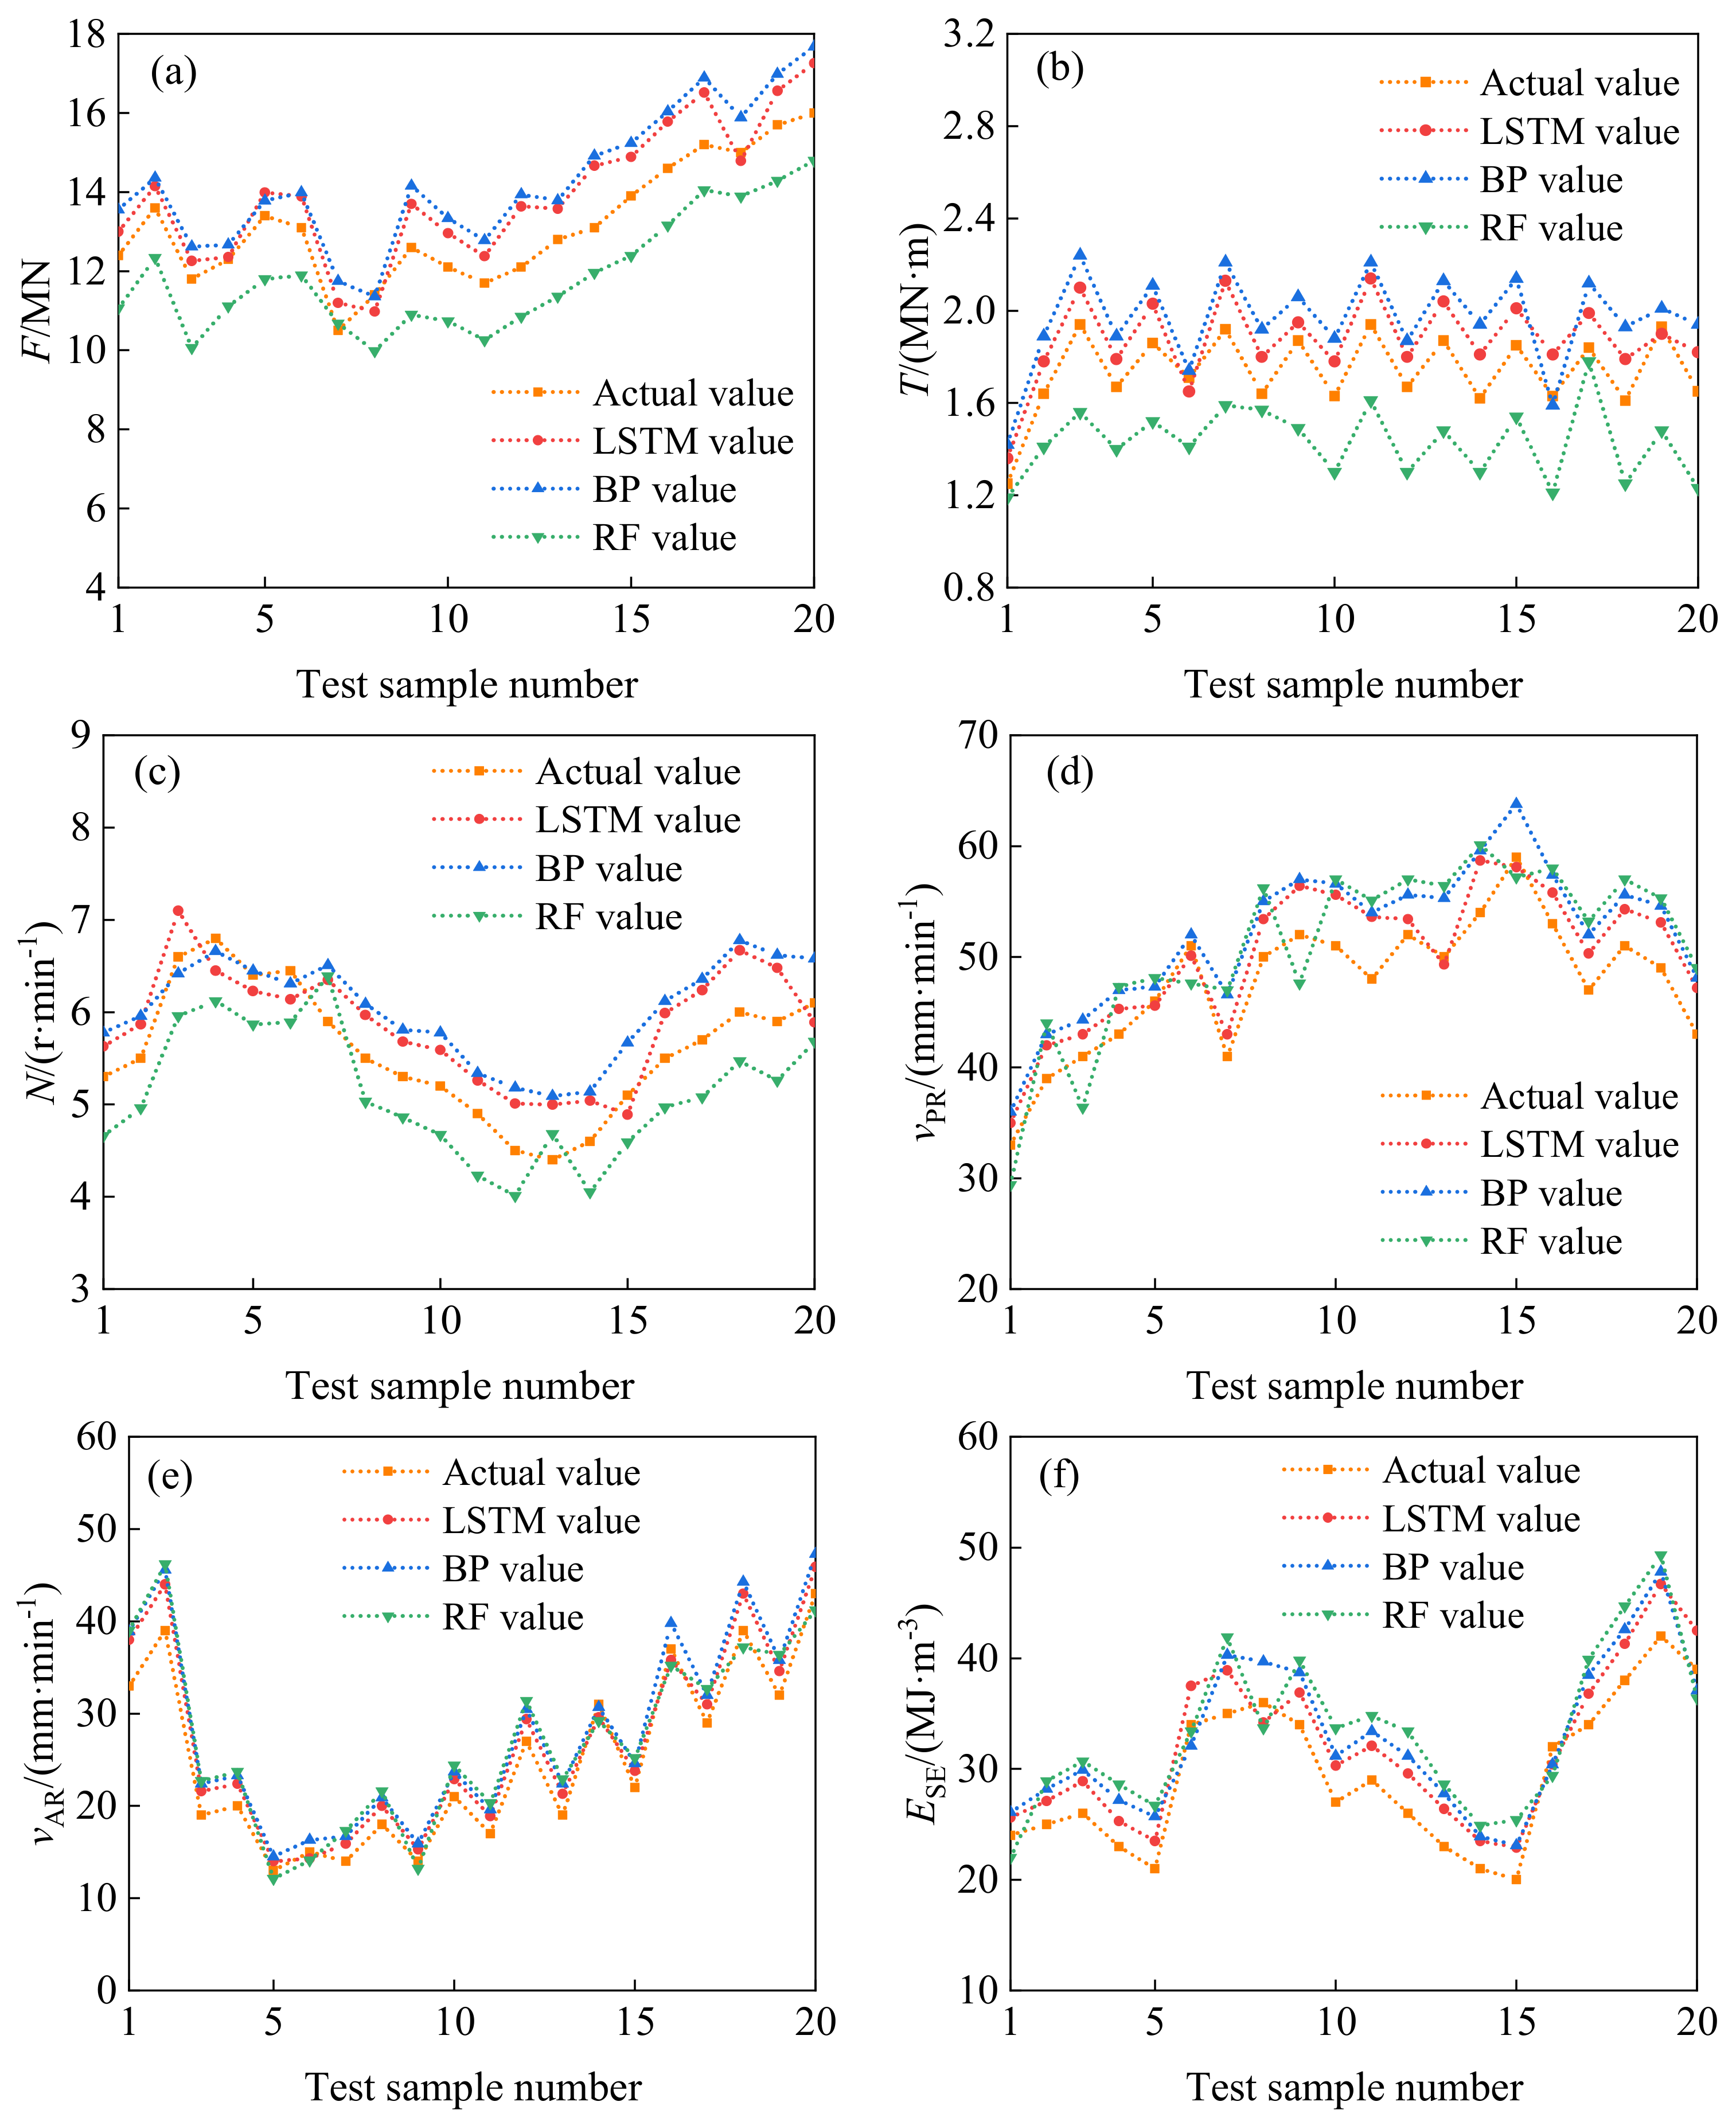
Figure 11.
The predicted and actual values of TBM driving parameters of Class IV surrounding rock. (a) F; (b) T; (c) N; (d) vPR; (e) vAR; (f) ESE.
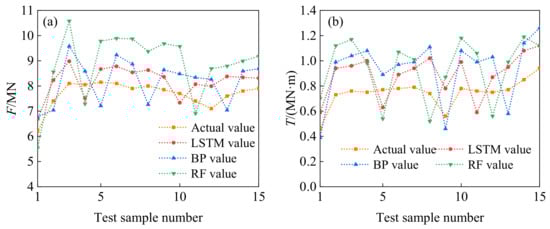
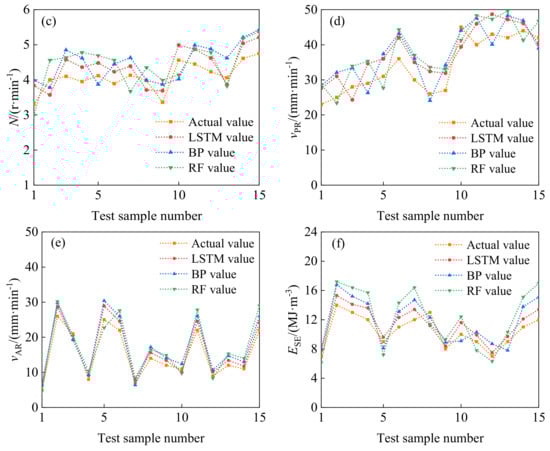
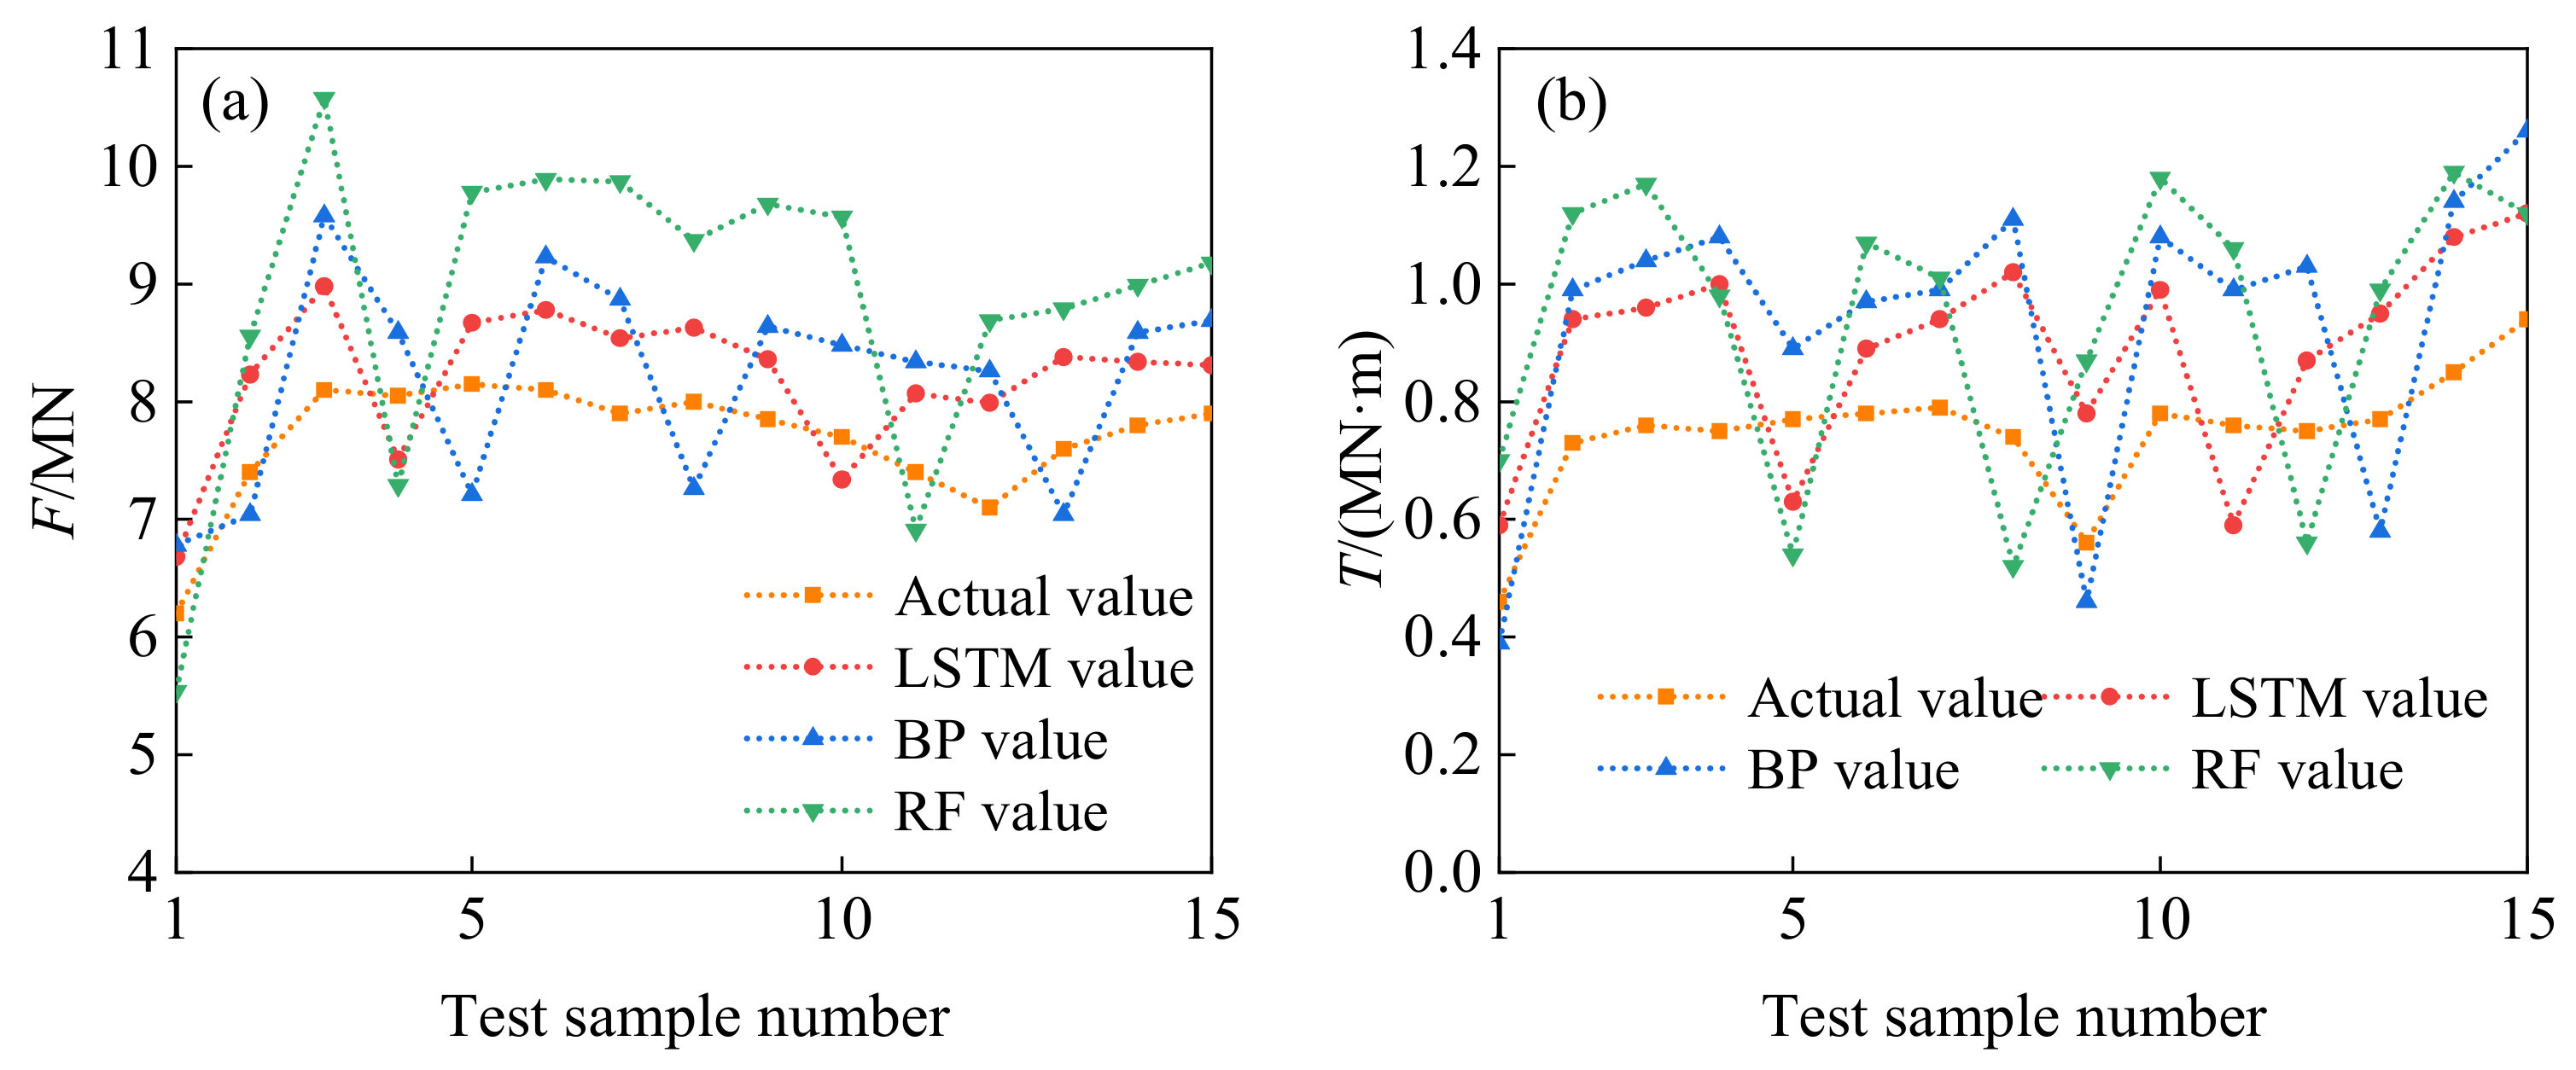
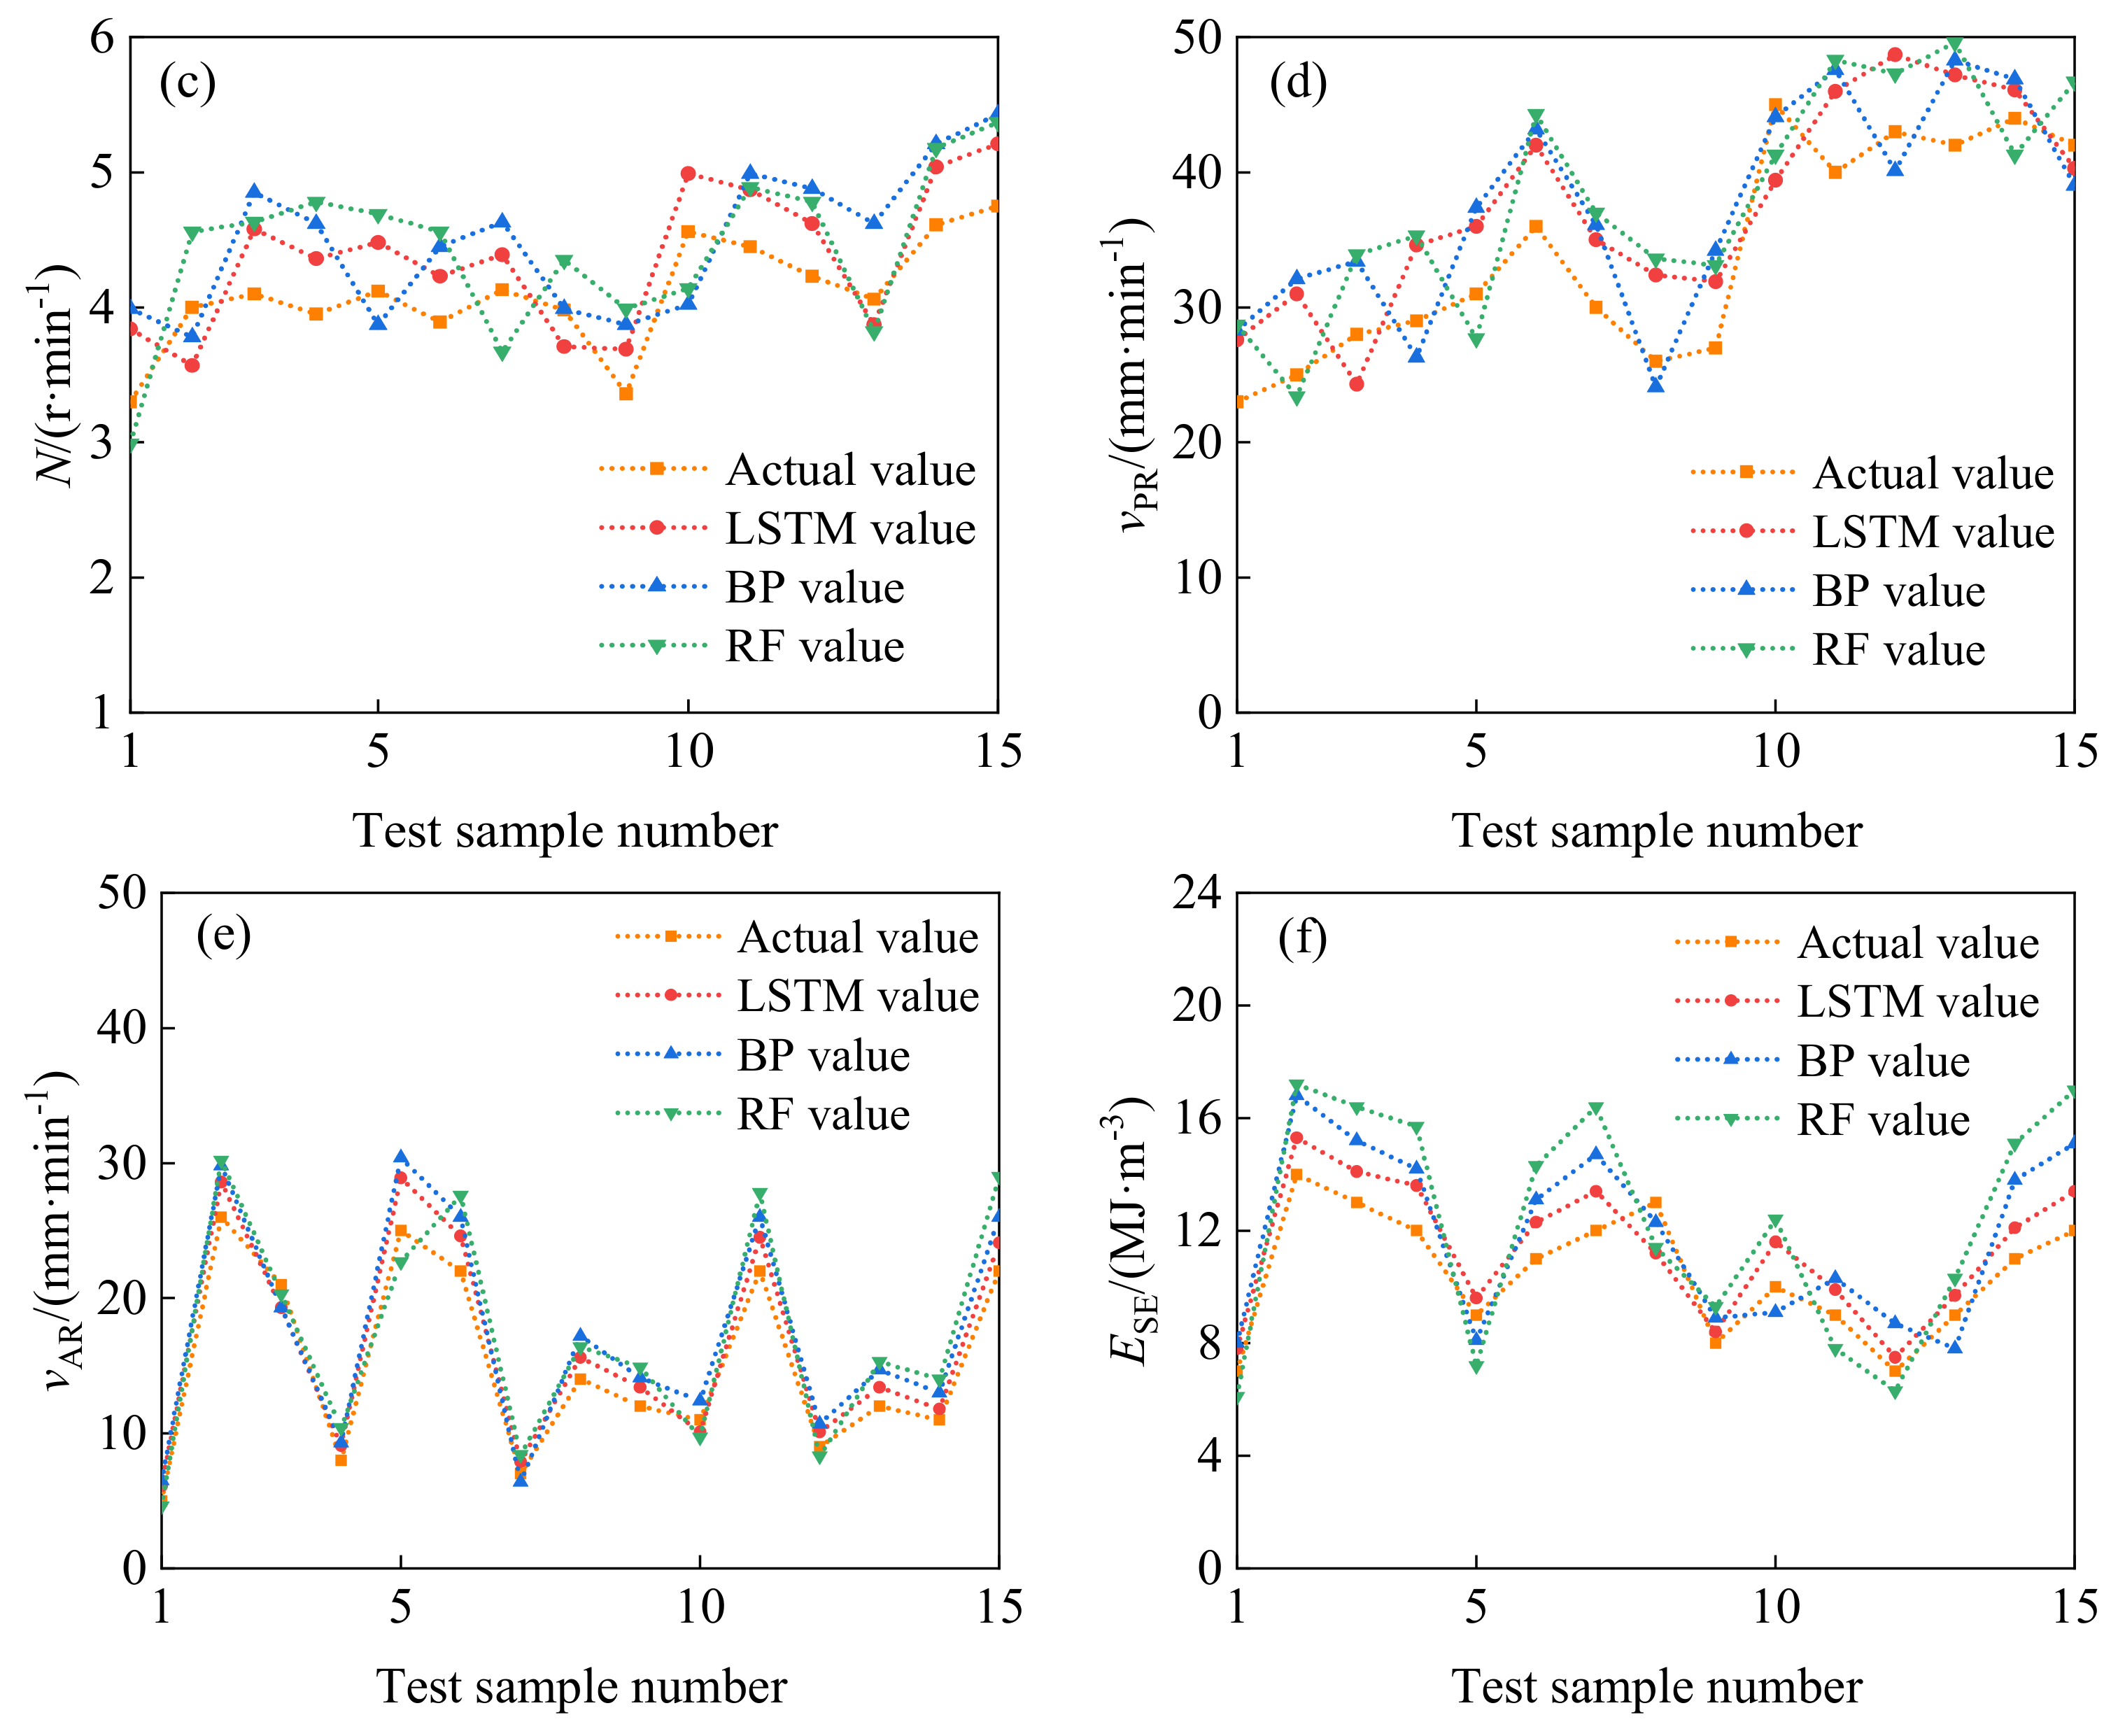
Figure 12.
The predicted and actual values of TBM driving parameters of Class V surrounding rock. (a) F; (b) T; (c) N; (d) vPR; (e) vAR; (f) ESE.
Table 2.
MAPE comparison of model prediction results.
According to Figure 9, Figure 10, Figure 11 and Figure 12 and Table 2, it can be seen that the prediction error of the LSTM model for the different excavation parameters under different levels of surrounding rock is significantly smaller than that of the BP and RF models. The MAPE value of the LSTM, BP, and RF models is 5.13%, 7.21%, and 8.08%, respectively. It can be seen that the accuracy is ranked from high to low as the LSTM model, BP model, and RF model. Therefore, the LSTM model was selected as a representative model for error analysis. The LSTM model prediction results were also evaluated using the following four indicators: relative error rate Er, goodness of fit R2, mean absolute percentage error (MAPE), and root mean square error (RMSE). The results are shown in Figure 12 and Table 3.
Table 3.
Error analysis of LSTM model prediction results.
From Figure 13, it can be observed that the range of relative error rates for predicting excavation parameters of Grade II, III, and IV surrounding rocks is between (−0.1, 0.1); for Grade V surrounding rock, except for the absolute value of the relative error rate predicted by vAR exceeding 0.2, the relative error rates of all other parameters are between (−0.2, 0.2). Moreover, the predicted data of vAR have significant volatility, but the predicted results of vAR are still within a certain range of accurate values, which can be controlled. The main reason is that the factors that affect vAR are multifaceted, including the surrounding rock conditions of the engineering site, personnel, construction planning, etc., resulting in significant randomness in the data, ultimately leading to the lowest prediction accuracy of LSTM among the six excavation parameters. The prediction accuracy of the CNN-LSTM model has been significantly improved compared to the LSTM model, indicating that the convolutional neural network has a significant optimization effect on the LSTM model. The average R2 of the LSTM model for predicting the parameters of four levels of surrounding rock is 0.9545, 0.8766, 0.8722, and 0.8286, which has a larger error compared to the CNN-LSTM model. In terms of MAPE and RMSE indicators, the prediction error values of the LSTM model are 5.13% and 146.3759, respectively, indicating that the CNN algorithm has a good optimization effect and can effectively reduce the impact of input parameter errors in LSTM.
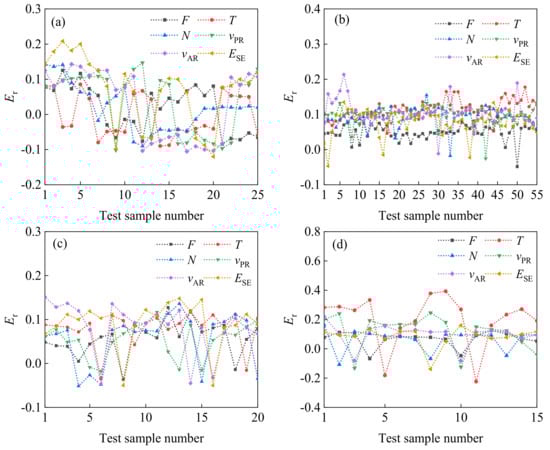
Figure 13.
Relative error rate of excavation parameters prediction for various levels of surrounding rock. (a) Grade II surrounding rock; (b) grade III surrounding rock; (c) grade IV surrounding rock; (d) grade V surrounding rock.
By comprehensively comparing the prediction and error analysis results of the CNN-LSTM model and the LSTM, BP, and RF models, it can be found that the CNN-LSTM model not only accurately predicts the trend of real-time parameters of surrounding rock excavation at all levels, but also has a relatively low prediction error rate. The surface output parameters are very consistent with the actual parameters. The LSTM model accurately predicts the trend of parameter changes, but its relative error rate in prediction is not as good as the LSTM model optimized by the CNN algorithm. However, the relative error rate of BP and RF models is larger, making it difficult to reveal the impact of rock mass grade on the accuracy of model prediction. Extensive experiments on multiple datasets have demonstrated that the CNN-LSTM-AdaBoost model performs excellently across different geological backgrounds. Since the ground conditions can be classified according to pre-construction survey data and hydropower survey design specifications, this model is also applicable to other TBM projects.
5. Conclusions
Based on the actual results of the CNN-LSTM-AdaBoost fusion prediction model for predicting TBM digging parameters and surrounding rock level, the accurate predictions of TBM digging parameters and of tunnel surrounding rock levels are essentially achieved. The conclusions are as follows:
(1) A time-series prediction model for TBM excavation parameters based on a CNN-LSTM network is proposed. A time-series prediction method for thrust, torque, rotational speed, net excavation speed, construction speed, and excavation specific energy was proposed using LSTM model for TBM crossing deep buried tunnels in gneiss and granite formations. This model has shown good application results in practical engineering and can provide reference for similar projects in the future. In practical tunnel surrounding rock detection work, the CNN-LSTM-AdaBoost model used in this study can be applied to assist in guiding parameter settings during the TBM excavation process.
(2) Compared with traditional regression prediction models, the CNN-LSTM model has higher prediction accuracy in various levels of surrounding rock and excavation parameters. The prediction results of the CNN-LSTM model provide guidance for the selection of the TBM equipment control parameters under different rock mass grades, and the relative error rate of data prediction is basically within 10%. Meanwhile, the prediction accuracy of traditional machine learning models is less than 80%, while the CNN-LSTM model is very effective as the prediction accuracy of mining parameters is about 90%, which is much higher than that of traditional machine learning models.
(3) The higher the level of surrounding rock, the higher the prediction accuracy of the CNN-LSTM model; the prediction accuracy of the construction speed is the lowest in all levels of surrounding rock; and the prediction effect of thrust and net excavation speed is the best in all levels of surrounding rock.
(4) The CNN-LSTM model has a good practical application effect in predicting the time series of TBM excavation parameters. If more dense temporal excavation data (such as the mean of excavation data per minute) can be studied for engineering cases with different types of TBM and different rock formations in the future, and the sample database can be expanded, a more comprehensive prediction model can be obtained to better guide TBM construction.
Author Contributions
Conceptualization, Y.J. and C.P.; methodology, C.P.; software, M.D.; validation, M.D., P.Z. and C.P.; formal analysis, X.C.; investigation, M.D.; resources, M.D.; data curation, Y.J.; writing—original draft preparation, Y.J.; writing—review and editing, M.D.; visualization, M.D.; supervision, M.D.; project administration, C.P.; funding acquisition, C.P. All authors have read and agreed to the published version of the manuscript.
Funding
This work was supported by the China National Natural Science Foundation (No. 52008383).
Data Availability Statement
The data that support the findings of this study are available from the corresponding author upon reasonable request.
Conflicts of Interest
Author Chengyuan Pei was employed by the company Xinjiang Water Conservancy Development and Construction Group Co., Ltd. The remaining authors declare that the research was conducted in the absence of any commercial or financial relationships that could be construed as a potential conflict of interest.
References
- Liu, Q.S.; Liu, J.P.; Pan, Y.C. Research progress on performance prediction model of hard rock tunnel boring machine. J. Rock Mech. Eng. 2016, 35, 2766–2786. [Google Scholar]
- Xue, Y.G.; Kong, F.M.; Yang, W.M. Major adverse geological conditions and engineering geological problems along the Sichuan-Tibet Railway. J. Rock Mech. Eng. 2020, 39, 445–468. [Google Scholar]
- Zhang, Y.J.; Pu, S.J.; Zhou, H. Some advances in key technologies for safe construction and efficient operation of central Yunnan water diversion project-underground engineering. Rock Mech. Eng. 2024, 43, 333–357. [Google Scholar] [CrossRef]
- Wu, X.L.; Zhang, X.P.; Liu, Q.S. TBM rock mass drivability prediction and classification. Geotech. Mech. 2020, 41, 1721–1729+1739. [Google Scholar]
- Liu, Y.R.; Hou, S.K.; Cheng, L. Advances and key technologies in intelligent construction of water conservancy projects. Water Conserv. Hydropower Technol. 2022, 53, 1–20. [Google Scholar]
- Xu, Q.; Huang, X.; Zhang, B. TBM performance prediction using LSTM-based hybrid neural network model: Case study of Baimang River tunnel project in Shenzhen, China. Undergr. Space 2023, 11, 130–152. [Google Scholar] [CrossRef]
- Saeed, M.H.; Mehdi, P.; Mohsen, K.L. Attenuated orthotropic time-domain half-space BEM for SH-wave scattering problems. Geophys. J. Int. 2022, 229, 1881–1913. [Google Scholar]
- Panji, M.; Mojtabazadeh-Hasanlouei, S.; Fakhravar, A. Seismic Response of the Ground Surface Including Underground Horseshoe-Shaped Cavity. Transp. Infrastruct. Geotech. 2022, 9, 338–355. [Google Scholar] [CrossRef]
- Gao, X.; Shi, M.; Song, X. Recurrent neural networks for real-time prediction of TBM operating parameters. Autom. Constr. 2019, 98, 225–235. [Google Scholar] [CrossRef]
- Liu, B.; Wang, R.; Zhao, G. Prediction of rock mass parameters in the TBM tunnel based on BP neural network integrated simulated annealing algorithm. Tunn. Undergr. Space Technol. 2020, 95, 103103. [Google Scholar] [CrossRef]
- Hou, S.; Liu, Y. Early warning of tunnel collapse based on Adam-optimised long short-term memory network and TBM operation parameters. Eng. Appl. Artif. Intell. 2022, 112, 104842. [Google Scholar] [CrossRef]
- Zhang, Q.; Zhu, Y.; Ma, R. Prediction method of TBM tunneling parameters based on PSO-Bi-LSTM model. Front. Earth Sci. 2022, 10, 854807. [Google Scholar] [CrossRef]
- Zhang, Z.M.; Li, X.Y.; Ji, J. TBM excavation parameter prediction model based on LS-SVM method. J. Hohai Univ. (Nat. Sci.) 2021, 49, 373–379. (In Chinese) [Google Scholar]
- Qiu, D.H.; Fu, K.; Xue, Y.G.; Li, Z.Q.; Li, G.K.; Kong, F.M. LSTM time series prediction model for TBM tunneling parameters of deep buried tunnels and its application. J. Cent. South Univ. (Nat. Sci. Ed.) 2021, 52, 2646–2660. [Google Scholar]
- Man, K.; Wu, L.W.; Liu, X.L.; Song, Z.F.; Li, K.N. The prediction of TBM tunnel boring parameters and rockburst grade based on CNN-LSTM model. Coal Sci. Technol. 2023, 1–19. (In Chinese) [Google Scholar]
- Ma, S.W.; Li, S.D.; Li, X. KNN method for intelligent dynamic classification of tunnel rock mass quality. Eng. Geol. 2020, 28, 1415–1424. [Google Scholar]
- Hou, S.; Liu, Y.; Yang, Q. Real-time prediction of rock mass classification based on TBM operation big data and stacking technique of ensemble learning. J. Rock Mech. Geotech. Eng. 2022, 14, 123–143. [Google Scholar] [CrossRef]
- Latif, K.; Sharafat, A.; Seo, J. Digital Twin-Driven Framework for TBM Performance Prediction, Visualization, and Monitoring through Machine Learning. Appl. Sci. 2023, 13, 11435. [Google Scholar] [CrossRef]
- Afradi, A.; Ebrahimabadi, A.; Hallajian, T. Prediction of Tunnel Boring Machine Penetration Rate Using Ant Colony Optimization, Bee Colony Optimization and the Particle Swarm Optimization, Case Study: Sabzkooh Water Conveyance Tunnel. Min. Miner. Depos. 2020, 14, 75–84. [Google Scholar] [CrossRef]
- Latif, K.; Sharafat, A.; Park, S.; Seo, J. Digital Twin-Based Hybrid Approach to Visualize the Performance of TBM. In Proceedings of the KSCE, Busan, Republic of Korea, 20 October 2022; pp. 3–4. [Google Scholar]
- An, X.F.; Zheng, F.; Jiao, Y.Y.; Li, Z.; Zhang, Y.; He, L.L. Optimized Machine Learning Models for Predicting Crown Convergence of Plateau Mountain Tunnels. Transp. Geotech. 2024, 46, 101254. [Google Scholar] [CrossRef]
- Zhou, X.X.; Gong, Q.M.; Yin, L.J. Prediction of tunneling parameters of TBM stable section based on BLSTM-AM model. J. Rock Mech. Eng. 2020, 39, 3505–3515. [Google Scholar]
- Li, P.F.; Zhang, J.; Krebs, P. Prediction of Flow Based on a CNN-LSTM Combined Deep Learning Approach. Water 2022, 14, 993. [Google Scholar] [CrossRef]
Disclaimer/Publisher’s Note: The statements, opinions and data contained in all publications are solely those of the individual author(s) and contributor(s) and not of MDPI and/or the editor(s). MDPI and/or the editor(s) disclaim responsibility for any injury to people or property resulting from any ideas, methods, instructions or products referred to in the content. |
© 2024 by the authors. Licensee MDPI, Basel, Switzerland. This article is an open access article distributed under the terms and conditions of the Creative Commons Attribution (CC BY) license (https://creativecommons.org/licenses/by/4.0/).