Article

Study on Key Parameters and Design Methods for the Density-Mix Proportion of Rubber-Foamed Concrete

1
School of Science, Chang’an University, Xi’an 710064, China
2
School of Traffic Engineering, Xi’an Vocational University of Automobile, Xi’an 710600, China
3
School of Business, Fuyang Normal University, Fuyang 236037, China
4
Scegc Mechanized Construction Group Co., Ltd., Xi’an 710032, China
5
Research Institute of Chinese Lacquer under All-China Federation of Supply, Xi’an 710064, China
*
Author to whom correspondence should be addressed.
Buildings 2024, 14(8), 2468; https://doi.org/10.3390/buildings14082468 (registering DOI)
Submission received: 9 July 2024 / Revised: 3 August 2024 / Accepted: 5 August 2024 / Published: 10 August 2024
(This article belongs to the Section Building Materials, and Repair & Renovation)

Abstract

:
Rubber-foamed concrete demonstrates exceptional toughness, a low elastic modulus, and significant sensitivity to density. It is necessary to parameterize the density mix of rubber-foaming concrete to meet engineering design requirements. Density-mix design methods for foaming concrete rely mainly on empirical knowledge or trial-and-error approaches. In this paper, with numerous parametric tests and regression analysis based on general principles for density-mix designs applicable to both foamed and rubber-foamed concretes, the key design parameters, such as volume correction coefficient, rubber size effect coefficient, and water-reducing agent effect coefficient, have been proposed in order to optimize their respective densities more accurately. The tests demonstrated an optimal water-to-cement ratio of 0.45, corresponding to a volume correction factor of 1.027. Incorporating rubber particles and water-reducing agents has a more significant effect on the cement-paste volume. Controlling fluidity in the 200 to 300 mm range is crucial when designing foamed concrete with varying densities. The regression equation accurately predicts the paste’s measured volume and wetting density by incorporating volume corrections, size, and water reduction effect coefficients. By employing a foam excess coefficient of 1.1 and a mass coefficient of 1.25, the dry and wet density error of foam concrete is less than 5%. A comprehensive framework for optimizing mix design in terms of density is provided for applications in foamed concrete and rubber-foamed concrete, facilitating researchers in designing mix ratios for additional novel mixture-based foamed-concrete applications.

1. Introduction

The limited application of low- and ultra-low-density foamed concrete in load-bearing structures is primarily attributed to its porous structure and low strength grade. Nevertheless, due to its remarkable thermal resistance and inherent fire resistance, it has emerged as the preferred non-structural inorganic thermal insulation material [1,2,3]. The application areas of high-density foamed concrete encompass pit backfilling, embankment elevation [4,5], collision prevention [6,7], explosion impact resistance [8,9], and other fields necessitating cushioning and energy absorption. In order to meet these requirements, foamed concrete should possess a specific load-bearing capacity. In recent years, the concept of structural, functional integration of foamed concrete materials has gradually shifted people’s performance requirements for these materials. Initially focused on thermal insulation and lightweight properties with high strength, there is an increasing emphasis on enhancing its functional characteristics while still meeting specific mechanical properties. This development necessitates achieving a higher balance level among various foamed concrete properties.
The compressive strength of foamed concrete, the crucial mechanical parameter, has consistently been the focal point for numerous scholars. Majeed et al. [10] confirmed a noticeable increase in the mechanical properties of ultra-lightweight foamed concrete, with respective improvements in the 28-day compressive, split tensile, and flexural strengths of up to 70.49%, 76.19%, and 51.51%, respectively. Liu et al. [11] conducted an orthogonal experimental design to perform a compressive strength test on fast-hardening foamed-concrete mixtures. They determined the optimal ratio of fast-hardening cement content using range and variance analysis based on the compressive strength values obtained on the first and third days. The porosity of foamed concrete is identified as the primary factor significantly influencing its compressive strength and thermal conductivity, while the dry density is a vital physical indicator characterizing its porosity. Othman et al. [12] conducted experimental research to investigate the correlation between compressive strength and high-density foam-concrete density, revealing an inverse relationship between water–cement ratio and density. Savenkov et al. [13] proposed an analytical expression for calculating the strength of foamed concrete within a range of average densities from 300 to 900 kg/m3. Zhang et al. [14] developed a predictive equation to estimate changes in the compressive strength of foamed concrete based on variations in density, number of freeze–thaw cycles, and constant pressure values, as well as considering the impact of coupled loads on its strength behavior.
It has been shown that foam concrete’s compressive strength is directly related to its dry density; as the density decreases, the compressive strength also decreases [4,15,16]. The foam volume is the most notable parameter controlling the compressive strength of foam concretes. Increasing the foam volume promotes air entrained in concrete, reducing compressive strength [17].
The density variation of the material is influenced by a combination of multiple factors; however, it is imperative to maintain the density of foamed concrete within a narrow range around the target value [18]. Furthermore, the pore structure characteristics of foamed concrete, including pore size, void distribution, and pore shape [19,20,21], are influenced by various factors such as mixture composition [20,22,23,24,25,26], preparation process [27], foam stability [28,29], ambient temperature [30], and others at equivalent density levels. These features also have diverse impacts on mechanical properties. Notably, foam stability can be classified into static and dynamic parameters after mixing with cement paste.
Regarding engineering applications, foamed concrete can be utilized as a non-load-bearing component and thermal insulation material due to its adjustable strength and thermal conductivity. It can also serve as a material with specific load-bearing requirements, thereby enhancing the functional properties of foamed concrete. These two crucial parameters are susceptible to changes in dry density. Consequently, unlike the mix design criteria based on the strength of ordinary concrete, the mix design for foamed concrete often focuses on controlling dry density. Based on this principle, upper and lower limits for measured compressive strength values, thermal conductivity, and other physical and mechanical indicators corresponding to different density levels are specified to cater to diverse engineering application needs.
As a lightweight porous material, the investigation into the energy absorption characteristics of foamed concrete has garnered increasing attention from scholars. Incorporating rubber powder can enhance the toughness of concrete materials [31], decrease the elastic modulus, and augment high energy dissipation capacity [32]. The compressive strength [33] and dry density [34,35] of foamed concrete exhibit a declining trend with increased rubber powder content. However, compared to rubber powder content, the quantity of foam added remains the most crucial factor influencing both density and mechanical properties in foamed-rubber concrete [36]. Rubber-foamed concrete demonstrates significant sensitivity to density regarding impact resistance [37]. Therefore, studying the influence of rubber particle size and content on foamed concrete is highly imperative.
Currently, the foamed-concrete density-mix ratio design primarily relies on the mass method and an empirical formula [28,38,39,40] derived from mathematical statistics. However, due to variations in cement types, physical parameters, and other admixtures, a significant discrepancy often exists between the measured dry density and the designed dry density of foamed concrete prepared according to these empirical parameters [41]. Some researchers have also proposed a polynomial regression model based on experimental data that considers density and strength as output variables and admixture amount as input variables. This model establishes statistical relationships between input and output variables while obtaining polynomial regression coefficients [42]. Nevertheless, differences in material properties can compromise the accuracy of such regression equations, rendering their coefficients devoid of clear physical significance. Consequently, they cannot be effectively applied to foam-concrete mix-ratio design.
Scholars often rely on previous experience or multiple trials and errors to determine the density-mix ratio of foamed concrete. However, this approach introduces testing uncertainties and increases test costs when specimens fail to meet the required density [12,27,43]. Furthermore, the literature lacks explicit calculation methods and design principles for different density-mix ratios, even in the experimental design section [3,44].
There is limited research on the precise control of dry density in foamed and rubber-foamed concrete domestically and internationally. Many studies primarily focus on investigating the macroscopic mechanical behavior of foamed concrete incorporating rubber particles while disregarding the influence of particle size and dosage on density. This study addresses this research gap by focusing on existing density design criteria for foamed concrete, considering the characteristics of the various materials used in this investigation. By adhering to the principle of total mass consistency per unit volume and aiming for precise control over dry density, we thoroughly examine the impact of rubber content and particle size on the mix ratio for foamed-rubber concrete. Through more accurate parameter optimization design, we propose a comprehensive process for designing density-mix ratios in foamed and rubber-foamed concrete. The resulting designs and preparations using this method will enable densities to be achieved closer to their intended targets.

2. Materials and Methods

2.1. Cementitious Material

The cementitious materials for preparing foam concrete include P.O.42.5 ordinary Portland cement, Grade-I fly ash, and silica fume. The ordinary Portland cement provided by Jidong Cement Tongchuan Co., Ltd., Tongchuan, China, the fly ash and silica fume provided by Henan Hougang Thermal Power Plant Co., Ltd. (Zhengzhou, China) and Sichuan Langtian Silica Fume Manufacturing Co., Ltd. (Chengdu, China), respectively. These materials’ physical properties and composition are consistent with those described in reference [45].

2.2. Additional Materials

The water-reducing agent employed is polycarboxylate superplasticizer (PCE), with a 19% reduction rate for cement mortar and a 32% reduction rate for concrete. The foam agent used in the experiment was consistent with that described in reference [45]. The relevant properties were tested following the Chinese foam-concrete industry standard [46]: the dilution ratio was 1:20, achieving a foaming multiple of 33~34, and foam density was 31 kg/m3. After one hour, there was precipitation at a distance of 7.5 mm, and bleeding occurred at a rate of 55.3 mL, while the foam’s half-evaporation time and full evaporation time were measured as 147 min and 275 min, respectively. All performance indicators of the foaming agent met current standards [46]. The rubber used in the experiment was obtained from Sichuan Huayi Rubber Co., Ltd., China, with particle sizes of 10 mesh, 20 mesh, 40 mesh, and 80 mesh. The physical properties of the rubber powder are as follows: a reduction of 0.63% after heating, an ash content of 6.78%, an iron content of 0.023%, and a sieve residue of 0.012%.
Before testing, pretreatment of the rubber particles with sodium hydroxide solution was conducted to enhance adhesion between the rubber and cement interface. The pretreatment process involved washing the rubber particles with tap water to remove impurities and dust from their surface, immersing them in a solution containing 10% NaOH for 30 min, filtering the solution, rinsing and stirring them in water, and air drying. This methodological approach facilitates improved bonding between concrete and rubber particles through surface treatment using sodium hydroxide solution. The treatment process for rubber is illustrated in Figure 1.

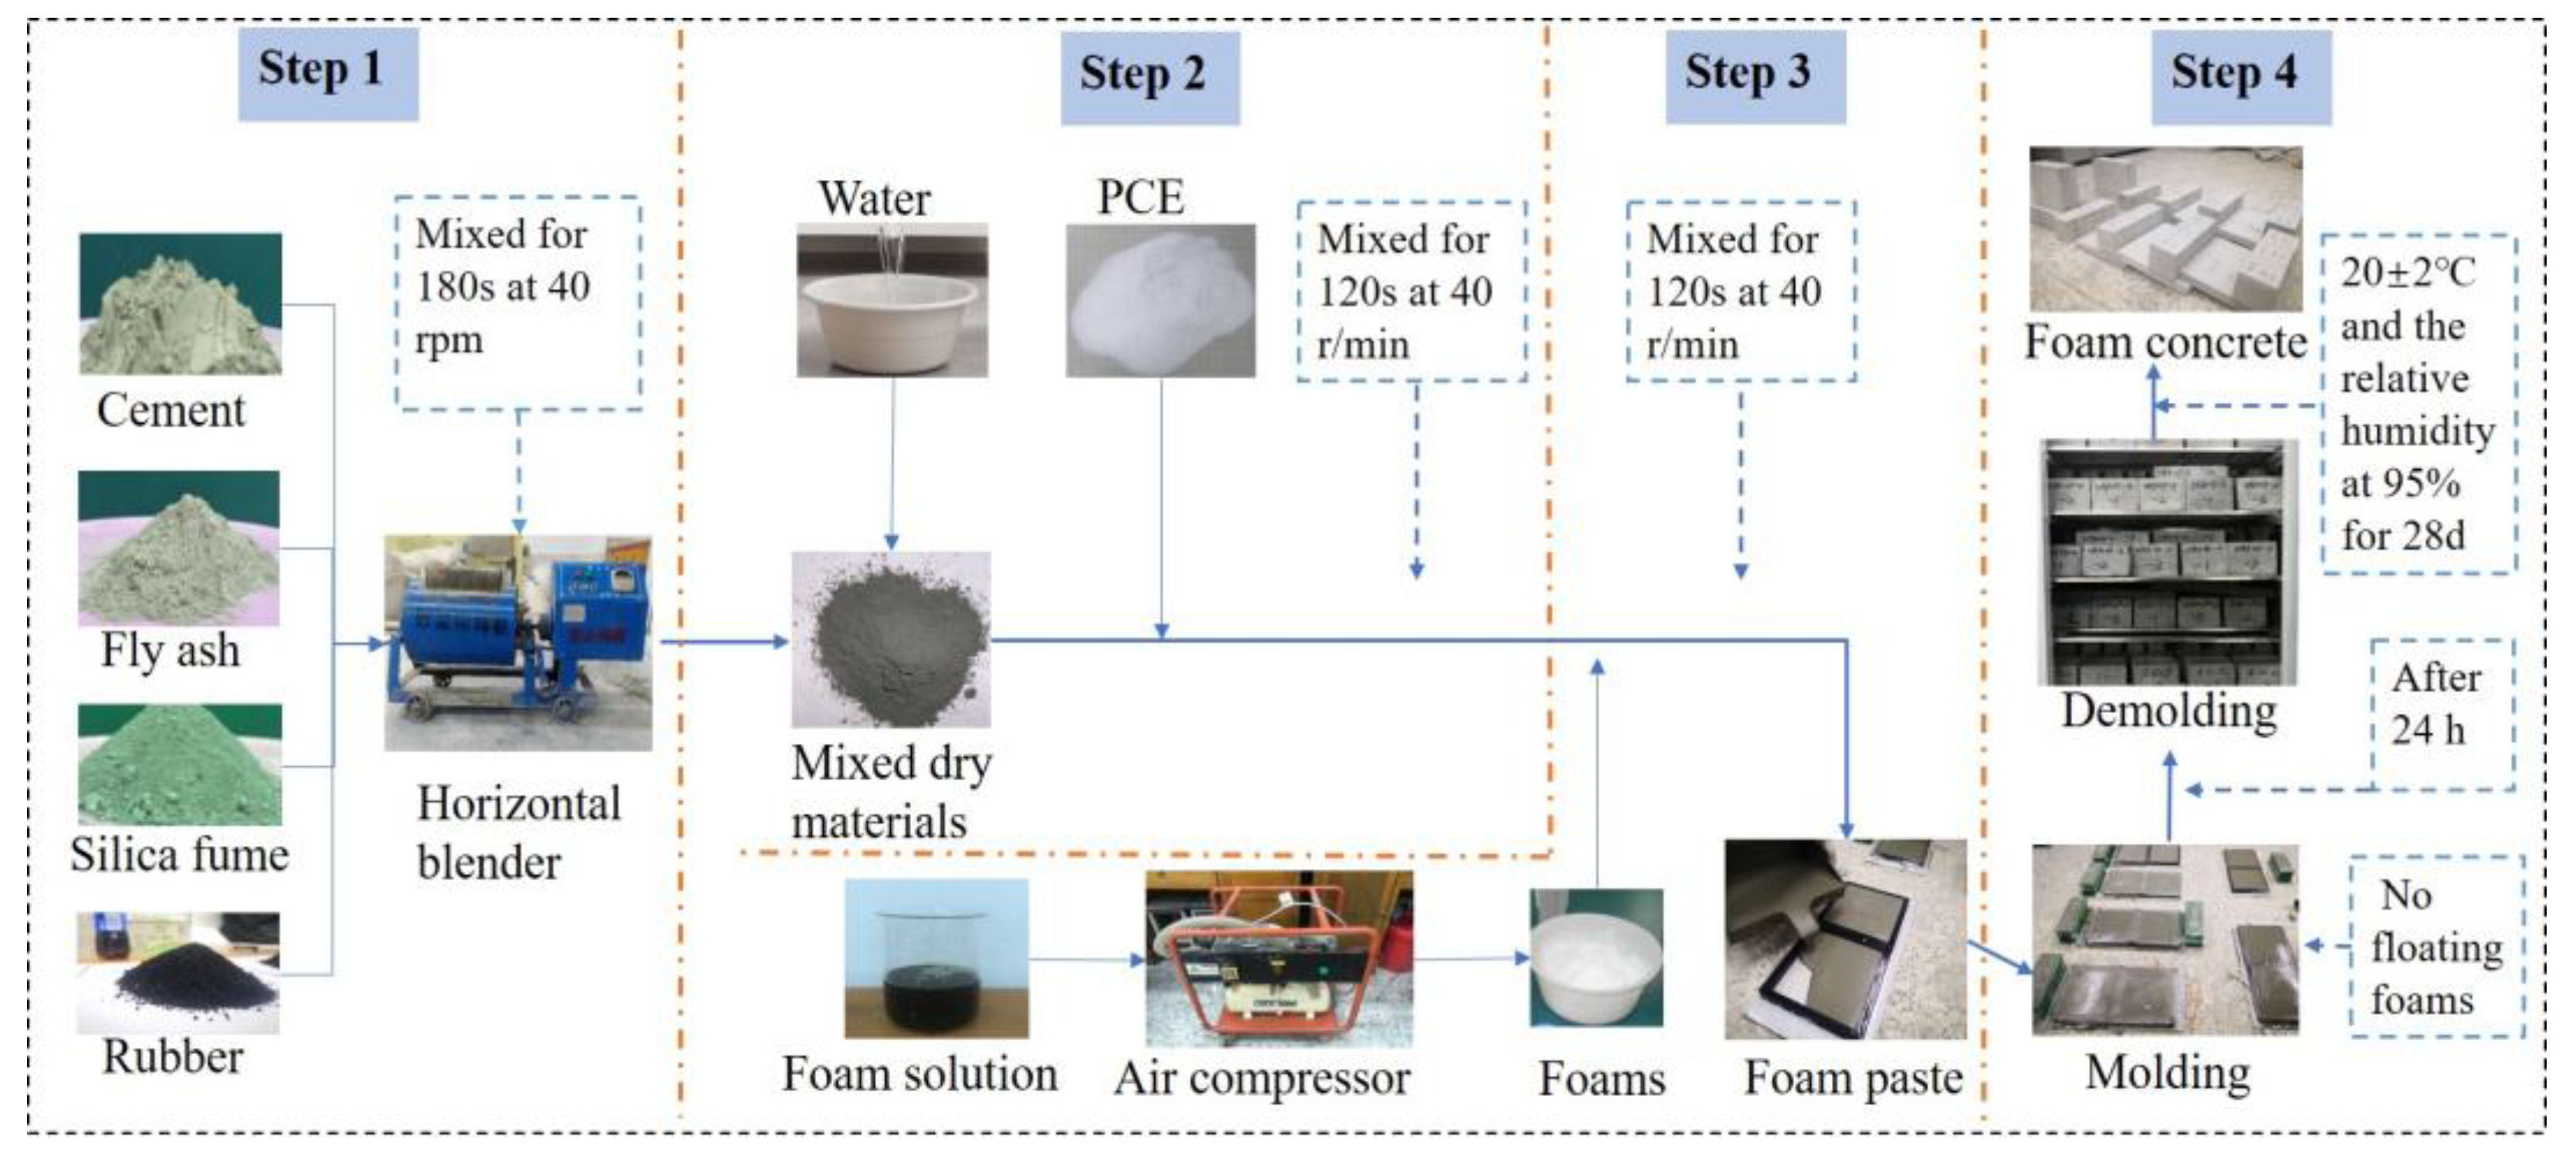
2.3. The Preparation Process of Rubber-Foam Concrete

The preparation process for the rubber-foam-concrete specimen includes the following steps, as shown in Figure 2. The preparation process of foamed concrete only lacks the addition of rubber in the first step in Figure 2.
First, the inner wall of the mixer should be consistently moist and clean to prevent absorption of mixing water, thereby indirectly minimizing the water–cement ratio of the paste. The measured cement, fly ash, silica fume, and rubber are poured into a horizontal mixer without water and stirred at 40 r/min for 180 s to form a uniformly mixed dry material. Second, measured water and PCE are added to the mixer for 120 s to prepare a well-mixed cement paste. Simultaneously, the foaming agent is diluted with water at a dilution ratio of 1:20 to initiate foam production in the foam generator. Once the foam density meets experimental requirements, an appropriate amount of foam is precisely measured and added to the cement paste. The mixture is then stirred at a constant speed for 120 s.
Finally, after thoroughly mixing until no residual foam remains on the paste’s surface, the foam-concrete paste is slowly poured into pre-lubricated molds. After leveling off the surface, it is covered with a plastic film to prevent moisture evaporation from the foam-concrete paste. The molds are undisturbed for 48 h before demolding and undergoing standard curing procedures [47]. The foam-concrete specimens were cured in the standard curing room at (20 ± 1) °C constant temperature and 95% relative humidity for 28 days and it was ensured that the distance between the specimens in the curing room was at least 20 mm, and the relevant parameters were tested.

2.4. Mix Proportion Experiment Design

2.4.1. Volume Test of Cementitious Material Paste

To investigate the influence of the water–cement ratio on the volume of cement paste, the measured volume and wet density of three paste types without a water-reducing agent were obtained under five different design water–cement ratios. The mixing mass ratio for cement, fly ash, and silica fume was set at 8:1:1. A theoretical calculation method for determining cement-paste volume is provided in the literature [48,49].
V 1 t = m c ρ c + m f ρ f + m s ρ s + m w ρ w
m w = φ ( m c + m f + m s )
where V 1 t is the theoretical volume of the cement paste; m c , m f , m g , and m w are the mass of the added cement, fly ash, silica fume, and water, respectively; ρ c , ρ f , ρ s , and ρ w are the density of cement, fly ash, silica fume, and water, respectively, with values of 3100 kg/m3, 2600 kg/m3, 2100 kg/m3, and 1000 kg/m3, respectively; and φ is the water–cement ratio.
The theoretical density ( ρ 1 t ) of the cementitious material paste is given by Equation (3).
ρ 1 t = m c + m f + m s + m w V 1 t
Firstly, cement pastes with water–cement ratios of 0.35, 0.4, 0.45, 0.5, and 0.55 were formulated and fabricated by the desired foamed-concrete density (600 kg/m3) while maintaining a default mass coefficient of 1.2. Subsequently, the wet density, volume, and fluidity of the mixed cement paste were experimentally determined to investigate the impact of the water–cement ratio on its physical parameters, as presented in Table 1.
Secondly, the influence of rubber particle size (mesh number of 10, 20, 40, and 80) and the amount of added rubber (2%, 4%, 6%, and 8% of the total mass of cementitious material) on the physical parameters of the cement paste was investigated. The water–cement ratio was set at 0.45, as presented in Table 2.

2.4.2. Test on the Effect of the Water-Reducing Agent on the Density of Cement

As supported by numerous studies, adding water-reducing agents can enhance the working performance of concrete and foamed concrete. These agents effectively reduce the required mixing water while maintaining the desired slump, thereby improving the compressive strength of hardened concrete. However, the current standards [48,49] for preparing foamed concrete and the mix design method only consider the influence of cementing materials, water–cement ratio, and fine aggregates on paste volume. However, water-reducing agents significantly impact paste fluidity, indirectly affecting measured density and volume. The inaccuracies in the calculation of paste volume based on those standards will result in variations in the actual foam volume, thereby ultimately impacting the dry density. Therefore, this section aims to investigate how a water–cement ratio of 0.45 and varying concentrations (0.35‰, 0.40‰, 0.45‰, 0.50‰, and 0.55‰) of water-reducing agents affect both wet density and volume of cement. The total mass of cementitious materials is determined based on a target density of 600 kg/m3 for foamed concrete with a default mass coefficient set at 1.2. Among these materials, the mixing mass ratio for cement, fly ash, and silica fume is set at 8:1:1., while considering the proportional addition of a reducing agent based on the total mass. The mixing proportion design is shown in Table 3.

2.4.3. Foam Surplus Coefficient Test

The foam surplus coefficient is introduced to compensate for errors caused by factors such as foam rupture and escape during mixing, typically with a value greater than 1. This empirical value, derived from numerous engineering research and application tests, significantly impacts the dry density of foamed concrete. An excessive surplus coefficient can result in a lower measured density of foamed concrete that fails to meet design requirements. It has been observed that various factors, including foam quality, foam stability, static defoaming rate, stirring defoaming rate, and stirring time, have obvious effects on the value of the surplus coefficient. References [48,49] provide a calculation method for determining the volume of foam ( V 2 t ) required in foamed-concrete preparation.
V 2 t = k ( 1 V 1 t )
where V 2 t is the theoretical added volume of the foam (the unit is m 3 ), k is the foam surplus coefficient, and dimension 1 refers to the unit volume, equal to 1 m3.
The precise control of the measured dry density heavily relies on the rational foam surplus coefficient. Based on the composition of all materials in foamed concrete, it is assumed that the theoretical wet density of foamed-concrete paste can be calculated by determining the total mass of additives per unit volume after mixing in an ideal state. A more minor discrepancy between the theoretical and measured wet densities indicates a more accurate foam surplus coefficient.
In order to determine the foam surplus coefficient of foamed concrete with different density grades, the influence of the water–cement ratio and water-reducing agent on the measured volume of cementable materials was considered. The water–cement ratio was set at 0.45, while the mixing mass ratio of cement, fly ash, and silica fume was adjusted to 8:1:1. The content of the water-reducing agent was modified based on the mass ratio of all cementable materials to ensure workability requirements under various design densities. The mix proportions of foam surplus coefficients with different design densities of foam concrete are presented in Table 4.

2.4.4. Dry Material Mass Coefficient Test

The dry material mass coefficient ( S a ) used in the mix ratio design of foamed concrete is determined by adding up the total amount of all dry materials per unit volume and the total amount of all non-evaporative substances (such as chemically bound water, crystal water, and other impurities) present in the final product. This coefficient represents the absolute dry weight of foamed concrete per unit volume, also known as the design dry density. However, it should be noted that environmental factors can significantly affect the water content in dry materials, leading to a certain degree of error between their actual value and their total weight. Due to limited research on total non-evaporative mass for foamed-concrete products, a method based on construction experience and statistics has been adopted as a simple yet efficient approach. By the recommended mass coefficient of 1.2, as stated in references [48,49], this section presents a comprehensive design and investigation into the influence of mass coefficients (1.2, 1.25, and 1.3) on the dry and wet density of foamed-concrete test blocks. The degree to which the measured dry density aligns with the intended value reflects the rationality of selecting a specific mass coefficient. The Mix proportions of the mass coefficient tests with different design densities of foam concrete are presented in Table 5.

2.5. Test Method

2.5.1. The Paste’s Measured Wet Density, Volume, and Fluidity

The wet density of the cement paste ( ρ 1 m ) was determined using a 1 L capacity density cylinder. Firstly, the empty cylinder was thoroughly cleaned and moistened, then dried until no moisture residue remained on its surface. The initial weight of the density cylinder was precisely measured on an electronic scale with an accuracy of 0.1 g. Subsequently, any cement paste adhering to the cylinder was dried and re-weighed to accurately determine its weight. The difference between these two weights represents the weight of the paste, providing the wet density value in g/L (equivalent to kg/m3 in standard density units). Finally, according to the total mass of the prepared paste (the unit is kg), the measured volume of the paste ( V 1 m ) is calculated (the unit is m3). The measurement of the cylinder and paste wet density is shown in Figure 3a.
The fluidity of paste ( F p m ) is a crucial parameter for its performance, and achieving appropriate fluidity is essential for the mixing, pouring mold, volume stability, and forming quality of foamed concrete. High-quality foamed concrete should have a workability of approximately 220–250 mm [50]. A stainless-steel flow barrel with an internal diameter and height of 80 mm was used in this paper. The process involved placing the drum on a dry and smooth horizontal surface, filling it with paste, scraping the top surface along the port plane of the cylinder using a flat knife, and then lifting the cylinder at a constant speed. After allowing the paste on the horizontal plate to rest for 1 min, we measured and recorded the maximum horizontal diameter of the collapsed paste body using a ruler. Three parallel tests were conducted using flow buckets of identical specifications. The average value from these three test results was considered the fluidity (mm), as depicted in Figure 3b.

2.5.2. Stability of Foam and Foam Paste

The critical parameters for assessing foam stability encompass foam density ( ρ f ), foam multiple (FM), 1 h settling distance (SD), and 1 h bleeding rate (BV), where FM represents the ratio of foam volume to foaming agent volume, SD denotes the distance between the upper surface of the existing foam and the surface of the initial foam after 1 h, and BV indicates the weight percentage of defoamed foam produced after being left in the system for 1 h. Semi-extinction time (HT) and total extinction time (FT) denote the duration in minutes when the volume of foam in the standard foam tester is reduced to 2.5 L and when the foam completely disappears, respectively. The experimental setup comprises an air compressor, pump body, and a foam testing apparatus that measures settling distance and bleeding rate, and the equipment used in this paper meets the requirements of the instruments in Appendix A and Appendix B of the standard [46].
The foam agent is initially diluted according to the manufacturer’s recommended dilution ratio and thoroughly stirred to ensure a consistent foam texture. Subsequently, the tester’s wide-mouthed cylinder container is positioned on an electronic scale for weighing, and the mass of the container ( m 0 ) is recorded. Afterward, the prepared foam is carefully poured into the tester’s wide-mouthed cylinder container, ensuring its surface is leveled by scraping it flat. Then, it is re-weighed to determine its mass ( m 1 ). The foam surface is gradually covered with a lightweight aluminum plate, ensuring a gradual and uniform distribution. The system is allowed to equilibrate for 1 h, and then the faucet positioned at the lower end of the glass tube is opened and the weight ( m 3 ) of the foam liquid is quantitatively determined in grams. Simultaneously, the half-defoaming and full-defoaming times are recorded as the time for the foam interface to reach half of the container and complete defoaming, respectively, with units in minutes. Other foam indicators can be calculated by Equation (5).
ρ f = m 1 m 0 V 0
F M = V 0 ( m 1 m 0 ) / ρ f l
B V = m 3 m 1 m 0 × 100 %
where V 0 is the volume of the foam barrel in the foam tester (the value is 5000 mL) and ρ f l is the density of the foam solution (the unit is g/cm3).
The foam is thoroughly mixed into the paste to create a stable foam paste, and the defoaming rate of the foam represents its dynamic stability during the stirring process. The defoaming rate is not a fixed parameter but has a significant correlation with both stirring time and the ratio of cementing material. Compared to various static stability parameters of foam, the defoaming rate can more accurately indicate the stability characteristics of foam in cement paste. It can be defined as the ratio between the current equivalent volume of foam in the foam paste and its initial incorporation volume. The calculation method for determining the defoaming rate is presented in Equations (8)–(12).
ω = V 2 m V e V 2 m × 100 %
V 2 m = k ( 1 V 1 m )
V 1 m = m c + m f + m s + m w ρ 1 m
V e = V f p m V 1 m
V f p m = m c + m f + m s + m w + m p ρ f p m
where ω is the defoaming rate, V 1 m is the actual volume of cement paste, V 2 m is the actual volume of foam incorporated (the unit is m3), ρ 1 m and ρ f p m are the measured density of cement paste and foam cement paste, respectively (the unit is kg/m3), V e is the equivalent volume of foam in the foam paste, and V f p m is the measured volume of foam paste (the unit is m3).

2.5.3. Test Method for Forming Dry Density of Foam Concrete

The dry density ( ρ f c d ) of foamed concrete refers to the absolute dry density of foamed concrete without internal moisture. The performance test method for measuring the dry density of foam concrete is as follows [47]. Firstly, three specimens are taken, and their dimensions (length, width, and height) are accurately measured with a precision of 1 mm. The volume of each specimen is then calculated. Next, the specimens are placed in a drying box at a temperature of 60 ± 5 °C until they reach a constant mass (the difference in mass before and after drying does not exceed 0.5% of the specimen’s mass). Once cooled to room temperature, the mass of each specimen ( M d ) is precisely measured with 1 g accuracy. Finally, the dry density is calculated by Equation (13).
ρ f c d = M d V
where ρ f c d is the dry density of foamed concrete (the unit is kg/m3), M d is the mass of foamed concrete after drying (the unit is g), and V is the measured volume of foamed concrete (the unit is cm3). The calculated results are the arithmetic average values of the three specimens.

2.5.4. Compressive Strength Test of Foam Concrete

The compressive strength ( f c u ) of foamed concrete was evaluated using an electro-hydraulic servo compression test machine. The rubber-foamed concrete is shown in Figure 4. A uniform and continuous load is applied at 1500 N/s until the specimen reaches the failure point. The failure load ( p 1 ), measured in N, is recorded. The final calculation results represent the arithmetic mean of the three specimens. A 1 is the area of the pressure surface, measured in mm2. The calculation method of compressive strength is shown in Equation (14).
f c u = p 1 A 1

3. Results and Discussion

3.1. Volume Correction Coefficient and Size Effect Coefficient

The density of foamed concrete is significantly influenced by the quantity of foam added, as indicated by relevant studies. Equation (4) demonstrates that precise control over the density of foamed concrete requires strict regulation of the foam volume, which is determined through a combined conversion of cement volume and foam surplus coefficient. Therefore, accurate prediction of cement volume and appropriate surplus coefficient holds great importance in achieving precise control over the dry density of foamed concrete.
The present study introduces a volume correction factor, denoted as the growth rate of the mixed paste’s volume resulting from variations in material fineness after blending different cementing materials, as depicted in Equation (15).
α = V 1 m / V 1 t
Table 6 presents the theoretical calculations and corresponding test results for cement-paste volume density and the measured density and fluidity when the water–cement ratio changes from 0.35 to 0.55. Theoretical calculation values for cement-paste volume ( V 1 t ) and density ( ρ 1 t ) are provided by Equations (1) and (3), respectively. The measurement of density ( ρ 1 m ) and fluidity ( F p m ) of cement paste follows the test method described in Section 2.5.1 of this paper, while Equation (10) is utilized to calculate the measured volume of cement paste ( V 1 m ).
As seen in Table 6, when the water–cement ratio is 0.35, the maximum error between theoretical calculation results and measured results is 3.81%, while when the water–cement ratio is 0.45, the minimum relative error is 1.98%.
The influence curve of the water-to-cement ratio on the volume of cement paste and the volume correction coefficient is depicted in Figure 5. As shown in Figure 5a, the measured volume of cement generally exceeds the theoretical volume, exhibiting a positive linear correlation with variations in the water-to-cement ratio. Conversely, there is a negative correlation between paste density and water-to-cement ratio; that is to say, higher water-to-cement ratios result in lower cement densities due to the significantly lower water density compared with cement. Excessive mixing water caused by a substantial water-to-cement ratio acts as a lubricating material for cement, enhancing its fluidity. However, this excess water dilutes the paste, increasing its volume and decreasing its density. Figure 5b presents polynomial fitting results illustrating the relationship between the volume correction coefficient and water-to-cement ratio for cementing materials.
When the water–cement ratio is 0.45, there is a minimal discrepancy between the theoretical and measured volumes, indicating that the theoretical formula provides superior predictive capability for actual paste volume and enhances cement-paste performance. The analysis reveals that a meager water–cement ratio leads to inadequate testing performance, characterized by extremely limited fluidity, uneven paste mixing, and numerous internal pores, ultimately compromising density measurement accuracy. As the water–cement ratio increases, paste fluidity gradually improves; however, excessive ratios further decrease paste consistency and may cause severe delamination and segregation during density measurement, resulting in significant measurement errors. Based on the fluidity test results presented in this study, a water–cement ratio of 0.45 was selected for subsequent mix design calculations to accurately predict actual paste volume.
According to Equation (16), the volume correction coefficient is 1.021. The modified formula for calculating the volume of cement paste is obtained, as depicted in Equation (17).
α = 1.409 1.727 φ + 1.922 φ 2
V 1 t = α V 1 t = 1.021 × m c ρ c + m f ρ f + m s ρ s + m w ρ w
where V 1 t is the predicted value of the modified cement volume.
When the water–cement ratio is 0.45, the effects of different rubber particle sizes and incorporation amounts on the cement paste’s measured density and fluidity are given in Table 7. The fresh density consistently decreases with increasing rubber content, as observed in Table 7, irrespective of the particle size of the rubber powder. This finding is consistent with those concluded by Eltayeb et al. [33].
The density results of Table 7 are put into Equation (10), and the measured volume of paste can be obtained. Figure 6 shows the influence of rubber particle size and dosage on paste volume and fluidity. The comparison of test data for four groups of rubber cement pastes with different particle sizes in Figure 6a reveals that when the rubber is 0, the volume of cement paste closely approximates the predicted value from Equation (17). This further validates the accuracy of the revised prediction expression proposed in this paper for estimating cement-paste volume. Moreover, an increasing trend in the volume of rubber cement paste is observed as the rubber content increases. Additionally, larger particle sizes under identical rubber content conditions result in a lower density and greater volume of rubber cement paste. Notably, compared to a mesh number of 10 particles, those with a mesh number of 80 exhibit faster growth rates. Figure 6b demonstrates that the amount of rubber content can influence the fluidity characteristics of cement paste. Larger-sized rubber particles notably enhance flowability, while a mesh number of 20 particles has minimal impact on it; however, both mesh numbers of 40 and 80 particles simulate flow behavior to some extent.
Furthermore, smaller-sized rubber particles exhibit more pronounced simulated effects due to their super hydrophobic nature and lower density than water; they effectively disperse cement molecules by introducing additional bubbles and hydrophobic groups at the interface between the rubber and cement phases. Consequently, this leads to an increase in volume but a decrease in density for samples of rubber-cement slurries. According to the linear fitting data of rubber cement-paste volume, the prediction expressions of rubber cement-paste volume with different rubber particle sizes and different rubber content can be obtained.
V 1 t R = α V 1 t + β V 1 t r
V 1 t r = λ ( m c + m f + m s ) ρ r
where V 1 t R is the revised predicted volume of cement paste containing rubber particles (the unit is m3), V 1 t r is the theoretical calculation volume of rubber particles (the unit is m3), ρ r is the density of rubber (the value is 1300 kg/m3), and β is the size effect coefficient corresponding to different rubber particle sizes. The four rubber particle sizes correspond to 1.29, 1.32, 1.37, and 1.84, respectively. The smaller the rubber particle size is, the larger the size effect coefficient is. λ is the percentage of rubber particles in the total mass of the cementing material.

3.2. Effect of Water-Reducing Agent on the Density of Cement

The superplasticizer is added at a dosage of 0.3–0.55‰ based on the total mass of all cementing materials, constituting a negligible proportion. Therefore, when calculating the cementing material’s volume and density, the superplasticizer’s impact on the total mass is disregarded. Table 8 presents theoretical calculation results and experimental data for the paste volume and density of the cementing material with varying water-reducing agent content ranging from 0.3‰ to 0.55‰. Considering the volume correction factor, the predicted value for paste volume can be obtained by Equation (17).
The density of cement paste, as determined by experimental measurements (Table 8), is influenced to a certain extent by the presence of a water-reducing agent. A comparison between the predicted volume value of cement paste without any water-reducing agent and the measured values reveals a maximum error of only 0.58%. Notably, it can be observed that lower concentrations of the water-reducing agent result in more accurate predictions. Therefore, it can be concluded that variations in the content of the water-reducing agent have a significant impact on cement volume, and the influence of the reducing agent cannot be ignored when the volume prediction is made.
The change curve depicting the influence of water-reducing agent content on the measured volume and density of cement paste is presented in Figure 7a. When the water-reducing agent content is set to 0, the measured value of cement-paste volume aligns closely with the predicted value provided by Equation (17), as shown by the red dashed line in Figure 7a, resulting in a negligible relative error of only 0.03%. Therefore, Equation (17) offers a relatively accurate estimation for paste volume and provides reliable theoretical support for predicting cement volume without adding a water-reducing agent. Furthermore, as illustrated in Figure 7b, an increase in water-reducing agent content leads to a decreasing trend in cementite volume while exhibiting a gradual linear increment in cementite density. For instance, when the water-reducer content reaches 0.5‰, fluidity is enhanced two times compared to the control group without adding a water reducer. Although incorporating a water-reducing agent aids in improving paste flowability similar to increasing the water–cement ratio for enhanced workability performance, it has an opposite effect on paste density due to several factors: the introduction of more polar groups by the water-reducing agent promotes sliding between cement particles, reduction in mixing water occurs, and excess moisture molecules fill gaps between cement, thereby elevating overall cement density.
The volume of cement containing a water-reducing agent can be given by Equation (20).
V 1 t = V 1 t 3.74 χ
where V 1 t is the theoretical volume of the cement with a reducing agent and χ is the fraction of the water reducing agent to the total mass of the cementing material.
By inserting Equation (20) into Equation (17), a comprehensive expression for predicting the volume of cement containing a water-reducing agent is obtained.
V 1 t = 1.021 × m c ρ c + m f ρ f + m s ρ s + m w ρ w 3.74 χ
When the water–cement ratio is 0.45, and the amount of rubber added is 8% of the mass of all cementing materials, the measured density ( ρ 1 m R ) and volume ( V 1 t R ) of rubber cement paste with different rubber particle sizes and water-reducing agent content are shown in Table 9.
The fitting curve of the influence of water-reducer content on the volume of rubber paste with different particle sizes is shown in Figure 8. The impact of a water-reducing agent on the measured volume of rubber cement paste can be observed in Figure 8. As the content of the water-reducing agent increases, there is a corresponding decrease in paste volume, similar to the effect observed in cement paste without rubber inclusion. Introducing a water-reducing agent enhances the fluidity of rubber cement paste and reduces the amount of mixing water utilized. Excess water molecules fill gaps between cement and rubber particles, increasing paste density and decreasing volume. Furthermore, it is crucial to consider the influence of different sizes of rubber particles on measured volume.
By analyzing linear fitting data for various particle sizes, predictive expressions for measuring volumes can be derived for different contents of water-reducing agents.
V 1 t R = V 1 t R + ψ χ
where V 1 t R is the predicted volume value of rubber cement paste containing water reducing agent (the unit is m3); ψ is the effect coefficient of the water reducing agent corresponding to different rubber particle sizes; and the effect coefficient corresponding to the four rubber particle sizes from large to small are −26.38, −17.98, −8.64, and −19.41, respectively.

3.3. Foam Surplus Coefficient

3.3.1. Results of the Surplus Coefficient Test

When the foam surplus coefficient k is 1.1 and 1.2, respectively, the calculation and test results of the foam-concrete paste under different design densities can be obtained, as shown in Table 10. The measured wet density, ρ f p m , is measured by the wet density test method of cement paste described in Section 2.5.1 of this paper, and the unit is kg/m3. The theoretical calculated density, ρ f p t , of foam paste and the calculated density, ρ f p t R , of rubber-foam paste are respectively given by Equations (23) and (24).
ρ f p t = ( m c + m f + m g + m w + m p ) / 1
ρ f p t R = ( m c + m f + m g + m w + m p + m r ) / 1
where m r is the mass of rubber particles and dimension 1 refers to the unit volume, equal to 1 m3.
According to preliminary testing experience, the fluidity of foam-concrete mixtures typically ranges between 200 and 300 mm, demonstrating exceptional workability and minimal risk of post-pouring collapse while maintaining high volume stability. Therefore, when preparing foam concrete with varying design densities, it is crucial to incorporate an appropriate amount of water-reducing agent based on the measured value of foam paste flow. Table 3 presents the recommended dosage range for water-reducing agents under different design densities to ensure effective control over the fluidity of foam paste.

3.3.2. Stirring Defoaming Rate

The actual density of foam paste with different design densities varies with stirring time, t, as shown in Table 11.
According to the data presented in Table 11 and Equations (8)–(12), the impact of mixing time on foam defoaming rate in foamed concrete can be derived, as depicted in Figure 9. The analysis reveals that, with increasing stirring time, the defoaming rate also increases. However, beyond a stirring duration of 4 min, there is a gradual diminishing change in the defoaming rate, indicating foam stabilization within the cement paste. At equivalent mixing times, foam concrete with a design density of 1000 kg/m3 exhibits a lower defoaming rate than foam concrete with a design density of 400 kg/m3. This suggests that foam demonstrates enhanced dynamic stability when utilized in high-content cement slurries.
Furthermore, when setting the surplus coefficient k at 1.2 and after mixing for 10 min, the foam defoaming rates reach 20.48% and 15.46% for foam concrete with design densities of 1000 kg/m3 and 400 kg/m3, respectively.
The foam must withstand the double impact force and friction from cement mortar and mixing blades during the foam mixing process, so it is crucial to consider the duration of mixing carefully. Prolonged mixing can result in increased damage, while reducing the time may lead to uneven distribution of foam and cement paste, resulting in significant errors in defoaming rate calculation. Moreover, the stability of the foam is influenced by the amount of wrapped cement mortar; a higher volume of foam per unit volume reduces its protective ability. Based on this analysis, maintaining a low defoaming rate for different design densities of foam-concrete paste with a surplus coefficient of 1.1 proves beneficial for density control during the design stage. After approximately 4 min, the defoaming rate tends to stabilize; therefore, this study sets a stirring time limit of 4 min in its preparation process.

3.3.3. Measured Wet Density and Theoretical Wet Density of Foam Paste

The theoretical volume prediction curve of cement with a reducing agent, proposed in the literature [48,49] and this paper, is presented in Figure 10a. The measured volume of cement with varying dosages of the water-reducing agent under different design densities shows minimal deviation from the predicted value obtained in Equation (16), indicating high prediction accuracy. However, it should be noted that the fitting degree is low as it does not account for the combined influence of both the water-reducing agent and dry material volume correction coefficient.
The impact of different foam surplus coefficients on the wet density and fluidity of foam-concrete paste with varying design densities is depicted in Figure 10b. It can be observed that, when the surplus coefficient is set at 1.1, there is a slight increase in discrepancy between the measured wet density of foam-concrete paste and its theoretically calculated value, ranging from 0.18% to 0.95%. However, as the surplus coefficient increases to 1.2, this discrepancy escalates significantly from 3.55% to 5.98%. Under identical design densities, a minor discrepancy is observed for a surplus coefficient of 1.1 compared to that for a surplus of 1.2. Furthermore, with an increase in design density, it becomes evident that the fluctuation range in discrepancy for a surplus coefficient of 1.1 is considerably smaller than that for a surplus coefficient of 1.2, indicating superior volume stability in foam paste mixtures prepared using this specific coefficient value. Based on the analysis mentioned above, it can be concluded that achieving closer proximity between the wet density of foam paste and its theoretical counterpart leads to a more accurate determination of the foam surplus coefficient, k, during foamed-concrete design and preparation processes. Therefore, it can be inferred that utilizing a foam surplus coefficient value equal to or around k = 1.1 can achieve more precise prediction results when designing and preparing foamed concrete with varying densities.
The fluidity of foam paste is primarily influenced by the self-weight and interaction force within the paste. The impact of the reducing agent on the flow behavior of foam paste with different design densities reveals that, as the content of the reducing agent decreases (design density increases), the flow rate of cementitious paste decreases. In contrast, the corresponding foam paste exhibits an increasing trend. Optimal flow characteristics are observed in the foam paste when the foam surplus coefficient, k, is 1.1, which can be attributed to a low density of only 31 kg/m3 for the prepared foam in this study. However, higher proportions of foams in such mixtures reduce overall fluidity due to combined effects from viscous forces and surface tension within the foam structure. Therefore, it becomes necessary to appropriately enhance fluidity within cement slurries so that the subsequent addition of large quantities of low-flow foams can meet pouring and testing requirements to effectively prepare low-density foamed concrete.

3.4. Mass Coefficient Test Results

When the foam surplus coefficient, k, is set at 1.1, the measured wet density ( ρ f p m ) and dry density ( ρ f c d ) of the foam-concrete paste by the mass coefficient under different design densities can be obtained, as shown in Table 12.
The influence of the mass coefficient on the volume and wet density of foamed-concrete paste with different design densities is depicted in Figure 11a. It can be observed from the figure that the measured volume values closely align with the predicted values corresponding to various mass coefficients, demonstrating a high level of consistency. As the mass coefficient increases, there is a decrease in the measured volume of cement at this density level, which concurs with theoretical calculations. Therefore, it can be concluded that dry material mass coefficient variations do not significantly impact the prediction results for cement volume established in this study. Furthermore, Figure 11a reveals minimal absolute error in wet density measurements, with a maximum value of only 2.29%. This further validates the abovementioned conclusions: when the foam surplus coefficient is set at 1.1, the measured wet density of foam paste approaches the theoretically calculated value more closely and exhibits improved volume stability.
The dry density distribution of foamed concrete produced with different mass coefficients is presented in Figure 11b. For a mass coefficient of 1.2, all dry density errors are positive, indicating that the prepared foamed concrete has a higher dry density than the design value, with an absolute error reaching up to 4.61%. However, as the mass coefficient increases to 1.25, the maximum error significantly decreases to 2.74%, which falls well below the dry density tolerance of 5% proposed by the Chinese foam-concrete standard [47].
When the foam surplus coefficient, k, is 1.1, and the mass coefficient is 1.25, according to the rubber cement-paste volume prediction methods given by Equations (18), (19) and (22), the results of the measured dry density ( ρ f c d R ) of foamed-rubber concrete with different particle sizes and mixtures are tested, as shown in Figure 12.
The results depicted in Figure 12 show that, for rubber particles with a mesh number of 10, the dry density of low-content rubber-foamed concrete is lower than the designated density. However, as the designated density and rubber content increase, the dry density surpasses the designated value. A similar trend is observed for rubber particles with mesh numbers of 20 and 40. This can be attributed to a smaller size effect coefficient exhibited by larger rubber particles, resulting in a reduced amplitude of volume change caused by varying amounts of rubber cement paste. Consequently, their impact on foam incorporation is not significant. Furthermore, the preparation of low-density foamed concrete necessitates an increased content of water-reducing agents, which significantly affects the volume of rubber cement paste, as shown in Figure 8 and Equation (22). As a result, there is an overall increase in foam inclusion volume, leading to generally lower-than-designated density low-density rubber-foamed concrete.
When the rubber particles are smaller than the mesh number of 80, it can be observed from Figure 12d that the dry density of all specimens is more significant than the design density. This phenomenon is attributed to the significant specific surface area of small-sized rubber particles, which enhances the volume of rubber paste and reduces foam incorporation, ultimately resulting in a measured dry density higher than the intended design density.
Figure 13 shows the compressive strength values for rubber-foamed concrete at different design densities. By analyzing the compressive strength value of rubber-foamed concrete with a density of 500 in Figure 13, it can be observed that the measured compressive strength values in this study are closely consistent with the range reported by Mydin et al. [30] at a temperature of 20 °C, albeit slightly lower than their recorded value of 2.0 MPa. However, the compressive strength of 600 kg/m3 rubber-foamed concrete in this paper is consistent with that of waste rubber-foamed concrete, as concluded by Damiani et al. [51]. As shown in Figure 13, the compressive strength of rubber-foamed concrete increases with the design density; this is consistent with the research conclusion of Yildizel et al. [35]. The growth rate of the compressive strength of rubber-foamed concrete made of rubber is higher for smaller rubber grain sizes with the same rubber content. This is because rubber particles are a type of hydrophobic material. It changed the shape of bubbles around the granules and increased the number of large-size bubbles while increasing a weaker area in the internal structure of foamed concrete [37].
At the same design density, the compressive strength decreases with increasing rubber production, with a faster rate for larger rubber particles. This is due to the relatively loose internal structure of the large-scale granular rubber-foamed concrete compared to the approximately minute-sized rubber particles that do not react with the tentative material and to the large number of internal voids caused by the large-scale rubber particles. Second, the cement–rubber interface transition region forms a sizeable weak region, reducing bonding forces for cement particles and hydration products. On the other hand, the excessive number of rubber particles dispersed in the matrix hinders the total hydration of the cement, destabilizes the foam group, causes deterioration of the microstructure, and reduces the mechanical properties of the rubber-foam concrete.
In addition, the values of the regression analysis and the coefficient for each variable are shown in Table 13. The dependent variables (y) were the predicted compressive strength of rubber under different particle sizes, while the independent variables (x) were the measured dry density. Based on the regression analysis, the results show a strong correlation between the selected independent variables and dependent variables due to the R2 value closer to 1. It indicates that the linear relationship between selected independent variables with compressive strength and density is observed. The relationships are represented in the following equation in Table 13.
This paper presents a comprehensive optimal density-mix proportion design procedure in foamed and rubber-foamed concrete. Firstly, the design density of foamed concrete is determined based on engineering requirements, followed by the mass coefficient specification according to the cementing material type. This paper proposes a recommended mass coefficient of 1.25, which is also applicable to rubber-foamed concrete. The coefficient depends on the deviation between measured dry density and design density. Secondly, the surplus coefficient for foam is established, considering foam stability parameters. In this study, the surplus coefficient of 1.1 is utilized, depending on the discrepancy between the measured wet density of foam paste and theoretical wet density. A more minor error indicates a more reasonable surplus coefficient value. Subsequently, an appropriate amount of water-reducing agent is added based on the designed density level for prepared foamed concrete while calculating the volume of cement paste using Equation (21) or Equation (22). Finally, precise foam incorporation volume is obtained by considering both the volumes of cement paste and the foam surplus coefficient.
By comparing the dry density of foamed concrete in Figure 11 and the rubber-foamed concrete in Figure 12, it can be observed that the density-mix design parameters proposed in this study for foamed concrete, including volume correction parameters, size effect coefficient, water-reducer effect coefficient, and the optimized design expression of density-mix parameters for both foamed concrete and rubber-foamed concrete based on these coefficients, can be effectively applied to specialized engineering applications requiring precise control over dry density. By employing various fitting calculation methods and foam-concrete optimization theory based on a range of experimental data, it becomes convenient to conduct relevant research on foam concrete with new materials and components. Consequently, it holds significant implications for practical production within the foamed-concrete industry.

4. Conclusions

Combining the characteristics of the materials used in this paper, many parametric tests and regression analyses were carried out to optimize the density-mix proportion of foamed concrete and rubber-foamed concrete. The main conclusions are as follows:
(1)
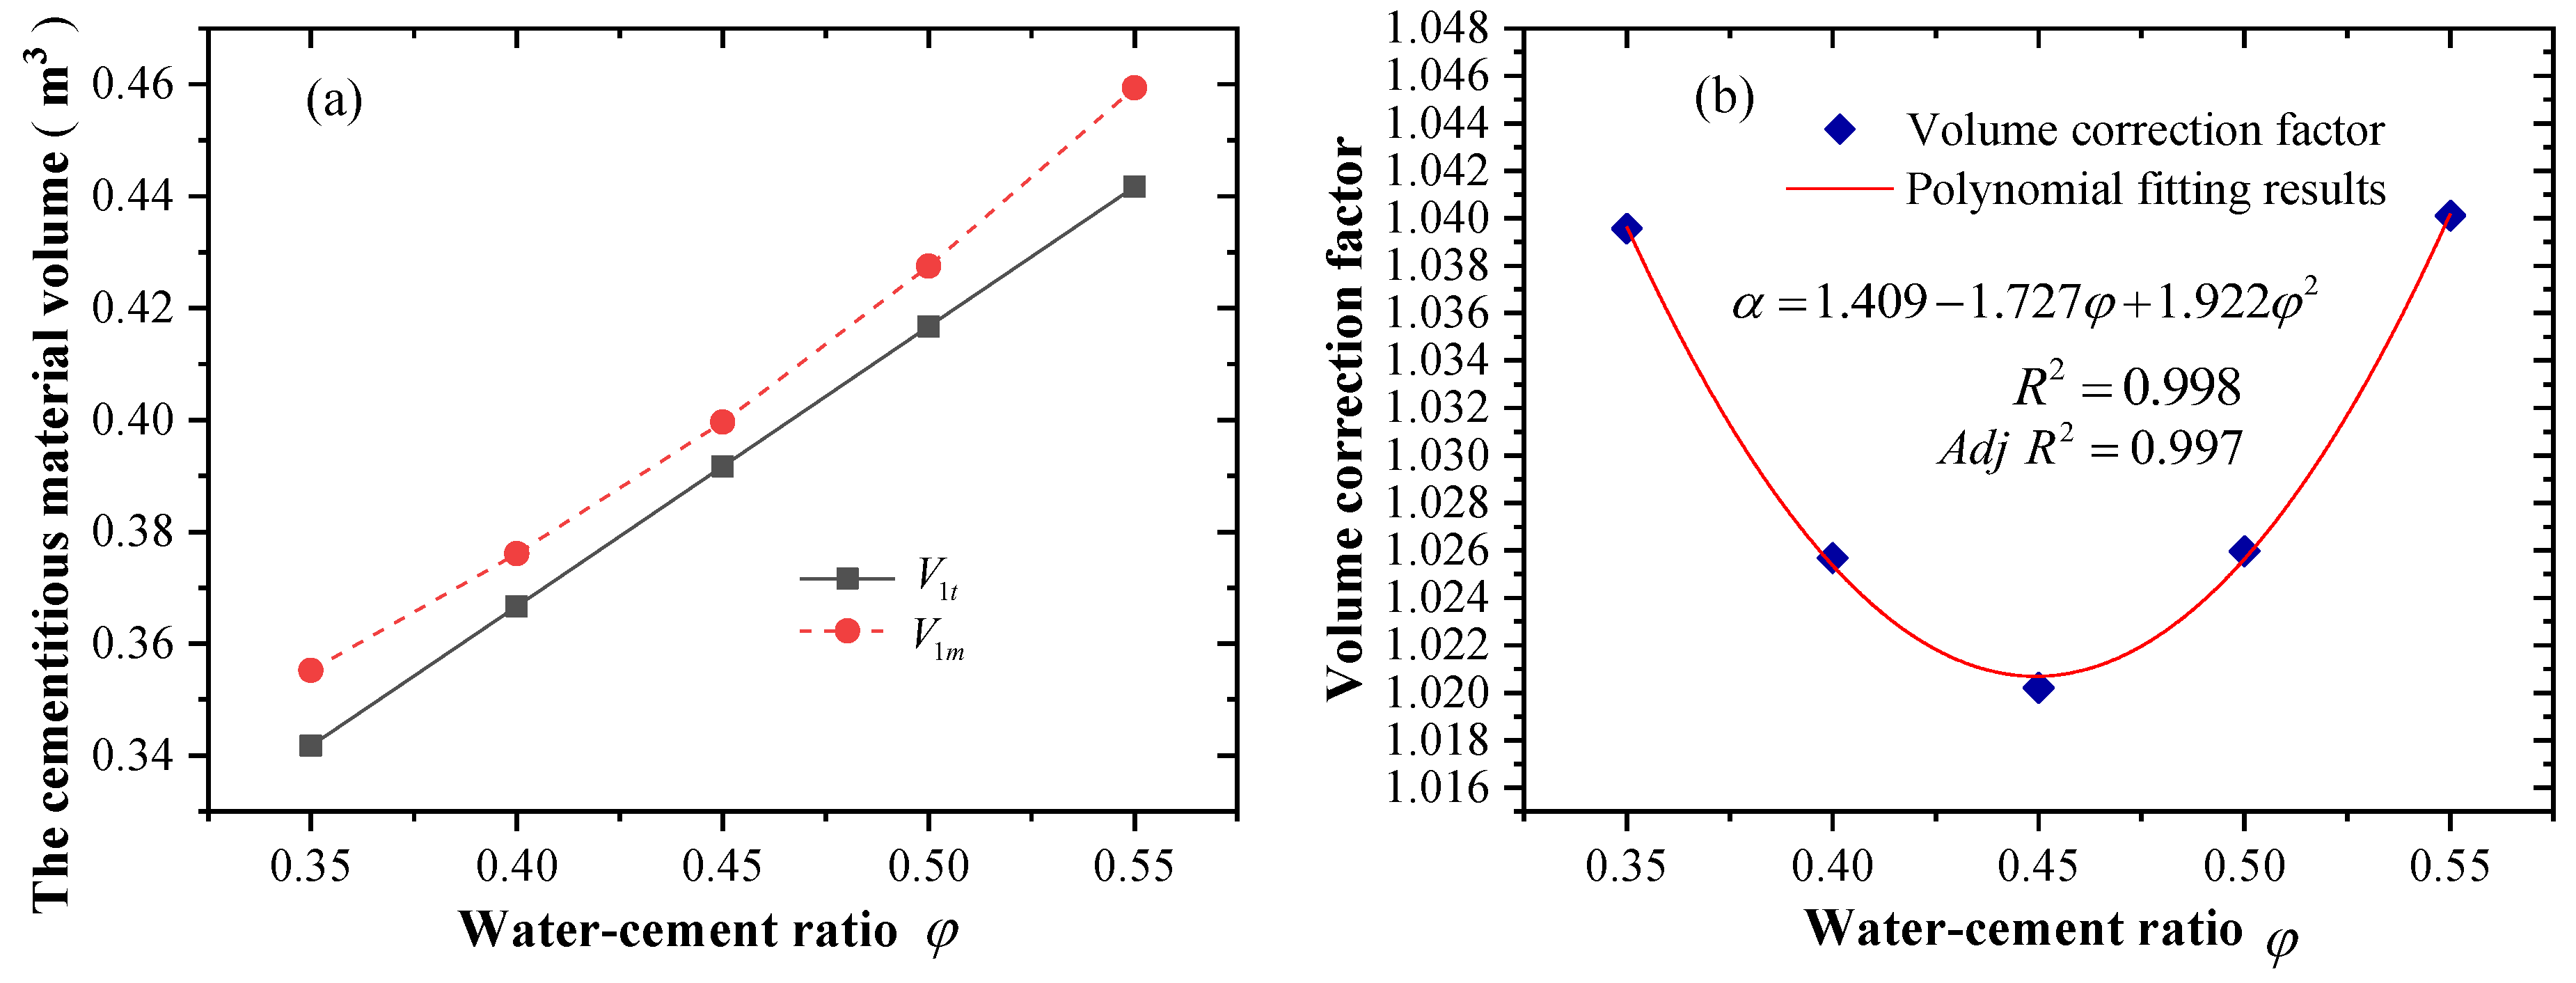
Inadequate water–cement ratio during the preparation of foamed concrete can result in paste segregation and uneven mixing, leading to inaccuracies in density testing. When the optimal water–cement ratio is maintained at 0.45, there is minimal disparity between theoretical and measured volumes, accompanied by a corresponding volume correction coefficient of 1.027.
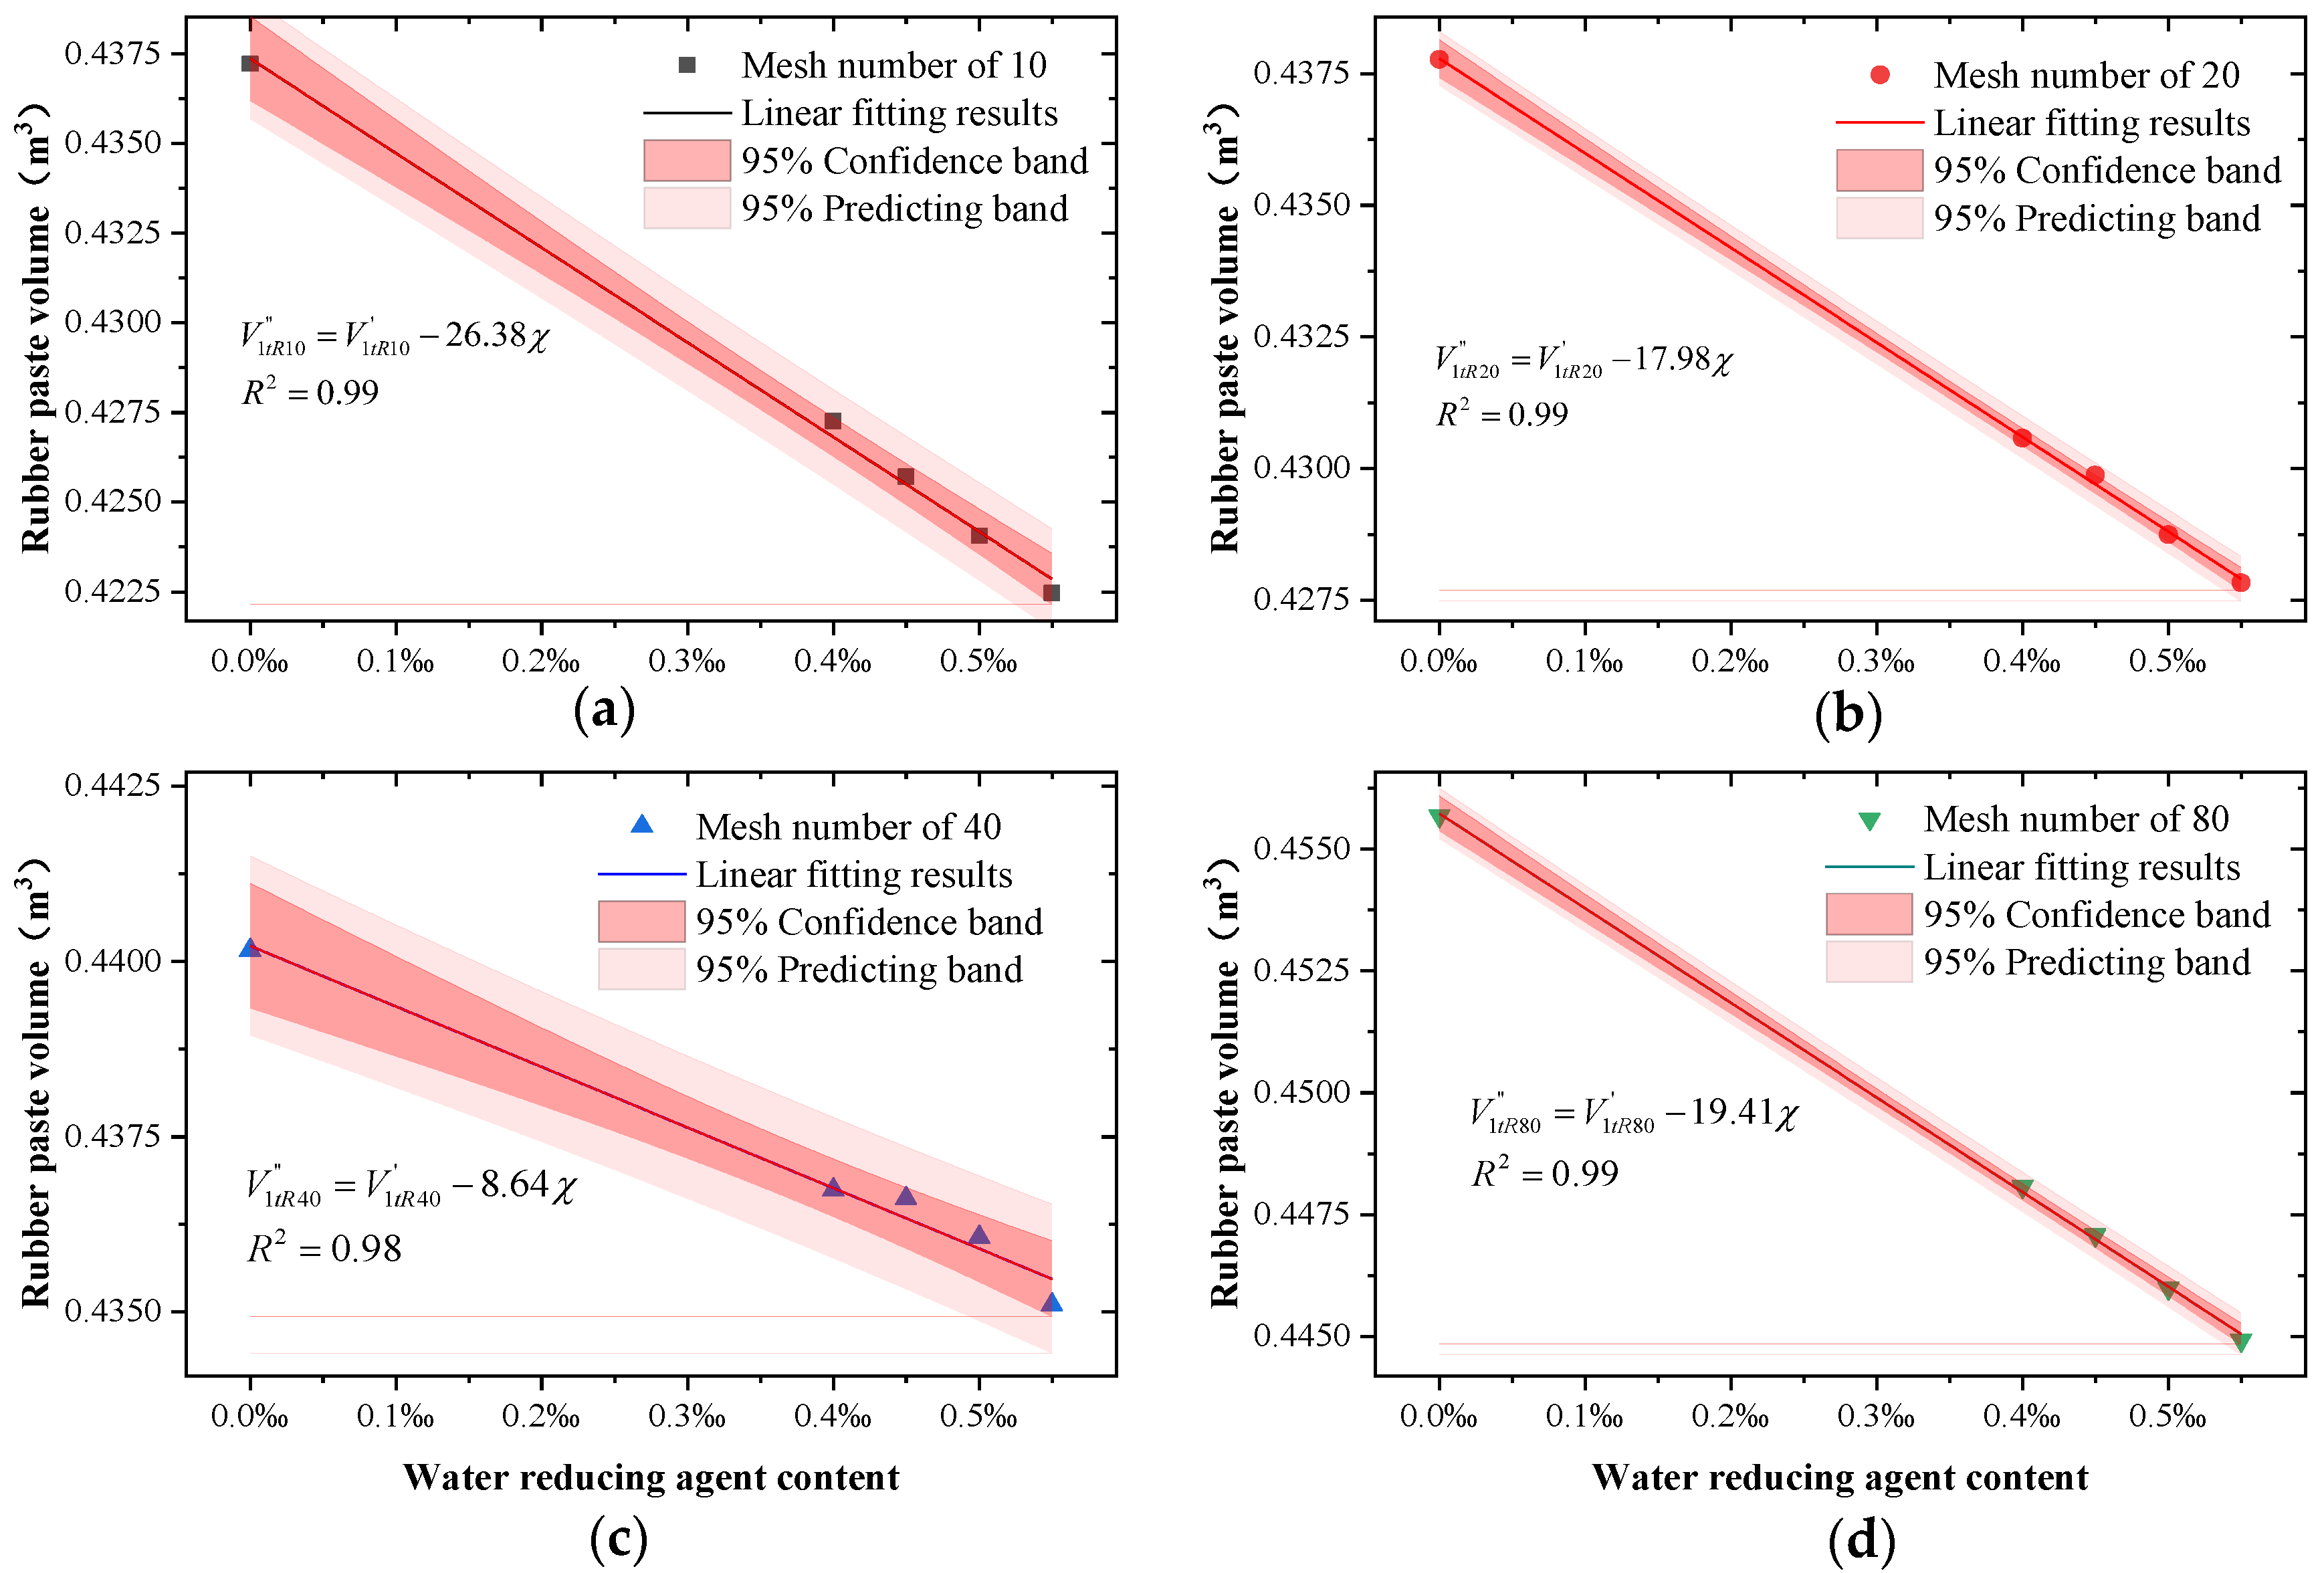
(2)
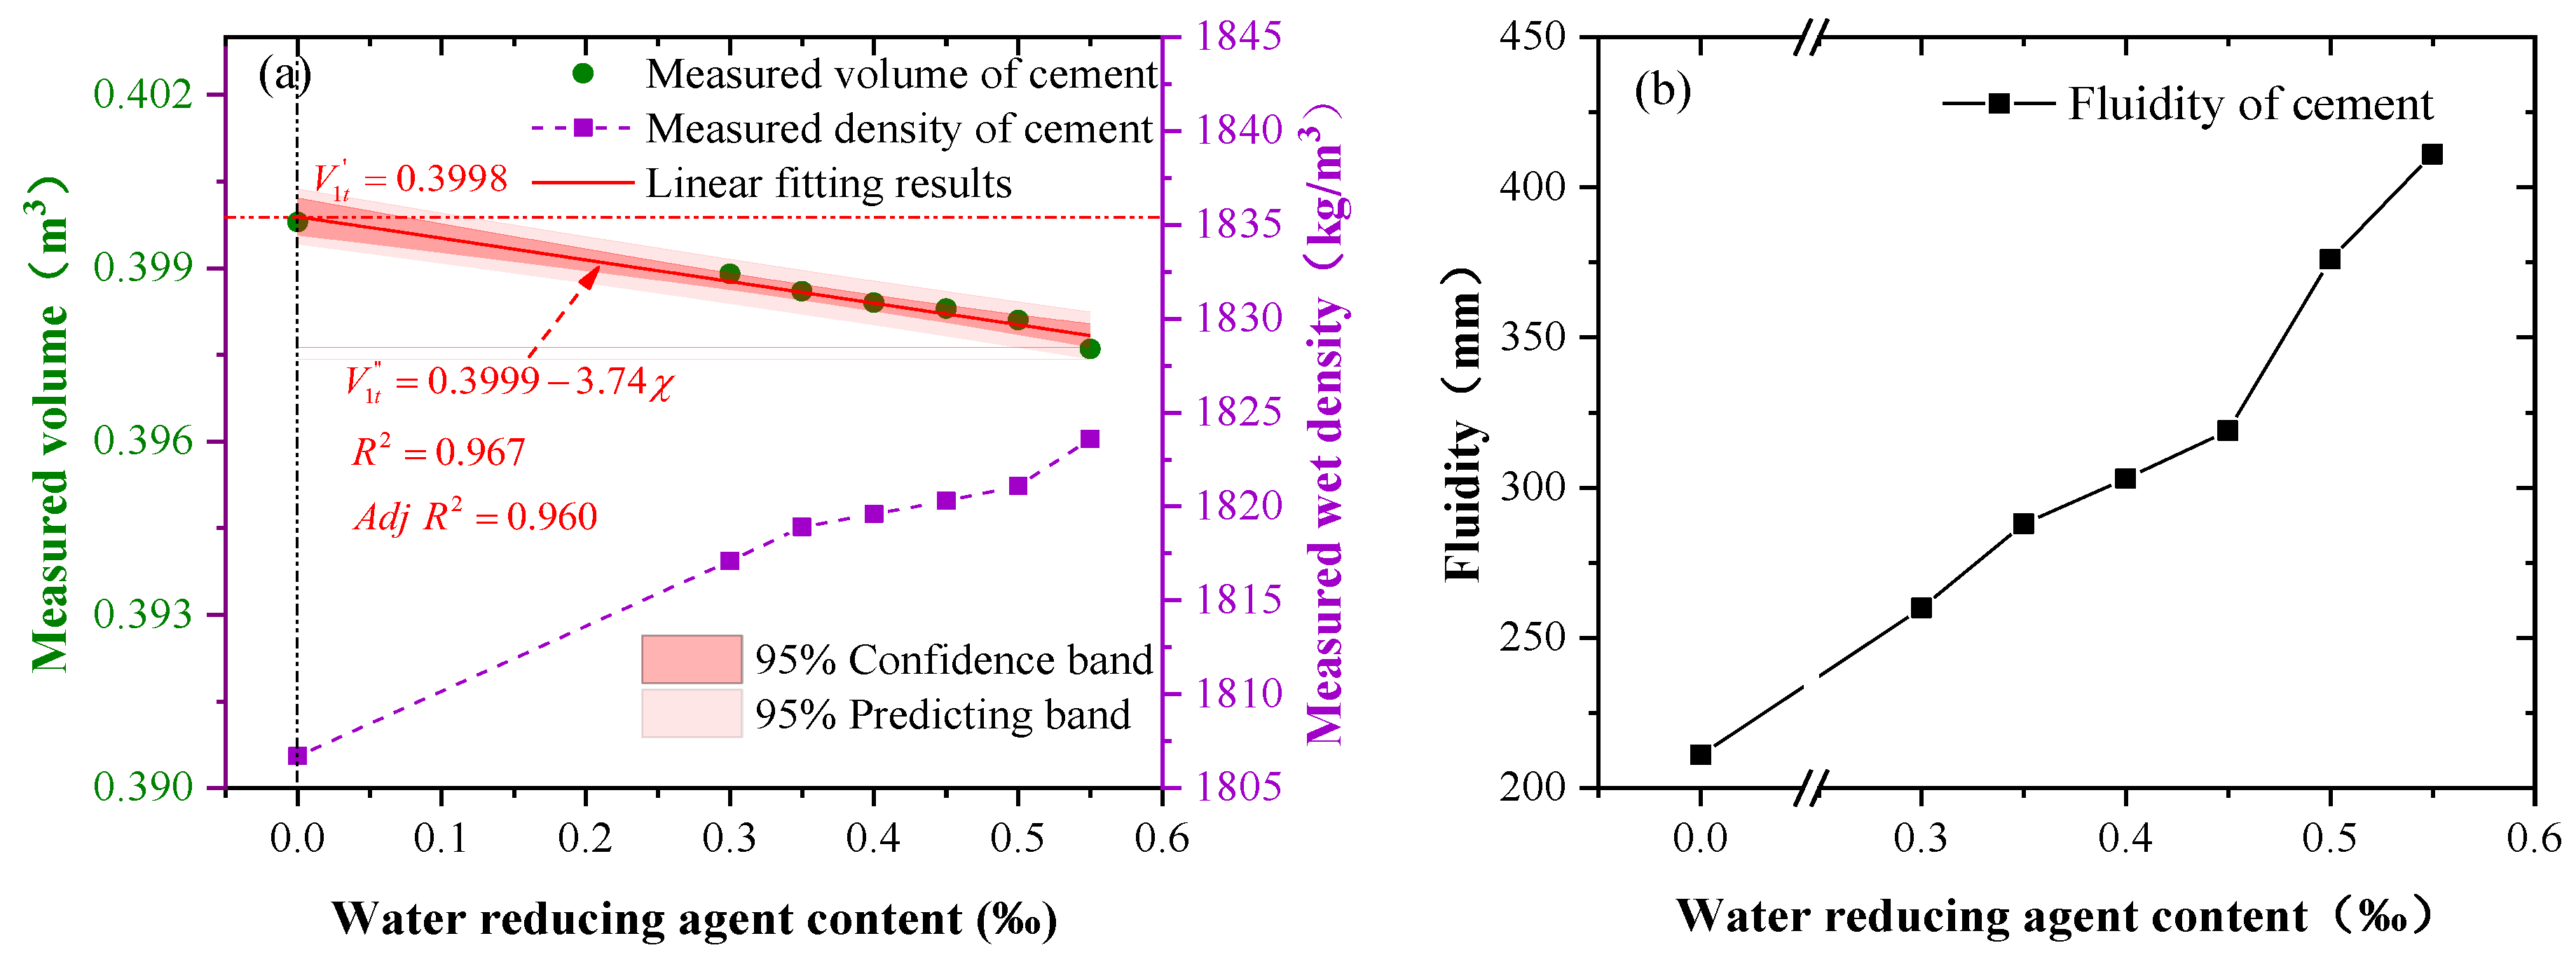
The addition of rubber particles significantly impacts the cement-paste volume, with corresponding size effect coefficients of 1.29, 1.32, 1.37, and 1.84 for different sizes of rubber particles. Smaller rubber particle sizes result in more significant size effect coefficients. Moreover, the inclusion of a water-reducing agent exerts a substantial influence on the volume of the cement paste, and it should not be ignored when predicting the volume of the cement paste. According to the size of rubber particles, the effect coefficients for the water-reducing agent are −26.38, −17.98, −8.64, and −19.41, respectively.
(3)
Fluidity plays a crucial role in forming foamed concrete. The optimal range of fluidity for the foamed-concrete paste is controlled between 200 and 300 mm, as this ratio promotes enhanced foam distribution and improved overall appearance quality of foamed concrete. When designing foam concrete with varying densities, it is recommended to maintain lower flow values for foam concrete with higher density levels, while higher flow values should be maintained for those with low or even ultra-low-density levels.
(4)
Accurate prediction of the cement volume and appropriate foam incorporation are pivotal for achieving the desired design density of foam concrete. Experimental data determined a foam surplus coefficient of 1.1 and a mass coefficient of 1.25, indicating that these parameters are suitable for preparing rubber-foam concrete.
(5)
The regression equation proposed in this paper, based on the volume correction coefficient and water-reducing agent, accurately predicts cement paste’s measured volume and wet density. This finding holds significant guiding implications for enhancing the density-mix design of foamed and rubber-foam concrete. By employing a calculation method that fits various test data and an optimization theory for mix proportion parameters of foamed concrete, researchers are facilitated to conduct further investigations into the application of new admixture foam concrete in specialized industries.

Author Contributions

Methodology, M.S. and W.Z.; Software, M.S.; Validation, G.Y.; Formal analysis, M.S., G.Y. and W.Z.; Investigation, M.S., P.W. and Z.Y.; Writing—original draft, M.S., W.Z., P.W. and J.Z.; Writing—review & editing, G.Y.; Funding acquisition, G.Y. All authors have read and agreed to the published version of the manuscript.

Funding

This research was funded by [the key research and development plan project of Shaanxi Province] Grant Number [2017SF-373]. The authors gratefully acknowledge their financial support.

Data Availability Statement

Data will be made available on request.

Conflicts of Interest

Author Zhaotong Yang was employed by the company Scegc Mechanized Construction Group Co., Ltd. The remaining authors declare that the research was conducted in the absence of any commercial or financial relationships that could be construed as a potential conflict of interest.

Nomenclature

V 1 t the theoretical volume of the cement paste
m c , m f , m s , m w , m r mass of the added cement, fly ash, silica fume, water, and rubber
ρ c , ρ f , ρ s , ρ w , ρ r density of cement, fly ash, silica fume, water, and rubber
φ water–cement ratio
ρ 1 t the theoretical density of the cementitious material paste
V 2 t theoretical added volume of the foam
k foam surplus coefficient
S a dry material mass coefficient
ρ 1 m , ρ 1 m R measured wet density of the paste and rubber cement paste
V 1 m measured volume of the paste
V 2 m the actual volume of foam incorporated
F p m , F p m R fluidity of cement and rubber cement paste
ρ f foam density
FM, SD, BV, HT, FTfoam multiple, 1 h settling distance, 1 h bleeding rate, semi-extinction time, total extinction time
m 0 mass of the container
m 1 mass when filled with foam
m 3 mass of the foam liquid
V 0 the volume of the foam barrel in the foam tester
ρ f l density of the foam solution
ω the defoaming rate
ρ f p t , ρ f p m theoretical calculated and measured density of foam cement paste
ρ f p t R the theoretical calculated density of rubber-foam paste
V e the equivalent volume of foam in the foam paste
V f p m measured volume of foam paste
ρ f c d , ρ f c d R the dry density of foamed and rubber-foamed concrete
M d mass of foamed concrete after drying
V the measured volume of foamed concrete
f c u compressive strength
p 1 failure load
A 1 area of the pressure surface
α volume correction factor
V 1 t , V 1 t R predicted volume value of the modified cement and rubber cement paste
V 1 t , V 1 t R the theoretical volume of the cement and rubber cement with reducing agent
V 1 t r theoretical calculation volume of rubber particles
χ fraction of the water-reducing agent
β size effect coefficient corresponding to different rubber particle sizes
λ percentage of rubber particles
ψ effect coefficient of water-reducing agent corresponding to different rubber particle sizes

References

  1. Sun, Y.; Gao, P.; Geng, F.; Li, H.; Zhang, L.; Liu, H. Thermal conductivity and mechanical properties of porous concrete materials. Mater. Lett. 2017, 209, 349–352. [Google Scholar] [CrossRef]
  2. Wei, P.; Yin, G.; Shi, M.; Zhang, W.; Zhang, J.; Hao, W.; Feng, J. Investigation on properties of phase change foamed concrete mixed with lauric acid-hexadecanol/fumed silica shape-stabilized composite phase change material. Constr. Build. Mater. 2023, 394, 132274. [Google Scholar] [CrossRef]
  3. Xi, H.; Yao, Y.; Sun, Y.; Mobasher, B.; Liu, Y.; Ma, H. Compressive and thermal properties of foamed concrete at high temperature. J. Sustain. Cem. Based Mater. 2022, 11, 353–369. [Google Scholar] [CrossRef]
  4. Huang, J.; Su, Q.; Zhao, W.; Li, T.; Zhang, X. Experimental study on use of lightweight foam concrete as subgrade bed filler of ballastless track. Constr. Build. Mater. 2017, 149, 911–920. [Google Scholar] [CrossRef]
  5. Shi, X.; Huang, J.; Su, Q. Experimental and numerical analyses of lightweight foamed concrete as filler for widening embankment. Constr. Build. Mater. 2020, 250, 118897. [Google Scholar] [CrossRef]
  6. Feng, S.; Zhou, Y.; Wang, Y.; Lei, M. Experimental research on the dynamic mechanical properties and damage characteristics of lightweight foamed concrete under impact loading. Int. J. Impact Eng. 2020, 140, 103558. [Google Scholar] [CrossRef]
  7. Ma, K.; Ren, F.; Huang, H.; Yang, X.; Zhang, F. Experimental investigation on the dynamic mechanical properties and energy absorption mechanism of foam concrete. Constr. Build. Mater. 2022, 342, 127927. [Google Scholar] [CrossRef]
  8. Shi, S.; Kong, X.; Fang, Q. A plastic-damage material model for foam concrete under blast loads. Int. J. Impact Eng. 2023, 177, 104596. [Google Scholar] [CrossRef]
  9. Zhou, H.; Fan, J.; Wang, X.; Ma, G.; Yu, S.; Wang, Y. Protection performance of sacrificial cladding with foam concrete filled aluminum tubes under blast loading. Int. J. Impact Eng. 2023, 179, 104633. [Google Scholar] [CrossRef]
  10. Majeed, S.S.; Othuman Mydin, M.A.; Bahrami, A.; Dulaimi, A.; Özkılıç, Y.O.; Omar, R.; Jagadesh, P. Development of ultra-lightweight foamed concrete modified with silicon dioxide (SiO2) nanoparticles: Appraisal of transport, mechanical, thermal, and microstructural properties. J. Mater. Res. Technol. 2024, 30, 3308–3327. [Google Scholar] [CrossRef]
  11. Liu, Y.; Zhao, D.; Yin, R.; Li, Q.; Wu, X.; Zeng, X.; Qiao, W.; Xu, J. Optimal Mix Design and Mechanical Properties of Rapid-Hardening Foam Concrete. Adv. Civ. Eng. 2024, 2024, 6232941. [Google Scholar] [CrossRef]
  12. Othman, R.; Jaya, R.P.; Muthusamy, K.; Sulaiman, M.; Duraisamy, Y.; Abdullah, M.M.A.B.; Przybył, A.; Sochacki, W.; Skrzypczak, T.; Vizureanu, P.; et al. Relation between Density and Compressive Strength of Foamed Concrete. Materials 2021, 14, 2967. [Google Scholar] [CrossRef] [PubMed]
  13. Savenkov, A.; Zaenec, E.; Ketner, A. Strength of cellular concrete as a function of density under axial uniaxial compression. IOP Conf. Ser. Earth Environ. Sci. 2021, 751, 12067. [Google Scholar] [CrossRef]
  14. Zhang, H.; Wang, J.; Liu, Z.; Ma, C.; Song, Z.; Cui, F.; Wu, J.; Song, X. Strength characteristics of foamed concrete under coupling effect of constant compressive loading and freeze-thaw cycles. Constr. Build. Mater. 2024, 411, 134565. [Google Scholar] [CrossRef]
  15. Li, C.; Li, X.; Guan, D.; Li, S.; Lv, W.; Cong, Z.; Soloveva, V.Y.; Dalerjon, H.; Qin, P.; Liu, X. Study on Influence Factors of Compressive Strength of Low Density Backfill Foamed Concrete Used in Natural Gas Pipeline Tunnel. Sustainability 2022, 14, 8333. [Google Scholar] [CrossRef]
  16. Nguyen, T.T.; Bui, H.H.; Ngo, T.D.; Nguyen, G.D. Experimental and numerical investigation of influence of air-voids on the compressive behaviour of foamed concrete. Mater. Des. 2017, 130, 103–119. [Google Scholar] [CrossRef]
  17. Ramamurthy, K.; Kunhanandan Nambiar, E.K.; Indu Siva Ranjani, G. A classification of studies on properties of foam concrete. Cem. Concr. Compos. 2009, 31, 388–396. [Google Scholar] [CrossRef]
  18. Othuman Mydin, M.A.; Jagadesh, P.; Bahrami, A.; Dulaimi, A.; Özkılıç, Y.O.; Al Bakri Abdullah, M.M.; Jaya, R.P. Use of calcium carbonate nanoparticles in production of nano-engineered foamed concrete. J. Mater. Res. Technol. 2023, 26, 4405–4422. [Google Scholar] [CrossRef]
  19. Guo, S.; Wang, W.; Jia, Z.; Qi, X.; Zhu, H.; Liu, X. Nanoparticle-stabilized foam with controllable structure for enhanced foamed concrete. Constr. Build. Mater. 2023, 362, 129723. [Google Scholar] [CrossRef]
  20. Hao, Y.; Yang, G.; Liang, K. Development of fly ash and slag based high-strength alkali-activated foam concrete. Cem. Concr. Compos. 2022, 128, 104447. [Google Scholar] [CrossRef]
  21. Wei, X.; Wang, H.; Xie, Y.; Du, Y. An experimental investigation on the effect of carboxymethyl cellulose on morphological characteristics of dust-suppression foam and its mechanism exploration. Process Saf. Environ. 2020, 135, 126–134. [Google Scholar] [CrossRef]
  22. Gökçe, H.S.; Hatungimana, D.; Ramyar, K. Effect of fly ash and silica fume on hardened properties of foam concrete. Constr. Build. Mater. 2019, 194, 1–11. [Google Scholar] [CrossRef]
  23. Jose, S.K.; Soman, M.; Evangeline, Y.S. Influence of mixture composition on the properties of foamed concrete. Mater. Today Proc. 2021, 42, 399–404. [Google Scholar] [CrossRef]
  24. Kilincarslan, Ş.; Davraz, M.; Akça, M. The effect of pumice as aggregate on the mechanical and thermal properties of foam concrete. Arab. J. Geosci. 2018, 11, 289. [Google Scholar] [CrossRef]
  25. Mydin, M.A.O.; Hamah Sor, N.; Althoey, F.; Özkılıç, Y.O.; Abdullah, M.M.A.B.; Isleem, H.F.; Deifalla, A.F.; Tawfik, T.A. Performance of lightweight foamed concrete partially replacing cement with industrial and agricultural wastes: Microstructure characteristics, thermal conductivity, and hardened properties. Ain Shams Eng. J. 2023, 14, 102546. [Google Scholar] [CrossRef]
  26. Sepulcre Aguilar, A.; Pinilla Melo, J.; Hernández Olivares, F. Microstructural analysis of aerated cement pastes with fly ash, Metakaolin and Sepiolite additions. Constr. Build. Mater. 2013, 47, 282–292. [Google Scholar] [CrossRef]
  27. Falliano, D.; De Domenico, D.; Ricciardi, G.; Gugliandolo, E. Experimental investigation on the compressive strength of foamed concrete: Effect of curing conditions, cement type, foaming agent and dry density. Constr. Build. Mater. 2018, 165, 735–749. [Google Scholar] [CrossRef]
  28. Ji, Y.; Sun, Q. The Stabilizing Effect of Carboxymethyl Cellulose on Foamed Concrete. Int. J. Mol. Sci. 2022, 23, 15473. [Google Scholar] [CrossRef]
  29. Liu, C.; Wang, X.; Chen, Y.; Zhang, C.; Ma, L.; Deng, Z.; Chen, C.; Zhang, Y.; Pan, J.; Banthia, N. Influence of hydroxypropyl methylcellulose and silica fume on stability, rheological properties, and printability of 3D printing foam concrete. Cem. Concr. Compos. 2021, 122, 104158. [Google Scholar] [CrossRef]
  30. Azree Othuman Mydin, M.; Hamah Sor, N.; Bahrami, A.; Dulaimi, A.; Onuralp Özkılıç, Y.; Althoey, F.; Jagadesh, P.; Isleem, H.F.; Tawfik, T.A. Residual durability, mechanical, and microstructural properties of foamed concrete subjected to various elevated temperatures. Eng. Sci. Technol. Int. J. 2024, 55, 101725. [Google Scholar] [CrossRef]
  31. Ding, Q.; Zhang, Y.; Zhang, G.; Li, Y.; Gong, J.; Zhou, C.; Qian, H. Study of the Effect of Surface-Modified Rubber Particles on the Properties of UHPC Containing Polyoxymethylene Fibers. J. Mater. Civ. Eng. 2023, 35, 4023328. [Google Scholar] [CrossRef]
  32. Liu, B.; Yang, S.; Li, W.; Zhang, M. Damping dissipation properties of rubberized concrete and its application in anti-collision of bridge piers. Constr. Build. Mater. 2020, 236, 117286. [Google Scholar] [CrossRef]
  33. Eltayeb, E.; Ma, X.; Zhuge, Y.; Youssf, O.; Mills, J.E. Influence of rubber particles on the properties of foam concrete. J. Build. Eng. 2020, 30, 101217. [Google Scholar] [CrossRef]
  34. Ji, Y.; Sun, Q. Experimental and numerical investigation of recycled rubber foam concrete. Alex. Eng. J. 2023, 76, 573–594. [Google Scholar] [CrossRef]
  35. Yildizel, S.A.; Özkılıç, Y.O.; Yavuz, A. Optimization of waste tyre steel fiber and rubber added foam concretes using Taguchi method and artificial neural networks. Structures 2024, 61, 106098. [Google Scholar] [CrossRef]
  36. Wang, R.; Gao, P.; Tian, M.; Dai, Y. Experimental study on mechanical and waterproof performance of lightweight foamed concrete mixed with crumb rubber. Constr. Build. Mater. 2019, 209, 655–664. [Google Scholar] [CrossRef]
  37. Ma, Z.; Ma, C.; Du, C.; Zhang, S.; Zhang, H.; Zhang, X.; Zhang, X.; Wang, J.; Tian, M.; Wang, Y. Research on dynamic mechanical properties of polypropylene fiber-modified rubber foamed concrete. Constr. Build. Mater. 2023, 404, 133282. [Google Scholar] [CrossRef]
  38. Ahmadi, S.F.; Reisi, M.; Sajadi, S.M. Comparing properties of foamed concrete and lightweight expanded clay aggregate concrete at the same densities. Case Stud. Constr. Mat. 2023, 19, e02539. [Google Scholar] [CrossRef]
  39. Van, L.T.; Kim, D.V.; Xuan, H.N.; Tho, V.D.; Bulgakov, B.I.; Alexandrova, O.V. Modelling of the effect of the water-cement ratios on properties foam concrete. J. Physics. Conf. Ser. 2019, 1425, 12189. [Google Scholar] [CrossRef]
  40. Zhang, J.; Jiang, N.; Li, H.; Wu, C. Study on mix proportion design of cement foam concrete. IOP Conf. Ser. Mater. Sci. Eng. 2018, 439, 42053. [Google Scholar] [CrossRef]
  41. Khanna, A.R.; Satyanarayana, G.V.V.; Raju, Y.K.; Ramanjaneyulu, N.; Nikhare, C.P.; Perveen, A.; Haider, J.; Purohit, R.; Singh, S.K. Experimental investigation on mix design of foam concrete to fix ingredients for various densities. In Proceedings of the International Conference on Materials, Processing & Characterization, Hyderabad, India, 22–24 April 2022; AIP Conference Proceedings. Volume 2754. [Google Scholar]
  42. Asadzadeh, S.; Khoshbayan, S. Multi-objective optimization of influential factors on production process of foamed concrete using Box-Behnken approach. Constr. Build. Mater. 2018, 170, 101–110. [Google Scholar] [CrossRef]
  43. Adams, T.; Vollpracht, A.; Haufe, J.; Hildebrand, L.; Brell-Cokcan, S. Ultra-lightweight foamed concrete for an automated facade application. Mag. Concr. Res. 2019, 71, 424–436. [Google Scholar] [CrossRef]
  44. Li, J.; Yu, Y.; Kim, T.; Hajimohammadi, A. Unveiling the underlying mechanisms of tensile behaviour enhancement in fibre reinforced foam concrete. Constr. Build. Mater. 2023, 398, 132509. [Google Scholar] [CrossRef]
  45. Shi, M.; Yin, G.; Wei, P.; Zhang, J.; Yang, Z. Mix proportion optimization and early strength development in modified foam concrete: An experimental study. Mater. Res. Express 2023, 10, 65507. [Google Scholar] [CrossRef]
  46. JC/T 2199-2013; Foaming Agents for Foamed Concrete. Standards Press of China: Beijing, China, 2013.
  47. JGT266-2011; Foamed Concrete. Standards Press of China: Beijing, China, 2011.
  48. ASTM C796-2004; Standard Test Method for Foaming Agents for Use in Producing Cellular Concrete Using Preformed Foam. ASTM, Ed. American Standard Testing Method: West Conshohocken, PA, USA, 2004.
  49. JGT/T 341-2014; Technical Specification for Application of Foamed Concrete. Standards Press of China: Beijing, China, 2014.
  50. Othuman Mydin, M.A.; Jagadesh, P.; Bahrami, A.; Dulaimi, A.; Onuralp Özkılıç, Y.; Omar, R. Enhanced fresh and hardened properties of foamed concrete modified with nano-silica. Heliyon 2024, 10, e25858. [Google Scholar] [CrossRef]
  51. Damiani, R.M.; Song, Y.; Lange, D.A. Effect of Waste Rubber Inclusion on the Microstructure and Mechanical Performance of Low-Density Foam Concrete. J. Mater. Civ. Eng. 2024, 36, 04024159. [Google Scholar] [CrossRef]
Figure 1. The treatment process for rubber. (a) Immersion in sodium hydroxide solution for cleaning. (b) Natural air drying. (c) The finished product after treatment.
Buildings 14 02468 g001
Figure 2. Preparation process of rubber-foamed concrete.
Buildings 14 02468 g002
Figure 3. Method for measurement of wet density and fluidity of paste. (a) Wet density. (b) Fluidity.
Buildings 14 02468 g003
Figure 4. Rubber-foamed concrete. (a) Compressive strength test of specimen. (b) Cube specimen. (c) Section view of rubber-foamed concrete.
Buildings 14 02468 g004
Figure 5. Results of volume test of paste with different water–cement ratios. (a) Theoretical and measured values. (b) Volume correction coefficient and fitting result.
Buildings 14 02468 g005
Figure 6. Effect of rubber particle size and content on the physical properties of rubber cement paste. (a) Measured volume and linear fitting results. (b) Fluidity of rubber cement paste.
Buildings 14 02468 g006
Figure 7. Effect of water-reducing agent on measured cement-paste volume, density, and fluidity. (a) Measured volume and density. (b) Fluidity.
Buildings 14 02468 g007
Figure 8. Effect of water-reducing agent content on the paste volume of different rubber particle sizes and fitting curve. (a) Mesh number of 10. (b) Mesh number of 20. (c) Mesh number of 40. (d) Mesh number of 80.
Buildings 14 02468 g008
Figure 9. Effect of stirring time on the defoaming rate of foam paste. (a) k = 1.1. (b) k = 1.2.
Buildings 14 02468 g009
Figure 10. Effect of foam surplus coefficient on the physical parameters of foam paste with different design densities. (a) Theoretical predicted value and measured value of cement-paste volume [48,49]. (b) Wet density error and fluidity.
Buildings 14 02468 g010
Figure 11. Effect of the mass coefficient on the density of foam concrete. (a) Volume prediction and wet density error. (b) Dry density and error value.
Buildings 14 02468 g011
Figure 12. Measured dry density of foam rubber concrete with different particle sizes and dosages. (a) Mesh number of 10. (b) Mesh number of 20. (c) Mesh number of 40. (d) Mesh number of 80.
Buildings 14 02468 g012
Figure 13. Compressive strength of foam rubber concrete with different particle sizes and design densities. (a) Mesh number of 10. (b) Mesh number of 20. (c) Mesh number of 40. (d) Mesh number of 80.
Buildings 14 02468 g013
Table 1. Mix proportion of cementitious material paste volume test.
Serial NumberCement (kg/m3)Fly Ash
(kg/m3)
Silica Fume
(kg/m3)
Cementitious Material (kg/m3)Water–Cement RatioWater
(kg/m3)
V- φ 3545025255000.35175
V- φ 400.40200
V- φ 450.45225
V- φ 500.50250
V- φ 550.55275
Table 2. The mix proportion of rubber particle size and dosage for the paste volume test.
Serial NumberCement (kg/m3)Fly Ash
(kg/m3)
Silica Fume
(kg/m3)
Cementitious Material (kg/m3)Water
(kg/m3)
Rubber
(%)
V-Rxx0045025255002250
V-Rxx022%
V-Rxx044%
V-Rxx066%
V-Rxx088%
Notes: In V-Rxx04, the term “xx” refers to the rubber particle size, while in the subsequent article, V-R2004 represents the experimental group with a rubber particle size of 20 mesh number and an incorporation amount of 4%.
Table 3. Mix proportion of water-reducing agent on cementitious material paste volume test.
Serial NumberCement (kg/m3)Fly Ash
(kg/m3)
Silica Fume
(kg/m3)
Cementitious Material (kg/m3)Water
(kg/m3)
Water Reducing Agent (‰)
V-WRA3045025255002250.30
V-WRA350.35
V-WRA400.40
V-WRA450.45
V-WRA500.50
V-WRA550.55
Table 4. Mix proportions of foam surplus coefficients with different design densities.
Serial NumberDesign Density (kg/m3)Cement (kg/m3)Fly Ash
(kg/m3)
Silica Fume
(kg/m3)
Cementitious Material (kg/m3)Water
(kg/m3)
Water Reducing Agent (‰)
D4k40030016.6516.65333.31500.6
D5k50037520.8520.85416.71880.55
D6k60045025.025.0500.02250.5
D7k80060033.3533.35666.73000.4
D10k100075041.8541.85833.33750.3
Table 5. Mix proportions of the mass coefficient tests with different design densities of foam concrete.
Serial NumberDesign Density (kg/m3)Water Reducing Agent (‰)Mass
Coefficient
Cement
(kg/m3)
Fly Ash
(kg/m3)
Silica Fume
(kg/m3)
Cementitious Material (kg/m3)Water
(kg/m3)
D5Sa1205000.551.20375.020.820.8416.7187.5
D5Sa1251.25360.020.020.0400.0180.0
D5Sa1301.30346.219.219.2384.6173.1
D6Sa1206000.51.20450.025.025.0500.0225.0
D6Sa1251.25432.024.024.0480.0216.0
D6Sa1301.30415.423.123.1461.5207.7
D7Sa1207000.451.20525.029.229.2583.3262.5
D7Sa1251.25504.028.028.0560.0252.0
D7Sa1301.30484.626.926.9538.5242.3
D8Sa1208000.41.20600.033.333.3666.7300.0
D8Sa1251.25576.032.032.0640.0288.0
D8Sa1301.30553.830.830.8615.4276.9
Table 6. Effect of water–cement ratio on paste volume of cementitious materials: density theoretical calculation and test results.
Serial Number φ V 1 t
(m3)
ρ 1 t
(kg/m3)
V 1 m
(m3)
ρ 1 m (kg/m3)Error Value
(%)
F p m
(mm)
V- φ 350.350.34171975.50.35521900.33.81%155
V- φ 400.40.36671909.00.37611861.22.50%183
V- φ 450.450.39171851.00.39961814.31.98%219
V- φ 500.50.41671799.90.42751754.42.53%267
V- φ 550.550.44171754.70.45941687.03.86%304
Table 7. Results of the influence of rubber particle size and content on paste’s measured density and fluidity.
ρ 1 m R (kg/m3) F p m R (mm)
Rubber (%)1020408010204080
01817.81818.91816.41816.3213215216216
2%1803.61801.61795.21789.9220221213210
4%1766.21759.61755.31747.6225220209205
6%1753.61749.41744.91718.3233217205202
8%1749.71747.51738.01678.8245220202192
Table 8. Effect of water reducing agent on paste volume of cementitious material: density theoretical calculation and test results.
Serial NumberPCE
(‰)
V 1 t
(m3)
ρ 1 t
(kg/m3)
V 1 t
(m3)
V 1 m
(m3)
ρ 1 m
(kg/m3)
Error Value (%) F p m
(mm)
V-WRA0000.39161851.40.39980.39991813.40.03%211
V-WRA300.30.39891817.50.25%260
V-WRA350.350.39861818.90.33%288
V-WRA400.40.39841819.60.38%303
V-WRA450.450.39831820.30.40%319
V-WRA500.50.39811821.10.45%376
V-WRA550.550.39761823.60.58%411
Table 9. The results of the measured density and volume of rubber cement paste with different rubber particle sizes and water-reducing agent content.
ρ 1 m R (kg/m3) V 1 t R (m3)
PCE (‰)1020408010204080
01749.71747.517381678.80.437220.437770.440160.45568
0.41790.51776.71751.61707.30.427250.430570.436740.44808
0.4517971779.61752.11711.10.425710.429870.436620.44708
0.518041784.31754.31715.30.424060.428740.436070.44599
0.551810.81788.11758.21719.40.422470.427830.43510.44492
Table 10. Wet density results of foam paste with different design densities.
Serial NumberDesign Density (kg/m3) V 1 t (m3) V 1 t (m3) V 1 m (m3) k V 2 m (m3) ρ f p t (kg/m3) ρ f p m (kg/m3)Wet Density Error F f p m (mm)
D4k114000.26110.26430.26801.10.8052508.3509.20.18%227
D4k121.20.8784510.5482.35.85%210
D5k115000.32690.33170.33291.10.7338627.4621.60.93%233
D5k121.20.8001629.5594.05.98%230
D6k116000.39170.39800.39851.10.6617745.5737.21.13%237
D6k121.20.7218747.7709.25.43%233
D8k118000.52230.53170.52901.10.5181982.7973.50.95%250
D8k121.20.5652984.2939.14.80%235
D10k1110000.65300.65560.65961.10.37441219.91210.60.77%287
D10k121.20.40851220.91179.13.55%256
Table 11. Effect of stirring time on wet density test results of foam paste.
Serial NumberDesign Density (kg/m3) k 2 min4 min6 min8 min10 min
D4k114001.1481.8509.2520.3536.7547.5
D4k121.2456.3482.3501.6514.3528.2
D5k115001.1562.9621.6634.2658.5672.4
D5k121.2545.8594.0593.3607.4621.5
D6k116001.1703.9737.2748.9761.4776.4
D6k121.2698.1709.2740.9758.6773.8
D8k118001.1948.3973.5977.0989.2994.3
D8k121.2861.8939.1902.8915.7927.6
D10k1110001.11188.31210.61228.91238.81244.7
D10k121.21176.41179.11223.01230.31237.9
Table 12. Test results of mass coefficient of foam concrete with different design densities.
Serial NumberDesign Density (kg/m3)PCE (‰) S a V 1 t (m3) V 1 m
(m3)
V 2 m (m3) ρ f p t (kg/m3) ρ f p m (kg/m3)Wet Density Error ρ f c d (kg/m3)Dry Density Error
D5Sa1205000.551.200.33120.33360.7330627.0616.81.62%523.64.72%
D5Sa1251.250.31790.32070.7472603.3593.61.60%507.61.52%
D5Sa1301.300.30560.30810.7611581.4574.71.15%488.8−2.24%
D6Sa1206000.51.200.39800.39990.6601745.5733.21.65%622.23.70%
D6Sa1251.250.38200.38360.6780717.1711.40.79%591.5−1.42%
D6Sa1301.300.36730.36860.6945690.8685.30.80%575.2−4.13%
D7Sa1207000.451.200.46490.46610.5873864.1873.6−1.10%732.34.61%
D7Sa1251.250.44620.44640.6089830.9850−2.30%719.22.74%
D7Sa1301.300.42900.42960.6274800.2781.92.29%669.4−4.37%
D8Sa1208000.41.200.53170.53150.5154982.6990.3−0.78%831.63.95%
D8Sa1251.250.51040.50820.5410944.7942.60.22%791.6−1.05%
D8Sa1301.300.49070.48940.5616909.7919.3−1.06%762.2−4.72%
Table 13. Regression analysis of density and compressive strength of rubber-foamed concrete.
Dependent Variable ( y )Different Rubber SizeIndependent Variable ( x )Rubber ContentR2Expression
y 1 Mesh number of 10Dry density2%0.949 y 1 = 0.0099 x 3.337
4%0.961 y 1 = 0.0094 x 3.207
6%0.974 y 1 = 0.0088 x 3.027
8%0.991 y 1 = 0.0083 x 2.886
y 2 Mesh number of 20Dry density2%0.955 y 2 = 0.0099 x 3.331
4%0.956 y 2 = 0.0096 x 3.256
6%0.952 y 2 = 0.0096 x 3.369
8%0.974 y 2 = 0.0087 x 2.931
y 3 Mesh number of 40Dry density2%0.953 y 3 = 0.0099 x 3.275
4%0.954 y 3 = 0.0097 x 3.272
6%0.959 y 3 = 0.0096 x 3.291
8%0.967 y 3 = 0.0090 x 3.017
y 4 Mesh number of 80Dry density2%0.952 y 4 = 0.0101 x 3.332
4%0.959 y 4 = 0.0097 x 3.221
6%0.965 y 4 = 0.0098 x 3.369
8%0.963 y 4 = 0.0094 x 3.246
Disclaimer/Publisher’s Note: The statements, opinions and data contained in all publications are solely those of the individual author(s) and contributor(s) and not of MDPI and/or the editor(s). MDPI and/or the editor(s) disclaim responsibility for any injury to people or property resulting from any ideas, methods, instructions or products referred to in the content.

