Abstract
This study presents a technology used for the prediction of economic losses to facilities in a given area during an earthquake, thereby enabling the efficient application of performance-based maintenance and seismic strengthening. We also propose an algorithm for the establishment of a reinforcement plan that minimizes earthquake-induced economic losses within a constrained budget. The algorithm incorporates fragility functions from prior research and utilizes an optimization technique for budget allocation, leveraging the target damage ratio concept and constrained optimization. Based on the fragility curve, the probability of occurrence for each damage state for a specific PGA value and the damage rate for each damage state are calculated. From these values, the expected damage ratio (EDR) is estimated. An optimization-based budget allocation algorithm is developed to find the elements that would result in the lowest damage rate for a limited cost. To validate the applicability of the model, we created a hypothetical city with a 30 km × 30 km area containing bridges, embankments, and buildings. The estimated pre- and post-reinforcement damage was assessed in two earthquake scenarios, allowing us to test the effectiveness of the optimization-based budget allocation model in reducing damage. These results suggest that the proposed model offers a viable strategy for efficient seismic strengthening within budgetary constraints.
1. Introduction
Multiple large-scale earthquakes have occurred in various countries over the past several years and have been associated with increased damages to facilities, particularly buildings. In particular, the Turkey earthquake (26 February 2023) and the Sichuan earthquake (19 December 2023) caused large-scale damage to property and inflicted injuries on people. These earthquakes caused significant structural and socioeconomic losses. Of particular concern is infrastructure damage, such as bridge collapses, embankment settlements, and bridge pier lateral displacements, which are significant social infrastructures that can suffer structural damage [1,2,3,4,5,6].
In the Republic of Korea, the Gyeongju earthquake (magnitude of 5.8) [7] in 2016 and the Pohang earthquake (magnitude of 5.6) [7] in 2017 damaged the columns of buildings near the epicenter, including school facilities and houses. In particular, 235 school buildings and more than 1400 houses were affected by half- and full-wave damage during the Pohang earthquake. This level of damage is aligned with the low seismic resistance rate of approximately 20% in Korean buildings. This underscores the urgent need for effective seismic strengthening methods to ensure future stability during earthquakes. Furthermore, Korean roads and railway facilities are vulnerable, and 40% of these structures lack seismic design. The low rate of seismic design adoption in Korea is largely attributed to the continuous strengthening of the country’s seismic design standards over time. As construction codes evolved, numerous structures built in earlier periods did not satisfy the latest seismic design requirements. In addition, many structures constructed before the implementation of the updated standards did not receive adequate reinforcement. This creates the need for an optimization-based model to help identify and prioritize structures that most need seismic strengthening, ensuring safety and compliance with the current standards.
Numerous studies have examined the dynamic behavior of structures in response to earthquakes. Ji et al. [8] evaluated the potential risk of liquefaction associated with the Pohang earthquake [8]. Yun and Han [9] investigated the dynamic behavior of a retaining wall during seismic events, whereas Anh-Dan Nguyen et al. [10] used numerical analysis to assess the dynamic behavior of sheet pile quay walls under earthquake conditions.
However, there is a lack of research on the development of risk assessment models to predict the expected damage in the event of an earthquake and the calculation of optimal reinforcement measures. Seismic hazard mitigation and response strategies have traditionally emphasized reactive measures, focusing on post-earthquake damage restoration. To address this, the Federal Emergency Management Agency (2022) developed an earthquake damage estimation model [11]. However, the use of this model has been limited owing to inherent constraints. Its vulnerability function, derived from actual damage cases, cannot easily account for various ground conditions. Additionally, the function’s values are based solely on data from significant seismic events that caused observable damage. Owing to these limitations, several studies have explored earthquake risk assessment for different structures. The National Disaster Prevention Research Institute (2008) introduced a seismic fragility curve for bridge structures based on numerical analysis tailored to Korean bridge design. Similarly, Mohseni calculated the seismic vulnerability of railroad bridges based on dynamic numerical analysis, based on considerations of variations in bridge extensions and pier heights [12]. Argyroudis and Kaynia (2015) provided earthquake fragility curves for embankment structures in transportation systems, such as highways and railways [13]. These studies demonstrate the efforts expended to broaden the scope of seismic risk assessment by incorporating a wider range of ground conditions and structural variations.
In addition to seismic risk assessment studies, rational budgeting and budget allocation for seismic risk mitigation are critical areas of research for effective seismic risk management. Various studies have explored methods for optimizing the distribution of resources for earthquake preparedness and damage reduction. Motamed et al. (2014) developed an automated model that uses optimization techniques to allocate budgets for earthquake mitigation, considering both pre- and post-earthquake expenditures [14]. Shi et al. (2021) proposed a joint optimization approach for budget allocation and maintenance planning to enhance resource efficiency in seismic strengthening [15]. However, there is a gap in the integration of comprehensive risk assessments with optimization-based budget strategies. Although several studies [16,17,18] have discussed specific aspects of seismic risk mitigation, they have not provided a holistic framework for seismic risk assessment in combination with budget optimization.
This paper proposes a holistic method for seismic risk assessment and budget allocation optimization for proactive seismic risk management. First, we establish a seismic risk assessment model to estimate the economic losses to structures in a specific region to support performance-based maintenance and seismic strengthening strategies. We then develop a budget allocation model that uses an optimization approach to incorporate the proposed seismic risk assessment scheme. This model creates a reinforcement plan that aims to minimize earthquake-induced economic losses while maintaining the budget within a constrained limit. This study incorporated certain assumptions and simplifications related to structural types and geographic locations, acknowledging the influence of these factors on the resulting models.
2. Analysis Methods
2.1. Establishment of an Earthquake Risk Assessment Model
In this paper, an earthquake risk assessment model is proposed to evaluate the potential damage caused by an earthquake in a specific area. A seismic risk assessment model was derived for buildings that are relatively vulnerable to earthquakes and for road transportation networks that are essential for disaster response.
Seismic risk assessment models can be classified into hazard models for earthquake disasters, inventory models for structures, and vulnerability models that encompass both disasters and structures. For hazard modeling, the peak ground acceleration (PGA) is assumed to be attenuated by the ratio of distance from the epicenter when an earthquake occurs. The actual PGA is affected by the ground conditions through which seismic waves propagate. However, in this study, the ground was assumed to be hard rock with no ground amplification. Only attenuation with distance was considered in the development of the seismic risk assessment model. Because the soil type and ground amplification only affect the PGA value, and the fragility curve is only a function of the PGA, the overall model will work well even if actual soil classification and ground amplification are applied.
By setting the depth of the earthquake and the PGA at the epicenter, the distance ratio at each location can be calculated; based on this distance, the PGA values at all structural locations are obtained. In inventory modeling, structures are divided into buildings, embankments, and bridges. Transportation facilities are mainly divided into embankments, bridges, and tunnels. However, because tunnels are classified as structures with relatively low earthquake vulnerability [19,20], they were excluded from the risk assessment model in this study.
We used inventory and hazard modeling to calculate the properties of the structure according to the geological location and the maximum ground acceleration at that location. Based on this, vulnerability modeling was proposed to estimate the damage that a structure can suffer when the PGA value is applied to the structure. In vulnerability modeling, the seismic fragility curve is frequently utilized to express the exceedance probability of a certain damage state as a function of the PGA. Seismic vulnerability represents the probability of exceedance for each damaged structure state as a function of earthquake magnitude, such as peak ground acceleration. The probability of exceedance is defined as the probability of damage occurring beyond a certain state. Therefore, the seismic fragility model is represented as a distribution of the exceedance probabilities for each damage state. The exceedance probability for each damage state is defined by the median and the standard deviation of the median (, where is calculated from the uncertainty of the ground motion and the uncertainty of the structural damage. Previous studies have presented the median and values for each damage state based on various analytical and empirical cases; these results were utilized in this study. In the case of buildings and embankments, results from international research studies were used because localized functions do not exist in Korea. In the case of bridges, localized functions developed in Korea were applied to develop a model suitable for Korean conditions. The damage states were categorized as slight, moderate, extensive, or complete. For example, as shown in Figure 1, for the seismic vulnerability function of a building, the probability of minor damage was approximately 60% at a PGA level of approximately 0.3 g. The seismic fragility curves applied in this study used the seismic vulnerability function from the existing literature, and the seismic fragility curves before and after reinforcement were applied to consider the reinforcement effect. The seismic fragility curves of buildings were taken from the Federal Emergency Management Agency (2022) [11] without the seismic design fragility and mid-code seismic design fragility curves (Figure 1), and the seismic fragility curves before and after seismic strengthening (Figure 2) were from the National Disaster Prevention Research Institute (2008) [21]. The seismic fragility curves proposed by Argyroudis and Kaynia [13] for soft and stiff embankments are shown in Figure 3. Figure 2 and Figure 3 were drawn by authors based on previous research. Since the fragility function before and after seismic strengthening has not been presented in previous research, a fragility curve without seismic design was applied to the function before seismic strengthening, and a fragility curve with seismic design was applied to the function after seismic strengthening. This is a reasonable assumption because the seismic strengthening standard requires a similar level of seismic performance to that of the seismic design standard.
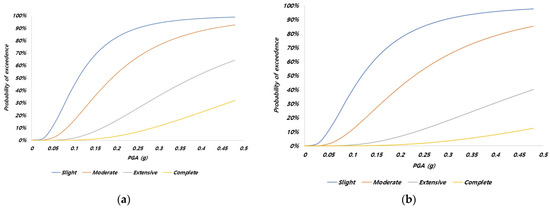
Figure 1.
Seismic fragility curves for buildings (Federal Emergency Management Agency, 2022) [11]. (a) Without strengthening and (b) with strengthening.
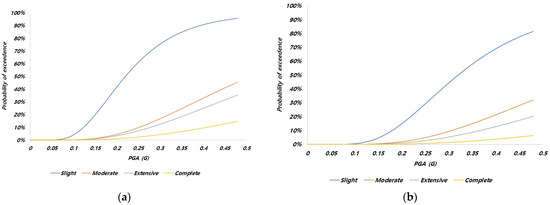
Figure 2.
Seismic fragility curves for bridges. (a) Without strengthening and (b) with strengthening.
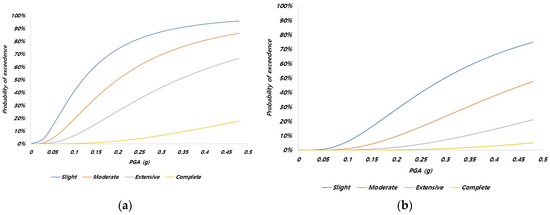
Figure 3.
Seismic fragility curves for embankments. (a) Without strengthening and (b) with strengthening.
The probability of exceedance of each damage state for the PGA value at each location was calculated and combined with the damage ratio for each damage state to determine the expected value of the damage caused by the earthquake, that is, the expected damage ratio. Herein, a model to calculate the expected damage rate is proposed based on the type of structure, seismic strengthening, and earthquake magnitude. The expected damage rate for each damage state utilized data from the Federal Emergency Management Agency (2022) [11] (Table 1).

Table 1.
Damage ratio for each damage state [11].
2.2. Development of an Optimization-Based Budget Allocation Algorithm for Seismic Strengthening
In this study, an optimization-based budget allocation algorithm is proposed to achieve optimal seismic strengthening within a given budget constraint. An overview of the proposed budget allocation algorithm is presented in Figure 4. The proposed algorithm uses the risk assessment model described in the previous section to screen infrastructure assets for seismic strengthening and estimate the total budget required to retrofit all screened assets. Subsequently, an optimization task was performed to obtain an optimal budget allocation strategy by minimizing an objective function designed to optimize the reduction in the overall structural damage ratio and the replacement cost of the screened assets. Further details on the proposed budget allocation algorithm are provided below.
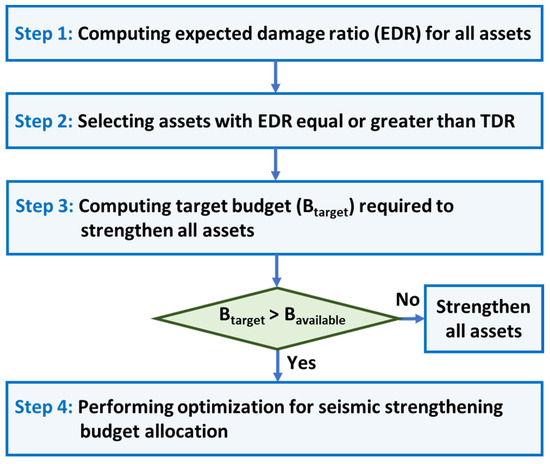
Figure 4.
An overview of the proposed seismic strengthening budget allocation algorithm.
In this study, three types of assets were considered: bridges, embankments, and buildings. Before applying the budget allocation algorithm, the following parameters were set: (1) the target damage ratio level for each infrastructure asset type, (2) the individual retrofit cost for each asset, and (3) budget constraints. Once the parameters were set, the algorithm performed as follows:
In Step 1, the expected damage ratios (EDRs) for all given infrastructure assets were estimated using the fragility curves of the assets described in the previous section. The EDR for each infrastructure asset is calculated by aggregating the product of each damage state’s probability and its corresponding damage rate, summed across all potential damage states. Given an earthquake scenario with an earthquake location , depth , and magnitude at the epicenter , the PGAs for all the assets were estimated. The computed PGA for the ith asset located at is as follows,
where is the distance between the ith asset and the earthquake hypocenter, expressed as
The computed PGA values for the assets were then input into the following function to estimate the EDR,
where , , , and are the asset type-specific net cumulative probability distribution functions in which damage may occur with slight, moderate, extensive, and complete severity levels, respectively. Each net probability function is a function of the type of asset and . In Equation (3), , , , and represent the corresponding asset type-specific damage ratios listed in Table 1.
In Step 2, asset screening was performed to determine the priority of seismic strengthening by comparing the EDR and target damage ratio (TDR) levels for each asset. Among the total N infrastructure assets, assets with EDR ≥ TDR are considered in the budget allocation step (Step 3) but assets with EDR < TDR are not. The TDR levels for each infrastructure asset type are shown in Table 2.
Table 2.
Target damage ratio for bridges, embankments, and buildings.
In Step 3, the target budget () required to reinforce all the screened assets in Step 2 is computed, from which we determine whether budget allocation is required. In this study, we assumed a simple reinforcement scenario in which seismic strengthening is implemented based on an asset at a given cost to reduce the damage ratio of the considered asset. is computed as follows,
where is the reinforcement cost for the ith asset depending on its asset type, and is the binary weight, expressed as follows,
where denotes the TDR of the ith asset. We set the TDR threshold values to 5%, 10%, and 3% for bridges, embankments, and buildings, respectively (Table 2), considering the nature of each asset type, earthquake vulnerability, and population. was then compared with the available budget (). When , budget allocation was required and optimization was performed in the subsequent step. In cases where , budget allocation was not needed as all the screened assets could be reinforced with .
In Step 4, optimization-based budget allocation was performed when by solving the following constrained optimization problem,
where is the objective function used to minimize
where is the kth element of the allocation weight vector , whose value can be one or zero. is the number of assets with EDR > TDR. Here, = 1 indicates that the kth asset among assets was selected for seismic strengthening, whereas = 0 indicates that the kth asset was unselected. The symbol in Equation (7) is a regularization factor that controls the significance of the regularization function given by
where is the value of the kth infrastructure asset and has units of 1 × 10⁹ KRW. The first term in the objective function in Equation (7) reduces the overall damage levels of the assets, and the second term reduces the total earthquake loss. The formulated optimization problem (Equation (6)) has a constraint condition that limits the solution space for the total reinforcement cost of the optimally selected assets to . The optimal solution for was obtained using an optimization solver. In this study, we used constrained optimization via the linear approximation (COBYLA) algorithm [22] implemented in the Python library SciPy [23]. COBYLA is a numerical optimization method for solving nonlinear, derivative-free problems where the objective function and constraints can be non-linear, and derivatives are either unavailable or impractical to compute. COBYLA operates by approximating the objective function and constraints linearly to guide the search for the optimal solution within a feasible region. Specifically, it uses a trust-region approach to manage the size of the steps taken in the parameter space, ensuring that the approximations remain valid over the search process. Each iteration involves solving a linearly constrained minimization problem in a trust region around the current point. COBYLA iteratively refines its estimate by solving a linearized version of the optimization problem seen in Equation (7) within a dynamically adjusted trust region radius, which is adjusted based on the solution’s improvement in terms of objective function reduction and constraint satisfaction. Descriptions of the COBYLA algorithm and its diverse applications in scientific and engineering contexts can be found elsewhere [24,25,26,27]. Once the optimal is obtained by solving the optimization problem, budget allocation is finalized by multiplying and .
3. Results
3.1. Earthquake Risk Assessment Model
To apply the proposed risk assessment model, the authors assumed a simplified, specific testbed region, including bridges, embankments, and buildings. For the seismic risk assessment, 76 simplified structures (20 bridges, 27 embankments, and 29 buildings) were assumed to be distributed over an area of 30 km × 30 km. The asset values of the bridges, embankment sections, and buildings were assumed to be KRW 10, 5, and 1 billion, respectively. Actual structures, bridges, embankments, and buildings have different asset values depending on their characteristics, and the vulnerabilities of these structures are also different. However, to evaluate the applicability of the earthquake risk assessment and optimization-based budget allocation algorithm, this study assumes that the structures constructed are all the same, and the asset value is assumed to be the same in each structure type. In addition, the earthquake risk assessment covered in this study is limited to primary damage and does not consider secondary damage due to infrastructure interdependencies, such as logistical damage caused by damage to bridges and embankments. The structures are assumed to be distributed in two cases. The first case assumes that road transportation facilities, bridges, and embankments are constructed linearly, and buildings are placed around them. The second case assumes that the same number of structures is randomly distributed over a 30 km × 30 km area. In addition, we analyzed the location of the earthquake that caused the maximum damage. First, in case 1, a PGA of 0.3 g, which is the PGA of a 4800-year return period of an earthquake based on the Korean seismic design code (MOITT, 2023), was assumed to occur at the epicenter, and an earthquake depth of 20 km, which is the depth of a recent earthquake in Korea, was applied to calculate the locations of the maximum damage among possible earthquakes. For the earthquake applied in this study, Korean seismic design standards were used, and for application in other regions, it is necessary to apply earthquakes that take into account regional characteristics. For the earthquake location with the maximum damage, an iterative operation was used to generate the same earthquake for each location and calculate the earthquake location. For case 2, a PGA at the epicenter equal to 0.4 g and an earthquake depth of 30 km were applied to assume that a larger earthquake occurred at an increased depth. The distribution of the structures in each case is shown in Figure 5 and the calculated earthquake scenarios are summarized in Table 3.
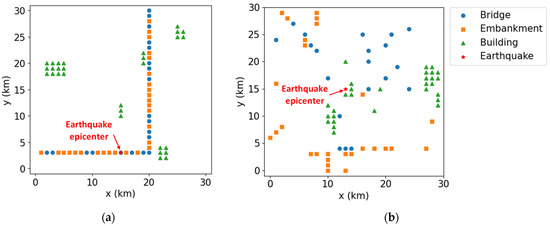
Figure 5.
Two earthquake scenarios with different asset placements: (a) Case 1 and (b) Case 2.
Table 3.
Two earthquake scenarios considered in this study.
The damage costs for each type of structure before and after reinforcement in each earthquake scenario are listed in Table 4. Bridges with relatively high-asset values and embankments with high vulnerabilities were calculated as these structures were considered to have significant damages. In addition, the estimated damage cost decreased significantly with reinforcement, and the reduction ratio of the damage cost was larger in Case 1, which had a relatively small earthquake magnitude. This is because the seismic vulnerability function decreased more significantly with reinforcement for smaller PGA values.
Table 4.
Predicted damage in two earthquake scenarios.
3.2. Optimization-Based Budget Allocation Algorithm for Seismic Strengthening
To evaluate the performance of the proposed optimal budget allocation algorithm developed in Materials and Methods, we performed numerical experiments considering the two earthquake scenarios listed in Table 3 with regard to different locations, depths, and magnitudes at the epicenter. The reinforcement costs were assumed to be 6% of the asset value, as listed in Table 5, and was set to KRW 11,000 × 106 in each case.
Table 5.
Asset value and reinforcement cost for each structure.
Figure 6 presents the results of the EDR computation, showing assets with EDR > TDR based on the earthquake scenarios listed in Table 3. The results were used to compute the target budget for the two numerical experiments. In Case 1, in 56 of the 76 assets, EDR > TDR, indicating the need for earthquake reinforcement (Figure 6a). The computed corresponding value was KRW 16,140 × 106. In Case 2, all 76 assets adhered to the inequality EDR > TDR, resulting in a of KRW 21,840 × 106 (Figure 6b). The higher EDR levels in Case 2 compared with those in Case 1 resulted from the relatively high earthquake magnitude at the epicenter and the favorable earthquake location (i.e., near the center of the asset placements). Notably, the results of the two cases show that both earthquake scenarios result in a limited reinforcement budget (); hence, not all assets with EDR > TDR can be reinforced, revealing the necessity for optimal budget allocation for seismic strengthening.
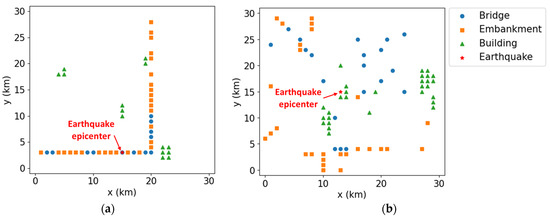
Figure 6.
Assets with an expected damage ratio greater than the target damage ratio: (a) Case 1 and (b) Case 2.
The earthquake reinforcement budget allocation results obtained using the proposed optimization-based algorithm are presented in Figure 7 and Table 6. In Case 1, among the 53 assets with EDR, 28 were selected for reinforcement using the TDR algorithm (Figure 7a). In this case, the total budget allocated to the 28 assets was KRW 10,800 × 106, which is within and close to (KRW 11,000 × 106). For comparison, in Case 2, 31 assets were selected for reinforcement by the algorithm (Figure 7b), resulting in a total allocated budget of KRW 10,500 × 106. For Case 1 (Figure 7a), the assets close to the earthquake source (indicated by the red star) were selected using the algorithm. In addition, because of the high EDR and short replacement duration, more embankments were selected than other assets. Buildings were not selected, likely because of their tendency toward a low EDR and long replacement duration. A similar output tendency of the budget allocation algorithm was observed for Case 2 (Figure 7b); more embankments were selected than other assets. Overall, the results of the numerical experiments demonstrated the feasibility of the proposed budget allocation algorithm for optimal earthquake reinforcement.
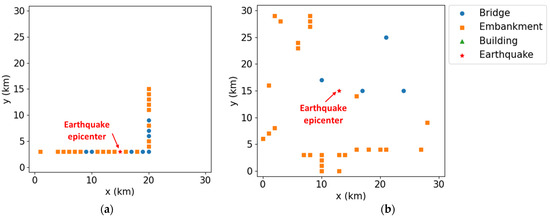
Figure 7.
Earthquake reinforcement budget allocation results: assets selected for reinforcement by the proposed algorithm for (a) Case 1 and (b) Case 2.
Table 6.
Budget allocation results.
Embankments are more vulnerable to earthquakes than buildings owing to the risk of liquefaction and permanent deformation caused by seismic activity. A recent study that derived fragility curves for various embankments and soil profile geometries showed that embankments are susceptible to significant damage owing to earthquake-induced liquefaction [28]. In contrast, buildings are designed with seismic resistance in mind, often based on seismic design strategies such as base isolation, braced frames, and moment-resistant frames to withstand earthquake forces [29,30]. The primary failure modes of buildings, such as soft first stories and torsional failure, can be addressed with proper engineering; however, embankments can suffer more severe and less predictable damage owing to ground instability. Given these considerations, the seismic strengthening budget allocation results derived from the proposed algorithm appear to be reasonable and justifiable.
As an early step of research, we simplified earthquake scenarios to establish a controlled environment where the capabilities of our proposed approach are tested. However, these scenarios may not fully represent the complexities of real-world metropolitan settings and their diverse infrastructure systems, such as building materials and construction codes. Therefore, the expected damage ratio could be overestimated or underestimated. In future research, more realistic settings with real-world data and complex scenarios can be considered.
4. Discussion
This study outlines a methodological approach for optimizing seismic retrofit budget calculations, but it involves significant simplifications in the data. Consequently, this approach does not account for a broad range of ground conditions and relies solely on distance-based attenuation for earthquake acceleration. Nevertheless, the actual PGA values can be incorporated by using simple one-dimensional site response analysis when evaluating real-world ground conditions. Thus, the proposed algorithm is applicable.
One limitation is the uniformity of the structures because each type of structure is represented by the same model. However, this limitation can be addressed by adjusting asset values and vulnerability functions based on specific structural investigations. In addition, more precise results can be achieved by incorporating newly developed pre- and post-reinforcement vulnerability curves for various structural types, thereby providing a broader spectrum for seismic risk analysis. Ultimately, the described approach offers a flexible framework that can be adapted and refined using additional data and sophisticated analyses. Moreover, in large-scale applications for a large complex urban region with many assets, the computational cost to obtain the optimal budget allocation solution can be significant. In this case, a modular approach that divides a large urban region into smaller, manageable sub-regions can be implemented. This segmentation can reduce the computational load by allowing parallel processing of smaller, independent problems that collectively contribute to the overall solution.
The generalizability and applicability of the proposed optimization-based budget allocation model are critical considerations for its broader impact. Although the model was developed with a focus on seismic strengthening in Korea, it is essential to evaluate its transferability to other regions or countries with distinct seismic characteristics. Variations in geological conditions, seismicity patterns, and structural vulnerabilities may pose challenges to the seamless adaptation of the model. Future research should explore the robustness and adaptability of the model across diverse contexts by considering the need for region-specific adjustments. In addition, incorporating local seismic data can enhance the generalizability of the budget allocation model, making it a valuable tool for proactive seismic risk management on a global scale. Addressing these aspects will contribute to the broader applicability of the model and ensure its effectiveness in aiding decision-making processes in different seismic-prone regions.
This study relied on several assumptions and simplifications regarding the types and placement of structures, which may not entirely reflect real-world scenarios or specific local characteristics. In addition, this research cannot consider interdependencies or cascade effects across various infrastructure types, such as logistical damage caused by damage to bridges and embankments. Therefore, the estimated damage and strength of an actual earthquake could increase or decrease significantly. However, this regional seismic risk assessment and optimization-based budget allocation model will work equally well with complex structure types and corresponding seismic fragility curves, as well as with seismic acceleration amplification due to ground classification, since the model’s construction algorithm is reasonable and there are no constructional issues. Therefore, the suggested model in this study is expected to be effective in more complex real-world contexts, provided that accurate seismic vulnerability functions for each structure type, structural information, such as construction year, construction type, occupancy, etc., and their exact locations are known. To ensure broader applicability, additional research is required to create seismic vulnerability functions that closely align with the actual structure types and their unique attributes. Future studies should focus on the development of a broader range of seismic fragility functions that reflect the diversity of real-world structures, allowing seismic risk assessment and optimization-based budget allocation models to be refined and improved. This approach enhances the reliability and robustness of the model and ensures its effectiveness in practical applications. Finally, we believe that validation based on damage data from actual earthquakes is necessary to make the model practical.
5. Conclusions
This study aimed to offer a proactive solution for earthquake preparedness by moving away from the traditional reactive approaches that focus on reinforcement after a seismic event. Current seismic strengthening in Korea involves the assessment of vulnerable sections after earthquakes and the budget is used to repair damaged areas. This reactive approach implies that resources are allocated only after the occurrence of a disaster. The proposed solution allows for the identification of critical reinforcement locations ahead of time, thereby minimizing the potential damage from a predicted earthquake within a constrained budget. This proactive approach can significantly influence government decision-making as it enables a more strategic allocation of resources and promotes cost-effective disaster preparedness. Based on these findings, policymakers can make informed decisions regarding seismic strengthening and budget planning, leading to enhanced safety and reduced post-earthquake restoration costs. However, in addition to the financial aspect, real-world decision-making processes incorporate a broader range of aspects, including social equity, the strategic importance of certain infrastructures, and even political influences. These factors can significantly affect the prioritization and allocation of resources for seismic strengthening, although they are not considered in the optimization process in this study. Incorporating such broader aspects of decision-making in earthquake strengthening into the optimization process can be a future research direction.
Author Contributions
S.K.: Writing–original draft preparation, methodology. J.K.: Writing—review and editing, conceptualization, visualization. H.S.: Writing—review and editing, methodology, validation M.Y.: Writing—review and editing, methodology, supervision, project administration. The authors confirm that this work has not been published before, and its publication has been approved by all co-authors. All authors have read and agreed to the published version of the manuscript.
Funding
This research was supported by the Korea Agency for Infrastructure Technology Advancement (KAIA) grant funded by the Ministry of Land, Infrastructure and Transport (Grant No. RS-2023-00238018). We appreciate the kind of support provided.
Data Availability Statement
The data presented in this study are available in this article.
Conflicts of Interest
The authors declare no conflicts of interest.
References
- Ogura, M. The Niigata Chuetsu earthquake-railway response and reconstruction. Jpn. Railw. Transp. Rev. 2006, 43/44, 46–63. [Google Scholar]
- Koseki, J.; Koda, M.; Matsuo, S.; Takasaki, H.; Fujiwara, T. Damage to railway earth structures and foundations caused by the 2011 off the Pacific Coast of Tohoku Earthquake. Soils Found. 2012, 52, 872–889. [Google Scholar] [CrossRef]
- Park, J.; Towashiraporn, P. Rapid seismic damage assessment of railway bridges using the response-surface statistical model. Struct. Saf. 2014, 47, 1–12. [Google Scholar] [CrossRef]
- Tsubaki, R.; Bricker, J.D.; Ichii, K.; Kawahara, Y. Development of fragility curves for railway embankment and ballast scour due to overtopping flood flow. Nat. Hazards Earth Syst. Sci. 2016, 16, 2455–2472. [Google Scholar] [CrossRef]
- Lai, Z.; Kang, X.; Jiang, L.; Zhou, W.; Feng, Y.; Zhang, Y.; Yu, J.; Nie, L. Earthquake influence on the rail irregularity on high-speed railway bridge. Shock Vib. 2020, 2020, 4315304. [Google Scholar] [CrossRef]
- Che, F.; Yin, C.; Zhao, X.; Hu, Z.; Sheng, L.; Liu, D. Embankment seismic fragility assessment: A case study on Xi’an-Baoji expressway (China). PLoS ONE 2021, 16, e0246407. [Google Scholar] [CrossRef]
- Korea Meteorological Administration; Annual report; Korea Meteorological Administration: Seoul, Republic of Korea, 2017.
- Ji, Y.; Kim, B.; Kim, K. Evaluation of liquefaction potentials based on shear wave velocities in Pohang City, South Korea. Int. J. Geo-Eng. 2021, 12, 3. [Google Scholar] [CrossRef]
- Yun, J.W.; Han, J.T. Dynamic behavior of pile-supported wharves by slope failure during earthquake via centrifuge tests. Int. J. Geo-Eng. 2021, 12, 33. [Google Scholar] [CrossRef]
- Nguyen, A.-D.; Nguyen, V.-T.; Kim, Y.S. Finite element analysis on dynamic behavior of sheet pile quay wall dredged and improved seaside subsoil using cement deep mixing. Int. J. Geo-Eng. 2023, 23, 9. [Google Scholar] [CrossRef]
- Federal Emergency Management Agency. HAZUS Earthquake Model Technical Manual; Federal Emergency Management Agency: Washington, DC, USA, 2022. [Google Scholar]
- Mohseni, M. Dynamic Vulnerability Assessment of Highway and Railway Bridges; The University of Nebraska: Lincoln, NE, USA, 2012. [Google Scholar]
- Argyroudis, S.; Kaynia, A.M. Analytical seismic fragility functions for highway and railway embankments and cuts. Earthq. Eng. Struct. Dyn. 2015, 44, 1863–1879. [Google Scholar] [CrossRef]
- Motamed, H.; Khazai, B.; Ghafory-Ashtiany, M.; Amini-Hosseini, K. An automated model for optimizing budget allocation in earthquake mitigation scenarios. Nat. Hazards 2014, 70, 51–68. [Google Scholar] [CrossRef]
- Shi, Y.; Xiang, Y.; Xiao, H.; Xing, L. Joint optimization of budget allocation and maintenance planning of multi-facility transportation infrastructure systems. Eur. J. Oper. Res. 2021, 288, 382–393. [Google Scholar] [CrossRef]
- Caterino, N.; Azmoodeh, B.M.; Manfredi, G. Seismic risk mitigation for a portfolio of reinforced concrete frame buildings through optimal allocation of a limited budget. Adv. Civ. Eng. 2018, 2018, 8184756. [Google Scholar] [CrossRef]
- Gu, W.; Qiu, J.; Hu, J.; Tang, X. A Bayesian decision network–based pre-disaster mitigation model for earthquake-induced cascading events to balance costs and benefits on a limited budget. Comput. Ind. Eng. 2024, 191, 110161. [Google Scholar] [CrossRef]
- Vaziri, P.; Davidson, R.A.; Nozick, L.K.; Hosseini, M. Resource allocation for regional earthquake risk mitigation: A case study of Tehran, Iran. Nat. Hazards 2010, 53, 527–546. [Google Scholar] [CrossRef]
- Tsinidis, G.; de Silva, F.; Anastasopoulos, I.; Bilotta, E.; Bobet, A.; Hashash, Y.M.A.; He, C.; Kampas, G.; Knappett, J.; Madabhushi, G.; et al. Seismic behaviour of tunnels: From experiments to analysis. Tunn. Undergr. Sp. Technol. 2020, 99, 103334. [Google Scholar] [CrossRef]
- Jaramillo, C.A. Impact of seismic design on tunnels in rock—Case histories. Undergr. Sp. 2017, 2, 106–114. [Google Scholar] [CrossRef]
- National Disaster Prevention Research Institute. A Study on the Localization of the Seismic Fragility Function of Railway Facilities; National Disaster Prevention Research Institute: Kyoto, Japan, 2008. [Google Scholar]
- Powell, M.J.D. A direct search optimization method that models the objective and constraint functions by linear interpolation. In Advances in Optimization and Numerical Analysis; Gomez, S., Hennart, J.P., Eds.; Kluwer Academic Publishers: New York, NY, USA, 1994; pp. 51–67. [Google Scholar]
- Virtanen, P.; Gommers, R.; Oliphant, T.E.; Haberland, M.; Reddy, T.; Cournapeau, D.; Burovski, E.; Peterson, P.; Weckesser, W.; Bright, J.; et al. SciPy 1.0: Fundamental algorithms for scientific computing in Python. Nat. Methods 2020, 17, 261–272. [Google Scholar] [CrossRef]
- Powell, M.J. A view of algorithms for optimization without derivatives. Math. Today-Bull. Inst. Math. Its Appl. 2007, 43, 170–174. [Google Scholar]
- Altieri, D.; Tubaldi, E.; De Angelis, M.; Patelli, E.; Dall’Asta, A. Reliability-based optimal design of nonlinear viscous dampers for the seismic protection of structural systems. Bull. Earthq. Eng. 2018, 16, 963–982. [Google Scholar] [CrossRef]
- Zhang, Z.; Zhang, C.; Qiao, Y.; Zhou, Y.; Wang, S. Design and mass optimization of numerical models for composite wind turbine blades. J. Mar. Sci. Eng. 2023, 11, 75. [Google Scholar] [CrossRef]
- Bonet-Monroig, X.; Wang, H.; Vermetten, D.; Senjean, B.; Moussa, C.; Bäck, T.; Dunjko, V.; O’Brien, T.E. Performance comparison of optimization methods on variational quantum algorithms. Phys. Rev. A 2023, 107, 032407. [Google Scholar] [CrossRef]
- Oblak, A.; Kosič, M.; Viana Da Fonseca, A.; Logar, J. Fragility assessment of traffic embankments exposed to earthquake-induced liquefaction. Appl. Sci. 2020, 10, 6832. [Google Scholar] [CrossRef]
- Kim, J.H.; Hessek, C.J.; Kim, Y.J.; Park, H.G. Seismic analysis, design, and retrofit of built-environments: A procedural review of current practices and case studies. J. Infrastruct. Preserv. Resil. 2022, 3, 11. [Google Scholar] [CrossRef]
- Lorant, G. Seismic Design Principles. Whole Building Design Guide. 2016. Available online: https://wbdg.org/resources/seismic-design-principles (accessed on 11 October 2016).
Disclaimer/Publisher’s Note: The statements, opinions and data contained in all publications are solely those of the individual author(s) and contributor(s) and not of MDPI and/or the editor(s). MDPI and/or the editor(s) disclaim responsibility for any injury to people or property resulting from any ideas, methods, instructions or products referred to in the content. |
© 2024 by the authors. Licensee MDPI, Basel, Switzerland. This article is an open access article distributed under the terms and conditions of the Creative Commons Attribution (CC BY) license (https://creativecommons.org/licenses/by/4.0/).