Article

Optimizing Urban Form to Enhance Dispersion of Carbon Emissions: A Case Study of Hangzhou

School of Landscape Architecture, Zhejiang Agriculture and Forestry University, Hangzhou 311300, China
*
Author to whom correspondence should be addressed.
Buildings 2024, 14(8), 2478; https://doi.org/10.3390/buildings14082478
Submission received: 14 July 2024 / Revised: 4 August 2024 / Accepted: 9 August 2024 / Published: 11 August 2024
(This article belongs to the Section Architectural Design, Urban Science, and Real Estate)

Abstract

:
Achieving the dual goals of “carbon neutrality and carbon peaking” will necessitate not only improving urban production and lifestyles to reduce carbon emissions but also minimizing the adverse effects of urban building elements on the diffusion of carbon emissions. This can facilitate the rapid flow of carbon emissions to high-carbon sink areas, thereby accelerating urban carbon circulation. This study calculated the carbon emissions of Hangzhou, utilized the WRF/Hysplit coupling method to simulate the city’s carbon emission diffusion status in 2020, and explored the impact of construction land layouts on carbon emission diffusion in terms of building height and building location. The results indicate the following: (1) The main sources of carbon emissions are located within the city, displaying a multi-center spatial distribution. The primary corridor for carbon emission diffusion is on the east side, where the underlying building density is relatively low. (2) As the building height increases from 24 to 36 m, the obstructive effect on carbon emission diffusion rapidly intensifies; however, this increase slows considerably once the building height exceeds 54 m. (3) The impact of buildings on carbon emission diffusion is the greatest when the distance between construction land and a carbon source area is 0 km. When this distance is 2 km, the obstructive effect of buildings significantly improves, depending on their heights. Beyond 7 km, the building height has almost no impact on carbon emission diffusion. The findings of this study may provide valuable suggestions for optimizing building heights in newly developed areas on the outskirts of cities, aiding in the effective design of construction land layouts to help China achieve its carbon neutrality and carbon peaking goals.

1. Introduction

Cities are key hubs for economic operations and energy consumption, making them also areas of high carbon emissions [1]. Reducing energy consumption is a crucial method for curbing the increase in urban carbon emissions. However, accelerating the urban carbon cycle and enhancing the carbon sequestration efficiency of ecological land are important approaches to mitigating urban carbon emissions from a green development perspective [2]. Constructing urban ventilation corridors to guide carbon emissions towards carbon sink areas on city outskirts can expedite the absorption of carbon emissions by these areas, thereby exerting an effective and long-term influence on the carbon emissions generated by urban development [3,4,5]. The height of urban buildings significantly influences the effectiveness of these ventilation corridors. Optimal building heights can mitigate the adverse effects of buildings on ventilation corridors, thereby facilitating the dispersion of urban carbon emissions [6,7]. Over the past decade, China’s urbanization rate of the permanent population has continued to grow rapidly even after surpassing 50% [8]. However, during the outward expansion of many Chinese cities, the density of construction land in suburban areas has continuously increased, and building heights have risen in a disorderly manner [9]. This situation has hindered the transmission of urban carbon emission diffusion corridors, leading to increased concentrations of carbon emissions within cities and exacerbating urban ecological problems. The increase in carbon emission concentrations has led to more frequent hot weather in cities, and carbon emissions can be inhaled through the respiratory tract, adversely affecting human health [10,11]. Consequently, the current urban living environment is further deteriorating. This has resulted in higher concentrations of carbon emissions within cities and has exacerbated various ecological problems [12,13]. Under the policy proposed by the Chinese government to achieve carbon neutrality by 2060 [14], understanding the impact of building height on urban carbon emission dispersion is crucial for accelerating urban carbon cycling and promoting sustainable urban development.
This study uses Hangzhou as a case study to examine building heights and locations in peripheral urban construction lands from the perspective of carbon emission diffusion. The aim is to determine effective methods of architectural planning and design to achieve low-carbon urban goals. The findings may help reduce the obstructive effects of new buildings on the outskirts of cities on carbon emission diffusion towards the periphery, strengthen the control and guidance of building design during urban development, and promote effective carbon cycling.
Section 2 provides a review of previous studies on building height control from different perspectives and the impact of building heights and locations on carbon emission diffusion. Section 3 describes the natural conditions of the study area and the characteristics of changes in construction land during urbanization. Section 4 analyzes the spatial distribution of urban carbon emission sources and the current state of carbon emission diffusion trajectories, as well as the impact of the locations and heights of new buildings on the periphery of urban construction lands on carbon emission diffusion trajectories based on simulation results. Section 5 discusses optimization measures for building heights and locations to facilitate carbon emission diffusion. Section 6 summarizes the findings of this study, its limitations, and directions for future research.

2. Literature Review

Calculating the spatial distribution of urban carbon emissions is essential for analyzing carbon emission diffusion. This study estimates the carbon emissions within the research area using the emission factor method provided in the Greenhouse Gas Inventory Guidelines developed by the Intergovernmental Panel on Climate Change (IPCC) [15,16]. By selecting pixel values of factors influencing carbon emissions and constructing an interpolation fitting model with the carbon emission data, it is possible to estimate the spatial distribution of carbon emissions on a raster scale [17,18]. This study integrates both methods to calculate the spatial distribution of carbon emissions in the Hangzhou study area, providing location coordinates for subsequent carbon emission diffusion simulations.
Accurately simulating carbon emission diffusion paths requires the application of appropriate technical methods. At the micro scale, wind tunnel experiments and computational fluid dynamics (CFD) simulation techniques are commonly used to measure gas diffusion effects on small to medium scales or for individual plots [19,20]. At the macro scale, the Lagrangian Hysplit model is frequently used for diffusion simulations of various gasses over medium to large scales, such as provinces or cities [21,22]. To enhance the accuracy of the Hysplit model, some researchers use the meso-scale meteorological forecast model WRF/UCM to simulate urban meteorological environments [23,24]. This study leverages the accurate urban meteorological background data provided by the WRF/UCM model, coupled with the Hysplit model, to simulate urban carbon emission diffusion.
Extensive research has been conducted on controlling building heights from various ecological perspectives, such as ventilation, cooling, and haze reduction [25,26,27]. For example, Gu et al. [28] enhanced the efficacy of urban ventilation corridors by adjusting elements such as local building density and height, thereby alleviating urban heat island problems. Cao et al. [29] analyzed the correlation between wind environments and building planning layouts in Xi’an, establishing strategies for optimizing the city’s urban wind environment. Gu et al. [30] conducted numerical simulations and quantitative comparisons of PM2.5 concentrations in residential areas of Hefei, considering research indicators such as building height and spacing. They proposed measures to improve air quality by optimizing residential area spatial forms. The above study only proposed building optimization measures for improving certain types of urban ecological environments. It is necessary to enhance and optimize the building form from a broader ecological perspective. Fu et al. [31] noted in their reviews that promoting the dispersion of urban carbon emissions not only reduces the concentration of carbon emissions within a region but also mitigates the urban heat island effect caused by elevated levels of greenhouse gasses in cities. This indicates that accelerating the dispersion of carbon emissions has multiple benefits for improving the urban ecological environment [32,33]. However, the current research on optimizing building heights from the perspective of carbon emissions is relatively limited. Therefore, this study aimed to enhance urban carbon cycling and address various urban ecological problems by optimizing building heights.
Numerous studies have established a direct relationship between building height and urban gas diffusion. These studies have focused on the effects of building density, building height, and the street canyon height-to-width ratio on gas diffusion, consistently demonstrating that changes in urban building morphology significantly affect air dispersion and distribution within cities [34,35,36]. Yang et al. [37] explored how building morphology influences urban air pollution diffusion, finding that the average building height is a key indicator affecting near-surface air pollutant flow. However, their research did not provide specific regulatory ranges for urban building heights. Yu et al. [38] used spatial regression models to analyze variations in the impact of building space on gaseous pollutant distribution, where building height factors reached a significance level over 0.01, but few studies have simultaneously explored the relationship between these two building environmental factors and gas dispersion. Further, the horizontal transmission of urban gases is influenced by buildings through factors like building height, as well as the relative positions of emission sources to buildings [39,40,41], but few studies have simultaneously explored the relationship between these two building environmental factors and gas dispersion. Zhao et al. [42] examined how the location of urban pollutant diffusion sources and building density interact, finding that different pollutant source locations yield various diffusion effects, as building densities vary. Keshavarzian et al. [43] found that the influence of buildings on gas diffusion sources diminishes with distance and that the complex relationships between the relative positions of buildings and gas diffusion sources significantly impacts pollutant diffusion. Therefore, future research needs to further investigate the quantitative relationship between building height and carbon emission dispersion at various building locations.
Most previous studies on optimizing building height have focused on small urban plots, typically offering recommendations for urban renewal and building control within city centers. Few scholars have examined the relationship between the height of newly constructed buildings on city outskirts and carbon emission diffusion, though such information may lead to effective control measures to promote carbon cycling during urban development.

3. Materials and Methods

3.1. Study Area

Hangzhou, a central city in Southeastern China, is located in the hinterland of the Yangtze River Delta. It has a subtropical monsoon climate with prevailing southwest winds in the summer. The overall wind direction generally shifts from southwest to northeast, mirroring the city’s topography, which slopes in the same direction. The city center is situated in the northeastern part of the province, encircled by mountains on three sides, which restricts air flow. Despite these constraints, the surrounding natural ecological environment is robust, featuring high-quality mountainous land in the southwest, including notable scenic areas like West Lake and the Tianmu Mountain Range. To the east, Hangzhou is connected to the ocean via the Qiantang River [44]. Hangzhou’s average building height is relatively low in the urban core, ranging from roughly 24 to 54 m. In contrast, the average building height in the outskirts ranges from 54 to 120 m and has gradually increased as urban development has progressed. This increase has further impeded the diffusion of carbon emissions from the city center towards the periphery. The construction land area of Hangzhou reached 634.5 km2 in 2020, 448.6 km2 of which comprised urban construction, marking an increase of 35.2% compared to the previous decade; this area’s urbanization is progressing very rapidly.
As depicted in Figure 1, the spatial distribution of construction land within the urban area is dense in the city center and more dispersed across the periphery. Future expansion is expected to concentrate on the west of Yuhang District and the northeast of Xiaoshan District [45]. The industrial zones in Hangzhou are predominantly located south of Xiaoshan, as well as in the Lin’an and Fuyang areas, where prevailing summer winds can increase carbon emissions downwind.

3.2. Data Sources and Processing

In the calculation of carbon emissions, data on energy consumption, product manufacturing, and vehicle ownership are sourced from the Hangzhou Statistical Yearbook 2020 and the China Energy Statistical Yearbook 2020. The population density index for administrative centers is derived from the LandScan dataset with a resolution of 1 km. Road network data come from OSM maps. Land use data for simulating urban wind environments were obtained from the 2020 MODIS Land Cover Type Annual Global 500 m Product. Building data were obtained from Baidu Maps. The specific source of the data is depicted in Table 1. All data were processed using the ArcGIS platform (defined in the WGS 1984 geographic coordinate system), with a processing resolution of 1 km for the raster data.

3.3. Methodology

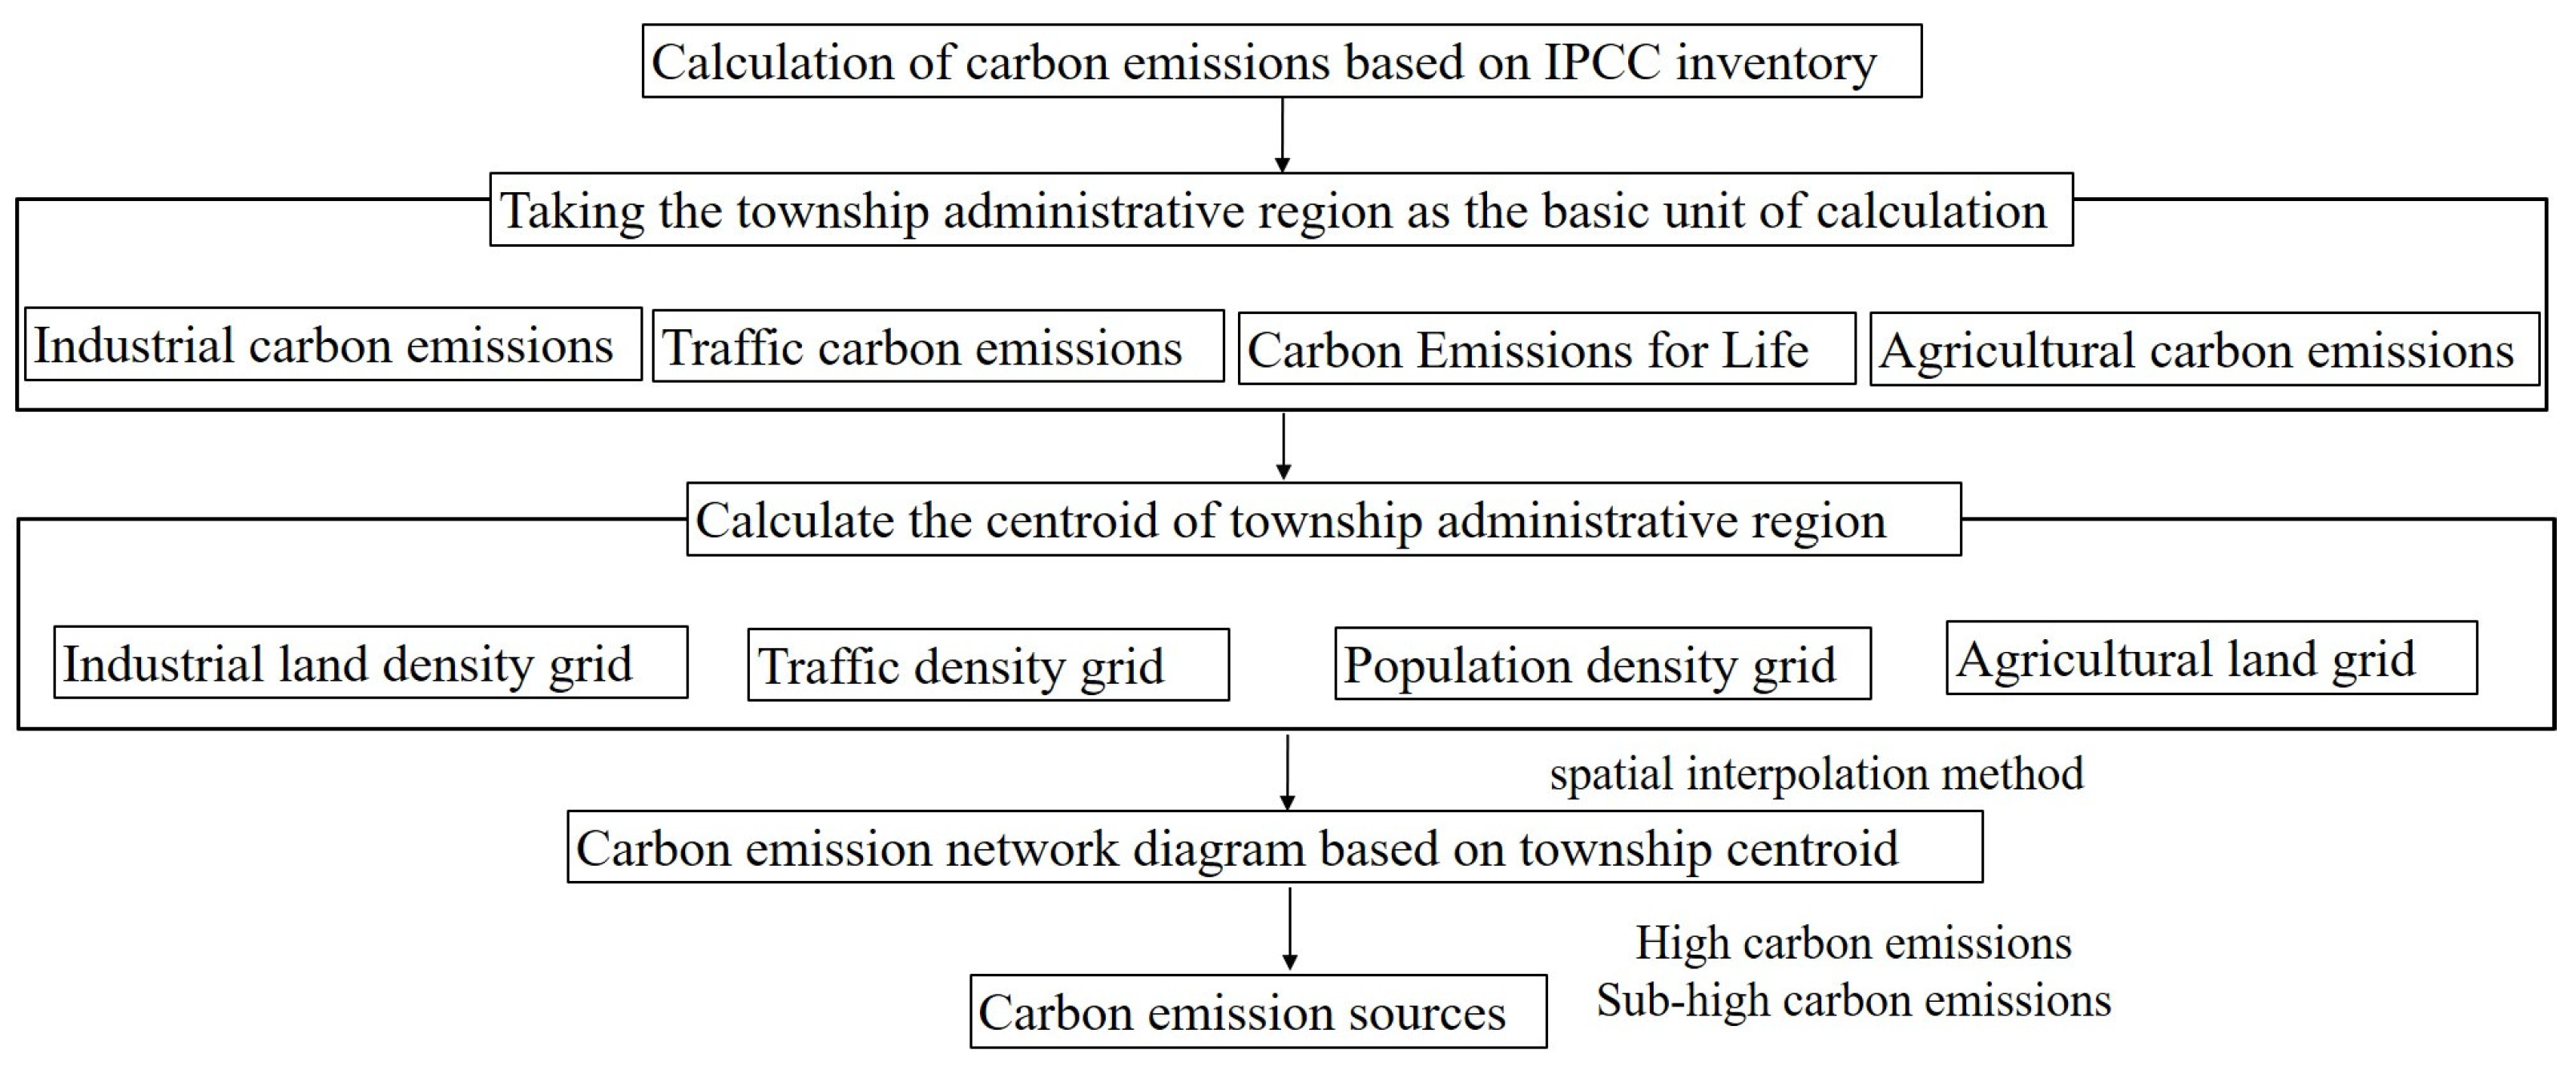
3.3.1. Calculation of Urban Carbon Emissions

Carbon emissions were calculated at the township level using the IPCC Greenhouse Gas Inventory, which is based on four sectors: industry, transportation, residential, and agriculture. The accounting process primarily focuses on energy consumption, including oil, natural gas, and electricity [46]. The specific calculation formulas are as follows:
M c = M i + M T + M Q + M P
M i = E i × α i × K + Q p × β p
M T = i V P i · V M T i · F E i · E F g / d
M Q = Q c × γ
M P = E P × P
where the variables M c , M i , M T , M Q , and M P represent the carbon emissions from the township, industrial sector, transportation sector, agricultural activities, and residential energy, respectively. E i denotes the consumption of the i th industrial energy source, α i is the standard coal conversion coefficient for the i th energy source, and K is the carbon emission coefficient of standard coal. Q p is the production quantity of the p th product, and β p is the carbon emission coefficient of the production of the p th product. V P i represents the number of motor vehicles owned, V M T i is the annual average mileage traveled, and F E i is vehicle fuel efficiency. E F is the carbon emission factor, where i denotes different types of motor vehicles, g represents gasoline, and d represents diesel. Q c is the cultivated land area, and γ is the carbon emission coefficient for cultivated land (0.372 t/hm2 [47]). E P represents the carbon emissions of per capita domestic energy consumption, which was 0.637 tons per person in 2020, according to the Zhejiang Energy Statistical Yearbook. P is the year-end permanent resident population.
Four types of carbon emission sectors in the corresponding townships were identified based on available data: industrial land, township traffic networks, population density, and agricultural land. These sectors were used as the basis for centroid calculations. Carbon emissions for each sector were interpolated from these centroids to map the spatial distribution of emissions across Hangzhou.
The composite carbon emissions from all sectors were then spatially overlaid to establish the city’s carbon emissions at the kilometer grid level. A natural breakpoint method was employed to categorize these emissions, dividing the area into five distinct zones: a high carbon emission zone, “second high” carbon emission zone, medium carbon emission zone, “second low” carbon emission zone, and low carbon emission zone. The high and second high carbon emission zones were selected as source areas for the subsequent analyses of carbon emission diffusion. The specific calculation procedures are illustrated in Figure 2.

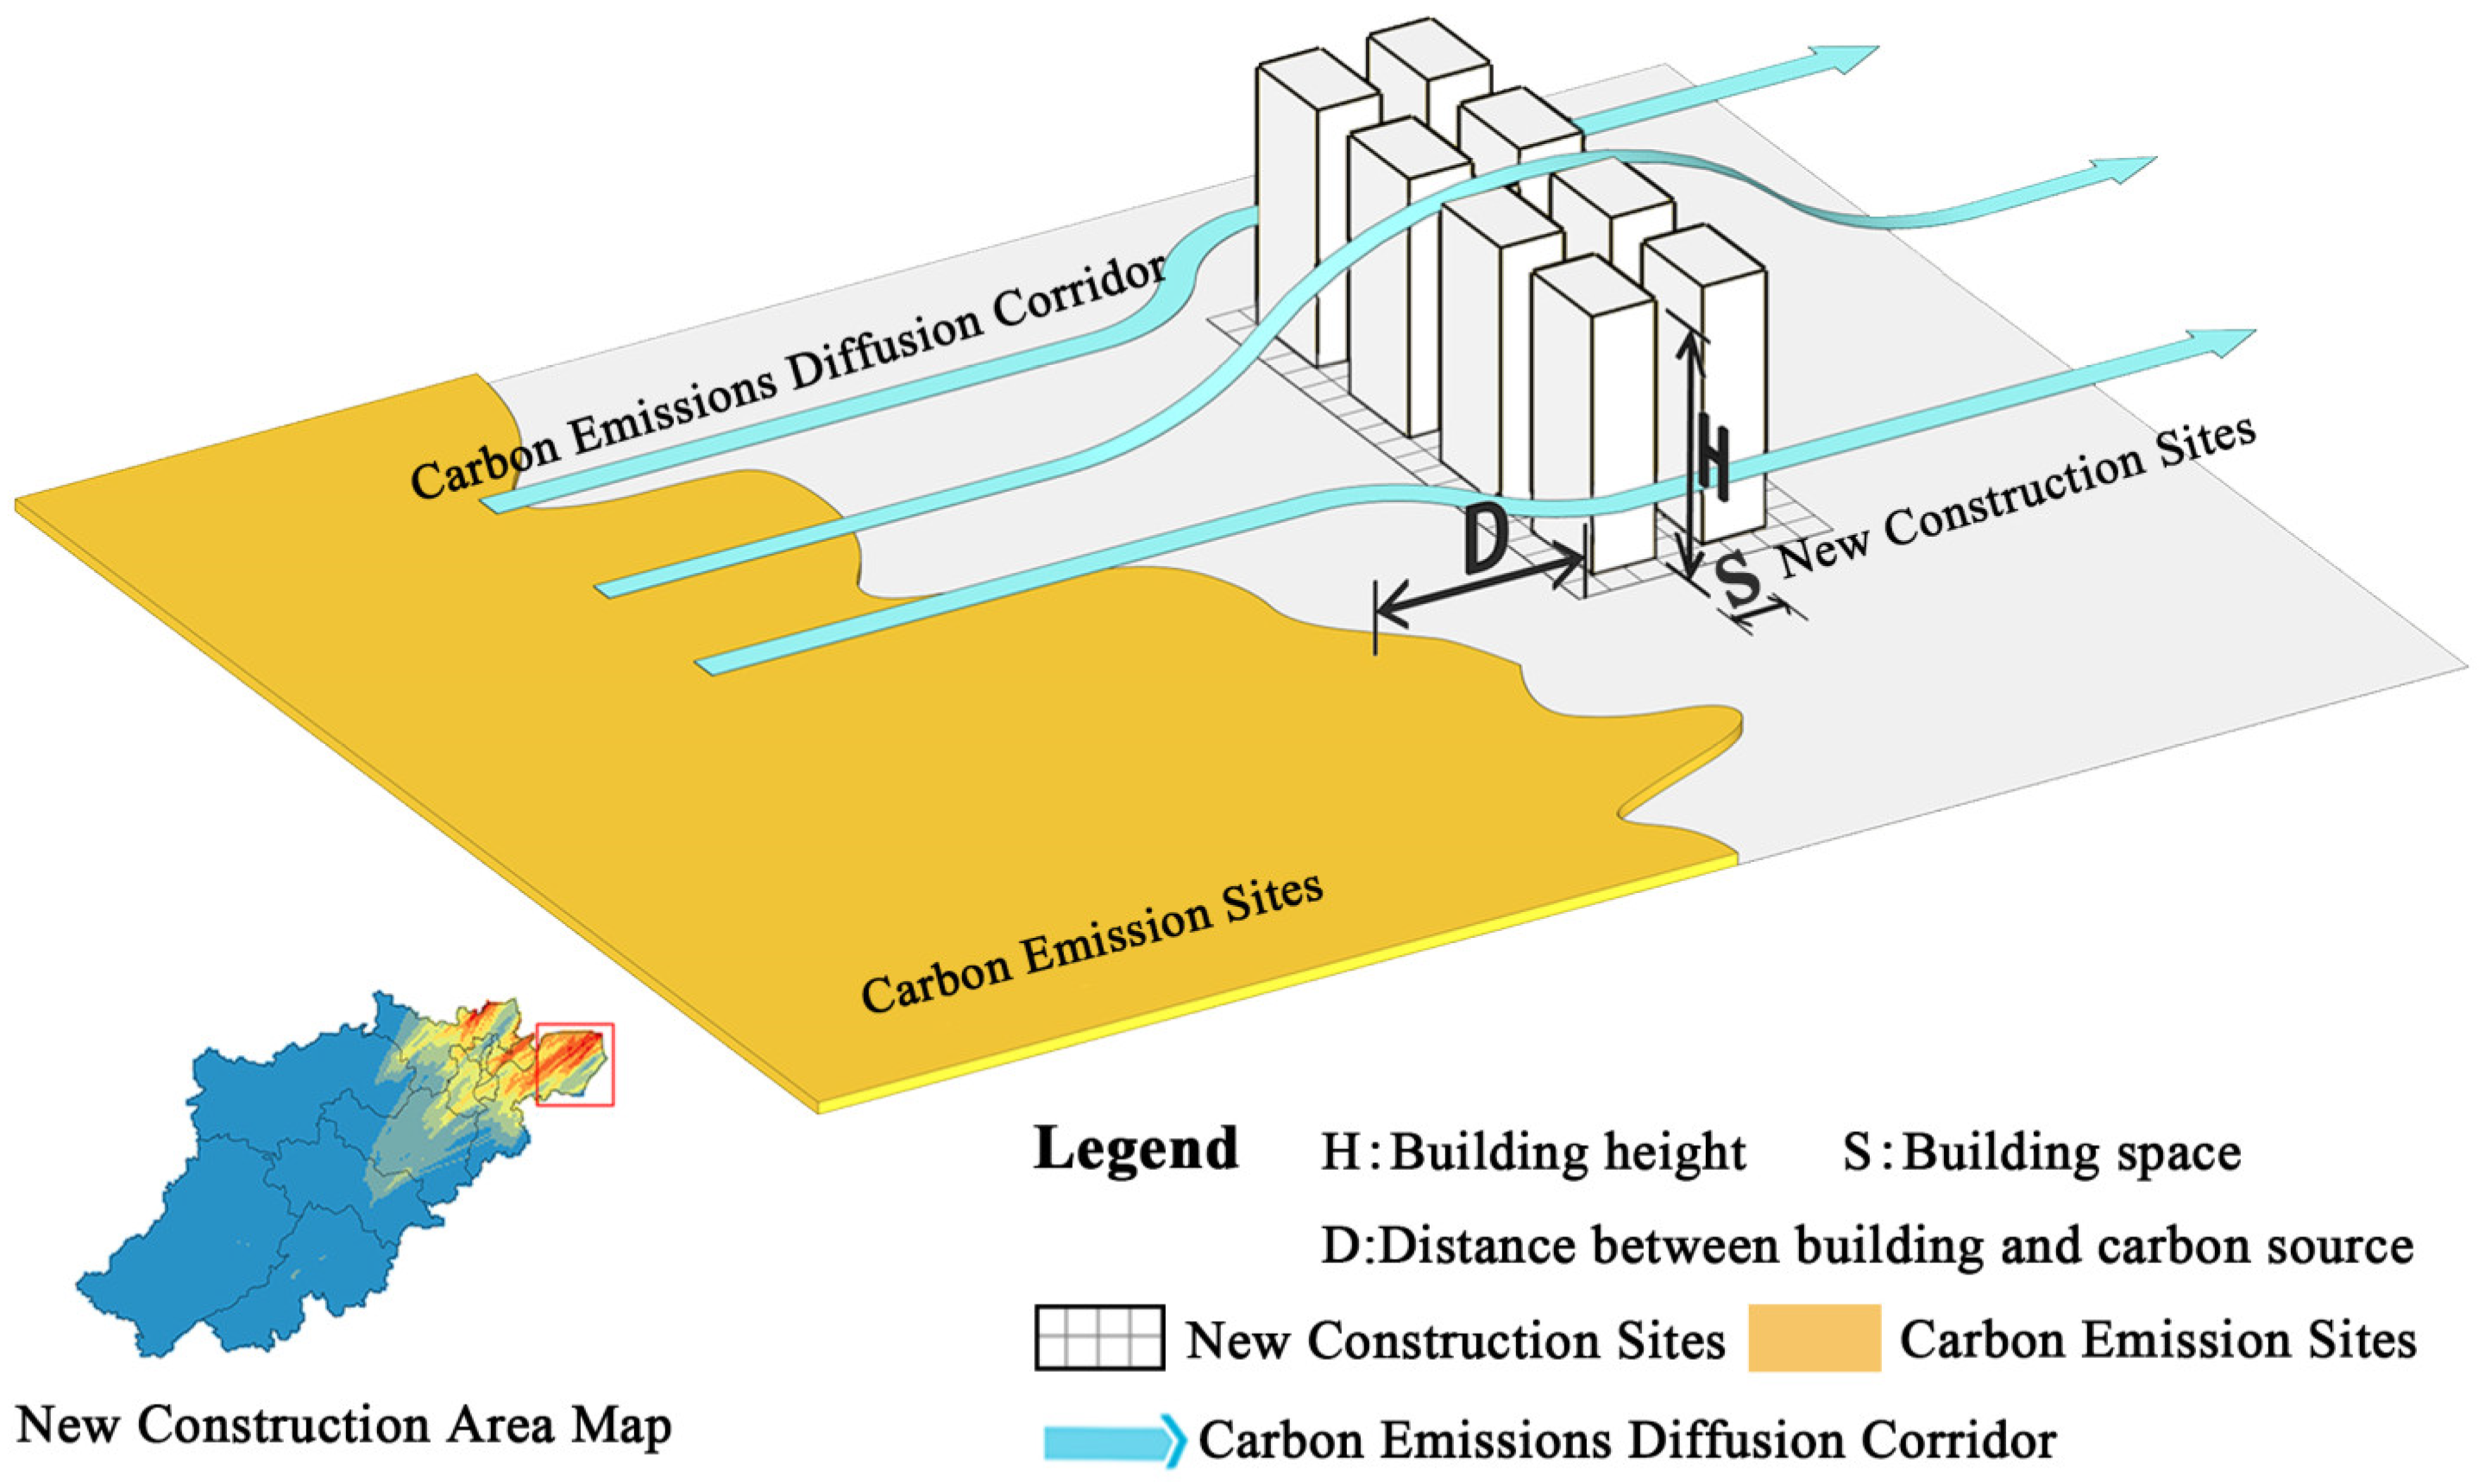
3.3.2. Simulating Carbon Emission Dispersion Trajectories

The Weather Research and Forecasting (WRF) model is a widely used tool for numerical weather prediction and atmospheric research, jointly developed by the National Center for Atmospheric Research (NCAR) and the National Oceanic and Atmospheric Administration (NOAA) [48,49]. The WRF/UCM version 3.6 configuration was used in this study. Due to the lag in obtaining urban building data for the WRF/UCM model, the primary research aim of this study—exploring the impact of building height on carbon emission dispersion across different building locations—remained unaffected by the simulation period. Therefore, the simulation time for this study spanned from 5 to 9 August 2020, totaling 120 h. During this period, the weather was clear, characterized by the typical summer prevailing wind direction: southwest. The central coordinates of the simulation were 120°12′ E and 30°16′ N. The model included three nested domains with resolutions of 9, 3, and 1 km, respectively, with the innermost domain covering Hangzhou and its immediate surroundings.
The Hysplit model, collaboratively developed by the NOAA and the Australian Bureau of Meteorology, is a specialized tool for calculating and analyzing the transport and dispersion trajectories of atmospheric pollutants [50]. In this study, the forward trajectory dispersion function of the Hysplit model was employed to simulate the dispersion of carbon emissions released from urban carbon emission source areas. These trajectories were used to illustrate the direction of carbon emissions and the impacts they cause on the region. Particles in the air are assumed to move with the wind; their trajectories are an integration of the velocity vector V over time Δ t and space. The formula is as follows:
P t + Δ t = P t + 0.5 V P , t + V P , t + Δ t Δ t
P t + Δ t = P t + V P , t Δ t
where the variable time step Δ t in the Hysplit model satisfies Δ t < 0.75 grid spacing/ U m a x , where U m a x is the maximum wind speed, ensuring that an air mass does not move more than a 0.75 grid spacing within one time step.
Specific settings in the Hysplit model included meteorological data from high-resolution WRF/UCM simulations: a simulation period beginning on 6 August 2020, covering 24 h, and particle dispersion initiation coordinates at the center of the kilometer grid of the carbon emission source area at a starting height of 10 m.

4. Results

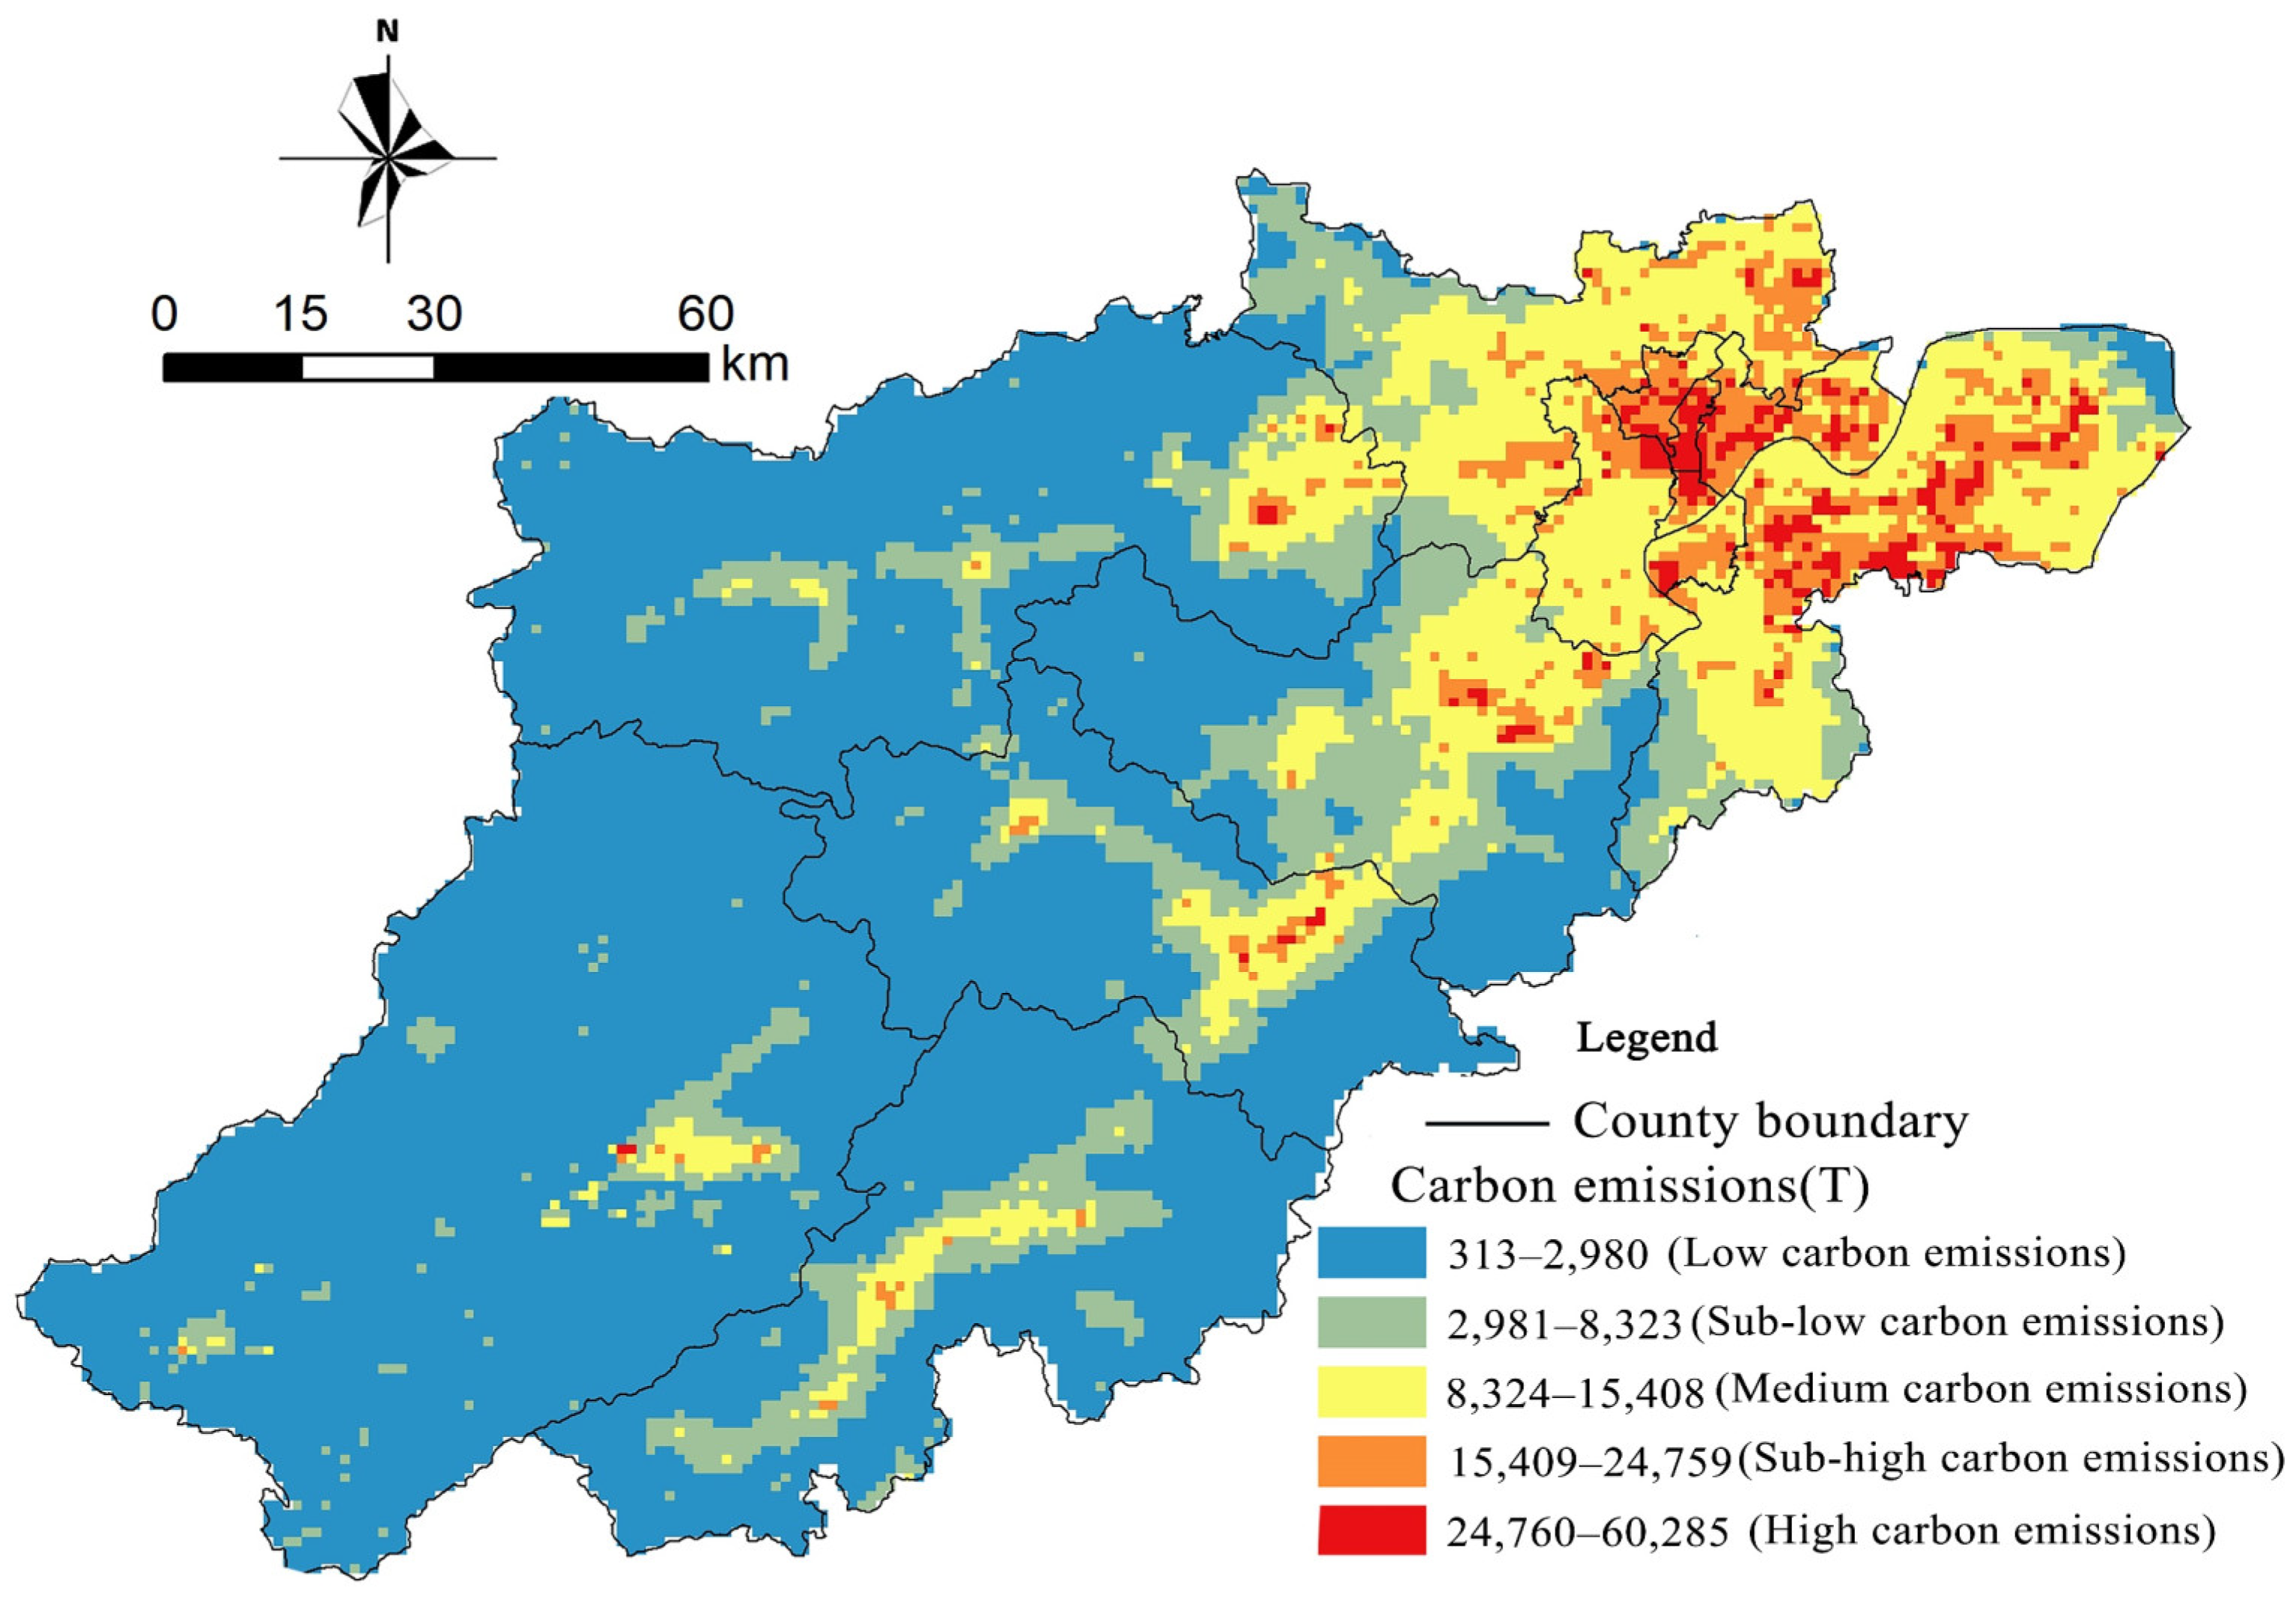
4.1. Spatial Distribution of Urban Carbon Emissions

Hangzhou’s carbon emissions reached a total of 93.1735 million tons in 2020. The breakdown of the sources includes 63.11 million tons from industrial sectors, 22.163 million tons from transportation, 7.784 million tons from residential energy use, and 0.107 million tons from agricultural activities. The industrial and transportation sectors are the primary contributors to these emissions. The high and second high carbon emission zones per unit area in Hangzhou totaled 989 km2 in 2020, predominantly concentrated in the central urban area, reflecting a polycentric spatial distribution pattern. Other high and second high carbon emission zones are mainly distributed in the built-up areas of the surrounding counties and districts. The low and second low carbon emission zones are primarily located in the western part of Hangzhou, which is characterized by more mountainous terrain and less developed land, resulting in lower overall carbon emission activities (Figure 3).
According to the natural breakpoint method for categorizing carbon emissions, the high and second high carbon emission zones are the main sources of carbon emission diffusion in Hangzhou. Therefore, the main urban area is used as the primary source of the city’s carbon emissions. To promote the transfer of urban carbon emissions towards peripheral high carbon sink areas and to enhance the carbon sequestration function of these areas, it is crucial to understand the pathways through which carbon emissions generated from the city center diffuse towards the city’s outskirts.

4.2. Spatial Distribution of Carbon Emission Diffusion Trajectories

According to the Hysplit forward simulation results, ArcGIS was used to statistically analyze the length of carbon emission diffusion trajectories on each kilometer grid. A longer trajectory within a given area indicates a higher frequency of carbon emission diffusion, signifying the main corridors for carbon diffusion in the study area. As shown in Figure 4, the overall direction of carbon emission diffusion follows a southwest–northeast orientation, aligning with the prevailing southwest winds. The spatial distribution of these trajectories in the city reveals higher values in the northeast and lower values in the north and south. In addition, the areas on the east side of the city exhibit faster diffusion speeds and longer diffusion trajectories. Land use analysis further reveals that areas with high-value trajectory diffusion typically have lower building densities, thus creating less resistance to carbon diffusion. Conversely, areas in the northeast displaying lower-value diffusion trajectories experience slower diffusion rates, likely due to wind obstruction by mountains on the lee side and higher building density and height. These factors impede the ventilation efficiency from the city center to the northeastern suburban areas.
The length of carbon emission diffusion trajectories is highest in the northern part of Xiaoshan District, marking the widest diffusion corridor (blue area, Figure 4). This area serves as a primary pathway for the outward spread of carbon emissions from the internal urban area. The land use on these outskirts of urban construction land is predominantly vacant, presenting no architectural obstacles to existing wind pathways. Consequently, this area was selected to simulate the potential impact of new construction on carbon emission diffusion, providing insights into how urban planning can influence environmental dynamics.

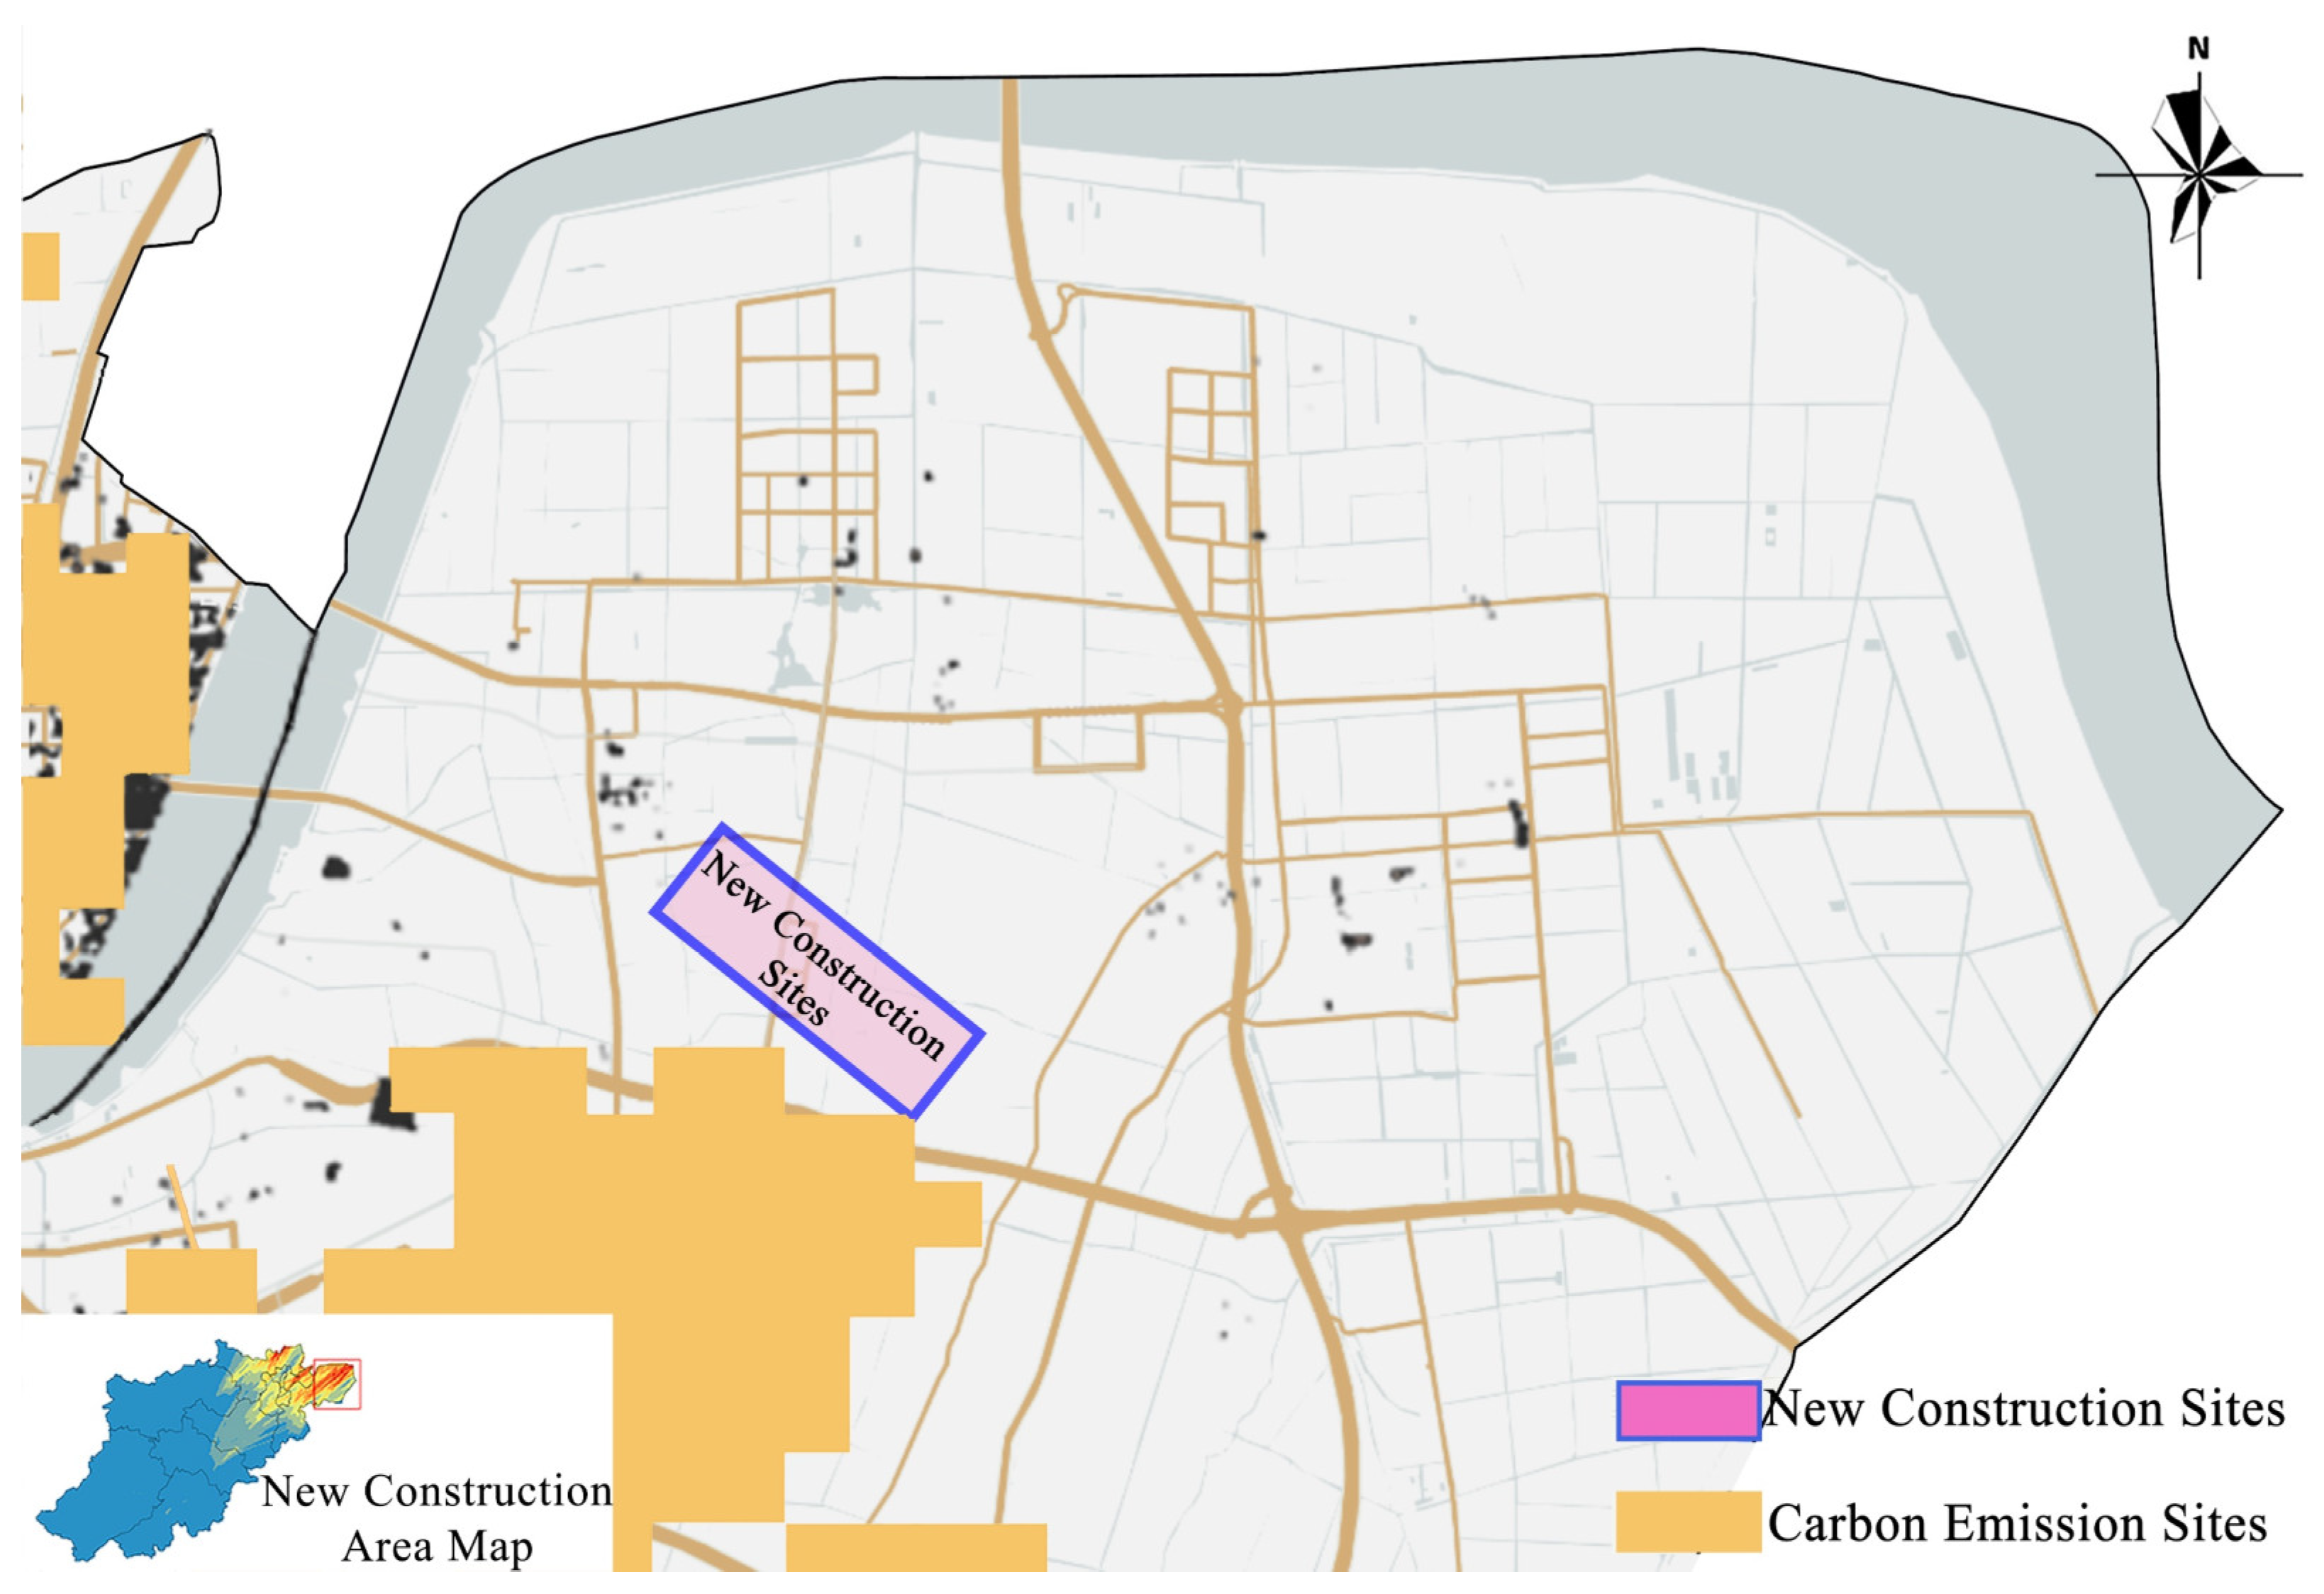
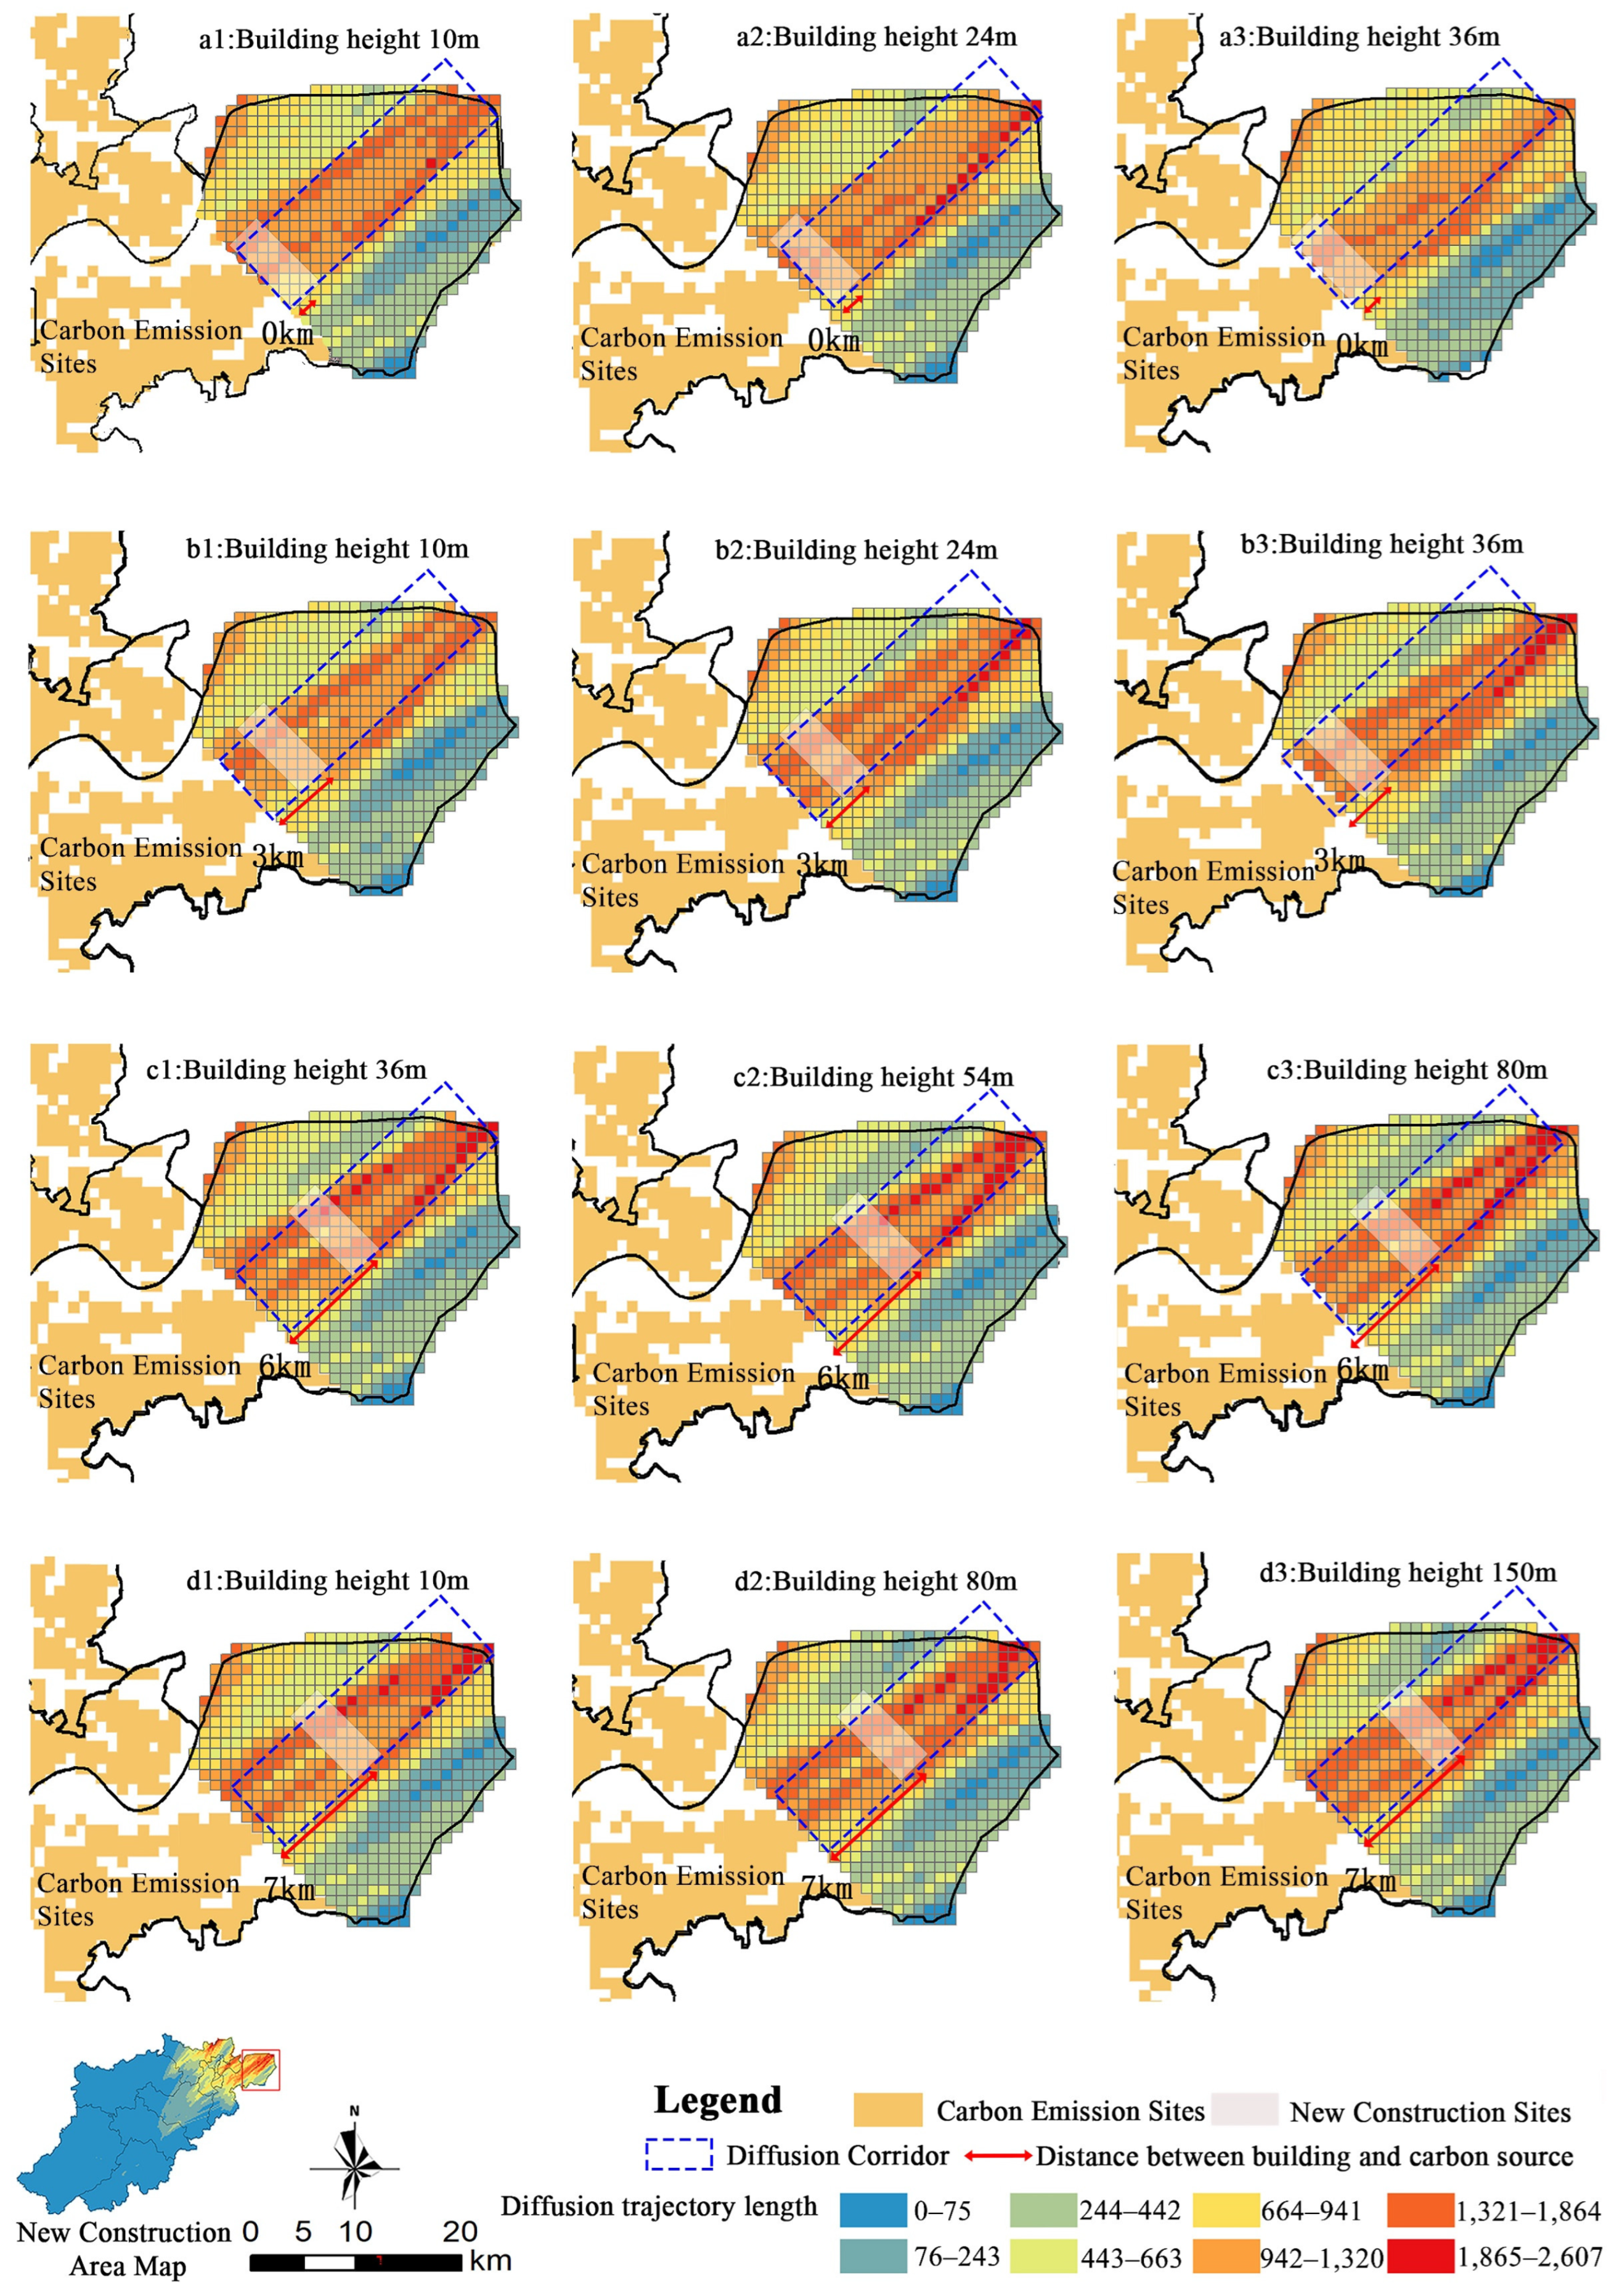
4.3. Experimental Simulation Design

The newly designated construction land simulated in this study is located in the edge area of the carbon emission sources, downwind of the periphery of urban built-up land. Currently, this land is largely constructable open space, with the exception of some scattered agricultural residential land. This study aims to investigate the effects of changes in building height and location on the diffusion of carbon emissions across this outer periphery of the urban built-up area, as shown in Figure 5. The nature of land use in this new construction land is not included in this analysis, nor is the impact of carbon emissions from new buildings.
The simulation approach and settings included the following: The width of the new construction land aligns with that width of the carbon emission diffusion corridor, encompassing an area of 10 km2; starting from a baseline distance of 0 km from the carbon source, the distance (D) between the new construction land and the carbon source gradually moves outward at an interval of 1 km, revealing the influence of building locations on the carbon emission ventilation corridor. Low-rise buildings in the city are typically three stories tall. The impact of building height (H) beginning at 10 m and gradually increasing was simulated accordingly. The spacing between buildings (S) was set to a 1:1 ratio with the building height, and the lateral spacing was uniformly set at 15 m, as per sunlight requirements and fire safety regulations. A diagram of this setup is provided in Figure 5.

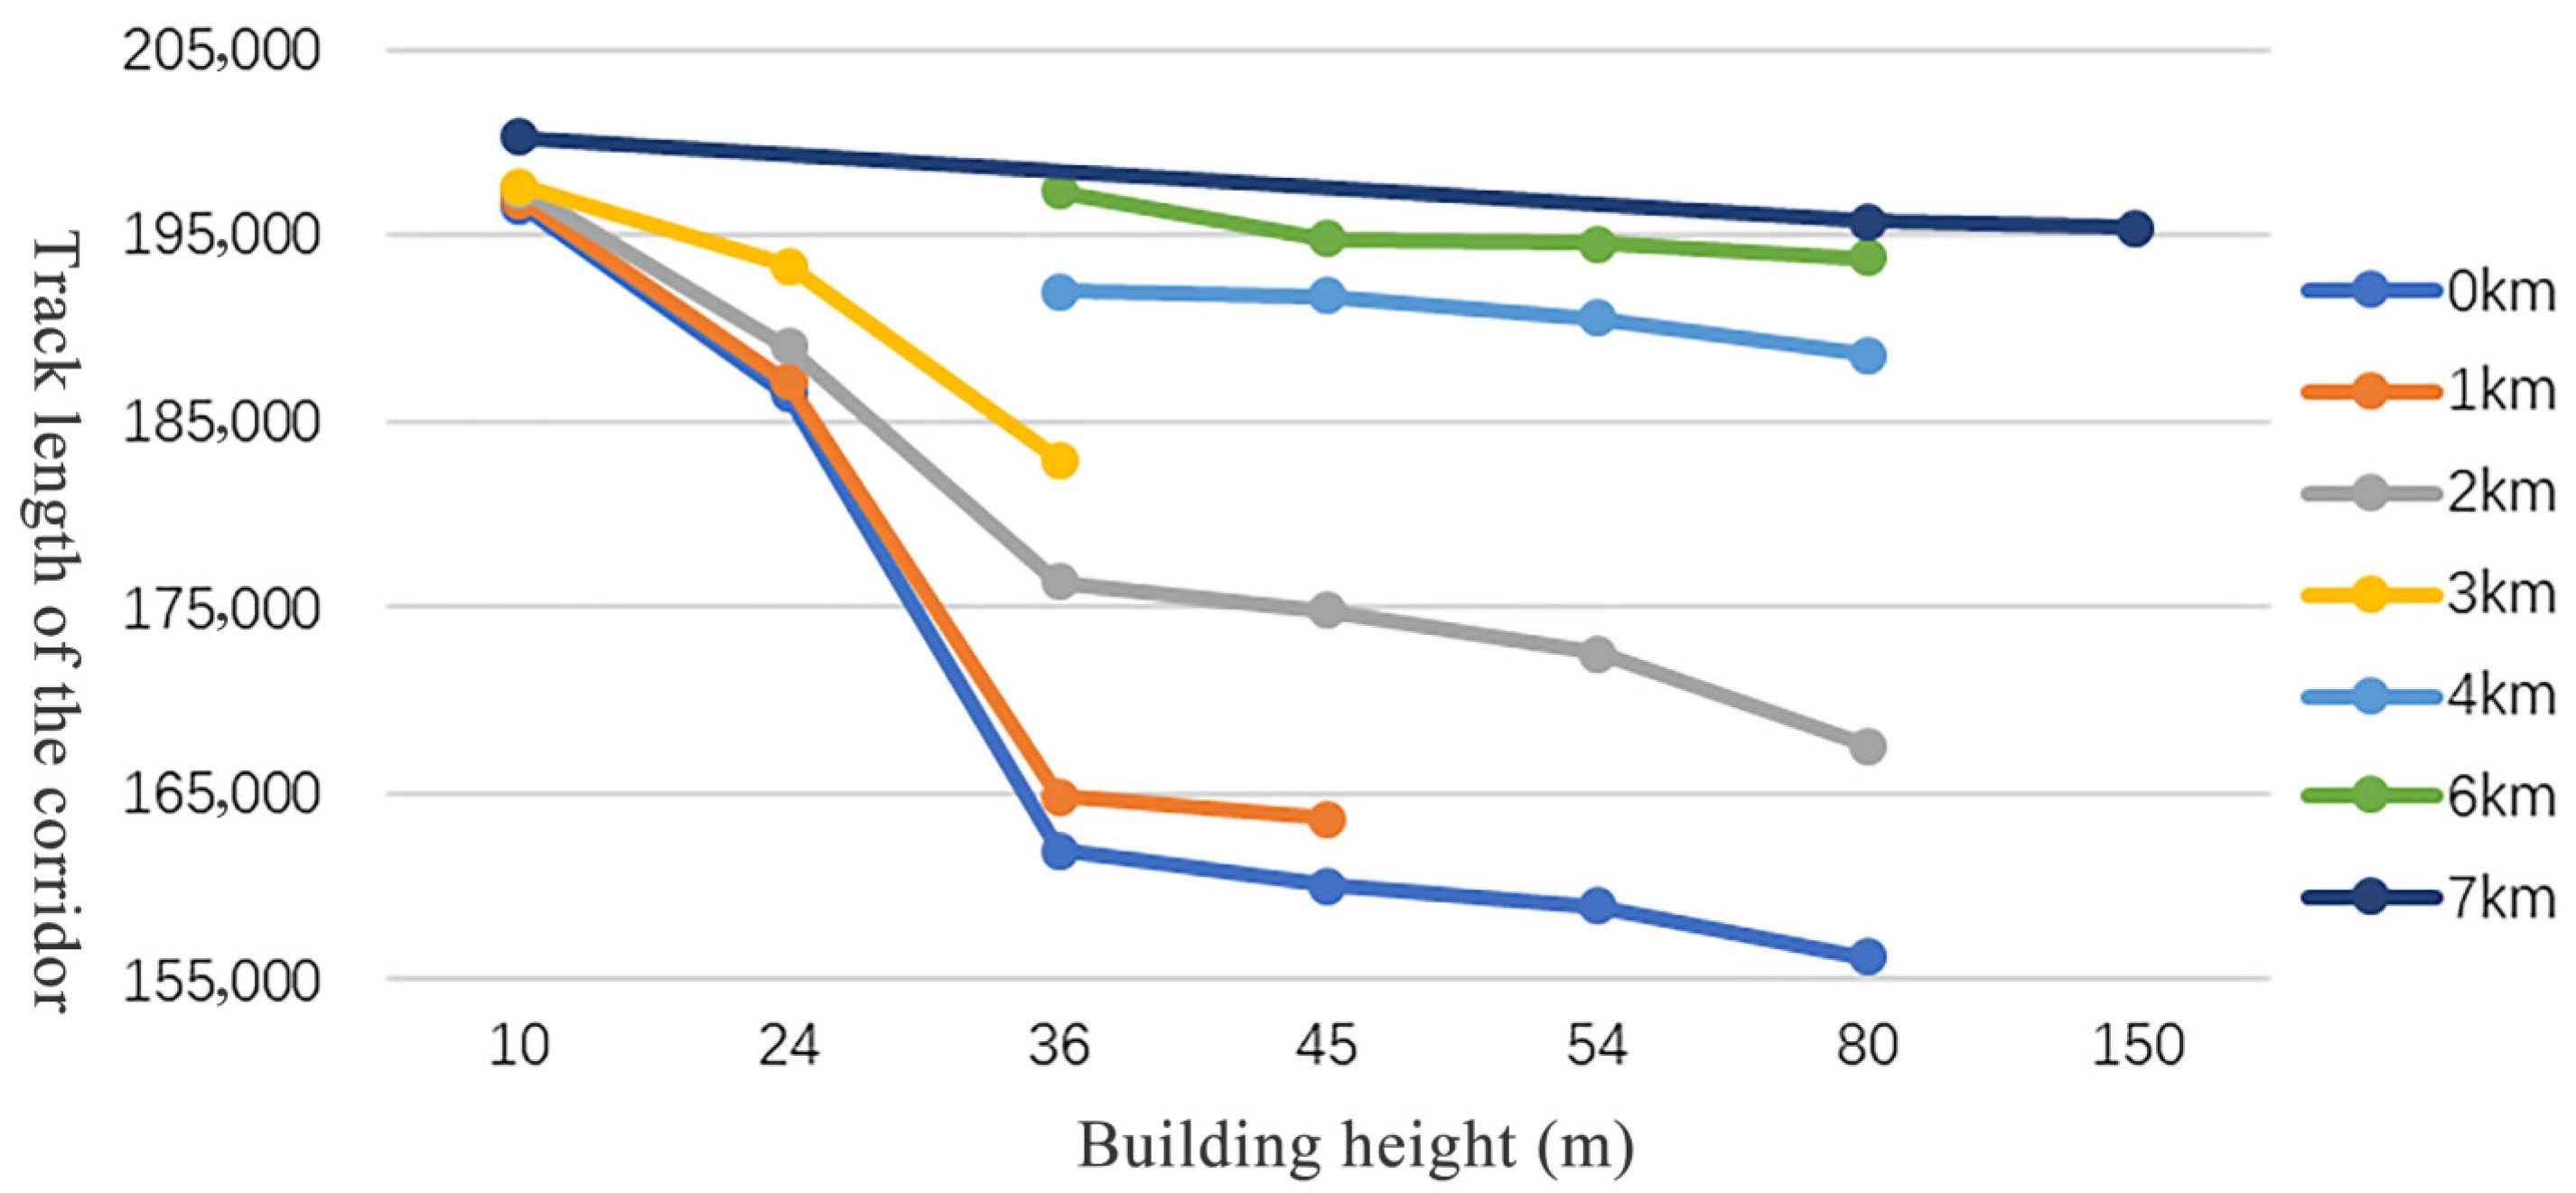
4.4. Impact of Building Location and Height on Carbon Emission Diffusion

The height of downwind buildings and their proximity to the carbon source both hinder the upward diffusion of carbon emissions. In comparison to the existing carbon emission diffusion trajectories, the simulated scenarios show a uniform decrease in the length of trajectories to the northeast of newly added buildings. Additionally, high-value areas representing longer diffusion trajectory lengths shift towards the southern side of the corridor. The width of the corridor narrows as building heights increase and distances from the carbon source decrease, as illustrated in Figure 6. This suggests a direct relationship between building height and location with the efficiency of carbon emission diffusion across the city.
Simulation results concerning the lengths of the carbon emission dispersion trajectories were analyzed as summarized in Table 2 and Figure 7. The total length of dispersion trajectories in the original corridor was 202,640 grid units. The proximity of buildings to the carbon emission source area significantly influences the impact of building height variations on carbon dispersion. In cases where buildings vary in distance from the carbon source, an increase in height from 24 to 36 m results in the most rapid decrease in the length of trajectories compared to other height ranges, indicating a significant obstruction to dispersion. The changes in trajectory lengths become relatively moderate when building heights exceed 54 m. This is because wind speeds in the area drop below 2 m/s once building heights surpass 54 m, which substantially hinders carbon emission dispersion along the corridor. Additionally, the building density typically decreases as the building height increases, which, conversely, is conducive to the diffusion of carbon emissions.
The effect of building height on carbon emission dispersion diminishes as the distance from the buildings to the carbon source increases. For instance, when buildings are located directly at the carbon source (0 km), the obstructive impact of the building height is the most pronounced. At a height of 10 m, the length of the carbon emission dispersion trajectory differs from the original by 2.9%; this difference increases to 7.96% at 24 m. This implies that building heights should not exceed 10 m at this proximity. At a distance of 2 km from the source, building heights do not significantly impact the corridor if they are below 24 m. For distances ranging from 4 to 6 km, the obstructive effect of building heights from 36 to 80 m gradually diminishes. Beyond a distance of 7 km, the variations in dispersion trajectory lengths remain minimal for building heights in the 10–150 m range. This is because buildings at such distances do not strongly impact the upstream dispersion of carbon emissions.
As shown in Figure 8, the overall impact of different building locations on the carbon emission dispersion corridor shows significant improvement in terms of carbon emission dispersion when the distance between buildings and the carbon source exceeds 2 km.

5. Discussion

5.1. Optimizing Building Locations

New buildings on the urban periphery should include protective green spaces between them and carbon emission sources to increase the distance between the sources and the buildings. Research has also shown that buildings located farther from carbon sources have a reduced impact on carbon emission dispersion, which aligns with the results of this study [43,51]. Moreover, this study further quantifies the relationship between building location and the efficiency of carbon emission dispersion.
The simulation results clearly demonstrated that, when new construction sites are directly adjacent to carbon emission sources (0 km), buildings of any height significantly affect carbon emission dispersion, necessitating the deployment of protective green spaces to control emission trajectories from the source area. At a distance of 2 km from the source, the obstructive effect of the building height on carbon emission dispersion is substantially reduced. Beyond 7 km, variations in building height have a minimal impact on the dispersal of carbon emissions, indicating that buildings positioned farther downwind from carbon sources facilitate dispersion more effectively. Practical considerations of urban development must also account for land economics and should avoid indiscriminately increasing the distance between carbon sources and new construction lands [52]. Therefore, the distance between new construction sites and carbon emission sources should not exceed 2 km. This approach will conserve land while ensuring that the building height does not obstruct the dispersion of carbon emissions in the upwind direction.
Wang et al. proposed that an interconnected ecological network should be established between building clusters [53]. Therefore, when planning expansion at a city’s periphery, it is advisable to design natural and ecological buffers such as large lakes, rivers, and green spaces like parks between carbon emission sources and new construction sites. In the context of adding new construction sites to the urban periphery, this study suggests using large lakes, rivers, and parks as ecological buffers between central urban areas and suburban buildings. This strategy not only increases the distance between buildings and carbon emission sources, thereby reducing the obstruction of carbon emission dispersion paths, but also contributes to the development of an ecological network.

5.2. Optimizing Building Heights

This paper proposes varying control ranges for building heights based on their proximity to carbon emission sources, with the goal of optimizing building heights to minimize their impact on carbon emission dispersion while maintaining economic viability. Cheng et al. [54] noted a significant relationship between building height and gas dispersion. Wu et al. [55]. analyzed the impact of various building heights on pollutants within residential areas, but they did not consider the relative position of residential areas to carbon emission sources. This research indicates that this relationship becomes more pronounced when buildings are closer to emission sources or are of lower heights. The effectiveness of carbon emission dispersion also varies with the distance between building clusters and carbon emission sources, even when building heights are the same. Thus, differentiated optimization recommendations for building heights can be established based on the varying distances between new construction sites and carbon emission sources on the city’s periphery. (1) When the construction site is 0 km from the carbon emission source, building heights should not exceed 10 m for optimal dispersion. (2) At a distance of 2 km from the emission source, building heights should not exceed 24 m to ensure that the obstruction to carbon emission dispersion remains below 10%. (3) Building heights should not exceed 36 m at distances of 3 km from the emission source, maintaining an impact on carbon dispersion efficiency around 10%. (4) For construction sites located 4 km or more from the emission source, building heights may exceed 80 m. The obstruction efficiency of various building heights for carbon emission dispersion remains below 10% in such scenarios, and increasing the building height does not intensify the obstruction of dispersion corridors.

5.3. Implications for Future Building Design

The uncontrolled sprawl of cities has led to an increase in carbon emission concentrations in urban areas, exacerbating urban ecological problems [56]. Buildings at the urban fringe obstruct the dispersion of carbon emissions from the city center, which, in turn, reduces the carbon sequestration efficiency of the surrounding ecological lands and diminishes the overall efficiency of the urban carbon cycle [57,58]. Therefore, it is crucial to implement optimized building designs to enhance the dispersion of carbon emissions.
In urban planning, the regulation of building heights often focuses on considerations of public safety and esthetics [59,60]. This study aims to emphasize that the control of building heights should also take into account multiple factors, including the relative position of buildings to pollution sources. The results indicate that different building heights have significantly varied impacts on the dispersion of carbon emissions. Therefore, in future planning, when new buildings are close to carbon emission sources, their height should not exceed 10 m. As the distance between new buildings and carbon emission sources increases, the impact of the building height on carbon emission dispersion decreases, allowing for greater building heights. The findings of this study provide specific planning and design guidance for controlling building heights around carbon emission sources.

6. Conclusions

6.1. Findings

This study employed WRF/UCM meteorological modeling and the Hysplit trajectory model to conduct multi-scenario experimental simulations of the relationship between building heights and carbon emission dispersion at the urban periphery. The results provide specific control ranges for the planning of buildings in these areas. The main conclusions can be summarized as follows:
(1) Carbon emission sources in Hangzhou are mainly concentrated in the city center, exhibiting a multi-center spatial distribution pattern. Non-carbon emission sources are distributed in the peripheral construction lands and western mountainous areas of the city. The overall carbon emission dispersion path in Hangzhou trends from southwest to northeast, aligning with the trajectory of prevailing summer winds. The northern area of Xiaoshan, the primary channel for carbon emission dispersion from the main urban area, is characterized by a relatively low building density, low building height, and predominantly vacant land use.
(2) When the distance between construction sites and carbon sources remains constant, the obstructive effect on the original pathways of carbon emission dispersion gradually increases as the building height increases. This effect escalates rapidly as the building height increases from 24 to 36 m but slows considerably once this height surpasses 54 m. Therefore, when the plot ratio of the land is low, it is advisable to restrict the building height at new construction sites to 24 m. Conversely, when the plot ratio is high, building heights exceeding 54 m are recommended.
(3) The obstruction of the original carbon emission dispersion trajectory gradually reduces as the distance between construction lands and carbon sources increases. Protective green spaces are recommended between carbon sources and construction sites within 0 km; protective green spaces should be set up, with building heights not exceeding 10 m. For construction sites located 2 km or more from the carbon source, building heights should be limited to below 24 m. In areas where this distance ranges from 4 to 6 km, building heights may exceed 80 m. At distances greater than 7 km from a carbon source, the obstruction effect of building heights on carbon emissions becomes negligible.

6.2. Limitations and Future Research Directions

The simulation design used in this study primarily comprises ideal scenarios, incorporating various factors such as the surrounding land environment of the simulated buildings and the intensity of urban development. Future research could benefit from integrating more detailed urban planning elements to simulate multiple construction indicators within the study area. These might include land use types, building floor area ratios, and green space ratios, making the research more comprehensive and its results more practically and universally applicable.
Despite these limitations, this study provides effective recommendations for controlling building heights and locations in newly developing urban areas from the perspective of promoting carbon emission dispersion, thereby enhancing urban carbon cycling.

Author Contributions

Conceptualization, S.S. and L.X.; Methodology, S.S. and L.X.; Software, S.S.; Validation, S.S. and L.X.; Data curation, S.S.; Writing—original draft preparation, S.S.; Writing—review and editing, L.X.; Supervision, L.X.; Project administration, L.X.; Funding acquisition, L.X. All authors have read and agreed to the published version of the manuscript.

Funding

This research was funded by the Natural Science Foundation of Zhejiang Province (Grant No. LZ23D010003), the Zhejiang Provincial Philosophy and Social Science Planning Interdisciplinary Key Support Project (No. 22JCXK06Z), and the National Natural Science Foundation of China (No. 41871216).

Data Availability Statement

Data available on request due to restrictions, e.g., privacy or ethics.

Conflicts of Interest

The funders had no role in the design of the study, nor in the collection, analyses, or interpretation of the data; writing of the manuscript; or decision to publish the results.

References

  1. Zheng, F.; Wang, Y.; Shen, Z.; Wang, Y. Research on the Correlations between Spatial Morphological Indices and Carbon Emission during the Operational Stage of Built Environments for Old Communities in Cold Regions. Buildings 2023, 13, 2222. [Google Scholar] [CrossRef]
  2. Leng, H.; Zhao, Y.; Yuan, Q. Carbon reduction pathways and strategies for urban morphological regulation. Urban Plan. J. 2023, 1, 54–61. [Google Scholar] [CrossRef]
  3. Xu, Q.; Yang, R.; Dong, Y.; Liu, Y.; Qiu, L. The influence of rapid urbanization and land use changes on terrestrial carbon sources/sinks in Guangzhou, China. Ecol. Indic. 2016, 70, 304–316. [Google Scholar] [CrossRef]
  4. Churkina, G. Modeling the carbon cycle of urban systems. Ecol. Model. 2008, 216, 107–113. [Google Scholar] [CrossRef]
  5. Fang, X.; Li, l.; LIU, W.; Ren, C.; Wang, J.; Cheng, C.; Yu, Y.; Zhang, S.; Du, W.; Liu, Y. Research and Practice Progress of Urban Ventilation Corridors in China. Chin. J. Ecol. 2021, 40, 4088–4098. [Google Scholar] [CrossRef]
  6. Liu, X.; Huang, B.; Li, R.; Zhang, J.; Gou, Q. Wind environment assessment and planning of urban natural ventilation corridors using GIS: Shenzhen as a case study. Urban Clim. 2022, 42, 101091. [Google Scholar] [CrossRef]
  7. Zhu, W.; Zhang, L.; Mei, S.; Yuan, C. Developing Urban Heat Mitigation Strategies for a Historic Area Using a High-Fidelity Parametric Numerical Simulation: A Case Study in Singapore. Buildings 2022, 12, 1311. [Google Scholar] [CrossRef]
  8. Chen, C.; Qin, Y.; Gao, Y. Does new urbanization affect CO2 emissions in China: A spatial econometric analysis. Sustain. Cities Soc. 2023, 96, 104687. [Google Scholar] [CrossRef]
  9. Liu, X.; Xu, H.; Zhang, M. The effects of urban expansion on carbon emissions: Based on the spatial interaction and transmission mechanism. J. Clean. Prod. 2024, 434, 140019. [Google Scholar] [CrossRef]
  10. Mohammadali, K.; Merabet, A.; Homa, H.-B. Health Impacts of Greenhouse Gases Emissions on Humans and the Environment; Elsevier: Amsterdam, The Netherlands, 2024; pp. 265–291. [Google Scholar]
  11. Tan, X.; Liu, Y.; Dong, H.; Xiao, Y.; Zhao, Z. The health consequences of greenhouse gas emissions: A potential pathway. Environ. Geochem. Health 2022, 44, 2955–2974. [Google Scholar] [CrossRef]
  12. Li, Y.; Zhang, J.; Sailor, J.; Ban-Weiss, A. Effects of urbanization on regional meteorology and air quality in Southern California. Atmos. Chem. Phys. 2019, 19, 4439–4457. [Google Scholar] [CrossRef]
  13. Wu, Y.; Zhen, H.; Delang, O.; Hu, Z.; Qian, J. How to build an eco-efficient city? Cases studies in Chinese urbanization over the past 20 years. Sustain. Cities Soc. 2021, 75, 103387. [Google Scholar] [CrossRef]
  14. Huang, Y.; Liu, G.; Bo, Y.; Wang, J.; Cao, M. Beijing-Tianjin-Hebei coordinated development toward the carbon peaking and carbon neutrality goals. Strateg. Study Chin. Acad. Eng. 2023, 25, 160–172. [Google Scholar]
  15. Oda, T.; Maksyutov, S. A very high-resolution (1 km × 1 km) global fossil fuel CO 2 emission inventory derived using a point source database and satellite observations of nighttime lights. Atmos. Chem. Phys. 2011, 11, 543–556. [Google Scholar] [CrossRef]
  16. Ou, J.; Liu, X.; Li, X.; Chen, Y. Quantifying the relationship between urban forms and carbon emissions using panel data analysis. Landsc. Ecol. 2013, 28, 1889–1907. [Google Scholar] [CrossRef]
  17. Gao, N.; Zeng, H.; Li, F. Quantitative analysis of energy consumption space in Jingmen City based on nighttime remote sensing and POI. J. Geo-Inf. Sci. 2021, 23, 891–902. [Google Scholar]
  18. Lu, Y.; Liang, Y.; Lu, S.; Xiao, Y.; He, X.; Lin, J. Simulation of the spatial distribution of carbon emissions in Guangzhou based on the nighttime lighting of Luojia-1 and the analysis of its influencing factors. J. Geo-Inf. Sci. 2022, 24, 1176–1188. [Google Scholar]
  19. He, Y.; Liu, Z.; Ng, E. Parametrization of irregularity of urban morphologies for designing better pedestrian wind environment in high-density cities–A wind tunnel study. Build. Environ. 2022, 226, 109692. [Google Scholar] [CrossRef]
  20. Pantusheva, M.; Mitkov, R.; Hristov, O.; Petrova-Antonova, D. Air pollution dispersion modelling in urban environment using CFD: A systematic review. Atmosphere 2022, 13, 1640. [Google Scholar] [CrossRef]
  21. Cassol, L.H.; Domingues, G.L.; Sanchez, H.A.; Basso, S.L.; Marani, L. Determination of region of influence obtained by aircraft vertical profiles using the density of trajectories from the HYSPLIT model. Atmosphere 2020, 11, 1073. [Google Scholar] [CrossRef]
  22. Yu, Z.; Wu, Y.; Jiang, Y.; Feng, H.; Liu, S.; Cao, Y. The HYSPLIT model was used to analyze the forward trajectory of long-distance migration of wheat aphid. Acta Ecol. Sin. 2011, 31, 889–896. [Google Scholar]
  23. Iraji, F.; Memarian, M.H.; Joghataei, M.; Malamiri, H.R.G. Determining the source of dust storms with use of coupling WRF and HYSPLIT models: A case study of Yazd province in central desert of Iran. Dyn. Atmos. Ocean. 2021, 93, 101197. [Google Scholar] [CrossRef]
  24. Tian, C.; Zhou, H.; Shen, A.; Shen, C.; Wang, M.; Chen, X.; Fan, Q. Numerical simulation analysis of transport characteristics of moderate to severe haze pollution in Shenzhen. Acta Sci. Nat. Univ. Sunyatseni/Zhongshan Daxue Xuebao 2022, 61, 38–47. [Google Scholar] [CrossRef]
  25. Hsieh, C.; Huang, H. Mitigating urban heat islands: A method to identify potential wind corridor for cooling and ventilation. Comput. Environ. Urban Syst. 2016, 57, 130–143. [Google Scholar] [CrossRef]
  26. Guo, A.; Yue, W.; Yang, J.; Li, M.; Xie, P. Quantifying the impact of urban ventilation corridors on thermal environment in Chinese megacities. Ecol. Indic. 2023, 156, 111072. [Google Scholar] [CrossRef]
  27. Du, W.; Zhu, R.; Fang, X. Construction of ventilation corridors and smog control in Beijing. Chin. J. Urban Environ. Stud. 2017, 5, 1750016. [Google Scholar] [CrossRef]
  28. Gu, K.; Fang, Y.; Qian, Z.; Sun, Z.; Wang, A. Spatial planning for urban ventilation corridors by urban climatology. Ecosyst. Health Sustain. 2020, 6, 1747946. [Google Scholar] [CrossRef]
  29. Cao, X.; Wang, C. Planning and Layout Strategy of High-rise Building Area in Xi’an City Based on Wind Environment: A Case Study of Qujiang New Area. Urban Dev. Res. J. 2017, 24, 20–26. [Google Scholar]
  30. Gu, K.; Zhu, L. The main urban area of Hefei PM2.5 Spatial and temporal distribution characteristics. Ecol. Environ. Sci. 2018, 27, 1107. [Google Scholar]
  31. Fu, C.; Xie, J.; Chen, L.; Liang, J. Block-scale Qingfeng Corridor Planning for Spatial Countermeasures and Implementation Management: A Case Study of Suqian City. Urban Plan. J. 2019, 3, 81–86. [Google Scholar] [CrossRef]
  32. Fang, Y.; Gu, K. A review of urban ventilation corridors: Characteristics and progress. Acta Ecol. Sin. 2024, 13, 1–15. [Google Scholar] [CrossRef]
  33. Goret, M.; Masson, V.; Schoetter, R.; Moine, M. Inclusion of CO2 flux modelling in an urban canopy layer model and an evaluation over an old European city centre. Atmos. Environ. X 2019, 3, 100042. [Google Scholar] [CrossRef]
  34. Jakub, L.; Jiří, P.; Klaudia, K. Identification of Wind-Induced Particle Resuspension in Urban Environment Using CFD Modelling. Atmosphere 2022, 14, 57. [Google Scholar] [CrossRef]
  35. Du, Z.; Guo, W.; Li, W.; Gao, X. A study on the optimization of wind environment of existing villa buildings in Lingnan area: A case study of Jiangmen’s “Yunshan Poetic” moon island houses. Buildings 2022, 12, 1304. [Google Scholar] [CrossRef]
  36. Miao, C.; Chen, W.; Cui, A.; Li, P.; Hu, Y.; He, X. Research progress on the distribution of air pollutants in urban valleys. Chinese Journal of Applied Ecology 2021, 32, 3377–3384. [Google Scholar] [PubMed]
  37. Yang, J.; Shi, B.; Zheng, Y.; Shi, Y.; Xia, G. Urban form and air pollution disperse: Key indexes and mitigation strategies. Sustain. Cities Soc. 2020, 57, 101955. [Google Scholar] [CrossRef]
  38. Yu, X.; Shan, B.; Chen, Y.; Zhang, Q.; Ren, Q. Influence of spatial distribution pattern of buildings on the distribution of urban gaseous pollutants. Environ. Monit. Assess. 2023, 195, 290. [Google Scholar] [CrossRef]
  39. Ma, T.; Chen, T. Influence mechanism and planning response of spatial morphology of urban riverfront area on near-ground ventilation. Urban Dev. Res. 2021, 28, 37–42+48. [Google Scholar]
  40. He, X.; Zhuang, Y.; Qiu, S.; Li, H.; Zhao, Y.; Lu, S.; Lin, J. Scaled effect analysis of the impact of urban three-dimensional spatial structure on carbon emissions. Acta Ecol. Sin. 2024, 44, 612–624. [Google Scholar] [CrossRef]
  41. Fuka, V.; Xie, Z.T.; Castro, I.P.; Hayden, P.; Carpentieri, M.; Robins, A.G. Scalar fluxes near a tall building in an aligned array of rectangular buildings. Bound.-Layer Meteorol. 2018, 167, 53–76. [Google Scholar] [CrossRef]
  42. Zhao, F.; Xu, Y.; Cheng, J.; Liu, B.; Liu, K.; Wang, H. Simulation of sudden gaseous pollutant diffusion in dense urban building blocks. J. Hunan Univ. Technol. 2019, 33, 14–18. [Google Scholar]
  43. Keshavarzian, E.; Jin, R.; Dong, K.; Kwok, C.; Zhang, Y. Effect of pollutant source location on air pollutant dispersion around a high-rise building. Appl. Math. Model. 2020, 81, 582–602. [Google Scholar] [CrossRef] [PubMed]
  44. Yu, B.; He, X.; Wei, L.; Chen, L.; Zhou, W. A Preliminary Study on the Construction of Urban Multi-level Ventilation Corridor System in Hangzhou. Chin. J. Meteorol. Sci. 2018, 38, 625–636. [Google Scholar]
  45. Lu, H.; Wang, R.; Fan, J. Spatiotemporal evolution analysis of urban construction land expansion in Hangzhou. J. ZheJiang Univ. Nat. Sci. 2022, 49, 96–104+111. [Google Scholar]
  46. Gu, Z.; Xu, L.; Ma, Q.; Shi, Y.; Lu, Z.; Wu, Y. Spatiotemporal evolution of carbon emissions in metropolitan areas of Zhejiang Province and its influencing factors. J. Nat. Resour. 2022, 37, 1524–1539. [Google Scholar]
  47. Fang, J.; Guo, Z.; Park, S.; Chen, A. Estimation of terrestrial vegetation carbon sequestration in China during 1981~2000. Sci. China Ser. D Earth Sci. 2007, 50, 804–812. [Google Scholar]
  48. Grosz, H.; Gyöngyösi, A.; Weidinger, P.; Nagy, A. Use of WRF result as meteorological input to DNDC model for greenhouse gas flux simulation. Atmos. Environ. 2015, 122, 230–235. [Google Scholar] [CrossRef]
  49. Mohammed, A.; Khan, A.; Khan, H.; Santamouris, M. Cooling energy benefits of increased green infrastructure in subtropical urban building environments. Buildings 2023, 13, 2257. [Google Scholar] [CrossRef]
  50. Asif, M.; Yadav, R.; Sugha, A.; Singh, M. Chemical Composition and Source Apportionment of Winter Fog in Amritsar: An Urban City of North-Western India. Atmosphere 2022, 13, 1376. [Google Scholar] [CrossRef]
  51. Wang, w.; Cheng, X.; Hu, C.; Xia, S.; Wang, T. City Street Canyon PM2. 5 Spatial-temporal distribution characteristics and air quality evaluation: A case study of Changhuai Street in Hefei. Ecol. Environ. Sci. 2021, 30, 2157. [Google Scholar]
  52. Wang, X.; Wang, J. An Ecological and Environmental Approach to Urban Morphological Research. Urban Plan. J. 1–10.
  53. Wang, K. Spatial planning strategy of green and low-carbon oriented suburban urban clusters—A case study of N clusters in southern Jiangsu. Planners 2022, 38, 100–104. [Google Scholar]
  54. Cheng, H.; Jiang, Z.; Zhang, P.; Kang, T. Influence of urban settlement morphological parameters on air pollutant diffusion based on CFD simulation. J. Beijing Univ. Technol. 2021, 47, 1377–1387. [Google Scholar]
  55. Wu, Y.; Chen, H. The diffusion of traffic pollutants in different residential blocks based on spatial morphological clustering. Build. Environ. 2023, 228, 109860. [Google Scholar] [CrossRef]
  56. Wu, Z.; Zhao, Z.; Gan, W.; Zhou, S.; Dong, W. Achieving Carbon Neutrality through Urban Planning and Design. Int. J. Environ. Res. Public Health 2023, 20, 2420. [Google Scholar] [CrossRef] [PubMed]
  57. Park, K. Regreening suburbia: An analysis of urban greening approaches in US sprawl retrofitting projects. Urban For. Urban Green. 2023, 88, 128092. [Google Scholar] [CrossRef]
  58. Zhou, J. Urban ecological human settlements design based on green and low-carbon concept. J. Comput. Methods Sci. Eng. 2024, 24, 303–309. [Google Scholar] [CrossRef]
  59. Guo, F.; Schlink, U.; Wu, W.; Hu, D.; Jia, Y. Scale-dependent and season-dependent impacts of 2D/3D building morphology on land surface temperature. Sustain. Cities Soc. 2023, 97, 104788. [Google Scholar] [CrossRef]
  60. Zhang, B.; Zhu, Y.; Zheng, C.; Xu, G. Building height control strategy in Qingyuanshan area, Quanzhou City, Fujian Province in the relationship between “mountain-city” overlook. Landsc. Archit. 2024, 31, 122–130. [Google Scholar] [CrossRef]
Figure 1. Study area.
Buildings 14 02478 g001
Figure 2. Carbon emission calculation process.
Buildings 14 02478 g002
Figure 3. Spatial distribution of carbon emissions in Hangzhou, 2020.
Buildings 14 02478 g003
Figure 4. Length of carbon emission diffusion trajectory in Hangzhou, 2020.
Buildings 14 02478 g004
Figure 5. Simulated plot location map.
Buildings 14 02478 g005
Figure 6. Location and height of new building sites.
Buildings 14 02478 g006
Figure 7. Maps of lengths of carbon emission corridor diffusion trajectories.
Buildings 14 02478 g007
Figure 8. Diffusion length of the carbon emission corridor for the simulation case.
Buildings 14 02478 g008
Table 1. Data sources.
The Name of the DataData SourceYear of ReleaseData Connection
Industrial energy consumption, the volume of industrial products producedHangzhou Statistical Yearbook2020https://tjj.hangzhou.gov.cn/
accessed on 6 July 2022
Vehicle ownership dataGovernment’s public information website2020https://www.hangzhou.gov.cn/
accessed on 6 July 2022
Population density indicesLandScan dataset2020https://landscan.ornl.gov/
accessed on 10 July 2022
Road network dataOSM maps2020https://www.openstreetmap.org/
accessed on 20 July 2022
Land use dataMODIS land cover product2020https://ladsweb.modaps.Eosdis.nasa.gov/
accessed on 12 August 2022
Building dataBaidu Maps2020https://lbsyun.baidu.com/
accessed on 10 August 2022
Table 2. Diffusion length of the carbon emission corridor for the simulation case.
Building Height10 m24 m36 m45 m54 m80 m150 m
Distance from
Carbon Emission Zone
0 km196,629186,501161,972160,053158,941156,241/
1 km196,991187,134164,849163,633///
2 km197,520189,040176,396174,836172,525167,583/
3 km197,689193,413183,020////
4 km//192,045191,748190,619188,599/
6 km//197,446194,848194,599193,848/
7 km200,328////195,789195,463
Disclaimer/Publisher’s Note: The statements, opinions and data contained in all publications are solely those of the individual author(s) and contributor(s) and not of MDPI and/or the editor(s). MDPI and/or the editor(s) disclaim responsibility for any injury to people or property resulting from any ideas, methods, instructions or products referred to in the content.

