Evaluation and Division Methods of Coupled Spatial Units between Parks and Living Circles: A Case Study of Four National-Level New Areas

Abstract
1. Spatial Unit Evaluation and Division: A Comprehensive Review
2. Evaluation Method of Spatial Units Based on Supply and Demand Coupling Relationships
2.1. Basic Categories and Division Methods of Spatial Units
2.2. Distribution Evaluation of Spatial Units
2.3. Measurement of Park Services
2.4. Measurement of Living Circle Activities
2.5. Construction of Spatial Suitability Index System
2.5.1. Construction Method and Hierarchical Structure of Indicators
2.5.2. Indicator Weighting
2.6. Measurement of Coupling Relationship between Park and Living Circle Services within Units
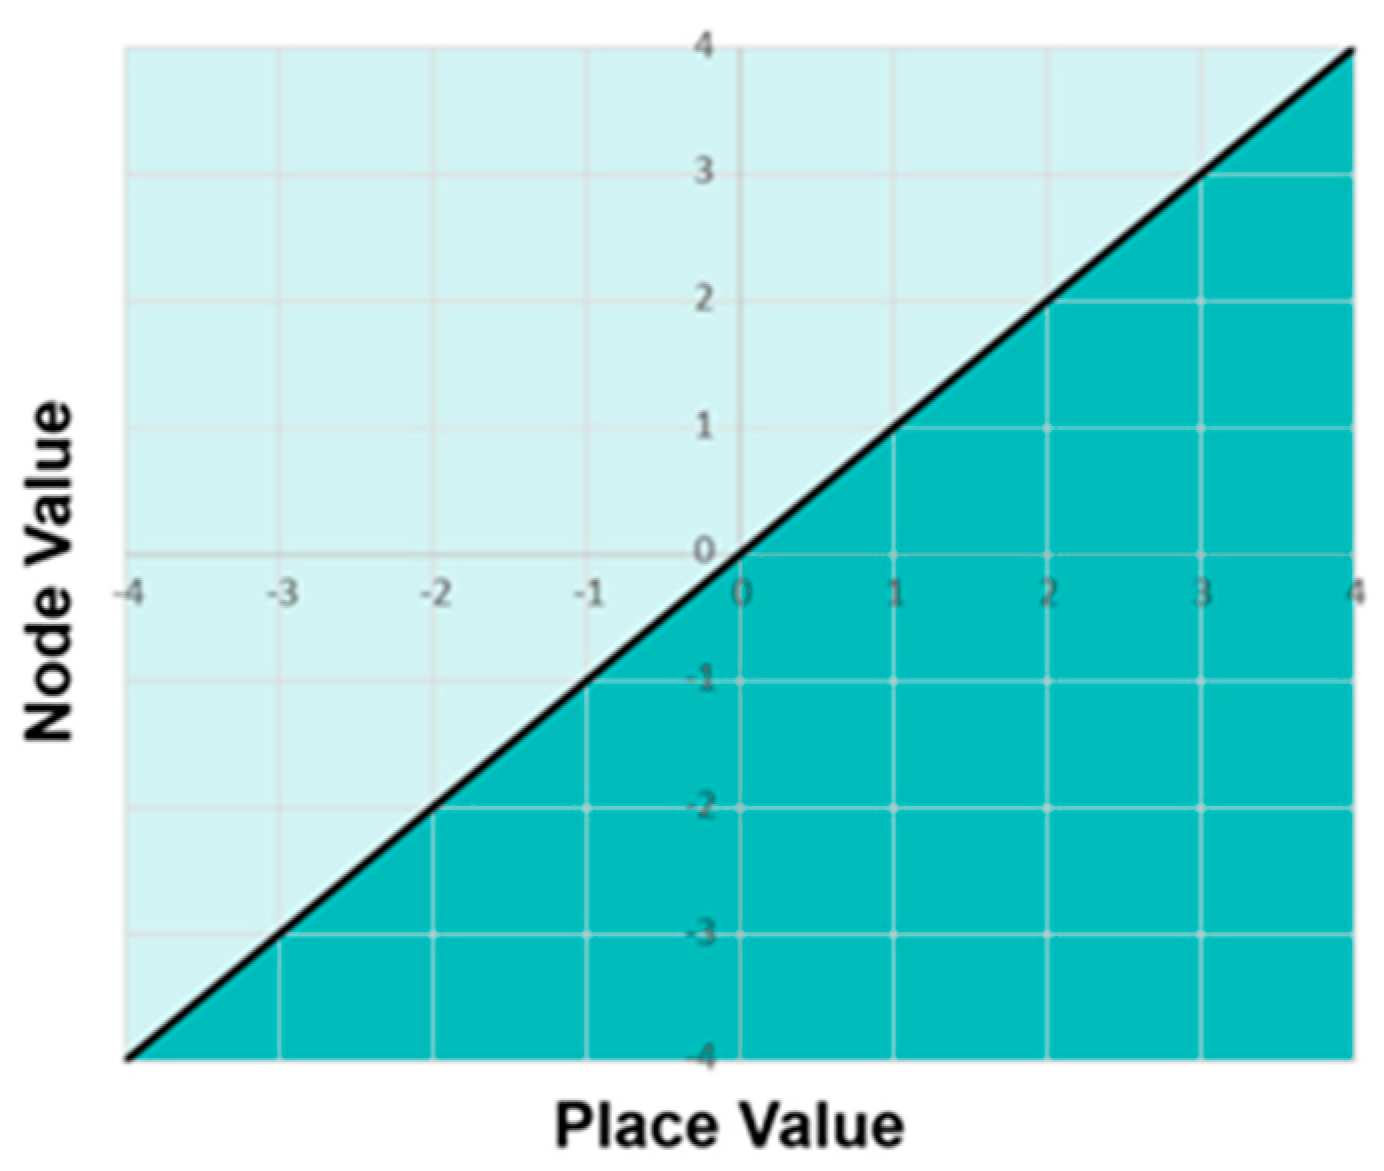
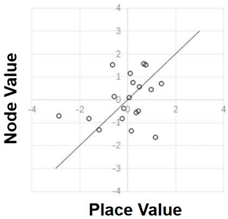
2.6.1. Introduction of Node–Place (NP) Model
2.6.2. Selection and Determination of Measurement Indicators
2.6.3. Composite Indicator Weights
2.6.4. Calculation Method and Explanation of Composite Indicators
3. Spatial Unit Evaluation Empirical Analysis: A Case Study of Four National-Level New Areas
3.1. Research Scope and Overview of New Areas
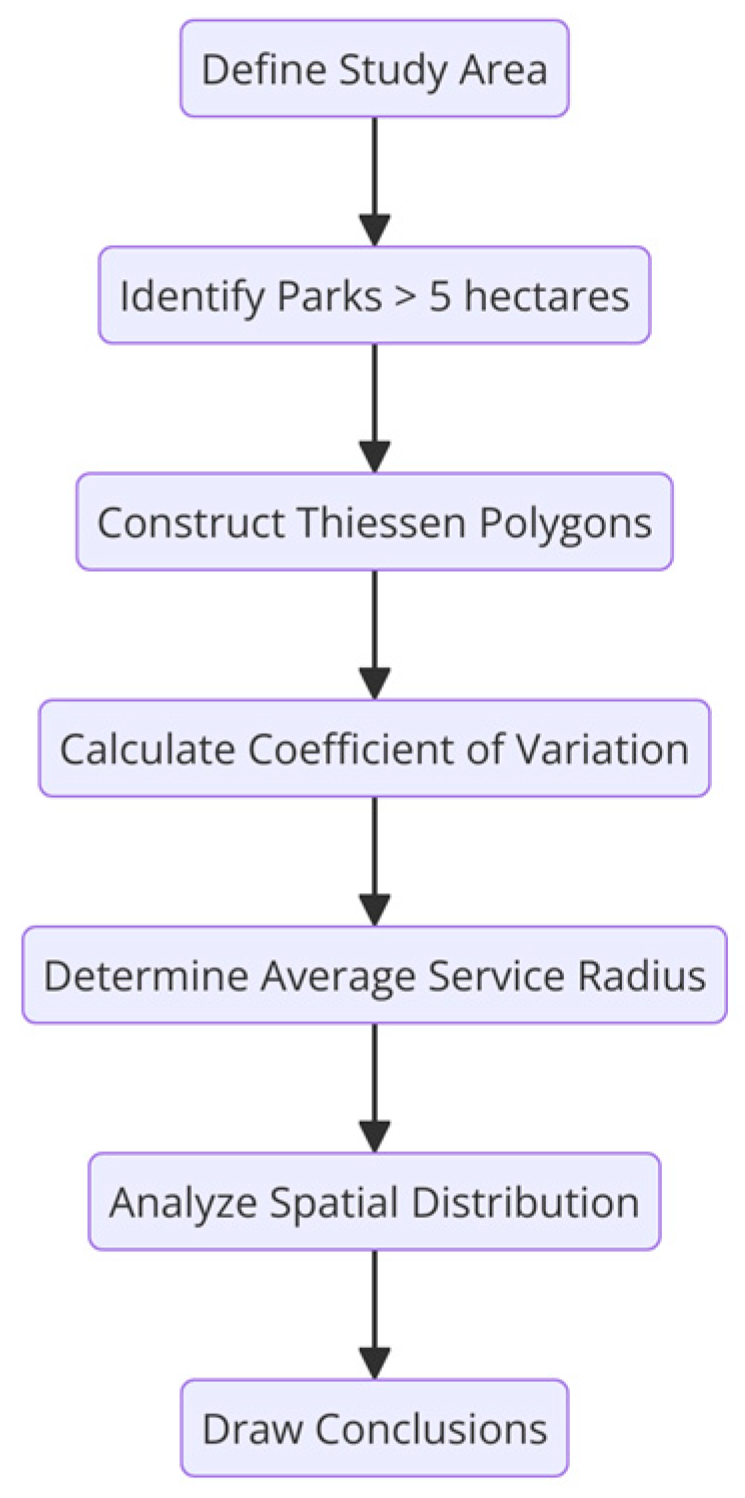
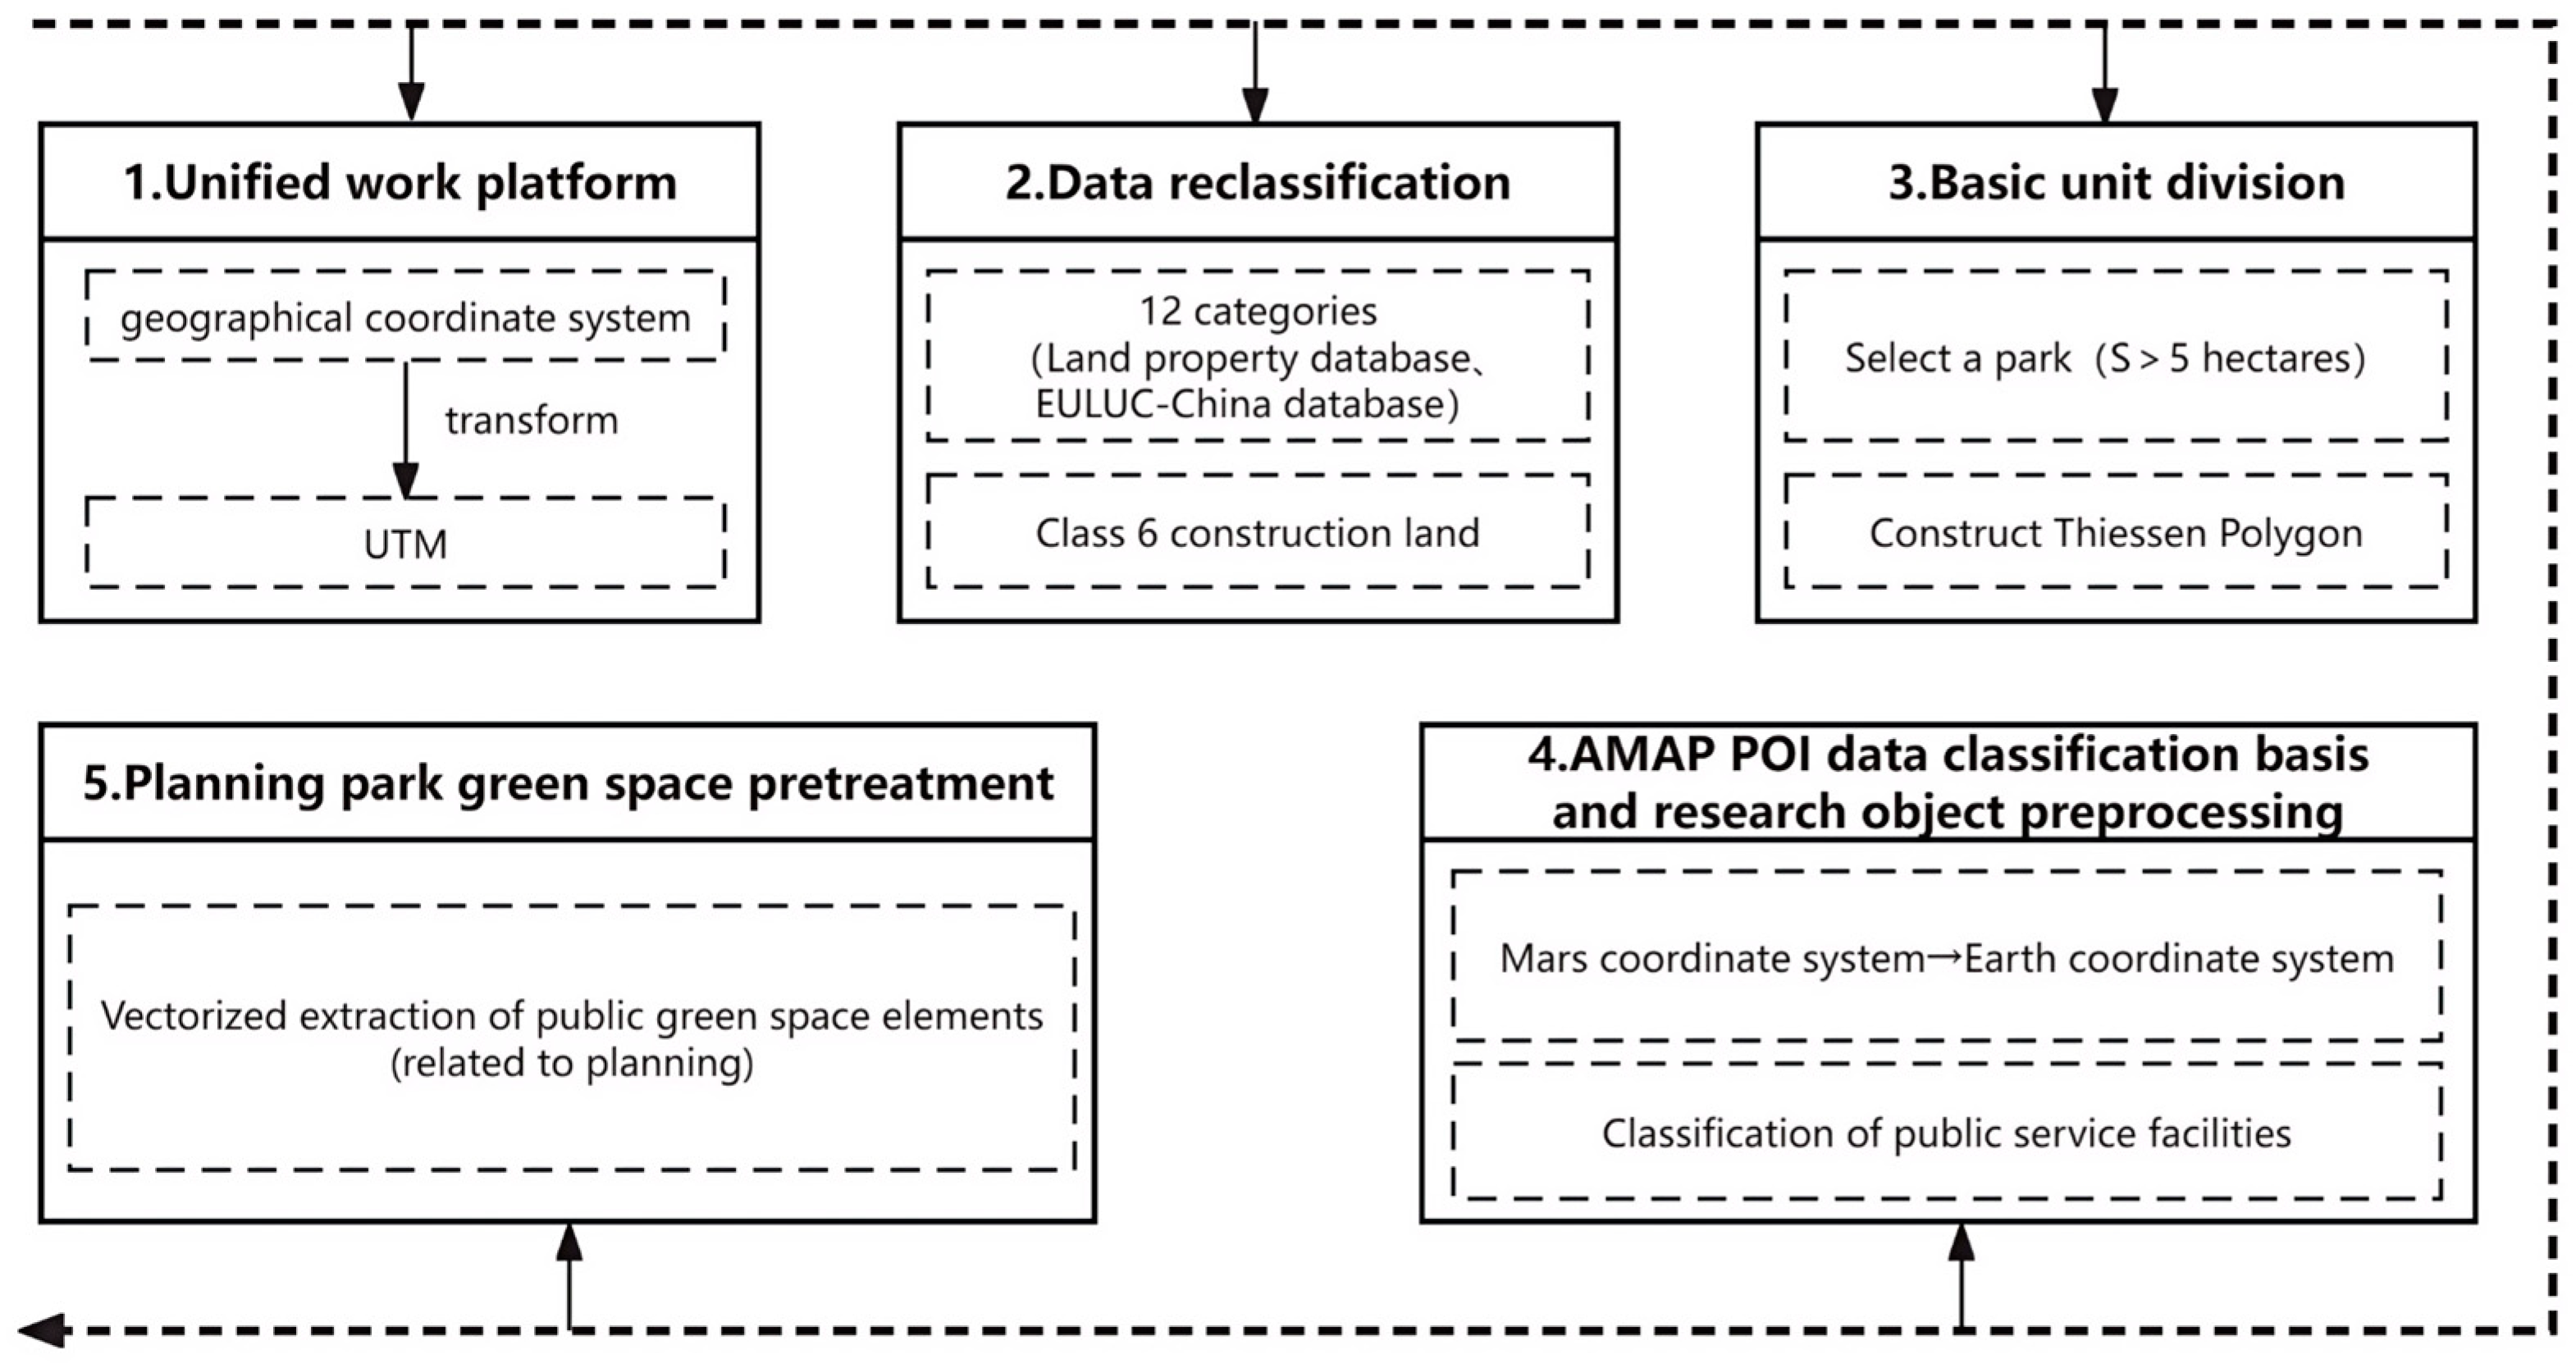
3.2. Data Processing and Method Flow
3.2.1. Workflow and Data Acquisition
3.2.2. Data Preprocessing
3.3. Empirical Research Results of Four National-Level New Areas
3.3.1. Spatial Unit Characteristics
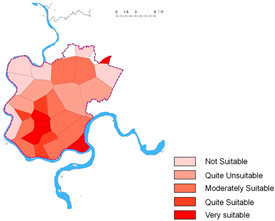
3.3.2. Evaluation of Spatial Unit Suitability
- (1)
- Quantity Characteristics
- (2)
- Spatial Distribution Characteristics
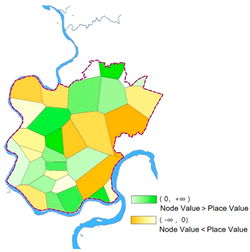
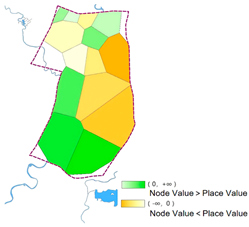
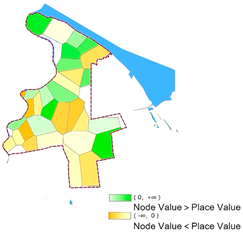
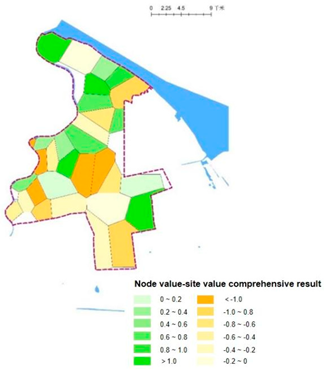
3.3.3. Coupling Relationship between Parks and Living Circles
3.4. Cross-Sectional Comparative Analysis
3.4.1. Comparative Analysis of Spatial Unit Characteristics
3.4.2. Comparative Analysis of Spatial Suitability Evaluation
- (1)
- Quantity Characteristics
- (2)
- Spatial Distribution Characteristics
3.4.3. Comparative Analysis of Coupling Relationship between Parks and Living Circles
- ➀
- Quantitative Characteristics
- ➁
- Spatial Distribution Characteristics
4. Conclusions and Discussion
4.1. Conclusions
4.2. Discussion
- ➀
- Method Limitations
- ➁
- Future Research Directions
Author Contributions
Funding
Data Availability Statement
Conflicts of Interest
References
- Wu, X.Q. Research on the Layout Structure of Green Space System in Mountainous Cities. Southwest University: Chongqing, China, 2009. [Google Scholar] [CrossRef]
- Wu, R.W. Hyde Park in the UK—The first urban park in the history of world gardens. Garden 2000, 3, 41–49. [Google Scholar]
- Zhang, X.L. Research on the Service Radius of Urban Park Green Space Based on GIS—A Case Study of Laohekou City; Huazhong Agricultural University: Wuhan, China, 2007. [Google Scholar] [CrossRef]
- Yuan, J.D.; Sun, Z.J.; Zhang, N.; Zhao, Z. Reconstruction of China’s urban regional system based on “daily life circle”. Geogr. Sci. 2005, 25, 17–22. [Google Scholar]
- Sun, D.F.; Shen, S.; Wu, T.H. Research on the allocation of county public service facilities from the perspective of life circle theory: Taking Pizhou City, Jiangsu Province as an example. Planner 2012, 28, 68–72. [Google Scholar]
- Waitt, G.; Knobel, H. Embodied geographies of liveability and urban parks. Urban Stud. 2018, 55, 3151–3167. [Google Scholar] [CrossRef]
- Stehman, S.V.; Wickham, J.D. Pixels, blocks of pixels, and polygons: Choosing a spatial unit for thematic accuracy assessment. Remote Sens. Environ. 2011, 115, 3044–3055. [Google Scholar] [CrossRef]
- Barbosa, O.; Tratalos, A.J.; Armsworth, R.P.; Davies, R.G.; Fuller, R.A.; Johnson, P.; Gaston, K.J. Who benefits from access to green space? A case study from Sheffield, UK. Landsc. Urban Plan. 2007, 83, 187–195. [Google Scholar] [CrossRef]
- Liang, T.; Jing, C.; Zhuo, F.; Feng, Y.; Zhang, H.; Fu, Y. Multi-Scale Dynamic Partitioning System of Urban Spatial Units. ISPRS Ann. Photogramm. Remote Sens. Spat. Inf. Sci. 2023, 10, 405–411. [Google Scholar] [CrossRef]
- Luo, S.; Liu, Y.; Du, M.; Gao, S.; Wang, P.; Liu, X. The Influence of Spatial Grid Division on the Layout Analysis of Urban Functional Areas. ISPRS Int. J. Geo-Inf. 2021, 10, 189. [Google Scholar] [CrossRef]
- Huang, Y.Y.; Lin, T.; Hu, D.J.; Xue, X.Z.; Zhang, G.Q. Research on the division technology of small-scale sea area spatial evaluation unit—Taking Dongshan Bay in Fujian Province as an example. Acta Ecol. Sin. 2021, 41, 707–716. [Google Scholar]
- Pang, W.Y. Research on the Division and Control of National Spatial Landscape Style Units from the Perspective of Overall Urban Design; Huazhong University of Science and Technology: Wuhan, China, 2022. [Google Scholar]
- Luo, J.C.; Zhou, C.H.; Liang, Y.; Zhang, J.S.; Huang, Y.F. Multi-scale spatial unit regional division method. Geogr. J. 2002, 2, 167–173. [Google Scholar]
- Chen, S.S.; Yang, G.; Liang, R.; Liu, L. Social performance evaluation of children’s outdoor activity space configuration in Beibei old city area of Chongqing. China Gard. 2020, 36, 87–91. [Google Scholar]
- Hao, X.Y.; Pan, Y.C.; Tang, X.M.; Qiu, H.; Liu, Y.; Ren, Y.M. Division method of land leveling unit in plain dry farming area based on spatial clustering. J. Agric. Eng. 2015, 31, 301–307. [Google Scholar]
- Ji, J.; Gao, X.L. Division of living space units based on residents’ daily travel. Prog. Geogr. 2012, 31, 248–254. [Google Scholar]
- Dong, X.; Xu, Y.; Huang, L.; Liu, Z.; Xu, Y.; Zhang, K.; Hu, Z.; Wu, G. Exploring Impact of Spatial Unit on Urban Land Use Mapping with Multisource Data. Remote Sens. 2020, 12, 3597. [Google Scholar] [CrossRef]
- Cheng, X.; Shen, Z.F.; Yang, B.H.; Liu, Y.; Zhang, Z.G. GIS simulation and evaluation analysis of environmental impact of urban master planning. J. Earth Inf. Sci. 2011, 13, 513–519. [Google Scholar]
- Bao, Z.T.; Jiang, D.Z.; Zhou, J.Y.; Huang, Y.X. Spatial unit delineation for national scale landscape planning management based on landscape feature assessment. China Gard. 2023, 39, 46–52. [Google Scholar]
- Yan, L.X.; Chen, J.N.; Zhang, S.W.; Wang, D.; Li, X.; Yin, Z.X.; Dou, Y. Planning simulation and evaluation oriented to spatial performance: Taking the unit planning of Hongqiao main city area in Shanghai as an example. Urban Plan. J. 2023, 5, 37–44. [Google Scholar]
- Grădinaru, S.R.; Iojă, C.I.; Pătru-Stupariu, I.; Hersperger, A.M. Are spatial planning objectives reflected in the evolution of urban landscape patterns? A framework for the evaluation of spatial planning outcomes. Sustainability 2017, 9, 1279. [Google Scholar] [CrossRef]
- Peng, J.; Peng, F.L. A GIS-based evaluation method of underground space resources for urban spatial planning: Part 1 methodology. Tunn. Undergr. Space Technol. 2018, 74, 82–95. [Google Scholar] [CrossRef]
- Wang, Y.D. Calculation of Regional Average Rainfall Using Thiessen Polygon Method Based on ArcGIS. Jilin Water Resour. 2024, 58–60+63. [Google Scholar] [CrossRef]
- Song, J.H.; Li, S.W.; Zhao, Z.Z.; Wu, S.L. Application of Thiessen Polygon in the Analysis of Spatial Distribution Characteristics of Residential Points: A Case Study of Lingao County, Hainan Province. J. Hainan Norm. Univ. (Nat. Sci. Ed.) 2013, 26, 223–226. [Google Scholar]
- Lu, L.; Deng, H.B. Research progress and prospect of node-place model and its application. Geogr. Sci. 2019, 39, 12–21. [Google Scholar]
- Reusser, D.E.; Loukopoulos, P.; Stauffacher, M.; Scholz, R.W. Classifying Railway Stations for Sustainable Transitions—Balancing Node and Place Functions. J. Transp. Geogr. 2008, 16, 191–202. [Google Scholar] [CrossRef]
- Yang, J.Y. Research on the Coordination Relationship between Land Use and Transportation in Shenzhen Based on the Node-Place Model; Harbin Institute of Technology: Harbin, China, 2017. [Google Scholar] [CrossRef]
- GB/T 51346-2019; Near Zero Energy Building Technical Standard. China Architecture & Building Press: Beijing, China, 2019.


| Authors | Year | Methodology Nomenclature | Description | Application Domain | Advantages | Shortcomings |
|---|---|---|---|---|---|---|
| Liang et al. [9] | 2023 | Multiscale Dynamic Partitioning System | Proposed a hierarchical zoning method and interactive unit grid partitioning method | Urban Analysis Applications | Enhances efficiency of spatial unit design, meets high-precision and multiscale analysis needs | Complexity in application requires extensive data |
| Luo et al. [10] | 2021 | Spatial Grid Division | Explored the influence of spatial grid division on urban functional area layout | Urban Functional Areas | Identifies single and mixed functional areas, provides a basis for refined management | Grid size selection is critical and may affect results |
| Huang et al. [11] | 2021 | Small-Scale Marine Area Division | Developed a spatial evaluation unit division technique suitable for small-scale marine areas | Marine Areas | Applicable to specific environments, integrates chemical, physical, and biological attributes | Limited to specific environments, not broadly applicable |
| Pang [12] | 2022 | Multidimensional Analysis | Expanded spatial unit division by evaluating the natural environment, built space, and historical culture | National Spatial Landscape | Emphasizes multidimensional analysis, enhances understanding of spatial unit dynamics | Requires comprehensive data from various dimensions |
| Luo and Zhou [13] | 2002 | Multiscale Regional Partitioning | Proposed a multiscale spatial unit regional partitioning method | Various Spatial Scales | Increases interdependence of spatial units, facilitates integration at larger scales | Complexity in multiscale interactions |
| Chen et al. [14] | 2020 | Children’s Outdoor Activity Spaces | Analyzed service coverage and coverage rates by dividing outdoor activity spaces of different levels for children | Urban Children’s Activity | Provides data support for planning children’s activity spaces | Focused on a specific demographic, not generalizable |
| Hao et al. [15] | 2015 | Spatial Clustering Method | Used a clustering-based method to determine the optimal number of partitions and their distribution | Land Use Planning | Reduces engineering costs and improves partition flatness compared to traditional methods | Requires detailed clustering algorithm understanding |
| Ji and Gao [16] | 2012 | Living Space Unit Identification | Proposed a method to identify living space units based on spatial stability and used K-Means spatial clustering analysis | Urban Living Spaces | Provides references for understanding spatial formation processes within cities | Limited by the assumptions of spatial stability |
| Dong et al. [17] | 2020 | Urban Land Use Types | Employed blocks, grids, and objects to divide urban land use types | Urban Planning | Demonstrates diversity and practicality of spatial unit division methods | Applicability may vary depending on the urban context |
| Authors | Year | Methodology Nomenclature | Description | Application Domain | Advantages | Shortcomings |
|---|---|---|---|---|---|---|
| Cheng et al. [18] | 2011 | Evaluation Index System | Developed through geographic information data processing and simulation techniques | Meteorological GIS Demonstration | Provides scientific basis for optimizing urban planning and local layout | Requires integration of meteorological models |
| Bao et al. [19] | 2023 | Landscape Feature Evaluation | Divides landscapes into multiscale, tangible, and identifiable whole spatial units | Ecosystem Services | New perspective for protection and management of ecosystem services | Complexity in landscape division and feature assessment |
| Yan et al. [20] | 2023 | Planning Simulation Evaluation | Focuses on urban spatial performance and supply-demand matching performance of planning schemes | Spatial Performance, Supply-Demand | Systematically evaluates planning schemes and provides a framework for performance evaluation | Integration of various models is complex |
| Grădinaru et al. [21] | 2017 | Consistency Framework | Assesses consistency between planning objectives and actual development patterns | Construction Efficiency, Quality of Life | Demonstrates actual achievements of national spatial planning objectives | Requires comprehensive data on planning objectives and outcomes |
| Peng and Peng [22] | 2018 | UUS Resource Evaluation | Quantified using AHP, MUGM, EM, and other tools | Construction Suitability, Latent Value | Provides theoretical support for urban underground space planning and resource assessment | Complexity in quantifying construction suitability and latent value |
| Basic Categories | ||||
|---|---|---|---|---|
| Research Object | Selected Area | Service Boundary | ||
| Park Green Spaces | S (≥5 hectare) | Boundary Classification | Boundary Classification | Service Category Consideration |
| Maximum Service Boundary Intuitive Service Boundary | Thiessen Polygon Service Aggregation Analysis (within a certain radius outside the park boundaries) | Park Service Characteristics | ||
| Living Area Service Attributes | ||||
| Management and Development of Spatial Units | ||||
| Calculation Method | Equation | |
|---|---|---|
| Evaluation of Spatial Unit Distribution | CV | where σ is the population standard deviation of spatial unit data, and μ is the mean of spatial unit data. |
| Park Service Measurement | Park Service Level Index | ① Park Service Efficiency where SE is the park service efficiency, S is the area of GOD development unit, and s is the area of park green space. ② Park Effective Service Level where ESL is the effective park service level, C is the effective park service area, and S is the area of the spatial unit. ③ Park Accessibility where PO is the park accessibility, l is the effective length of the park adjacent to urban roads, and L is the total perimeter of the park. |
| Living Circle Activity Measurement | General Activity Index of Living Circles | ① Land Use Mix where H is the land use mix index, m is the total number of land use functional categories, and Pi is the proportion of land area for the i-th land use category. ② Public Service Coverage where PE is the public service coverage, n is the number of basic public service facility categories, Wi (i = 1, 2, 3, …, i) is the weight of the i-th public service facility category, defined as 1/n (n = 6), and Ti (i = 1, 2, 3, …, i) is the coverage rate of the i-th public service facility category. ③ Service Space Agglomeration where ASS is the service space agglomeration, n is the total number of POIs within the intuitive boundary, and N is the total number of POIs within the development unit. |
| Economic Management Activity Index of Living Circles | ① Development Intensity Concentration where FAR is the floor area ratio (i.e., the standard land development intensity), A is the total built-up area of the spatial unit, S is the total land area of the spatial unit, CDI is the concentration degree of development intensity, Fa is the land development intensity within the intuitive boundary, and Fb is the land development intensity of the spatial unit. ② Land Value Concentration where CLV is the land value concentration, Va is the land value within the effective service radius (GDP per hectare), and Vb is the land value of the spatial unit (GDP per hectare). ③ Administrative Management Level where AM is the level of administrative management. | |
| Calculation Method of Composite Index | Z-Score Standardization Equation | where μ is the mean of population data and σ is the standard deviation of population data. |
| Primary Indicators | Weights | Secondary Indicators | Weight |
|---|---|---|---|
| Park Service Level M1 | 0.5177 | Park Service Efficiency N1 | 0.1252 |
| Park Effective Service Level N2 | 0.2594 | ||
| Park Accessibility N3 | 0.1331 | ||
| Living Circle Activity Characteristics M2 | 0.3529 | Land Use Mix N4 | 0.0859 |
| Public Service Coverage N5 | 0.2194 | ||
| Service Space Agglomeration N6 | 0.0476 | ||
| Management and Development Level M3 | 0.1294 | Development Intensity Concentration N8 | 0.0359 |
| Land Value Concentration N9 | 0.0592 | ||
| Administrative Management Level N7 | 0.0343 |
| Primary Indicators | Secondary Indicators |
|---|---|
| Park Service Support A1 | P1—Park Service Efficiency |
| P2—Park Effective Service Level | |
| P3—Park Accessibility | |
| Living Circle Functional Agglomeration A2 | P4—Land Use Mix |
| P5—Public Service Coverage | |
| P6—Service Space Agglomeration | |
| P7—Development Intensity Concentration | |
| P8—Land Value Concentration |
| Establishment Year | Planned Area (Hectare) | Resident Population (Ten Thousand People) | Research Area (Hectare) | Total Area of Basic Units (Hectare) | |
|---|---|---|---|---|---|
| Chongqing Liangjiang New Area | 2001 | 12.00 | 333.0 | 2.10 | 2.05 |
| Chengdu Tianfu New Area | 2011 | 15.78 | 205.0 | 1.35 | 1.23 |
| Shanghai Pudong New Area | 1992 | 12.10 | 578.2 | 4.09 | 3.77 |
| Tianjin Binhai New Area | 1994 | 22.70 | 149.7 | 2.11 | 1.88 |
| Land Classification Standards | Land Attribute Database | EULUC Database | ||
|---|---|---|---|---|
| R | Living Circle | 0101 | Living Circle Areas | |
| A | Land for Public Administration and Public Service | Public Facilities | 0501 | Administrative Management |
| Educational Areas | 0502 | Education | ||
| Medical and Health Facilities | 0503 | Healthcare | ||
| Cultural Areas | 0504 | Cultural and Sports Facilities | ||
| Sports Facilities | ||||
| B | Land for Commercial and Service Facilities | 0201 | Commercial Offices | |
| Commercial Premises | 0202 | Commercial Areas | ||
| M | Industrial Areas | 0301 | Industrial Areas | |
| S | Roads and Transportation Facilities Areas | Subway Facilities | 0401 | Roads |
| Transport Hubs | 0402 | Transport Stations | ||
| Parking Lots | 0403 | Airport Facilities | ||
| G | Green Spaces and Square Areas | Scenic Areas | ||
| Green Spaces | 0505 | Park and Green Spaces | ||
| E | Non-construction Areas | Water Systems | ||
| Public Service Facilities Category | Gaode POI Major Category | Gaode POI Sub-Category | Gaode POI Minor Category | Liangjiang New Area POIs Quantity | Tianfu New Area POIs Quantity | Pudong New Area POIs Quantity | Binhai New Area POIs Quantity |
|---|---|---|---|---|---|---|---|
| Commercial Facilities | Shopping Services | Supermarket | — | 486 | 94 | 790 | 339 |
| General Market | — | 1886 | 241 | 6 | 719 | ||
| Convenience Store | — | 2445 | 368 | 7 | 599 | ||
| Lifestyle Services | Post Office | — | 71 | 13 | 75 | 48 | |
| Logistics and Express | — | 1276 | 265 | 4 | 754 | ||
| Telecommunications Office | — | 248 | 105 | 186 | 144 | ||
| Laundromats | — | 531 | 106 | 470 | 174 | ||
| Financial and Insurance Services | Banks | — | 517 | 123 | 723 | 506 | |
| Administrative Management and Services | Government Agencies and Social Organizations | Government Agencies | Township Level Government and Public Institutions | 389 | 142 | 933 | 267 |
| Public Security, Procuratorial, and Judicial Organs | Public Security Institutions | 49 | 12 | 131 | 11 | ||
| Educational Facilities | Science, Education, and Cultural Services | Schools | Kindergarten | 459 | 117 | 443 | 514 |
| Schools | Primary School | 76 | 22 | 148 | 78 | ||
| Sports Facilities | Sports and Leisure Services | Sports Venues | — | 676 | 232 | 1362 | 271 |
| Healthcare Services | Medical and Healthcare Sales Stores | Clinics | — | 592 | 172 | 268 | 160 |
| Pharmacies | Pharmacy | 1096 | 402 | 627 | 359 | ||
| Transportation Facilities | Transportation Facility Services | Bus Stops | — | 669 | 400 | 1789 | 968 |
| Total | — | — | — | 11,366 | 2814 | 7962 | 5911 |
| Public Service Facilities Category | Liangjiang New Area POIs Quantity | Tianfu New Area POIs Quantity | Pudong New Area POIs Quantity | Binhai New Area POIs Quantity |
|---|---|---|---|---|
| Commercial Facilities | 24,245 | 4374 | 8127 | 7546 |
| Administrative Management and Services | 786 | 243 | 1590 | 692 |
| Educational Facilities | 1555 | 578 | 724 | 887 |
| Sports Facilities | 1019 | 353 | 1999 | 382 |
| Healthcare Services | 2165 | 967 | 2252 | 845 |
| Transportation Facilities | 3914 | 2661 | 12,052 | 5583 |
| Total | 33,684 | 9176 | 26,744 | 15,935 |
| New Area Name | Urban Park Category | Number of Spatial Units (Units) | Standard Deviation/Mean Value (Hectare) | CV (%) | Spatial Distribution Characteristics | Average Radius of Spatial Units (Meter) |
|---|---|---|---|---|---|---|
| Chongqing Liangjiang New Area | Construction Status | 29 | 415.96 | 58.82 | Random Distribution | 1500 |
| 707.21 | ||||||
| Planning Scheme | 44 | 235.16 | 49.66 | Random Distribution | 1200 | |
| 473.57 | ||||||
| Chengdu Tianfu New Area | Construction Status | 14 | 605.99 | 74.16 | Clustered Distribution | 1600 |
| 817.12 | ||||||
| Planning Scheme | 50 | 133.39 | 52.97 | Random Distribution | 900 | |
| 251.82 | ||||||
| Shanghai Pudong New Area | Construction Status | 32 | 600.47 | 50.97 | Random Distribution | 1900 |
| 1178.04 | ||||||
| Planning Scheme | 14 | 1217.31 | 42.28 | Random Distribution | 3000 | |
| 2879.01 | ||||||
| Tianjin Binhai New Area | Construction Status | 19 | 812.92 | 82.11 | Clustered Distribution | 1700 |
| 990.05 | ||||||
| Planning Scheme | 16 | 1398.62 | 106.20 | Clustered Distribution | 2000 | |
| 1316.98 |
| Construction Status Spatial Unit Division Results | Planning Schemes Spatial Unit Division Results | |
|---|---|---|
| Chongqing Liangjiang New Area |  |  |
| Chengdu Tianfu New Area | 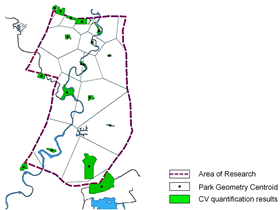 | 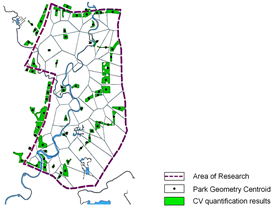 |
| Shanghai Pudong New Area |  | 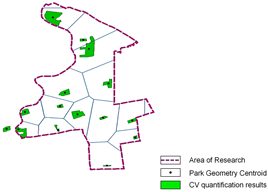 |
| Tianjin Binhai New Area |  | 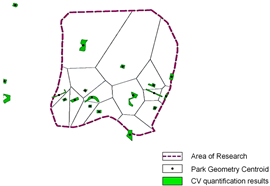 |
| Score Rang Level 1 | Score Rang Level 2 | Score Rang for Level 3 | Score Rang Level 4 | Score Rang Level 5 | |
|---|---|---|---|---|---|
| Chongqing Liangjiang New Area | 0.395917–0.4863 84 | 0.486385–0.5573 65 | 0.557366–0.6399 28 | 0.639929–0.7026 44 | 0.702645–0.7806 56 |
| Chengdu Tianfu New Area | 0.331458–0.3997 34 | 0.399735–0.4685 36 | 0.468537–0.6234 04 | 0.623405–0.6832 66 | 0.683267–0.8767 42 |
| Shanghai Pudong New Area | 0.309449–0.4036 13 | 0.403614–0.5279 77 | 0.527978–0.6448 62 | 0.644863–0.7978 69 | 0.797870–1.1894 86 |
| Tianjin Binhai New Area | 0.367650–0.4140 34 | 0.414035–0.5233 06 | 0.523307–0.5569 80 | 0.556981–0.6746 82 | 0.674683–0.7519 77 |
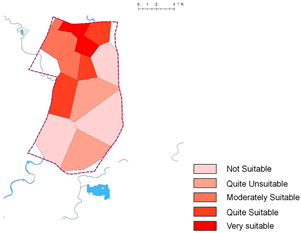
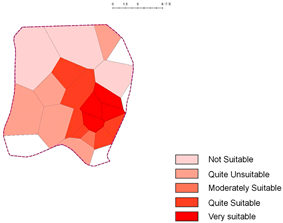
| Grading Quantity Statistics | Proportion Statistics of Spatial Unit Suitability Evaluation Results | |
|---|---|---|
| Chongqing Liangjiang New Area | 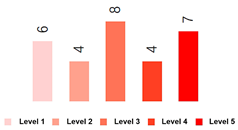 |  |
| Chengdu Tianfu New Area | 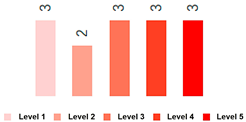 | 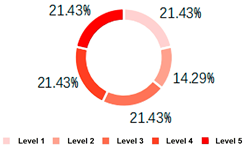 |
| Shanghai Pudong New Area |  |  |
| Tianjin Binhai New Area | 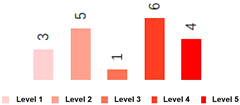 |  |
| Chongqing Liangjiang New Area | Chengdu Tianfu New Area |
 |  |
| Shanghai Pudong New Area | Tianjin Binhai New Area |
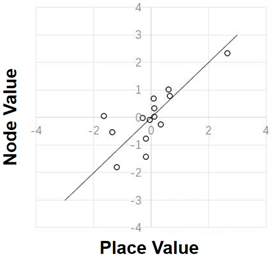
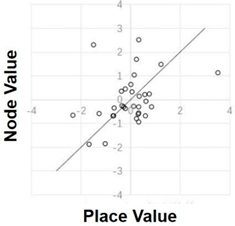
 |  |
| Spatial Units Quantity (Units) | Coupling Relationship Relative Balance Units Quantity (Units)/Proportion (%) | Node Value > Place Value Units Quantity (Units)/Proportion (%) | Place Value > Node Value Units Quantity (Units)/Proportion (%) | Maximum/Minimum Node Value | Node Value < 0 (Units)/Proportion (%) | Maximum/Minimum Place Value | Place Value < 0 (Units)/Proportion (%) | |
|---|---|---|---|---|---|---|---|---|
| Chongqing Liangjiang New Area | 29 | 7 | 15 | 14 | 2.08 | 16 | 1.26 | 13 |
| 24.14 | 51.72 | 48.28 | −1.64 | 55.17 | −3.63 | 44.83 | ||
| Chengdu Tianfu New Area | 14 | 3 | 7 | 7 | 2.32 | 8 | 2.67 | 7 |
| 21.34 | 50.00 | 50.00 | −1.82 | 57.14 | −1.61 | 50.00 | ||
| Shanghai Pudong New Area | 32 | 9 | 14 | 18 | 2.51 | 19 | 3.54 | 13 |
| 28.13 | 43.75 | 56.25 | −1.89 | 59.38 | −2.30 | 40.63 | ||
| Tianjin Binhai New Area | 19 | 4 | 9 | 10 | 1.56 | 9 | 1.42 | 7 |
| 21.05 | 47.37 | 52.63 | −1.67 | 47.37 | −2.85 | 36.84 |
| Chongqing Liangjiang New Area | Chengdu Tianfu New Area |
 |  |
| Shanghai Pudong New Area | Tianjin Binhai New Area |
 |  |
| Chongqing Liangjiang New Area | Chengdu Tianfu New Area |
 |  |
| Shanghai Pudong New Area | Tianjin Binhai New Area |
 |  |
| New Area Name | Construction Status/Planning Scheme Spatial Unit Quantity | Construction Status/Planning Scheme Spatial Unit CV (%) | Construction Status/Planning Scheme Spatial Unit Average Area (Hectares) | Construction Status/Planning Scheme Spatial Unit Average Service Radius (Meters) | ||||
|---|---|---|---|---|---|---|---|---|
| Chongqing Liangjiang New Area | 29 | 44 | 58.82 | 49.66 | 707.21 | 473.57 | 1500 | 1200 |
| Chengdu Tianfu New Area | 14 | 50 | 74.16 | 52.97 | 817.12 | 251.82 | 1600 | 900 |
| Shanghai Pudong New Area | 32 | 14 | 50.97 | 42.28 | 1178.04 | 2879.01 | 1900 | 3000 |
| Tianjin Binhai New Area | 19 | 16 | 82.11 | 106.20 | 990.05 | 1316.98 | 1700 | 2000 |
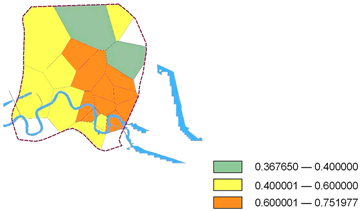
| Score Range Level 1 | Score Range Level 2 | Score Range Level 3 | Score Range Level 4 | |
|---|---|---|---|---|
| Chongqing Liangjiang New Area | 0.395917–0.40000 0 | 0.400001–0.60000 0 | 0.600001–0.7806 56 | — |
| Chengdu Tianfu New Area | 0.331458–0.40000 0 | 0.400001–0.600000 | 0.600001–0.8000 0 | 0.800001–0.8767 42 |
| Shanghai Pudong New Area | 0.309449–0.40000 0 | 0.400001–0.60000 0 | 0.600001–0.8000 0 | 0.800001–1.1894 86 |
| Tianjin Binhai New Area | 0.367650–0.40000 0 | 0.400001–0.60000 0 | 0.600001–0.7519 77 | — |
| Chongqing Liangjiang New Area | Chengdu Tianfu New Area |
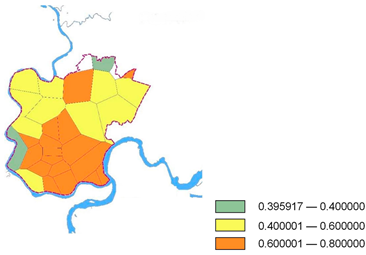 |  |
| Shanghai Pudong New Area | Tianjin Binhai New Area |
 |  |
| New Area Name | Spatial Units Quantity (Unit) | Units Quantity with Relatively Balanced Coupling Relationships/Proportion (%) | Units Quantity with Node Value > Place Value/Proportion (%) | Units Quantity with Place Value > Node Value/Proportion (%) |
|---|---|---|---|---|
| Chongqing Liangjiang New Area | 29 | 7 | 15 | 14 |
| 24.14 | 51.72 | 48.28 | ||
| Chengdu Tianfu New Area | 14 | 3 | 7 | 7 |
| 21.43 | 50.00 | 50.00 | ||
| Shanghai Pudong New Area | 32 | 9 | 14 | 18 |
| 28.13 | 43.75 | 56.25 | ||
| Tianjin Binhai New Area | 19 | 4 | 9 | 10 |
| 21.05 | 47.37 | 52.63 |
| Chongqing Liangjiang New Area | Chengdu Tianfu New Area |
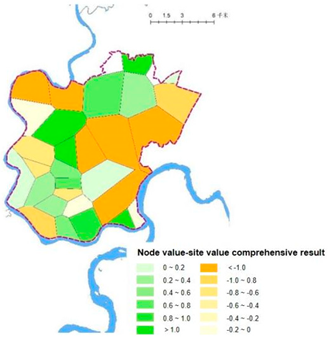 | 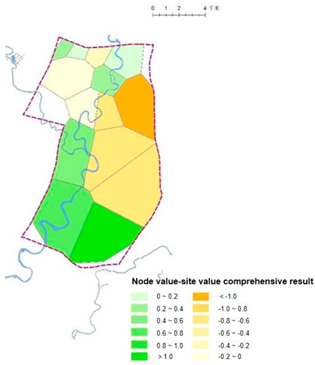 |
| Shanghai Pudong New Area | Tianjin Binhai New Area |
 |  |
Disclaimer/Publisher’s Note: The statements, opinions and data contained in all publications are solely those of the individual author(s) and contributor(s) and not of MDPI and/or the editor(s). MDPI and/or the editor(s) disclaim responsibility for any injury to people or property resulting from any ideas, methods, instructions or products referred to in the content. |
© 2024 by the authors. Licensee MDPI, Basel, Switzerland. This article is an open access article distributed under the terms and conditions of the Creative Commons Attribution (CC BY) license (https://creativecommons.org/licenses/by/4.0/).
Share and Cite
Wang, C.; Yang, Y.; Li, G.; Yan, S. Evaluation and Division Methods of Coupled Spatial Units between Parks and Living Circles: A Case Study of Four National-Level New Areas. Buildings 2024, 14, 2493. https://doi.org/10.3390/buildings14082493
Wang C, Yang Y, Li G, Yan S. Evaluation and Division Methods of Coupled Spatial Units between Parks and Living Circles: A Case Study of Four National-Level New Areas. Buildings. 2024; 14(8):2493. https://doi.org/10.3390/buildings14082493
Chicago/Turabian StyleWang, Chenpei, Yuanxiang Yang, Gantian Li, and Shuiyu Yan. 2024. "Evaluation and Division Methods of Coupled Spatial Units between Parks and Living Circles: A Case Study of Four National-Level New Areas" Buildings 14, no. 8: 2493. https://doi.org/10.3390/buildings14082493
APA StyleWang, C., Yang, Y., Li, G., & Yan, S. (2024). Evaluation and Division Methods of Coupled Spatial Units between Parks and Living Circles: A Case Study of Four National-Level New Areas. Buildings, 14(8), 2493. https://doi.org/10.3390/buildings14082493