
Field Study and Analysis of Passenger Density in the Beijing Subway Transfer Hall


Abstract
1. Introduction
2. Methodology
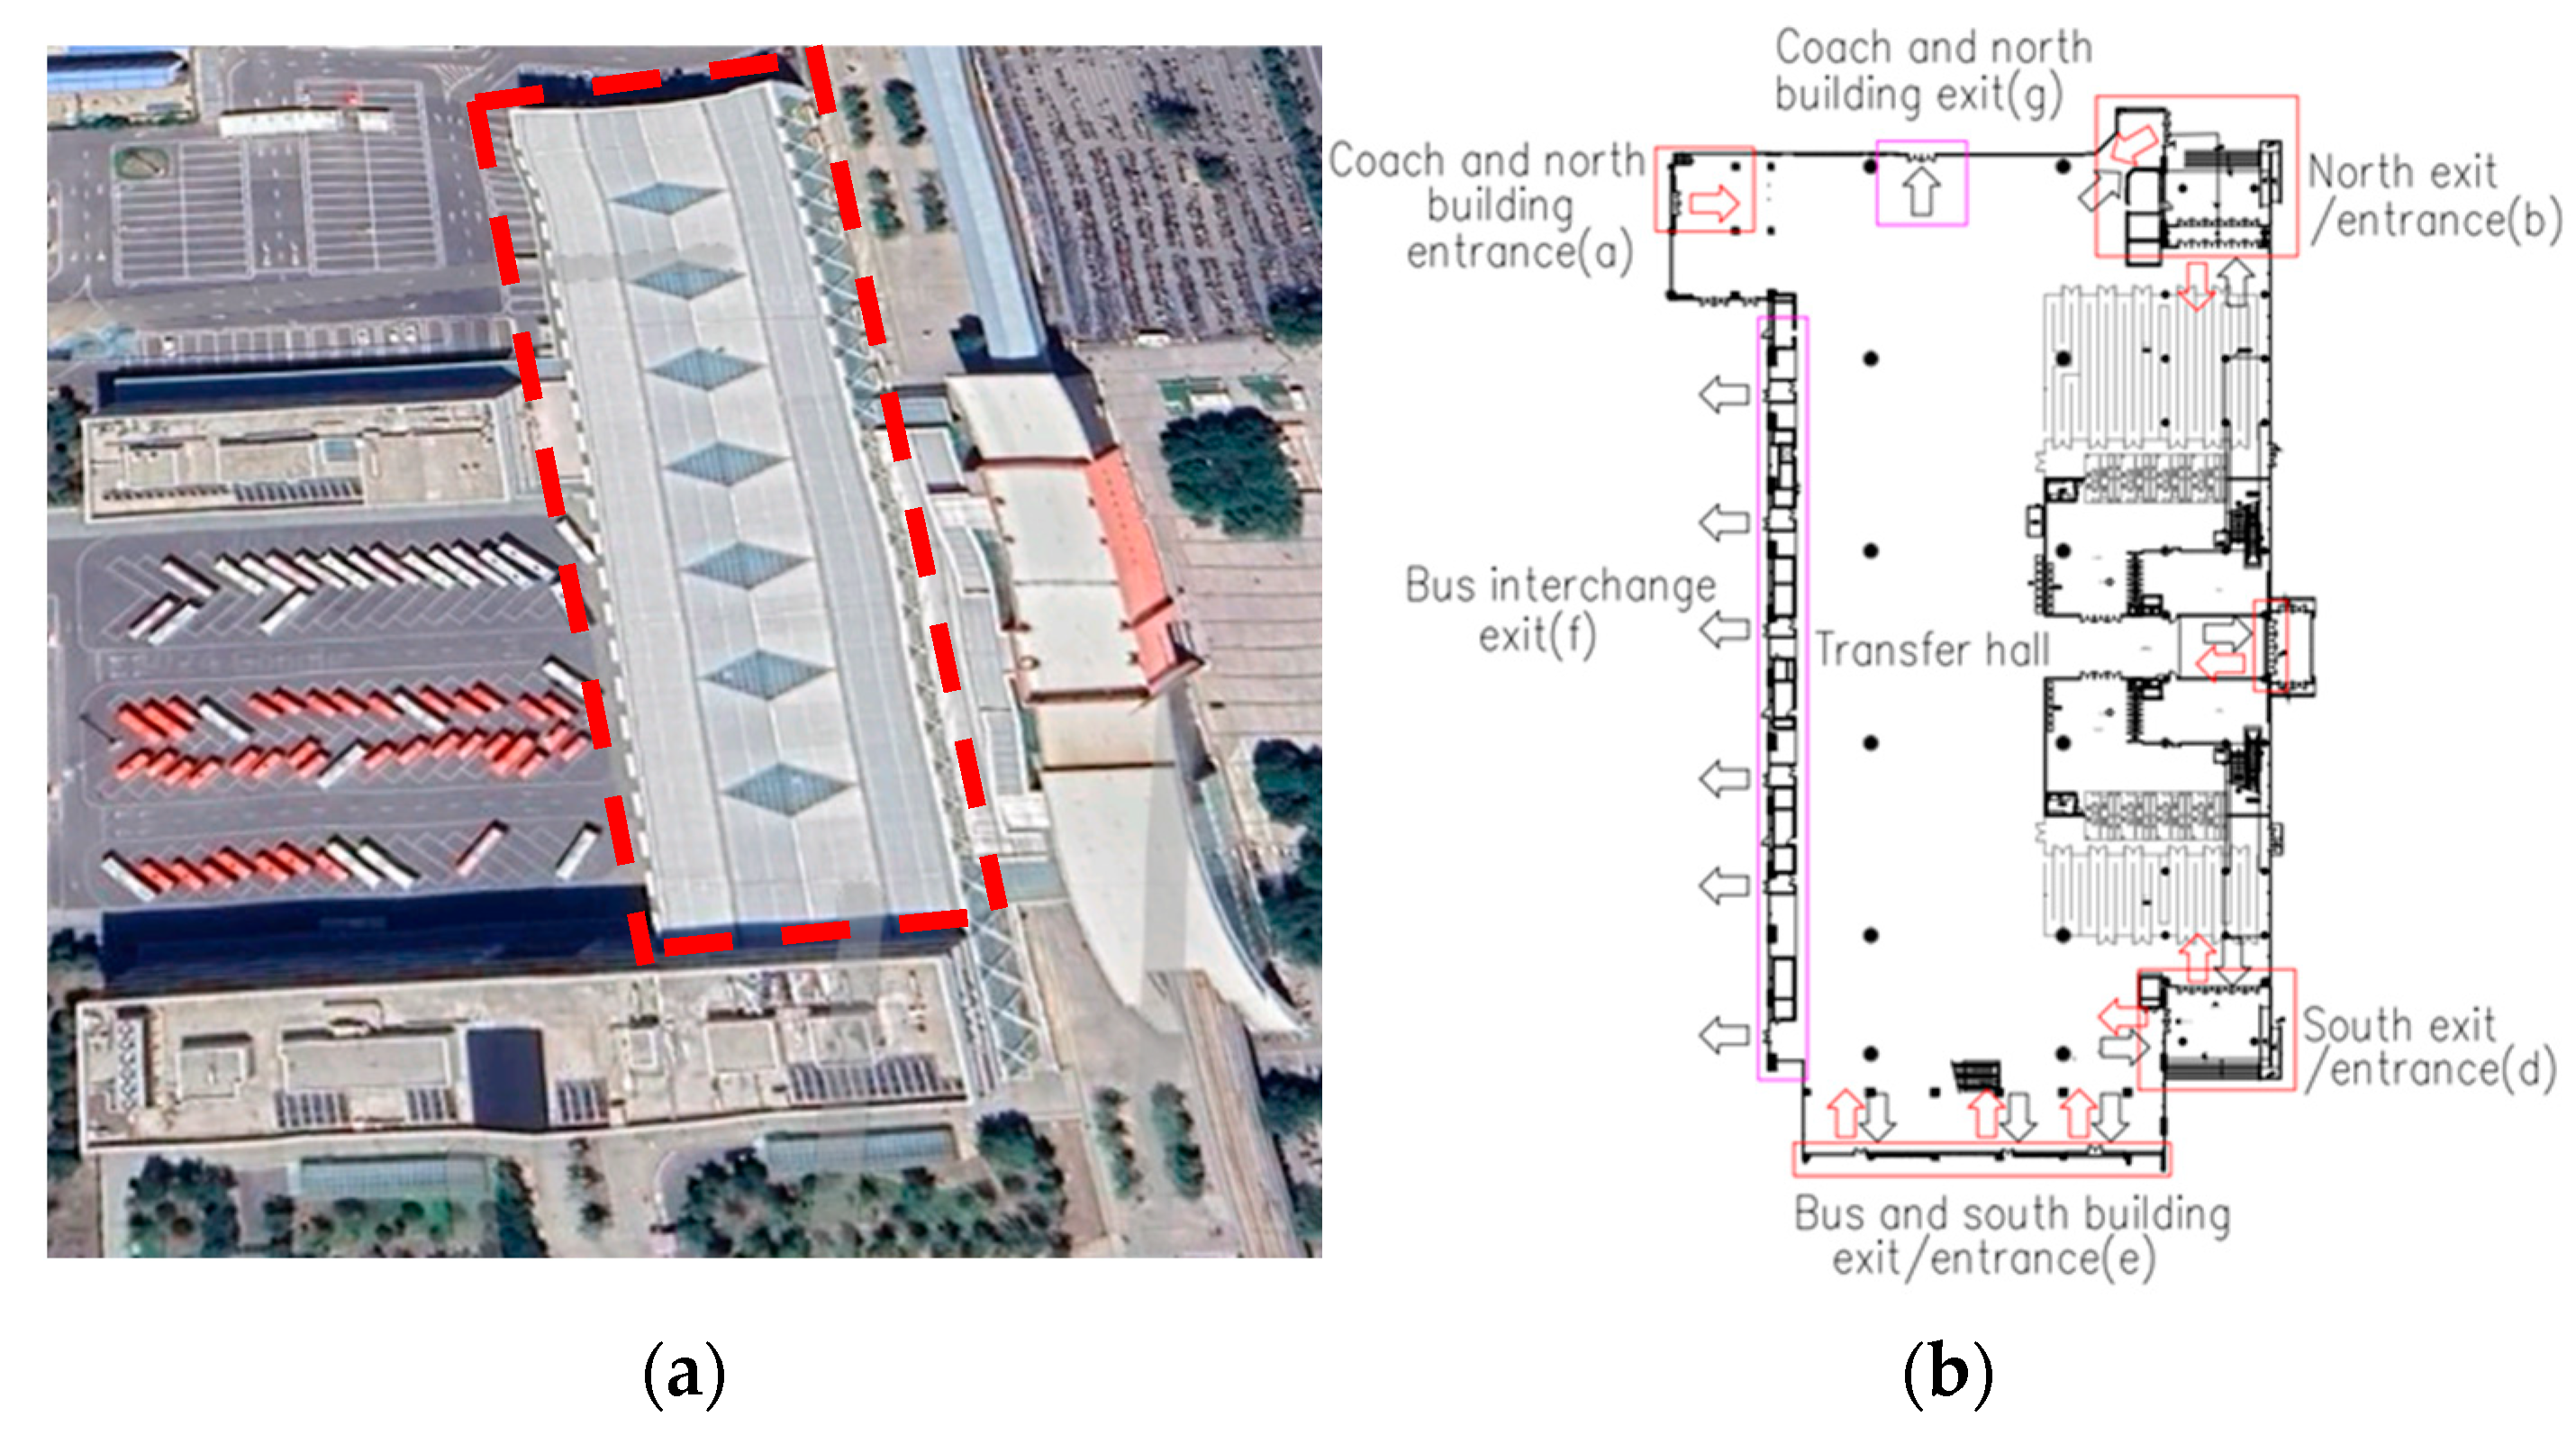
2.1. The Subway Transport Hub Case Study
2.2. Key Parameters Affecting Passenger Density
- (1)
- Surrounding land type: According to a previous study [39], passenger flows in transportation hubs are directly connected to the surrounding land type. Depending on the type of surrounding land, the passenger flow exhibits different time distribution characteristics, as follows:
- (a)
- Residential and office type: In this case, the transportation hub is mainly surrounded by residential districts and areas with houses and apartments, in addition to areas with office buildings and facilities. Under this condition, and following the characteristic of committing hours, the passenger flow in the corresponding transportation hub exhibits obvious morning and evening peaks.
- (b)
- Commercial and large hub types: In this case, the transportation hub is mainly surrounded by commercial buildings and facilities, airplanes, trains, and other rail transit systems. Due to the nature of these facilities and surrounding areas, there is no peak passenger flow on weekdays, and the transportation hub experiences a relatively consistent daily passenger flow distribution. On the other hand, passenger flow exhibits a significant peak on weekends or holidays compared with weekdays.
- (2)
- Dwell time: According to the study presented by Zhao et al. [5], dwell time is defined as the time that passengers will spend in a specific hall. Thus, it could be represented by a probability distribution due to the diversity of passengers’ preferences. It is noted here that the dwell time is influenced by the characteristics of different halls and areas, such as the floor areas and the service counters.
- (3)
- Population density: The population density refers to the number of people per unit area of the area or district surrounding the transportation hub or in a city. On this basis, it restricts the passenger flow of the transportation hub to a certain extent.
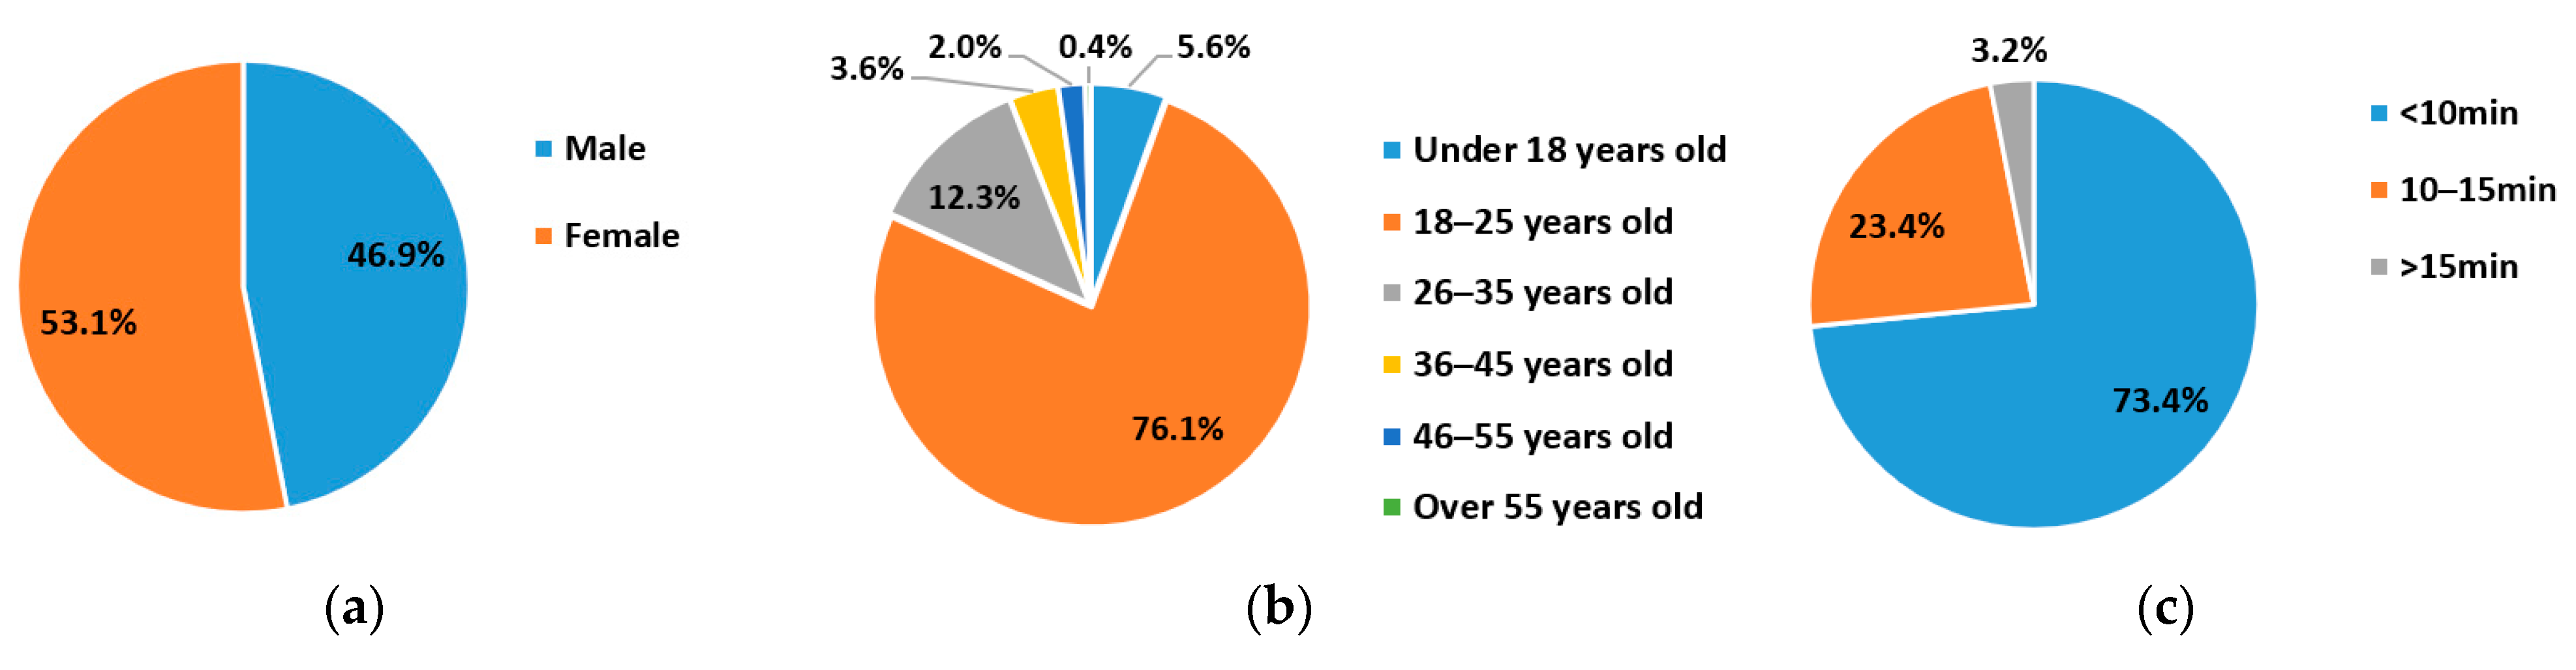
2.3. Questionnaire Survey
2.4. Field Measurement
2.5. Separation of Passengers Entering and Leaving
3. Results and Discussion
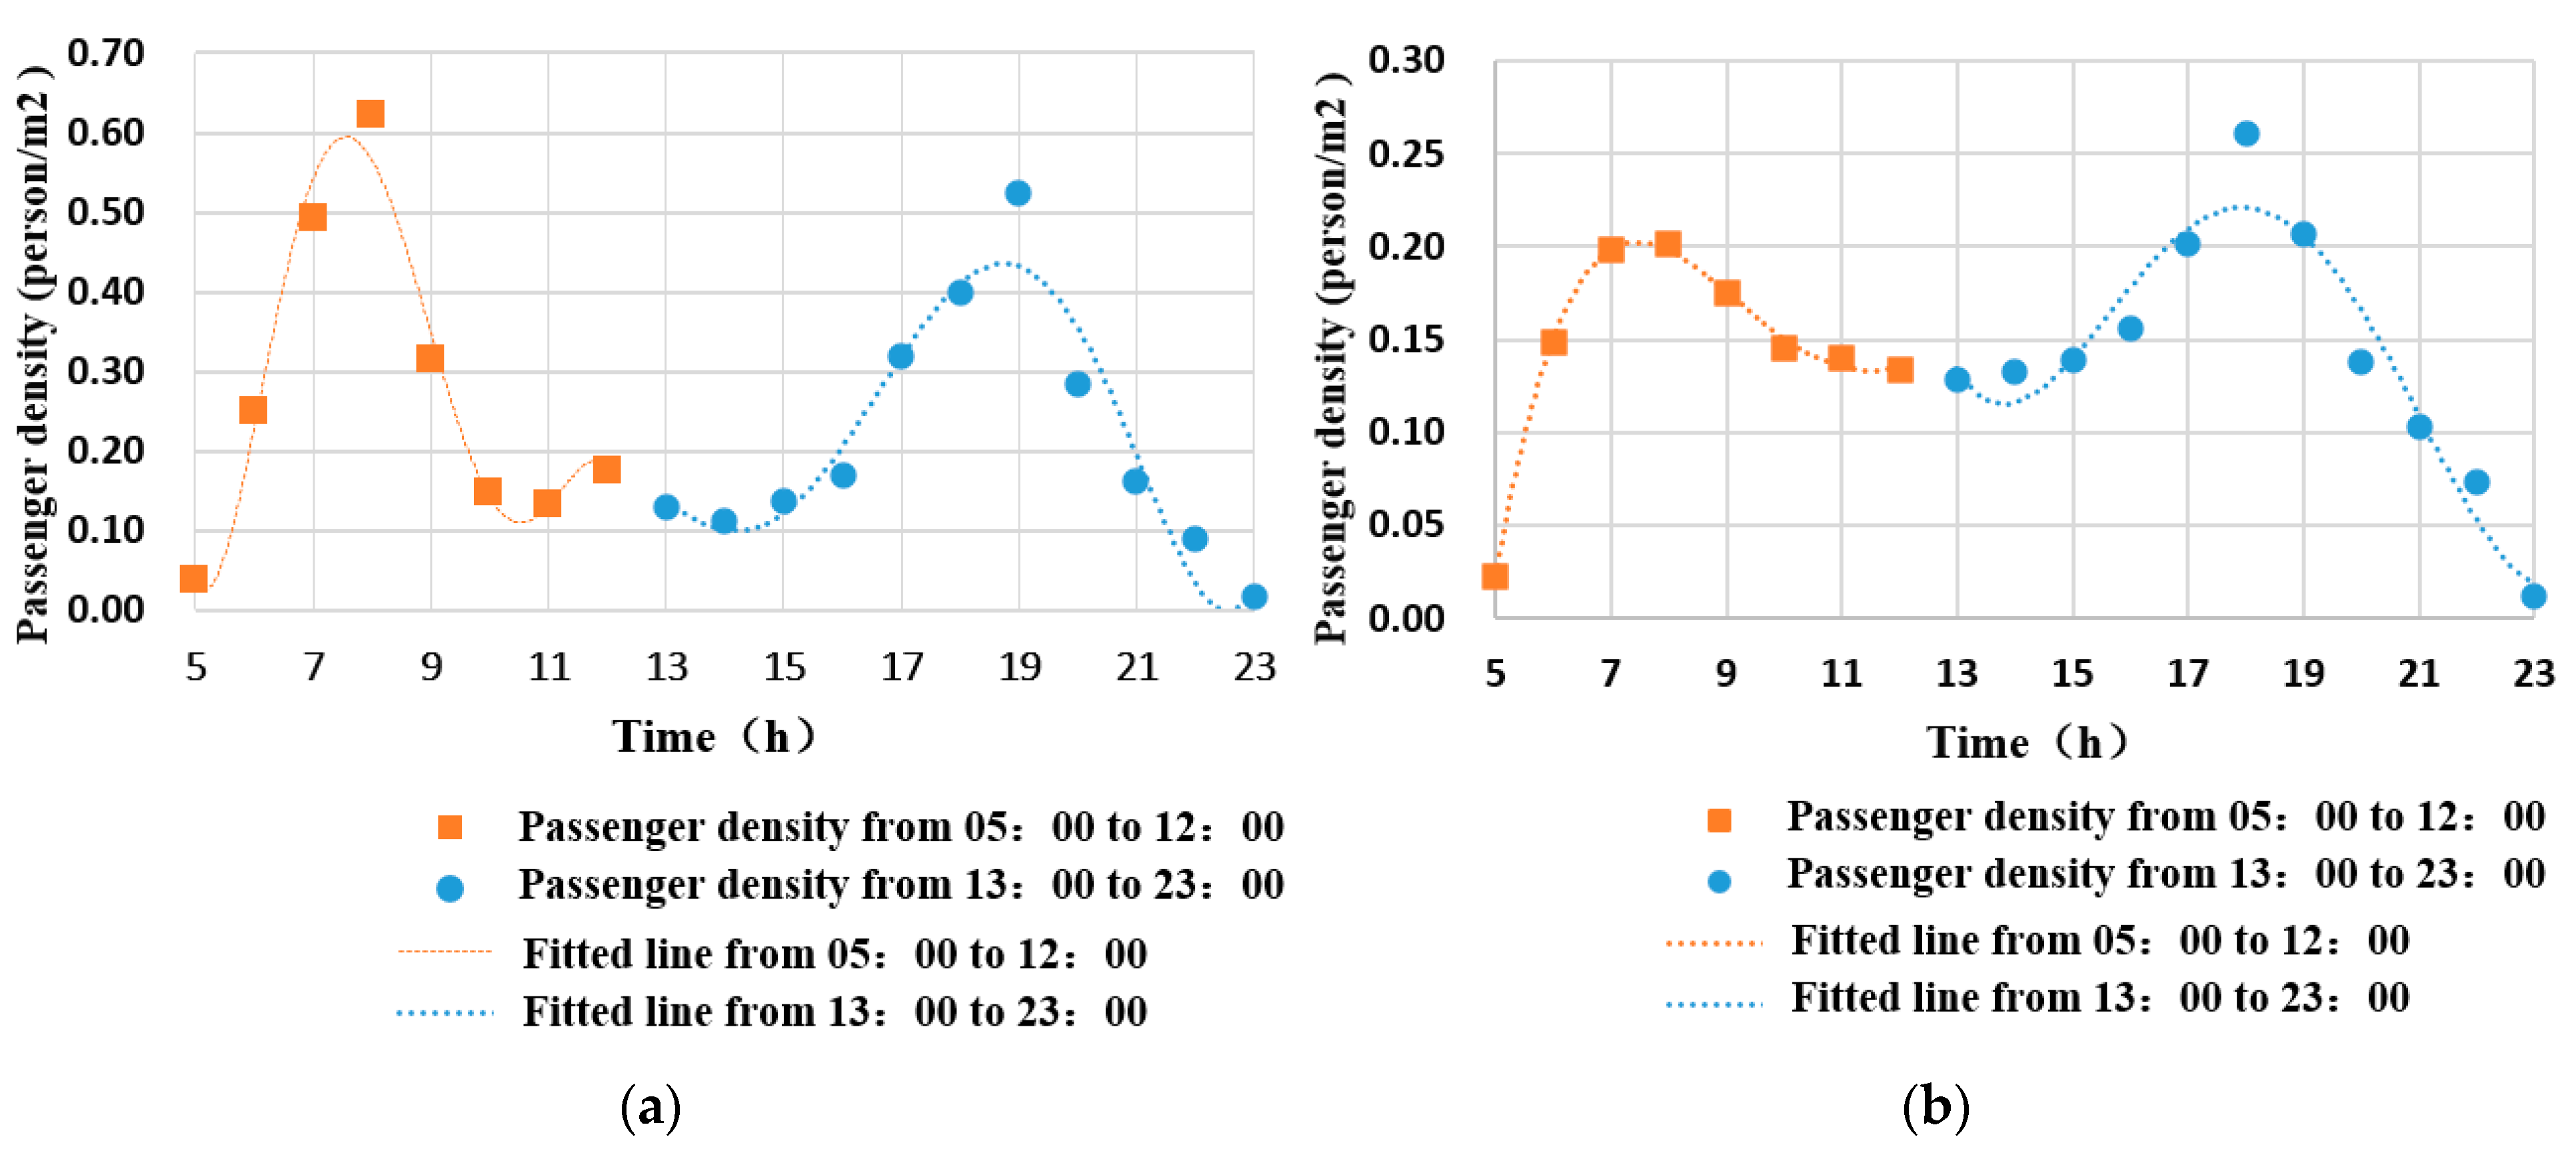
3.1. Dwell Time
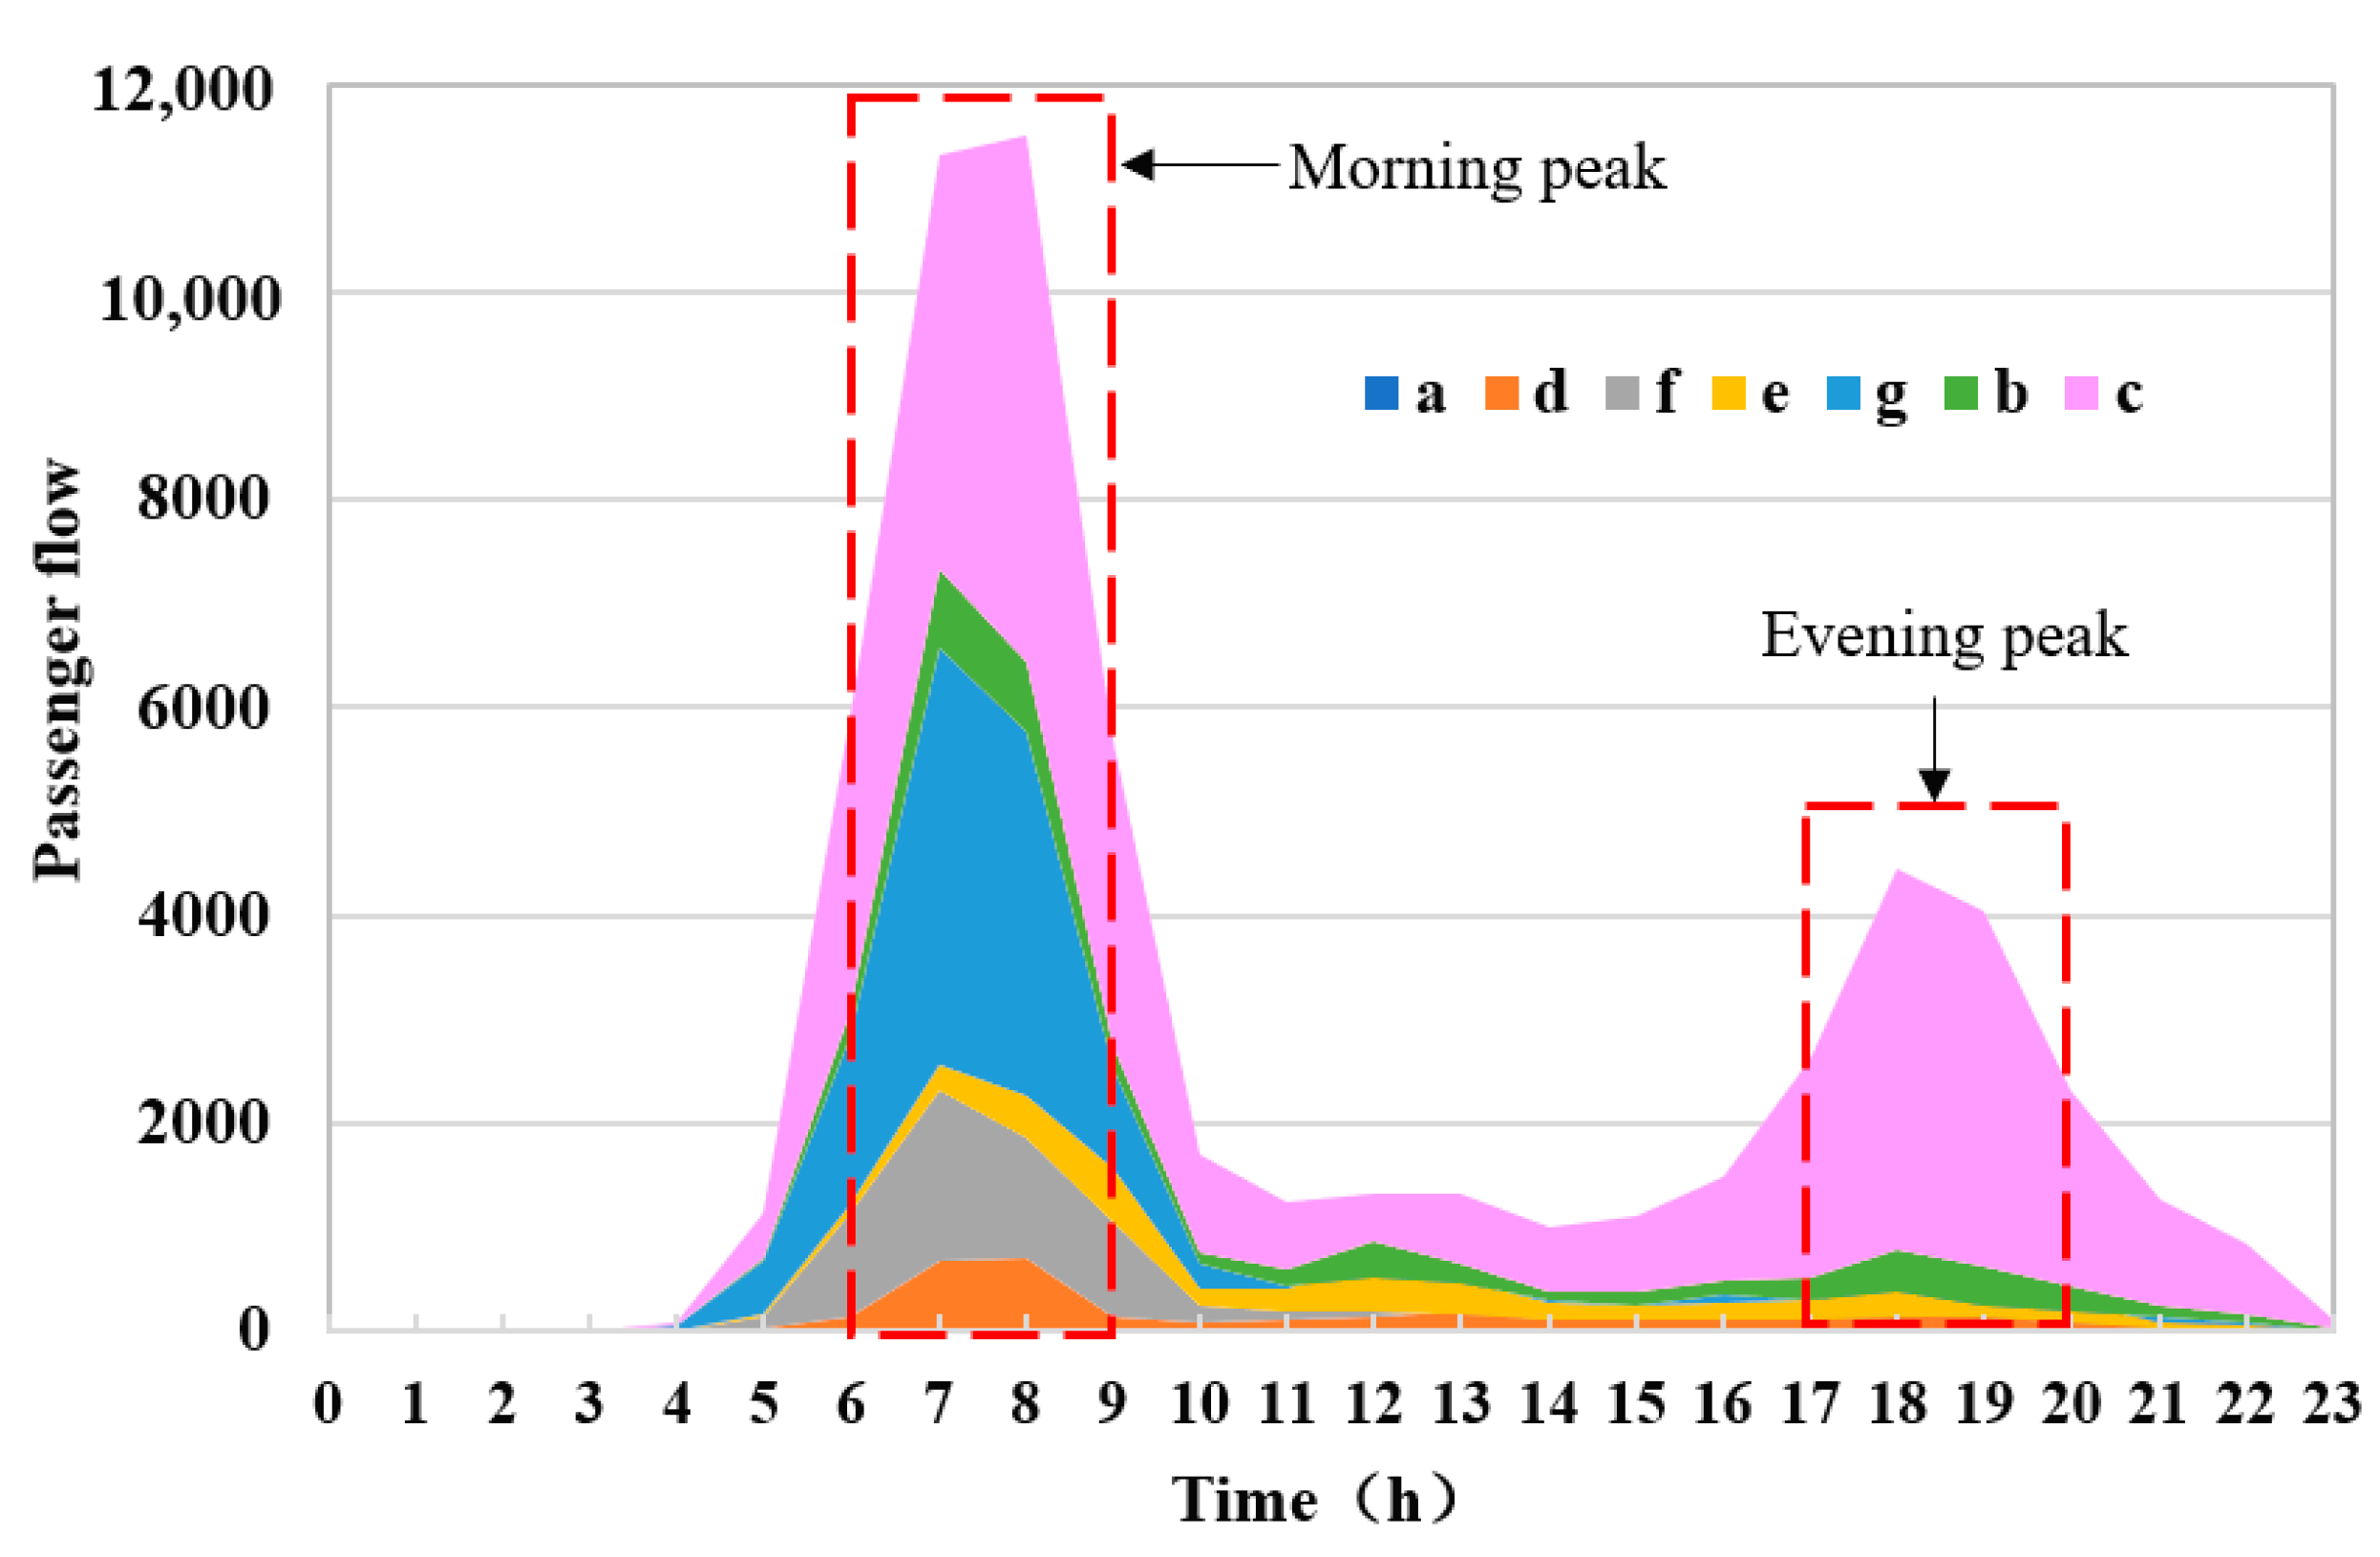
3.2. Passenger Flow
3.3. Entering and Leaving Passenger Flow
4. Prediction of Passenger Density
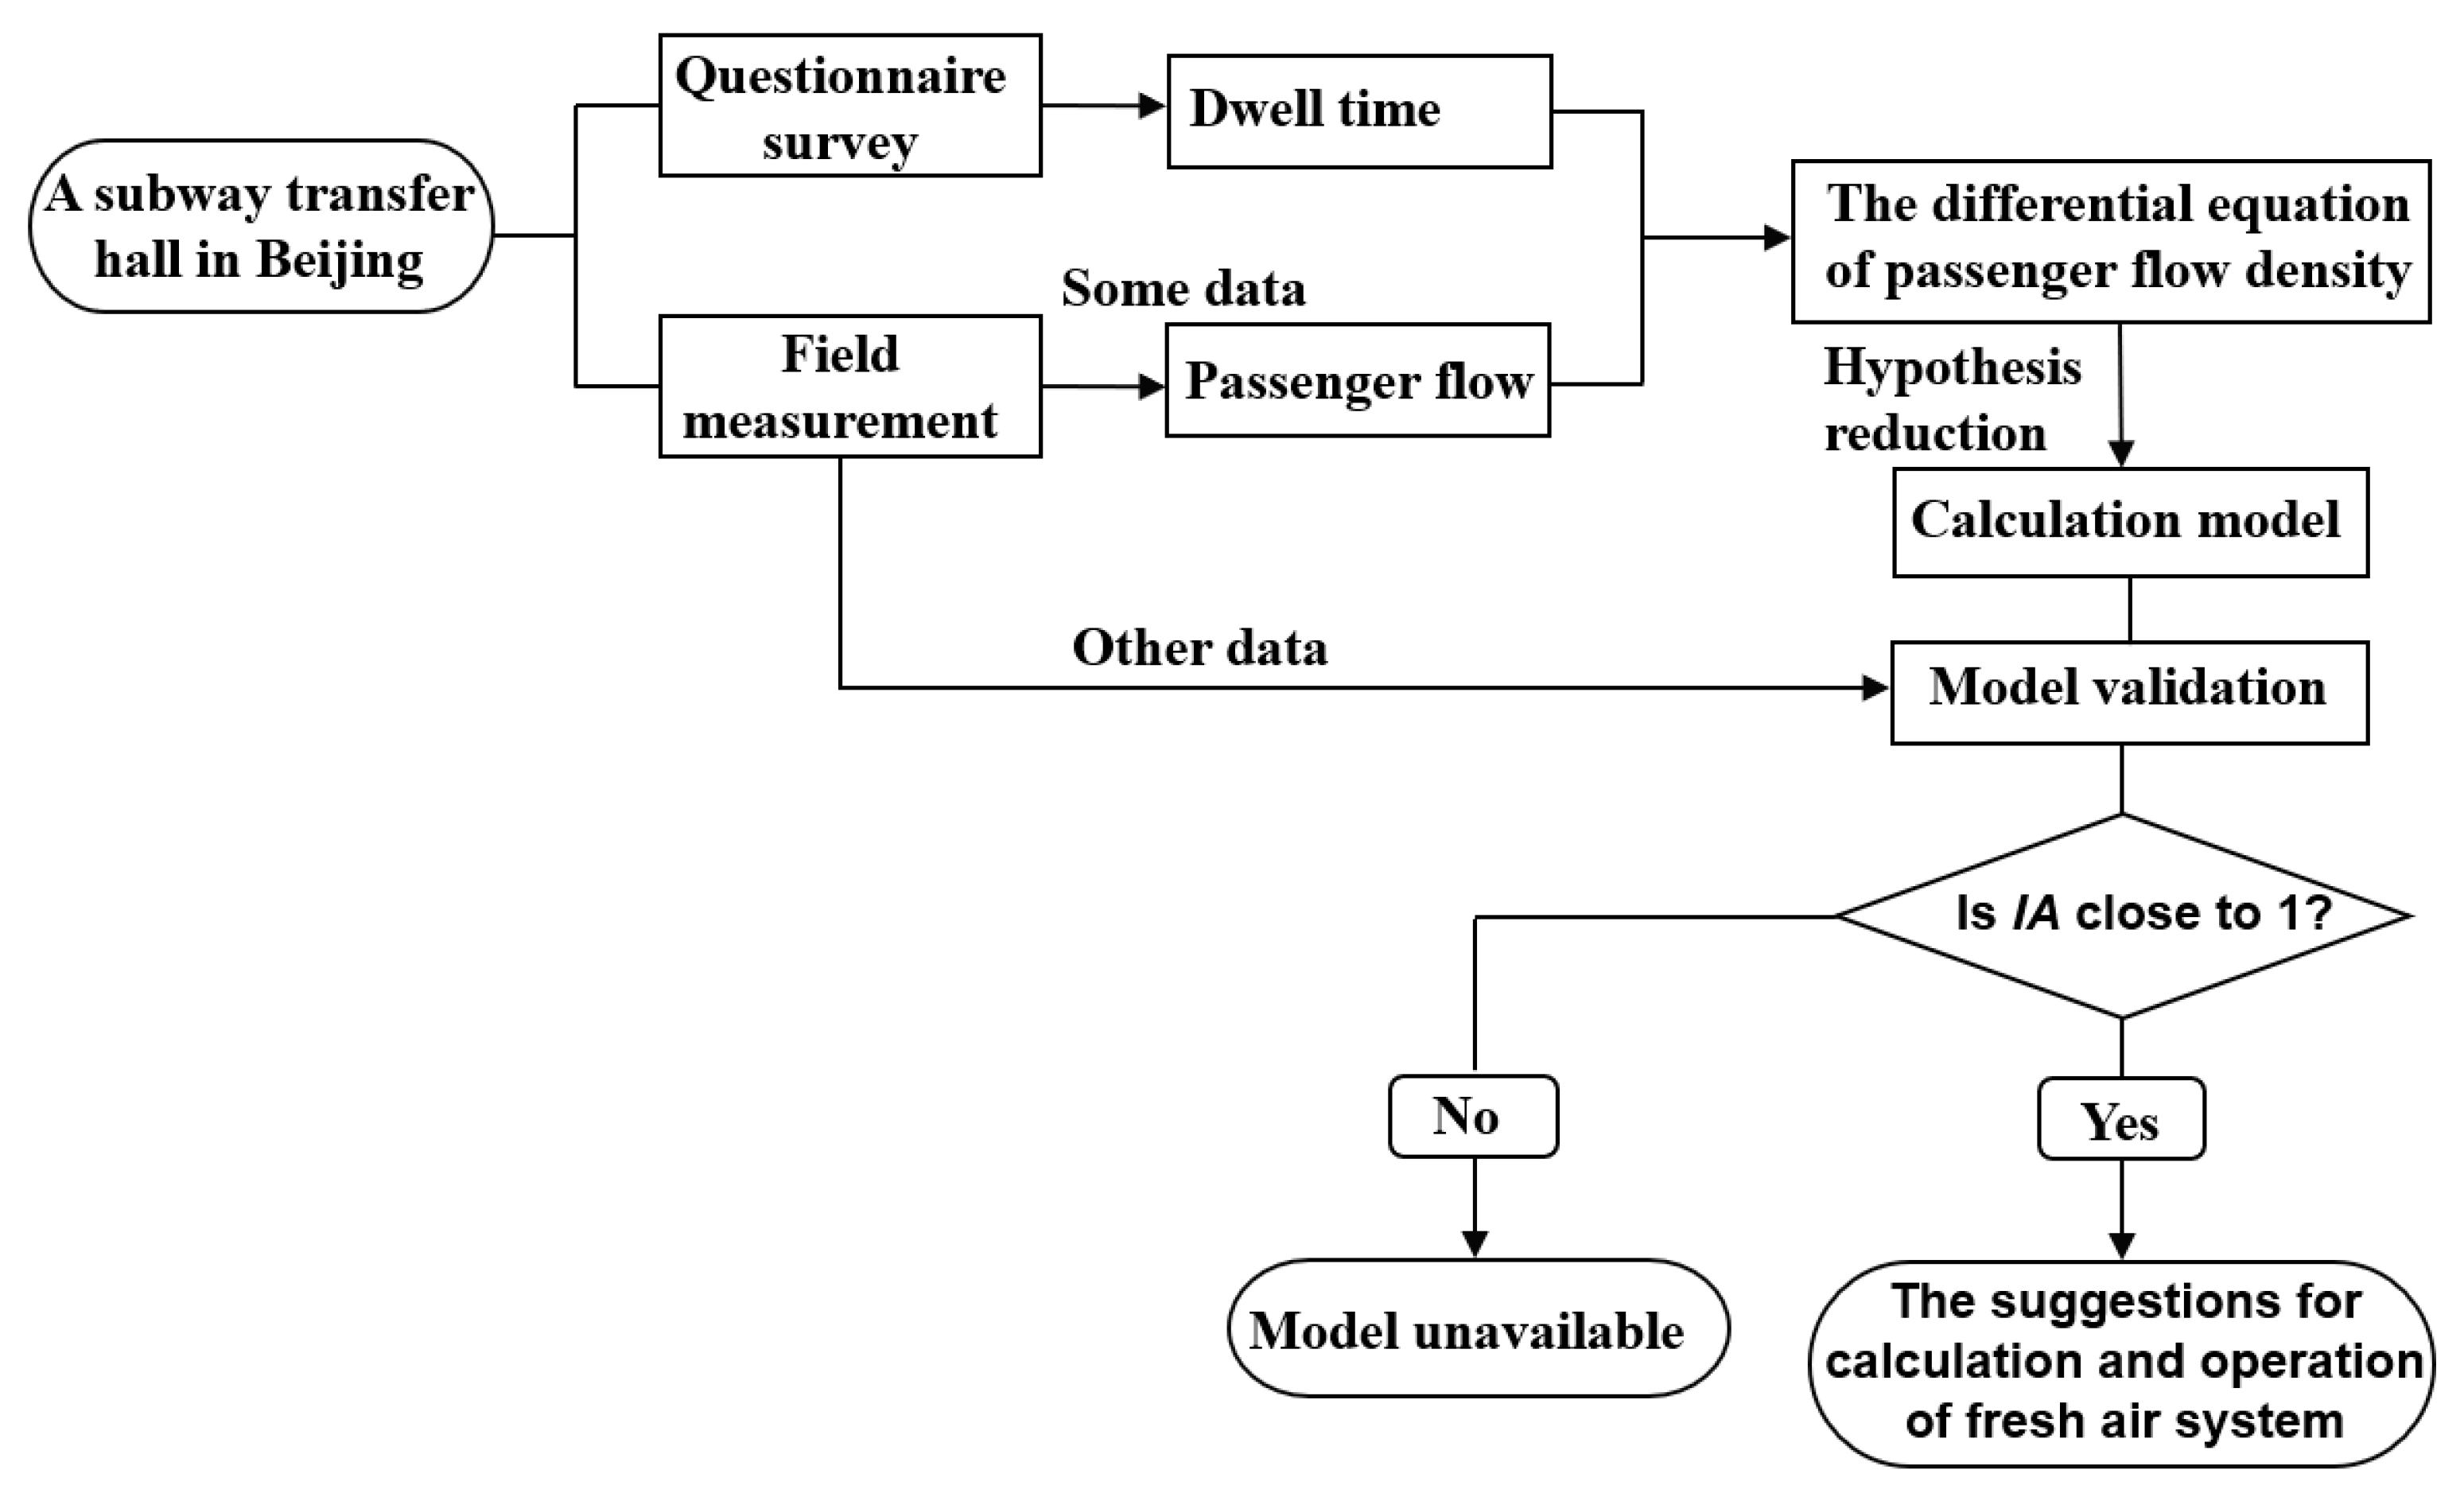
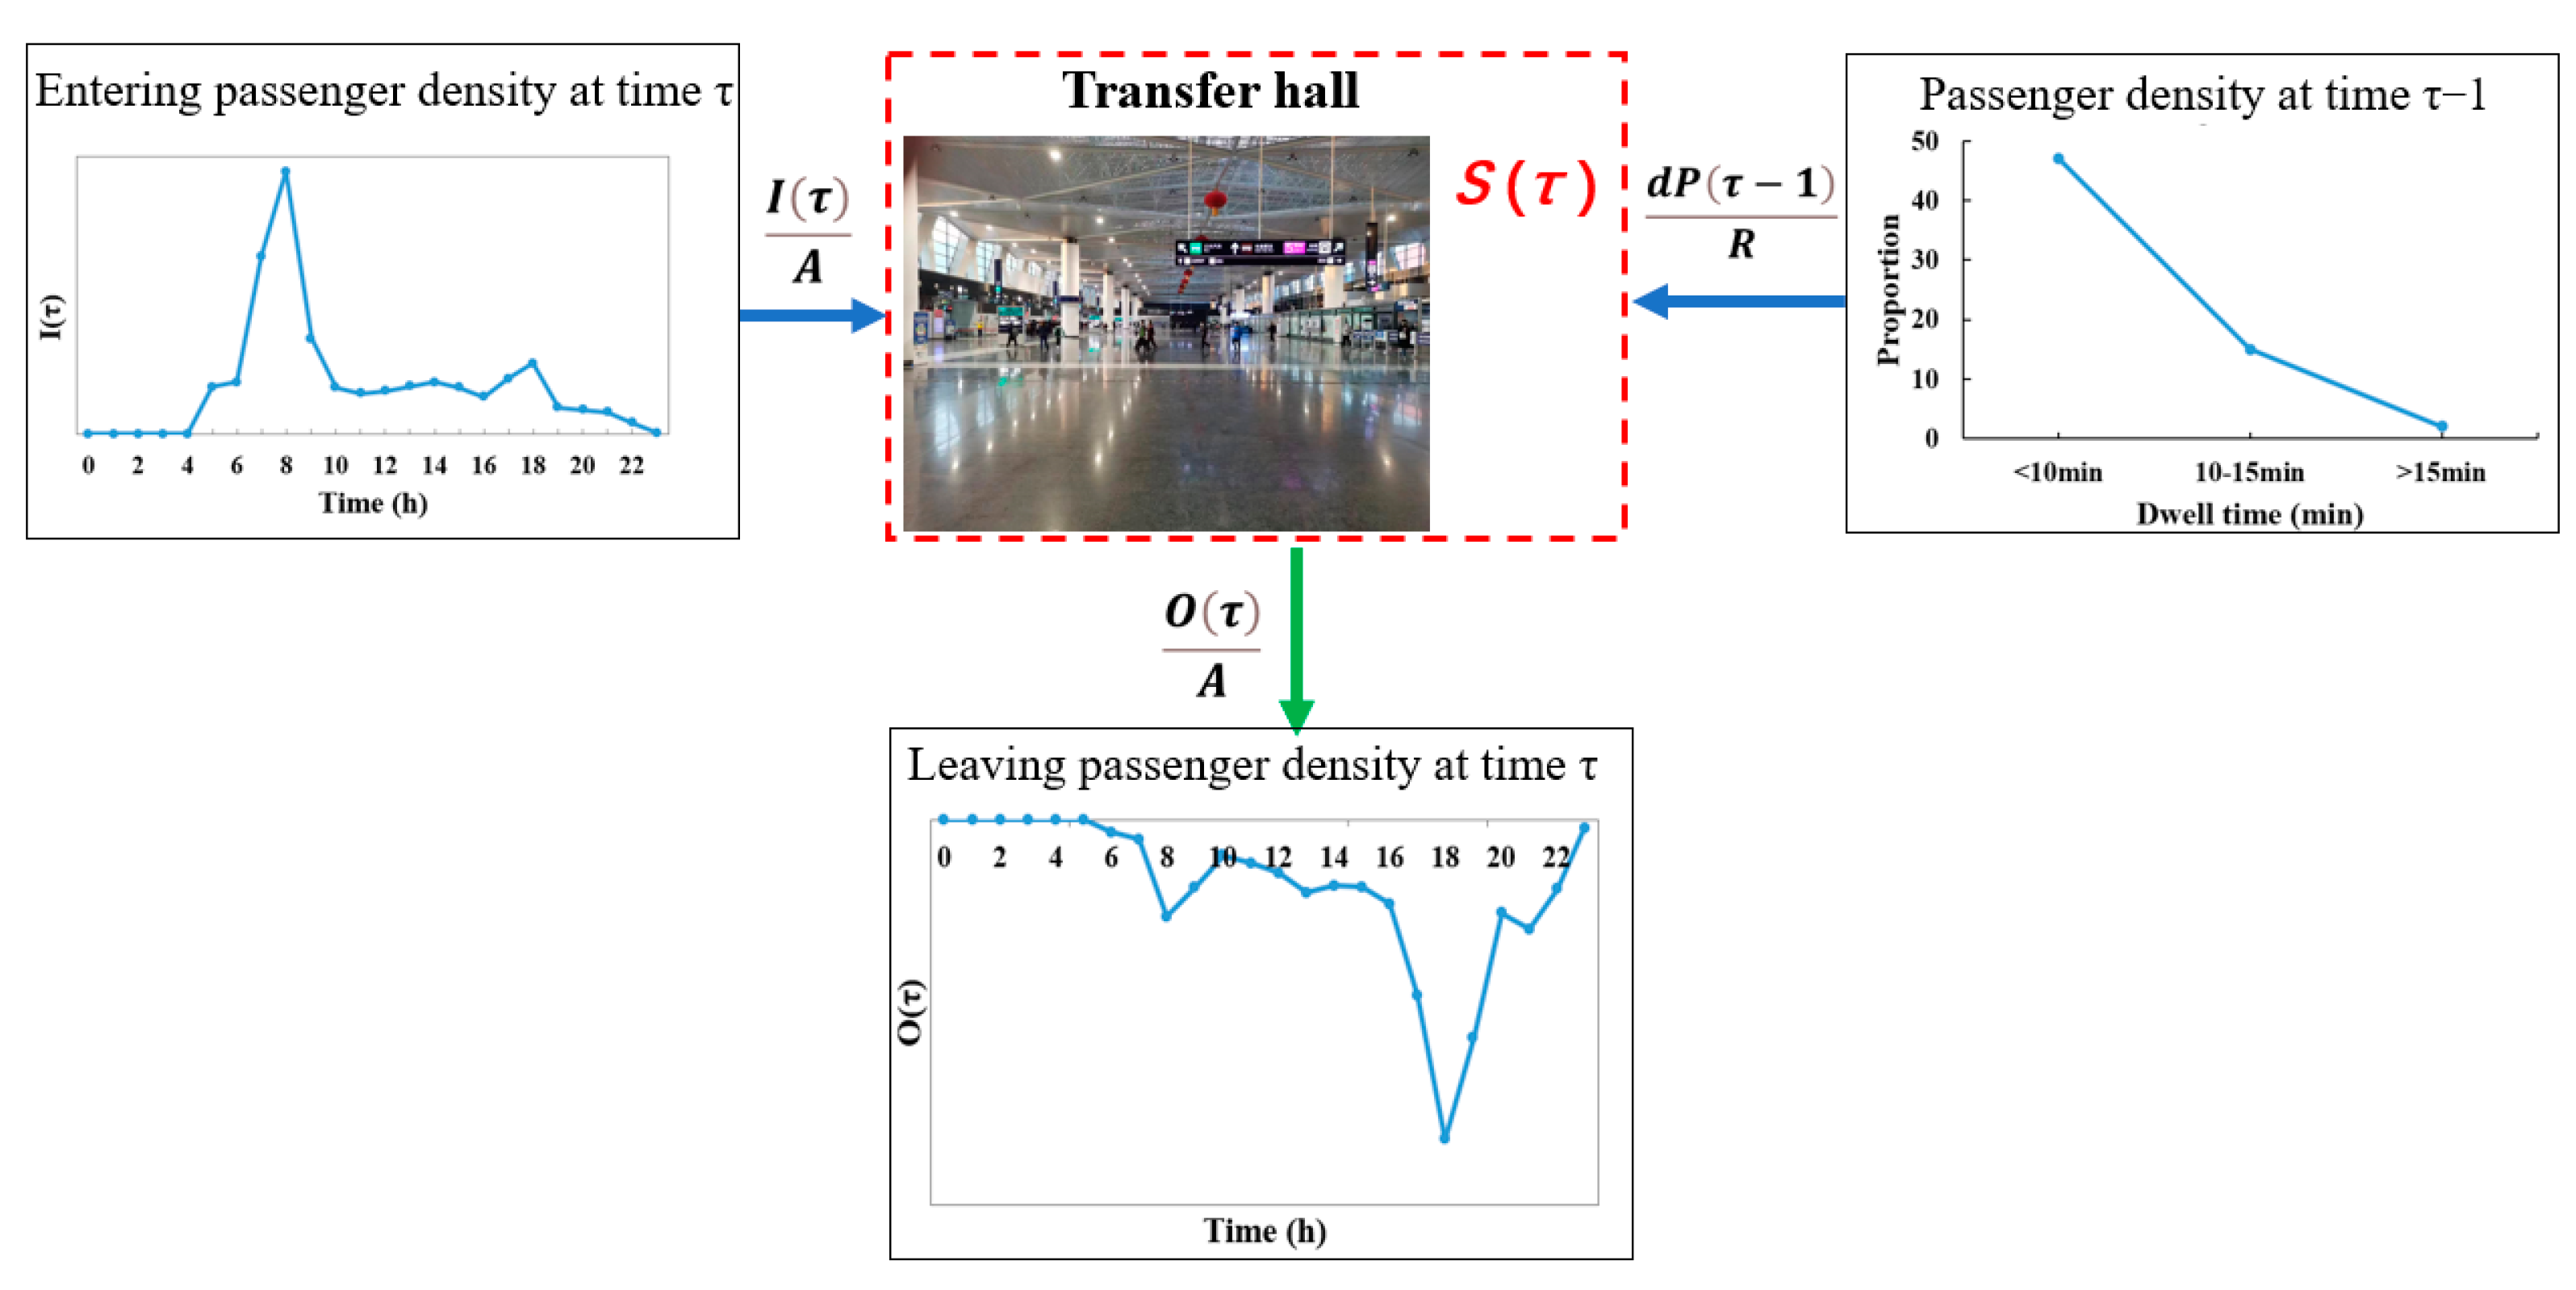
4.1. Prediction Model
- The passengers in the transfer hall are assumed to be evenly distributed, with a consistent passenger density. On this basis, the passenger density is only related to the time parameter and is not related to the spatial parameters , , and ;
- It is assumed that all passengers in the transfer hall have the same diffusion rate, meaning that the diffusion is uniform;
- The passenger dwelling time is assumed to be consistent, thus the weighted average of the dwelling time of the passenger can be taken as the average residence time according to the survey data reported in Figure 3.
4.2. Simplified Calculation Model
4.3. Calculation Results and Model Validation
5. Conclusions
- (1)
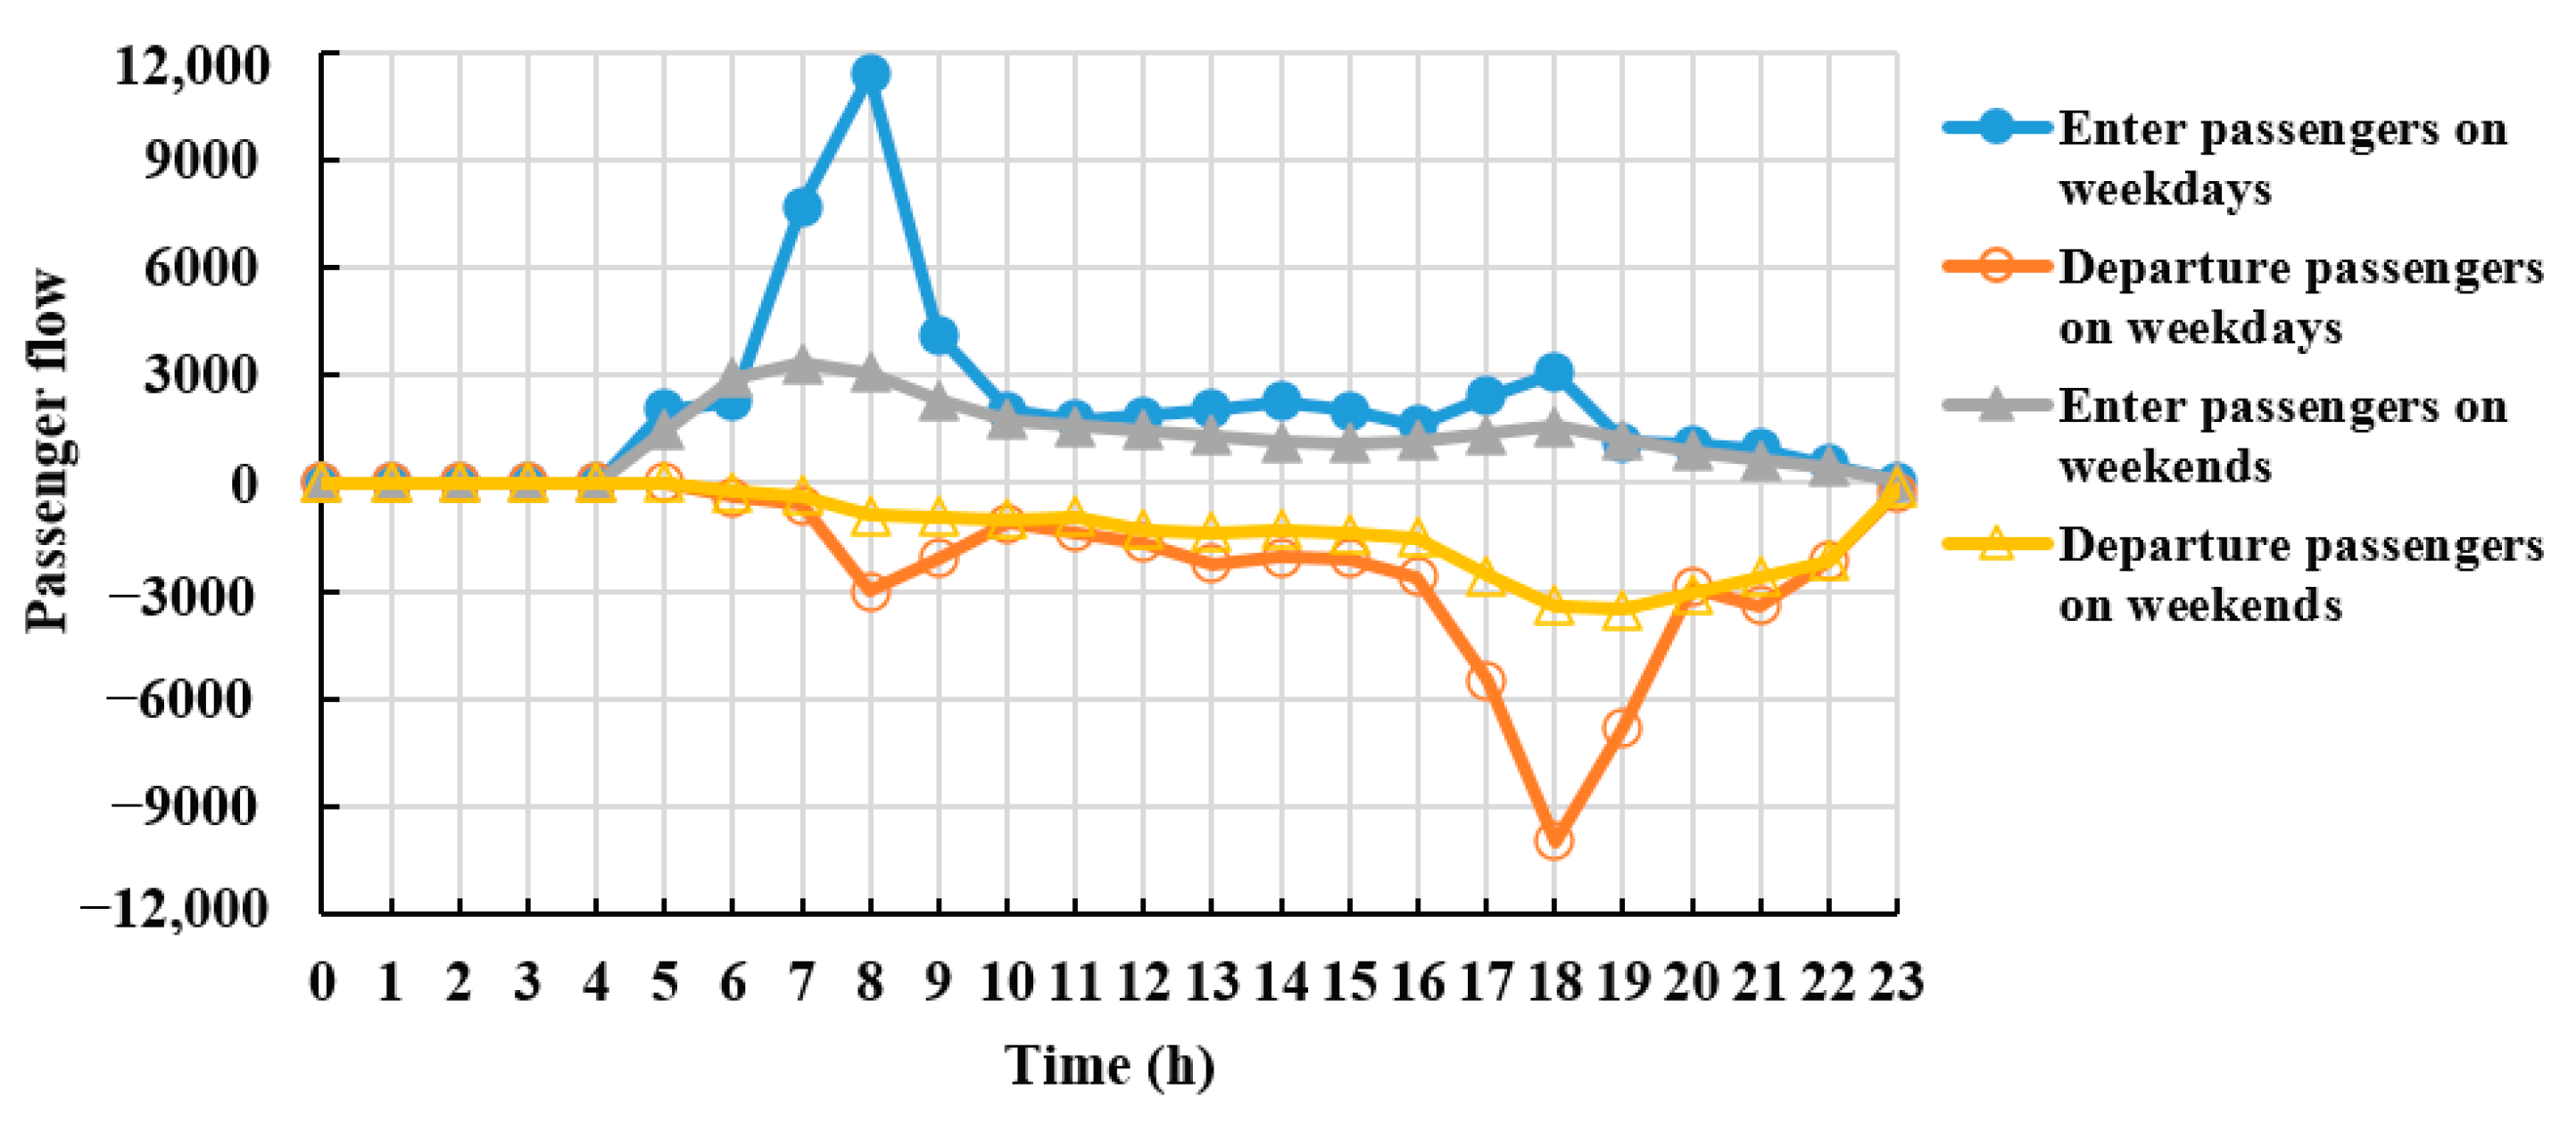
- The passenger flow is not affected by the outdoor weather conditions and seasonality but is closely related to the passengers’ working hours and the scale of population in the surrounding office and residential areas. Additionally, there is a major variation between the passenger flow pattern reported on weekdays and that reported on weekends. On weekdays, there is an obvious “tidal” pattern in the morning and evening periods. In this regard, the passenger traffic reaches a peak at 07:00, and the cumulative passenger flow by 08:00 has reached 54.30%. Another small peak is reported at 18:00. It is also shown that the flow of passengers on weekends is much smaller than that on weekdays, with an even change in the flow of passengers. The flow of passengers on full-day weekends is 57.2% of that on full-day weekdays.
- (2)
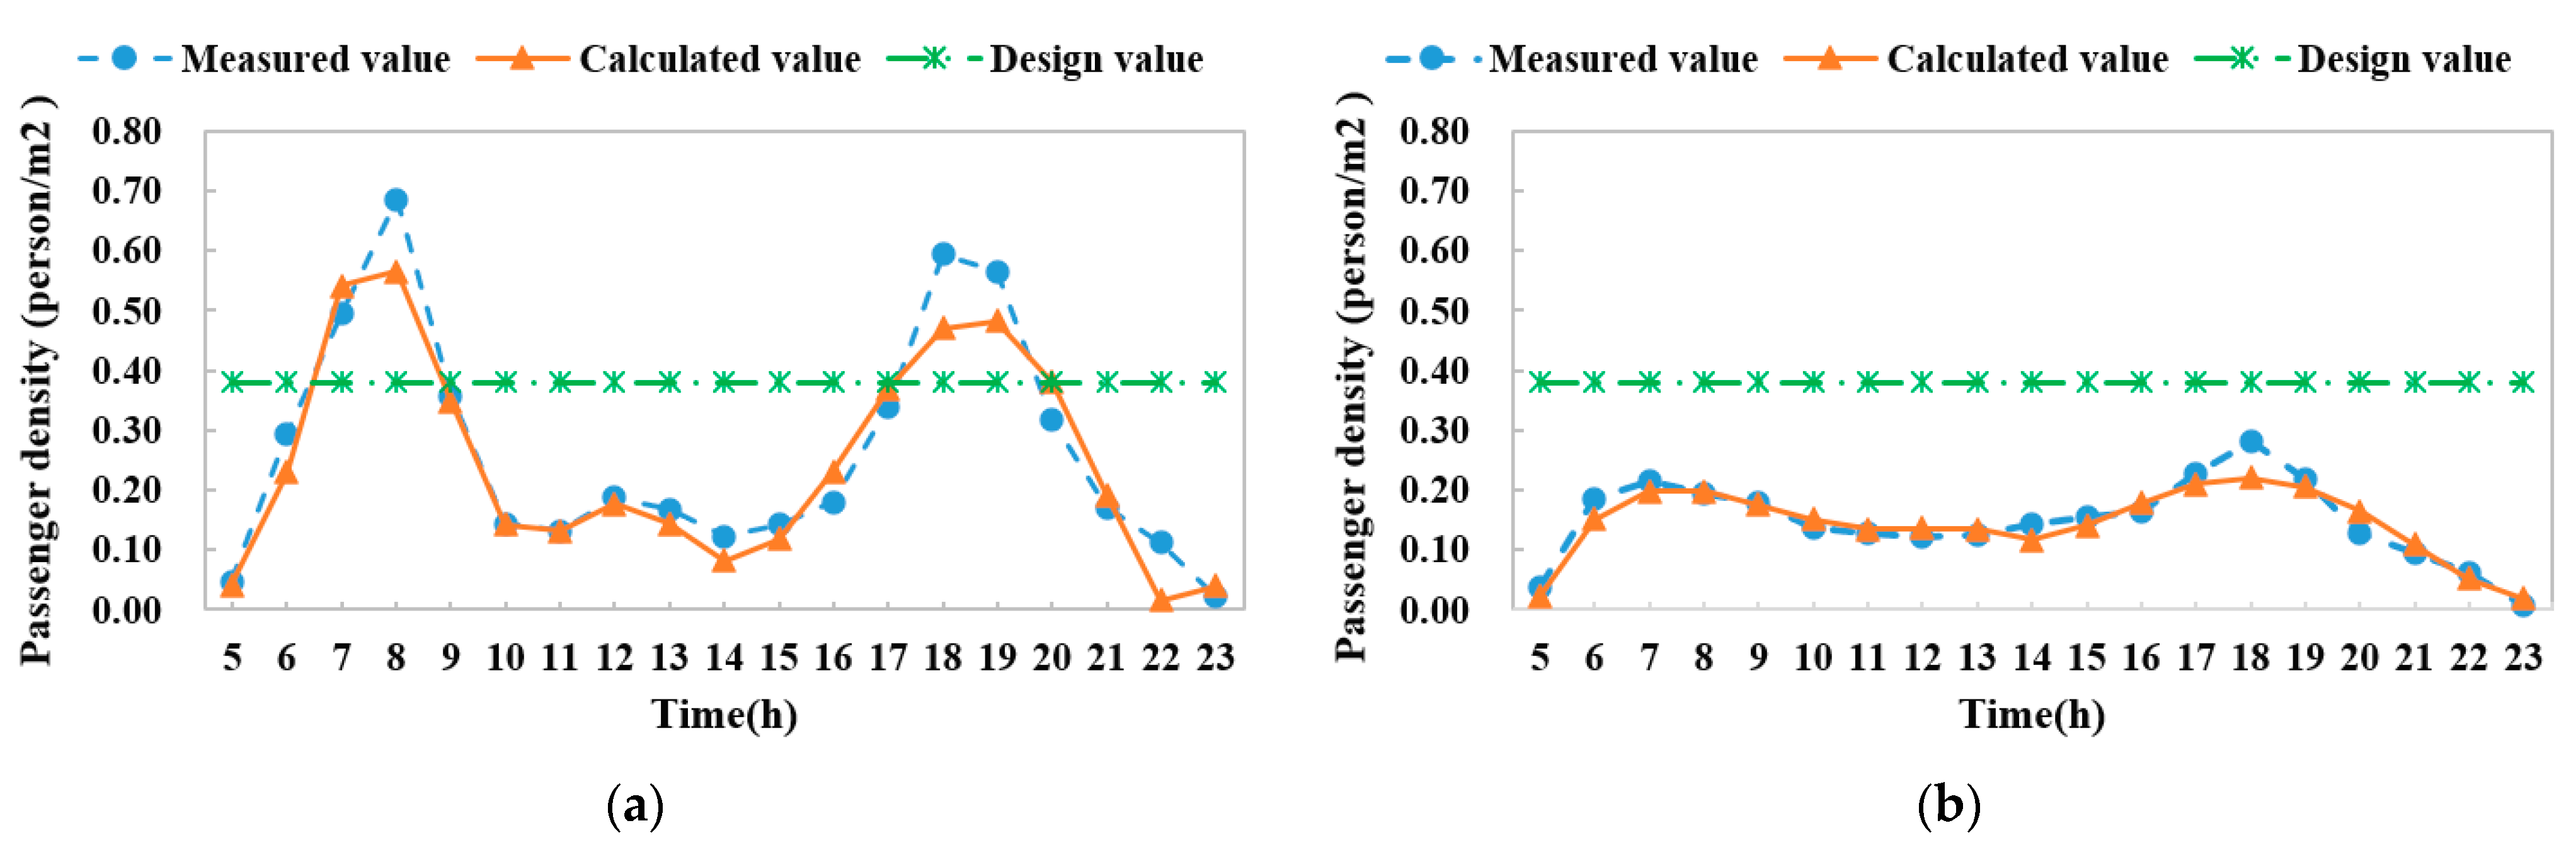
- Based on the characteristics of passenger flow and residence time in the transfer hall of the subway transportation hub, a passenger density prediction model was established. The model was validated using actual measurement data, reporting that the proposed calculation method has good precision in terms of capturing peak and average values.
- (3)
- The characteristics of passenger density have significant influence on the design and operation processes of fresh air systems. The passenger density at 07:00 and 08:00 during the morning peak, as well as at 18:00 and 19:00 during the evening peak on weekdays, exceeds the design capacity, leading to insufficient fresh air. However, for most other times on weekdays and all weekend hours, the passenger density is below the design value, which demonstrates a large potential for energy saving by adjusting the amount of mechanical outdoor air with the variation of actual occupancy rates.
Author Contributions
Funding
Data Availability Statement
Conflicts of Interest
Abbreviations
| A | Area of the transfer hall (m2) |
| D | Diffusion rate of personnel |
| Ii | Number of people entering the transfer hall per hour (person/h) |
| I | Number of people entering the transfer hall per second (person/s) |
| Oi | Number of people leaving the transfer hall per hour (person/h) |
| O | Number of people leaving the transfer hall per second (person/s) |
| P | Passenger density (person/m2) |
| Average residence time of passengers in the transfer hall (s) | |
| S | Change of the passenger density in the transfer hall per unit time (person/m2·s) |
| x, y, z | Spatial coordinates |
| τ | Time |
References
- Pan, S.; Liu, Y.; Xie, L.; Wang, X.; Yuan, Y.; Jia, X. A thermal comfort field study on subway passengers during air-conditioning season in Beijing. Sustain. Cities Soc. 2020, 61, 102218. [Google Scholar] [CrossRef]
- Ortega Alba, S.; Manana, M. Energy research in airports: A review. Energies 2016, 9, 349. [Google Scholar] [CrossRef]
- Liu, X.; Li, L.; Liu, X.; Zhang, T.; Rong, X.; Yang, L.; Xiong, D. Field investigation on characteristics of passenger flow in a Chinese hub airport terminal. Build. Environ. 2018, 133, 51–61. [Google Scholar] [CrossRef]
- Balaras, C.; Dascalaki, E.; Gaglia, A.; Droutsa, K. Energy conservation potential, HVAC installations and operational issues in Hellenic airports. J. Energy Build. 2003, 35, 1105–1120. [Google Scholar] [CrossRef]
- Zhao, H. A Field Study on Energy Consumption and Indoor Environment Quality of Terminals in China. Master’s Thesis, Tsinghua University, Beijing, China, 2015. [Google Scholar]
- Chen, S.; Yang, W.; Yoshino, H.; Levine, M.D.; Newhouse, K.; Hinge, A. Definition of occupant behavior in residential buildings and its application to behavior analysis in case studies. J. Energy Build. 2015, 104, 1–13. [Google Scholar] [CrossRef]
- Hong, T.; Yan, D.; D’Oca, S.; Chen, C.-F. Ten questions concerning occupant behavior in buildings: The big picture. Build. Environ. 2017, 114, 518–530. [Google Scholar] [CrossRef]
- Jani, D.B. Review on performance analysis of desiccant-assisted hybrid cooling systems. Glob. J. Energy Technol. Res. Updates 2022, 9, 60–70. [Google Scholar] [CrossRef]
- Wu, L.H. A study on practical analysis of bus passenger flow survey data: Urban. Public Transp. 2009, 6, 14–15. [Google Scholar]
- Denman, S.; Fookes, C.; Ryan, D.; Sridharan, S. Large scale monitoring of crowds and building utilization: A new database and distributed approach. In Proceedings of the IEEE International Conference on Advanced Video and Signal Based Surveillance, Karlsruhe, Germany, 25–28 August 2015; pp. 1–6. [Google Scholar]
- Zou, J.; Zhao, Q.; Yang, W.; Wang, F. Occupancy detection in the office by analyzing surveillance videos and its application to building energy conservation. J. Energy Build. 2017, 152, 385–398. [Google Scholar] [CrossRef]
- Carvalho, J.; Marques, M.; Costeira, J.P. Understanding people flow in transportation hubs. J. IEEE Trans. Intell. Transp. Syst. 2017, 19, 3282–3291. [Google Scholar] [CrossRef]
- Zhou, M.; Ge, S.; Liu, J.; Dong, H.; Wang, F. Field observation and analysis of waiting passengers at subway platform—A case study of Beijing subway stations. Phys. A Stat. Mech. Its Appl. 2020, 556, 124779. [Google Scholar] [CrossRef]
- Jiang, C.; Masood, M.K.; Soh, Y.C.; Li, H. Indoor occupancy estimation from carbon dioxide concentration. J. Energy Build. 2016, 131, 132–141. [Google Scholar] [CrossRef]
- Pedersen, T.H.; Nielsen, K.U.; Petersen, S. Method for room occupancy detection based on trajectory of indoor climate sensor data. Build. Environ. 2017, 115, 147–156. [Google Scholar] [CrossRef]
- Depatla, S.; Muralidharan, A.; Mostofi, Y. Occupancy estimation using only WiFi power measurements. J. IEEE J. Sel. Areas Commun. 2015, 33, 1381–1393. [Google Scholar] [CrossRef]
- Nikoue, H.; Marzuoli, A.; Clarke, J.P.; Feron, E.; Peters, J. Passenger flow predictions at sydney international airport: A data-driven queuing approach. arXiv 2015, arXiv:1508.04839. [Google Scholar]
- Wang, F.J.; Kang, Y.; Shen, G.Y. Implementation and application of data analysis of human flow density in smart terminal building. Electron. Technol. Softw. Eng. 2022, 14, 179–182. [Google Scholar]
- Huang, W.; Lin, Y.; Lin, B.; Zhao, L. Modeling and predicting the occupancy in a China hub airport terminal using Wi-Fi data. J. Energy Build. 2019, 203, 109439. [Google Scholar] [CrossRef]
- Xu, T.; Yang, M.; Wu, J.X.; Lei, X.; Wu, Y.T. Passenger Flow Prediction of Urban Public Transport Hubs Based on a Deep Learning Approach: A Case Study in Changzhou. In Proceedings of the 18th COTA International Conference of Transportation Professionals, Beijing, China, 5–8 July 2018; pp. 755–765. [Google Scholar]
- Wu, Z.Y. Analysis and prediction of passenger flow data of Shanghai Hongqiao hub based on ARIMA model. Traffic Transp. 2022, 35, 315–320. [Google Scholar]
- Cheng, C.; Du, Y.C.; Liu, X. Passenger flow prediction model for transportation hubs considering holiday effects. Transp. Syst. Eng. Inf. 2015, 15, 202–207, 215. [Google Scholar]
- Ge, L.; Wang, W.; Deng, W.; Shan, X.F. Research on practical methods for predicting passenger flow in urban public transportation hubs. Highw. Traffic Sci. Technol. 2005, 110–113, 117. [Google Scholar]
- Liu, J.; Heng, Y.M.; Zhao, F.; Gao, X.J.; Wang, P. A combined prediction model for short-term passenger flow in urban transportation hubs. Transp. Inf. Saf. 2014, 32, 41–44, 49. [Google Scholar]
- Wu, M. Research on urban rail traffic passenger flow prediction based on Markov chain. J. Chengdu Inst. Technol. 2023, 26, 62–65. [Google Scholar]
- Liu, J.; Heng, Y.M.; Liu, L.L.; Guan, P. Study on the passenger flow pattern of Dongzhimen traffic hub. J. Road Traffic Saf. 2014, 14, 16–20. [Google Scholar]
- Zhong, G.; Wan, X.; Zhang, J.; Yin, T.; Ran, B. Characterizing Passenger Flow for a Transportation Hub Based on Mobile Phone Data. IEEE Trans. Intell. Transp. Syst. 2017, 18, 1507–1518. [Google Scholar] [CrossRef]
- Xu, X.; Zhang, K.; Mi, Z.; Wang, X. Short-term passenger flow prediction during station closures in subway systems. Expert Syst. Appl. 2024, 236, 121362. [Google Scholar] [CrossRef]
- Gu, X.; Xie, J.; Huang, C.; Ma, K.; Liu, J. Prediction of the spatiotemporal passenger distribution of a large airport terminal and its impact on energy simulation. Sustain. Cities Soc. 2022, 78, 103619. [Google Scholar] [CrossRef]
- Wang, W.; Chen, J.Y.; Lu, Y.; Wei, H.-H. Energy conservation through flexible HVAC management in large spaces: An IPS-based demand-driven control (IDC) system. Autom. Construct. 2017, 83, 91–107. [Google Scholar] [CrossRef]
- Zhou, P.; Huang, G.S.; Li, Z.W. Demand-based temperature control of large-scale rooms aided by wireless sensor network: Energy saving potential analysis. Energy Build. 2014, 68, 532–540. [Google Scholar] [CrossRef]
- Peng, Y.Z.; Rysanek, A.; Nagy, Z.; Schlüter, A. Using machine learning techniques for occupancy-prediction-based cooling control in office buildings. Appl. Energy 2018, 221, 1343–1358. [Google Scholar] [CrossRef]
- Wang, W.; Chen, J.Y.; Hong, T.Z. Modeling occupancy distribution in large spaces with multi-feature classification algorithm. Build. Environ. 2018, 137, 108–117. [Google Scholar] [CrossRef]
- Liu, X.; Li, L.; Liu, X.; Zhang, T. Analysis of passenger flow and its influences on HVAC systems: An agent based simulation in a Chinese hub airport terminal. Build. Environ. 2019, 154, 55–67. [Google Scholar] [CrossRef]
- Peng, Z.; Rysanek, A.; Nagy, Z.; Schlüter, A. Occupancy learning-based demand-driven cooling control for office spaces. Build. Environ. 2017, 122, 145–160. [Google Scholar] [CrossRef]
- Wang, C.; Guo, J.; Cao, L.; Zhang, Y.; Li, C.; Ma, Z. Mechanical behavior and fiber reinforcing mechanism of high-toughness recycled aggregate concrete under high strain-rate impact loads. Constr. Build. Mater. 2024, 437, 136960. [Google Scholar] [CrossRef]
- Wang, C.; Du, Z.; Zhang, Y.; Ma, Z. Elaborating the 3D microstructural characteristics and strength softening mechanical mechanism of fiber-reinforced recycled aggregate concrete. Constr. Build. Mater. 2024, 436, 137009. [Google Scholar] [CrossRef]
- Xia, J. Optimization and Simulation of Passenger Flow Organization in Urban Rail Transit Hub Stations. Master’s Thesis, Lanzhou Jiaotong University, Lanzhou, China, 2013. [Google Scholar]
- Ma, X.Y.; Jin, A.; Liu, M.; Li, F.Z. Rail Transit Passenger Flow Characteristics in Guangzhou. Urban Transp. China 2013, 11, 35–42. [Google Scholar]
- Zhao, J.N.; Wu, L.X.; Wang, Z.J.; Fang, X.M. Investigation and Analysis of Passenger Flow in Large Supermarkets. HVAC 2004, 34, 53–56. [Google Scholar]
- Willmott, C.J. On the Validation of Models. Phys. Geogr. 1981, 2, 184–194. [Google Scholar] [CrossRef]


Disclaimer/Publisher’s Note: The statements, opinions and data contained in all publications are solely those of the individual author(s) and contributor(s) and not of MDPI and/or the editor(s). MDPI and/or the editor(s) disclaim responsibility for any injury to people or property resulting from any ideas, methods, instructions or products referred to in the content. |
© 2024 by the authors. Licensee MDPI, Basel, Switzerland. This article is an open access article distributed under the terms and conditions of the Creative Commons Attribution (CC BY) license (https://creativecommons.org/licenses/by/4.0/).
Share and Cite
Yu, N.; Wang, Y.; Zhou, Y.; Hu, Y.; Wu, J.; Zhang, L. Field Study and Analysis of Passenger Density in the Beijing Subway Transfer Hall. Buildings 2024, 14, 2504. https://doi.org/10.3390/buildings14082504
Yu N, Wang Y, Zhou Y, Hu Y, Wu J, Zhang L. Field Study and Analysis of Passenger Density in the Beijing Subway Transfer Hall. Buildings. 2024; 14(8):2504. https://doi.org/10.3390/buildings14082504
Chicago/Turabian StyleYu, Nan, Yanhu Wang, Yihui Zhou, Yukun Hu, Jinshun Wu, and Lining Zhang. 2024. "Field Study and Analysis of Passenger Density in the Beijing Subway Transfer Hall" Buildings 14, no. 8: 2504. https://doi.org/10.3390/buildings14082504
APA StyleYu, N., Wang, Y., Zhou, Y., Hu, Y., Wu, J., & Zhang, L. (2024). Field Study and Analysis of Passenger Density in the Beijing Subway Transfer Hall. Buildings, 14(8), 2504. https://doi.org/10.3390/buildings14082504