Article

Integration of Photovoltaic Systems for Energy Self-Sufficient Low-Rise Multi-Family Residential Buildings in Republic of Korea

Center for Housing Environment Research and Innovation, Korea Land and Housing Research Institute, Sejong 34047, Republic of Korea
*
Author to whom correspondence should be addressed.
Buildings 2024, 14(8), 2522; https://doi.org/10.3390/buildings14082522
Submission received: 12 July 2024 / Revised: 9 August 2024 / Accepted: 14 August 2024 / Published: 15 August 2024
(This article belongs to the Special Issue Advanced Studies in Nearly Zero-Energy Buildings and Optimal Design)

Abstract

:
Globally, building energy consumption has been rising, emphasizing the need to reduce energy usage in the building sector to lower national energy consumption and carbon dioxide emissions. This study analyzes the applicability of photovoltaic (PV) systems in enhancing the energy self-sufficiency of small-scale, low-rise apartment buildings. The analysis is based on a case study using Republic of Korea’s Zero-Energy Building Certification System. By employing the ECO2 simulation program, this research investigates the impact of PV system capacity and efficiency on the energy self-sufficiency rate (ESSR). A series of parametric analyses were carried out for various combinations of building-attached photovoltaic (BAPV) roofs and building-integrated photovoltaic (BIPV) facades, considering the initial cost of BIPV facades. The simulations demonstrate that achieving the target ESSR requires a combination of BAPV roofs and BIPV facades, due to limited roof areas for PV systems. Additionally, this study reveals that BIPV facades can be cost-effective when their unit price, relative to BAPV roofs, is below 62%. Based on the ECO2 simulations, a linear regression formula is proposed to predict the ESSR for the case study building. Verification analysis shows that the proposed formula predicts an ESSR of 74.1%, closely aligned with the official ESSR of 76.9% certified by the Korean government. Although this study focuses on the case of a specific apartment building and lacks actual field data, it provides valuable insights for future applications of PV systems to enhance energy self-sufficiency in small-scale, low-rise apartment buildings in Republic of Korea.

1. Introduction

Globally, the building sector constitutes a substantial portion of national energy consumption. According to the International Energy Agency (IEA), the building sector accounts for over 40% of energy consumption in North America, more than 37.3% in Europe, and above 24% in Asia. Specifically, residential buildings represent over 17% in North America, 25% in Europe, and 19% in Asia, in terms of the total energy consumption [1]. The U.S. Energy Information Administration (EIA) similarly reports that the building sector represents approximately 21% of total energy consumption in the United States, with residential buildings accounting for about 11% [2]. The Korea Energy Economics Institute (KEEI) indicates that the building sector comprises about 22% of national energy consumption, with residential buildings making up about 11% [3]. According to the KEEI, the important fact is that energy consumption in the building sector is continuously increasing [3].
The government in Republic of Korea introduced the Zero-Energy Building Certification (ZEBC) System in 2017, aiming to reduce energy consumption in the building sector. Since 2020, the ZEBC requires public buildings to achieve an energy self-sufficiency rate (ESSR) of at least 20%. Starting in 2023, this mandate has been extended to public multi-family residential buildings with 30 or more dwelling units [4]. The ESSR is the ratio between the source energy generation and the source energy consumption of a building. It serves as the basis for determining the Zero-Energy Building Grade; Grade 5 requires an ESSR from 20% to less than 40%, Grade 4 requires an ESSR from 40% to less than 60%, Grade 3 requires an ESSR from 60% to less than 80%, Grade 2 requires an ESSR from 80% to less than 100%, and Grade 1 requires an ESSR from 100% or higher [4].
However, as mentioned earlier, in Republic of Korea, multi-family residential buildings with 30 or more dwelling units are required to comply with the Zero-Energy Building Certification [4]. This highlights a lack of standards or systems for achieving zero energy in small-scale, low-rise, multi-family residential buildings in Republic of Korea. Consequently, there is also a scarcity of research focused on achieving energy self-sufficiency for these low-rise residential buildings.
According to the Korea Statistical Information Service (KOSIS), as of 2022, multi-family housing accounted for 79% of the total number of dwellings in Republic of Korea [5]. Data from the Korea Energy Agency indicates that since the implementation of the Zero-Energy Building Certification in 2017, only 20 out of 975 certified buildings are residential buildings, representing just 2.1% of the total number of certified buildings [4]. Among the certified residential buildings, 11 buildings are multi-family residential buildings, showing no significant difference in proportion compared to single-family homes. However, when comparing the ZEB grades, 45% of single-family homes achieved a ZEB Grade 3 or higher, while only 33% of multi-family residential buildings reached this level. Therefore, given the high prevalence of multi-family residential buildings in Republic of Korea, it is crucial to enhance the energy self-sufficiency of these buildings to achieve significant energy savings in the building sector.
Research aimed at improving the energy performance and energy self-sufficiency of housing has been actively conducted worldwide, including in Republic of Korea. Some previous studies have performed research using case studies on various net-zero energy buildings, demonstrating the necessity of applying diverse energy reduction technologies and renewable energy sources to achieve net-zero energy buildings [6,7,8,9]. Notably, these studies identified that photovoltaic (PV) systems have been employed in most cases. This underscores that PV systems are considered the primary renewable energy solution for achieving net-zero energy buildings. Furthermore, various pieces of global research on implementing net-zero energy buildings have consistently shown that both PV (including building-attached photovoltaic or BAPV and building-integrated photovoltaic or BIPV) systems and solar thermal systems are considered as energy sources in many of these types of studies [10,11,12,13,14,15,16,17,18,19,20,21,22].
In Republic of Korea, various studies have also been conducted to implement net-zero energy residential buildings, as summarized in Table 1 [23,24,25,26,27,28,29,30,31,32,33,34,35,36,37,38,39,40,41,42,43,44,45,46,47,48]. Unlike international studies, Korean research has predominantly focused on energy reduction technologies and the analysis of building energy policies and their effectiveness, rather than the implementation of zero energy multi-family residential buildings. This suggests that there is a lack of research on application strategies and capacity estimation methods for PV systems, which are essential for achieving nearly or net-zero energy residential buildings in Korean studies. Furthermore, Korean research has primarily focused on high-rise apartments, reflecting the predominant residential culture in Republic of Korea. Consequently, there is a notable deficiency in the research aimed at improving energy performance and achieving nearly or net-zero energy in small-scale, low-rise, multi-family residential buildings, with fewer than 30 dwelling units, in Republic of Korea.
In general, achieving net-zero energy buildings with PV systems can be easier for single-family homes compared to multi-family residential buildings. This is because the energy generated by PV systems installed on the same roof area only needs to cover the energy load of a single household in a single-family home. In contrast, in multi-family housing, PV systems must cover the energy load of multiple households. Consequently, achieving energy self-sufficiency solely through rooftop PV systems could be challenging for multi-family residential buildings.
This study aims to analyze how PV systems can be applied to achieve energy self-sufficiency in a small-scale, low-rise, multi-family residential building in Republic of Korea, particularly during the schematic design process. For this research, an actual low-rise residential building with 28 dwelling units that achieved ZEB Grade 3 will be used as a case study.

2. Methodology

The main purpose of this research is to analyze the integration of PV systems into low-rise residential buildings to achieve energy self-sufficiency in Republic of Korea, particularly during the schematic design process. This study analyzes the energy performance of buildings and conducts a sensitivity analysis of the impact of PV systems using building energy simulation, as shown in Figure 1.
The target ESSR of 60% was set based on the requirements of the city government of Sejong City for public rental housing. Subsequently, using the Korean building energy code and other criteria, the baseline building was modelled in the ECO2 building energy simulation and the building energy performance was evaluated to calculate the required source energy generation needed to achieve the target ESSR.
To understand the contributions of the BAPV roof and BIPV facade towards achieving the target ESSR, a sensitivity analysis of the PV system’s capacity and efficiency was conducted using the ECO2 simulation. Additionally, this research carried out parametric analysis to analyze the different combinations of BAPV roofs and BIPV facades, as well as the impact of the initial cost of a BIPV facade on the different combinations of PV systems. Based on the ECO2 simulation results and regression analysis, this research proposed a calculation formula for predicting the ESSR.
The energy performance analysis of the baseline buildings was conducted using ECO2, the official building energy analysis program in Republic of Korea, as illustrated in Figure 2. Internationally, various building energy simulation tools, such as EnergyPlus, TRNSYS, and DOE-2 based EQUEST, are commonly used to assess and evaluate building energy performance. However, in Republic of Korea, the ECO2 simulation program serves as the official tool for analyzing building energy loads and consumption in the context of the Zero-Energy Building Certification. The ECO2 program calculates building energy loads and consumption, aiming to evaluate the overall energy performance [30,34,35,49,50]. Previous studies have shown that the ECO2 simulation program yields energy usage trends consistent with the reference data [51,52,53]. In this research, the ECO2 simulation program is employed to analyze building energy performance and assess the impact of PV systems on achieving energy self-sufficiency rates.

3. Building Energy Modeling

3.1. Baseline Building Energy Modeling

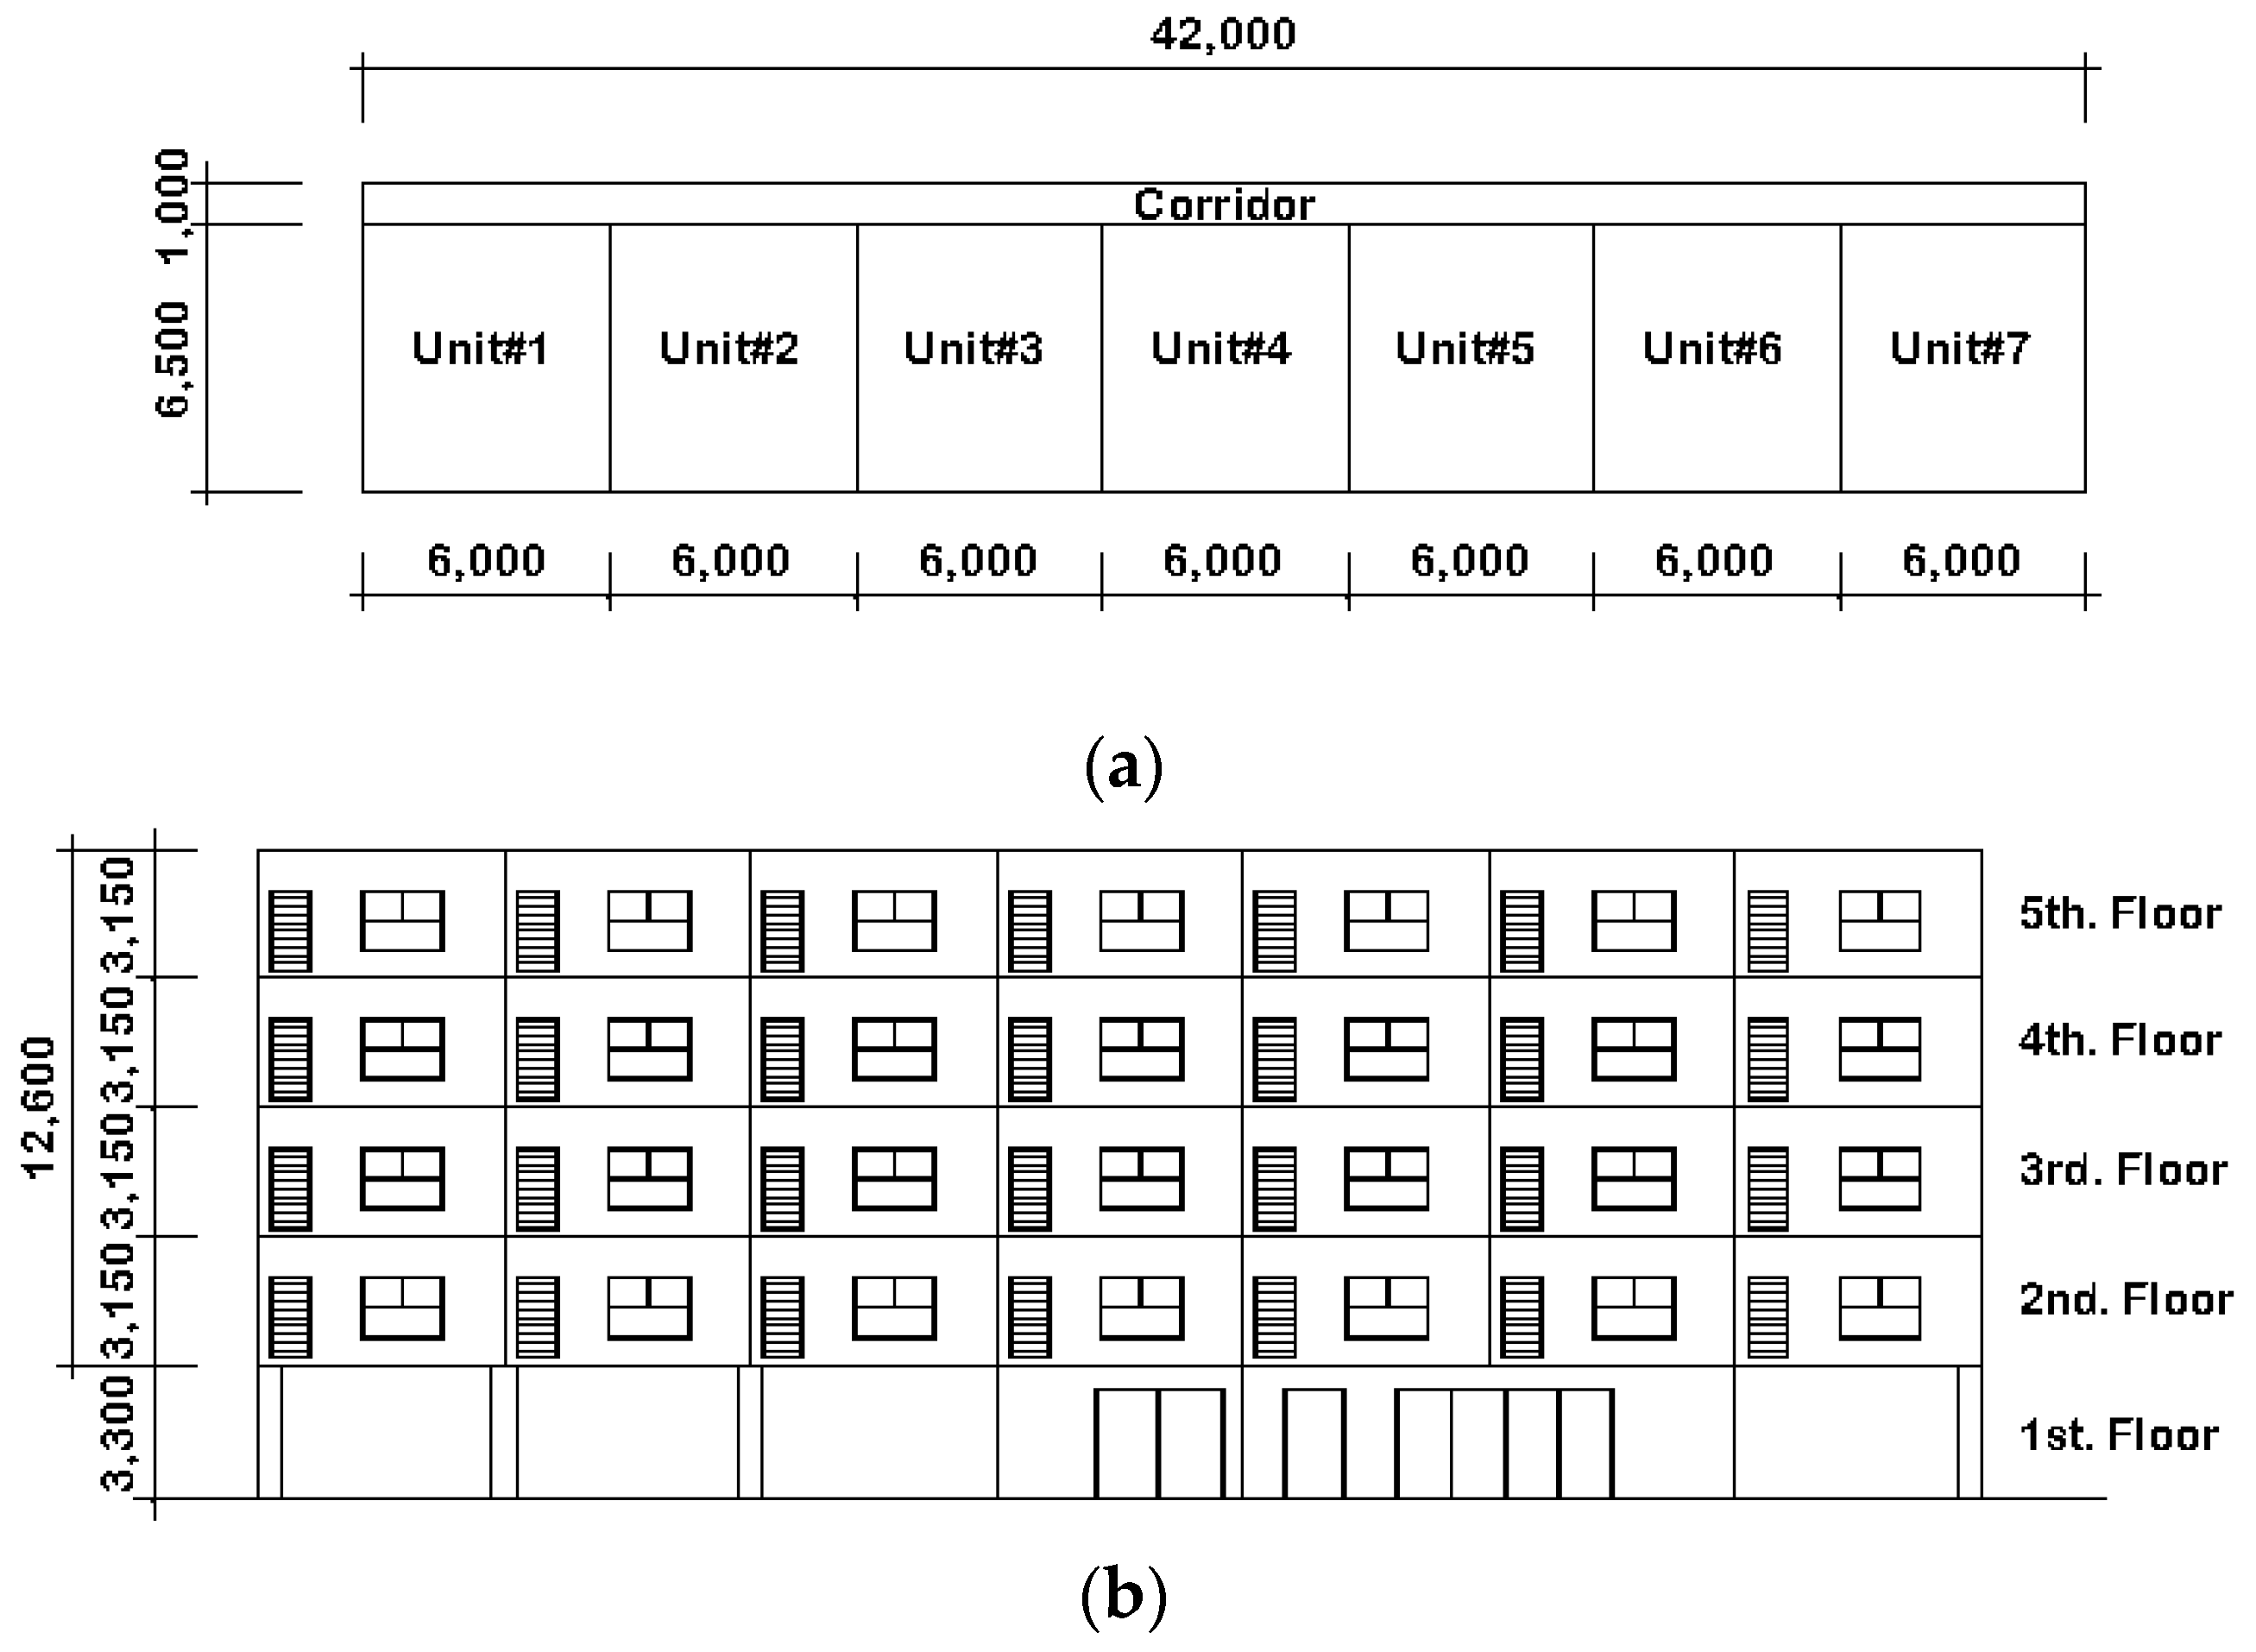
The case study building is a small-scale five-story multi-family public housing building with 28 dwelling units located in Sejong, Republic of Korea. Excluding the first floor, which is a public space, including a lobby and monitoring room, the second to fifth floors consist of seven dwelling units per floor, as shown in Figure 3. This public apartment aims to achieve an energy self-sufficiency rate of over 60% and obtain at least ZEB Grade 3 certification. Each dwelling unit is planned to have an area of 39 m2. The description of the case study building is summarized in Table 2.
The ECO2 building energy simulation inputs are summarized in Table 3. These inputs are primarily based on reference data from the Energy Saving Design Standards for Buildings of the Korean Government [49]. According to the Energy Saving Design Standards for Buildings of the Ministry of Land, Infrastructure, and Transport of Republic of Korea, residential buildings can exclude the cooling system from the evaluation criteria for the Zero-Energy Building Certification [54]. Therefore, the baseline building in this study does not consider the cooling system and has excluded space cooling from the ZEB certification evaluation criteria.

3.2. Parameters for the Sensitivity Analysis

The study applied BAPV on the roof and BIPV on the facade of the baseline building and conducted a sensitivity analysis to assess the impact of the BAPV roof and BIPV facade on the building’s ESSR. The parameters investigated in this study included the installation area and efficiency of the BAPV roof and BIPV facade, as outlined in Table 4.

4. Building Energy Simulation Results

4.1. Energy Performance of the Baseline Model

Table 5 presents the results of the ECO2 simulation for the baseline model. Heating accounted for approximately 54.2% of the total building energy load, followed by domestic hot water at 32.3%, and lighting at 13.5%. When considering site energy consumption, calculated taking into account the equipment efficiency and operating hours, heating energy consumption represented 60.2% of the total, domestic hot water 21.0%, lighting 7.9%, and ventilation 10.8%. In terms of source energy consumption, space heating represented 48.0%, domestic hot water 16.3%, lighting 15.1%, and ventilation 20.6%. Overall, heating dominated the building energy performance, highlighting its significant contribution to energy consumption.

4.2. Results of the Sensitivity Analysis

4.2.1. Impact of PV System Capacities

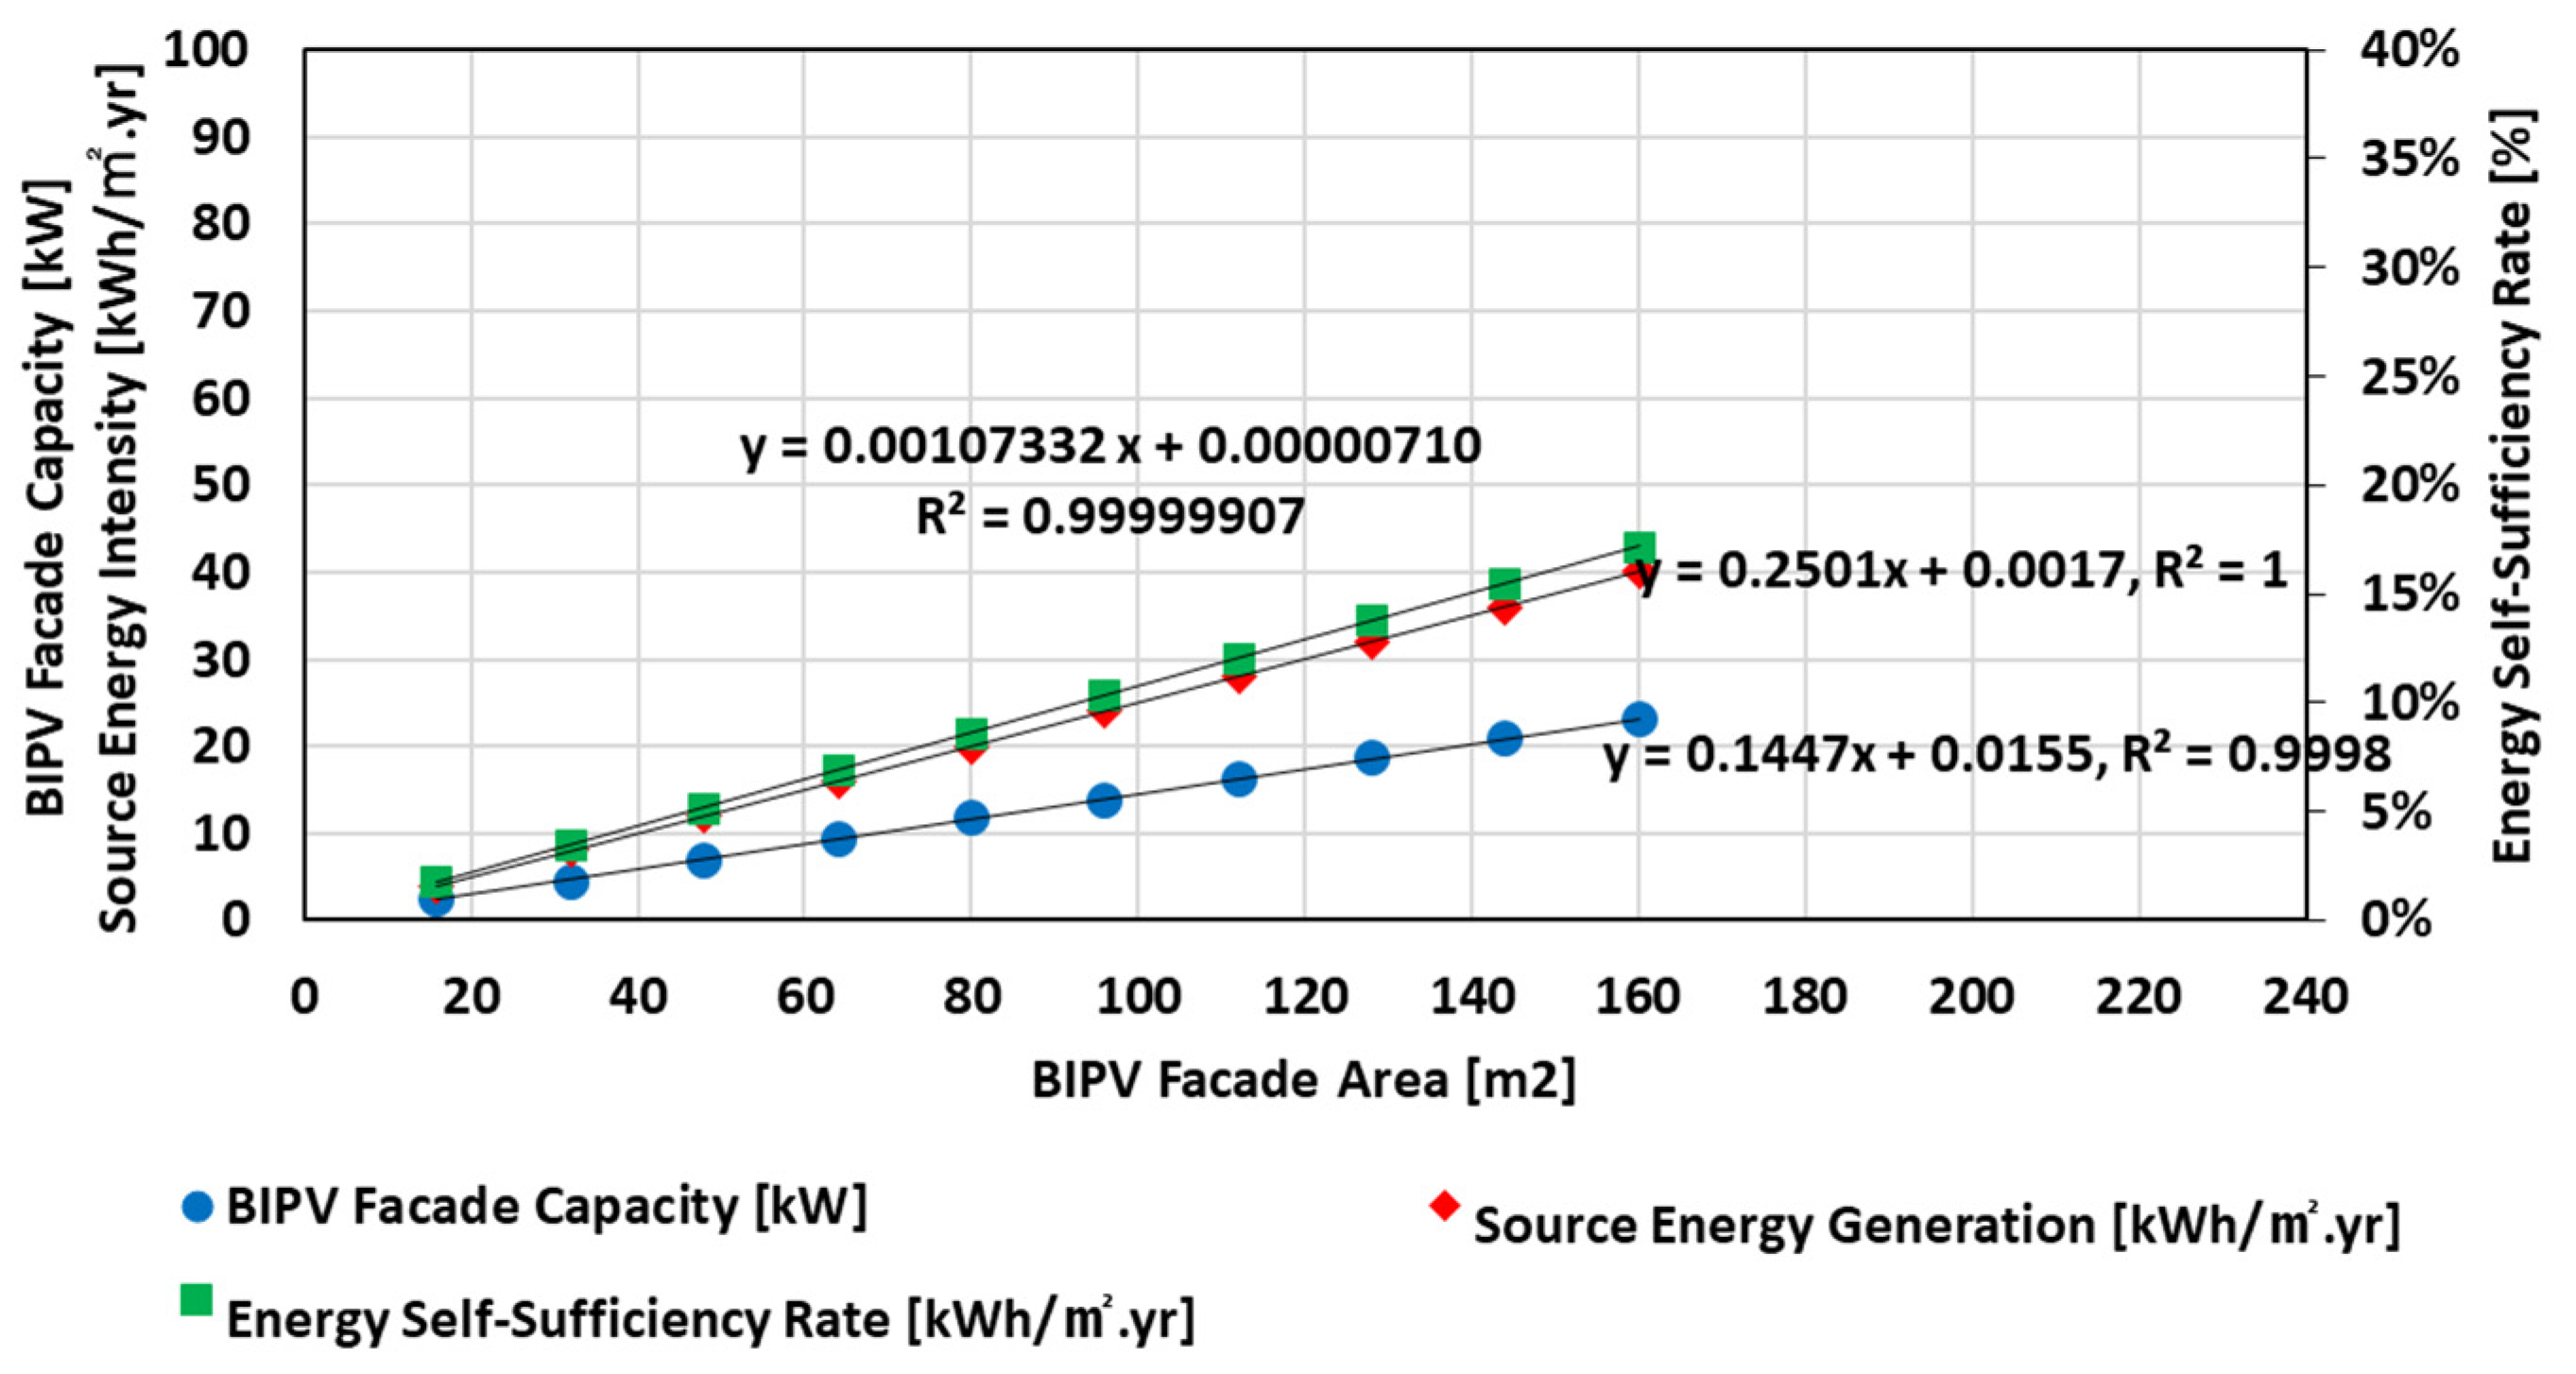
This study analyzed the impact of capacity changes in the BAPV roof and BIPV facade on the ESSR for the case study building. In the ECO2 simulation, the BAPV roof efficiency and installation angle was fixed at 20% and 30 degrees, respectively, while the BIPV facade efficiency was assumed to be 15%. Notably, when conducting simulations for the BAPV roof or BIPV facade, each type of PV system was simulated independently. In other words, the BIPV facade was not applied during the simulations for the BAPV roof. The simulation results, as shown in Figure 4 and Figure 5, revealed that the ESSR increases linearly as the installation area of both systems increases and the installed capacity increases.
The simulation analysis results indicate that achieving the target ESSR of 60% solely with either a BAPV roof or a BIPV facade is challenging due to installation area limitations. Specifically, a BAPV roof would need to cover more than 280 m2, while a BIPV facade would require at least 560 m2, according to the linear regression equation. However, local government regulations in Republic of Korea restrict solar panel installation to a maximum of 70% of the flat roof area [55,56]. Given the total roof area of 300 m2 in the case study building, a BAPV roof can be installed on up to 210 m2 of the horizontal flat roof surface. Applying an installation angle of 30°, the maximum installable area for the BAPV roof is 243 m2. Therefore, achieving the target ESSR necessitates combining both a BAPV roof and a BIPV facade.

4.2.2. Impact of PV System Efficiencies

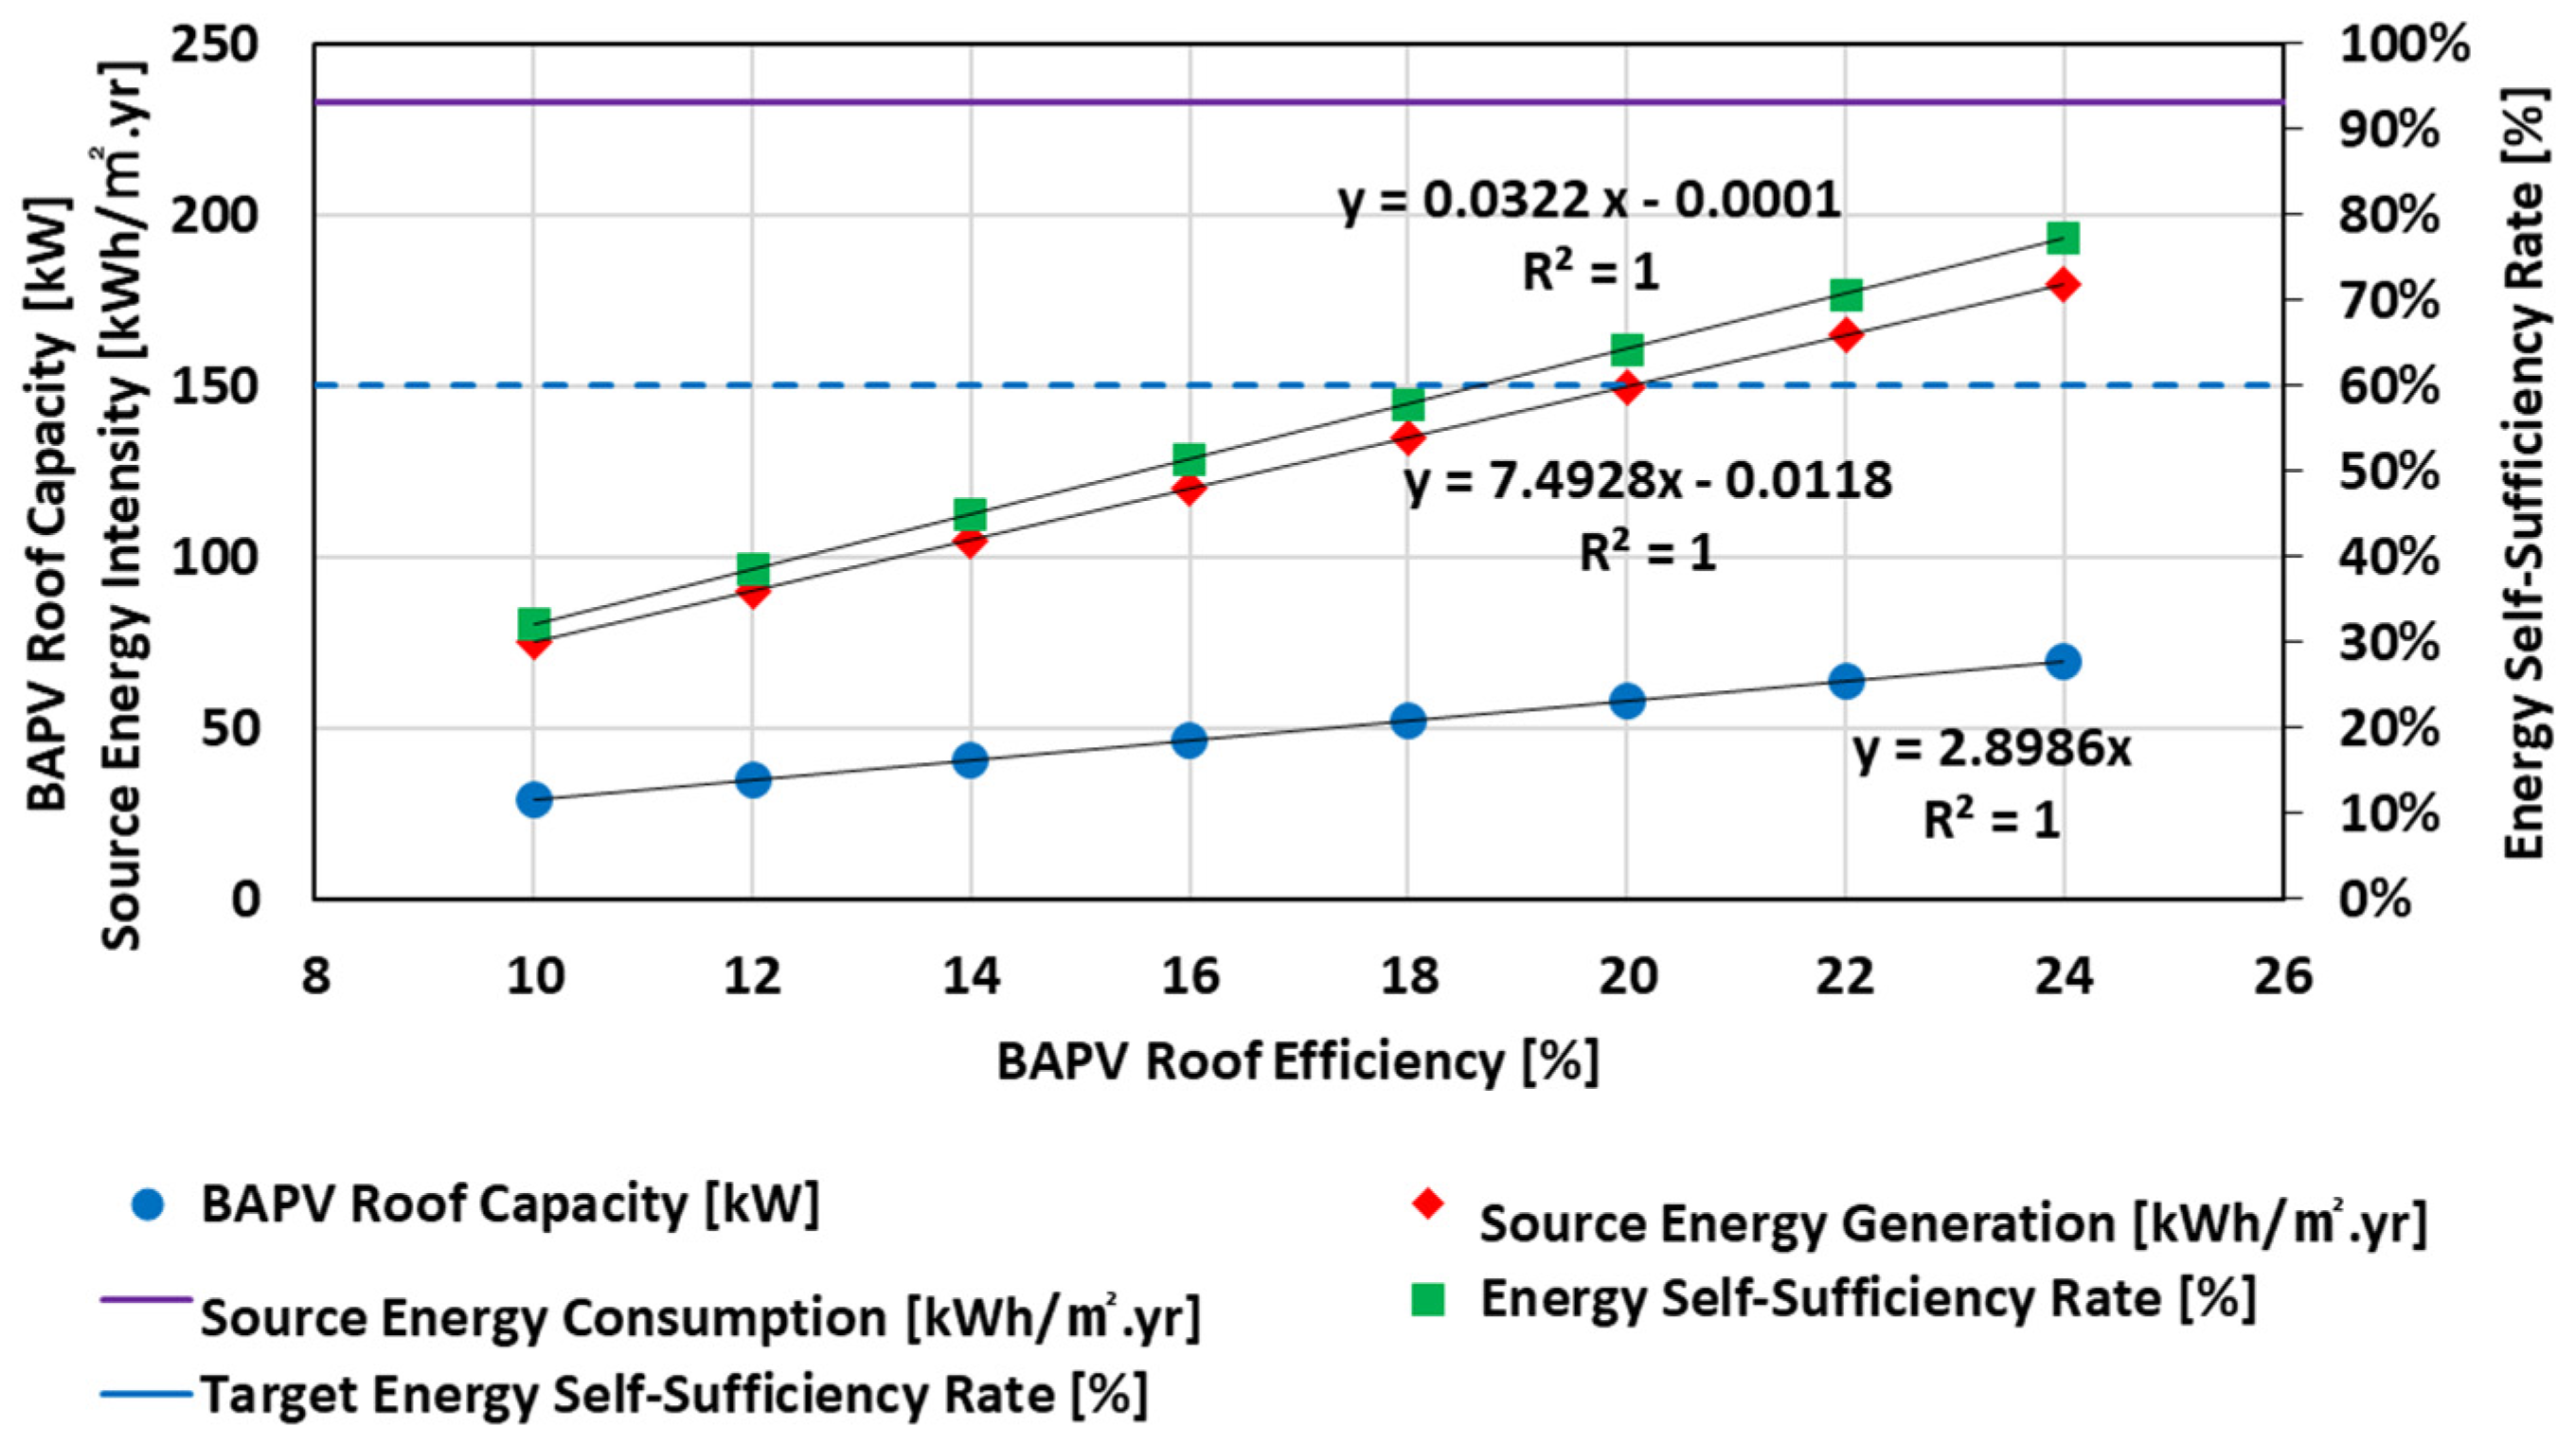
This study conducted simulations to analyze the impact of changes in the efficiency of the PV system on the ESSR of the case study building. When simulating the BAPV roof, it was assumed that it would be installed on 300 m2 of the roof, with no installation of a BIPV facade. For the BIPV facade, it was assumed that it would cover 160 m2, corresponding to about 30% of the front wall area of 530 m2, without a BAPV roof. As a result of the analysis, it was observed that the change in the building’s ESSR due to efficiency changes followed a linear trend, as shown in Figure 6 and Figure 7. Specifically, for the BAPV roof, an efficiency saving of at least 16% was necessary to achieve the target ESSR for the case study building. However, in the case of the BIPV facade, regardless of how high the efficiency was, the target ESSR of 60% could not be reached. The limitation arises from the BIPV facade installation area being restricted to 30% of the front wall.

5. Analysis

5.1. Impact of Combining PV Systems on Achieving the Target ESSR

Since the source energy demand of the baseline model is 233 kWh/(m2·yr), achieving the target ESSR of 60% requires a source energy generation of at least 139.8 kWh/(m2·yr). This study analyzed various combinations of BAPV roofs and BIPV facades to meet the target ESSR, as summarized in Table 6. For this analysis, the PV efficiencies of 20% and 15% were used for the BAPV roof and BIPV facade, respectively. As shown in Table 6, an area of 280 m2 for the BAPV roof alone is sufficient to achieve the target ESSR of 60%. However, due to regulatory constraints, which allows only up to 270 m2 for the BAPV roof installation in the case study building, achieving the target ESSR solely with a BAPV roof is not feasible. Therefore, a combination of a BAPV roof and a BIPV facade is necessary to achieve the target ESSR of 60% for the case study building.

5.2. Impact of BIPV Facade Initial Costs

This study examined the combination of a BAPV roof and a BIPV facade to achieve the target ESSR, considering the installation costs. As shown in Table 7, the baseline installation cost for PV systems was obtained from the Korea Energy Agency’s 2021 report [57]. Since there are no recent official cost estimates for BIPV facade panels from the Korea Energy Agency (KEA), this research used the cost difference ratio between BAPV roofs and BIPV facades from the 2011 and 2012 KEA reports [58,59]. Specifically, the cost of BIPV facade panels was assumed to be approximately 2.0 times that of BAPV roof panels, estimated at KRW 2724 per kW.
To evaluate the effect of the initial cost of a BIPV facade, this study conducted ECO2 simulations for various combinations of BAPV roof and BIPV facade installations needed to achieve the target ESSR of 60%. Different initial costs for a BIPV facade were then applied, as shown in Table 8. Throughout the analysis, the installation areas for BAPV roof and BIPV facade panels, as well as the cost of a BAPV roof, remained constant, while the cost of the BIPV facade was varied.
Table 9 presents the initial cost associated with different combinations of BAPV roofs and BIPV facades for various implementation surfaces. The minimum initial cost is highlighted in yellow. Notably, for Option 1 and Option 2, a higher utilization of the BIPV facade results in a lower initial cost for implementing PV systems. In contrast, other options achieve the minimum initial cost by using only a BAPV roof. These results indicate that applying a BIPV facade is cost-effective when its initial price, relative to a BAPV roof, is below 62%. Therefore, to promote the extensive adoption of BIPV facades, reducing the initial installation cost through financial support systems, such as government subsidies, is crucial.

5.3. ESSR Prediction Models for PV Systems

5.3.1. ESSR Prediction Model Regression Analysis

Table 10 shows variations in the PV capacity, source energy consumption, and ESSR for changes in the BIPV facade area, based on different BAPV roof areas. As shown in Table 10, since the trend of increasing the ESSR with an increase in the BIPV facade area is linear, the required installation area of the BIPV facade for the case study building to achieve net-zero energy can be estimated through linear regression.
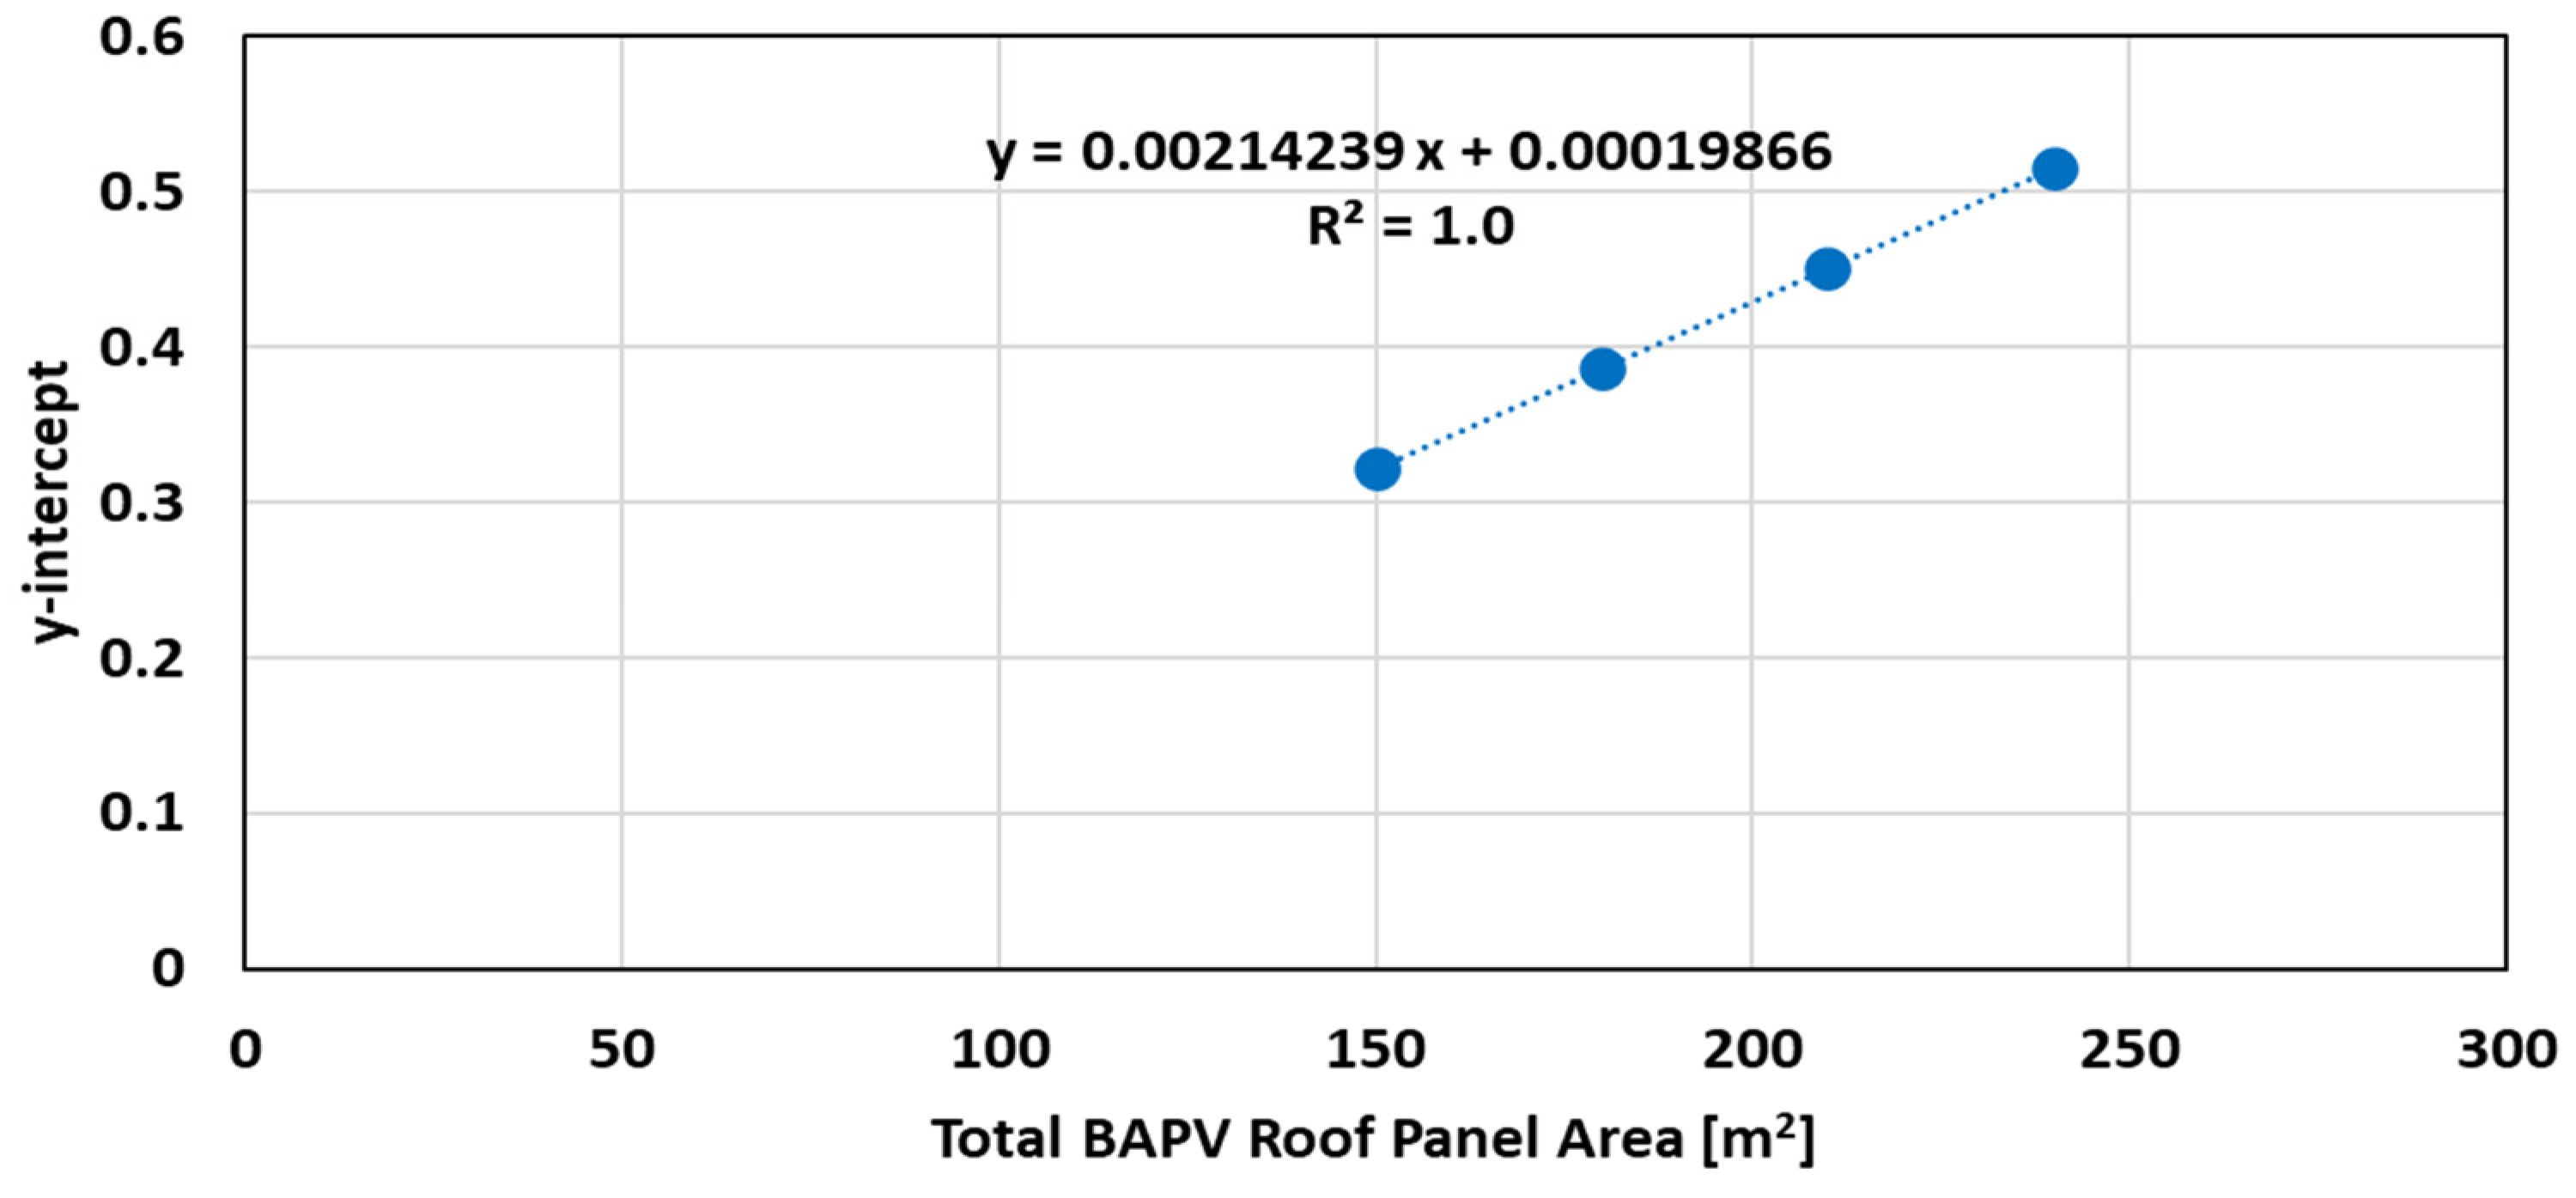
Figure 8 shows that the trend of the ESSR variation with respect to changes in the BIPV facade area remains consistent regardless of the BAPV roof area, indicating only a shift in the y intercept. Figure 9 further demonstrates that the y intercept linearly correlates with the BAPV roof area. By combining these linear regression relationships, Equation (2) could be derived, suggesting that it is feasible to predict the ESSR based on variations in both the BAPV roof and BIPV facade areas for a specific building.
E S S R % = 0.001071 × A B I P V + 0.002142 × A B A P V + 0.000199
However, this equation only considers the influence of the installation areas of the BAPV roof and BIPV facade, failing to adequately reflect the direct correlation with the source energy consumption for ESSR calculations. In other words, Equation (1) may show high predictive accuracy for the case study building used to derive Equation (1), however it can lack accuracy when building loads and source energy consumption vary. Therefore, to address such limitations and account for source energy consumption, this study used the correlation between the PV capacity and building source energy consumption to assess the achievable ESSR through PV system implementation.
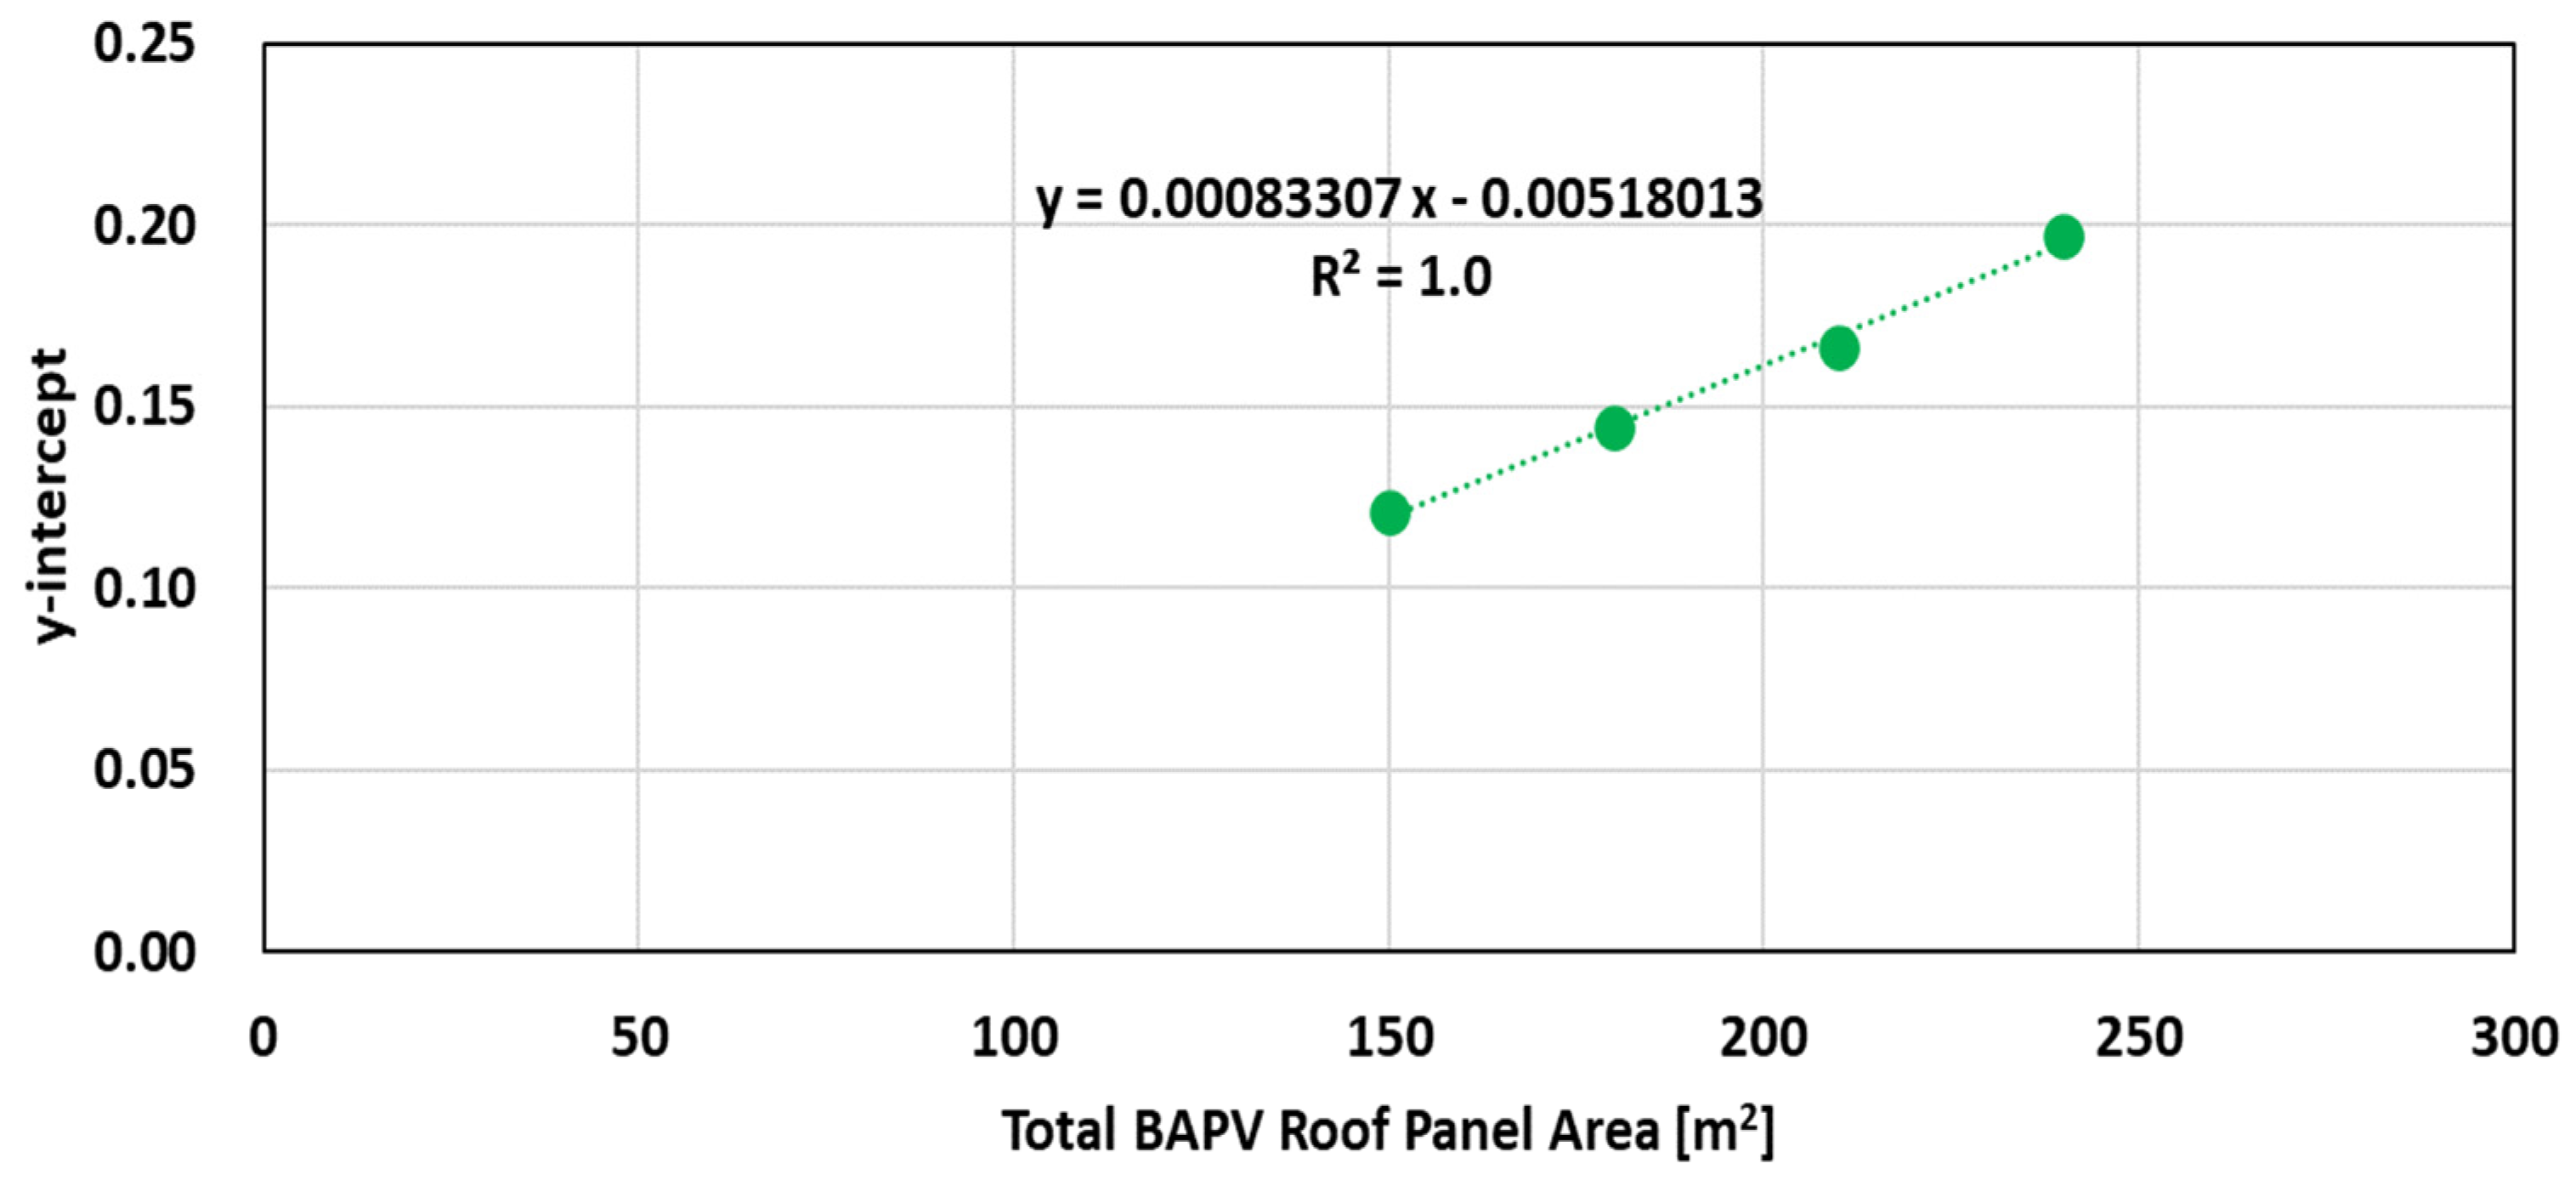
As shown in Figure 10, the ESSR variation relative to the ratio of the PV capacity to the source energy consumption follows a linear trend. The slope of the change, which varies based on the BAPV roof area, remains consistent, while the y intercept differs. Figure 11 shows that the y intercept linearly correlates with changes in the BAPV roof area. By combining these linear regression equations, depicted in Figure 10 and Figure 11, this study derived Equation (2), which can predict the building’s ESSR.
E S S R % = 1.6066 × T o t a l   S o l a r   P o w e r   C a p a c i t y A n n u a l   P r i m a r y   E n e r g y   C o n s u m p t i o n + 0.000833 × A B A P V 0.005180

5.3.2. Verification of the ESSR Prediction Models

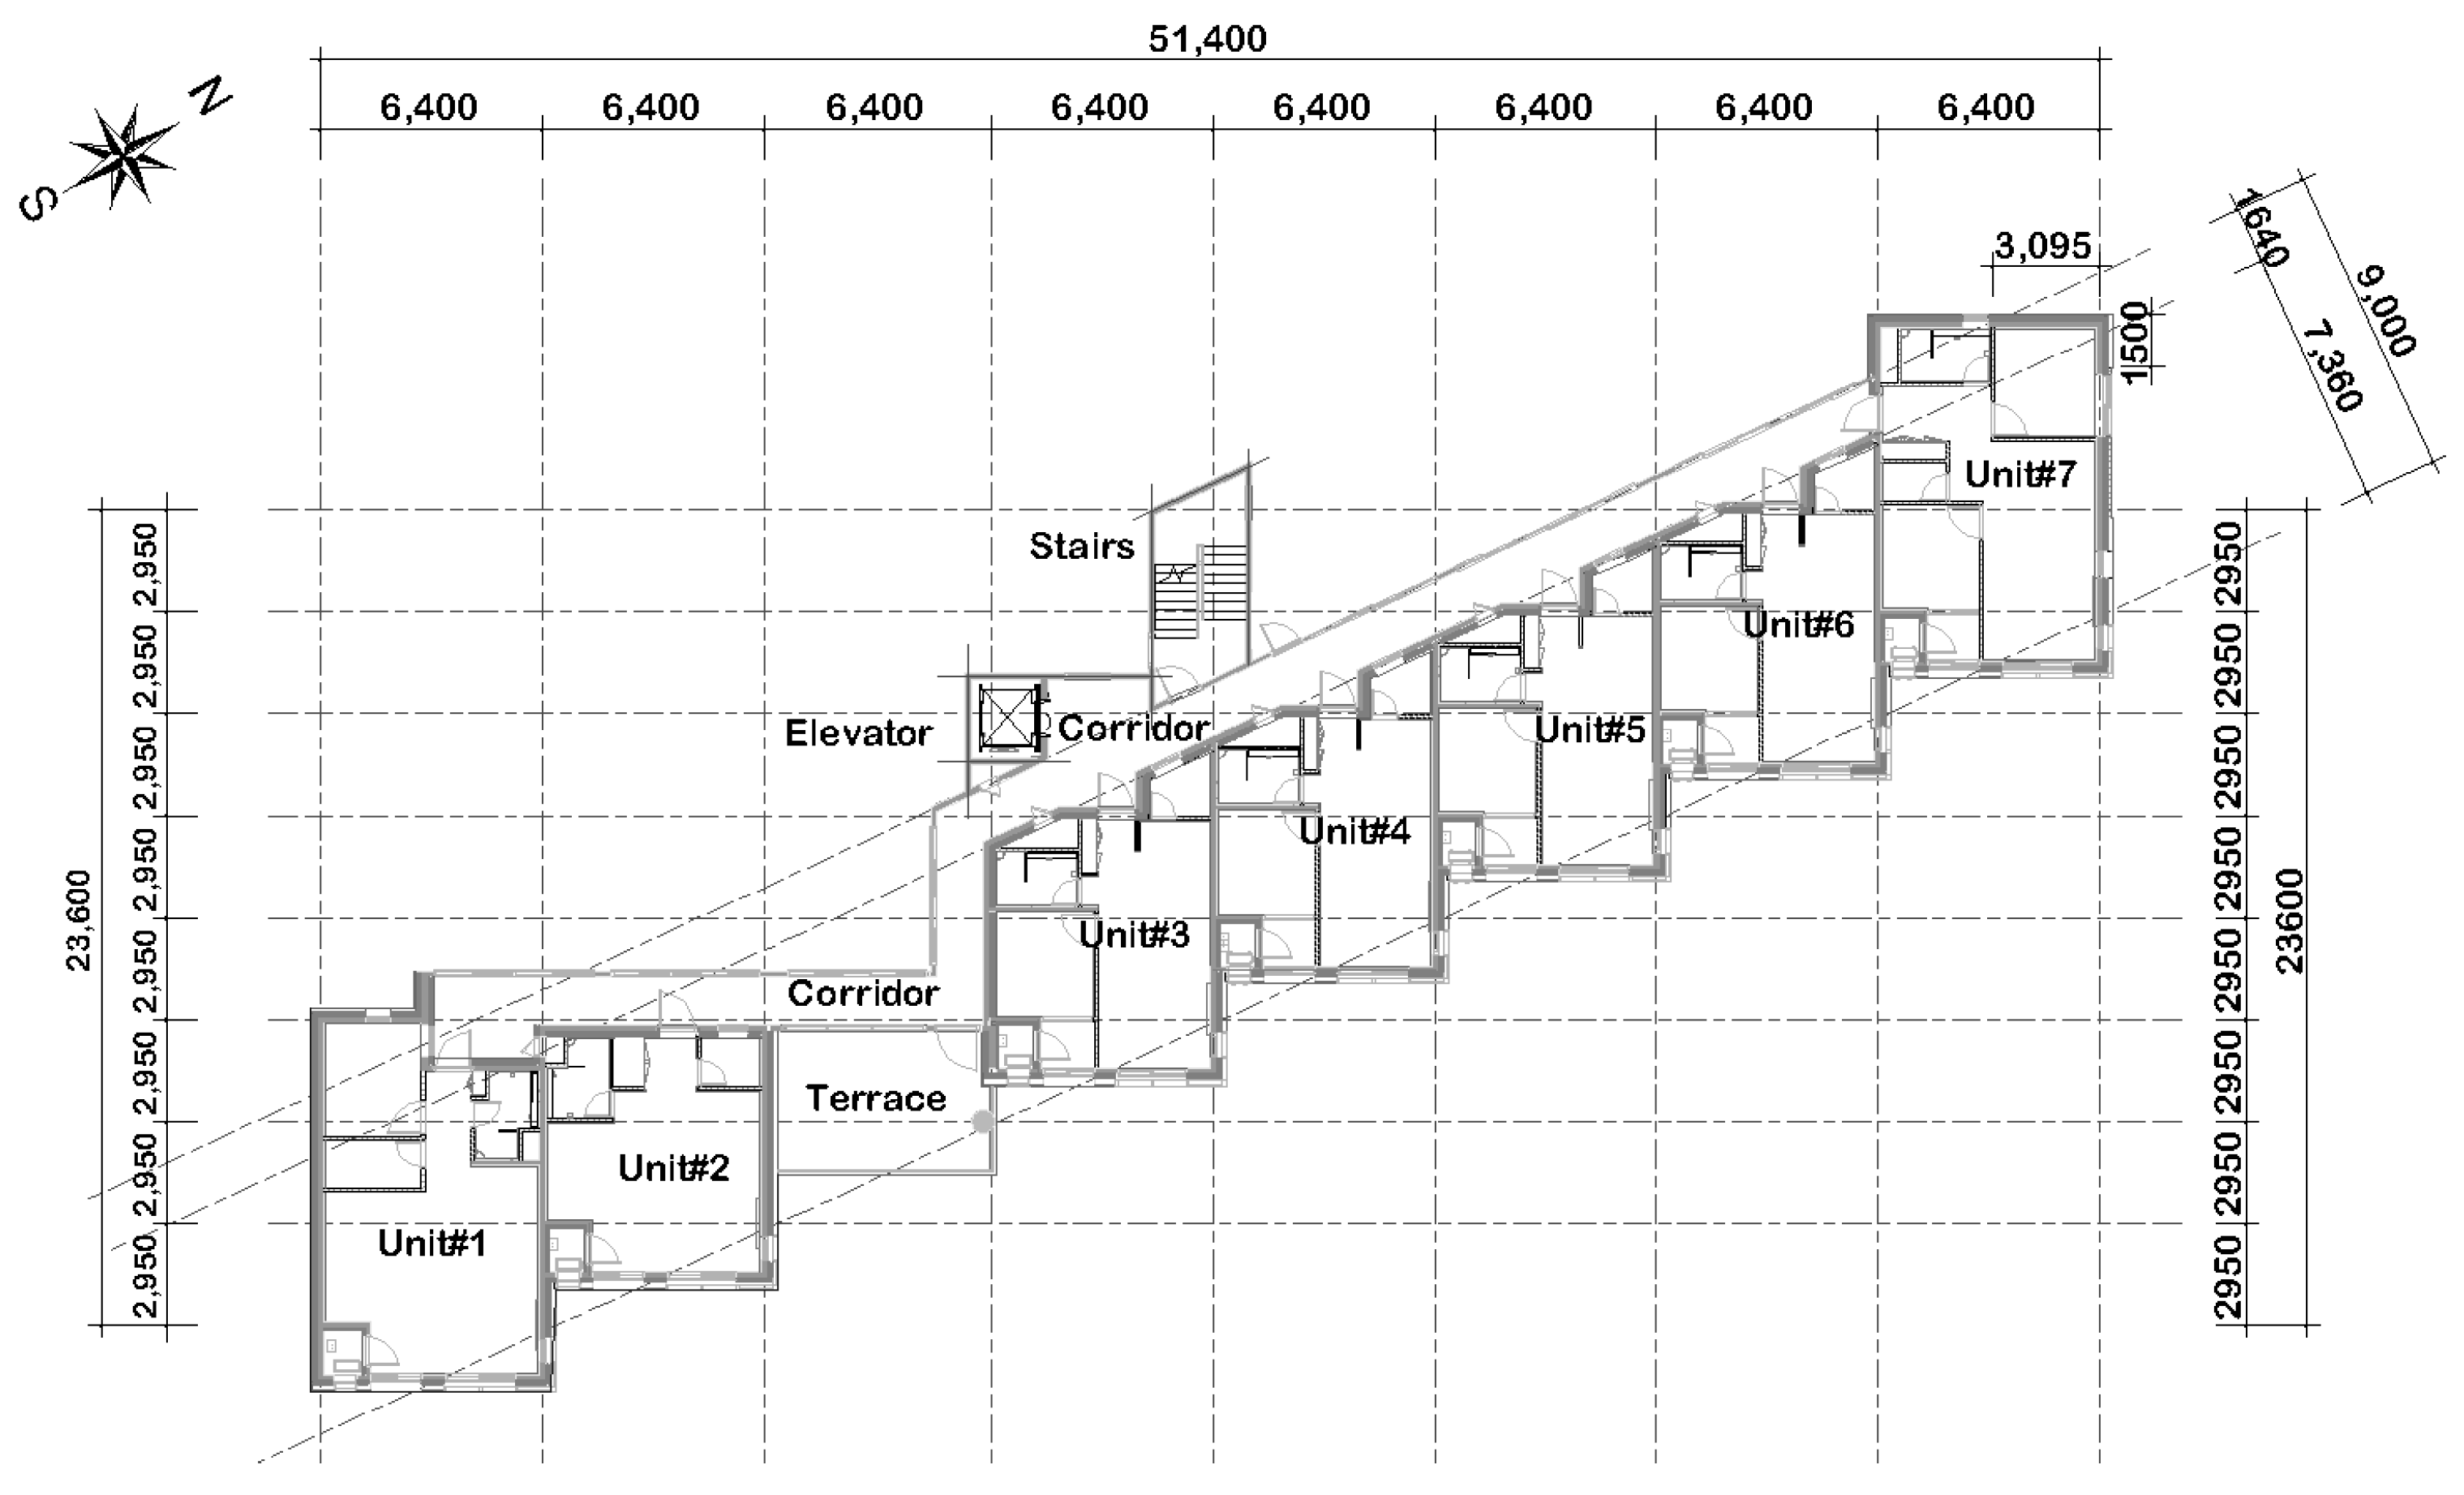
The case building studied in this research was built in August 2023, as shown in Figure 12, along with the floor plan shown in Figure 13. While the main design remained consistent with the conceptual design, the dwelling unit area was expanded beyond the initial plans. Notably, mechanical ventilation was not implemented in the final design. The photographs and specifications of the completed building are presented in Figure 12 and Table 11.
Based on the specifications of the building shown in Table 11, the official results of the Zero-Energy Building Certification of Republic of Korea are presented in Table 12, indicating the final ESSR of 76.9%. This exceeds the target ESSR of 60%. The variation is attributed to changes in the boundary conditions, including envelope U-values, the infiltration rate, and lighting power density, as well as adjustments to the floor area compared to the initial plans.
The ESSR predictions were made using Equations (1) and (2), considering the final building specifications, source energy consumption, and PV capacity. The calculated ESSR prediction from Equation (1) was 66.2%, whereas Equation (2) predicted an ESSR of 74.1%. This discrepancy highlights that Equation (2) provides a more accurate prediction.
The reason lies in that Equation (1) focuses solely on variations in the installation area of PV systems, without directly considering the building’s source energy consumption. While Equation (1) suited the sample data used for its derivation, it exhibited significant errors when the building’s energy usage changed. In contrast, Equation (2) accounts for both PV capacity and source energy consumption, resulting in a more reliable ESSR prediction.

6. Conclusions

This study analyzed various factors related to implementing PV systems for achieving nearly zero energy in small-scale, low-rise, multi-family residential buildings. The analysis was based on a case study building located in Republic of Korea, a newly constructed five-story multi-family residential building with 28 dwelling units. The research investigated the impact of PV capacity and efficiency variations, BIPV facade costs, and the combined effects of a BAPV roof and BIPV facade on the building’s ESSR. Based on these analyses, the study proposed equations to predict the ESSR when implementing PV systems in small-scale, low-rise, multi-family residential buildings in Republic of Korea.
During the conceptual design process, the case study building set a target ESSR of 60%, excluding space cooling and plug loads. To achieve this target ESSR, this study analyzed the impact of PV capacity and efficiency. The simulation results showed that achieving the target ESSR using only a BAPV roof or a BIPV facade would be challenging due to the limited roof area for BAPV systems in multi-family residential buildings and the lower efficiency of BIPV facades compared to BAPV roofs. Therefore, a combination of a BAPV roof and BIPV facade emerges as a viable strategy to achieve the desired ESSR.
Due to the initial cost of a BIPV facade being twice as high as that of BAPV roof, it was more cost-effective to use more BAPV roof panels than BIPV facade panels. To enhance the cost-effectiveness of the BIPV facade, the sensitivity analysis revealed that its initial cost should be 62% lower than that of a BAPV roof. This difference primarily stems from the lower energy performance of BIPV facades compared to BAPV roofs.
Based on the simulation results for various combinations of BAPV roofs and BIPV facades, this study derived equations using linear regression analysis to predict the ESSR for a small-scale, low-rise, multi-family residential building. By utilizing the final design details of the case study residential building, the proposed equation, which considers both the PV capacity and building source energy consumption, was validated to predict the ESSR, which was closely aligned with the actual ESSR.
However, it is important to acknowledge that this study has limitations. Conducted on a specific case study building, further analysis is necessary to determine whether the results can be generalized to multi-family residential buildings of varying scales and locations. Additionally, since this study primarily relied on simulation analysis, future validation using real building energy performance data and PV system-generated energy data is essential.
Despite these limitations, this study differs from previous research by investigating the application of PV systems as a strategy to achieve the ESSR in small-scale, low-rise, multi-family residential buildings in Republic of Korea. This research could be useful for future studies exploring strategies for achieving zero-energy, multi-family residential buildings using PV systems.

Author Contributions

Conceptualization, B.C.K.; Methodology, B.C.K.; Formal analysis, B.C.K.; Investigation, B.C.K.; Data curation, B.C.K.; Writing—original draft, B.C.K.; Writing—review & editing, G.T.K. and I.T.H.; Visualization, B.C.K. and I.T.H.; Supervision, G.T.K.; Project administration, G.T.K.; Funding acquisition, G.T.K. All authors have read and agreed to the published version of the manuscript.

Funding

This research was funded by City Government of Sejong [Sejong New Deal Policy for Urban Regeneration].

Data Availability Statement

The data presented in the study are included in the article material; further inquiries can be directed to the corresponding author.

Conflicts of Interest

The authors declare no conflicts of interest.

References

  1. International Energy Agency. Efficiency & Demand. Available online: https://www.iea.org/countries (accessed on 22 June 2024).
  2. U.S. Energy Information Administration. Annual Energy Review 2023. Available online: https://www.eia.gov/totalenergy/data/annual/index.php (accessed on 22 June 2024).
  3. Korea Energy Economics Institute. 2023 Yearbook of Energy Statistics—Data up to 2022; Korea Energy Economics Institute: Ulsan, Republic of Korea, 2023; ISSN 1226-606X. [Google Scholar]
  4. Korea Energy Agency. Zero Energy Building Certification. Available online: https://zeb.energy.or.kr/BC/BC00/BC00_01_001.do (accessed on 22 June 2024).
  5. Korean Statistical Information Service. Housing Census. Available online: https://kosis.kr/eng/statisticsList/statisticsListIndex.do?parentId=I1.1&menuId=M_01_01&vwcd=MT_ETITLE&parmTabId=M_01_01#content-group (accessed on 22 June 2024).
  6. Wu, W.; Skye, H.M. Residential net-zero energy buildings: Review and perspective. Renew. Sustain. Energy Rev. 2021, 142, 110859. [Google Scholar] [CrossRef] [PubMed]
  7. Feng, W.; Zhang, Q.; Ji, H.; Wang, R.; Zhou, N.; Ye, Q.; Hao, B.; Li, Y.; Luo, D.; Lau, S.S.Y. A review of net zero energy buildings in hot and humid climates: Experience learned from 34 case study buildings. Renew. Sustain. Energy Rev. 2019, 114, 109303. [Google Scholar] [CrossRef]
  8. Wells, L.; Rismanchi, B.; Aye, L. A review of Net Zero Energy Buildings with reflections on the Australian context. Energy Build. 2018, 158, 616–628. [Google Scholar] [CrossRef]
  9. Ullah, K.; Prodanovic, V.; Pignatta, G.; Deletic, A.; Santamouris, M. Technological advancements towards the net-zero energy communities: A review on 23 case studies around the globe. Sol. Energy 2021, 224, 1107–1126. [Google Scholar] [CrossRef]
  10. Omar, A.I.; Khattab, N.M.; Abdel Aleem, S.H.E. Optimal strategy for transition into net-zero energy in educational buildings: A case study in El-Shorouk City, Egypt. Sustain. Energy Technol. Assess. 2022, 49, 101701. [Google Scholar] [CrossRef]
  11. Alawode, A.; Rajagopalan, P. Feasibility of net zero energy high rise apartment buildings in Australia. Sol. Energy 2022, 231, 158–174. [Google Scholar] [CrossRef]
  12. Ni, S.; Zhu, N.; Zhang, Z.; Hou, Y.; Li, S. The operational performance of net zero energy wooden structure building in the severe cold zone: A case study in Hailar of China. Energy Build. 2021, 257, 111788. [Google Scholar] [CrossRef]
  13. Nematchoua, M.K.; Nishimwe, A.M.; Reiter, S. Towards nearly zero-energy residential neighbourhoods in the European Union: A case study. Renew. Sustain. Energy Rev. 2021, 135, 110198. [Google Scholar] [CrossRef]
  14. Zhang, X.; Wang, A.; Tian, Z.; Li, Y.; Zhu, S.; Shi, X.; Jin, X.; Zhou, X.; Wei, S. Methodology for developing economically efficient strategies for net zero energy buildings: A case study of a prototype building in the Yangtze River Delta, China. J. Clean. Prod. 2021, 320, 128849. [Google Scholar] [CrossRef]
  15. Panagiotidou, M.; Aye, L.; Rismanchi, B. Optimisation of multi-residential building retrofit, cost-optimal and net-zero emission targets. Energy Build. 2021, 252, 111385. [Google Scholar] [CrossRef]
  16. Ali, H.H.; Al-Rub, F.A.A.; Shboul, B. Evaluation of Near-net-zero-energy Building Strategies: A Case Study on Residential Buildings in Jordan. Int. J. Energy Econ. Policy 2020, 10, 325–336. [Google Scholar] [CrossRef]
  17. Lan, L.; Wood, K.L.; Yuen, C. A holistic design approach for residential net-zero energy buildings: A case study in Singapore. Sustain. Cities Soc. 2019, 50, 101672. [Google Scholar] [CrossRef]
  18. Alajmi, A.; Rodrígueza, S.; Sailor, D. Transforming a passive house into a net-zero energy house: A case study in the Pacific Northwest of the U.S. Energy Convers. Manag. 2018, 172, 39–49. [Google Scholar] [CrossRef]
  19. Ascione, F.; Bianco, N.; Böttcher, O.; Kaltenbrunner, R.; Vanoli, G.P. Net zero-energy buildings in Germany: Design, model calibration and lessons learned from a case-study in Berlin. Energy Build. 2016, 133, 688–710. [Google Scholar] [CrossRef]
  20. Zhou, Z.; Feng, L.; Zhang, S.; Wang, C.; Chen, G.; Du, T.; Li, Y.; Zuo, J. The operational performance of ‘‘net zero energy building”: A study in China. Appl. Energy 2016, 177, 716–728. [Google Scholar] [CrossRef]
  21. Tsalikis, G.; Martinopoulos, G. Solar energy systems potential for nearly net zero energy residential buildings. Sol. Energy 2015, 115, 743–756. [Google Scholar] [CrossRef]
  22. Cellura, M.; Guarinoa, F.; Longoa, S.; Mistretta, M. Energy life-cycle approach in Net zero energy buildings balance: Operation and embodied energy of an Italian case study. Energy Build. 2015, 72, 371–381. [Google Scholar] [CrossRef]
  23. Park, B.R.; Chung, M.H. Analysis of the additional energy-saving potential of residential buildings after mandatory zero-energy buildings to achieve carbon neutrality in South Korea. Build. Environ. 2023, 228, 109908. [Google Scholar] [CrossRef]
  24. Choi, J.; Kee, D.; Lee, J.; Kim, J.J. Understanding heterogeneous consumer preferences for residential zero-energy buildings (ZEBs) in South Korea: A latent class approach. Sustain. Cities Soc. 2023, 97, 104747. [Google Scholar] [CrossRef]
  25. Ji, C.; Hong, T.; Kim, H.; Yeom, S. Effect of building energy efficiency certificate on reducing energy consumption of non-residential buildings in South Korea. Energy Build. 2022, 255, 111701. [Google Scholar] [CrossRef]
  26. Ji, C.; Hong, T.; Kim, H. Statistical analysis of greenhouse gas emissions of South Korean residential buildings. Renew. Sustain. Energy Rev. 2022, 156, 111981. [Google Scholar] [CrossRef]
  27. Kim, K.S.; Yoo, D.C.; Choi, C.; Jang, H.I. Verification of Energy Usage Based on Standard Building Model Development of Low-Rise Residential Buildings in South Korea. Adv. Civ. Eng. 2021, 2021, 6679108. [Google Scholar] [CrossRef]
  28. Jung, Y.; Heo, Y.; Cho, H.; Kang, Y.T.; Kim, Y.; Lee, H. A plan to build a net zero energy building in hydrogen and electricity-based energy scenario in South Korea. J. Clean. Prod. 2023, 397, 136537. [Google Scholar] [CrossRef]
  29. Ji, C.; Choi, M.; Hong, T.; Yeom, S.; Kim, H. Evaluation of the effect of a building energy efficiency certificate in reducing energy consumption in Korean apartments. Energy Build. 2021, 248, 111168. [Google Scholar] [CrossRef]
  30. Munkhbat, U.; Byun, S.Y.; Lee, D.H. A Study on the Prediction of Achieving of Zero Energy Building Certification in an Apartment House according to Early Adoption of Zero-energy Buildings. J. KIAEBS 2021, 15, 313–325. [Google Scholar]
  31. Wang, S.; Tae, S.; Jang, H. Prediction of the Energy Self-Sufficiency Rate of Major New Renewable Energy Types Based on Zero-Energy Building Certification Cases in South Korea. Sustainability 2021, 13, 11552. [Google Scholar] [CrossRef]
  32. Lee, H.; Choi, M.; Lee, R.; Kim, D.; Yoon, J. Energy performance evaluation of a plus energy house based on operational data for two years: A case study of an all-electric plus energy house in Korea. Energy Build. 2021, 252, 111394. [Google Scholar] [CrossRef]
  33. Yang, S.; Cho, H.M.; Yun, B.Y.; Hong, T.; Kim, S. Energy usage and cost analysis of passive thermal retrofits for low-rise residential buildings in Seoul. Renew. Sustain. Energy Rev. 2021, 151, 111617. [Google Scholar] [CrossRef]
  34. Kim, Y.; Yu, K.H. Study on the Certification Policy of Zero-Energy Buildings in Korea. Sustainability 2020, 12, 5172. [Google Scholar] [CrossRef]
  35. Kwag, B.C.; Han, S.; Kim, G.T.; Kim, B.; Kim, J.Y. Analysis of the Effects of Strengthening Building Energy Policy on Multifamily Residential Buildings in South Korea. Sustainability 2020, 12, 3566. [Google Scholar] [CrossRef]
  36. Lee, J.; Shepley, M.M.; Choi, J. Exploring the localization process of low energy residential buildings: A case study of Korean passive houses. J. Build. Eng. 2020, 30, 101290. [Google Scholar] [CrossRef]
  37. Suh, H.S.; Kim, D.D. Energy performance assessment towards nearly zero energy community buildings in South Korea. Sustain. Cities Soc. 2019, 44, 488–498. [Google Scholar] [CrossRef]
  38. Song, J.; Oh, S.-D.; Song, S.J. Effect of increased building-integrated renewable energy on building energy portfolio and energy flows in an urban district of Korea. Energy 2019, 189, 116132. [Google Scholar] [CrossRef]
  39. Eum, J.; Kim, Y. Applicability analysis of residential energy storage system (ESS) using Homer in Korea. In Proceedings of the Grand Renewable Energy 2018 Proceedings, Pacifico Yokohama, Yokohama, Japan, 17–22 June 2018. [Google Scholar]
  40. Kim, T.H.; Jeong, Y.S. Analysis of Energy-Related Greenhouse Gas Emission in the Korea’s Building Sector: Use National Energy Statistics. Energies 2018, 11, 855. [Google Scholar] [CrossRef]
  41. Kim, S.-Y.; Choi, H.-S.; Eum, J.-H. Energy-Independent Architectural Models for Residential Complex Plans through Solar Energy in Daegu Metropolitan City, South Korea. Sustainability 2018, 10, 482. [Google Scholar] [CrossRef]
  42. Park, K.S.; Kim, M.J. Energy Demand Reduction in the Residential Building Sector: A Case Study of Korea. Energies 2017, 10, 1506. [Google Scholar] [CrossRef]
  43. Oh, J.; Hong, T.; Kim, H.; An, J.; Jeong, K.; Koo, C. Advanced Strategies for Net-Zero Energy Building: Focused on the Early Phase and Usage Phase of a Building’s Life Cycle. Sustainability 2017, 9, 2272. [Google Scholar] [CrossRef]
  44. Cheong, C.H. Appropriate Size of a Net Zero-Energy Multi-Family Housing using PV system. J. KIAEBS 2017, 11, 113–120. [Google Scholar]
  45. Kim, J.H.; Kim, H.R.; Kim, J.T. Analysis of Photovoltaic Applications in Zero Energy Building Cases of IEA SHC/EBC Task 40/Annex 52. Sustainability 2015, 7, 8782–8800. [Google Scholar] [CrossRef]
  46. Park, D.J.; Yu, K.H.; Yoon, Y.S.; Kim, K.H.; Kim, S.S. Analysis of a Building Energy Efficiency Certification System in Korea. Sustainability 2015, 7, 16086–16107. [Google Scholar] [CrossRef]
  47. Lim, J.H.; Kim, S.I.; Song, S.Y. Improvement of Design Criteria in Heating and Cooling Equipment According to the Consolidation of Design Standard for Energy Saving in Apartment Buildings of Korea. J. Korean Sol. Energy Soc. 2014, 34, 89–97. [Google Scholar] [CrossRef]
  48. Lee, K.-H.; Lee, J.-K.; Yoon, E.-S.; Joo, M.-C.; Lee, S.-M.; Baek, N.-C. Annual measured performance of building-integrated solar energy systems in demonstration low-energy solar house. J. Renew. Sustain. Energy 2014, 6, 042013. [Google Scholar] [CrossRef]
  49. Ministry of Land, Infrastructure and Transport. Energy Saving Design Standards for Buildings. Available online: http://www.law.go.kr/ (accessed on 22 June 2024).
  50. Oh, T.-K.; Lee, D.; Park, M.; Cha, G.; Park, S. Three-Dimensional Visualization Solution to Building-Energy Diagnosis for Energy Feedback. Energies 2018, 11, 1736. [Google Scholar] [CrossRef]
  51. Kim, C.S. The Influence of Unit Plan Shapes to the Energy Eciency of Collective Housing Simulated by ECO2 Software. Korea Inst. Ecol. Archit. Environ. J. (KIEAE J.) 2015, 15, 89–94. [Google Scholar]
  52. Lee, A.R.; Kim, J.G.; Kim, J.H.; Jeong, H.G.; Jang, C.Y.; Song, K.D. Comparing the actual heating energy with calculated energy by the amended standard building energy rating system for apartment buildings. Korea Inst. Ecol. Archit. Environ. J. (KIEAE J.) 2015, 15, 103–107. [Google Scholar]
  53. Kwon, J.H.; Jang, H.I.; Kim, M.K.; Park, H.S.; Suh, S.J. Comparison on the Annual Energy Demand by Building Energy Assessment Tool and Dynamic Energy Simulation. In Proceedings of the 2012 Summer Conference of the Society of Air-Conditioning and Refrigerating Engineers of Korea, Pyeongchang, Republic of Korea, 27–29 June 2012; pp. 363–366. [Google Scholar]
  54. Kim, S.H.; Kwak, Y.H.; Kim, C.S. The Analysis on Energy Performance of Collective Housing using ECO2 and DesignBuilder Softwares. Korea Inst. Ecol. Archit. Environ. J. (KIEAE J.) 2018, 18, 47–54. [Google Scholar]
  55. Seoul Metropolitan Government. Standards for Installation and Management of Solar Power Facilities in Seoul. Available online: https://www.seoul.go.kr (accessed on 22 June 2024).
  56. National Agency for Administrative City Construction. Solar Power Facility Installation Guidelines. Available online: https://naacc.go.kr (accessed on 22 June 2024).
  57. Korea Energy Agency. 2021 Standard Unit Price for Renewable Energy Sources. Available online: https://www.knrec.or.kr/biz/pds/pds/view.do?no=303 (accessed on 22 June 2024).
  58. Korea Energy Agency. 2012 Standard Unit Price for Renewable Energy Sources. Available online: https://www.knrec.or.kr/biz/pds/businoti/view.do?no=598 (accessed on 22 June 2024).
  59. Korea Energy Agency. 2011 Standard Unit Price for Renewable Energy Sources. Available online: https://www.knrec.or.kr/biz/pds/businoti/view.do?no=395 (accessed on 22 June 2024).
Figure 1. Flowchart of the research.
Buildings 14 02522 g001
Figure 2. Flowchart of ECO2 building energy simulations.
Buildings 14 02522 g002
Figure 3. Schematic drawings of the case study building: (a) floor plan, (b) elevation (unit: mm).
Buildings 14 02522 g003
Figure 4. Source energy intensity for variations in the BAPV roof area.
Buildings 14 02522 g004
Figure 5. Source energy intensity for variations in the BIPV facade area.
Buildings 14 02522 g005
Figure 6. Source energy intensity for variations in the BAPV roof efficiency.
Buildings 14 02522 g006
Figure 7. Source energy intensity for variations in the BIPV facade efficiency.
Buildings 14 02522 g007
Figure 8. ESSR variations according to the BIPV facade area and BAPV roof area.
Buildings 14 02522 g008
Figure 9. Relationship between the BAPV roof area and the y intercept in Figure 8.
Buildings 14 02522 g009
Figure 10. ESSR variations for the ratio between total PV capacity and source energy consumption.
Buildings 14 02522 g010
Figure 11. Relationship between BAPV roof area and y intercept in Figure 10.
Buildings 14 02522 g011
Figure 12. Images of final design of the case study building: (a) elevation, (b) BIPV facade, (c) BAPV roof.
Buildings 14 02522 g012
Figure 13. Floor plan of the final design of the case study building (unit: mm).
Buildings 14 02522 g013
Table 1. Summary of previous research on energy-efficient buildings in Republic of Korea.
AuthorMethodBuilding TypeIndicatorVariablesType of Renewable EnergyConclusion
Bo Rang Park et al. [23]SimulationResidential buildingEnergy use intensity
  • Infiltration
  • Lighting power density
  • Heating system efficiency
  • Plug-load density
-
  • Achieving carbon neutrality requires a comprehensive approach beyond regulating individual technology elements.
Jihye Choi et al. [24]SurveyResidential buildingChoice
probability
  • Respondents
  • Subsidy
  • Building energy level
  • Cost-related factors are the most significant in terms of public acceptance of zero-energy residential building.
Changyoon Ji et al. [25]StatisticsNon-residential
building
Energy use intensity
  • Building Energy Efficiency Certification (BEEC)
-
  • Improving BEEC is suggested to better account for all energy uses and enhance its effectiveness in reducing greenhouse gas emissions.
Changyoon Ji et al. [26]StatisticsResidential
building
Greenhouse gas (GHG) emissions
  • Building type
  • Year it was built
  • Climate region
  • Thermal conductivity of the envelope
-
  • Strengthening BEEC has reduced greenhouse gas emissions from heating energy use in new buildings, but it has not significantly impacted on baseload and cooling energy emissions.
KyungSoo Kim et al. [27]Survey
Statistics
Simulation
Residential BuildingEnergy consumption
  • Building Type
  • Building Size
  • Built Year
  • Window-Wall-Ratio
  • Building Orientation
  • Aspect Ratio
-
  • The developed standard building model showed a high level of efficiency and reliability in predicting energy consumption, with a total energy consumption error rate of 12.67%.
Yujun Jung et al. [28]SimulationResidential buildingEnergy and economic metrics;
life cycle performance
  • Air tightness
  • Occupants
  • Window–wall ratio
  • Hydropower
  • Solar power
  • The electricity-based energy scenario has better energy and environmental performance compared to the hydrogen-based scenario, achieving energy savings of 62% and 53%, respectively.
Changyoon Ji et al. [29]StatisticsResidential
building
Energy use intensity
  • Climate region
  • Floor area
  • Building energy certificate
-
  • The BEEC effectively reduces heating energy consumption, but its impact on electricity use is insignificant.
Munkhbat Undram et al. [30]SimulationResidential
building
ESSR
  • Photovoltaic (PV) area
  • Building area
  • Solar power
  • District heating apartments can achieve Zero-Energy Building (ZEB) Grade 5 with rooftop PV installations alone, but individual apartments require additional measures to reduce primary energy consumption.
Seongjo Wang et al.
[31]
SimulationNon-residential buildingESSR
  • Building size
  • Cooling/heating capacity
  • Renewable energy capacity
  • Solar power
  • Fuel cell
  • Geothermal
  • ESSR prediction formulas are proposed to design optimal renewable energy systems for zero-energy buildings.
Hyomun Lee et al. [32]Field testResidential buildingEnergy
generation
  • Season
  • Solar power
  • Solar thermal
  • The house consumed 7368.95 kWh/yr and generated 11,439.68 kWh/yr through roof-integrated photovoltaics (RIPVs), achieving a 35.58% annual energy surplus.
Sungwoong Yang et al. [33]Survey
simulation
Residential buildingEnergy
consumption
  • Air tightness
  • Lighting power density
  • Thermal conductivity of the envelope
  • Heating system efficiency
-
  • Applying energy-saving technologies can lead to substantial energy savings and improved energy efficiency in low-rise residential buildings.
Yeweon Kim et al. [34]ReviewResidential and non-residential
buildings
--
  • Ground-source heat pumps generally showed higher self-sufficiency rates than water-source heat pumps.
Byung Chang Kwag et al. [35]SimulationResidential
building
Heat loss form factor;
energy load;
energy use intensity
  • Building size
  • Envelope thermal conductivity
  • Household location
  • Lighting power density
  • Heating system efficiency
-
  • Improving the boiler efficiency is the most effective measure for reducing energy consumption, while enhancing the building envelope has the least impact.
Joohyun Lee et al. [36]SimulationResidential
building
Energy load;
energy use intensity
  • Passive house
  • Conventional house
-
  • It is important to consider the local climate and construction practices in achieving energy efficiency of a passive house.
Hye Soo Suh et al. [37]SimulationCommunity buildingEnergy consumption
  • Thermal conductivity of the envelope
  • Air tightness
  • Lighting power density
  • Ventilation efficiency
  • Cooling/heating system efficiency
  • Solar power
  • Geothermal
  • Solar thermal
  • Combining passive and active design strategies with renewable energy systems can significantly improve energy performance and achieve nearly zero-energy targets for community buildings.
Jeonghun Song et al. [38]SimulationResidential and non-residential
buildings
Building
energy
performance
  • Building type
  • Renewable energy type
  • Solar power
  • Fuel cell
  • Geothermal
  • Solar thermal
  • Integrating renewable energy sources like photovoltaics, ground-source heat pumps, and fuel cells can reduce electricity and gas supply from the grid by 17% and 3%, respectively.
Jiyoung Eum et al. [39]SimulationResidential buildingTotal net
present cost
  • Energy storage system (ESS) capacity/price
  • PV capacity/price
  • Grid price
  • Solar power
  • ESS prices should decrease significantly to be economically viable, especially with government support and the implementation of time-of-use (TOU) rates.
Tae-Hyoung Kim et al. [40]StatisticsResidential and non-residential
buildings
Greenhouse gas emissions
  • Climate region
  • Energy source
  • Year
-
  • This study suggests that the building sector has significant potential for energy efficiency improvements and greenhouse gas emission reductions.
Sung-Yul Kim et al. [41] Residential buildingOptimum
solar power generation
  • Building design
  • Subsidy
  • Initial cost
  • Operation cost
  • Solar power
  • Economic analyses show that connecting solar power generation capacity from a zero-energy perspective is more effective than maximizing the capacity based on the building structure.
Kwon Sook Park et al. [42]StatisticsResidential buildingEnergy
consumption
  • Number of family members
  • Building type
  • Climate condition
-
  • Improving energy performance in existing buildings, strengthening building design criteria, and revitalizing Korea’s energy-saving policies are essential to reduce energy demand and GHG emissions in the residential buildings sector.
Jeongyoon Oh et al. [43]ReviewResidential and non-residential
buildings
  • Passive strategies
  • Active strategies
-
  • This study proposes integrating and optimizing the passive and active strategies in the early phase of a building’s life cycle and real-time monitoring during the usage phase to achieve net-zero energy buildings.
Chang Heon Cheong [44]SimulationResidential buildingEnergy
reduction
  • Locations of PV panels
  • Building story
  • Solar power
  • To achieve net-zero energy in apartment buildings, an advanced energy mix is necessary. The policy for zero-energy buildings may only be feasible for detached houses.
Jin-Hee Kim et al. [45]StatisticsResidential and non-residential
buildings
Energy
generation
  • Energy demand
  • PV installation type
  • PV cell type
  • Solar power
  • Solar thermal
  • PV systems are essential for achieving net-zero energy in buildings, but their application requires careful consideration of the economic viability, architectural integration, and surrounding environment.
Duk Joon Park et al. [46]ReviewResidential and non-residential
buildings
  • Number of energy certified buildings
  • Energy performance
-
  • The BEEC has influenced gas and district heating consumption in residential buildings and shown a decreasing trend in primary energy consumption for non-residential buildings since its implementation.
Lim Jae-Han et al. [47]SimulationResidential
building
Energy load
  • Thermal conductivity of the envelope
  • Air tightness
  • Ventilation efficiency
  • Heating system efficiency
-
  • Enhancing insulation, window performance, ventilation, and air tightness can significantly reduce energy consumption in apartment buildings.
Kyoung-ho Lee et al. [48]Field testResidential
building
Energy
generation
  • Thermal demands
  • Outdoor air temperature
  • Solar irradiance
  • Solar power
  • Solar thermal
  • It is important to integrate solar energy systems in buildings to achieve energy savings and improve the overall energy efficiency.
  • The total annual solar fraction of the solar heating system was 69.7%.
Table 2. Description of the case study building.
CategorySpecification
Floor to Ceiling2.3 m
Floor to Floor3.2 m
Dwelling Unit AreaTotal 1092 m2
39 m2/unit × 7 units/floor × 4 floor
Roof Area306 m2
Front Exterior Wall Area530 m2
Front Exterior Wall Window Area of a Dwelling Unit(Living Space) Window 1: 3.8 m2/Window 2: 2.9 m2
(Mechanical Room) Louver Window: 1.6 m2
Number of FloorsFive-Story Building
First floor: Parking Lots, Lobby, Monitoring Room
Second~Fifth Floor: Dwelling Units (Seven Units Per Floor)
Main Building MaterialReinforced Concrete
Target ESSROver 60% (ZEB Grade 3)
Table 3. Baseline modeling inputs.
ElementCategorySpecification
Exterior WallThermal Transmittance (U-value)0.167 W/(m2K)
WindowThermal Transmittance (U-value)1.00 W/(m2K)
Slab on Grade FloorThermal Transmittance (U-value)0.17 W/(m2K)
RoofThermal Transmittance (U-value)0.15 W/(m2K)
Space HeatingTypeRadiant Floor Heating
Water TemperatureSupply 80 °C/Return 60 °C
Efficiency [%]91% (Decentralized Natural Gas Condensing Boiler)
Domestic Hot WaterTypeNatural Gas Condensing Boiler
Water TemperatureSupply 80 °C/Return 60 °C
VentilationTypeEnergy Recovery Ventilator
Capacity (Air Change per Hour)0.5
EfficiencyHeating 70%
Cooling 45%
LightingLighting Power Density7 W/m2
InfiltrationAir Change per Hour6
Table 4. Description of the options for the sensitivity analysis.
ParameterOptions
BAPV RoofArea [m2]30, 60, 90, 120, 150, 180, 210, 240, 270, 300
Efficiency [%]10, 12, 14, 16, 18, 20, 22, 24
BIPV FacadeArea [m2]16, 32, 48, 64, 80, 96, 112, 128, 144, 160
Efficiency [%]10, 12, 14, 16, 18, 20, 22, 24
Table 5. Simulation results of the baseline model.
CategorySpace HeatSpace CoolHot WaterLightingVentilationTotal
Building Energy Load
[kWh/m2· yr]
51.50.030.712.80.095.0
Site Energy Consumption
[kWh/m2· yr]
97.40.034.012.817.5161.7
Source Energy Consumption
[kWh/m2· yr]
111.90.037.935.148.1233.0
Table 6. Simulation results for various combinations of BAPV roofs and BIPV facades.
CASESurface Area [m2]PV Capacity [kW]Source Energy Generation [kWh/m2·yr]ESSR [%]
BAPV
Roof
BIPV
Facade
BAPV
Roof
BIPV
Facade
BAPV
Roof
BIPV
Facade
Total
Case 13050067815.0124.8139.8 60.0%
Case 260440126830.0109.8139.8 60.0%
Case 390380175944.994.9139.8 60.0%
Case 4120320235059.979.9139.8 60.0%
Case 5150260294074.964.9139.8 60.0%
Case 6180200353189.949.9139.8 60.0%
Case 72101404122104.835.0139.8 60.0%
Case 82231144318111.428.5139.8 60.0%
Case 9240804612119.919.9139.8 60.0%
Case 1027020523134.94.9139.8 60.0%
Case 112800540139.80.0139.8 60.0%
Case 123000580149.90.0149.9 64.3%
Table 7. Standard price per 1 kW for PV systems released by KEA.
Type of PV SystemYear
201120122021
BAPV Roof1000 KRW/kW565049721816
USD/kW423837291362
BIPV Facade1000 KRW/kW13,0559553-
USD/kW97917165-
(Exchange rate: KRW 1000 = USD 0.75, Google Finance, 8 March 2024).
Table 8. Unit cost options for a BIPV facade.
Unit Cost OptionOption 1Option 2Option 3Option 4Option 5Option 6Option 7
BAPV Roof [USD]1362136213621362136213621362
BIPV Facade [USD]6818459531362204327244086
Ratio0.50.620.71.01.52.03.0
Table 9. The resulting initial cost for various combinations and cost options, with the minimum total value highlighted in yellow.
CaseBAPV Roof
[USD]
Option 1Option 2Option 3Option 4Option 5Option 6Option 7
BIPV Facade
[USD]
Total
Cost
[USD]
BIPV Facade
[USD]
Total
Cost
[USD]
BIPV Facade
[USD]
Total
Cost
[USD]
BIPV Facade
[USD]
Total
Cost
[USD]
BIPV Facade
[USD]
Total
Cost
[USD]
BIPV Facade
[USD]
Total
Cost
[USD]
BIPV Facade
[USD]
Total
Cost
[USD]
Case 17900 52,924 60,824 65,631 73,530 74,082 81,982 105,848 113,748 158,773 166,672 211,697 219,597 317,545 325,445
Case 215,786 46,569 62,354 57,750 73,535 65,186 80,972 93,138 108,923 139,707 155,492 186,276 202,061 279,413 295,199
Case 323,685 40,245 63,930 49,908 73,593 56,334 80,019 80,490 104,175 120,735 144,421 160,981 184,666 241,471 265,156
Case 431,585 33,869 65,454 42,000 73,585 47,409 78,994 67,737 99,322 101,606 133,191 135,475 167,060 203,212 234,797
Case 539,484 27,513 66,998 34,119 73,603 38,513 77,997 55,027 94,511 82,540 122,025 110,054 149,538 165,080 204,565
Case 647,370 21,158 68,528 26,238 73,608 29,617 76,987 42,316 89,686 63,474 110,845 84,632 132,003 126,948 174,319
Case 755,270 14,824 70,094 18,383 73,653 20,750 76,020 29,648 84,918 44,471 99,741 59,295 114,565 88,943 144,213
Case 858,687 12,070 70,757 14,968 73,655 16,896 75,582 24,140 82,827 36,210 94,897 48,281 106,967 72,421 131,107
Case 963,170 8458 71,627 10,489 73,658 11,839 75,009 16,916 80,085 25,374 88,543 33,832 97,001 50,747 113,917
Case 1071,056 2071 73,127 2568 73,624 2899 73,954 4142 75,198 6213 77,269 8284 79,340 12,426 83,482
Case 1173,687 0 73,687 0 73,687 0 73,687 0 73,687 0 73,687 0 73,687 0 73,687
Table 10. Simulation results for various installation areas of the BAPV roof and BIPV facade.
CategoryBAPV Roof Area [m2]BIPV Facade Area [m2]
100150200250300350400450500
Total PV Capacity
[kW]
1504552606876839199107
18051586674828997105113
210576472808895103111119
2406269778593100108116124
Total Source Energy Generation [kWh/m2. yr]15099.9112.3124.8137.3149.8162.3174.8187.2199.7
180114.9127.3139.8152.3164.8177.3189.8202.2214.7
210129.8142.2154.7167.2179.7192.2204.7217.1229.6
240144.9157.3169.8182.3194.8207.3219.8232.2244.7
ESSR [%]15042.948.253.658.964.369.775.080.485.7
18049.354.760.065.470.776.181.486.892.2
21055.761.166.471.877.182.587.993.298.6
24062.267.572.978.283.688.994.399.7105.0
Table 11. Details of the final design specifications of the case study building.
Energy Efficiency MeasureOptions
Dwelling Unit InformationFloor Area of Units [m2]4948433936
Number of Dwelling Units233164
Passive
System
Building Envelop: Opaque ElementThermal Transmittance (U-value)0.137 W/(m2K)
Building Envelop: WindowThermal Transmittance (U-value)0.693 W/(m2K)
InfiltrationAir Change per Hour5.50
Active
System
Interior LightingLighting Power Density4.67 W/m2
Space CoolingTypeSpace Cooling Not Installed
Space HeatingTypeRadiant Floor Heating
Efficiency91.1% (Natural Gas Boiler)
Domestic Hot WaterTypeNatural Gas Boiler
Water TemperatureSupply 80 °C/Return 60 °C
VentilationTypeMechanical Ventilator Not Installed
Energy Generation SystemBAPV RoofArea240 m2 (52 kW = 500 Wp × 104 panels
Efficiency21.6%
BIPV FacadeArea138 m2 (17.2 kW = 123 Wp ∗ 140 panels)
Efficiency12.3%
Table 12. The official simulation results of the Zero-Energy Building Certification for the case study building.
CategorySpace HeatSpace CoolHot WaterLightingVentilationTotalEnergy Generation
Building Energy Load
[kWh/m2.yr]
63.6030.78.50102.80
Site Energy Consumption
[kWh/m2.yr]
126.2032.78.50167.456.9
Source Energy Consumption
[kWh/m2.yr]
145.9034.323.40203.6156.6
Disclaimer/Publisher’s Note: The statements, opinions and data contained in all publications are solely those of the individual author(s) and contributor(s) and not of MDPI and/or the editor(s). MDPI and/or the editor(s) disclaim responsibility for any injury to people or property resulting from any ideas, methods, instructions or products referred to in the content.