Article

Changing Rules in Subway Tunnel Thermal Environment and Comprehensive Utilization of Waste Heat

School of Environment and Municipal Engineering, Qingdao University of Technology, Qingdao 266033, China
*
Author to whom correspondence should be addressed.
Buildings 2024, 14(8), 2524; https://doi.org/10.3390/buildings14082524
Submission received: 4 July 2024 / Revised: 10 August 2024 / Accepted: 13 August 2024 / Published: 16 August 2024
(This article belongs to the Special Issue Recently Advances in the Thermal Performance of Buildings)

Abstract

:
The deteriorating thermal environment of tunnels and the increase in energy consumption of environmental control systems has become highlights in the subway field. In existing research related to analysis of subway tunnel thermal environments and thermal accumulation; there is no predictive law that accounts for thermal accumulation or the long-term change in subway tunnel thermal environments. In this study, a combination of simulations and experiments is used. First, the long-term evolution of tunnel thermal environments with and without thermal interference are predicted and analyzed. Then, the changes in the tunnel thermal environment after the use of capillary heat exchangers are explored. The research results indicate that the model of the system has high accuracy and reliability. When there is a capillary heat exchanger installed in the subway tunnel, the anti-seasonal heat storage characteristics of the system result in the tunnel temperature increasing significantly in summer and decreasing significantly in winter, with a small decrease in the average annual temperature. This study provides a theoretical reference for environment-based subway tunnel construction and the comprehensive utilization of tunnel waste heat.

1. Introduction

Subway systems have become increasingly popular in the transportation field due to their convenience, safety, comfort, cleanliness, and hygienic conditions, but their energy consumption has been an increasing concern. The London Underground has a history longer than 150 years and has become the largest consumer of electricity in London [1]. In the future, the Chinese subway is predicted to expand to 80 cities, and its total length is predicted to reach 14,000 km. It is estimated that the annual power consumption of the Chinese subway will reach 40 billion kWh, accounting for more than 5‰ of the country’s total power consumption.
More and more studies have shown that with the long-term continuous operation of the subway system, the deterioration of subway tunnel thermal environment has become a common phenomenon. The hazards of the deterioration of subway tunnel thermal environment are specifically manifested in the survival of underground creatures, the stability of tunnel envelope structure, the comfort for train passengers, and the safety of the subway system. Obtaining stable and safe thermal environments in subway tunnels has become a popular research goal in the field of subway technology.
Beginning in the 1870s, scholars from Germany, Japan, and other countries successively conducted field experiments on subway tunnels [2,3], mastering field test data to explore the changing rules in tunnel thermal environments. The SES [4] described the airflow and pressure distribution of the entire tunnel under the subway piston effect, which provided a theoretical basis for the design of the tunnel ventilation system. In order to study the temperature at different tunnel locations in winter, KJ Jun et al. [5] investigated the Gangwon-do tunnel, the coldest in Korea. It was found that the lining temperature changes with the air temperature within a certain time interval. Bidarmaghz et al. [6] simulated the tunnel GHEs, the tunnel air, and the surrounding ground through the finite element analysis. The numerical results showed that the groundwater flow velocity has an important influence on the underground temperature distribution. To study the feasibility of using an ASHP system to recover waste heat from subway tunnels, Ninakas et al. [7,8] conducted field experiments at the Glasgow subway station and found that the annual temperature variation inside Glasgow tunnels was 2.6 °C and the energy consumption could be reduced by 75%. Krasyuk et al. [9] studied the impact of the air velocity caused by the piston effect on the Novosibirsk subway terminal Garin-Mikhailovsky, it was found that changing the speed of the train entering and leaving the station could reduce the air velocity, thereby reducing the impact on the tunnel air temperature. By studying the new subway in Stockholm, Olander et al. [10] found that natural ventilation sent a lot of heat to tunnels and stations.
Based on subway design experience, field testing, and model verification, the SEDH [11] studied the influence of train operation time, tunnel environment and system location on temperature, humidity, wind speed, and air pressure change rate. To explore the feasibility of using subway waste heat via WSHP, scholars [12,13] conducted 4 months of on-site monitoring at the Glasgow subway station, and the study showed that energy consumption was reduced by 60%. MT Keet al. [14] combined SES and CFD software to simulate a subway environmental control system and discussed the subway tunnel thermal environment. William Lassow et al. [15] used programming to calculate and analyze the influence of factors such as number of train pairs, outdoor temperature, outdoor humidity, and deep soil heat storage on the tunnel thermal environment. Zeng Y et al. [16] used similarity theory to build a model to study the influence of the temperature of a lower entry tunnel on the airflow and the tunnel temperature based on a specific tunnel section. The results showed that a higher wind speed and lower temperature cause the tunnel temperature to decrease rapidly. Zhang et al. [17] used the response surface model to analyze the influence of five different factors (passenger number, carriage weight, regenerative braking system efficiency, soil conductivity, and thermal capacity) on tunnel temperature. Zhang et al. [18] adopted the experimental method and monitored the tunnel wall and air temperature in 5 subway lines for more than 1 year. The temperature profiles were obtained, and it was revealed that the temperature distribution within a tunnel is not sensitive to the length of tunnel but susceptible to ventilation condition. Zhang et al. [19] combined field testing and numerical investigation to analyze the thermal environment of tunnels with air layer structures and found that the numerical results regarding the temperature fields within the tunnel are in good agreement with the measured results and that a high ground temperature tunnel with an air layer structure has a preferable thermal insulation effect. Yang et al. [20] measured and studied the thermal environment of Harbin Metro Line 1/3 and the entrance and exit lines. The heat production of train operation and annual heat storage heat were calculated, and the results showed that climatic conditions, burial depth, operating phase of the tunnel, passenger flow, and driving interval have an impact on the thermal environment of the tunnel.
In view of the deterioration of the subway tunnel thermal environment, scholars have conducted a large amount of research on how to solve the problem of tunnels overheating. The main solutions can be divided into the following categories. Passive methods are applicable to subways older than 100 years, mainly using the energy storage characteristics of the subway tunnels’ surrounding rock. The offset method uses natural or mechanical means to offset the heat in the tunnel environment through generation of heat sinks. The exhaust method uses natural or mechanical ventilation to provide an outlet for the tunnel heat and improve the quality of the tunnel’s thermal environment [17,21,22]. Comprehensive utilization of tunnel waste heat, i.e., using the exhaust heat or subway tunnel waste heat as a heat source for ground-level buildings, can cool the subway tunnel while dissipating heat waste from the tunnel. H. Brandl et al. [23] first proposed using ground source heat pumps to absorb heat through a conversion tunnel to heat nearby schools. According to Ji et al. [24], based on the validated system simulation module, the coupling effect between the lining heat exchanger operation and the tunnel thermal environment was analyzed under different tunnel environment conditions.
With the birth of new materials such as capillary, there is another feasible technical solution. Due to the small diameter, close spacing, softness, and corrosion resistance, capillary tubes can be laid following the shape of the wall surface. Therefore, large heat exchange areas and good heat exchange effects can be obtained. Capillaries can be flexibly applied to a variety of areas. These devices are placed in the second lining structures of subway tunnels. Our team members propose installing a capillary heat exchanger between the primary lining and the secondary lining of the subway tunnel to act as the front-end heat exchanger of a ground-source heat pump system [25,26], as shown in Figure 1. Not only should this reduce the tunnel heat and reduce tunnel thermal pollution—it should also realize the comprehensive utilization of waste heat.
The research on capillary heat exchangers has made the following progress. Liu et al. [27] proposed a one-dimensional simplified plate heat calculation method for capillary heat exchangers (CHE) based on surface heat sources, established a CHE heat transfer model, and verified the model. The results showed that the maximum error of the model was 8.79%. Ren et al. [28] conducted a single-factor analysis to investigate the key design parameters of tunnel lining CHEs, the results showed that the tube length of CHE should be kept within the range of 3–5 m, and the tube spacing should be maintained at 20–30 mm. Tong et al. [29] used the orthogonal experimental method to determine the key design parameters affecting the subway source heat pump system and optimized the system design using a multifactor analysis method. They found that the key design parameters affecting the subway source heat pump system were the cooling-to-heating-load ratio and capillary flow velocity. Ji et al. [30] analyzed the heat transfer performance of a tunnel lining CHE for an entire year under the typical conditions of an actual project, and the proposed model was verified. Tong et al. [31] confirmed the excellent heat transfer performance and high operating efficiency of CHEs through experimental measurements and analysis. Ji et al. [32] established a numerical simulation model for tunnel lining CHEs and analyzed the influence of groundwater seepage on the heat transfer characteristics of tunnel lining CHEs. The research results showed that an increase in groundwater seepage velocity led to an initial expansion and subsequent contraction of the thermal impact range caused by CHEs.
Currently, research studies using numerical simulations and model verifications all simplify internal factors. The majority of these studies have not involved theoretical research on the laws of subway tunnel thermal pollution. However, subway tunnel thermal pollution is a hidden factor, so a long-term systematic mechanistic study is needed.
This article chooses an operating station from Qingdao Metro as the research target and conducts long-term continuous data monitoring. First, changes in the tunnel thermal environment after long-term operation of the subway trains are explored. Then, the laws of the tunnel thermal environment during different periods of subway operation are analyzed. Which is achieved by adding a new tunnel air module and a new simulation system in TRNSYS 16.1. This provides a theoretical basis for improving the long-term subway tunnel thermal environment and solving the tunnel thermal pollution. Finally, capillary heat exchangers are proposed as a solution to the subway tunnel heat waste problem; the capillary heat exchanger uses circulating water as the medium; and due to the much higher heat dissipation capacity of water cooling compared to air cooling, the cooling effect of the capillary heat exchanger is better. At the same time, considering the thermal storage and hysteresis effect of the surrounding rock itself, the system can also perform off-season cold and heat storage to achieve comprehensive utilization of waste heat. In winter, the capillary tube absorbs the thermal energy of the tunnel surrounding rock and tunnel air through its circulating medium and uses the heat pump to raise the temperature level for heating above ground buildings. At the same time, it eliminates the thermal energy inside the tunnel, reduces the temperature inside the tunnel, and can be used in summer; In summer, the chilled water at the end of the user’s air conditioning system absorbs heat inside the building and flows back into the capillary network through the heat pump unit. The front-end heat exchanger of the capillary network releases some of the heat and stores it in the surrounding rock, which can be used for heating in winter; Another part of the heat can be released into the atmosphere through auxiliary cold sources. These can realize energy savings, emission reduction and sustainable development of the subway environmental control system.

2. Method

In order to study the long-term variation law of temperature in interval tunnels, a combination of numerical simulation and experimental verification was adopted. Taking a certain operating station of Qingdao Metro as the research object, long-term continuous data monitoring was conducted, and the simulation model was validated through actual measurement data. Then, the long-term thermal environment changes of tunnels with and without capillary heat exchangers were further analyzed through simulation, and the soil thermal pollution situation was predicted and analyzed. The main software for numerical simulation is TRNSYS. Next, the various modules of the subway source heat pump system will be introduced to provide theoretical basis for subsequent simulation research.

2.1. Tunnel Air Temperature Module

At present, there is no corresponding module for calculating the tunnel air temperature in TRNSYS, and there is also no existing method for calculating the tunnel air temperature in a time-dependent dynamic simulation. We compiled a tunnel air temperature module to calculate the interval tunnel air temperature after long-term operation of the subway system.
The main sources of heat [27,33] in subway tunnels are mainly divided into the following categories, as shown in Figure 2.
In the tunnel air temperature module, the main source of heat in subway tunnels is calculated using the following formulas:
  • Heat generated by trains starting from rest
Direct contact between the vehicle shaft and the bearing produces the greatest frictional resistance when the train begins moving. The heat produced when overcoming the starting resistance can be calculated according to the following formula [34]:
Q 1 = 9.8 r 1 W L 1
2.
Heat generated by trains during acceleration and braking
Studies have shown that most of the electrical energy consumed by trains is converted into kinetic energy to increase the operating speed during the acceleration phase. The heat generated by the acceleration resistance is approximately 50% [35] of the braking heat, and the regenerative braking rate of the train is 0.5 [36].
Q b = 1.5 × 1 0.5 V 1 2 V 2 2 W / 2
3.
Heat generated by train driving
A train travels at a constant speed after accelerating to the maximum designed speed. At this point, most of the resistance originates from the frictional resistance of the rails and the air resistance that hinders the progress of the train [37].
R 2 = 1.32 + 0.0164 V 3 + 0.028 + 0.0078 n 1 W × V 3 2
Q x = 9.8 × 0.001 r 2 W L 2
4.
Heat generated by air-conditioning units
The air-conditioning load of a subway train includes the load of the passengers and the lighting. Therefore, the heat generation of the air-conditioning units of the train only needs to include the heat dissipation of the condenser. It can be calculated by the following formula [34]:
Q k = 1000 M × 2 n t
5.
Heat generated by auxiliary equipment
Generally, a subway train is equipped with two auxiliary motors that are relatively stable during operation. This heat can be calculated by the following formula [34]:
Q f = i = 1 n 0.239 M g f η
6.
Heat generated by lighting equipment
The heat dissipation of the lighting equipment cannot be ignored. The lighting in the interval tunnel is generally calculated using the per-kilometer lighting load of the tunnel. It can be calculated by the following formula [38]:
Q d = L × W g
7.
Heat transfer of piston wind
The subway trains running in a tunnel generate piston wind, which exchanges heat with the outdoor air through the piston ventilation shaft, causing the tunnel to gain or lose heat. It can be calculated by the following formula [39]:
Q d   = ρ · V d ( h i h q )
V d = A · v
The parameter settings of the tunnel air module are shown in Table 1.

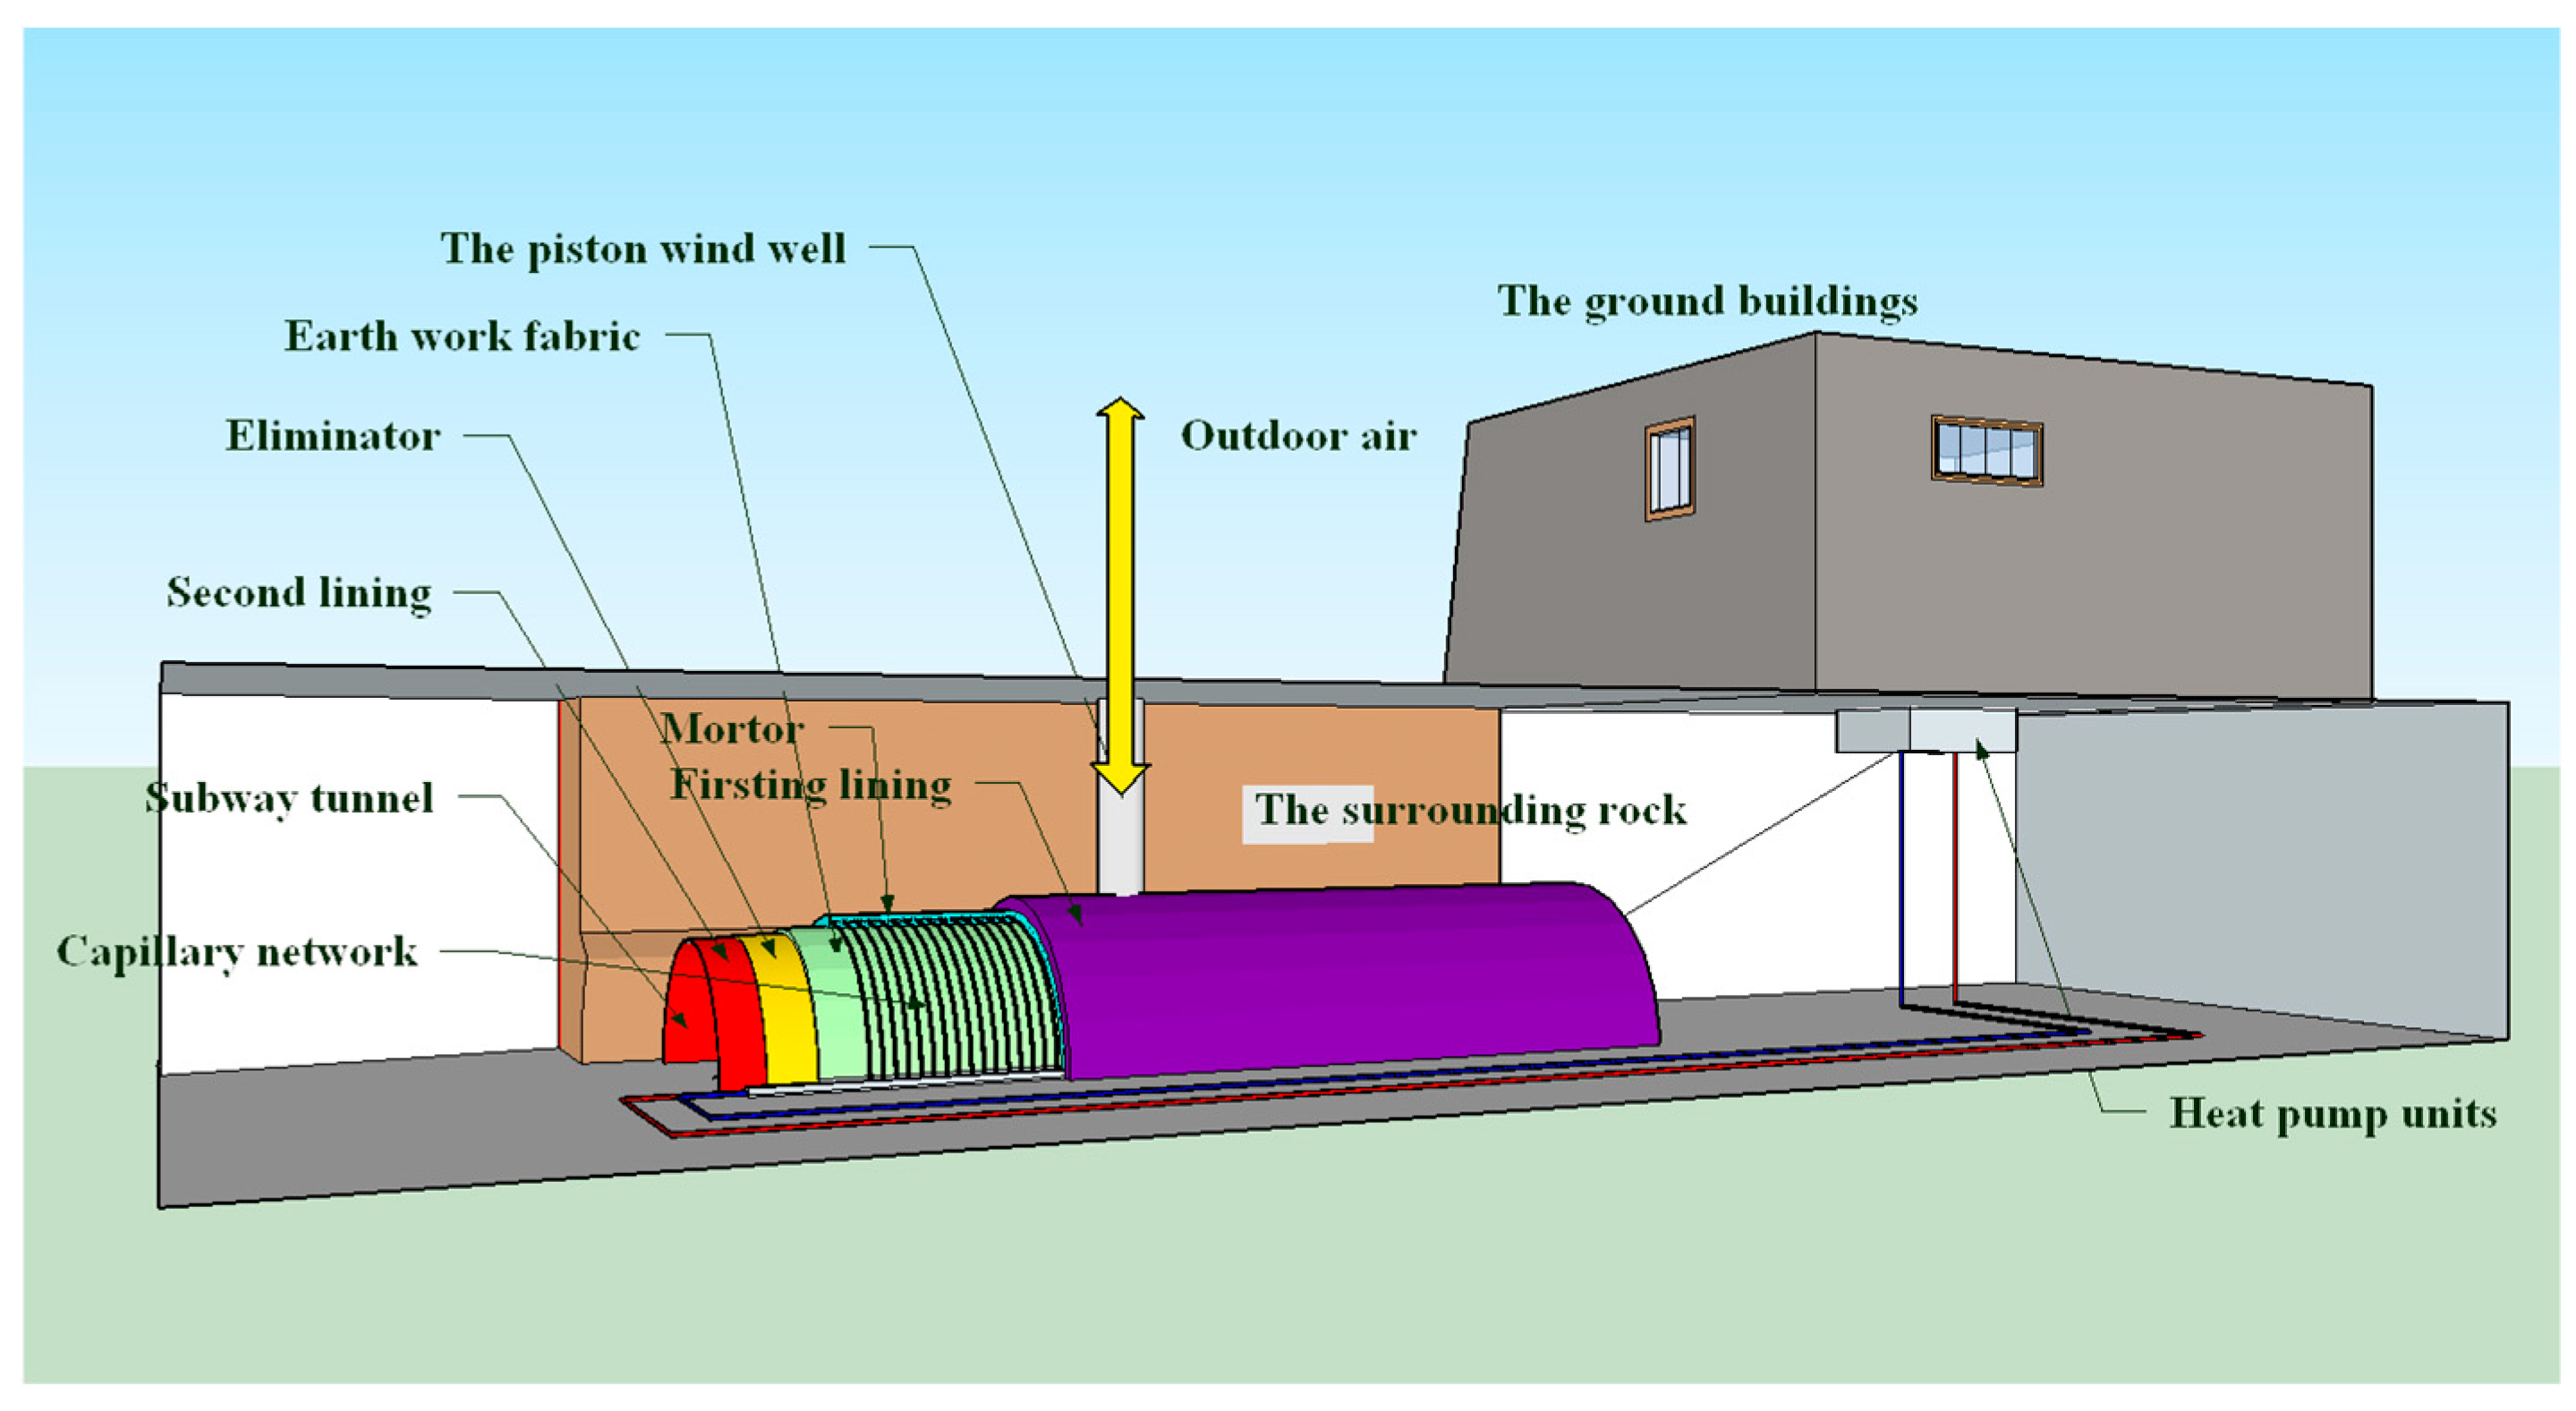
2.2. Capillary Network Module

The capillary heat exchanger is laid between the first lining and the second lining of the tunnel and surrounded by cement mortar and geotextile, as shown in Figure 1, and the material parameters of each structural layer of the tunnel are shown in Table 2 [26].
The thickness of each layer of material in the capillary heat exchanger is extremely small compared with the capillary area, so the heat exchange process of the capillary heat exchanger can be simplified to one-dimensional steady-state heat transfer [40]. The heat transfer characteristics and mathematical derivation of the capillary heat exchanger in TRNSYS are proposed and applied to the module by our team members.

2.3. Season Setting Module
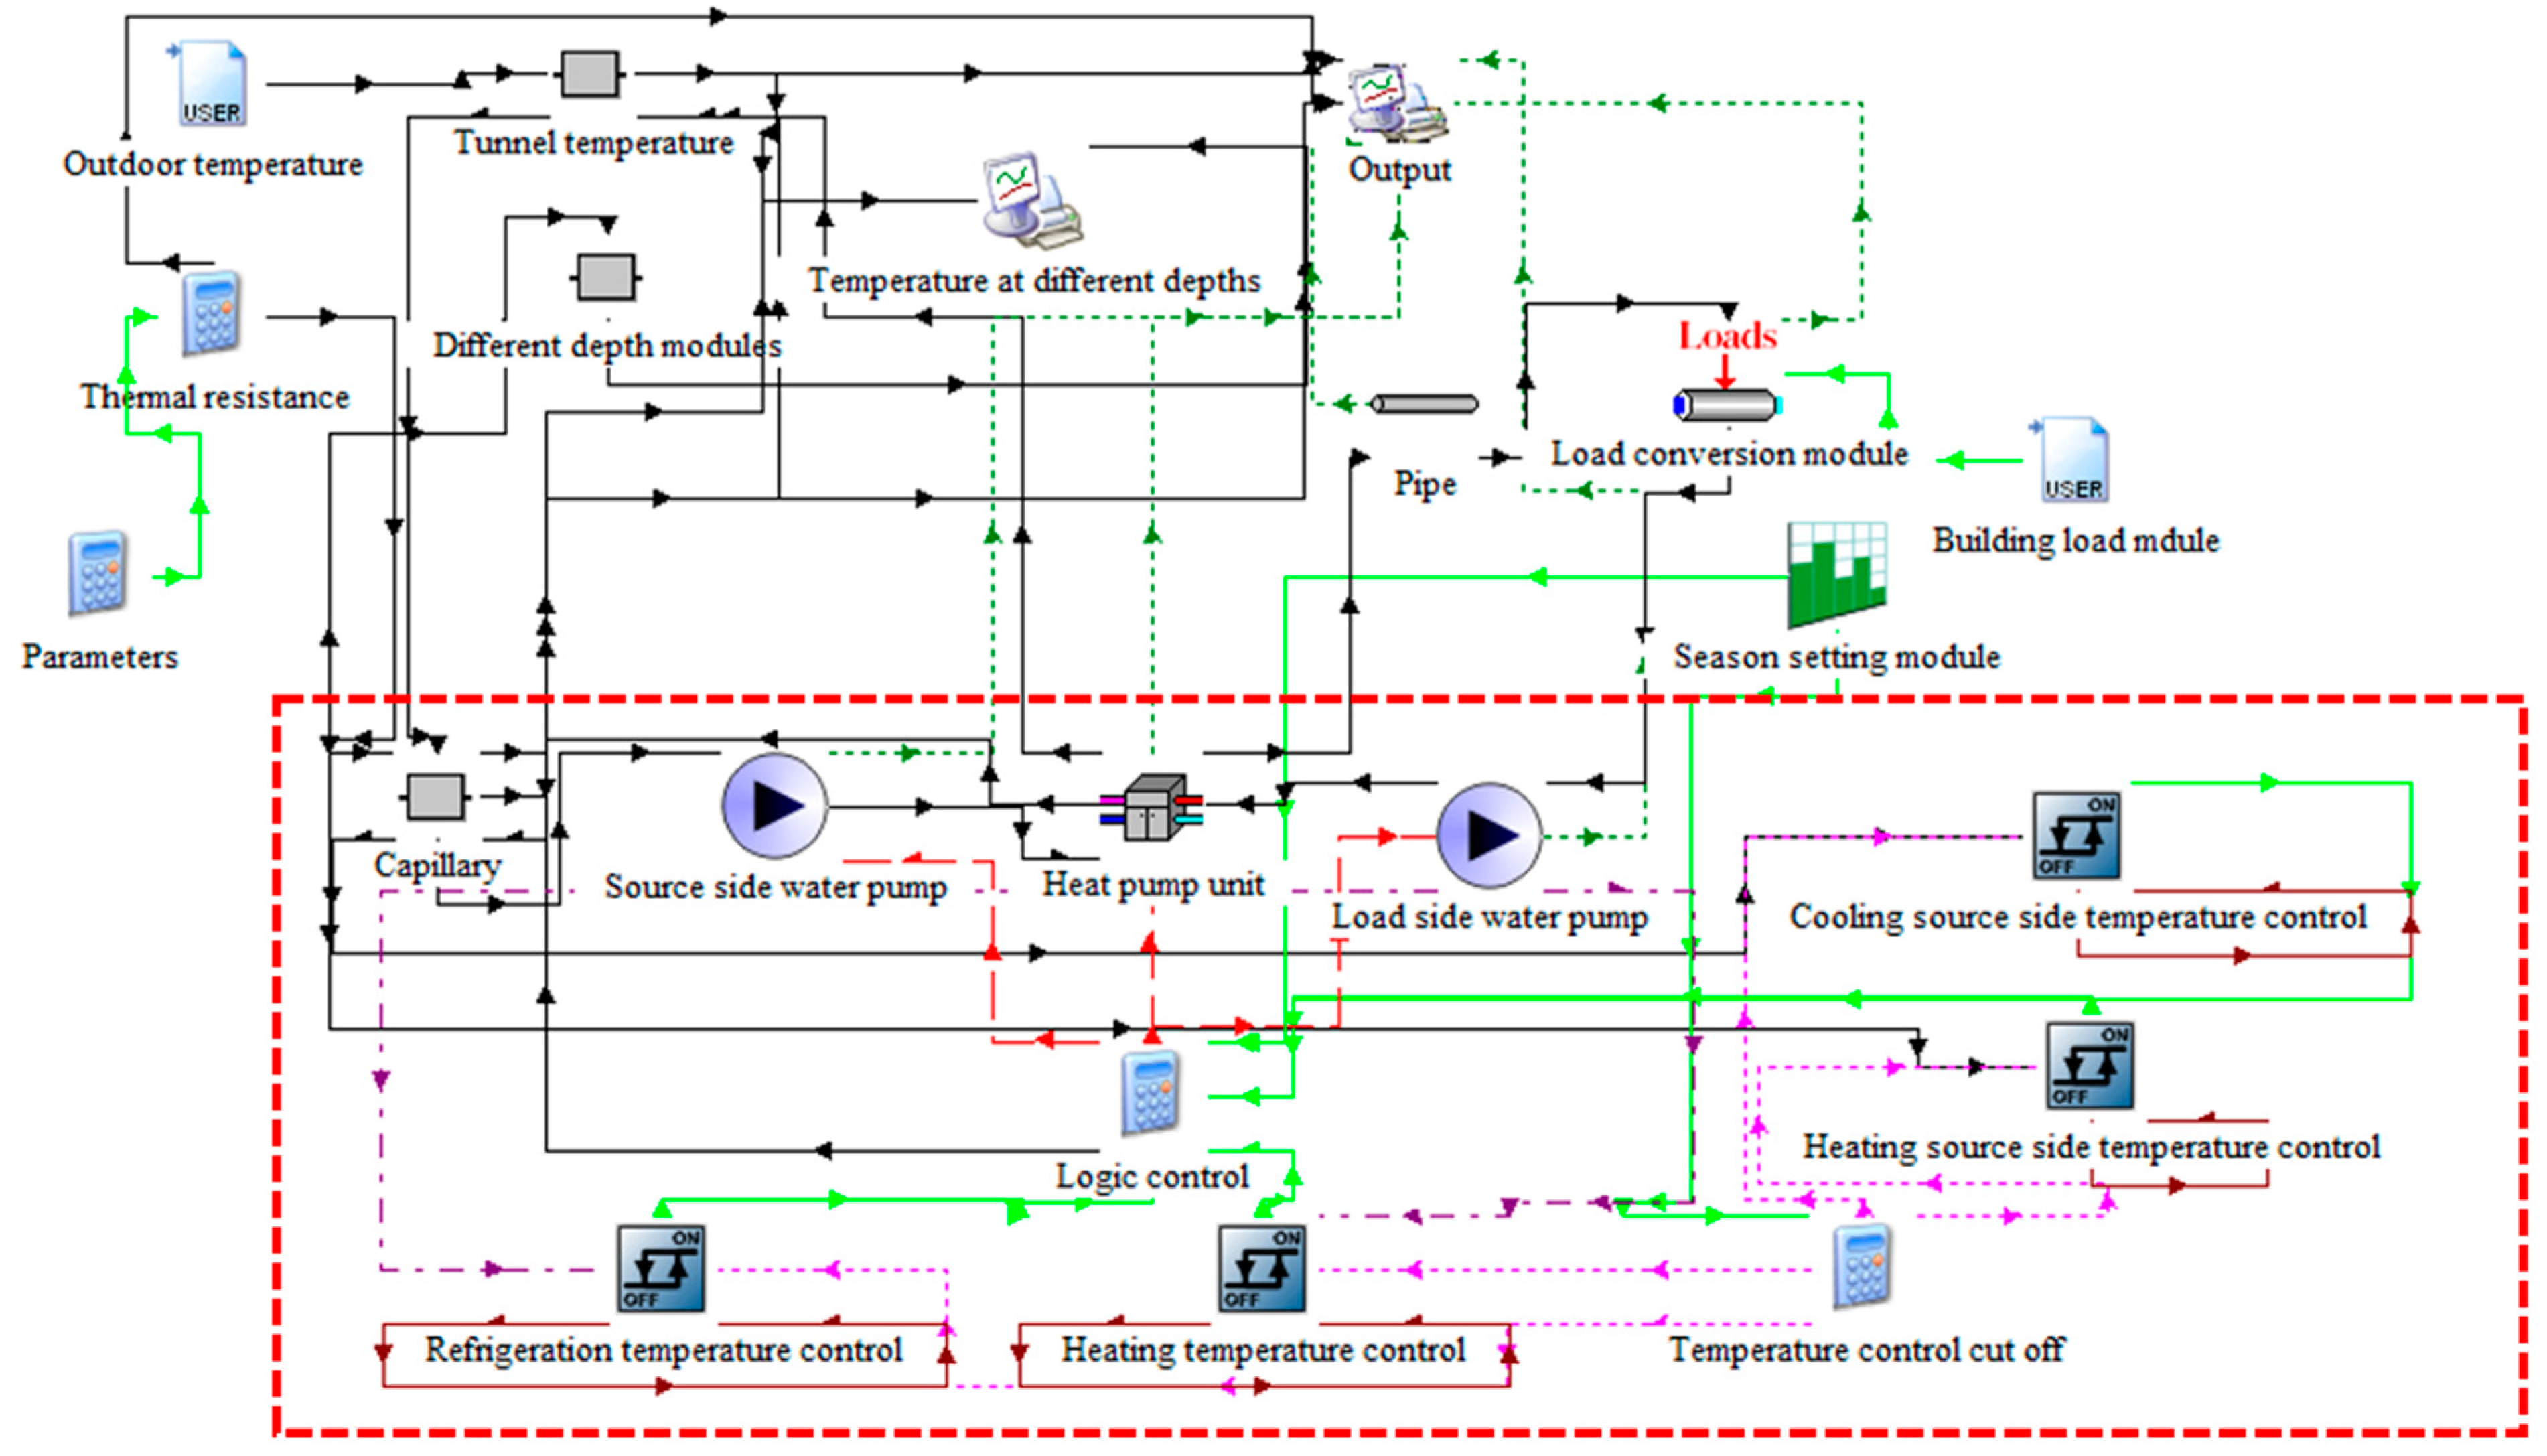
In TRNSYS, Type14h is used to output seasonal signals to change the control of the system so that the unit can cool and heat according to different needs during different time periods. The module outputs Signal 3 during the summer season, when the entire system bears the cooling load; the module outputs Signal 2 during the winter season, when the entire system bears the heating load. In order for the entire system to operate normally, it is necessary to connect the capillary module [41], but this article first studies the law of the tunnel thermal environment in the absence of thermal interference, when the capillary heat exchanger does not operate, so all output signals are set to Signal 4, representing transitional seasons. The relationship between the operating time of the system and the seasonal signal output is shown in Table 3.

2.4. Other Modules

  • Type823: Temperature module for different depths of subway tunnel surrounding rock temperature. Based on the surface temperatures of the surrounding rock obtained by the capillary module, the numerical calculation of the unsteady heat conduction is carried out using the finite difference method.
  • Type668: Heat pump unit module. This is a device that converts low-grade energy to high-grade energy. Two signals are set in this module, one for heating and one for cooling; correspondingly, it can achieve both cooling and heating functions.
  • Type682: Load conversion module. This is used to describe the process of fluid flow from the load to the water collector through the water divider and the system end device.
  • Type114: Constant flow water pump module. The selection standard refers to the water pump connected to the heat pump unit in the project.
The subway source heat pump system model is shown in Figure 3.
This paper studies subway tunnel thermal law patterns with and without capillary heat exchangers, so the simulation process is divided into two parts.
When studying the laws of tunnel thermal evolution on the basis of no thermal interference, the capillary module is not in operation. The red dashed box in the figure indicates that this part of the module is not running, but it is still an indispensable condition for the normal process of system simulation. When studying the use of capillary heat exchangers to treat tunnel waste heat, all modules operate normally.
Then, numerical simulation and experimental verification will be combined to further analyze the changes in tunnel thermal environment with and without capillary heat exchangers. The use of intervening capillary heat exchangers will solve the problem of waste heat in subway tunnels, providing theoretical reference for environment-based subway tunnel construction and comprehensive utilization of tunnel waste heat. The flowchart of this study is shown in Figure 4.

3. Results

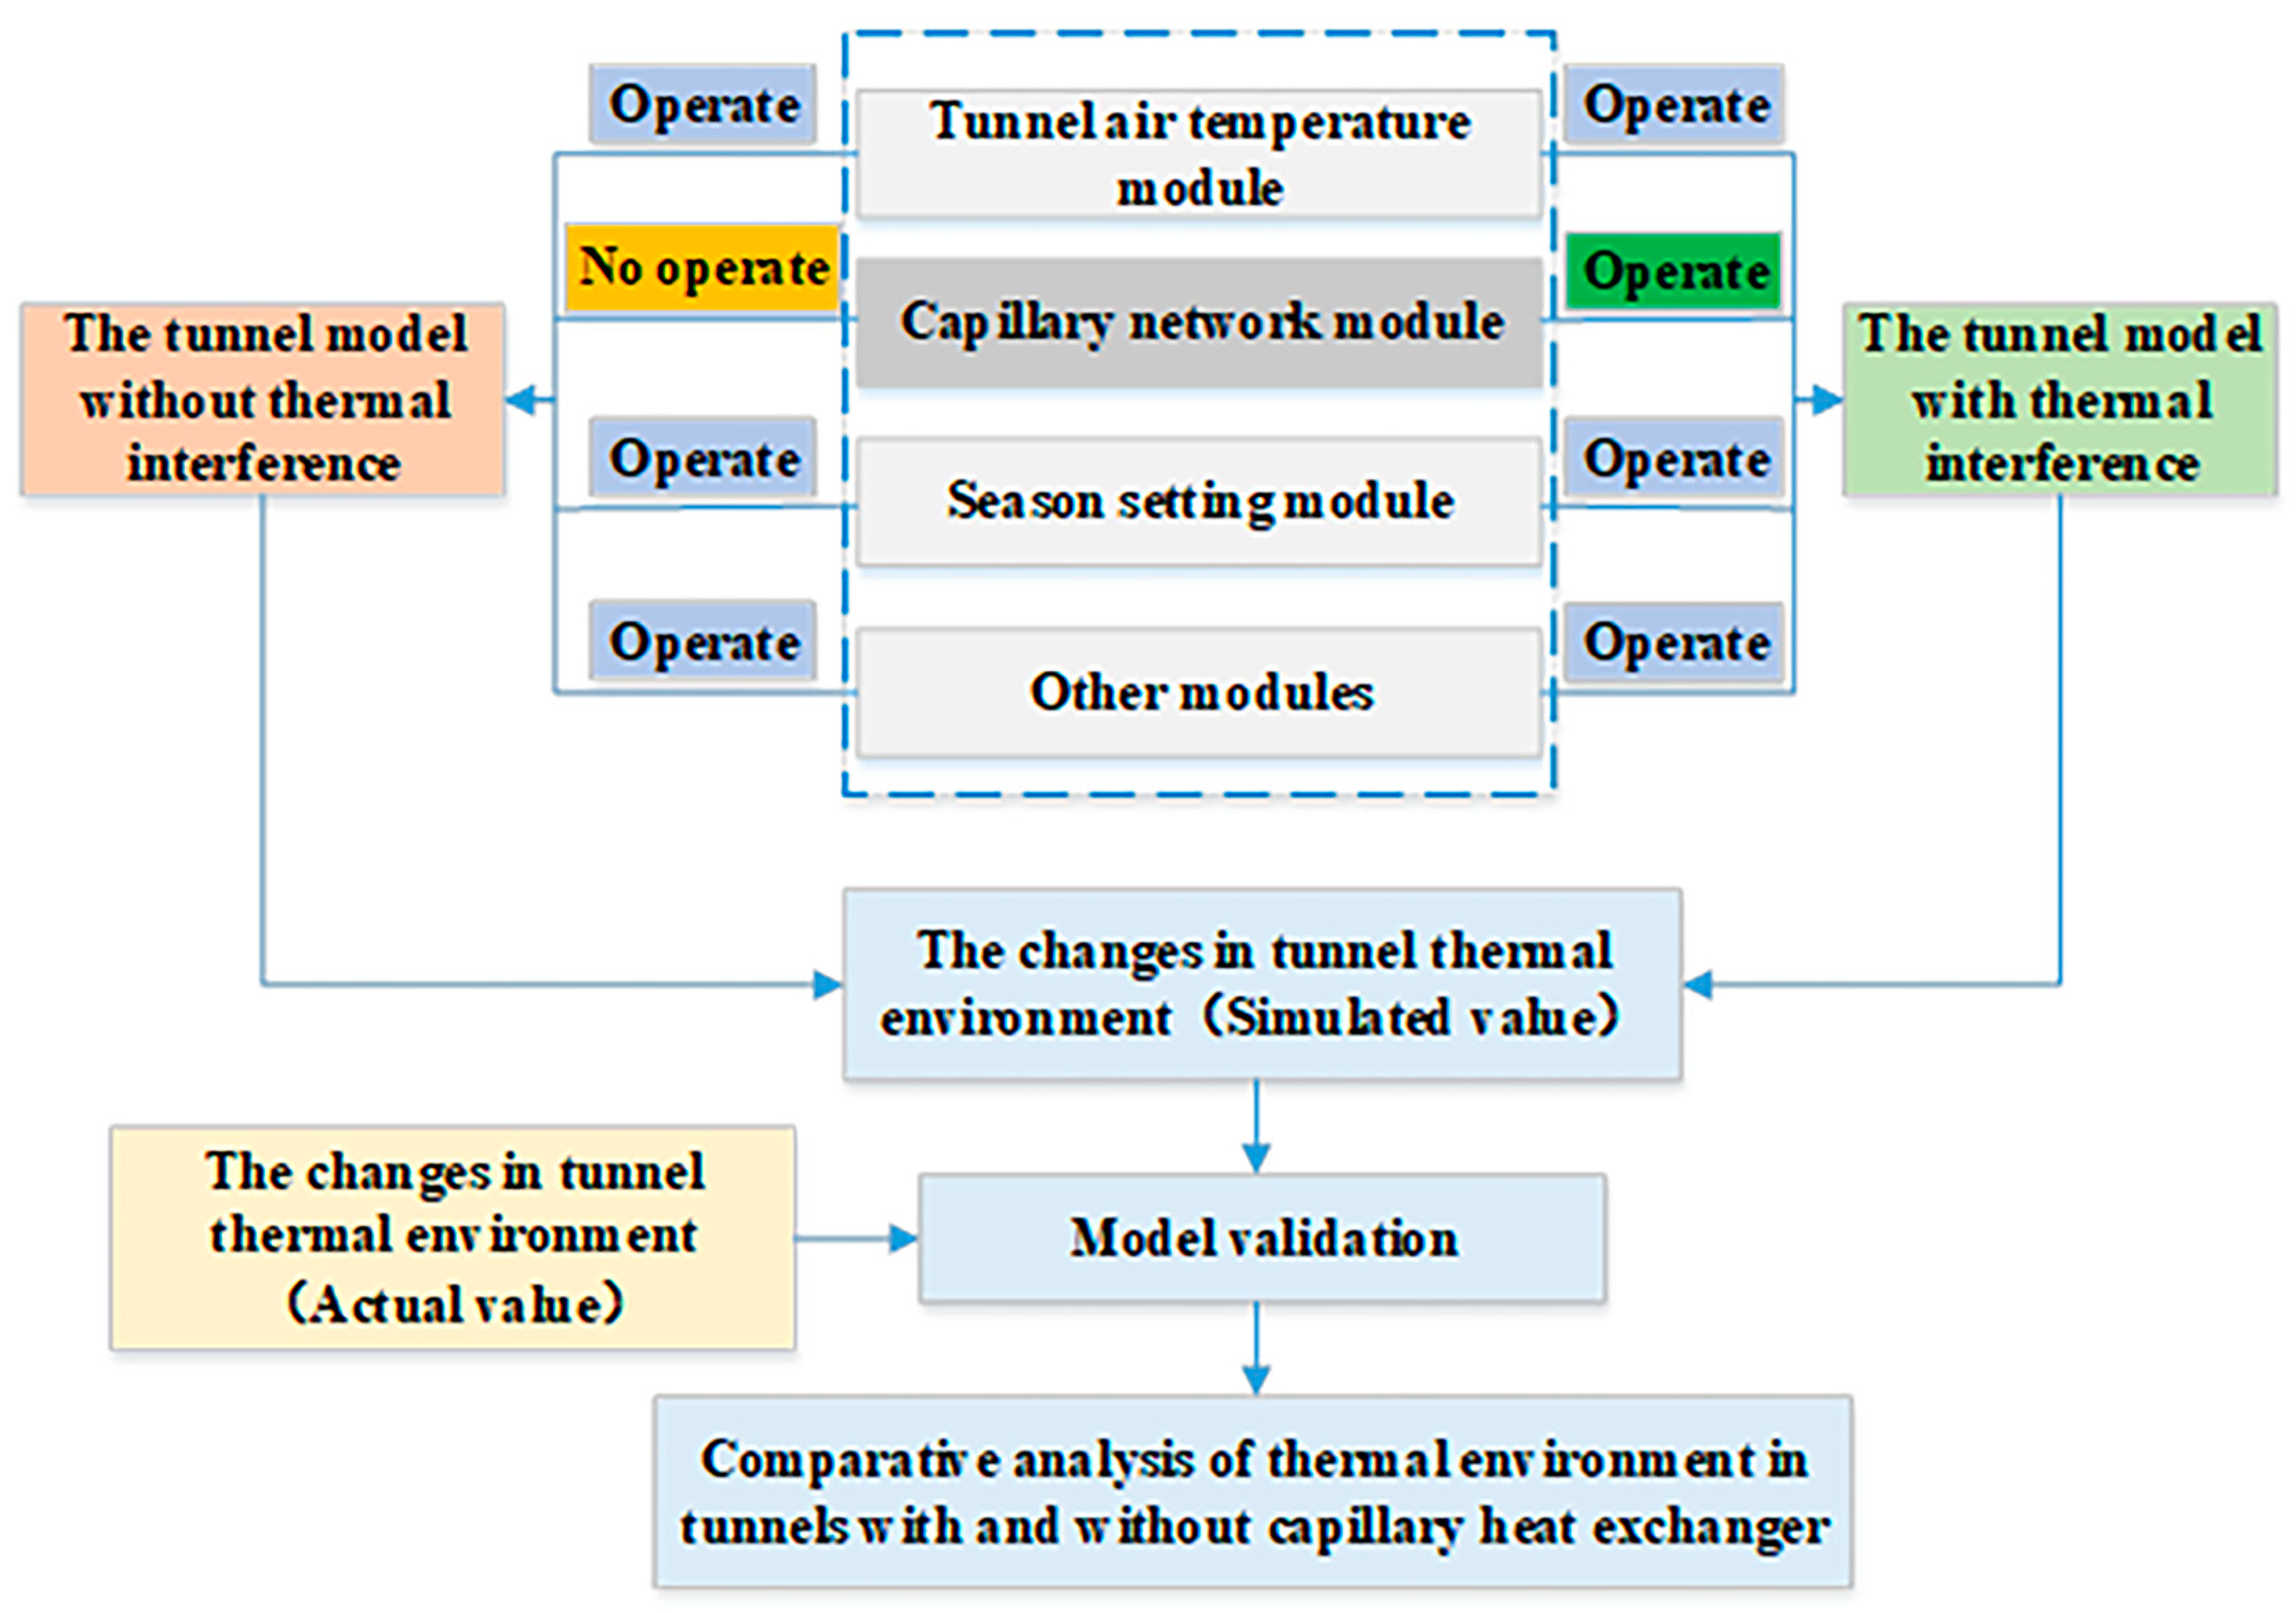
3.1. Study on the Law of the Tunnel with No Thermal Interference

The interval tunnel tested in this paper is located in Qingdao, Shandong Province. It is 2500 m in length, with the perimeter of the tunnel section being approximately 18.84 m and the area of the tunnel section being approximately 28.27 m2.

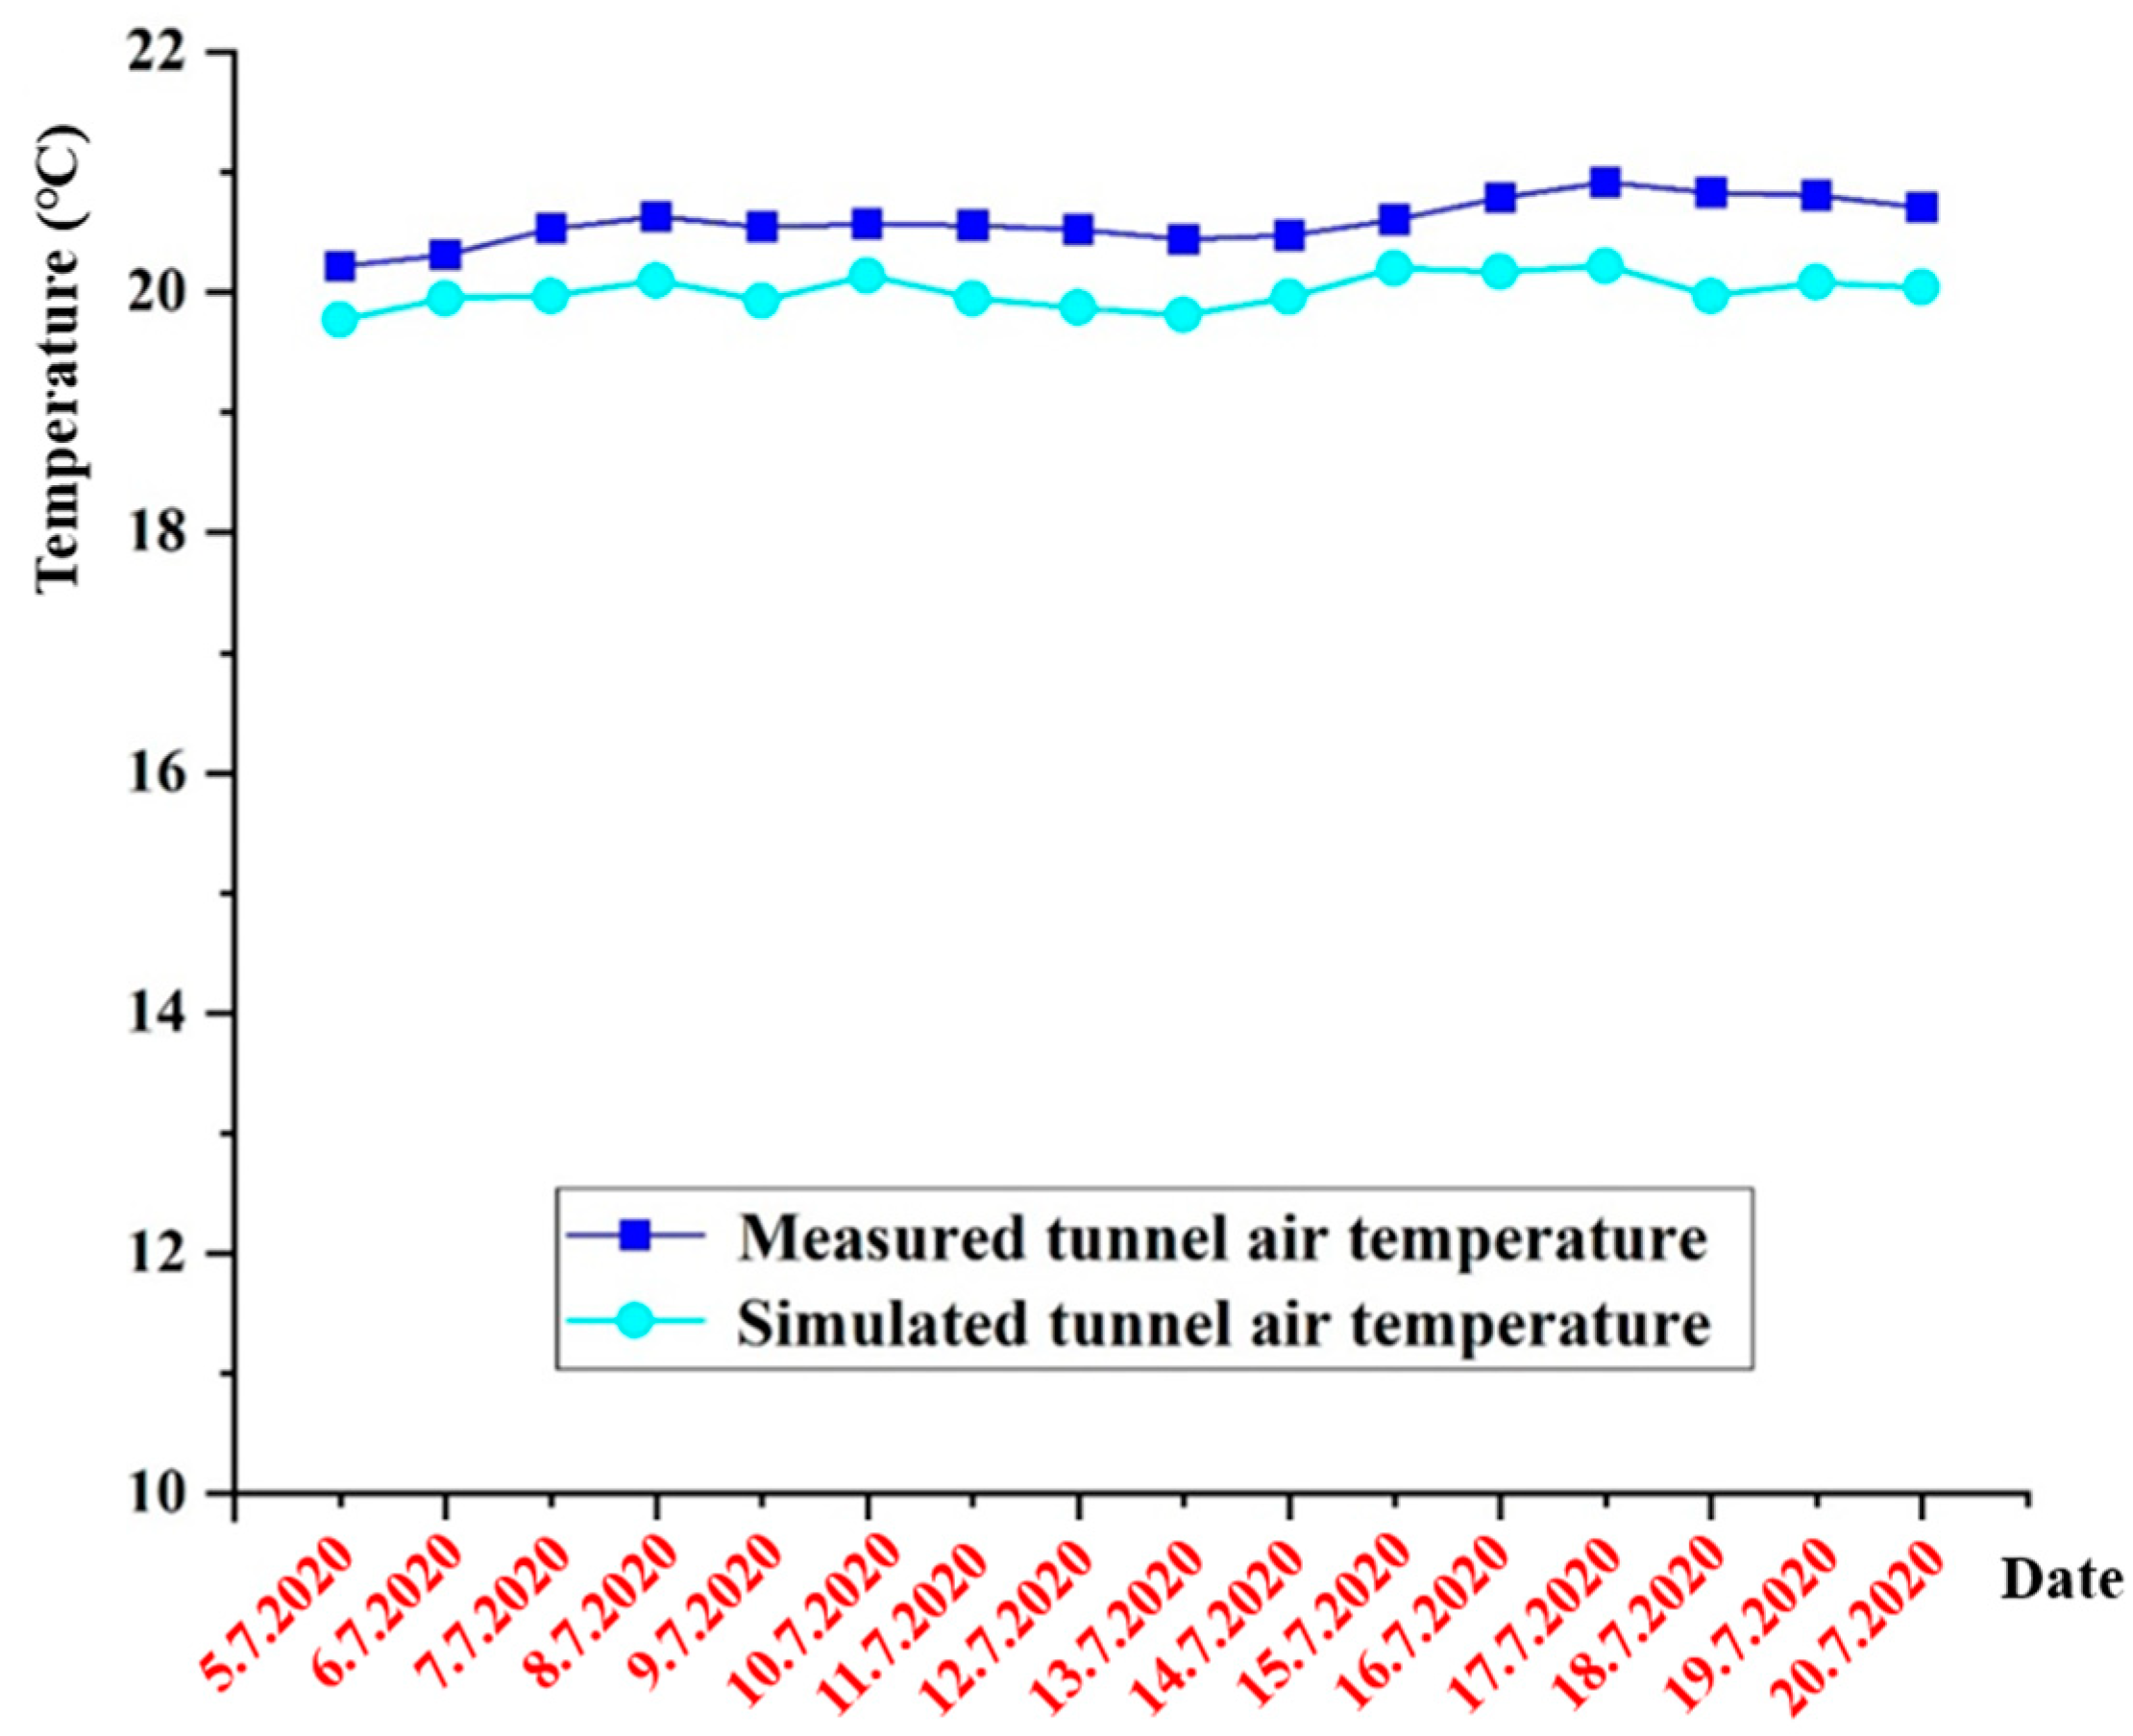
3.1.1. Validation of the Tunnel Model without Thermal Interference

The average daily temperatures from 18 January 2020 to 2 February 2020 are used to verify the winter tunnel air temperature, and the average daily temperatures from 5 July 2020 to 20 July 2020 are used to verify the summer tunnel air temperature. The graphs of the measured and simulated tunnel air temperatures are shown in Figure 5 and Figure 6 [26].
A comparison of the simulated values to measured values shows that the trendline of the changes in the simulated tunnel air temperature values is similar to that of the measured values. On the five days from 26 January 2020 to 30 January 2020 in the winter and the two days of 18 July 2020 to 19 July 2020 in the summer, the deviation between the measured value and the simulated value is relatively large. This is because the outdoor temperature is significantly reduced due to the cold air during this period. In the simulation process, the outdoor temperature is the input condition for obtaining the tunnel air temperature, so the tunnel air temperature is greatly affected by the outdoor temperature, which is nearly identical to the trend for outdoor temperature changes. Subway tunnels are usually located in an underground layer with a constant temperature, and the surrounding soil and rock has good energy storage characteristics. Therefore, the measured value of the tunnel air temperature has a delay relative to the outdoor temperature and does not change instantaneously, resulting in a large deviation between the measured values and the simulated values.
The average relative error between the measured and simulated tunnel air temperatures in winter is 2.21%, with the maximum relative error being 4.45% and the minimum relative error being 0.56%. The average relative error between the measured and simulated tunnel air temperatures in summer is 2.82%, with the maximum relative error being 4.15% and the minimum relative error being 1.79%. All relative errors are less than 5%.
Due to the incomplete consideration of the heat generation of the internal heat sources in the tunnel during the system simulation due to factors such as the heat transfer between the platform and the tunnel, the heat generation of curve resistance, slope resistance, and catenary energy loss, the simulated values in this verification are lower than the measured values, but the difference is within the allowable margin of error. After comparison and verification, the simulation has increased accuracy and higher reliability.

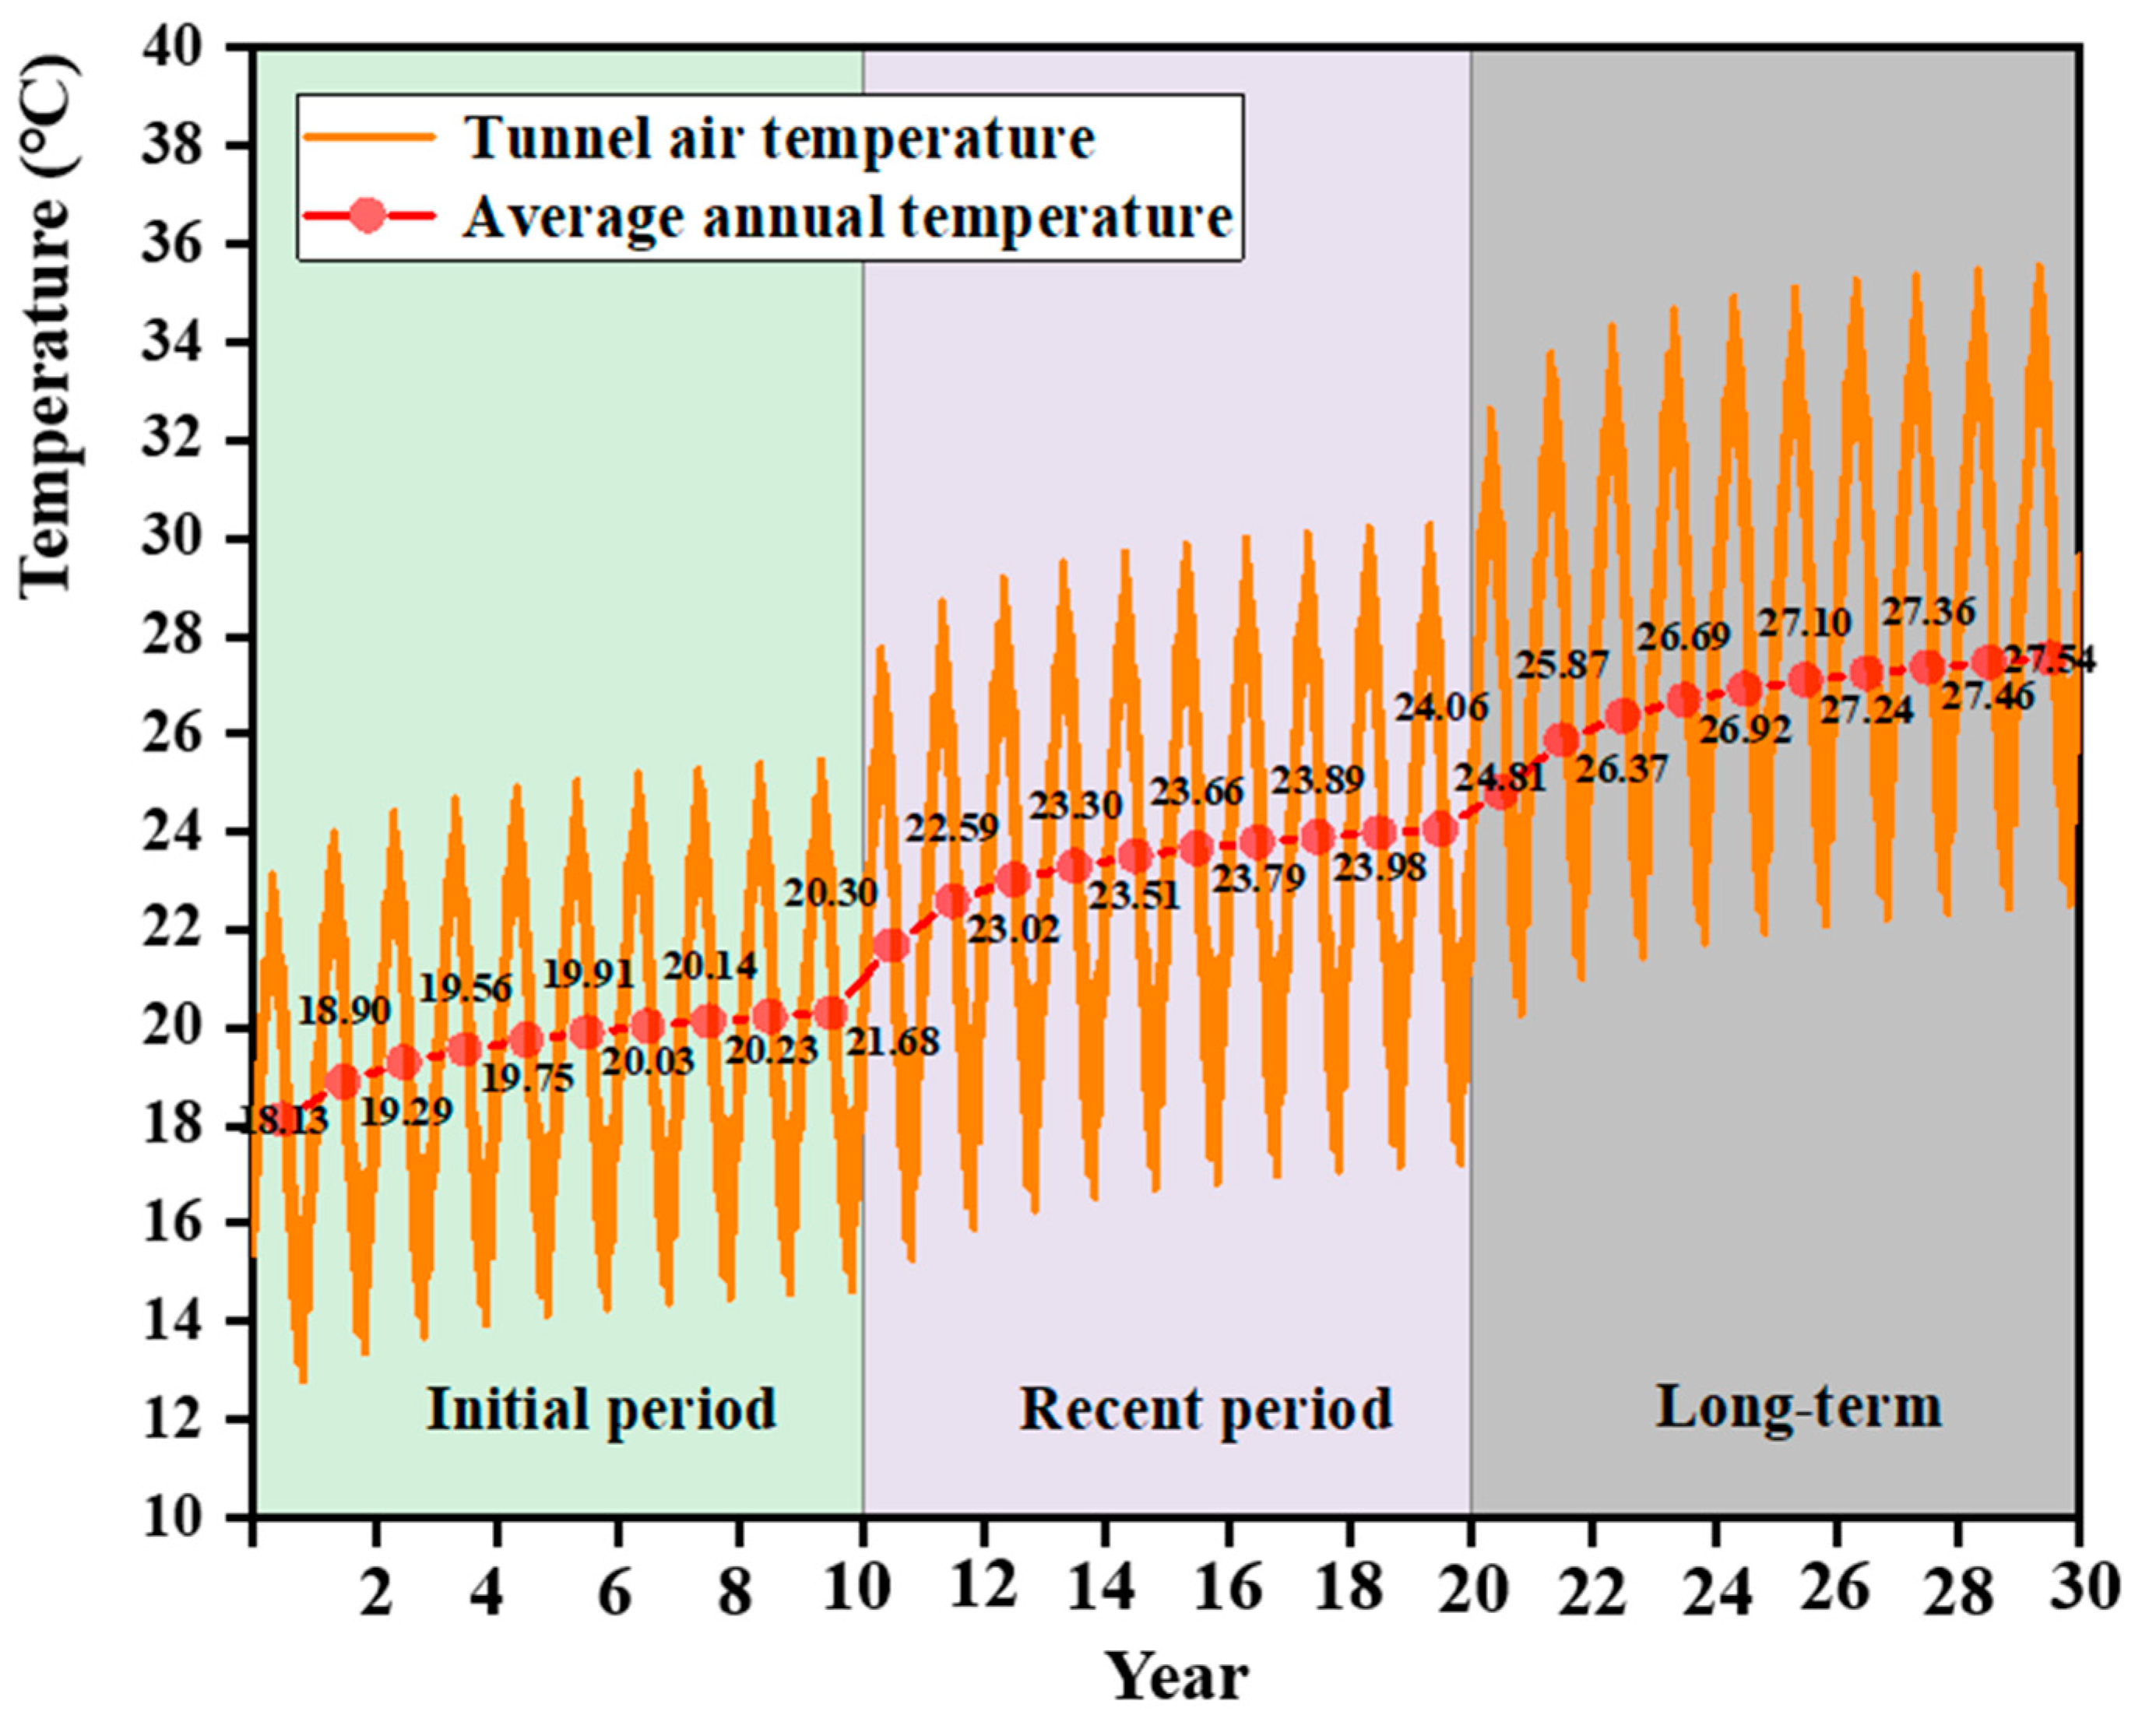
3.1.2. Analysis of Long-Term Laws of Tunnel Air Temperature (No Thermal Interference)

The subway system is a century-old project. Aiming to study the impact of the long-term operation of the subway system on the tunnel thermal environment, this paper simulates 30 years of subway system operation based on “Metro Construction Facilities” and “Metro Vehicles”. This simulation takes the standard year as a simulation cycle, starting at 0:00 on 1 May and ending at 23:00 on 30 April of the following year, totaling 8760 h. According to the actual subway operation, this simulation sets the number of train pairs during the initial period of subway operation (0–10 years) to 8 pairs/h, the number of train pairs in the more recent period of subway operation (11–20 years) to 12 pairs/h, and the number of train pairs in the long-term subway operation period (11–20 years) to 16 pairs/h. The changes in the tunnel air temperature are shown in Figure 7.
The tunnel air temperature changes periodically over different years. This is because it is affected by the annual cyclical change in the outdoor dry bulb temperature. The tunnel air temperature is similar to a sinusoidal curve and changes periodically.
During the initial period of subway operation (0–10 years), as the operating time increases, the rise in tunnel air temperature gradually decreases. This is because the low temperature of the surrounding rock of the subway absorbs the waste heat from the interval tunnel during the initial period, causing the surrounding rock temperature to rise; conversely, the surrounding rock soil transfers heat to the tunnel air, causing the tunnel air temperature to rise. Therefore, during the initial period of subway operation, the tunnel air temperature rises by a large proportion. After three to five years of operation, the heat absorption and release between the surrounding rock soil and tunnel air become more balanced. Thus, the heat absorption capacity of the soil and its influence on the tunnel air become more stable. Therefore, during these 5 to 10 years of operation, the proportional increase in tunnel air temperature is relatively small.
From the 11th to the 30th year of subway operation, the tunnel temperature changes more than in the previous 10 years. This is because the number of train pairs and the tunnel heat production increase, causing the tunnel air temperature to rise. With long-term, continuous operation of the subway system, the rate of temperature rise is relatively stable. In the next several years, the heat absorption capacity of the soil decreased, so the tunnel air temperature rise was relatively small. It can be concluded from the above that the number of train pairs is the main reason for the increase in tunnel temperature.

3.2. Laws of Tunnel Temperature with Thermal Interference

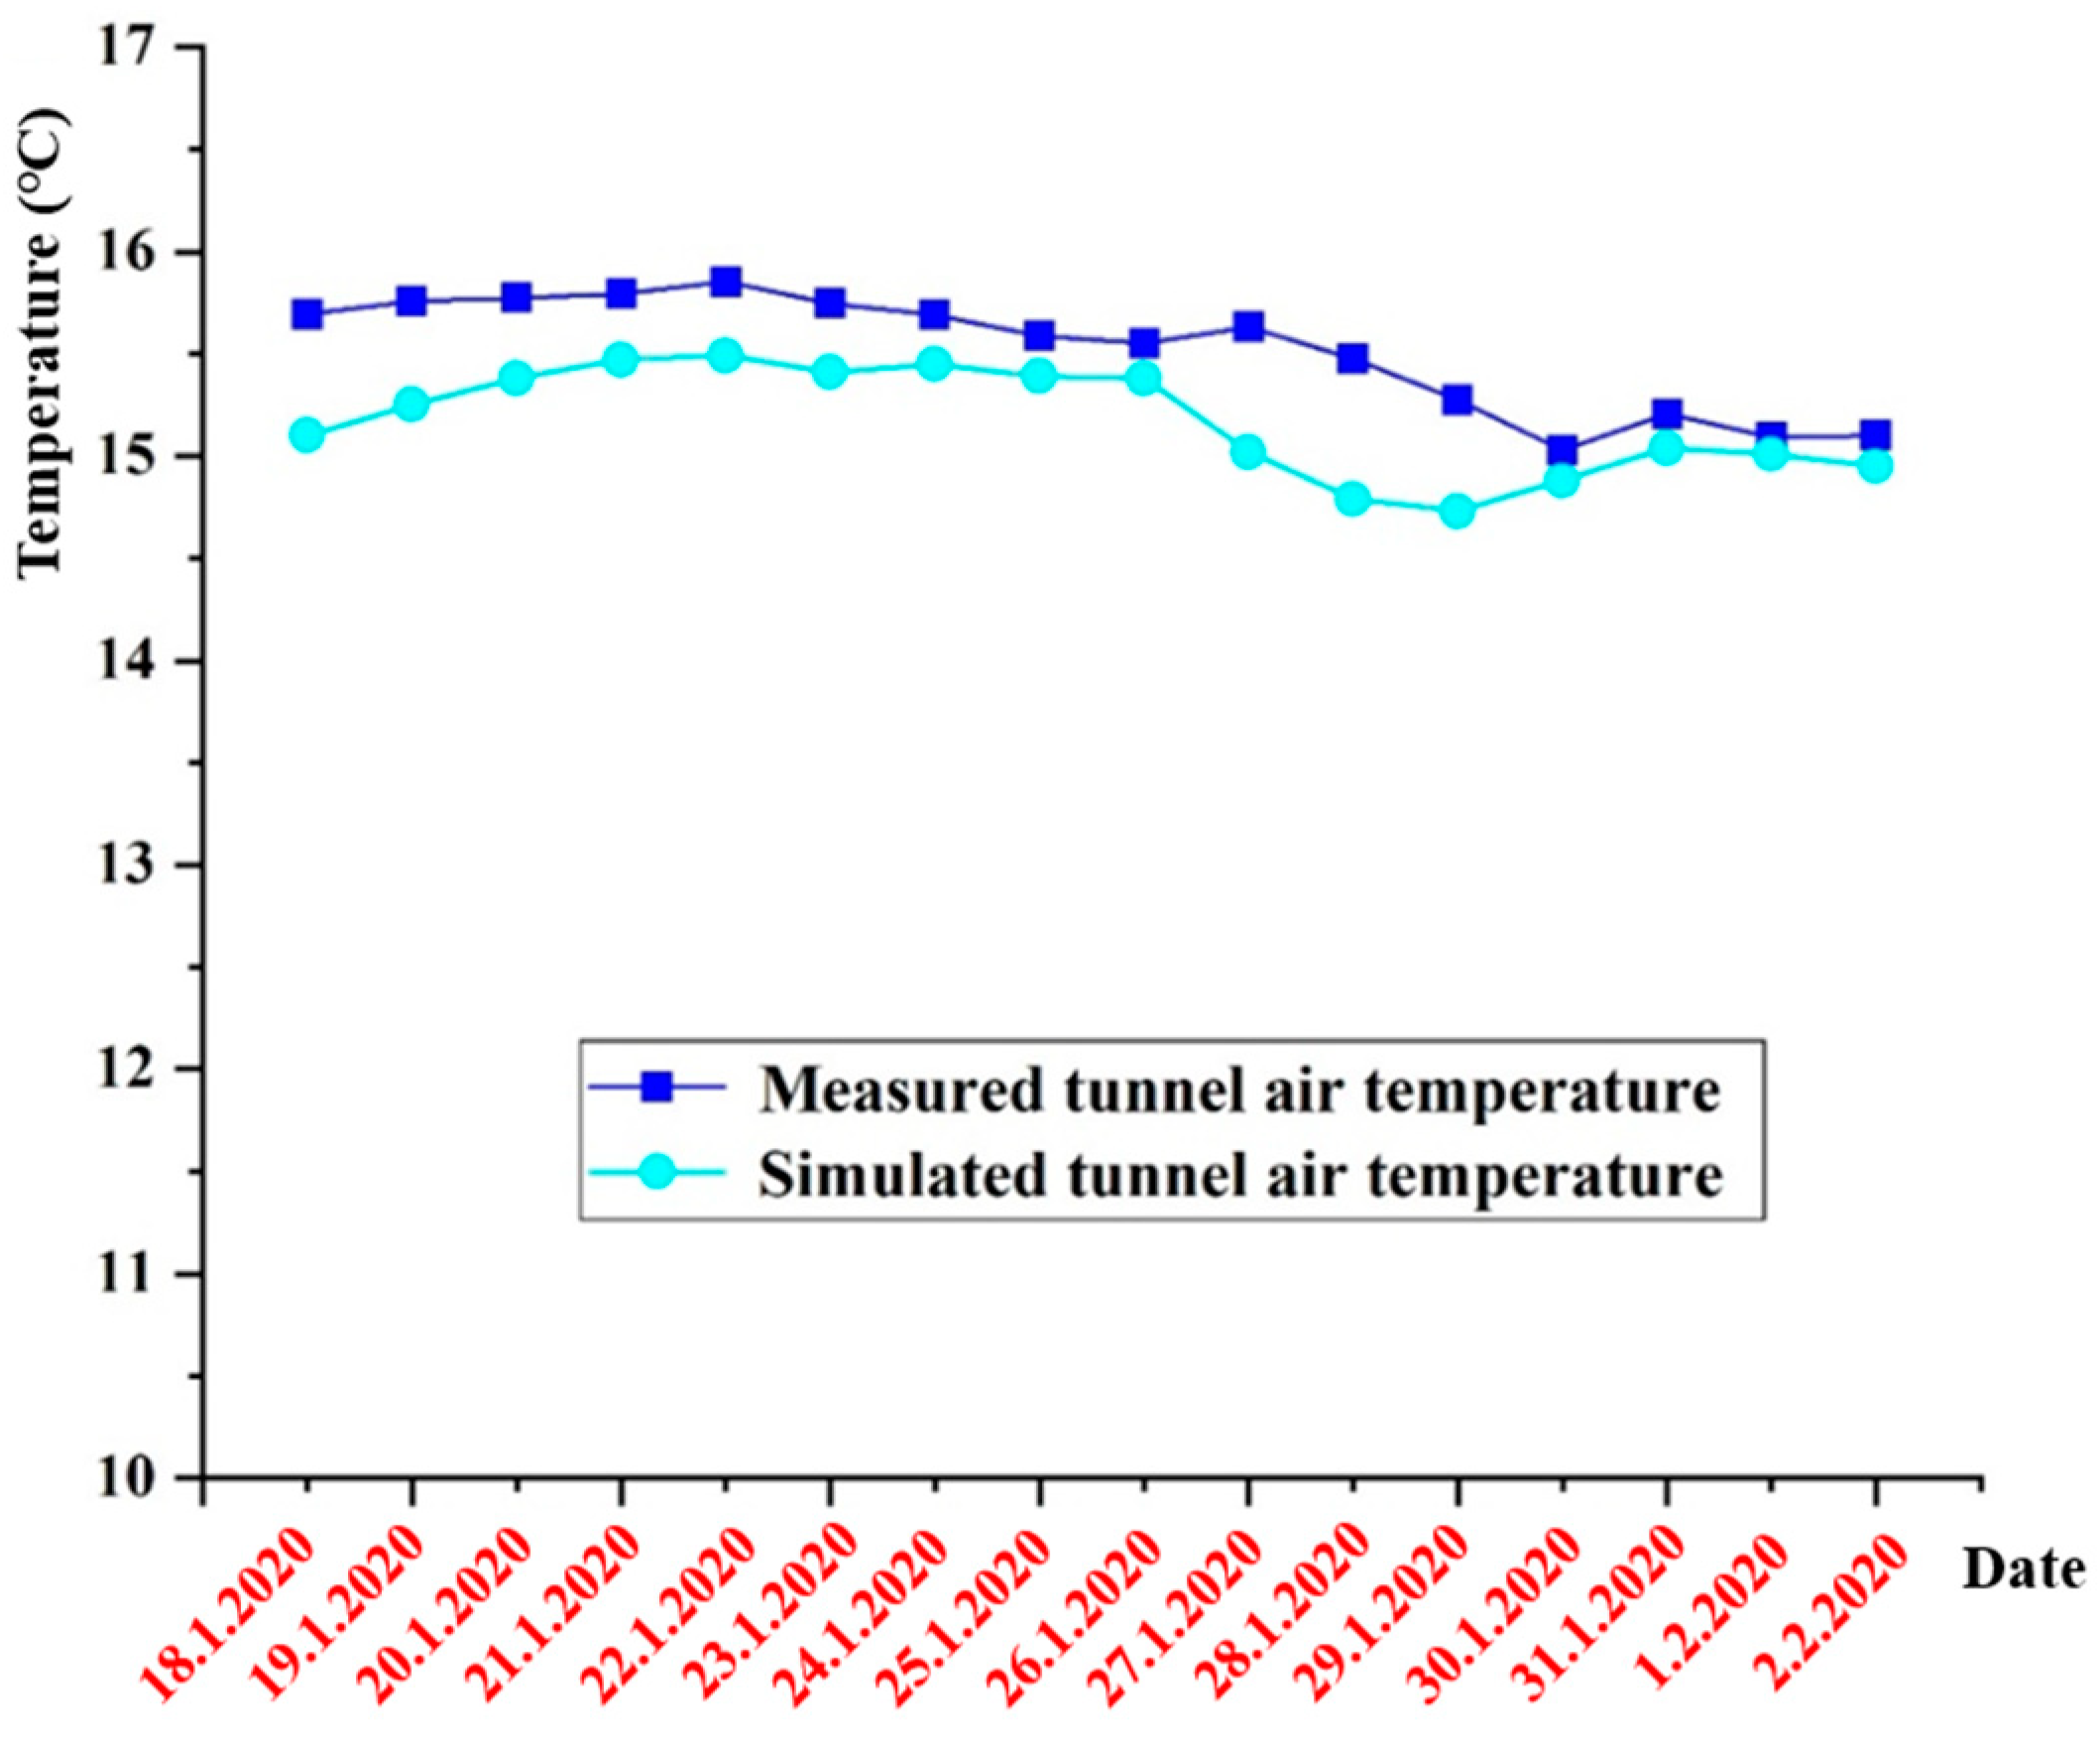
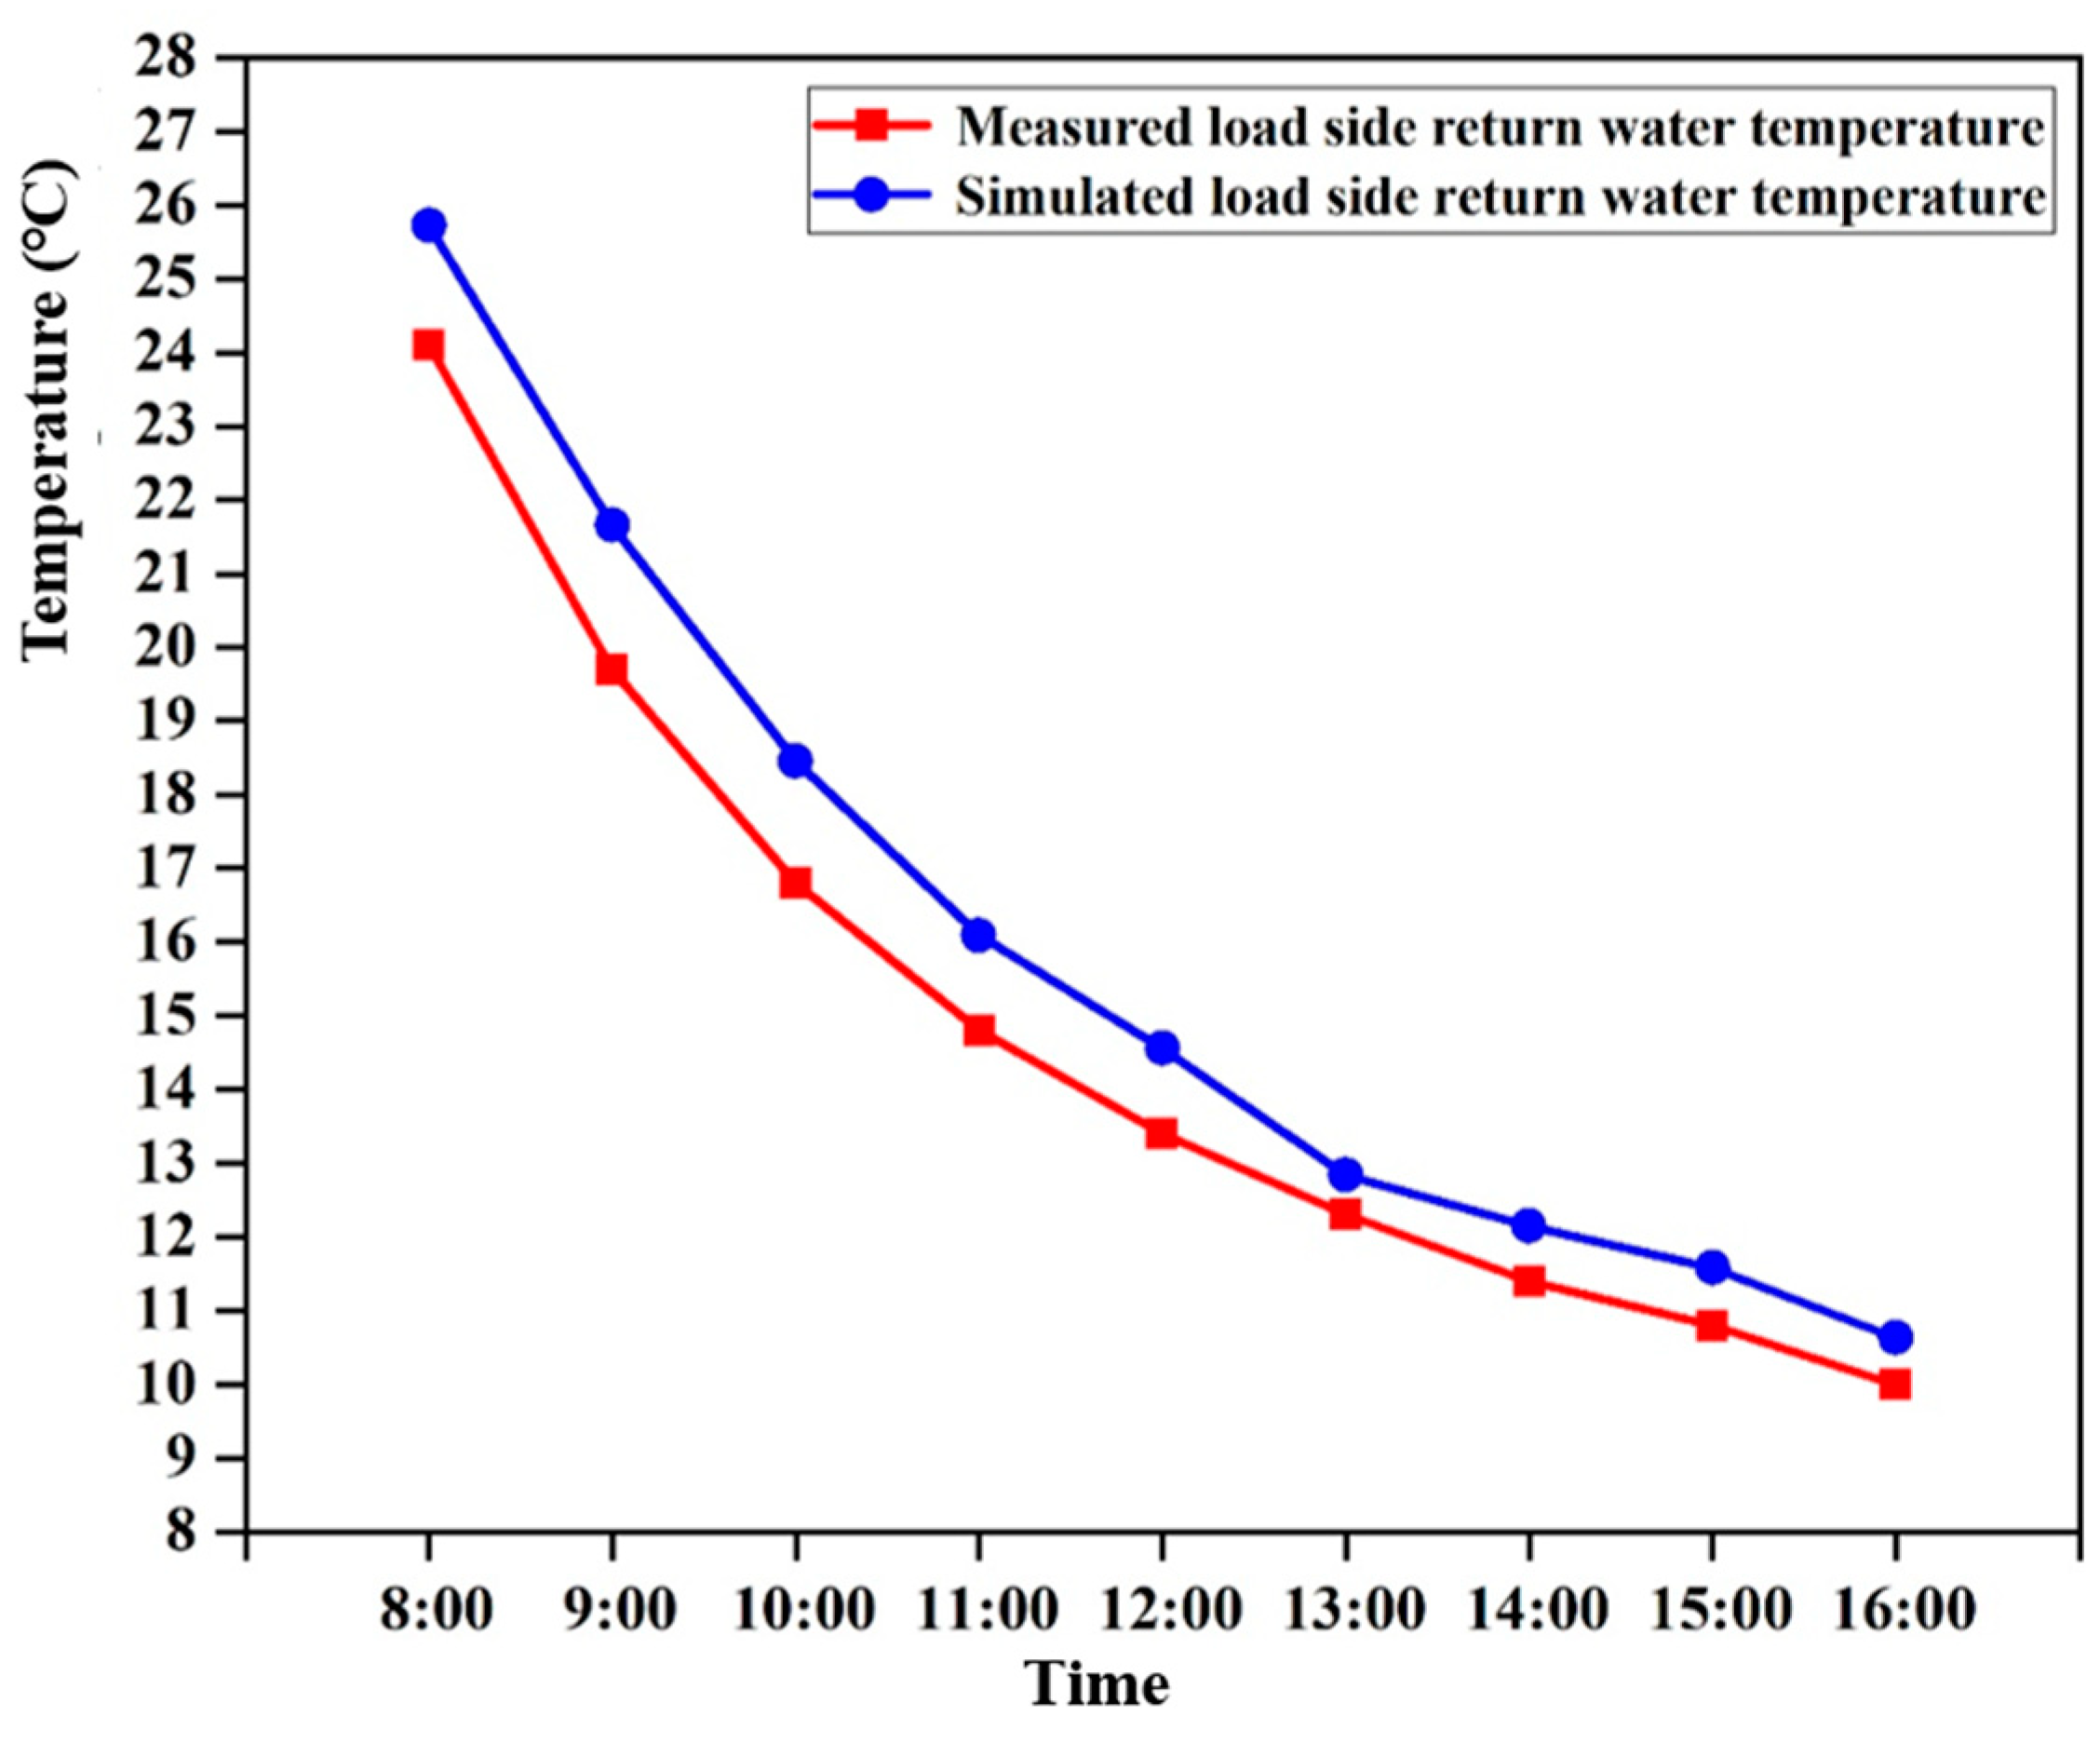
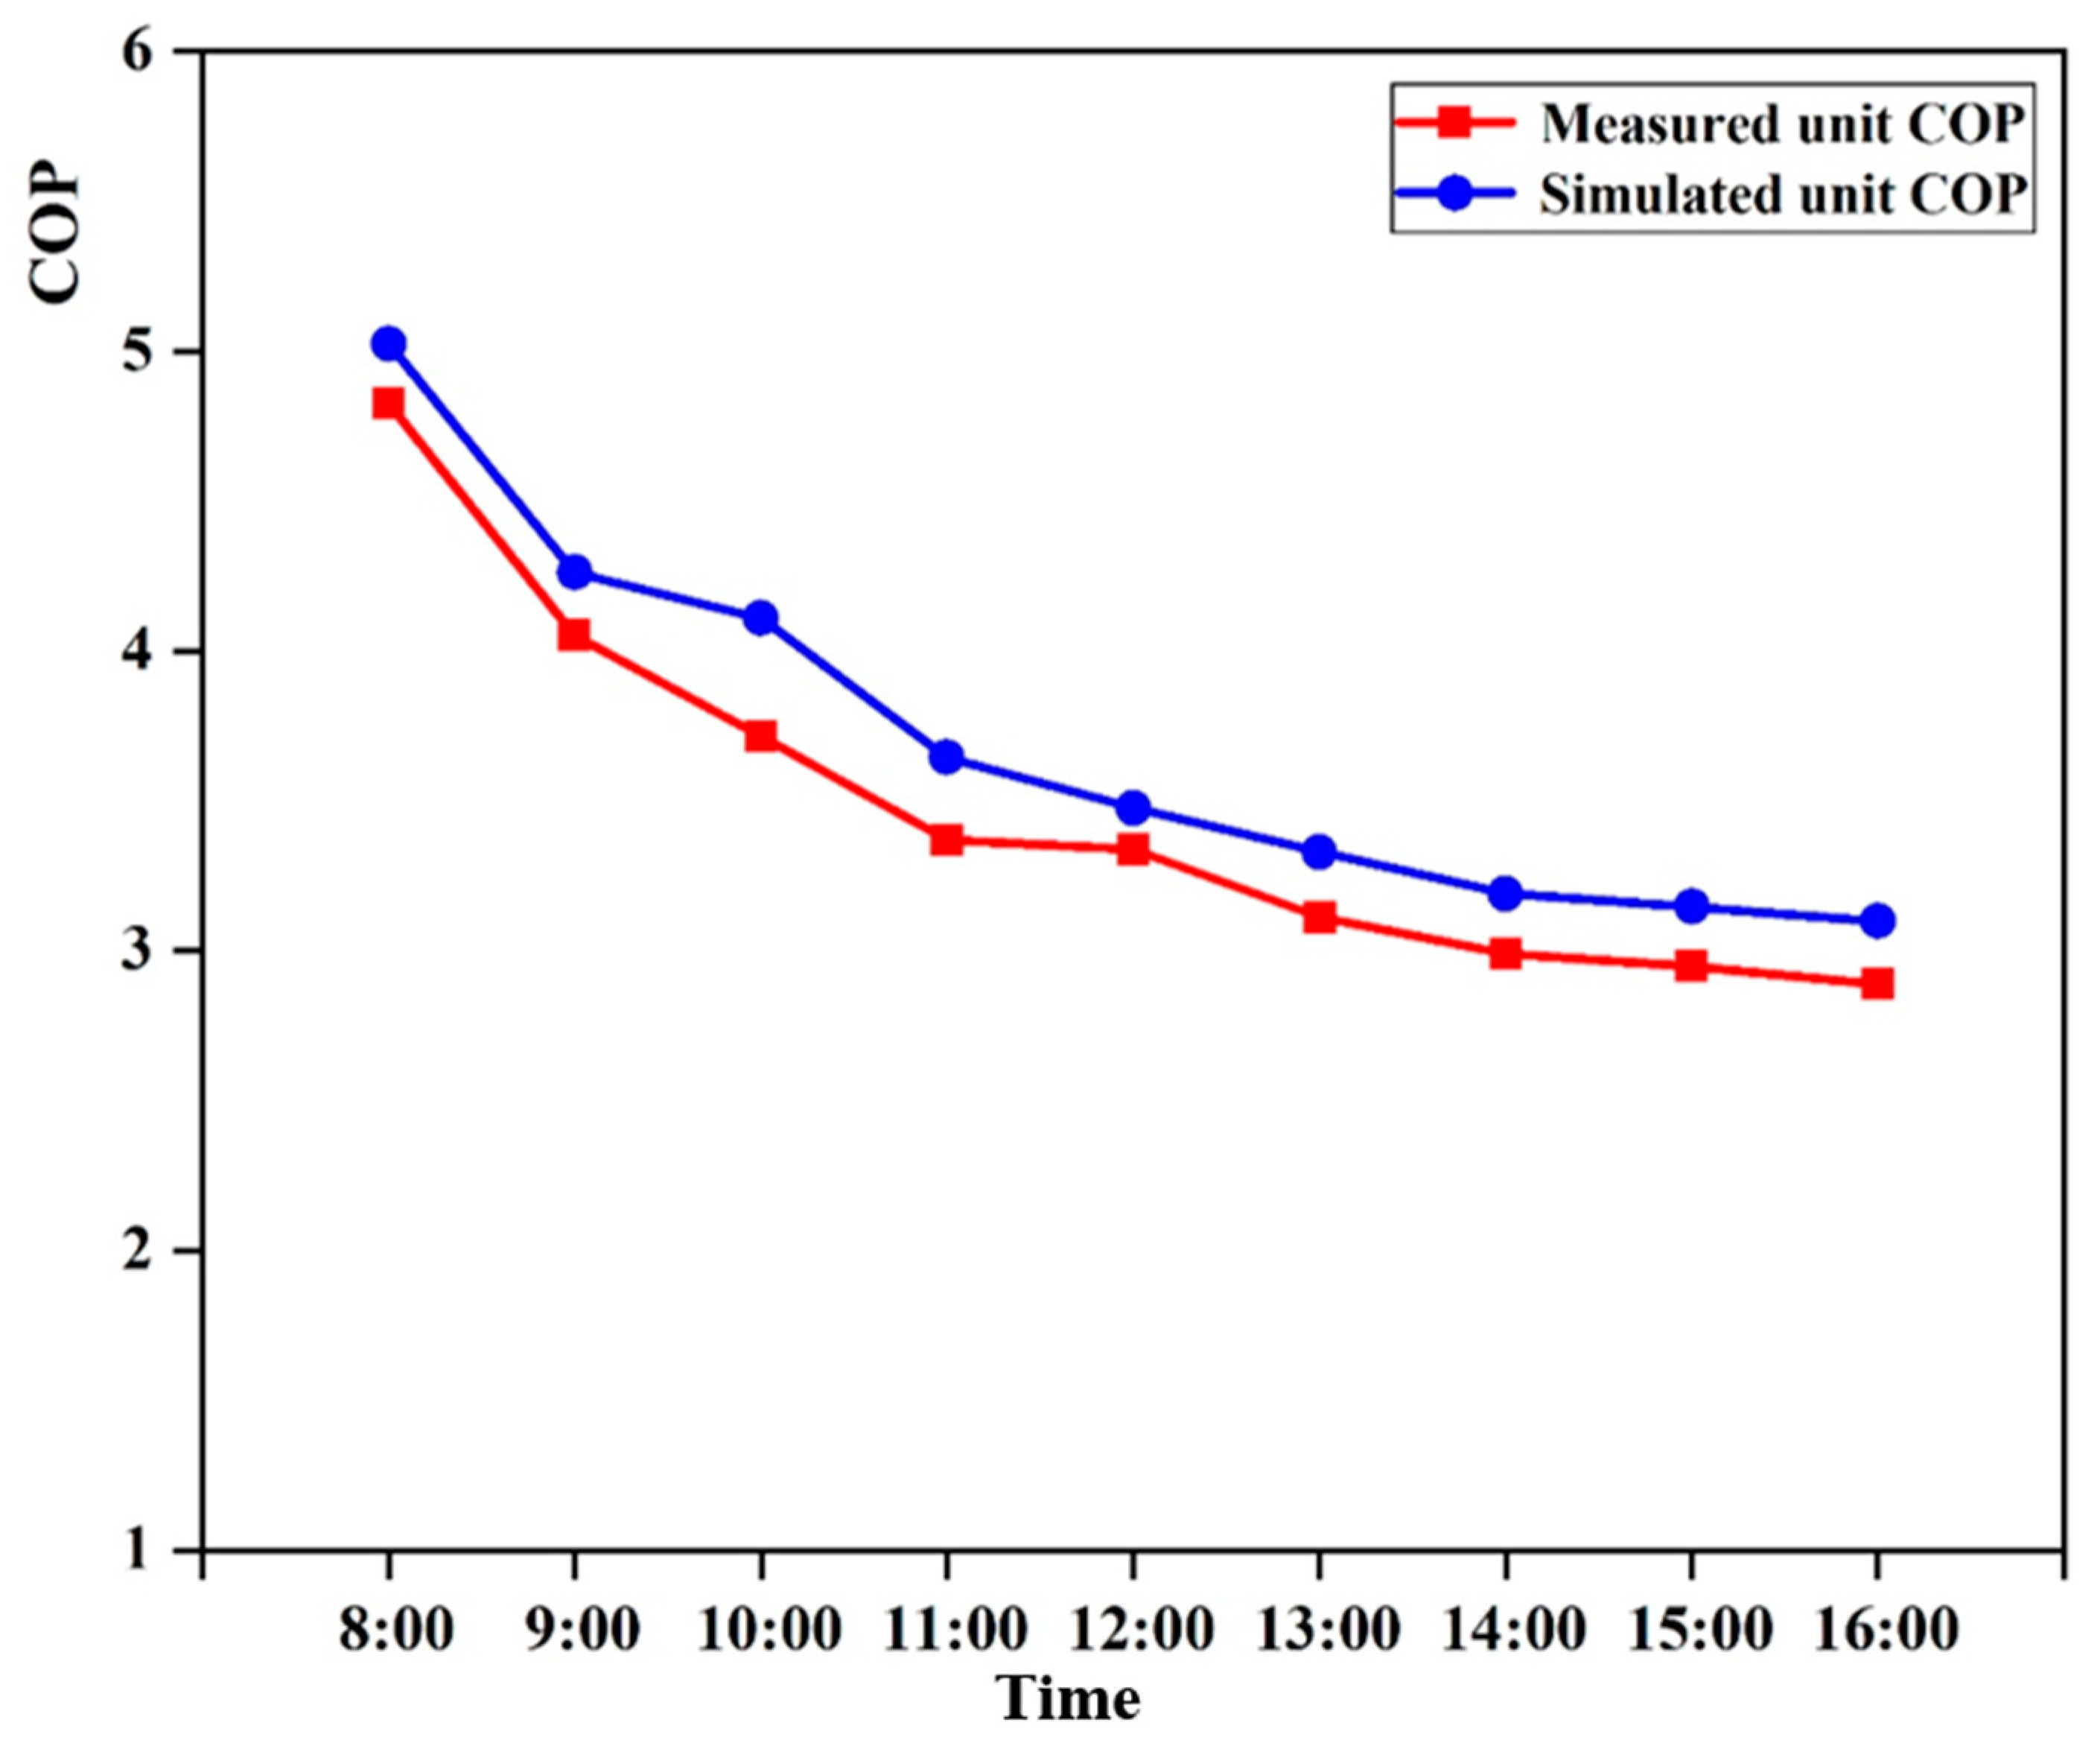
3.2.1. Validation of the Tunnel Model with Thermal Interference

The experiment was conducted on 26 September 2019. The subway source heat pump unit was turned on at 7:20. The unit data were recorded at 8:00 AM, when the system was operating stably. Data such as the outdoor temperature and humidity, unit current and temperature were recorded once per minute, the recording of the unit data stopped at 16:00.
Figure 8 and Figure 9 show that the overall changes in the simulated and measured water temperatures of the supply and return on the load side of the subway source heat pump unit tend to be consistent, showing a gradual downward trend. Because the pipe heat loss is ignored in the simulation process, the simulated value is higher than the measured value. The hourly temperature values and errors are shown in Table 4.
It can be seen from the table that the relative errors between the measured values and simulated values of the supply and return water temperature on the load side are within 10%. The average relative error of the supply water temperature is 7.37%, and the average relative error of the return water temperature is 7.60%.
Figure 10 shows that the overall change in the simulated and measured water temperatures of the unit COP tend to be consistent, showing a gradual downward trend. The maximum relative error of the unit COP is 10.61%; the minimum relative error of the unit COP is 4.13%, most of which are within 7%; and the average relative error is 6.67%. The simulated value is higher than the measured value because the simulation process ignores the heat dissipation between the unit and the water pump and the contact thermal resistance between the material layers of the capillary heat exchanger. Therefore, the simulation system has high accuracy and reliability and can be applied to the next long-term operation analysis.

3.2.2. Long-Term Analysis of Tunnel Air Temperature Changes (with Thermal Interference)

The operation strategy of the subway source heat pump system is set to assume a 10% cooling load in summer and a 100% heating load in winter. The changes in tunnel air temperature over 30 years of system operation are shown in Figure 11.
The trendlines for changes in tunnel air temperature over 30 years is shown in Figure 11. The tunnel air temperature changes periodically over different years. This is because it is affected by the annual cyclical changes in the outdoor temperature.
During the initial period of subway operation (0–10 years), as the operating time increases, the rise in tunnel air temperature gradually decreases. This is because the subway source heat pump system has just been put into operation and the system releases heat to the surrounding rock in summer, causing the temperature of the surrounding rock to rise. Conversely, the surrounding rock soil transfers heat to the tunnel air, causing the tunnel air temperature to rise. Therefore, during the initial period of subway operation, the tunnel air temperature rises by a large proportion. As the system continues to operate, the heat stored in the surrounding rock slowly decreases and its influence on the tunnel air becomes more stable. Therefore, in the last three years of operation, the proportion of tunnel air temperature rise is relatively small.
In the more recent period (Years 11–20), the tunnel temperature changes more than in the previous 10 years. This is because the number of train pairs increases, increasing the tunnel heat generation and the tunnel air temperature. With the uninterrupted operation of the system, the capillary heat exchanger consistently releases heat to the surrounding rock. Since the system only assumes a 10% cooling load in summer, the impact on the temperature rise is small.
During the long-term period (Years 21–30), the number of train pairs continues to rise, increasing tunnel heat generation. Compared with the previous two decades, the tunnel temperature changes significantly.

3.3. Comparative Analysis with and without a Capillary Heat Exchanger

To observe the cooling effect of the capillary heat exchanger more clearly, the air temperatures of the tunnel with and without capillaries during the 1st and 30th years of operation are selected for mathematical fitting, and the graphs of temperature change are shown in Figure 12 and Figure 13.
During the first year of subway operation, the maximum tunnel air temperature is higher in the tunnel with an installed capillary heat exchanger than in the tunnel without it. This is because during the operation of the subway source heat pump system in summer, the building heat is be transported to the surrounding rock and tunnel air through the capillary heat exchanger, resulting in a significant increase in the tunnel temperature. In winter, the system absorbs the tunnel heat generation to heat the building and realizes the comprehensive utilization of waste heat. Therefore, the air temperature of the tunnel is greatly reduced.
The comparison of fitting values of tunnel air temperature with or without capillary heat exchangers in the first year is shown in Table 5.
Although the tunnel air temperature will increase after laying the capillary heat exchanger in summer, the temperature still remains inside an acceptable range during the initial period. Moreover, the average temperature of the tunnel air is reduced by 1.25 °C, indicating that the heat absorption effect of the capillary heat exchanger in winter causes the tunnel temperature to decrease significantly.
During the 30th year of subway operation, the tunnel air temperature is lower both in winter and summer when there is a capillary heat exchanger installed. This is because the system absorbs the generated tunnel heat to heat the building in winter and realize the comprehensive utilization of waste heat. Because the system assumes a low cooling load in summer and assumes all heating loads in winter, the heat release to the tunnel is much lower than the heat absorption from the tunnel. The change in tunnel air temperature is a long-term process. Tunnel heat is effectively recycled by the capillary heat exchanger, and the tunnel temperature rise is small. Without the capillary heat exchanger, the tunnel heat continues to accumulate for a long time and the tunnel temperature increases significantly.
The comparison of fitting values of tunnel air temperature with or without capillary heat exchangers in the 30th year is shown in Table 6.
During the 30th year of subway operation, the average temperature of the tunnel air is reduced by 5 °C and the maximum value is reduced by 1.29 °C. This shows that tunnel thermal pollution is significantly improved by the long-term operation of the system.

4. Discussion

In this study, a comparative analysis was conducted through TRNSYS software simulation and onsite measurement to verify the reliability of the system models with and without thermal interference. Then, the air temperature changes within 30 years with and without the use of capillary heat exchangers in the tunnel were compared and analyzed using this model. Research has found that in the early stages of tunnel operation, when using capillary heat exchangers to treat tunnel heat pollution, the air temperature in the tunnel rises above a tolerable range within a certain period of time. Therefore, in future studies, assuming that the thermal balance of the surrounding rocks is maintained, intermittent operation can be adopted to reduce the operating time of capillary heat exchangers in summer. In the later stage of tunnel operation, the average air temperature in the tunnel after using capillary heat exchangers will be lower than that without capillary heat exchangers throughout the year. This is because in summer, the heat inside the tunnel is transferred to the surrounding rock walls through capillary heat exchangers, thereby reducing the tunnel air temperature. In winter, the heat inside the surrounding rock walls is transferred to the tunnel through capillary heat exchangers, thereby bearing part of the heat load. In the long-term operation process, the heat pump system using capillary heat exchangers has a lower cooling load in summer and bears all the heat load in winter, so the heat released into the tunnel is much lower than the heat absorbed from the tunnel.
It is recommended to use capillary heat exchangers to solve the problem of tunnel waste heat and reduce the harm of tunnel thermal pollution. This technology has extremely high engineering significance and social value. By analyzing experimental data, we found that when a subway train runs in a 1.6 km tunnel for 22 min, it can generate 600,000 kilojoules of heat. Through conversion, if all 41 subway stations in Qingdao apply this technology, the heat generated by subway trains will meet the heating needs of half of the city’s heating season, greatly reducing energy consumption.

5. Conclusions

(1)
The validation results of the tunnel model with and without capillary heat exchangers are displayed. When there is no capillary heat exchanger, the relative error between the measured and simulated winter and summer temperatures in the tunnel is less than 5%. When there is a capillary heat exchanger, the relative error between the measured and simulated values of the user side return water temperature is less than 10%, and the average relative error between the measured and simulated values of the unit COP is 6.67%. From this, it can be concluded that the system model has high accuracy and reliability and can be applied for long-term operational analysis in the next step.
(2)
According to the simulation results, it was found that in the first 10 years of subway operation, the air temperature in tunnels with capillary heat exchangers was 2.18 °C lower than that in tunnels without capillary heat exchangers; in the next decade of subway operation, the air temperature in tunnels with capillary heat exchangers will be 0.29 °C lower than that in tunnels without capillary heat exchangers; during the 10 years of long-term subway operation, the air temperature in tunnels with capillary heat exchangers was 0.52 °C lower than that in tunnels without capillary heat exchangers. This result indicates that the use of capillary heat exchangers helps to reduce tunnel air temperature, thereby reducing thermal pollution.
(3)
When capillary heat exchangers are installed in subway tunnels, the anti-seasonal heat storage characteristics of the system lead to a significant increase in tunnel temperature in summer and a significant decrease in winter, with a slight decrease in annual average temperature. This indicates that capillary heat exchangers have significant effects on the treatment of thermal pollution in subway tunnels and the comprehensive utilization of waste heat.
(4)
The results of this study indicate that the use of capillary heat exchangers has significant benefits in reducing heat and thermal pollution in subway tunnels and can provide reference for improving the long-term thermal environment of subway interval tunnels. However, research on the influencing factors and design optimization of the entire system is limited. In future research, relevant parameters such as temperature changes at different depths of surrounding rock, flow velocity inside capillaries, capillary laying methods, laying lengths, and the application of capillary heat exchanger technology in engineering practice should be considered.

Author Contributions

Conceptualization, L.T. and Y.J.; investigation, S.H.; methodology, L.T. and M.Z.; visualization, M.Z.; writing–original draft, M.Z.; writing–review and editing, M.Z. All authors have read and agreed to the published version of the manuscript.

Funding

The authors are indebted to the National Natural Science Foundation of China (Grant no. 52108079), Science and Technology Demonstration Project of Qingdao (24-1-8-cspz-1-nsh) and Shandong Engineering Research Center of Healthy Environment and Low-Carbon Energy.

Data Availability Statement

The data that support the findings of this study are available on request from the corresponding author. The data are not publicly available due to privacy restrictions.

Conflicts of Interest

The authors declare that they have no known competing financial interests or personal relationships that could appeared to have influenced the work reported in this paper.

References

  1. Transport for London. London Underground Environment Strategy 2008–2013; Transport for London: London, UK, 2011; Volume 9. [Google Scholar]
  2. Nakamura, H.; Yamana, T.; Matshushita, T.; Wakamatsu, T. Research on smoke control in underground structures. Tunn. Undergr. Space Technol. 1992, 7, 325–333. [Google Scholar] [CrossRef]
  3. Heffels, P. Improving fire protection in tunnels for commuter rail traffic. Tunn. Undergr. Space Technol. 1987, 2, 311–314. [Google Scholar] [CrossRef]
  4. Subway Environmental Design Handbook. Volume ii. Subway Environment Simulation Computer Program (ses). Part 2. Programmer’s Manual. 1975. Available online: https://trid.trb.org/View/42725 (accessed on 12 August 2024).
  5. Jun, K.J.; Hwang, Y.C.; Yune, C.Y. Field measurement of temperature inside tunnel in winter in Gangwon, Korea. Cold Reg. Sci. Technol. 2017, 143, 32–42. [Google Scholar] [CrossRef]
  6. Bidarmaghz, A.; Narsilio, G.A. Heat exchange mechanisms in energy tunnel systems. Geomech. Energy Environ. 2018, 16, 83–95. [Google Scholar] [CrossRef]
  7. Ninikas, K.; Hytiris, N.; Emmanuel, R.; Aaen, B.; Younger, P.L. Heat recovery from air in underground transport tunnels. Renew. Energy 2016, 96, 843–849. [Google Scholar] [CrossRef]
  8. Ninikas, K.; Hytiris, N.; Emmanuel, R.; Aaen, B. The Performance of an ASHP System Using Waste Air to Recover Heat Energy in a Subway System. Clean Technol. 2019, 1, 154–163. [Google Scholar] [CrossRef]
  9. Krasyuk, A.M.; Lugin, I.V.; Pavlov, S.A. Experimental research into air distribution in a terminal subway station. Tunn. Undergr. Space Technol. 2019, 85, 21–28. [Google Scholar] [CrossRef]
  10. Olander, L. Do Train Tunnels Need Ventilation Systems. Int. J. Vent. 2010, 9, 89–92. [Google Scholar] [CrossRef]
  11. Subway Environmental Design Handbook; Urban Mass Transportation Administration: Washington, DC, USA, 1976.
  12. Ninikas, K.; Hytiris, N.; Emmanuel, R.; Aaen, B. Heat energy from a shallow geothermal system in Glasgow, UK: Performance evaluation design. Environ. Geotech. 2017, 7, 274–281. [Google Scholar] [CrossRef]
  13. Ninikas, K.; Hytiris, N.; Emmanuel, R.; Aaen, B. Recovery and Valorisation of Energy from Wastewater Using a Water Source Heat Pump at the Glasgow Subway: Potential for Similar Underground Environments. Resources 2019, 8, 169. [Google Scholar] [CrossRef]
  14. Ke, M.T.; Cheng, T.C.; Wang, W.P. Numerical simulation for optimizing the design of subway environmental control system. Build. Environ. 2002, 37, 1139–1152. [Google Scholar] [CrossRef]
  15. Lassow, W.; Lustenader, E.L.; Schoch, K.F. A Thermal Model for the Evaluation of Subway Ventilation and Air Conditioning. IEEE Trans. Ind. Appl. 2007, IA-8, 504–513. [Google Scholar] [CrossRef]
  16. Zeng, Y.; Liu, K.; Zhou, X.; Fan, L. Tunnel temperature fields analysis under the couple effect of convection-conduction in cold regions. Appl. Therm. Eng. 2017, 120, 378–392. [Google Scholar] [CrossRef]
  17. Zhang, Y.; Li, X. Response-surface-model based on influencing factor analysis of subway tunnel temperature. Build. Environ. 2019, 160, 106140. [Google Scholar] [CrossRef]
  18. Zhang, Y.; Li, X. Monitoring and analysis of subway tunnel thermal environment: A case study in Guangzhou, China. Sustain. Cities Soc. 2020, 55, 102057. [Google Scholar] [CrossRef]
  19. Zhang, G.; Cao, Z.; Wang, W.; Mei, X.; Zhao, X.; Shen, S.; Na, T. Field test and numerical investigation on thermal environment of tunnel with air layer structure. Build. Environ. 2021, 203, 108105. [Google Scholar] [CrossRef]
  20. Yang, B.; Sun, Y.; Yao, Y.; Ni, L. Field measurement and analysis of subway tunnel thermal environment in severe cold region. Build. Environ. 2023, 243, 110629. [Google Scholar] [CrossRef]
  21. Teodosiu, C.I.; Ilie, V.; Dumitru, R.G.; Teodosiu, R.S. Assessment of ventilation efficiency for emergency situations in subway systems by CFD modeling. Build. Simul. 2016, 9, 319–334. [Google Scholar] [CrossRef]
  22. Juraeva, M.; Ryu, K.J.; Jeong, S.H.; Song, D.J. Influence of mechanical ventilation-shaft connecting location on subway tunnel ventilation performance. J. Wind. Eng. Ind. Aerodyn. 2013, 119, 114–120. [Google Scholar] [CrossRef]
  23. Vidmar, P.; Petelin, S.; Luin, B. Upgrade of a transverse ventilation system in a bi-directional tunnel. Therm. Sci. 2012, 16, 1067–1080. [Google Scholar] [CrossRef]
  24. Ji, Y.; Wang, W.; Fan, Y.; Hu, S. Coupling effect between tunnel lining heat exchanger and subway thermal environment. Renew. Energy 2023, 217, 119165. [Google Scholar] [CrossRef]
  25. Brandl, H. Energy foundations and other thermo-active ground structures. J. Géotechnique 2006, 56, 81–122. [Google Scholar] [CrossRef]
  26. Liu, N. Study on the Law and Treatment Strategy of Thermal Pollution in Subway Tunnel; Qingdao University of Technology: Qingdao, China, 2018. [Google Scholar]
  27. Liu, G.; Li, C.; Hu, S.; Ji, Y.; Tong, Z.; Wang, Y.; Tong, L.; Mao, Z.; Lu, S. Study on heat transfer model of capillary exchanger in subway source heat pump system. Renew. Energy 2020, 150, 1074–1088. [Google Scholar] [CrossRef]
  28. Ren, M.; Yuan, Y.; Cao, X.; Sun, L.; Jiang, F. Numercial analysis on the thermal performance of capillary heat exchange system in metro running tunnel. Energy Built Environ. 2020, 1, 207–214. [Google Scholar] [CrossRef]
  29. Tong, L.; Liu, N.; Hu, S.; Ji, Y.; Lu, S.; Liu, G.; Tong, Z. Study on key design parameters of subway source heat pump system with capillary exchanger. Renew. Energy 2021, 164, 183–193. [Google Scholar] [CrossRef]
  30. Ji, Y.; Wu, W.; Qi, H.; Wang, W.; Hu, S. Heat transfer performance analysis of front-end capillary heat exchanger of a subway source heat pump system. Energy 2022, 246, 123424. [Google Scholar] [CrossRef]
  31. Tong, Z.; Guan, Y.; Cao, T.; Ji, Y.; Hu, S.; Liu, G.; Liu, N.; Fan, Y. Onsite measurement and performance analysis of capillary heat pump system used in subway tunnels. Appl. Therm. Eng. 2022, 204, 118008. [Google Scholar] [CrossRef]
  32. Ji, Y.; Shen, S.; Wang, X.; Zhang, H.; Qi, H.; Hu, S. Impact of groundwater seepage on thermal performance of capillary heat exchangers in subway tunnel lining. Renew. Energy 2024, 227, 120551. [Google Scholar] [CrossRef]
  33. Bidarmaghz, A.; Narsilio, G.A.; Buhmann, P.; Moormann, C.; Westrich, B. Thermal interaction between tunnel ground heat exchangers and borehole heat exchangers. Geomech. Energy Environ. 2017, 10, 29–41. [Google Scholar] [CrossRef]
  34. Zheng, C. Research on Thermal Environment and Heat Dissipation Methods of Subway Station Tunnels in Guangzhou Area; Guangzhou University: Guangzhou, China, 2020. [Google Scholar]
  35. Cheng, Y. Research on Prediction Model of Thermal Environment of Metro Capillary Heat Pump; Qingdao University of Technology: Qingdao, China, 2018. [Google Scholar]
  36. Liang, G.; Huang, L. Analysis of Energy Consumption and Renewable Energy Saving Effect of Metro B-type Train. J. Urban Mass Transit. 2016. [Google Scholar]
  37. Wu, W. Study on Thermal Characteristics and Ventilation System of Subway Tunnel in Severe Cold Region; Harbin Institute of Technology: Harbin, China, 2018. [Google Scholar]
  38. Gong, F. Subway Tunnel Temperature Characteristics and Its Impact on the Site Environment; Chongqing University: Chongqing, China, 2014. [Google Scholar]
  39. Qi, J.; Zhao, L.; Wang, J.; Li, D.; Guo, Y.; Deng, B. Measurement and characteristic analysis of piston wind in subway tunnels. J. Railw. Sci. Eng. 2016, 13, 740–747. [Google Scholar]
  40. Benz, S.A.; Bayer, P.; Menberg, K.; Jung, S.; Blum, P. Spatial resolution of anthropogenic heat fluxes into urban aquifers. J. Sci. Total Environ. 2015, 524–525, 427–439. [Google Scholar] [CrossRef] [PubMed]
  41. Tong, L.; Hu, S.; Lu, S.; Wang, Y. Study on heat transfer performance of metro tunnel capillary heat exchanger—ScienceDirect. Sustain. Cities Soc. 2019, 45, 683–685. [Google Scholar] [CrossRef]
Figure 1. Subway source heat pump system.
Buildings 14 02524 g001
Figure 2. Internal heat source of subway tunnel.
Buildings 14 02524 g002
Figure 3. Subway source heat pump system diagram.
Buildings 14 02524 g003
Figure 4. Flowchart of the study.
Buildings 14 02524 g004
Figure 5. Comparison of measured and simulated values of tunnel temperature in winter.
Buildings 14 02524 g005
Figure 6. Comparison of measured and simulated values of tunnel temperature in summer.
Buildings 14 02524 g006
Figure 7. Simulation of tunnel air temperature during different operating periods of the subway. (no thermal interference).
Buildings 14 02524 g007
Figure 8. Comparison of simulated and measured values of water supply on the load side.
Buildings 14 02524 g008
Figure 9. Comparison of simulated and measured values of return water on the load side.
Buildings 14 02524 g009
Figure 10. Comparison of simulated and measured values of unit COP.
Buildings 14 02524 g010
Figure 11. Simulation of tunnel air temperature during different operating periods of the subway. (with thermal interference).
Buildings 14 02524 g011
Figure 12. Comparison of tunnel air temperature with or without capillary in the first year of subway operation.
Buildings 14 02524 g012
Figure 13. Comparison of tunnel air temperature with and without capillary in the 30th year of subway operation.
Buildings 14 02524 g013
Table 1. The parameter settings of the tunnel air module.
SymbolParameterValueUnit
r 1 Starting resistance coefficient2/
WTrain weight159.6T
L 1 Train travel distance during the starting phase 10m
V 1 Train speed at the beginning of braking22.8m/s
V 2 Train speed at the end of braking0m/s
L 2 Train travel distance2250m
V 3 Train speed at a constant speed19.44m/s
nThe number of train formations4/
M Air conditioner condensation heat generation35kJ
tTrain operation hours138s
M g Motor output power37.5t
f Load factor0.85/
η Motor efficiency0.921/
W g Interval tunnel lighting heat generation6000W/km
ρ Outdoor air density1.29kg/m3
APiston air shaft area20m2
vTunnel wind speed3m/s
Table 2. Each structural layer material parameters of the tunnel.
MeaningValueUnit
Thickness of second lining0.29m
Thickness of manger plate0.01m
Thickness of geotextile0.002m
Thickness of motar0.1m
Thickness of pipe wall0.00085m
Thickness of first lining0.22m
Thickness of the water layer0.0026m
Thermal conductivity of 2nd and 1st lining3.2W/(m·K)
Thermal conductivity of manger plate1.5W/(m·K)
Thermal conductivity of geotextie0.5W/(m·K)
Thermal conductivity of motar0.97W/(m·K)
Thermal conductivity of capillary pipe wall0.24W/(m·K)
Thermal conductivity of the water0.62W/(m·K)
Table 3. Relationship between system running time and seasonal signal.
DateSeasonHoursOutput Signal
5.1–6.15Transition season1–10804
6.16–9.30Cooling season1080–36723
9.30–11.15Transition season3672–47764
11.16–4.5Heating season4776–81602
4.6–4.30Transition season8160–87604
Table 4. Measured and simulated water temperature values of the supply and return on the load side.
TimeWater Supply Temperature On Load SideWater Return Temperature On Load Side
Measured Value/°CSimulated Value/°CRelative Error %Measured Value/°CSimulated Value/°CRelative Error %
8:0018.819.855.5624.125.726.72
9:0014.915.957.0719.721.659.92
10:0012.413.478.6316.818.459.2
11:0010.811.415.6314.816.098.72
12:009.510.288.2013.414.568.66
13:008.69.318.2612.312.844.39
14:007.98.548.0811.412.156.58
15:007.37.999.4510.811.587.22
16:006.87.175.391010.636.30
Table 5. Comparison of fitting values of tunnel air temperature with or without capillary heat exchangers in the first year.
SpeciesWith Capillary Heat ExchangerWithout Capillary Heat Exchanger
Temperature (°C)
Maximum23.6821.71
Minimum9.1512.57
Average15.8117.06
Table 6. Comparison of fitting values of tunnel air temperature with or without capillary heat exchangers in the 30th year.
SpeciesWith Capillary Heat ExchangerWithout Capillary Heat Exchanger
Temperature(°C)
Maximum30.9532.24
Minimum15.0922.97
Average22.5427.54
Disclaimer/Publisher’s Note: The statements, opinions and data contained in all publications are solely those of the individual author(s) and contributor(s) and not of MDPI and/or the editor(s). MDPI and/or the editor(s) disclaim responsibility for any injury to people or property resulting from any ideas, methods, instructions or products referred to in the content.

