

Integration of Photovoltaic Systems for Energy Self-Sufficient Low-Rise Multi-Family Residential Buildings in Republic of Korea

Abstract
:1. Introduction
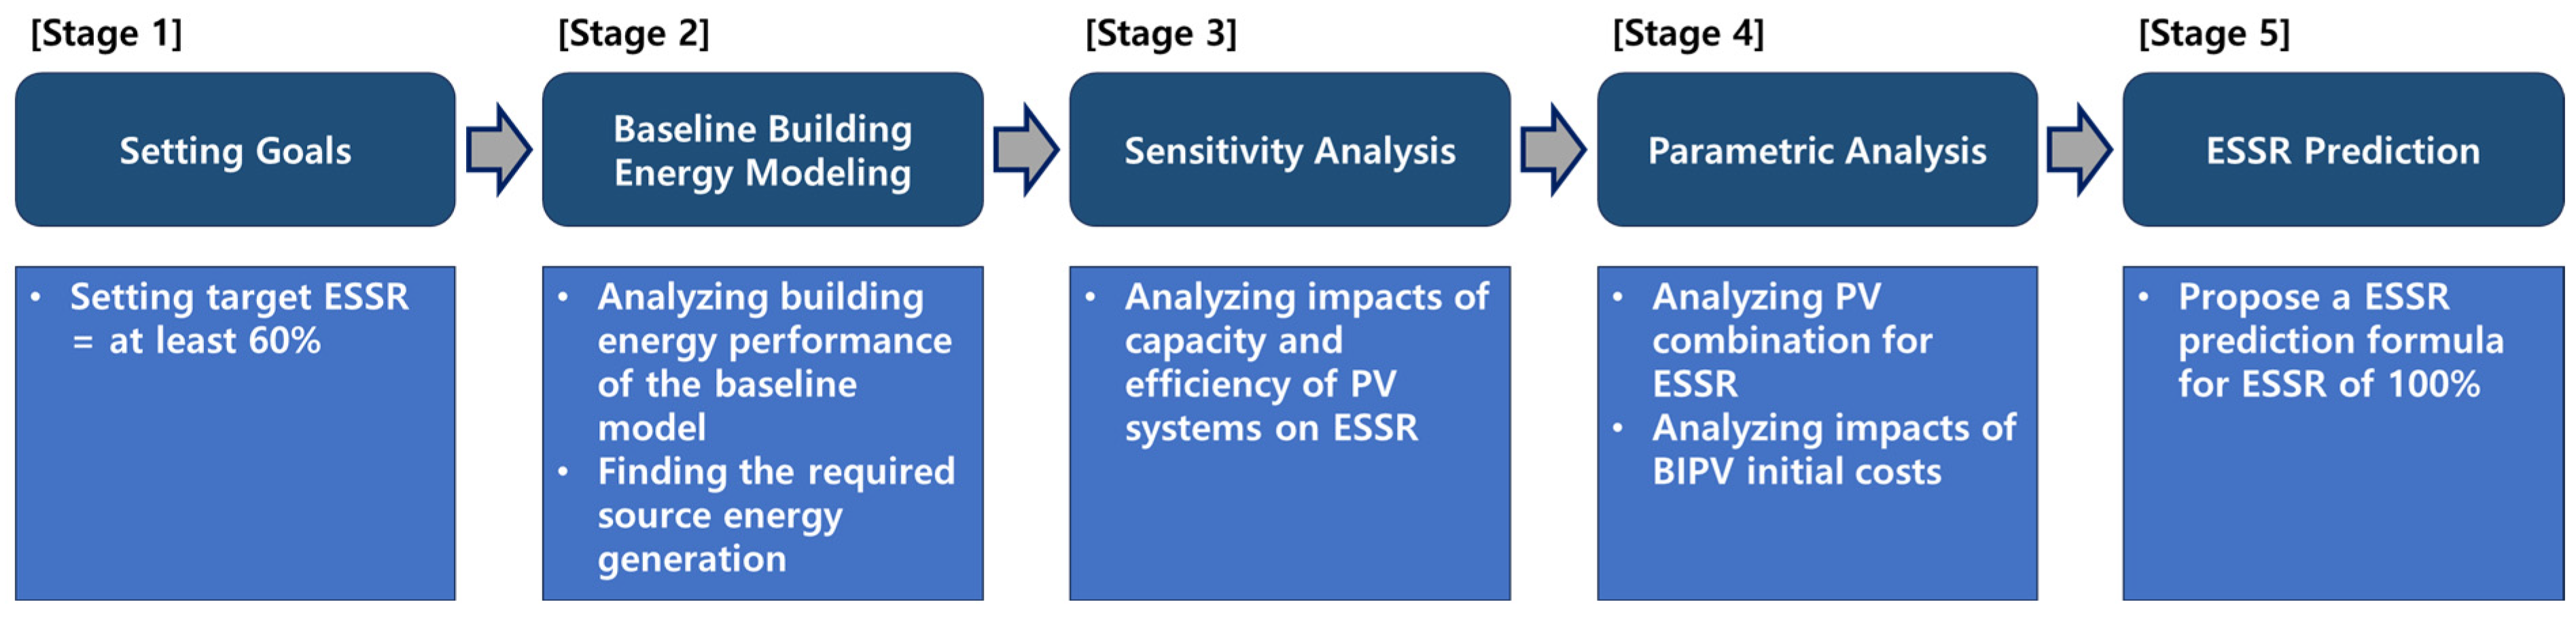
2. Methodology
3. Building Energy Modeling
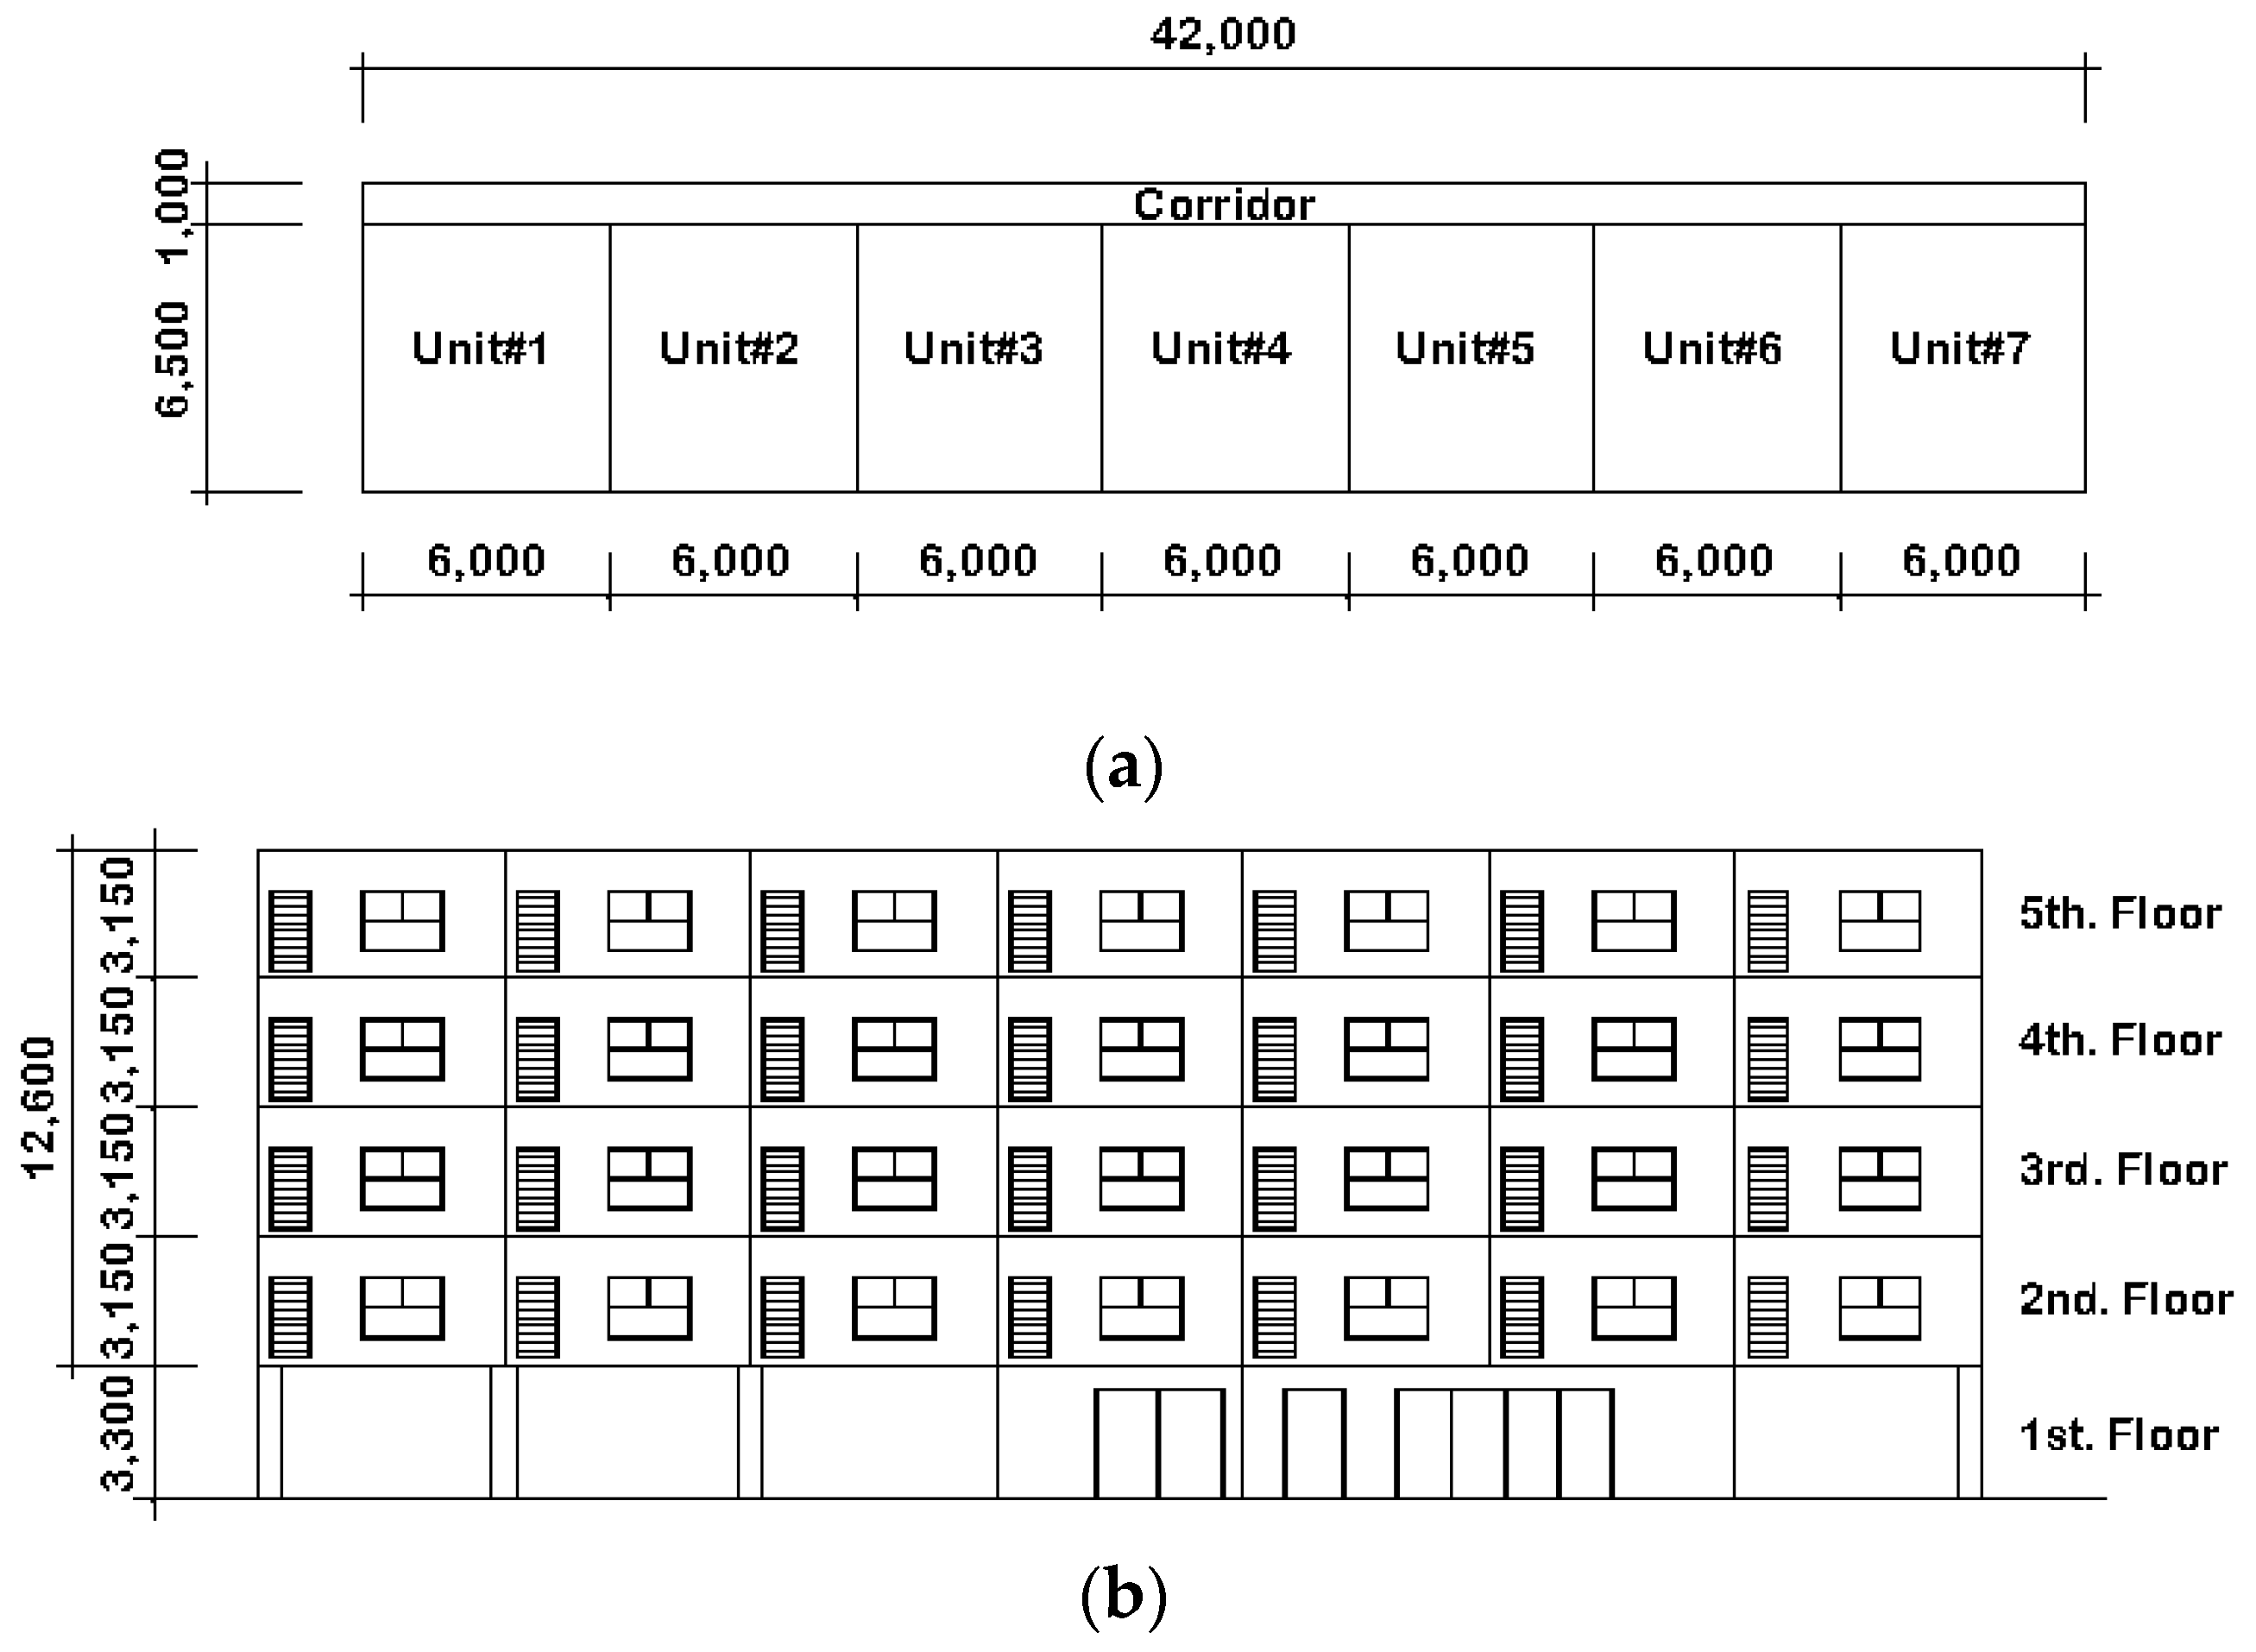
3.1. Baseline Building Energy Modeling
3.2. Parameters for the Sensitivity Analysis
4. Building Energy Simulation Results
4.1. Energy Performance of the Baseline Model
4.2. Results of the Sensitivity Analysis
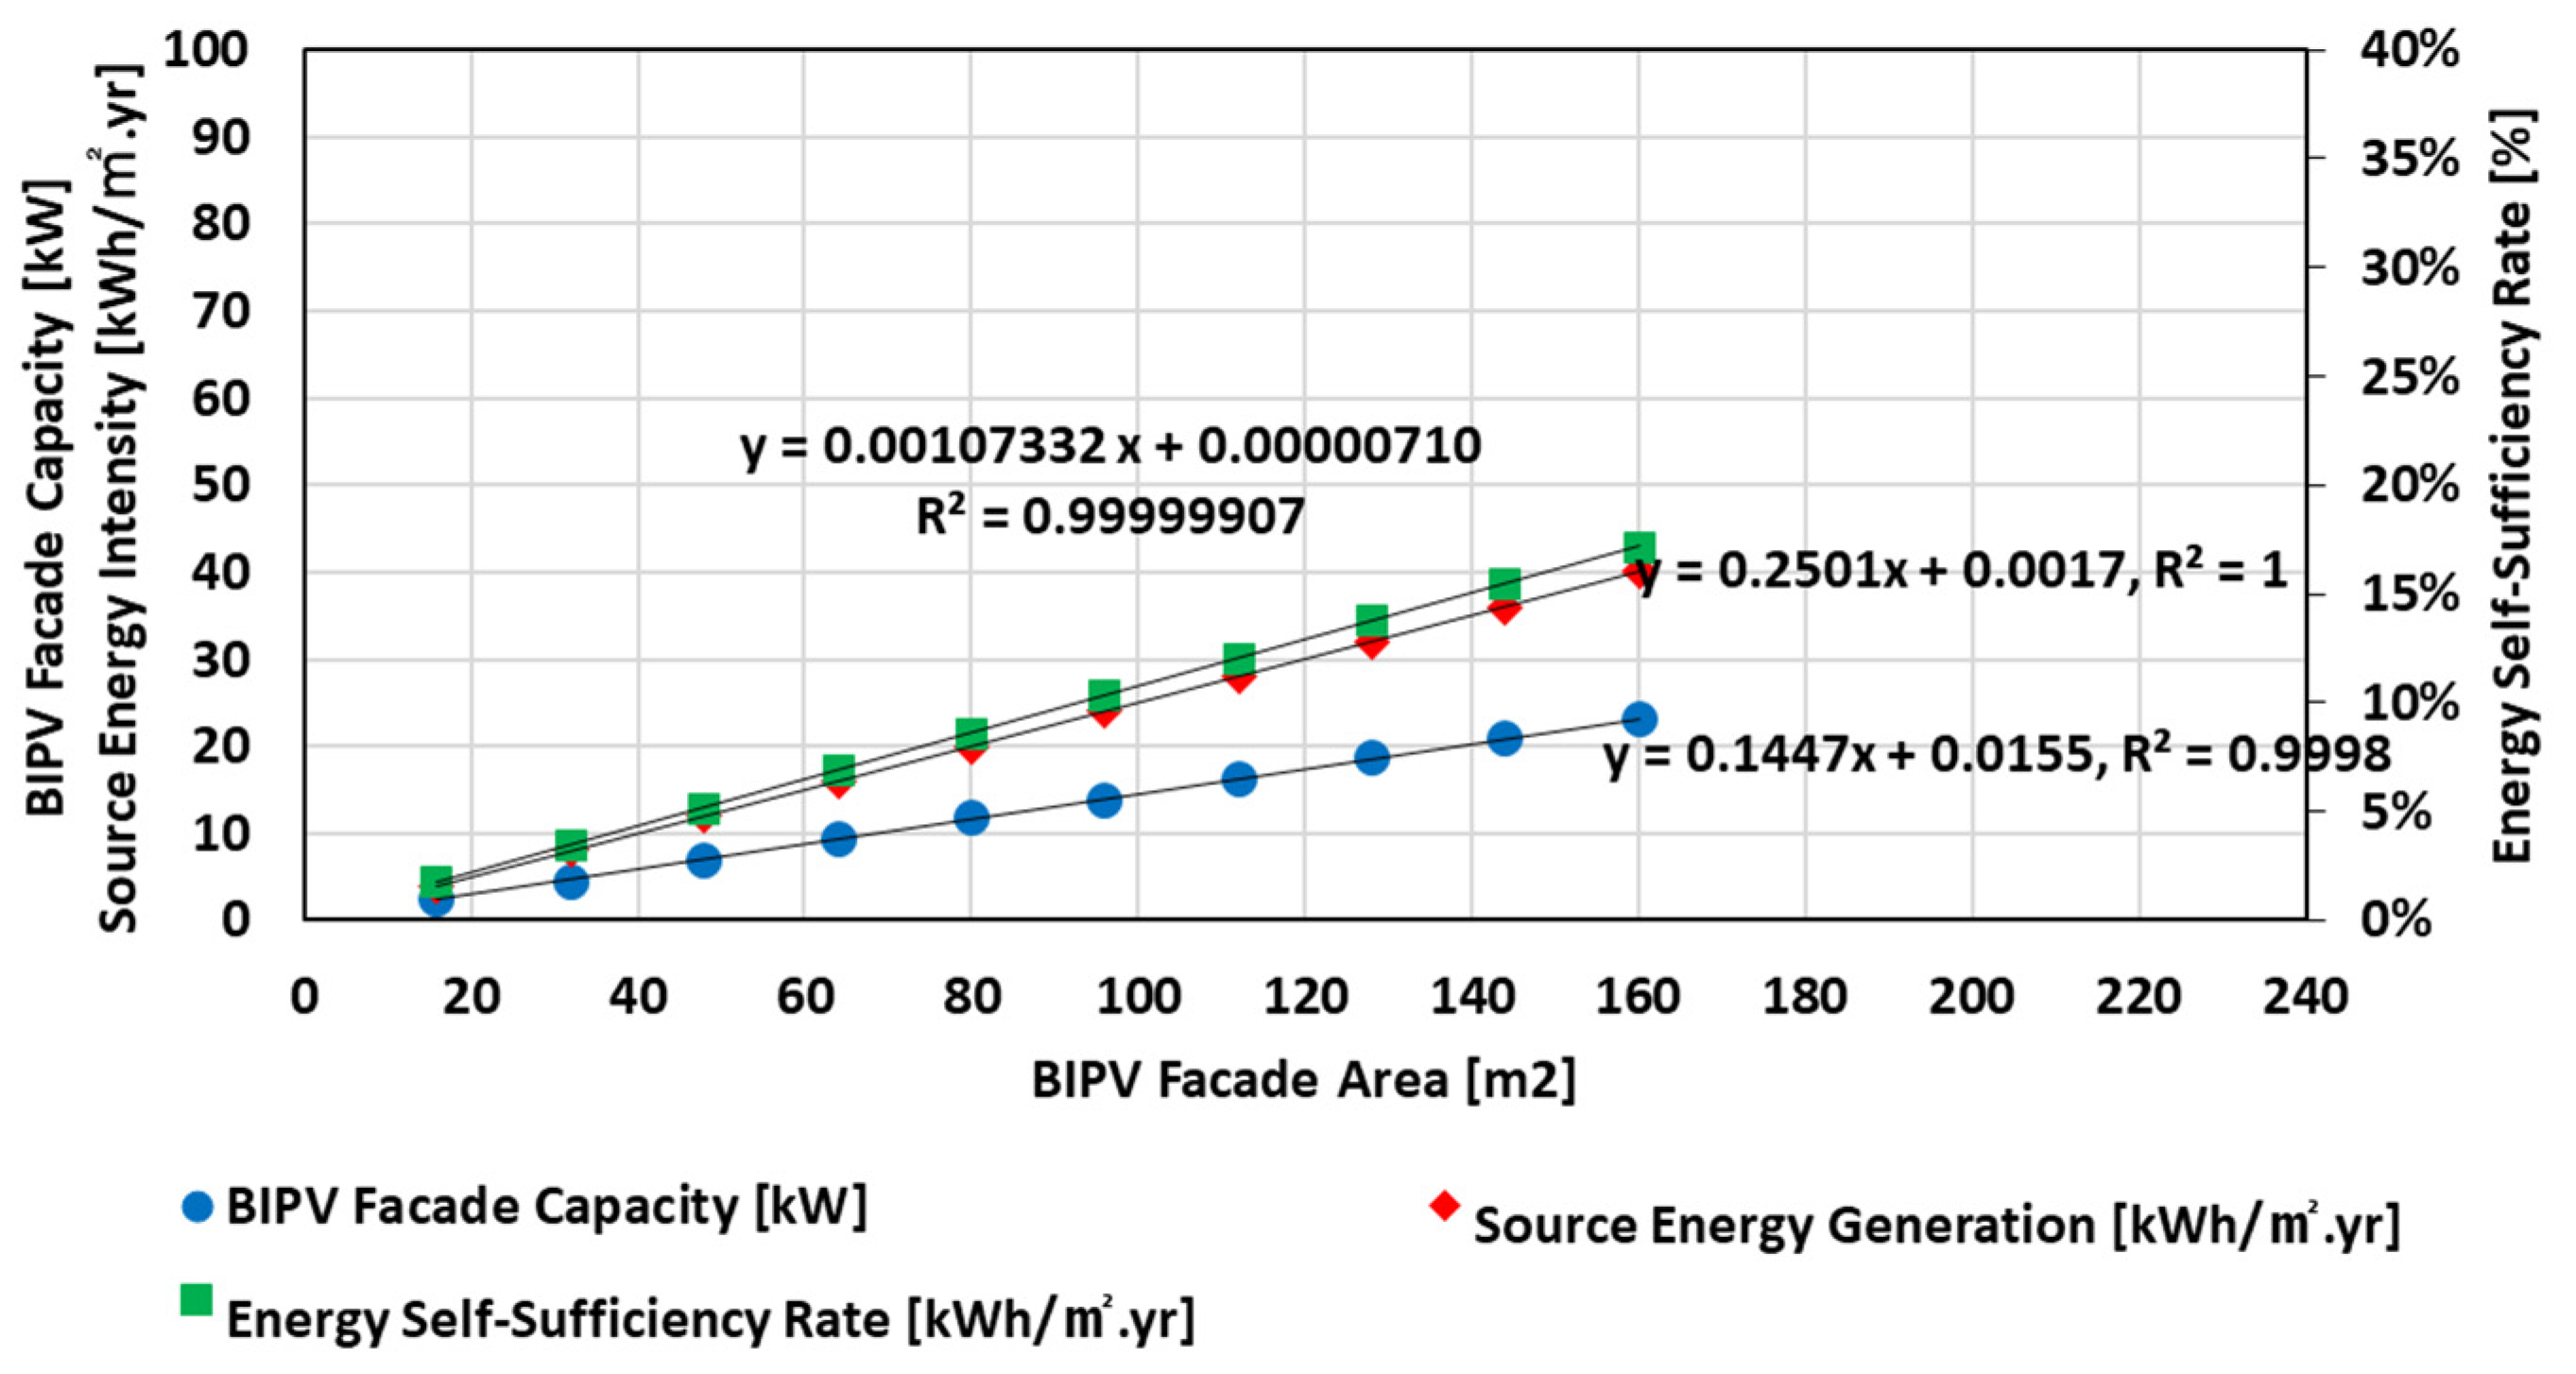
4.2.1. Impact of PV System Capacities
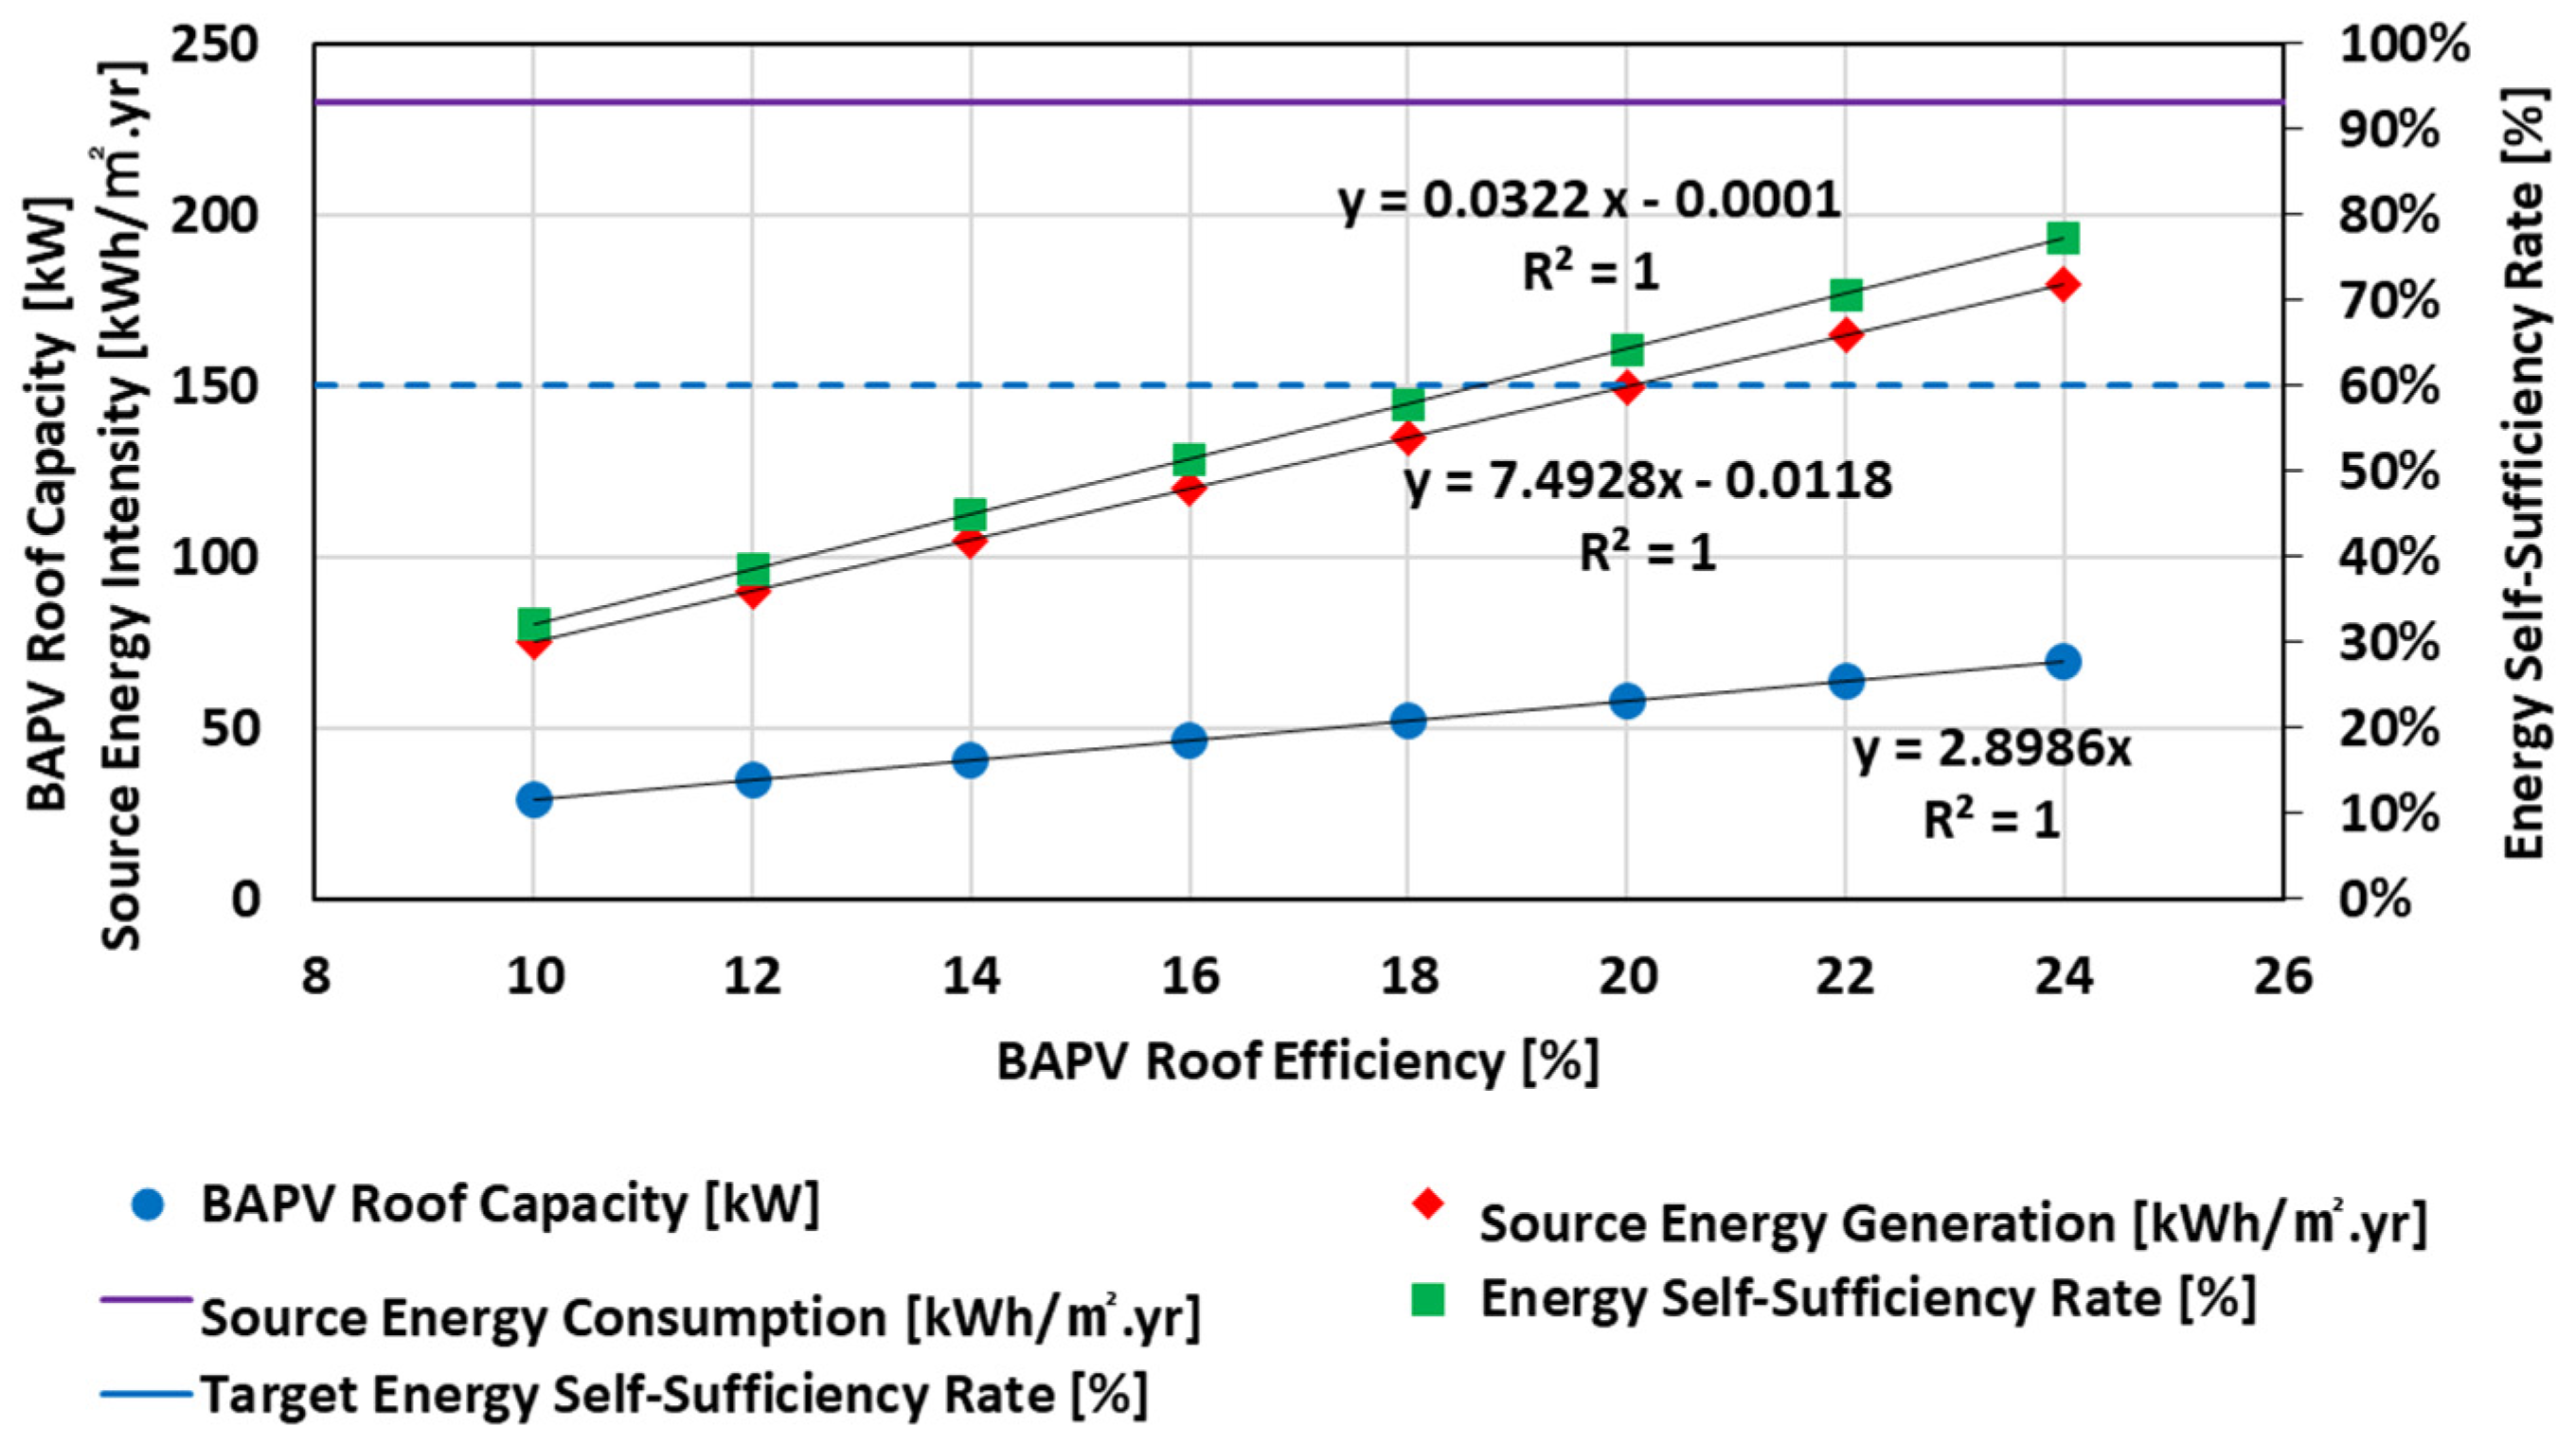
4.2.2. Impact of PV System Efficiencies
5. Analysis
5.1. Impact of Combining PV Systems on Achieving the Target ESSR
5.2. Impact of BIPV Facade Initial Costs
5.3. ESSR Prediction Models for PV Systems
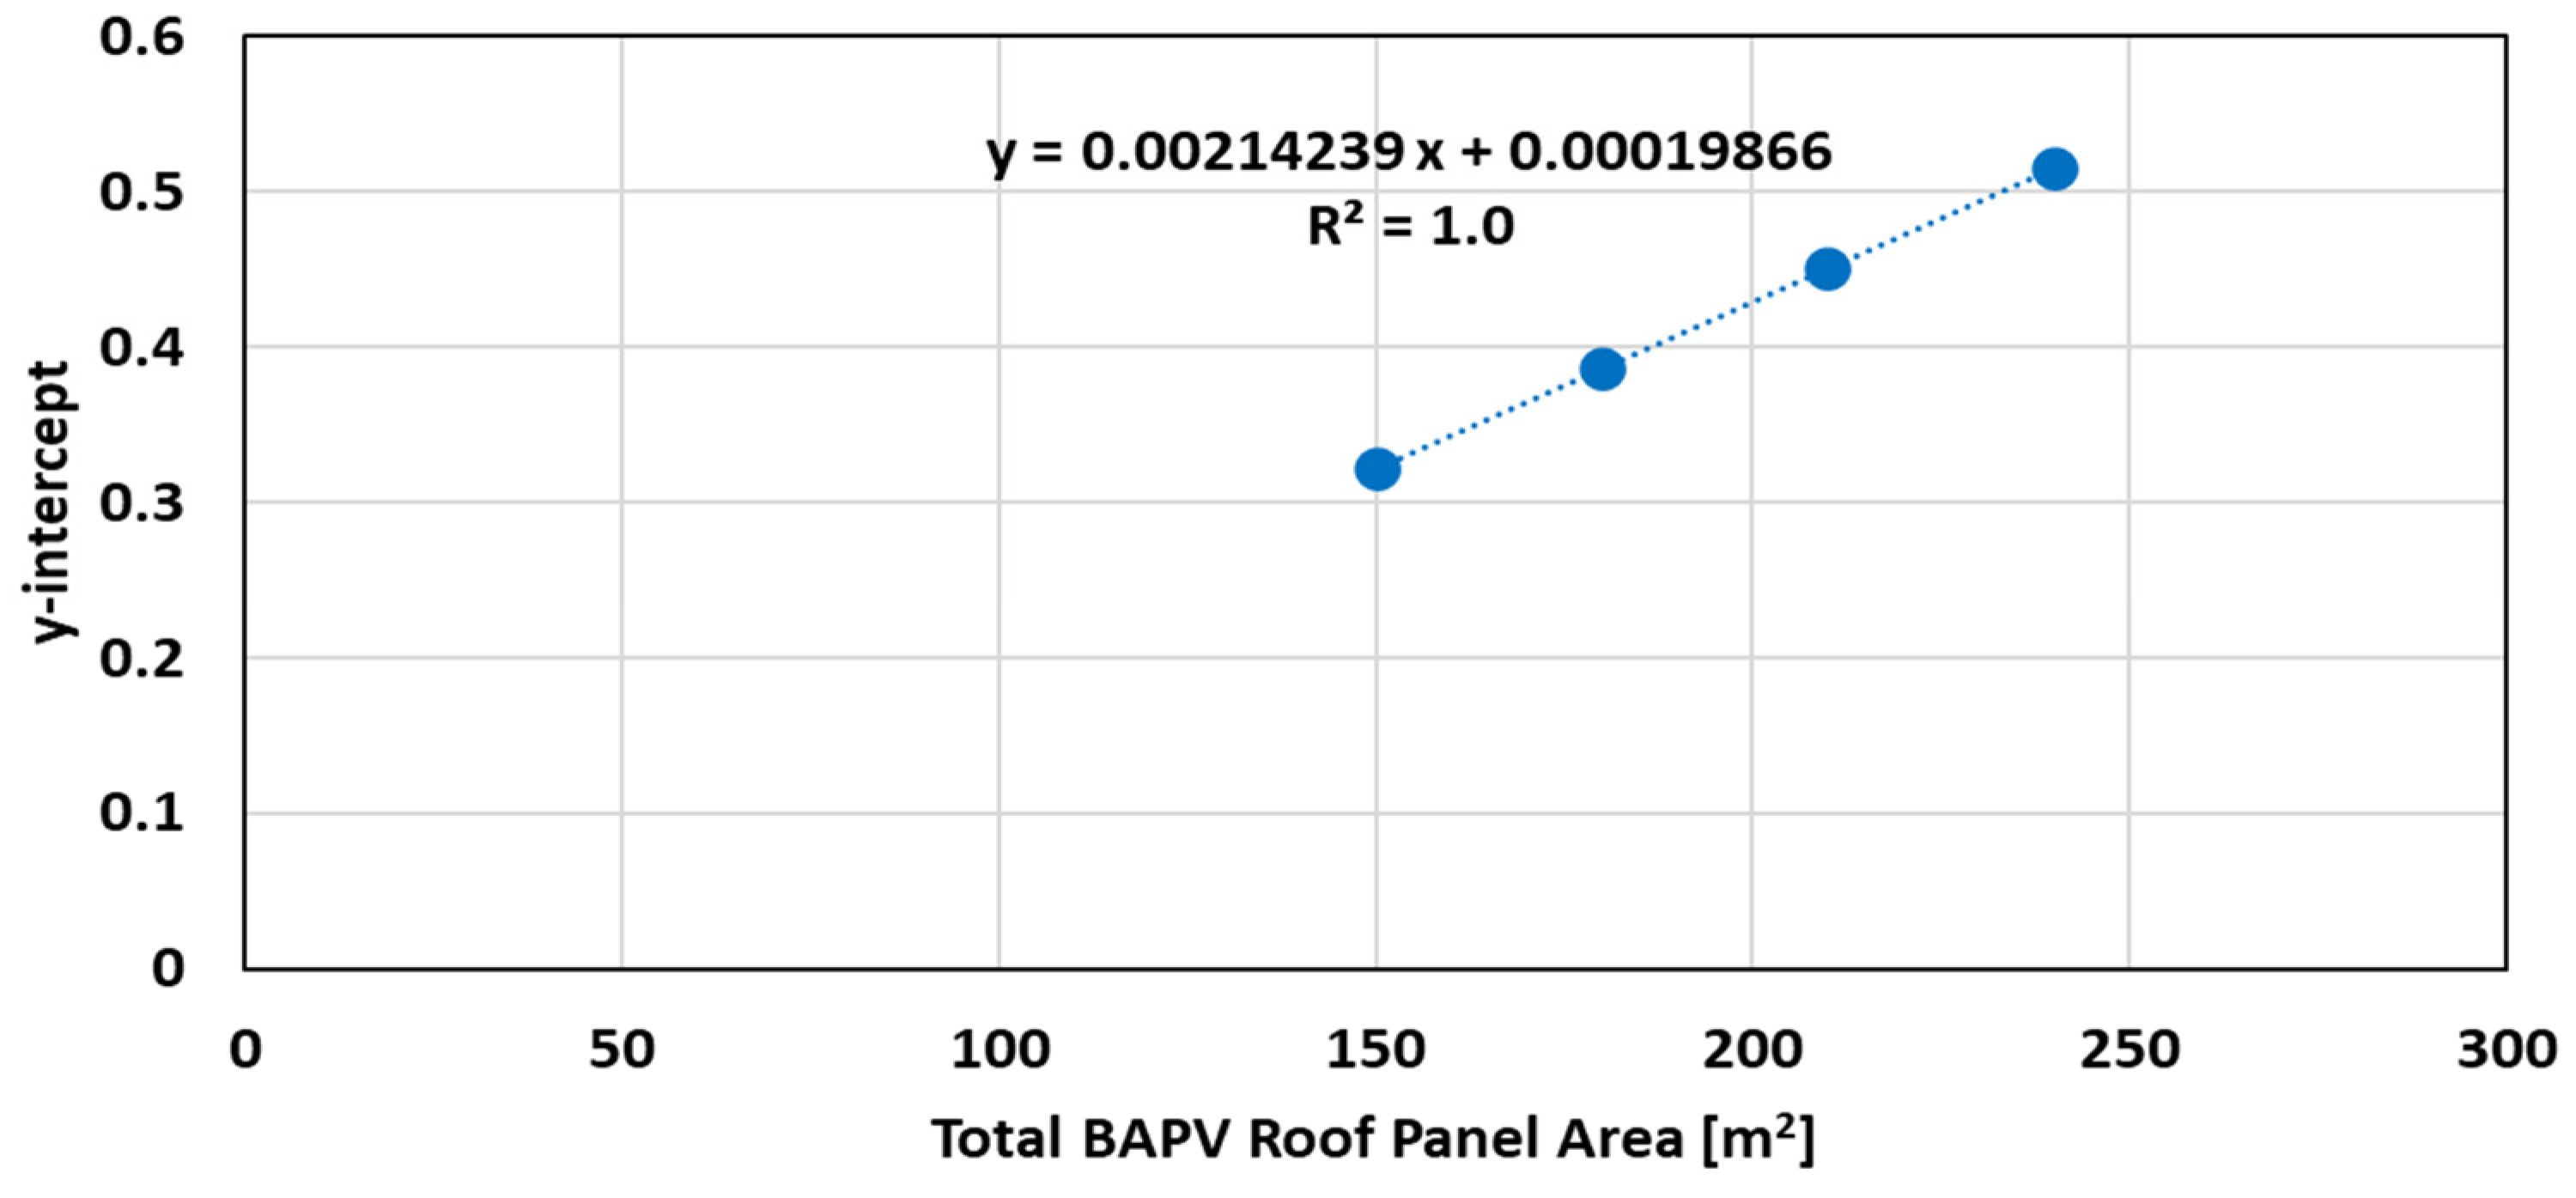
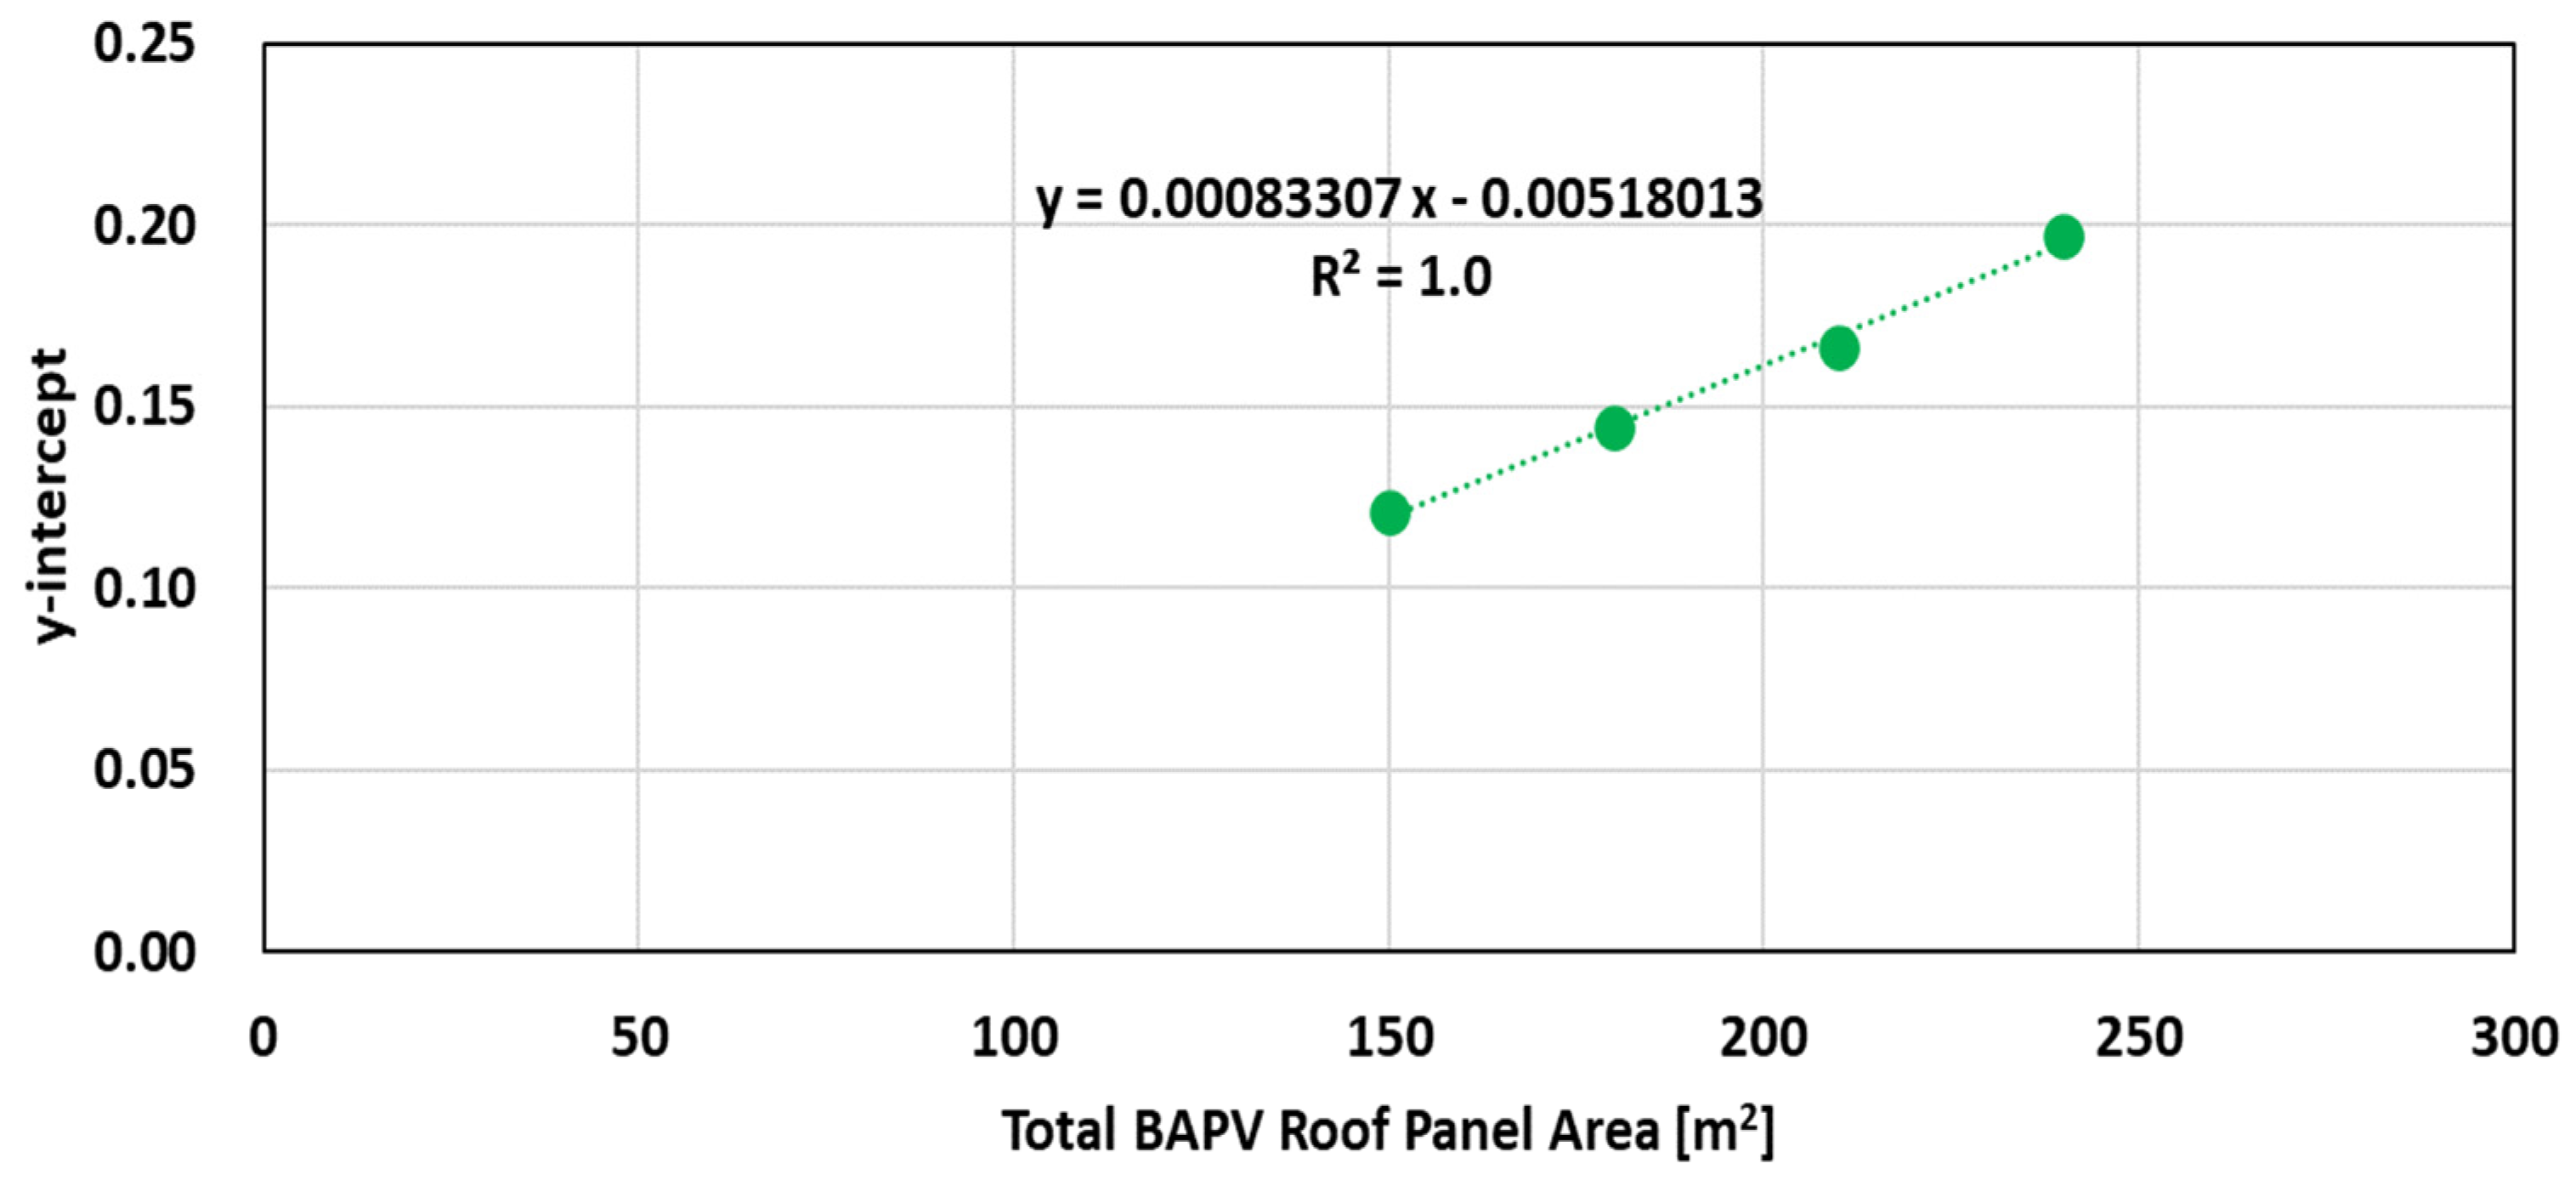
5.3.1. ESSR Prediction Model Regression Analysis
5.3.2. Verification of the ESSR Prediction Models
6. Conclusions
Author Contributions
Funding
Data Availability Statement
Conflicts of Interest
References
- International Energy Agency. Efficiency & Demand. Available online: https://www.iea.org/countries (accessed on 22 June 2024).
- U.S. Energy Information Administration. Annual Energy Review 2023. Available online: https://www.eia.gov/totalenergy/data/annual/index.php (accessed on 22 June 2024).
- Korea Energy Economics Institute. 2023 Yearbook of Energy Statistics—Data up to 2022; Korea Energy Economics Institute: Ulsan, Republic of Korea, 2023; ISSN 1226-606X. [Google Scholar]
- Korea Energy Agency. Zero Energy Building Certification. Available online: https://zeb.energy.or.kr/BC/BC00/BC00_01_001.do (accessed on 22 June 2024).
- Korean Statistical Information Service. Housing Census. Available online: https://kosis.kr/eng/statisticsList/statisticsListIndex.do?parentId=I1.1&menuId=M_01_01&vwcd=MT_ETITLE&parmTabId=M_01_01#content-group (accessed on 22 June 2024).
- Wu, W.; Skye, H.M. Residential net-zero energy buildings: Review and perspective. Renew. Sustain. Energy Rev. 2021, 142, 110859. [Google Scholar] [CrossRef] [PubMed]
- Feng, W.; Zhang, Q.; Ji, H.; Wang, R.; Zhou, N.; Ye, Q.; Hao, B.; Li, Y.; Luo, D.; Lau, S.S.Y. A review of net zero energy buildings in hot and humid climates: Experience learned from 34 case study buildings. Renew. Sustain. Energy Rev. 2019, 114, 109303. [Google Scholar] [CrossRef]
- Wells, L.; Rismanchi, B.; Aye, L. A review of Net Zero Energy Buildings with reflections on the Australian context. Energy Build. 2018, 158, 616–628. [Google Scholar] [CrossRef]
- Ullah, K.; Prodanovic, V.; Pignatta, G.; Deletic, A.; Santamouris, M. Technological advancements towards the net-zero energy communities: A review on 23 case studies around the globe. Sol. Energy 2021, 224, 1107–1126. [Google Scholar] [CrossRef]
- Omar, A.I.; Khattab, N.M.; Abdel Aleem, S.H.E. Optimal strategy for transition into net-zero energy in educational buildings: A case study in El-Shorouk City, Egypt. Sustain. Energy Technol. Assess. 2022, 49, 101701. [Google Scholar] [CrossRef]
- Alawode, A.; Rajagopalan, P. Feasibility of net zero energy high rise apartment buildings in Australia. Sol. Energy 2022, 231, 158–174. [Google Scholar] [CrossRef]
- Ni, S.; Zhu, N.; Zhang, Z.; Hou, Y.; Li, S. The operational performance of net zero energy wooden structure building in the severe cold zone: A case study in Hailar of China. Energy Build. 2021, 257, 111788. [Google Scholar] [CrossRef]
- Nematchoua, M.K.; Nishimwe, A.M.; Reiter, S. Towards nearly zero-energy residential neighbourhoods in the European Union: A case study. Renew. Sustain. Energy Rev. 2021, 135, 110198. [Google Scholar] [CrossRef]
- Zhang, X.; Wang, A.; Tian, Z.; Li, Y.; Zhu, S.; Shi, X.; Jin, X.; Zhou, X.; Wei, S. Methodology for developing economically efficient strategies for net zero energy buildings: A case study of a prototype building in the Yangtze River Delta, China. J. Clean. Prod. 2021, 320, 128849. [Google Scholar] [CrossRef]
- Panagiotidou, M.; Aye, L.; Rismanchi, B. Optimisation of multi-residential building retrofit, cost-optimal and net-zero emission targets. Energy Build. 2021, 252, 111385. [Google Scholar] [CrossRef]
- Ali, H.H.; Al-Rub, F.A.A.; Shboul, B. Evaluation of Near-net-zero-energy Building Strategies: A Case Study on Residential Buildings in Jordan. Int. J. Energy Econ. Policy 2020, 10, 325–336. [Google Scholar] [CrossRef]
- Lan, L.; Wood, K.L.; Yuen, C. A holistic design approach for residential net-zero energy buildings: A case study in Singapore. Sustain. Cities Soc. 2019, 50, 101672. [Google Scholar] [CrossRef]
- Alajmi, A.; Rodrígueza, S.; Sailor, D. Transforming a passive house into a net-zero energy house: A case study in the Pacific Northwest of the U.S. Energy Convers. Manag. 2018, 172, 39–49. [Google Scholar] [CrossRef]
- Ascione, F.; Bianco, N.; Böttcher, O.; Kaltenbrunner, R.; Vanoli, G.P. Net zero-energy buildings in Germany: Design, model calibration and lessons learned from a case-study in Berlin. Energy Build. 2016, 133, 688–710. [Google Scholar] [CrossRef]
- Zhou, Z.; Feng, L.; Zhang, S.; Wang, C.; Chen, G.; Du, T.; Li, Y.; Zuo, J. The operational performance of ‘‘net zero energy building”: A study in China. Appl. Energy 2016, 177, 716–728. [Google Scholar] [CrossRef]
- Tsalikis, G.; Martinopoulos, G. Solar energy systems potential for nearly net zero energy residential buildings. Sol. Energy 2015, 115, 743–756. [Google Scholar] [CrossRef]
- Cellura, M.; Guarinoa, F.; Longoa, S.; Mistretta, M. Energy life-cycle approach in Net zero energy buildings balance: Operation and embodied energy of an Italian case study. Energy Build. 2015, 72, 371–381. [Google Scholar] [CrossRef]
- Park, B.R.; Chung, M.H. Analysis of the additional energy-saving potential of residential buildings after mandatory zero-energy buildings to achieve carbon neutrality in South Korea. Build. Environ. 2023, 228, 109908. [Google Scholar] [CrossRef]
- Choi, J.; Kee, D.; Lee, J.; Kim, J.J. Understanding heterogeneous consumer preferences for residential zero-energy buildings (ZEBs) in South Korea: A latent class approach. Sustain. Cities Soc. 2023, 97, 104747. [Google Scholar] [CrossRef]
- Ji, C.; Hong, T.; Kim, H.; Yeom, S. Effect of building energy efficiency certificate on reducing energy consumption of non-residential buildings in South Korea. Energy Build. 2022, 255, 111701. [Google Scholar] [CrossRef]
- Ji, C.; Hong, T.; Kim, H. Statistical analysis of greenhouse gas emissions of South Korean residential buildings. Renew. Sustain. Energy Rev. 2022, 156, 111981. [Google Scholar] [CrossRef]
- Kim, K.S.; Yoo, D.C.; Choi, C.; Jang, H.I. Verification of Energy Usage Based on Standard Building Model Development of Low-Rise Residential Buildings in South Korea. Adv. Civ. Eng. 2021, 2021, 6679108. [Google Scholar] [CrossRef]
- Jung, Y.; Heo, Y.; Cho, H.; Kang, Y.T.; Kim, Y.; Lee, H. A plan to build a net zero energy building in hydrogen and electricity-based energy scenario in South Korea. J. Clean. Prod. 2023, 397, 136537. [Google Scholar] [CrossRef]
- Ji, C.; Choi, M.; Hong, T.; Yeom, S.; Kim, H. Evaluation of the effect of a building energy efficiency certificate in reducing energy consumption in Korean apartments. Energy Build. 2021, 248, 111168. [Google Scholar] [CrossRef]
- Munkhbat, U.; Byun, S.Y.; Lee, D.H. A Study on the Prediction of Achieving of Zero Energy Building Certification in an Apartment House according to Early Adoption of Zero-energy Buildings. J. KIAEBS 2021, 15, 313–325. [Google Scholar]
- Wang, S.; Tae, S.; Jang, H. Prediction of the Energy Self-Sufficiency Rate of Major New Renewable Energy Types Based on Zero-Energy Building Certification Cases in South Korea. Sustainability 2021, 13, 11552. [Google Scholar] [CrossRef]
- Lee, H.; Choi, M.; Lee, R.; Kim, D.; Yoon, J. Energy performance evaluation of a plus energy house based on operational data for two years: A case study of an all-electric plus energy house in Korea. Energy Build. 2021, 252, 111394. [Google Scholar] [CrossRef]
- Yang, S.; Cho, H.M.; Yun, B.Y.; Hong, T.; Kim, S. Energy usage and cost analysis of passive thermal retrofits for low-rise residential buildings in Seoul. Renew. Sustain. Energy Rev. 2021, 151, 111617. [Google Scholar] [CrossRef]
- Kim, Y.; Yu, K.H. Study on the Certification Policy of Zero-Energy Buildings in Korea. Sustainability 2020, 12, 5172. [Google Scholar] [CrossRef]
- Kwag, B.C.; Han, S.; Kim, G.T.; Kim, B.; Kim, J.Y. Analysis of the Effects of Strengthening Building Energy Policy on Multifamily Residential Buildings in South Korea. Sustainability 2020, 12, 3566. [Google Scholar] [CrossRef]
- Lee, J.; Shepley, M.M.; Choi, J. Exploring the localization process of low energy residential buildings: A case study of Korean passive houses. J. Build. Eng. 2020, 30, 101290. [Google Scholar] [CrossRef]
- Suh, H.S.; Kim, D.D. Energy performance assessment towards nearly zero energy community buildings in South Korea. Sustain. Cities Soc. 2019, 44, 488–498. [Google Scholar] [CrossRef]
- Song, J.; Oh, S.-D.; Song, S.J. Effect of increased building-integrated renewable energy on building energy portfolio and energy flows in an urban district of Korea. Energy 2019, 189, 116132. [Google Scholar] [CrossRef]
- Eum, J.; Kim, Y. Applicability analysis of residential energy storage system (ESS) using Homer in Korea. In Proceedings of the Grand Renewable Energy 2018 Proceedings, Pacifico Yokohama, Yokohama, Japan, 17–22 June 2018. [Google Scholar]
- Kim, T.H.; Jeong, Y.S. Analysis of Energy-Related Greenhouse Gas Emission in the Korea’s Building Sector: Use National Energy Statistics. Energies 2018, 11, 855. [Google Scholar] [CrossRef]
- Kim, S.-Y.; Choi, H.-S.; Eum, J.-H. Energy-Independent Architectural Models for Residential Complex Plans through Solar Energy in Daegu Metropolitan City, South Korea. Sustainability 2018, 10, 482. [Google Scholar] [CrossRef]
- Park, K.S.; Kim, M.J. Energy Demand Reduction in the Residential Building Sector: A Case Study of Korea. Energies 2017, 10, 1506. [Google Scholar] [CrossRef]
- Oh, J.; Hong, T.; Kim, H.; An, J.; Jeong, K.; Koo, C. Advanced Strategies for Net-Zero Energy Building: Focused on the Early Phase and Usage Phase of a Building’s Life Cycle. Sustainability 2017, 9, 2272. [Google Scholar] [CrossRef]
- Cheong, C.H. Appropriate Size of a Net Zero-Energy Multi-Family Housing using PV system. J. KIAEBS 2017, 11, 113–120. [Google Scholar]
- Kim, J.H.; Kim, H.R.; Kim, J.T. Analysis of Photovoltaic Applications in Zero Energy Building Cases of IEA SHC/EBC Task 40/Annex 52. Sustainability 2015, 7, 8782–8800. [Google Scholar] [CrossRef]
- Park, D.J.; Yu, K.H.; Yoon, Y.S.; Kim, K.H.; Kim, S.S. Analysis of a Building Energy Efficiency Certification System in Korea. Sustainability 2015, 7, 16086–16107. [Google Scholar] [CrossRef]
- Lim, J.H.; Kim, S.I.; Song, S.Y. Improvement of Design Criteria in Heating and Cooling Equipment According to the Consolidation of Design Standard for Energy Saving in Apartment Buildings of Korea. J. Korean Sol. Energy Soc. 2014, 34, 89–97. [Google Scholar] [CrossRef]
- Lee, K.-H.; Lee, J.-K.; Yoon, E.-S.; Joo, M.-C.; Lee, S.-M.; Baek, N.-C. Annual measured performance of building-integrated solar energy systems in demonstration low-energy solar house. J. Renew. Sustain. Energy 2014, 6, 042013. [Google Scholar] [CrossRef]
- Ministry of Land, Infrastructure and Transport. Energy Saving Design Standards for Buildings. Available online: http://www.law.go.kr/ (accessed on 22 June 2024).
- Oh, T.-K.; Lee, D.; Park, M.; Cha, G.; Park, S. Three-Dimensional Visualization Solution to Building-Energy Diagnosis for Energy Feedback. Energies 2018, 11, 1736. [Google Scholar] [CrossRef]
- Kim, C.S. The Influence of Unit Plan Shapes to the Energy Eciency of Collective Housing Simulated by ECO2 Software. Korea Inst. Ecol. Archit. Environ. J. (KIEAE J.) 2015, 15, 89–94. [Google Scholar]
- Lee, A.R.; Kim, J.G.; Kim, J.H.; Jeong, H.G.; Jang, C.Y.; Song, K.D. Comparing the actual heating energy with calculated energy by the amended standard building energy rating system for apartment buildings. Korea Inst. Ecol. Archit. Environ. J. (KIEAE J.) 2015, 15, 103–107. [Google Scholar]
- Kwon, J.H.; Jang, H.I.; Kim, M.K.; Park, H.S.; Suh, S.J. Comparison on the Annual Energy Demand by Building Energy Assessment Tool and Dynamic Energy Simulation. In Proceedings of the 2012 Summer Conference of the Society of Air-Conditioning and Refrigerating Engineers of Korea, Pyeongchang, Republic of Korea, 27–29 June 2012; pp. 363–366. [Google Scholar]
- Kim, S.H.; Kwak, Y.H.; Kim, C.S. The Analysis on Energy Performance of Collective Housing using ECO2 and DesignBuilder Softwares. Korea Inst. Ecol. Archit. Environ. J. (KIEAE J.) 2018, 18, 47–54. [Google Scholar]
- Seoul Metropolitan Government. Standards for Installation and Management of Solar Power Facilities in Seoul. Available online: https://www.seoul.go.kr (accessed on 22 June 2024).
- National Agency for Administrative City Construction. Solar Power Facility Installation Guidelines. Available online: https://naacc.go.kr (accessed on 22 June 2024).
- Korea Energy Agency. 2021 Standard Unit Price for Renewable Energy Sources. Available online: https://www.knrec.or.kr/biz/pds/pds/view.do?no=303 (accessed on 22 June 2024).
- Korea Energy Agency. 2012 Standard Unit Price for Renewable Energy Sources. Available online: https://www.knrec.or.kr/biz/pds/businoti/view.do?no=598 (accessed on 22 June 2024).
- Korea Energy Agency. 2011 Standard Unit Price for Renewable Energy Sources. Available online: https://www.knrec.or.kr/biz/pds/businoti/view.do?no=395 (accessed on 22 June 2024).


| Author | Method | Building Type | Indicator | Variables | Type of Renewable Energy | Conclusion |
|---|---|---|---|---|---|---|
| Bo Rang Park et al. [23] | Simulation | Residential building | Energy use intensity |
| - |
|
| Jihye Choi et al. [24] | Survey | Residential building | Choice probability |
|
| |
| Changyoon Ji et al. [25] | Statistics | Non-residential building | Energy use intensity |
| - |
|
| Changyoon Ji et al. [26] | Statistics | Residential building | Greenhouse gas (GHG) emissions |
| - |
|
| KyungSoo Kim et al. [27] | Survey Statistics Simulation | Residential Building | Energy consumption |
| - |
|
| Yujun Jung et al. [28] | Simulation | Residential building | Energy and economic metrics; life cycle performance |
|
|
|
| Changyoon Ji et al. [29] | Statistics | Residential building | Energy use intensity |
| - |
|
| Munkhbat Undram et al. [30] | Simulation | Residential building | ESSR |
|
|
|
| Seongjo Wang et al. [31] | Simulation | Non-residential building | ESSR |
|
|
|
| Hyomun Lee et al. [32] | Field test | Residential building | Energy generation |
|
|
|
| Sungwoong Yang et al. [33] | Survey simulation | Residential building | Energy consumption |
| - |
|
| Yeweon Kim et al. [34] | Review | Residential and non-residential buildings | - | - |
| |
| Byung Chang Kwag et al. [35] | Simulation | Residential building | Heat loss form factor; energy load; energy use intensity |
| - |
|
| Joohyun Lee et al. [36] | Simulation | Residential building | Energy load; energy use intensity |
| - |
|
| Hye Soo Suh et al. [37] | Simulation | Community building | Energy consumption |
|
|
|
| Jeonghun Song et al. [38] | Simulation | Residential and non-residential buildings | Building energy performance |
|
|
|
| Jiyoung Eum et al. [39] | Simulation | Residential building | Total net present cost |
|
|
|
| Tae-Hyoung Kim et al. [40] | Statistics | Residential and non-residential buildings | Greenhouse gas emissions |
| - |
|
| Sung-Yul Kim et al. [41] | Residential building | Optimum solar power generation |
|
|
| |
| Kwon Sook Park et al. [42] | Statistics | Residential building | Energy consumption |
| - |
|
| Jeongyoon Oh et al. [43] | Review | Residential and non-residential buildings |
| - |
| |
| Chang Heon Cheong [44] | Simulation | Residential building | Energy reduction |
|
|
|
| Jin-Hee Kim et al. [45] | Statistics | Residential and non-residential buildings | Energy generation |
|
|
|
| Duk Joon Park et al. [46] | Review | Residential and non-residential buildings |
| - |
| |
| Lim Jae-Han et al. [47] | Simulation | Residential building | Energy load |
| - |
|
| Kyoung-ho Lee et al. [48] | Field test | Residential building | Energy generation |
|
|
|
| Category | Specification |
|---|---|
| Floor to Ceiling | 2.3 m |
| Floor to Floor | 3.2 m |
| Dwelling Unit Area | Total 1092 m2 39 m2/unit × 7 units/floor × 4 floor |
| Roof Area | 306 m2 |
| Front Exterior Wall Area | 530 m2 |
| Front Exterior Wall Window Area of a Dwelling Unit | (Living Space) Window 1: 3.8 m2/Window 2: 2.9 m2 (Mechanical Room) Louver Window: 1.6 m2 |
| Number of Floors | Five-Story Building First floor: Parking Lots, Lobby, Monitoring Room Second~Fifth Floor: Dwelling Units (Seven Units Per Floor) |
| Main Building Material | Reinforced Concrete |
| Target ESSR | Over 60% (ZEB Grade 3) |
| Element | Category | Specification |
|---|---|---|
| Exterior Wall | Thermal Transmittance (U-value) | 0.167 W/(m2K) |
| Window | Thermal Transmittance (U-value) | 1.00 W/(m2K) |
| Slab on Grade Floor | Thermal Transmittance (U-value) | 0.17 W/(m2K) |
| Roof | Thermal Transmittance (U-value) | 0.15 W/(m2K) |
| Space Heating | Type | Radiant Floor Heating |
| Water Temperature | Supply 80 °C/Return 60 °C | |
| Efficiency [%] | 91% (Decentralized Natural Gas Condensing Boiler) | |
| Domestic Hot Water | Type | Natural Gas Condensing Boiler |
| Water Temperature | Supply 80 °C/Return 60 °C | |
| Ventilation | Type | Energy Recovery Ventilator |
| Capacity (Air Change per Hour) | 0.5 | |
| Efficiency | Heating 70% Cooling 45% | |
| Lighting | Lighting Power Density | 7 W/m2 |
| Infiltration | Air Change per Hour | 6 |
| Parameter | Options | |
|---|---|---|
| BAPV Roof | Area [m2] | 30, 60, 90, 120, 150, 180, 210, 240, 270, 300 |
| Efficiency [%] | 10, 12, 14, 16, 18, 20, 22, 24 | |
| BIPV Facade | Area [m2] | 16, 32, 48, 64, 80, 96, 112, 128, 144, 160 |
| Efficiency [%] | 10, 12, 14, 16, 18, 20, 22, 24 | |
| Category | Space Heat | Space Cool | Hot Water | Lighting | Ventilation | Total |
|---|---|---|---|---|---|---|
| Building Energy Load [kWh/m2· yr] | 51.5 | 0.0 | 30.7 | 12.8 | 0.0 | 95.0 |
| Site Energy Consumption [kWh/m2· yr] | 97.4 | 0.0 | 34.0 | 12.8 | 17.5 | 161.7 |
| Source Energy Consumption [kWh/m2· yr] | 111.9 | 0.0 | 37.9 | 35.1 | 48.1 | 233.0 |
| CASE | Surface Area [m2] | PV Capacity [kW] | Source Energy Generation [kWh/m2·yr] | ESSR [%] | ||||
|---|---|---|---|---|---|---|---|---|
| BAPV Roof | BIPV Facade | BAPV Roof | BIPV Facade | BAPV Roof | BIPV Facade | Total | ||
| Case 1 | 30 | 500 | 6 | 78 | 15.0 | 124.8 | 139.8 | 60.0% |
| Case 2 | 60 | 440 | 12 | 68 | 30.0 | 109.8 | 139.8 | 60.0% |
| Case 3 | 90 | 380 | 17 | 59 | 44.9 | 94.9 | 139.8 | 60.0% |
| Case 4 | 120 | 320 | 23 | 50 | 59.9 | 79.9 | 139.8 | 60.0% |
| Case 5 | 150 | 260 | 29 | 40 | 74.9 | 64.9 | 139.8 | 60.0% |
| Case 6 | 180 | 200 | 35 | 31 | 89.9 | 49.9 | 139.8 | 60.0% |
| Case 7 | 210 | 140 | 41 | 22 | 104.8 | 35.0 | 139.8 | 60.0% |
| Case 8 | 223 | 114 | 43 | 18 | 111.4 | 28.5 | 139.8 | 60.0% |
| Case 9 | 240 | 80 | 46 | 12 | 119.9 | 19.9 | 139.8 | 60.0% |
| Case 10 | 270 | 20 | 52 | 3 | 134.9 | 4.9 | 139.8 | 60.0% |
| Case 11 | 280 | 0 | 54 | 0 | 139.8 | 0.0 | 139.8 | 60.0% |
| Case 12 | 300 | 0 | 58 | 0 | 149.9 | 0.0 | 149.9 | 64.3% |
| Type of PV System | Year | |||
|---|---|---|---|---|
| 2011 | 2012 | 2021 | ||
| BAPV Roof | 1000 KRW/kW | 5650 | 4972 | 1816 |
| USD/kW | 4238 | 3729 | 1362 | |
| BIPV Facade | 1000 KRW/kW | 13,055 | 9553 | - |
| USD/kW | 9791 | 7165 | - | |
| Unit Cost Option | Option 1 | Option 2 | Option 3 | Option 4 | Option 5 | Option 6 | Option 7 |
|---|---|---|---|---|---|---|---|
| BAPV Roof [USD] | 1362 | 1362 | 1362 | 1362 | 1362 | 1362 | 1362 |
| BIPV Facade [USD] | 681 | 845 | 953 | 1362 | 2043 | 2724 | 4086 |
| Ratio | 0.5 | 0.62 | 0.7 | 1.0 | 1.5 | 2.0 | 3.0 |
| Case | BAPV Roof [USD] | Option 1 | Option 2 | Option 3 | Option 4 | Option 5 | Option 6 | Option 7 | |||||||
|---|---|---|---|---|---|---|---|---|---|---|---|---|---|---|---|
| BIPV Facade [USD] | Total Cost [USD] | BIPV Facade [USD] | Total Cost [USD] | BIPV Facade [USD] | Total Cost [USD] | BIPV Facade [USD] | Total Cost [USD] | BIPV Facade [USD] | Total Cost [USD] | BIPV Facade [USD] | Total Cost [USD] | BIPV Facade [USD] | Total Cost [USD] | ||
| Case 1 | 7900 | 52,924 | 60,824 | 65,631 | 73,530 | 74,082 | 81,982 | 105,848 | 113,748 | 158,773 | 166,672 | 211,697 | 219,597 | 317,545 | 325,445 |
| Case 2 | 15,786 | 46,569 | 62,354 | 57,750 | 73,535 | 65,186 | 80,972 | 93,138 | 108,923 | 139,707 | 155,492 | 186,276 | 202,061 | 279,413 | 295,199 |
| Case 3 | 23,685 | 40,245 | 63,930 | 49,908 | 73,593 | 56,334 | 80,019 | 80,490 | 104,175 | 120,735 | 144,421 | 160,981 | 184,666 | 241,471 | 265,156 |
| Case 4 | 31,585 | 33,869 | 65,454 | 42,000 | 73,585 | 47,409 | 78,994 | 67,737 | 99,322 | 101,606 | 133,191 | 135,475 | 167,060 | 203,212 | 234,797 |
| Case 5 | 39,484 | 27,513 | 66,998 | 34,119 | 73,603 | 38,513 | 77,997 | 55,027 | 94,511 | 82,540 | 122,025 | 110,054 | 149,538 | 165,080 | 204,565 |
| Case 6 | 47,370 | 21,158 | 68,528 | 26,238 | 73,608 | 29,617 | 76,987 | 42,316 | 89,686 | 63,474 | 110,845 | 84,632 | 132,003 | 126,948 | 174,319 |
| Case 7 | 55,270 | 14,824 | 70,094 | 18,383 | 73,653 | 20,750 | 76,020 | 29,648 | 84,918 | 44,471 | 99,741 | 59,295 | 114,565 | 88,943 | 144,213 |
| Case 8 | 58,687 | 12,070 | 70,757 | 14,968 | 73,655 | 16,896 | 75,582 | 24,140 | 82,827 | 36,210 | 94,897 | 48,281 | 106,967 | 72,421 | 131,107 |
| Case 9 | 63,170 | 8458 | 71,627 | 10,489 | 73,658 | 11,839 | 75,009 | 16,916 | 80,085 | 25,374 | 88,543 | 33,832 | 97,001 | 50,747 | 113,917 |
| Case 10 | 71,056 | 2071 | 73,127 | 2568 | 73,624 | 2899 | 73,954 | 4142 | 75,198 | 6213 | 77,269 | 8284 | 79,340 | 12,426 | 83,482 |
| Case 11 | 73,687 | 0 | 73,687 | 0 | 73,687 | 0 | 73,687 | 0 | 73,687 | 0 | 73,687 | 0 | 73,687 | 0 | 73,687 |
| Category | BAPV Roof Area [m2] | BIPV Facade Area [m2] | ||||||||
|---|---|---|---|---|---|---|---|---|---|---|
| 100 | 150 | 200 | 250 | 300 | 350 | 400 | 450 | 500 | ||
| Total PV Capacity [kW] | 150 | 45 | 52 | 60 | 68 | 76 | 83 | 91 | 99 | 107 |
| 180 | 51 | 58 | 66 | 74 | 82 | 89 | 97 | 105 | 113 | |
| 210 | 57 | 64 | 72 | 80 | 88 | 95 | 103 | 111 | 119 | |
| 240 | 62 | 69 | 77 | 85 | 93 | 100 | 108 | 116 | 124 | |
| Total Source Energy Generation [kWh/m2. yr] | 150 | 99.9 | 112.3 | 124.8 | 137.3 | 149.8 | 162.3 | 174.8 | 187.2 | 199.7 |
| 180 | 114.9 | 127.3 | 139.8 | 152.3 | 164.8 | 177.3 | 189.8 | 202.2 | 214.7 | |
| 210 | 129.8 | 142.2 | 154.7 | 167.2 | 179.7 | 192.2 | 204.7 | 217.1 | 229.6 | |
| 240 | 144.9 | 157.3 | 169.8 | 182.3 | 194.8 | 207.3 | 219.8 | 232.2 | 244.7 | |
| ESSR [%] | 150 | 42.9 | 48.2 | 53.6 | 58.9 | 64.3 | 69.7 | 75.0 | 80.4 | 85.7 |
| 180 | 49.3 | 54.7 | 60.0 | 65.4 | 70.7 | 76.1 | 81.4 | 86.8 | 92.2 | |
| 210 | 55.7 | 61.1 | 66.4 | 71.8 | 77.1 | 82.5 | 87.9 | 93.2 | 98.6 | |
| 240 | 62.2 | 67.5 | 72.9 | 78.2 | 83.6 | 88.9 | 94.3 | 99.7 | 105.0 | |
| Energy Efficiency Measure | Options | ||||||
|---|---|---|---|---|---|---|---|
| Dwelling Unit Information | Floor Area of Units [m2] | 49 | 48 | 43 | 39 | 36 | |
| Number of Dwelling Units | 2 | 3 | 3 | 16 | 4 | ||
| Passive System | Building Envelop: Opaque Element | Thermal Transmittance (U-value) | 0.137 W/(m2K) | ||||
| Building Envelop: Window | Thermal Transmittance (U-value) | 0.693 W/(m2K) | |||||
| Infiltration | Air Change per Hour | 5.50 | |||||
| Active System | Interior Lighting | Lighting Power Density | 4.67 W/m2 | ||||
| Space Cooling | Type | Space Cooling Not Installed | |||||
| Space Heating | Type | Radiant Floor Heating | |||||
| Efficiency | 91.1% (Natural Gas Boiler) | ||||||
| Domestic Hot Water | Type | Natural Gas Boiler | |||||
| Water Temperature | Supply 80 °C/Return 60 °C | ||||||
| Ventilation | Type | Mechanical Ventilator Not Installed | |||||
| Energy Generation System | BAPV Roof | Area | 240 m2 (52 kW = 500 Wp × 104 panels | ||||
| Efficiency | 21.6% | ||||||
| BIPV Facade | Area | 138 m2 (17.2 kW = 123 Wp ∗ 140 panels) | |||||
| Efficiency | 12.3% | ||||||
| Category | Space Heat | Space Cool | Hot Water | Lighting | Ventilation | Total | Energy Generation |
|---|---|---|---|---|---|---|---|
| Building Energy Load [kWh/m2.yr] | 63.6 | 0 | 30.7 | 8.5 | 0 | 102.8 | 0 |
| Site Energy Consumption [kWh/m2.yr] | 126.2 | 0 | 32.7 | 8.5 | 0 | 167.4 | 56.9 |
| Source Energy Consumption [kWh/m2.yr] | 145.9 | 0 | 34.3 | 23.4 | 0 | 203.6 | 156.6 |
Disclaimer/Publisher’s Note: The statements, opinions and data contained in all publications are solely those of the individual author(s) and contributor(s) and not of MDPI and/or the editor(s). MDPI and/or the editor(s) disclaim responsibility for any injury to people or property resulting from any ideas, methods, instructions or products referred to in the content. |
© 2024 by the authors. Licensee MDPI, Basel, Switzerland. This article is an open access article distributed under the terms and conditions of the Creative Commons Attribution (CC BY) license (https://creativecommons.org/licenses/by/4.0/).
Share and Cite
Kwag, B.C.; Kim, G.T.; Hwang, I.T. Integration of Photovoltaic Systems for Energy Self-Sufficient Low-Rise Multi-Family Residential Buildings in Republic of Korea. Buildings 2024, 14, 2522. https://doi.org/10.3390/buildings14082522
Kwag BC, Kim GT, Hwang IT. Integration of Photovoltaic Systems for Energy Self-Sufficient Low-Rise Multi-Family Residential Buildings in Republic of Korea. Buildings. 2024; 14(8):2522. https://doi.org/10.3390/buildings14082522
Chicago/Turabian StyleKwag, Byung Chang, Gil Tae Kim, and In Tae Hwang. 2024. "Integration of Photovoltaic Systems for Energy Self-Sufficient Low-Rise Multi-Family Residential Buildings in Republic of Korea" Buildings 14, no. 8: 2522. https://doi.org/10.3390/buildings14082522