Abstract
The assessment of barriers to the application of cost-reduction techniques in delivering educational buildings in Nigeria is essential in addressing the infrastructural shortage, building performance, delay, cost, time overrun, and abandonment in the delivery of higher educational buildings (HEBs). This study examines barriers to applying cost-reduction techniques in educational buildings in southwestern Nigeria. Using a survey design, the questionnaire was distributed to stakeholders who participated in delivering the government intervention, private donors, and internally generated revenue educational buildings in public tertiary institutions in southwestern Nigeria from 2012 to 2022. A total of 150 copies of the questionnaire were administered, while 133 responses were obtained and analyzed. To begin with, data reliability and validity were examined using Bartlett’s sphericity, Cronbach’s alpha, and Kaiser–Meyer–Olkin (KMO) tests, accordingly, followed by descriptive, Kruskal–Wallis H test, and exploratory factor analysis. The six components obtained from exploratory factor analysis for explaining the barriers to applying cost-reduction techniques in educational buildings were as follows: ambiguity in HEB contracts awards and project executions, lack of control from the HEIs management over HEB project delivery, perceived political influence in HEB procurement, unrealistic contract requirements and change orders, non-prioritization of automation integration in HEB delivery, and deficiencies in contract documents and costing. This study recommends establishing a project-monitoring team involving independent consultants from project inception to reduce excessive errors, practices of assigning contracts to the lowest bidder, and excessive claims for variation orders that escalate the project’s final sum.
1. Introduction
The application of cost-reduction techniques in delivering higher educational buildings (HEBs) emerged from the demands to mitigate the consequences of delay and overspending, project abandonment, and poor standards [1]. This is because cost-reduction techniques often influence the timely delivery of HEBs to meet academic, administration, and residency purposes within higher education institutions [2]. According to Beste and Klakegg [3], cost-reduction techniques are cost-control strategies to keep building projects within budget or reduce the overall delivery cost. Oyewobi et al. [4] noted that cost reduction is a significant factor for construction stakeholders, often based on various techniques and software to control costs and achieve project objectives. The importance of reducing construction costs through the material, process substitution, site organization, and site cost management without compromising quality delivery [5,6,7,8]. Cost-reduction techniques enable construction stakeholders to achieve project performance related to time, cost, and quality delivery goals [1,6,9].
There are various techniques for achieving cost reduction in construction project delivery. Target value design often provides a collaborative design that promotes design outcomes, maximizes value and the concurrent engineering required for meeting the project’s budget in a contractual arrangement [10,11,12]. Al-Weriket [13] advanced knowledge of the role of the supply chain in reducing time, cost, and wastage, controlling project costs, and increasing contractors’ profitability. According to [14], budgetary control also effectively manages resources (money, machines, materials, and human resources) to accomplish planned goals in a contractual arrangement. Likewise, Refs. [15,16] explored the significance of standardizing and simplifying component units to attain life cycle costing in construction project delivery. Studies by Refs. [17,18] further provided an understanding of activity-based costing in assigning indirect and overhead costs to different operations in the project delivery to facilitate building project performance and cost control. However, Aboelmagd [19] noted that earned value analysis is among the principal techniques to lower the cost of construction, while also guaranteeing cost efficiency. Vivan et al. and Miranda et al. [20,21] reported that the Kaizen approach offers construction cost analysis and diagnostic tools to guarantee quality delivery and cost reduction in building projects. The availability of a circular economy model of production and consumption also contributes to the control of cost-reduction techniques, which encourages leasing, sharing, repairing, refurbishing, reusing, and recycling existing materials and products [22,23,24]. Nevertheless, Refs. [25,26] maintained that integrating automation into construction planning and processes promotes stakeholders’ collaboration in achieving project economic value. They concluded that innovations in technology such as the Industry 4.0 paradigm, digital twins, artificial intelligence, sensing technologies, Building Information Modeling (BIM), and the smart cities concept could foster the application of robotics and automation in the construction sector despite the low adoption reported in [25,27].
However, Refs. [28,29,30,31] submitted that HEBs projects exhibit unsatisfactory performance, delays, cost, and time overrun. This prompted stakeholders to explore cost-reduction techniques in delivering HEBs in Nigeria. The investigation of [32] revealed varying degrees of usage of the 16 various cost-reduction techniques investigated on public tertiary educational building projects. At the same time, Syahrizal et al. [33] suggested the application of value engineering at the project’s initial phases to achieve optimal cost reduction. Meanwhile, Hafez et al. [34] demonstrated the use of earned value management, activity-based costing, target costing, and value engineering and emphasized the need for optimal cost reduction and control on the construction site. Ogunbayo et al. [35] admitted the desire of Nigerian higher educational institutions (HEIs) to provide infrastructural facilities to meet students’ yearly intake and maintain the overstretching of available physical facilities. This is also to ensure that the HEBs delivered via government intervention, private donors, and internally generated revenue (IGR) to meet the required quality and stayed within the cost estimate [30,36,37,38]. Unfortunately, the application of these available cost-reduction techniques is not without its barriers, particularly in relation to HEBs in emerging nations, especially Nigerian HEIs.
The need to identify and overcome barriers to applying cost-reduction techniques in HEB delivery has become increasingly urgent, with constrained budgets and rising construction costs. Several essential considerations highlight the urgency of this study. First, the financial constraints within public higher educational institutions necessitate the prudent allocation of resources to support core educational objectives. Secondly, the escalating costs associated with construction projects in Nigeria significantly burden institutional budgets, potentially compromising the quality of education provided. Furthermore, the barriers to adopting cost-reduction techniques in Nigeria’s public higher educational buildings created a knowledge gap regarding their essentiality in addressing the infrastructural shortage, building performance, delay, cost and time overrun, and abandonment in delivering HEBs. In addressing this knowledge gap, this study examines the barriers to cost-reduction techniques in higher educational buildings in southwestern Nigeria to enrich their adoption in higher education building delivery in Nigeria. Hence, a literature review identified 31 barriers from existing studies. Descriptive statistics and exploratory factor analysis were employed to determine the barriers to adopting cost-reduction techniques in delivering HEB in southwestern Nigeria. Through an in-depth exploration of stakeholders’ perspectives, this study aims to identify actionable insights that can inform policy decisions, improve operational efficiency and building delivery, and ultimately enhance the quality of educational services provided by public HEIs in Nigeria.
2. Literature Review
2.1. Overview of the Nigerian Higher Educational System
The Nigerian higher education system comprises 265 universities, 180 polytechnics, 89 colleges of education, 183 mono-technics, 33 colleges of agriculture, and 94 colleges of health technology [39,40]. The higher education system in Nigeria is under the Federal Ministry of Education and is overseen by the National Board for Technical Education (NBTE) and the National Universities Commission (NUC) [41,42]. Likewise, there are three categories of ownership of the various higher education institutions in Nigeria: federal government, state government, and privately owned [1,36]. The financing of public higher education institutions in Nigeria is mainly the responsibility of the federal and state governments, comprising about 90% of the required funds, with 10% of the funds generated internally [30,36]. Nonetheless, Refs. [30,43,44,45] noted that additional funding sources have to be adopted to fill the gaps caused by the federal and state governments’ incapability to fulfill HEI’s needs for infrastructure facilities. The Nigerian government instituted a tertiary education trust fund (TETfund) under the Act of 2011 to improve the Nigerian education sector through a government intervention program. The provision of the TETfund Act of 2011 mandated registered companies in Nigeria to contribute an education levy of 2% of their taxable income [46]. In Refs. [36,37,47], the authors admitted that various internal revenues and donor funds such as grants, student levies, private sector contributions, commercial activities, and consultancy services are used to fill the infrastructure gap in Nigerian HEIs.
Nonetheless, the funding for the education sector by the Nigerian government was negatively affected by the rise in HEIs and the economic recession [48]. This has also caused growing concern about the rising student population and infrastructural facilities deficit in Nigerian higher education institutions (HEIs), which poses a tremendous threat to available limited resources [35,48,49]. Poor construction project performance and delivery within Nigeria’s education sector have cut stakeholders’ attention in the construction industry [50]. In Refs. [51,52,53,54], the authors expressed that over the last two decades, 56,000 HEBs funded through government intervention, private donors, and internally generated revenue (IGR) in the public tertiary institutions nationwide experienced delay, abandonment, cost, and time overrun. Aghimien and Aigbavboa [30], noted that the success of these interventions is undermined due to the escalation of the final project’s sum, lack of automation integration, lack of detailing of designs, excessive material wastage, and poor communication and coordination systems between parties.
Ewa [51] postulated that the delivery of HEBs is characterized by ambiguity in the contract documentation, a lack of clear goals and objectives, inadequate funding and budgetary allocation, improper project planning from commencement, corruption and compromises, and the withholding of official white papers on abandoned projects. Okechukwu et al. [47], posited that the problems of financing, equity, efficiency, equality, and governance have often slowed down the capacity of education to fulfil its role in developing nations, particularly in the Nigerian education sector. Aghimien et al. [50], noted that the problem created due to insufficient HEBs and underfunding of higher education institutions in Nigeria has recently caused various industrial actions to be taken by academic bodies. These, therefore, call for cost reduction and control to ensure that the available funds are utilized effectively in managing available resources in the delivery of higher educational buildings in Nigeria. In Refs. [30,55,56], the authors concurred that time and cost performance are essential in delivering HEBs, which often become a significant concern to construction stakeholders. Breuer et al. [6], affirmed that quality cost-reduction techniques remain the most important means of realizing effective cost performance in a project.
2.2. Barriers to the Application of Cost-Reduction Techniques in Delivering Higher Educational Buildings
In mitigating the impact of various claims from contractors, clients’ late payments, and delayed approval of change orders escalating the final project sum in delivering public educational buildings in Nigeria, scholars have expressed different views about the barriers to adopting cost-reduction techniques [57,58,59,60,61]. According to [62,63], barriers to applying cost-reduction techniques in HEBs include HEI’s management lacking control, the project team lacking technical competency, and HEI’s management lacking support and commitment. Dougherty [64] reported that more than 80% of higher education institutions’ funding comes from the federal government, making it difficult for each institution to control the cost of delivering educational building projects.
Isofia et al. [61], noted that despite the TETfund guidelines for releasing funds for work conducted during the delivery of educational building projects in public tertiary institutions, there are still late payments to contractors, unrealistic contract durations and requirements, and imposition of fixed price contracts for contracts exceeding one year, all of which affect the final cost of the educational building projects. In Refs. [65,66], the authors attributed barriers to applying cost-reduction techniques in HEBs to communication gaps among contract parties, resulting in cost underestimation and excessive change orders. Meanwhile, Hatoum [12] reported that improper communication among project parties, which resulted in excessive delay and increased construction cost, could have been avoided had an integrated design approach been implemented. According to [65], construction professionals purposefully break established rules under pressure to generate documentation despite improper activities. Asiedu and Adaku [66] posited that excessive errors and inconsistencies at the design stage, the practice of assigning contracts to the lowest bidder, insufficient time for estimation, and utilization of poor procurement strategies could cause variances, a significant source of cost overruns for clients and contractors. Wells [67], added that communication hurdles that cause inaccurate estimations at the pre-contract stage might lead to the acceptance of meagre bidding rates, which can lead to misinformation about construction project funding decisions and arrangements.
In Refs. [61,68,69], all of the authors attributed barriers to applying cost-reduction techniques in the HEBs to contractors’ payment delays that push them to undermine their professional integrity and stifle their desire to complete quality jobs on time. In Refs. [67,70] it was noted that prolonged and intractable delays, uncertainties surrounding payment for performed work, and a lack of enforcement of contract provisions by all parties significantly affect the adoption of cost-reduction techniques in Nigerian HEB delivery. Furthermore, Alsuliman et al. [71] observed that barriers to applying cost-reduction techniques in the HEBs could be attributed to high numbers of construction changes on educational building projects and change orders to alter or modify the original design or scope of work throughout construction. They asserted that the complexity of construction projects means delivering a project without any change in its lifecycle is impossible. In Refs. [71,72], the authors submitted that multiple unrecorded change orders frequently lead to scope creep and cost overruns in building projects. In Refs. [73,74,75,76], the authors further informed that fluctuation in the price of building materials, the high cost of building materials, payment challenges, and materials shortage have consequences on the final construction sum.
According to [77], Nigeria’s education sector’s planning, administration, and management are greatly influenced by the political party in power. Olayisade et al. [77] noted that unfavorable conditions in the Nigerian educational sector could be traced to political office holders and party affiliations, educational buildings’ budget padding, high bureaucracy, and the continuous payment failure cycle significantly affecting cost-reduction techniques application in the delivery of HEBs. Likewise, Refs. [78,79] admitted that the fragmented nature of the project stakeholders in delivering HEBs, such as the government, clients, contractors, subcontractors, suppliers, and consultants, contributed to stakeholders’ corrupt practices preventing the use of cost-reduction techniques. Khadim et al. [80] noted that infrastructure projects are most susceptible to corruption due to the high capital involved in their production. When the money allocated for constructing infrastructure, such as roads, schools, hospitals, etc., is misappropriated due to contractors’ incorrect planning and scheduling; Owusu et al. [79] opined that it could result in a socio-economic setback. Non-adherence to professionalism and ethical practice, deception, and delusion among the project team often influence the application of cost-reduction techniques in delivering HEBs [80,81]. In Refs. [33,82], the authors posited barriers such as political leadership, culture, funding and institutional administration, and lack of automation integration in the process of HEB delivery attributed to barriers influencing the adoption of cost-reduction techniques. Therefore, Table 1 summarizes the identified barriers to applying cost-reduction techniques in HEBs.

Table 1.
Summary of Barriers to the application of cost-reduction techniques in HEBs.
3. Materials and Methods
This study examined barriers to applying cost-reduction techniques in higher educational building delivery in southwestern Nigeria. An extant literature review was conducted to identify and understand 31 barriers (see Table 1) to applying cost-reduction techniques in delivering educational buildings. An extant literature review assists researchers in providing a comprehensive overview of the current state of research to identify gaps that should be considered [83]. A quantitative research design was adopted because it is appropriate for this study due to unbiased mathematical statistical or numerical data analysis [84]. In Refs. [85,86,87,88] it was noted that quantitative research design enables survey research, voting polls, structured questionnaires, or computational techniques to verify the statistics that are already available and draw conclusions for generalizing research findings.
This study focuses explicitly on educational buildings delivered from 2012 to 2022 by government intervention, private donors, and IGR in public HEIs in southwestern Nigeria. The study was based on public HEIs in southwestern Nigeria accredited and overseen by the NUC, NBTE, and the National Commission for College of Education (NCCE). The southwestern part of Nigeria comprises six states: Lagos, Ogun, Oyo, Osun and Ekiti. These states have fifty (50) HEIs (public universities, polytechnic, and colleges of education only). However, this study focused on four states, namely Lagos, Ogun, Oyo, and Osun, due to the preponderance of HEIs within their boundaries with a total of thirty-seven (37) HEIs. Based on completed building projects within the selected time frame, the presence of the physical planning/works department, and the accessibility of stakeholders that took part in the construction, 15 HEIs were eventually considered in the survey. This includes Lagos State (3), Ogun State (4), Oyo State (4) and Osun State (4), respectively. It is thought that because the government contributes significantly to the education sector, and the different financing schemes are employed in providing infrastructures in all public institutions within the country, the selected public HEIs adequately represent the happenings in public HEIs around the country.
A survey approach was adopted in which stakeholders who participated in delivering HEBs within the selected time frame were purposively sampled. Purposive sampling is the intentional inclusion of participants according to their special knowledge and expertise [89]. The sampling method adopted was informed by the focus of this investigation. These stakeholders include those in the Physical Planning Unit/Works Department of the identified institutions representing the client (i.e., the institution), consultants, and the contractors that handled the building projects. A total of 150 participants’ details were extracted from the project files and thus included in the study. To manage response biases, the respondents were assured the confidentiality of their identity and the voluntary right to take part in the survey and to withdraw at any time. A structured questionnaire was developed and used as a data collection instrument. The factors (see Table 1) informing the development of the research questionnaire were based on the identified barriers to applying cost-reduction techniques in HEBs from extant literature. Emails containing a link to the questionnaire were sent to participants who were inaccessible in person.
The questionnaire determines the respondent’s level of agreement with the 31 identified barriers to applying cost-reduction techniques on a five-point Likert scale with 1 = strongly disagree, 2 = disagree, 3 = neither agree nor disagree, 4 = agree, and 5 = strongly agree. The Likert scale was used for this research due to its excellent level of reliability coefficient as well as its increased potential for obtaining feedback that accurately represents the subject of discussion [42]. In total, 133 were received, representing an 89% response rate and this was ascertained to be fit for analysis, based on the submission of [90] that if the proportion of responses returned is below 30–40 percent, it could be regarded as biased and unimportant. Descriptive statistics and exploratory factor analysis were performed from the data obtained from the field survey and were analyzed using IBM Statistical Package for Social Science (SPSS) version 28.0. The exploratory factor analysis includes a test of reliability using Cronbach’s alpha, Kaiser–Meyer–Olkin (KMO) test, and Bartlett’s sphericity tests. According to [91], an exploratory factor analysis (EFA) is a statistical method of eliminating a high tendency of interrelatedness or severe autocorrelation among the variable factors to produce reliable and stable orthogonal findings. Furthermore, the EFA establishes the correlation patterns in a dataset to extract variables from the different factor components [92]. As [93] recommended, a 0.837 value of Cronbach’s alpha test obtained in this study is more significant than 0.7, indicating the data reliability and the interrelatedness of the variables in each component. Also, the descriptive statistics determined the percentage, frequency, standard deviation, and mean item score. In contrast, the inferential statistics determined significant differences in the respondents’ level of agreement with the identified factors using the Kruskal–Wallis H test. The Kruskal–Wallis H is a non-parametric test that allows researchers to determine groups’ variance and compare the mean scores on the continuous variables according to the survey participants’ responses [94,95]. The decision to use a non-parametric test was informed by a prior test conducted to check the normality of data using Kolmogorov–Smirnov and Shapiro–Wilk tests. While the study of [42,48] reported that the Shapiro–Wilk test is most suitable when the sample size is less than 2000, Aboginije [96] mentioned that the Kolmogorov–Smirnov test is for sample size of 50 and above while the Shapiro–Wilk test is for sample size less than 50. Since this study sample size is 133, both tests were conducted. The results depicted in Table 2 show that the significant value of all the assessed factors are 0.000, which is less than the 0.05 required threshold for normality. Based on this, the data were adjudged non-parametric.
Table 2.
Tests of normality.
4. Results and Discussion of Findings
4.1. Respondents’ Demographic Information
Figure 1 presents the professional background of the respondents. The stakeholders that participated in the survey comprised 32.3% (43) quantity surveyors, 22.6% (30) architects, 19.5% (26) civil/structural engineers, 14.3% (19) other disciplines, 7.5% (10) builders, 2.3% (3) electrical and 1.5% (2) mechanical engineers, respectively.
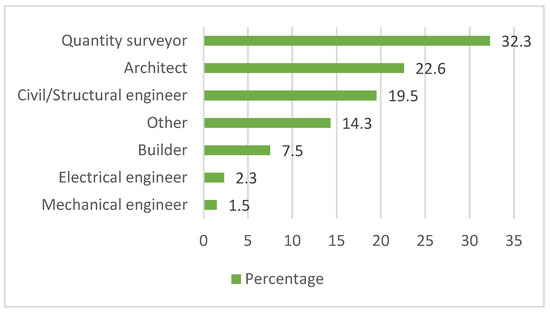
Figure 1.
Respondent’s professional background.
Unsurprisingly, quantity surveyors have the highest percentage among the respondents since they deal with construction costs. The findings of this data affirm that suitable respondents participated in this survey. The findings also depict an excellent representation of the significant construction professionals.
Figure 2 presents the study findings showing the respondents’ working experience. A total of 36.1% (48) had 21–30 years of experience, 32.3% (43) had 11–20 years of working experience, 15.8% (21) of the respondents had 1–10 years of working experience, 10.5% (14) had 31–40 years of working experience, and 5.3% (7) had 41–50 years of working experience in the construction industry. As a result, the respondents had enough adequate years of expertise to offer helpful insights into the study.
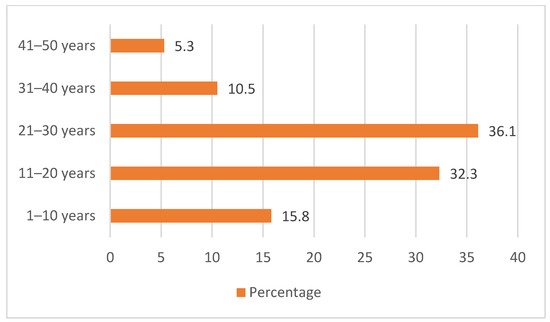
Figure 2.
Respondent’s years of working experience.
4.2. Descriptive Analysis Findings
Table 3 presents findings from the descriptive analysis using mean scores (MS) and standard deviation (SD) rankings of the barriers to applying cost-reduction techniques in delivering HEB in southwestern Nigeria. For factors with the same MS, SD was used to determine the most significant factor; this is in accordance with the study of [97], which noted that when factors have the same mean values, the factor with the lowest SD is given the highest ranking. The respondents ranked their level of agreement with the 31 identified barriers to using cost-reduction techniques on a five-point Likert scale with 1 = strongly disagree, 2 = disagree, 3 = neither agree or disagree, 4 = agree, and 5 = strongly agree. Deficiencies in cost estimates prepared by public agencies ranked first with SD = 1.152 and MS = 4.11; contractors lacking experience in project type ranked second with SD = 1.094 and MS = 4.03; HEI’s management lacks support and commitment ranked third with SD = 1.074 and MS = 43.69; excessive design errors ranked fourth with SD = 1.033 and MS = 3.68. Contractors’ incorrect planning and scheduling with SD = 1.001 and MS = 3.65 and disputes from enforcement of contract provisions with SD = 1.053 and MS = 3.65 ranked fifth. The seventh-ranked barriers are HEI’s management lacks control, with SD = 1.003 and MS = 3.64, and the inexperience of project stakeholders, with SD = 1.124 and MS = 3.64. Likewise, fixed price imposition for contracts exceeding one year ranked ninth with SD = 1.045 and MS = 3.59. In contrast, lack of communication among parties with SD = 1.123 and MS = 3.57, non-adherence to professionalism and ethical practice with SD = 1.227 and MS = 3.57, and ambiguity in contract documentation with SD = 1.361 and MS = 3.57 were ranked tenth, respectively. Influence of political party in power in governance ranked thirteenth with SD = 1.126 and MS = 3.53; cash inflow problems ranked fourteenth with SD = 1.265 and MS = 3.47; while utilization of poor procurement strategies with SD = 1.158 and MS = 3.46 and budget padding on educational projects with SD = 1.294 and MS = 3.46 ranked fifteenth.
Table 3.
Barriers to the application of cost-reduction techniques in HEBs.
Inaccurate estimation ranked seventeenth with SD = 1.236 and MS = 3.39; stakeholders’ corrupt practices ranked eighteenth with SD = 1.209 and MS = 3.37; practices of assigning contracts to the lowest bidder ranked nineteenth with SD = 1.169 and MS = 3.31; materials shortage ranked twentieth with SD = 1.268 and MS = 3.27; complexity of tertiary education projects ranked twenty-first with SD = 1.165 and MS = 3.23. Consequently, high construction claims ranked twenty-second with SD = 1.153 and MS = 3.20; variation order ranked twenty-third with SD = 1.072 and MS = 3.14; insufficient time for estimation ranked twenty-fourth with SD = 1.041 and MS = 3.01; while lack of automation integration with SD = 1.077 and MS = 3.01 and continuous cycle of payment failure with SD = 1.111 and MS = 3.01 ranked twenty-fifth. The project team lacks technical competency ranked twenty-seventh with SD = 1.090 and MS = 2.98; high cost of building materials with SD = 0.903 and MS = 2.95 and acceptance of meager bidding rates with SD = 0.915 and MS = 2.95 ranked twenty-eighth, while high construction changes on HEB projects with SD = 0.938 and MS = 2.92 and unrealistic contract requirements and duration with SD = 0.930 and MS = 2.86 ranked thirtieth and thirty-first, respectively.
Looking through the SD column in Table 3, the result shows that out of the 31 barriers assessed, only 4 have an SD less than 1.0, which implies that there is little variability in the data and more consistency in agreement among the respondents concerning these 4 barriers. However, the remaining 27 barriers with a SD greater than 1.0 indicate greater dispersion or spread of the data points around the mean. As recommended by [48], an MS value of 3.00 suggests the importance of the identified barriers to the application of cost-reduction techniques, while a MS value of < 3.00 is an insignificant barrier to the application of cost-reduction techniques. The result shows that 27 out of 31 of the assessed barriers have a mean value above average 3.0, which implies they are significant and thus adequate attention should be paid to these barriers to encourage the application of cost-reduction techniques, thereby improving cost performance of HEBs. This result is consistent with the study of [4] who discovered that the most significant factors affecting building cost are inadequate planning, inadequate financial control, disputes, inaccurate cost estimates, the relationship between management and labor, and lack of consultants and contractors. Likewise, Aboelmagd [19] concluded that change orders, design errors, materials rising in prices, and lowest bidding procurement methods were the top factors affecting cost reduction for mega projects.
Furthermore, as indicated in Table 3, a Kruskal–Wallis non-parametric test was conducted to compare the perspectives of the stakeholders involved in the survey depending on their professional designation (architects, builders, quantity surveyors, electrical engineers, civil/structural engineers, mechanical engineers, and others). Table 3 indicates that 18 out of the 31 identified barriers had a significant p-value ranging from 0.001 to 0.05, below the recommended 0.05 p-value and Chi-Square range of 12.601–24.207 [94,95], indicating a statistically significant difference in the perception of respondents on the barriers to the application of cost-reduction techniques in public higher educational buildings in Nigeria. They included HEI’s management lacking support and commitment with a p-value of 0.017; excessive design errors, p-value of 0.004; disputes from enforcement of contract provisions, with a p-value of 0.032; HEI’s management lacks control, with a p-value of 0.014; fixed price imposition for contracts exceeding one-year, p-value of 0.001; lack of communication among parties, p-value of 0.009; non-adherence to professionalism and ethical practice, with a p-value of 0.010; ambiguity in contract documentation, p-value of 0.050; influence of the political party in power, with p-value of 0.004; cash inflow problems, p-value of 0.004; utilization of poor procurement strategies, p-value of 0.033; stakeholders corrupt practices, with a p-value of 0.012; materials shortage, p-value of 0.018; high construction claims, p-value of 0.048; continuous cycle of payment failure, p-value of 0.039; variation order, with a p-value of 0.013; high construction changes on HEBs projects, p-value of 0.015; and unrealistic contract requirements and duration, with a p-value of 0.006.
4.3. Exploratory Factor Analysis Findings
4.3.1. KMO and Bartlett’s Test
Table 4 depicts findings from the exploratory analysis (EFA) of the 31 identified barriers to applying cost-reduction techniques in educational building delivery, using the IBM SPSS statistics 28.0. The principal component of EFA was used to determine survey data appropriateness for factor analysis using the KMO test and Bartlett’s test of sphericity. A 0.837 value was obtained for the KMO test, which exceeds the minimum value of 0.6, 0.000 for Bartlett’s test of sphericity and <0.05 of the level of significant value recommended for data suitable for an exploratory factor analysis [97,98].
Table 4.
KMO and Bartlett’s Test.
4.3.2. Scree Plot
Figure 3 depicts the findings of the scree plot using the oblimin rotation method to show the eigenvalue of the 31 identified barriers to applying cost-reduction techniques in educational building delivery in HEIs within southwestern Nigeria. The graph indicates the six components correlated above 1 eigenvalue before the break in the steep slope. The steep slope represents the extraction of six significant components, while the gradual trailing indicates the remaining variables < 1.0 eigenvalue [95].
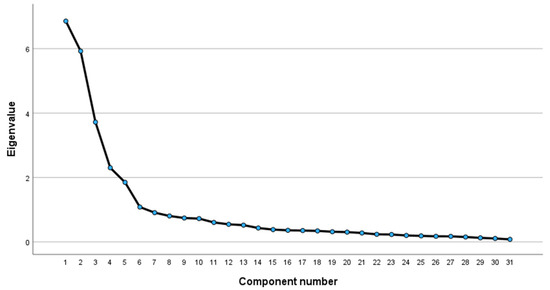
Figure 3.
Scree plot.
4.3.3. Communalities
Table 5 presents the communalities for the 31 identified barriers to applying cost-reduction techniques in HEBs. All variables have extraction values greater than 0.1, which justifies data suitability for an exploratory factor analysis.
Table 5.
Communalities for barriers to the application of cost-reduction techniques in HEBs.
4.3.4. Total Variance Explained
Table 6 presents the latent root, or Kaiser’s criterion for retaining EFA factors greater than 1.0 eigenvalues of the total variance that explained the 31 identified barriers to applying cost-reduction techniques in educational building delivery in HEIs within southwestern Nigeria. The six components with eigenvalues > 1.0 were explored as 6.855, 5.924, 3.719, 2.302, 1.849, and 1.082, accounting for 22.113%, 19.110%, 11.997%, 7.456%, 5.963%, and 3.490%. These factors explained 70.099% of the variance, highlighting the significance of the variables of the six components.
Table 6.
Total variance explained.
4.3.5. Pattern Matrix
Table 7 presents the pattern matrix of how the six components clustered the barriers to applying cost-reduction techniques in HEBs. The naming and interpretation of the components were according to the correlation between the factors that are loaded in each component. Therefore, in line with the recommendation of [99,100], a common name was assigned to each of the six components of the EFA thus: Component 1 was named “ambiguity in HEBs contracts awards and project executions”; Component 2 was named “lack of control from the HEIs management over HEB project delivery”; Component 3 was named; “perceived political influence in HEB procurement”; Component 4 was named “unrealistic contract requirements and change orders”; Component 5 was named “non-prioritized automation integration in HEB delivery”, and Component 6 was named “deficiencies in contract documents and costing”. Likewise, as informed by [94], a 0.40 loading cut-off was adopted as the minimum criteria for keeping the loading value and variables critical for the EFA factors.
Table 7.
Pattern matrix.
4.3.6. Component Correlation Matrix and Reliability of the Factors
As presented in Table 8, the relationship between the variables group of the six-component correlation matrix shows the relationship within these clustered variables with a value of around 0.300. The study findings collaborate with [99,101], who confirm that a correlation matrix value of 0.300 shows highly correlated variables and relationship dependence among these variables in the components. As indicated in Table 8, the findings of the reliability test of the six components using Cronbach alpha coefficient obtained values ranging from 0.728 to 0.930. The findings align with [98,99], indicating that the Cronbach alpha coefficient greater than 0.6 for each of the six components is valid and reliable, affirming the reliability of the data collection instrument used in this study.
Table 8.
Component correlation matrix and reliability of the factors.
4.4. Discussion of Extracted Factors
Component 1: Ambiguity in HEBs contracts awards and project executions.
As indicated in Table 7, ambiguity in HEB’s contracts awards and project executions clustered 22.113% of the variance explained with the highest loading factors of 10 variables. These factors include ambiguity in contract documentation (87%), cash inflow problems (85%), non-adherence to professionalism and ethical practice (84%), budget padding on educational projects (82%), the inexperience of project stakeholders (81%), practices of assigning contracts to the lowest bidder (87%), materials shortage (74%), stakeholders’ corrupt practices (67%), excessive design errors (66%), and lack of communication among parties (61%). The variables in this component explain various ambiguities in HEB’s contract awards and project executions, which prevented the application of cost-reduction techniques in delivering educational buildings in Nigeria. The study findings align with the conclusion of [51], which admitted that the delivery of educational buildings is characterized by ambiguity in contract documentation, lack of adequate funds and budgetary allocation, various corruption practices, and non-release of government white papers on abandoned projects that compromise the integrity of the project’s delivery. Various contributing barriers to the non-application of cost-reduction techniques in educational building delivery in HEIs are ambiguities in contract awards and project delivery. These are due to practices of assigning contracts to the lowest bidder, excessive design errors, cash inflow problems, and non-adherence to professionalism and ethical practices. The study findings align with the submissions by [47] that the non-availability of finance, equity, efficiency, equality, and governance has frequently slowed down the infrastructural development of HEIs in developing countries, particularly in the Nigerian education sector. These factors negatively affect the funding of educational buildings and their infrastructural facilities by government intervention, private donors, and internally generated revenue (IGR). In addition to the findings of [33,35,49], these barriers led to infrastructure deficit, delay, cost and time overrun, and abandonment in delivering education institutions in Nigeria. The study findings are also in line with [66,68], who noted that excessive errors, inconsistencies at the design stage, practices of assigning contracts to the lowest bidder, and communication hurdles affected the application of cost-reduction techniques in educational building delivery.
Component 2: Lack of control from the HEIs management over HEB project delivery.
In all, 19.110% of the total variance was clustered in the second component, as indicated in Table 7. The underlying variables correlation in this component was named lack of control from the HEI’s management over educational building project delivery with five variables, loaded as follows: disputes from enforcement of contract provisions (89%), contractors’ incorrect planning and scheduling (89%), HEI’s management lacks support and commitment (87%), HEI’s management lacks control (85%), and fixed price imposition for contracts exceeding one year (81%). This component’s name informs us about the HEI’s management’s lack of control over HEB project delivery. The study findings are in collaboration with [62,63], who attributed barriers to applying cost-reduction techniques in delivering educational buildings to HEI’s management lacking control, support, and commitment over the project delivery and the project team lacking technical competency. Nonetheless, the process and procedures in the awarding of contracts and project delivery should be able to balance HEI’s management project consultant inclusiveness. The findings are consistent with the studies of [64], who reported that more than 80% of higher education institutions’ funding comes from the federal government, making it difficult for each institution to control the cost of delivering educational building projects in Nigeria. Likewise, in agreement with [61], the study findings emphasized the imposition of unrealistic contract duration and requirements and fixed price contracts for contracts exceeding one year, often escalating the educational building projects’ final cost. Therefore, the HEI’s management consultant team, having control over the delivery of educational buildings and establishing a project monitoring team involving independent consultants, is needed to oversee stakeholders’ activities in delivery quality within the cost estimate.
Component 3: Perceived political influence in HEB procurement.
This component’s name was based on the perceived political influence in HEB procurement, which negatively affects the application of cost-reduction techniques. The five variables clustered in this component accounted for 11.997% of the total variance explained. They include inaccurate estimates (91%), the influence of the political party in power (90%), utilization of poor procurement strategies (89%), high construction claims (87%), and complexity of tertiary education projects (82%). The study results show that the perceived political influence in HEB procurement processes limits the application of cost-reduction techniques in delivering educational buildings, particularly in southwestern Nigeria. These findings collaborated with the barriers identified by [65,66], who noted that barriers to applying cost-reduction techniques in educational buildings are due to communication gaps among contract parties, resulting in cost underestimation and excessive change orders. Likewise, Love et al. [65] maintained that stakeholders involved in delivering educational buildings purposefully break established rules to obtain payment documentation, even when specific qualities in the condition of the contract are not met. Nonetheless, politicizing educational buildings’ procurement processes is a significant barrier to controlling final costs, often giving contracting firms a strong backup for excessive claims for variation orders. Hence, the contract must be awarded on merit and not politicized to improve the delivery of educational building projects and other infrastructure needed in public tertiary institutions.
Component 4: Unrealistic contract requirements and change orders.
The four variables loaded in this fourth component include the high cost of building materials (80%), high construction changes on HEB projects (80%), unrealistic contract requirements and duration (71%), and acceptance of meager bidding rates (61%). This fourth component gathered 7.456% of the total variance. Generally, unrealistic contract requirements and change orders are dominant when addressing barriers to applying cost-reduction techniques in educational building delivery. As noted in this study’s results, [71] affirms that barriers to applying cost-reduction techniques in the HEBs could be attributed to high construction changes on educational building projects and change orders to alter or modify the original design or scope of work throughout construction. Likewise, aligning the study findings with [73,74,75,76], the fluctuation in the price of building materials, the high cost of building materials, payment challenges, and materials shortage have negative consequences on the final construction sum. Hatoum et al. [12], also agree that changes in design, and fluctuations in prices of raw materials were significant problems in HEB projects. As indicated in the study findings, inaccuracies estimated during the pre-contract stage led to the acceptance of meager bidding rates, which often led to misinformation about construction project funding and constituted a significant source of cost overruns for clients and contractors [66]. Hence, standardizing contract requirements in delivering educational buildings is essential in attracting qualified contractors to reduce excessive change orders. Furthermore, contract requirements in providing educational buildings will also help solve the escalation of the final contract sum.
Component 5: Non-prioritized automation integration in HEB delivery.
The fifth component was named non-prioritized automation integration in HEB delivery based on the five loading variables in this component. The variables include the project team’s lack of technical competency (87%), continuous cycle of payment failure (81%), lack of automation integration (80%), variation order (79%), and insufficient time for estimation (75%). This factor amounted to 5.963% of the total variance, directly influencing the application of cost-reduction techniques in educational building delivery in Nigeria. The non-prioritized automation integration gives room for excessive foul play from the design phase to the delivery phase in the delivery of educational buildings in Nigeria. In Refs. [25,26,27], the authors mentioned various automation technologies that can be employed in the construction industry throughout the project’s lifecycle to improve delivery. However, [98] submits that the digital twin method offers a comprehensive and integrated utilization of these technologies. The findings agree with [20,82], who maintained that barriers such as lack of automation integration in the construction process of delivery educational buildings are attributed to barriers influencing the adoption of cost-reduction techniques in Nigeria. In addition, this study’s findings align with [67] that the continuous cycle of payment failure, uncertainties surrounding payment for work performed, and lack of enforcement of contract provisions by all parties significantly affect the adoption of cost-reduction techniques in Nigerian HEB delivery. Furthermore, Alsuliman et al. [71] further establishes that barriers to applying cost-reduction techniques in educational building delivery could be attributed to high construction changes and change orders to modify the original design or scope of work throughout construction. Therefore, delivering educational buildings using cost-reduction techniques will require prioritizing automation integration in all processes.
Component 6: Deficiencies in contract documents and costing.
The two variables in the sixth component have the least loading factors, with 3.490% of the variance explained. Deficiencies in cost estimates prepared by public agencies (92%) and contractors lacking experience in project type (92%). Deficiencies in contract documents and costing prepared by public agencies often affect cost control in educational building projects. This is in line with the findings of [51], who noted that deficiencies in contract documents in contract documentation affect delivery. Also, the findings support [62,63] submission on barriers to applying cost-reduction techniques in HEB delivery due to the project team’s lack of technical competency.
5. Conclusions and Recommendations
This study examines barriers to applying cost-reduction techniques in educational buildings in southwestern Nigeria. A quantitative questionnaire was designed to explore the barriers to applying cost-reduction techniques in educational buildings, and a purposive sampling method was used to identify and select participating stakeholders in educational building delivery in southwestern Nigeria from 2012 to 2022. A Kruskal–Wallis non-parametric test compares the construction shareholders’ perspectives, indicating a significant difference in about 18 out of the 31 identified barriers to the application of cost-reduction techniques. The barriers included HEIs management lack of support and commitment, excessive design errors, disputes from enforcement of contract provisions, HEI’s management lack of control, fixed price imposition for contracts exceeding one year, lack of communication among parties, non-adherence to professionalism and ethical practice, lack of communication among parties, ambiguity in contract documentation, and influence of the political party in power in governance, cash inflow problems, utilization of poor procurement strategies, stakeholders’ corrupt practices, materials shortage, high construction claims, continuous cycle of payment failure, variation order, high construction changes on HEBs projects, and unrealistic contract requirements and duration. Likewise, the factors identified by the exploratory factor analysis explained the barriers to applying cost-reduction techniques in educational buildings in six components as follows: ambiguity in HEB contracts awards and project executions, lack of control from the HEIs management over HEB project delivery, perceived political influence in HEB procurement, unrealistic contract requirements and change orders, non-prioritized automation integration in HEB delivery, and deficiencies in contract documents and costing. The six components obtained from the study EFA findings on the 31 identified barriers are consistently supported by a theoretical review of barriers to the application of cost-reduction techniques in higher education building delivery in southwestern Nigeria. Therefore, the management of HEIs and construction stakeholders involved in the construction of the educational buildings industry must understand the barriers associated with deficiencies in cost estimates prepared by public agencies, contractors lacking experience in project type, excessive design errors, contractors’ incorrect planning and scheduling, and disputes from enforcement of contract provisions.
The findings from this study provide theoretical and practical implications supporting the knowledge gaps of cost-reduction techniques application in educational building delivery. Empirically, this study established barriers to cost-reduction techniques in educational building delivery in six components in HEIs. Theoretically, the study findings further advance knowledge and provide additional literature on the barriers to cost-reduction techniques in educational building delivery, as indicated in the six components obtained from the EFA. Additionally, the practical implication of the study findings could provide a relevant understanding of barriers to cost-reduction techniques in educational building delivery to solve the problems of project cost and time overrun, project abandonment, and delay in HEIs. These six identified components from the EFA could assist policymakers, construction stakeholders, and management in higher education institutions in developing strategies to bridge the gaps in infrastructure facilities’ demand delivered via government intervention, private donors, and internally generated revenue (IGR).
In conclusion, this study identified barriers to the application of cost-reduction techniques among construction stakeholders to understand improvement strategies for delivering educational building projects within the estimated budget and schedule. It will also accelerate the efforts of government funds, private donors, and internally generated revenue (IGR) to improve infrastructure facilities’ demand of Nigerian HEIs. This study recommends that the six identified components explaining barriers to the application of cost-reduction techniques will encourage stakeholders to improve educational building delivered via government intervention, private donors, and internally generated revenue (IGR). Similarly, the study recommends various strategies for applying cost-reduction techniques in educational building projects, such as establishing a project monitoring team involving independent consultants from project inception to reduce excessive errors, practices of assigning contracts to the lowest bidder, and excessive claims for variation orders that escalate the project’s final sum. The findings of this study are limited to selected participating construction stakeholders in educational building delivery in southwestern Nigeria from 2012 to 2022, which enhances the generalization of the study findings for HEIs in Nigeria. However, it is essential to establish that the participating construction stakeholders in this study fairly represent key stakeholders in the Nigerian construction industry. Hence, further study is recommended to explore a larger population involving professionals in the construction industry to assess the impact of cost-reduction techniques on project performance.
Author Contributions
Conceptualization, G.A.A., O.I.F. and A.O.O.; methodology, G.A.A., O.I.F. and A.O.O.; resources, G.A.A.; writing—original draft preparation, G.A.A.; writing—review and editing, G.A.A., O.I.F. and A.O.O.; visualization, G.A.A.; supervision, O.I.F. and A.O.O.; project administration, G.A.A., O.I.F. and A.O.O. All authors have read and agreed to the published version of the manuscript.
Funding
The publication fee was paid by The Covenant University Centre for Research Innovation and Discovery (CUCRID).
Data Availability Statement
The original contributions presented in the study are included in the article, further inquiries can be directed to the corresponding author.
Acknowledgments
The authors, appreciate Covenant University Research Innovation and Discovery (CUCRID) at Covenant University, Ota, Nigeria, for securing open access to this article.
Conflicts of Interest
The authors declare no conflicts of interest.
References
- Akinola, G.; Fagbenle, O.; Ogunde, A.; Akerele, A. Cost Reduction Techniques in Public Higher Educational Buildings in Southwestern Nigeria: Awareness among Project Participants. E3S Web Conf. 2023, 437, 04001. [Google Scholar] [CrossRef]
- Moghayedi, A.; Michell, K.; Hübner, D.; Le Jeune, K.; Massyn, M. Examine the impact of green methods and technologies on the environmental sustainability of supportive education buildings, perspectives of circular economy and net-zero carbon operation. Facilities 2023, 42, 201–222. [Google Scholar] [CrossRef]
- Beste, T.; Klakegg, O.J. Strategic change towards cost-efficient public construction projects. Int. J. Proj. Manag. 2022, 40, 372–384. [Google Scholar] [CrossRef]
- Oyewobi, L.O.; Jimoh, L.O.; Suleiman, B.; Sheu, M.T. Cost Reduction Strategies for Building Construction Projects in Minna. J. Res. Inf. Civ. Eng. 2018, 15, 2172–2194. [Google Scholar]
- Bhangale, P.P.; Mahajan, A.K. Cost Reduction through Cost Effective Construction Techniques. Int. J. Sci. Res. 2015, 4, 2167–2169. [Google Scholar]
- Breuer, A.; Frumusanu, N.M.L.; Ciurea, J.B.; Breuer, B.L. Management and calculation of the most important document in construction: The estimate documentation. Ann. DAAAM Proc. 2009, 4, 1469. [Google Scholar]
- Lekan, A.; Aigbavboa, C.; Emetere, M. Managing quality control systems in intelligence production and manufacturing in contemporary time. Int. J. Constr. Manag. 2023, 23, 1436–1446. [Google Scholar] [CrossRef]
- Osawaru, F.; Amusan, L.; Awotinde, O.; Akanya, C.; Asiyanbola, O.; Akinbo, F. Planning materials supply for construction works. IOP Conf. Ser. Earth Environ. Sci. 2018, 173, 012002. [Google Scholar] [CrossRef]
- Akinola, G.; Ogunde, A.; Ogundipe, K.E.; Akuete, E. Factors Influencing Construction Project Planning and Implementation: Lessons from South-Western Nigeria. Int. J. Mech. Eng. Technol. (IJMET) 2019, 10, 1–12. [Google Scholar]
- Emuze, F.; Mathinya, L. Assessing the feasibility and use of target value design in South African construction. Annu. Conf. Int. Group Lean Constr. 2016, 24, 73–82. [Google Scholar]
- Kim, Y.W.; Alseadi, I. Identification and evaluation of the influencing factors in target value design process through an industry survey. J. Civ. Eng. Constr. 2021, 10, 75–83. [Google Scholar] [CrossRef]
- Hatoum, M.B.; El Mustapha, R.; Nassar, C.; Zaheraldeen, H.; Hamzeh, F. Lean methods to improve end user satisfaction in higher education buildings. In Proceedings of the 26th Annual Conference of the International Group for Lean Construction, Chenni, Inida, 18–22 July 2018; pp. 187–198. [Google Scholar]
- Al-Werikat, G. Supply chain management in construction revealed. Int. J. Sci. Technol. Res. 2017, 6, 106–110. [Google Scholar]
- Akhil, R.P.; Das, B.B. Cost reduction techniques on MEP projects. In Sustainable Construction and Building Materials: Select Proceedings of ICSCBM; Springer: Singapore, 2019; pp. 495–517. [Google Scholar]
- Beemsterboer, S.; Baumann, H.; Wallbaum, H. Ways to get work done: A review and systematisation of simplification practices in the LCA literature. Int. J. Life Cycle Assess. 2020, 25, 2154–2168. [Google Scholar] [CrossRef]
- Laovisutthichai, V.; Lu, W. Architectural design for manufacturing and assembly for sustainability. In Design and Technological Applications in Sustainable Architecture: The perspective of China, Japan, Singapore and Thailand; Springer: Berlin/Heidelberg, Germany, 2021; pp. 219–233. [Google Scholar]
- Al-Hajj, A.; Al Zaher, T.H. Effectiveness of implementing Activity Based Costing technique on cost control function and performance of construction projects. In Proceedings of the 7th International Conference on Innovation in Architecture, Engineering & Construction, São Paulo, Brazil, 15–17 August 2012; pp. 15–17. [Google Scholar]
- Tran, U.T.; Tran, H.T. Factors of application of activity-based costing method: Evidence from a transitional country. Asia Pac. Manag. Rev. 2022, 27, 303–311. [Google Scholar] [CrossRef]
- Aboelmagd, Y. Assessments of Barriers to Implementing Cost Control and Optimal Cost Reduction Techniques in Construction Projects: A Case Study of Egypt. J. Eng. Sci. 2021, 49, 509–529. [Google Scholar]
- Vivan, A.L.; Ortiz, F.A.H.; Paliari, J.C. Model for kaizen project development for the construction industry. Gest. Prod. 2016, 23, 333–349. [Google Scholar] [CrossRef]
- Miranda, P.; Silva, R.; da Silva, A.F.; Ferreira, C. Kaizen Costing: Systematic Literature Review (2015–2020). In Economic and Social Development: Book of Proceedings; University of Aveiro, Aveiro, Portugal; 2020; pp. 71–85.
- Guerra, B.C.; Leite, F. Circular economy in the construction industry: An overview of United States stakeholders’ awareness, major challenges, and enablers. Resour. Conserv. Recycl. 2021, 170, 105617. [Google Scholar] [CrossRef]
- Guerra, B.C.; Shahi, S.; Mollaei, A.; Skaf, N.; Weber, O.; Leite, F.; Haas, C. Circular economy applications in the construction industry: A global scan of trends and opportunities. J. Clean. Prod. 2021, 324, 129125. [Google Scholar] [CrossRef]
- Norouzi, M.; Chàfer, M.; Cabeza, L.F.; Jiménez, L.; Boer, D. Circular economy in the building and construction sector: A scientific evolution analysis. J. Build. Eng. 2021, 44, 102704. [Google Scholar] [CrossRef]
- Delgado, J.M.D.; Oyedele, L.; Ajayi, A.; Akanbi, L.; Akinade, O.; Bilal, M.; Owolabi, H. Robotics and automated systems in construction: Understanding industry-specific challenges for adoption. J. Build. Eng. 2019, 26, 100868. [Google Scholar] [CrossRef]
- Borkowski, A.S. Evolution of BIM: Epistemology, genesis and division into periods. J. Inf. Technol. Constr. 2023, 28, 646–661. [Google Scholar] [CrossRef]
- Aghimien, D.O.; Aigbavboa, C.O.; Oke, A.E.; Thwala, W.D. Mapping out research focus for robotics and automation research in construction-related studies: A bibliometric approach. J. Eng. Des. Technol. 2020, 18, 1063–1079. [Google Scholar] [CrossRef]
- Ogunsemi, D.R.; Jagboro, G.O. Time-Cost Model for Building Projects in Nigeria. Constr. Manag. Econ. 2006, 24, 253–258. [Google Scholar] [CrossRef]
- Ogunsemi, D.R. Value for Money in Construction Projects: The Quantity Surveyor’s Quest. In Proceedings of the 71st Inaugural Lecture delivered by Prof. D. R. Ogunsemi at the 2500 Capacity Auditorium, Federal University of Technology, Akure, Ondo State, Nigeria, 14–19 August 2015; pp. 901–911. [Google Scholar]
- Aghimien, D.; Aigbavboa, C. Performance of selected funding schemes used in delivering educational buildings in Nigeria. In Proceedings of the International Conference on Industrial Engineering and Operations Management, Washington DC, USA, 27–29 September 2018; pp. 108–119. [Google Scholar]
- Amusan, L.M.; Afolabi, A.; Ojelabi, R.; Omuh, I.; Okagbue, H.I. Data exploration on factors that influences construction cost and time performance on construction project sites. Data Brief 2018, 17, 1320–1325. [Google Scholar] [CrossRef]
- Akinola, G.; Fagbenle, O.; Ogunde, A. Cost Reduction Techniques Used on Public Tertiary Educational Building Projects in Southwestern Nigeria. In Proceedings of the International Conference on Science, Engineering Management and Information Technology, Ankara, Turkey, 14–15 September 2023; pp. 448–457. [Google Scholar]
- Syahrizal, F.A.; Karolina, R.; Handana, M.A.P. Value Engineering Implementation on Construction Project of Suzuya Plaza, Tanjung Morawa. In ACEIVE 2018, Proceedings of the 2nd Annual Conference of Engineering and Implementation on Vocational Education, North Sumatra, Indonesia, 3 November 2018; European Alliance for Innovation: Bratislava, Slovakia, 2019. [Google Scholar]
- Hafez, S.M.; Aziz, R.F.; Elzebak, H.M. Optimal techniques for cost reduction and control in construction sites. J. Hum. Resour. Manag. 2015, 3, 17–26. [Google Scholar] [CrossRef]
- Ogunbayo, B.F.; Aigbavboa, C.; Thwala, W.D. A Maintenance Management Framework for Municipal Buildings in Developing Economies; Taylor & Francis: Abingdon, UK, 2023. [Google Scholar]
- Ogbogu, C.O. Policy Issues in the Administration of Higher Education in Nigeria. World J. Educ. 2013, 3, 32–38. [Google Scholar]
- Okojie, J.A. Innovative Funding in the Nigerian University System. Available online: http://www.unilorin.edu.ng/unilorin/downloads/okojie-innovative%20Funding.ppt# (accessed on 19 August 2022).
- Ibrahim, M.L.; Ibrahim, Y.M.; Adogbo, K.J. Appraisal of Stakeholder Management Practice in Tertiary Education Trust Fund (Tetfund) Construction Project. Master’s Thesis, Ahmadu Bello University, Zaria Nigeria, 2014. [Google Scholar]
- The National Universities Commission (NUC). Approved Affiliation of Some Nigerian Universities with Colleges of Education, Seminaries/Theological and Other Educational Institutions. Available online: https://www.nuc.edu.ng/approved-affiliations/ (accessed on 29 December 2023).
- The National Board for Technical Education (NBTE). Approved Affiliations of the Nigerian Polytechnics, Monoethnic, Vocational, Technical and Skill Development Institutions. Available online: https://net.nbte.gov.ng/accredited%20institutions (accessed on 29 December 2023).
- Jibril, M. Perspectives and Reflections on Nigerian Higher Education; Spectrum Books, Limited: Ibadan, Nigeria, 2005. [Google Scholar]
- Owolabi, J.D.; Ogundipe, K.E.; Ogunbayo, B.F.; Aigbavboa, C.O. Barriers to Attracting and Retaining Female Construction Graduates into Academic Careers in Higher Education Institutions. Buildings 2023, 13, 2673. [Google Scholar] [CrossRef]
- Adeniyi, P.O. Repositioning Nigerian universities for national sustainable development. In Proceedings of the 10th Iju Quarterly Public Affairs Forum Series, Iju, Ondo State, Nigeria, 19–20 March 2008. [Google Scholar]
- Bamiro, O.A.; Adedeji, O.S. Sustainable financing of higher education in Nigeria. In A Conceptual Framework; University of Ibadan: Ibadan, Nigeria, 2010. [Google Scholar]
- Udu, L.E.; Nkwede, J.O. Tertiary education trust fund interventions and sustainable development in Nigerian Universities: Evidence from Ebonyi State University, Abakaliki. J. Sustain. Dev. 2014, 7, 191. [Google Scholar] [CrossRef]
- Osaigbovo, J.H.; Ikediashi, J.A. Challenges confronting the implementation of tertiary education trust fund (TETFUND) in Nigerian Educational System: The way forward. Afr. Educ. Indices 2022, 12, 20–30. [Google Scholar]
- Okechukwu, C.O.; Okafor, C.V.; Okeke, A.U. User’s Satisfaction of Higher Educational Buildings In Nigeria: A Case-Study Of Nnamdi Azikiwe University Awka. J. Multidiscip. Eng. Sci. Technol. (JMEST) 2020, 7, 2458–9403. [Google Scholar]
- Aghimien, D.O.; Adegbembo, T.F.; Aghimien, E.I.; Awodele, O.A. Challenges of sustainable construction: A study of educational buildings in Nigeria. Int. J. Built Environ. Sustain. 2018, 5. [Google Scholar] [CrossRef]
- Akuete, E.; Nduka, D.O.; Ogundipe, K.E. Maintenance Feedback Mechanisms and Limiting Factors of Post-Occupancy Evaluation in Student Residents of Higher Education Institutions in Nigeria. J. Constr. Dev. Ctries. 2022, 27, 17–41. [Google Scholar]
- Aghimien, D.O.; Awodele, O.A.; Aghimien, E.I. Stakeholders’ perception of sustainability in educational buildings in Nigeria. Int. J. Sustain. Constr. Eng. Technol. 2018, 9, 1–13. [Google Scholar]
- Ewa, U.E. Root causes of project abandonment in tertiary institutions in Nigeria. Int. Bus. Res. 2013, 6, 149. [Google Scholar] [CrossRef]
- Ogunde, A.O.; Dafe, O.E.; Akinola, G.A.; Ogundipe, K.E.; Oloke, O.C.; Ademola, S.A.; Akuete, E.; Olaniran, H.F. Factors Militating Against Prompt Delivery of Construction Projects in Lagos Megacity, Nigeria Contractors’ Perspective. Mediterr. J. Soc. Sci. 2017, 8, 1–10. [Google Scholar]
- Alao, O.; Jagboro, G.; Opawole, A.; Kadiri, D. Assessment of resuscitation strategies of abandoned projects: A case study of public tertiary education institutions’ buildings in Osun State, Nigeria. Acta Structilia 2019, 26, 167–200. [Google Scholar] [CrossRef]
- Osuizugbo, I.C.; Ojelabi, R.A. Building production management practice in the construction industry in Nigeria. Eng. Manag. Prod. Serv. 2020, 12, 56–73. [Google Scholar] [CrossRef]
- Memon, A.H.; Rahman, I.A.; Abdullah, M.R.; Azis, A.A.A. Factors affecting construction cost performance in project management projects: Case of MARA large projects. Int. J. Civ. Eng. Built Environ. 2014, 1, 30–35. [Google Scholar]
- Hussin, J.M.; Rahman, I.A.; Memon, A.H. The way forward in sustainable construction: Issues and challenges. Int. J. Adv. Appl. Sci. 2013, 2, 15–24. [Google Scholar] [CrossRef]
- Olanrewaju, A.J.; Anavhe, P. Perceived claim sources in the Nigerian construction industry. Built Environ. Proj. Asset Manag. 2014, 4, 281–295. [Google Scholar] [CrossRef]
- Mangvwat, J.S.; Ewuga, D.J.; Izam, Y.D. Time and cost performance of fixed price building contracts in tertiary institutions in Nigeria. MATEC Web Conf. 2020, 312, 06003. [Google Scholar] [CrossRef][Green Version]
- Olupitan, A.L.; Ajator, U.O.; Nzeneri, O.P. The Critical Causes and Effects of Cost Overruns in Public Sector Construction Projects in Port Harcourt, Nigeria. Int. J. Sci. Res. Publ. 2021, 11, 304–317. [Google Scholar]
- Adedokun, O.A.; Egbelakin, T.; Adedokun, D.O.; Adafin, J. Success criteria-based impacts of risk factors on education building projects in southwestern Nigeria. J. Eng. Des. Technol. 2023, 21, 1901–1924. [Google Scholar] [CrossRef]
- Isiofia, L.A.; Ibem, E.O.; Uzuegbunam, F.O.; Iloeje, A.F. Causes of time overrun in fixed price contracts of tertiary education trust fund (TETFund) building projects in Enugu State, Southeast Nigeria. Int. J. Constr. Manag. 2023, 24, 1201–1214. [Google Scholar] [CrossRef]
- Aje, I. The impact of contractors’ prequalification on construction project delivery in Nigeria. Eng. Constr. Archit. Manag. 2012, 19, 159–172. [Google Scholar] [CrossRef]
- Larson, E.; Gray, C. Project Management: The Managerial Process; McGraw Hill Education: New York, NY, USA, 2018. [Google Scholar]
- Dougherty, K.J. Performance Funding for Higher Education; JHU Press: Baltimore, MD, USA, 2016. [Google Scholar]
- Love, P.E.; Edwards, D.J.; Irani, Z. Moving beyond optimism bias and strategic misrepresentation: An explanation for social infrastructure project cost overruns. Eng. Manag. IEEE Trans. 2012, 59, 560–571. [Google Scholar] [CrossRef]
- Asiedu, R.O.; Adaku, E. Cost overruns of public sector construction projects: A developing country perspective. Int. J. Manag. Proj. Bus. 2020, 13, 66–84. [Google Scholar] [CrossRef]
- Wells, J. Corruption and collusion in construction: A view from the industry. In Corruption, Grabbing and Development: Real World Challenges; Edward Elgar Publishing: Cheltenham, UK, 2013; pp. 23–34. [Google Scholar]
- Kadiri, D.S.; Shittu, A.A. Causes of time overrun in building projects in Nigeria: Contracting and consulting perspectives. Int. J. Civ. Eng. Constr. Estate Manag. 2015, 3, 50–56. [Google Scholar]
- Cyprian, M.U.; Emenike, O.F.; Oluwaseun, N.E.; Agara, O. The Effects of Variations on the Final Cost of Selected Public Building Projects in Akanu Ibiam Federal Polytechnic, Unwana from (2010–2020). Environ. Eng. 2021, 6, 177–187. [Google Scholar]
- Tuuli, M.M.; Baiden, B.K.; Badu, E. Assessment and enforcement of liquidated damages in construction contracts in Ghana. Struct. Surv. 2007, 25, 204–219. [Google Scholar] [CrossRef]
- Alsuliman, J.; Bowles, G.; Chen, Z.; Smith, S.D. Current practice of variation order management in the Saudi construction industry. In Proceedings of the Association of Researchers in Construction Management, Edinburgh, UK, 3–5 September 2012; pp. 1–10. [Google Scholar]
- Bordat, C.; McCullouch, B.G.; Labi, S.; Sinha, K.C. An Analysis of Cost Overruns and Time Delays of INDOT Projects; Technical report prepared for INDOT-FHWA-JTRP; INDOT: Indianapolis, IN, USA, 2004. [Google Scholar]
- Jagboro, G.O.; Owoeye, C.O. A model for predicting the prices of building materials using the exchange rate in Nigeria. Malays. Surv. 2004, 5, 9–14. [Google Scholar]
- Akanni, P.O. Small scale building material production in the context of the informal economy. Prof. Build. 2006, 5, 13–18. [Google Scholar]
- Udosen, J.U.; Akanni, P.O. A factorial analysis of building material wastage associated with construction projects. J. Civ. Environ. Syst. Eng. 2010, 11, 81–90. [Google Scholar]
- Idoro, G.I.; Jolaiya, O. Evaluating material storage strategies and their relationship with construction project performance. In Proceedings of the CIB International Conference on Building Education and Research, University of Cape Town, Cape Town, South Africa, 11–15 February 2010; pp. 103–113. [Google Scholar]
- Olayisade, O.A.; Igbekoyi, O.E.; Mohammed, K. Internal Control System and Financial Management in Federal Government Hospitals. Int. J. Res. Innov. Soc. Sci. 2023, 7, 1648–1664. [Google Scholar] [CrossRef]
- Young Global Leaders. World Economic Forum Annual Meeting 2016: Mastering the Fourth Industrial Revolution; World Economic Forum: Cologny, Switzerland, 2016. [Google Scholar]
- Owusu, E.K.; Chan, A.P.; Ameyaw, E. Toward a cleaner project procurement: Evaluation of construction projects’ vulnerability to corruption in developing countries. J. Clean. Prod. 2019, 216, 394–407. [Google Scholar] [CrossRef]
- Khadim, N.; Jaffar, S.T.; Musarat, M.A.; Ilyas, U. Effects of corruption on infrastructure projects in developing countries. Int. J. Emerg. Technol. 2021, 12, 284–295. [Google Scholar]
- Ogbu, C.P.; Asuquo, C.F. A comparison of prevalence of unethical tendering practices at national and subnational levels in Nigeria. Afr. Public Serv. Deliv. Perform. Rev. 2018, 6, 1–3. [Google Scholar] [CrossRef]
- Damoah, I.S.; Tingbani, I.; Kumi, D.K.; Akwei, C.C.; Amoako, I.O. Factors influencing school building construction projects abandonment. Int. J. Constr. Manag. 2022, 22, 961–976. [Google Scholar] [CrossRef]
- Paré, G.; Kitsiou, S. Methods for literature reviews. In Handbook of Ehealth Evaluation: An Evidence-Based Approach; University of Victoria: Victoria, BC, Canada, 2017. [Google Scholar]
- Babbie, E.R. The Practice of Social Research; Cengage Learning: Boston, MA, USA, 2020. [Google Scholar]
- Eyisi, D. The usefulness of qualitative and quantitative approaches and methods in researching problem-solving ability in science education curriculum. J. Educ. Pract. 2016, 7, 91–100. [Google Scholar]
- Apuke, O.D. Quantitative research methods: A synopsis approach. Kuwait Chapter Arab. J. Bus. Manag. Rev. 2017, 33, 1–8. [Google Scholar] [CrossRef]
- Akinradewo, O.; Aghimien, D.; Aigbavboa, C.; Onyia, M. Factors influencing the adoption of insurance as a risk treatment tool by contractors in the construction industry. Int. J. Constr. Manag. 2020, 22, 2484–2492. [Google Scholar] [CrossRef]
- Ogundipe, K.E.; Ogunbayo, B.F.; Ajao, A.M.; Ogundipe, U.L.; Tunji-Olayeni, P.F. Survey datasets on categories of factors militating against safety practices on construction sites. Data Brief 2018, 19, 2071–2078. [Google Scholar] [CrossRef] [PubMed]
- Campbell, S.; Greenwood, M.; Prior, S.; Shearer, T.; Walkem, K.; Young, S.; Bywaters, D.; Walker, K. Purposive sampling: Complex or simple? Research case examples. J. Res. Nurs. 2020, 25, 652–661. [Google Scholar] [CrossRef] [PubMed]
- Moser, C.A.; Kalton, G. Survey Methods in Social Investigation; Routledge: London, UK, 2017. [Google Scholar]
- Ezennia, I.S. Insights of housing providers’ on the critical barriers to sustainable affordable housing uptake in Nigeria. World Dev. Sustain. 2022, 1, 100023. [Google Scholar] [CrossRef]
- Tabachnick, B.G.; Fidell, L.S. Using Multivariate Statistics; Pearson Education Inc.: Boston, MA, USA, 2007. [Google Scholar]
- Tavokol, M.; Dennick, R. Making sense of Cronbach’s alpha. Int. J. Med. Educ. 2011, 2, 53–55. [Google Scholar] [CrossRef] [PubMed]
- Yong, A.G.; Pearce, S. A beginner’s guide to factor analysis: Focusing on exploratory factor analysis. Tutor. Quant. Methods Psychol. 2013, 9, 79–94. [Google Scholar] [CrossRef]
- Pallant, J. SPSS Survival Manual, 6th ed.; Open University Press: England, UK, 2016. [Google Scholar]
- Aboginije, A.; Aigbavboa, C.; Thwala, W.A. Holistic Assessment of Construction and Demolition Waste Management in the Nigerian Construction Projects. Sustainability 2021, 13, 6241. [Google Scholar] [CrossRef]
- Oke, A.E.; Aliu, J.; Tunji-Olayeni, P.; Abayomi, T. Application of gamification for sustainable construction: An evaluation of challenges. Constr. Innov. 2023; Epub ahead of printing. [Google Scholar] [CrossRef]
- Eiselen, R.; Uys, T.; Potgieter, T. Analysing Survey Data Using SPSS13; STATKON, University of Johannesburg: Johannesburg, South Africa, 2007. [Google Scholar]
- Bell, E.; Bryman, A. The ethics of management research: An exploratory content analysis. Br. J. Manag. 2007, 18, 63–77. [Google Scholar] [CrossRef]
- Kothari, C.R. Research Methodology: Methods and Techniques; New Age International: Delhi, India, 2004. [Google Scholar]
- Opoku, D.G.J.; Perera, S.; Osei-Kyei, R.; Rashidi, M. Digital twin application in the construction industry: A literature review. J. Build. Eng. 2021, 40, 102726. [Google Scholar] [CrossRef]


Disclaimer/Publisher’s Note: The statements, opinions and data contained in all publications are solely those of the individual author(s) and contributor(s) and not of MDPI and/or the editor(s). MDPI and/or the editor(s) disclaim responsibility for any injury to people or property resulting from any ideas, methods, instructions or products referred to in the content. |
© 2024 by the authors. Licensee MDPI, Basel, Switzerland. This article is an open access article distributed under the terms and conditions of the Creative Commons Attribution (CC BY) license (https://creativecommons.org/licenses/by/4.0/).