
Effect of Self-Filtering Layer on Tailings–Steel Wire Mesh Interfacial Shearing Properties and Bearing Behavior of Drain Pipes


Abstract
1. Introduction
2. Interfacial Shearing Experiment
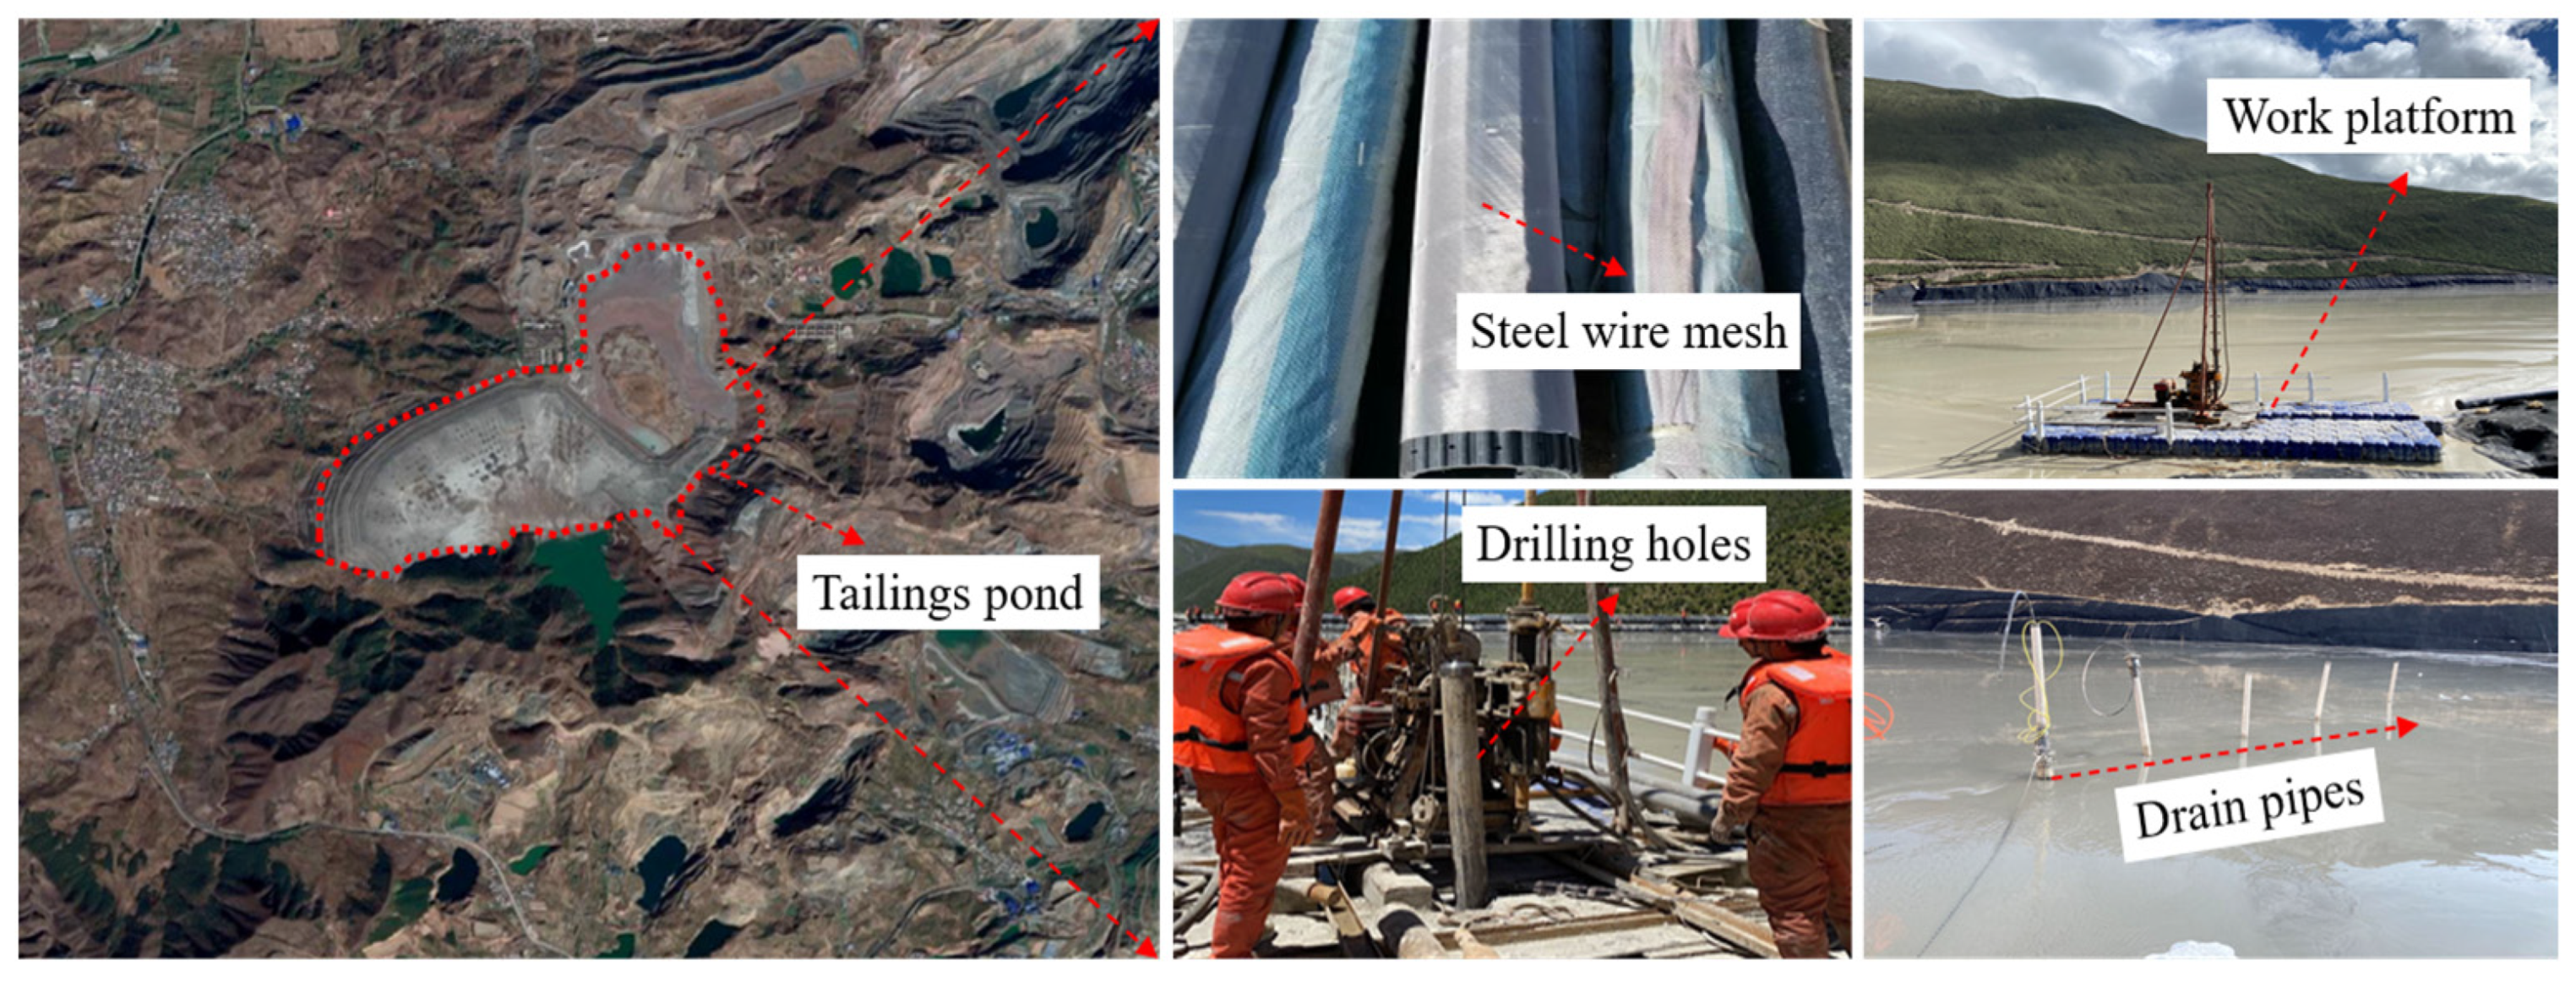
2.1. Engineering Background
2.2. Materials
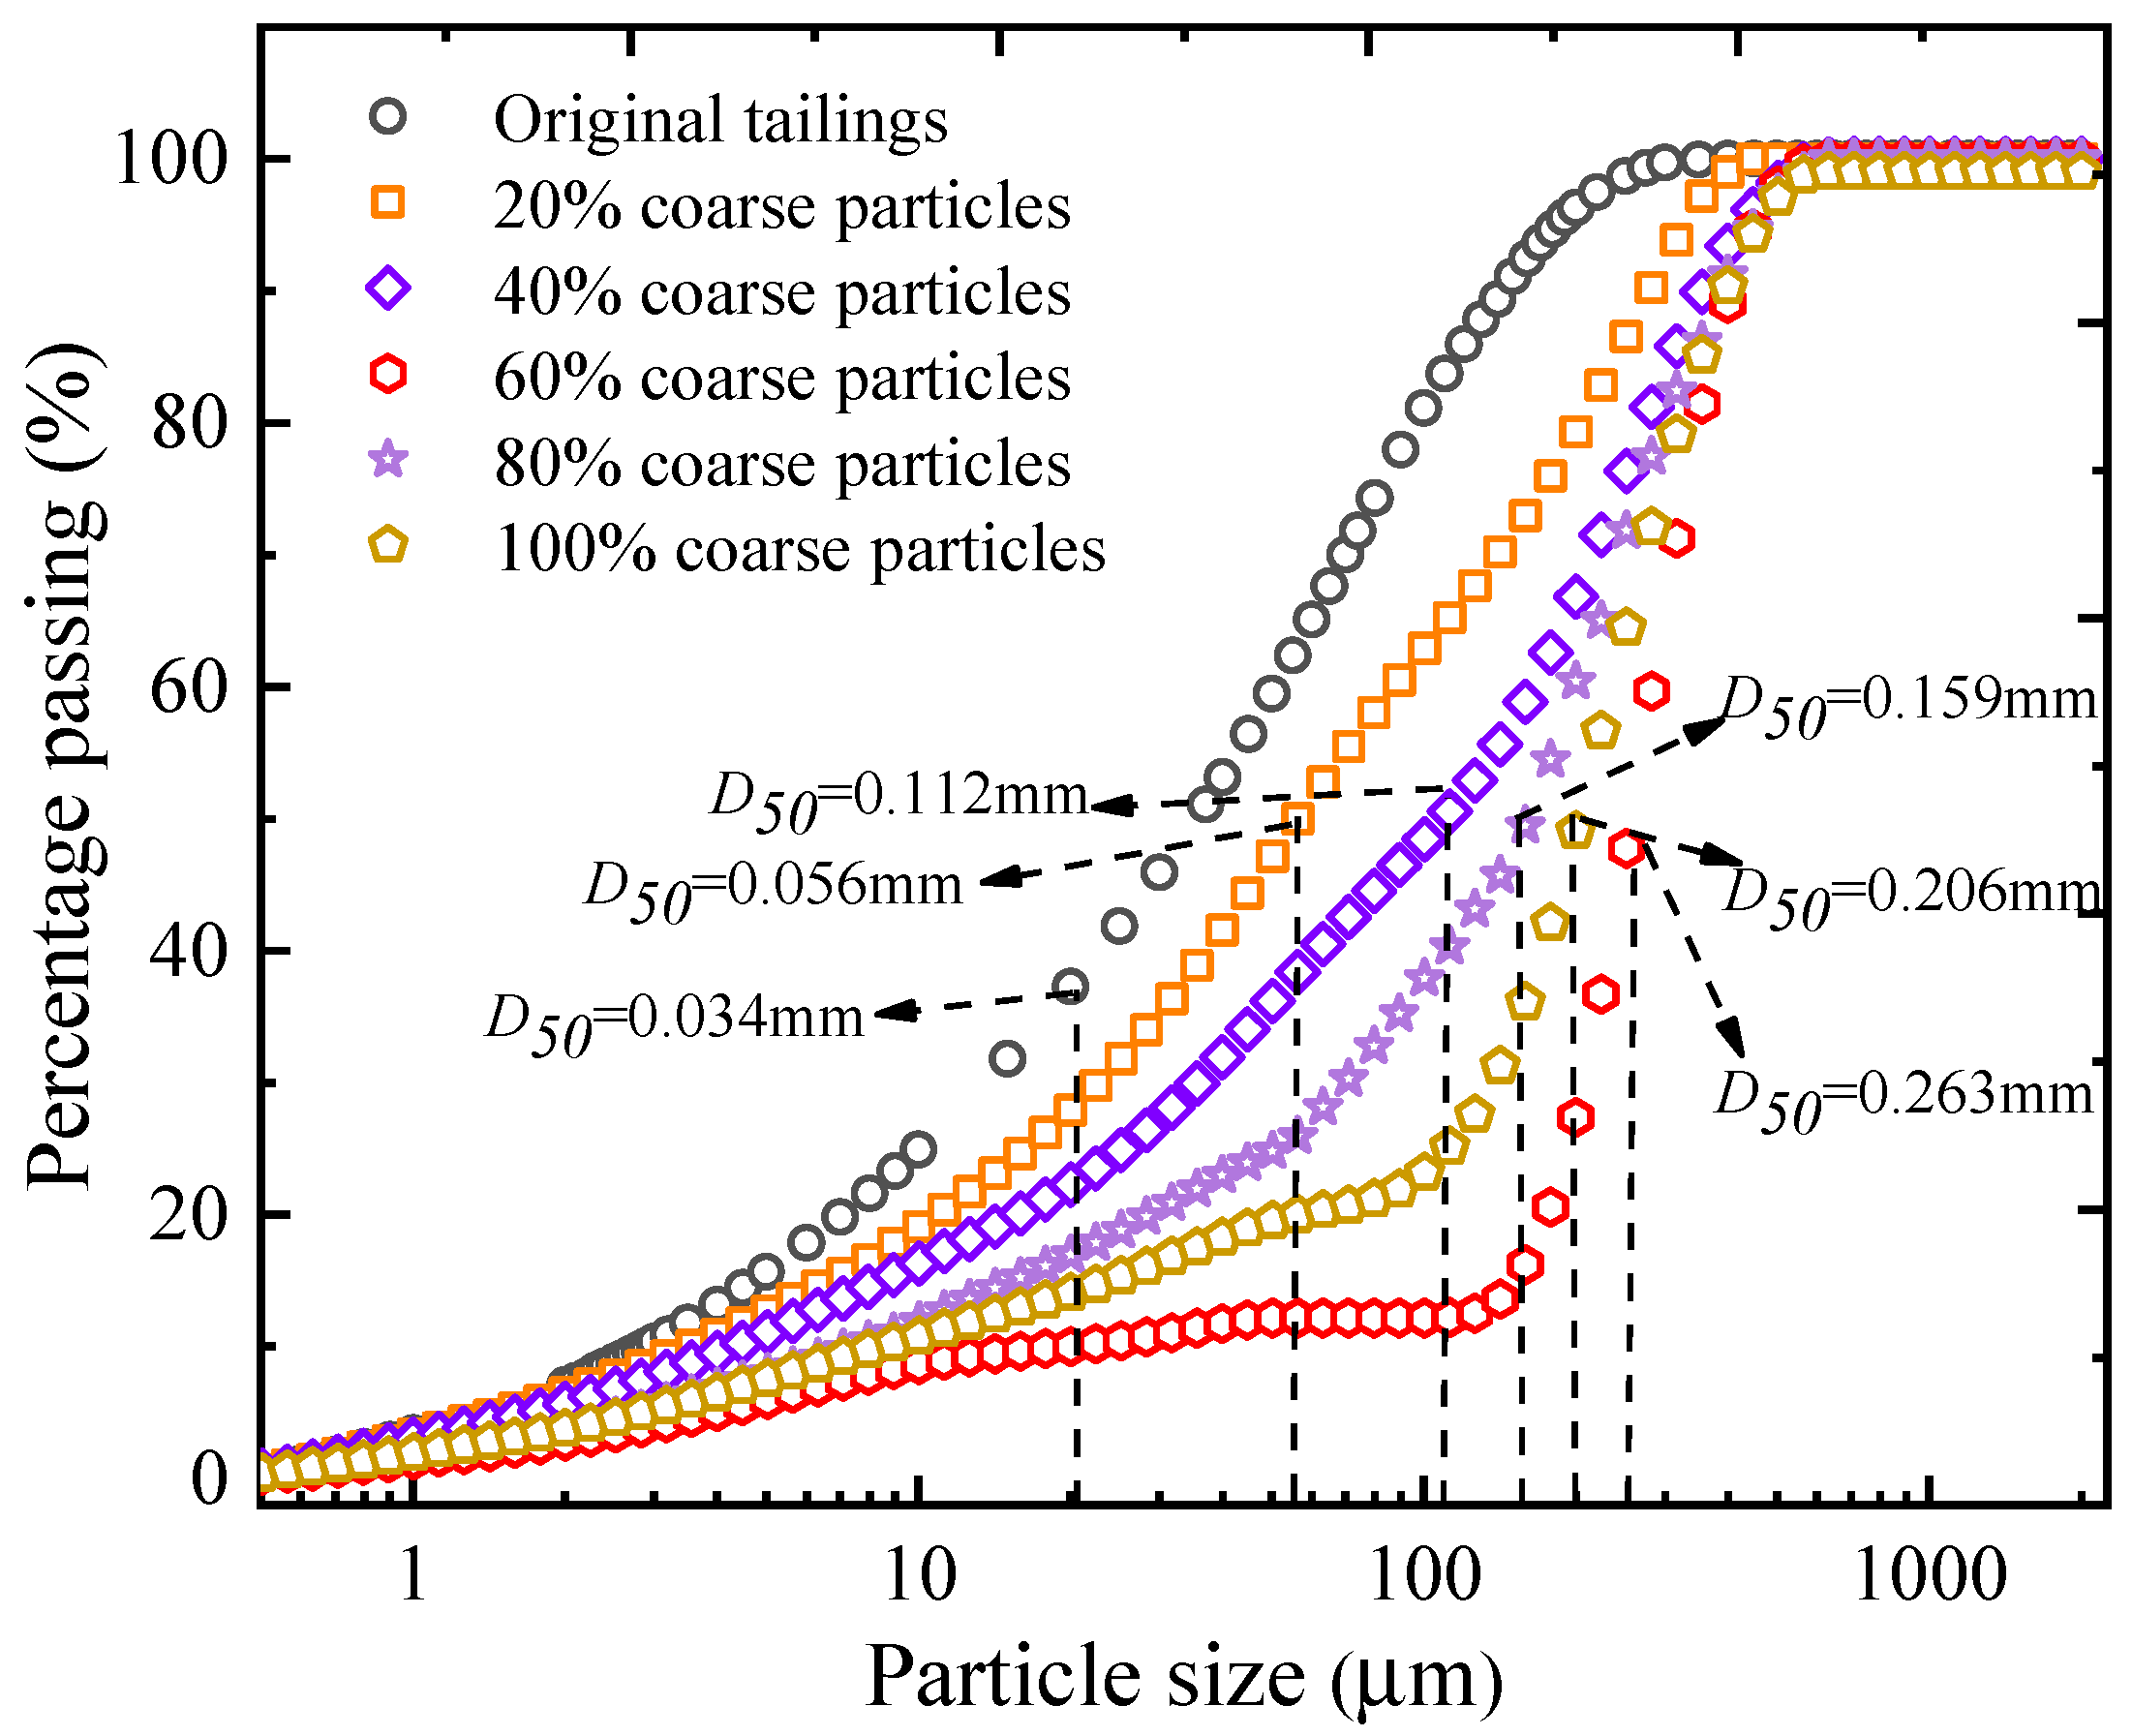
2.2.1. Tailings
2.2.2. Steel Wire Mesh
2.3. Specimen Preparation
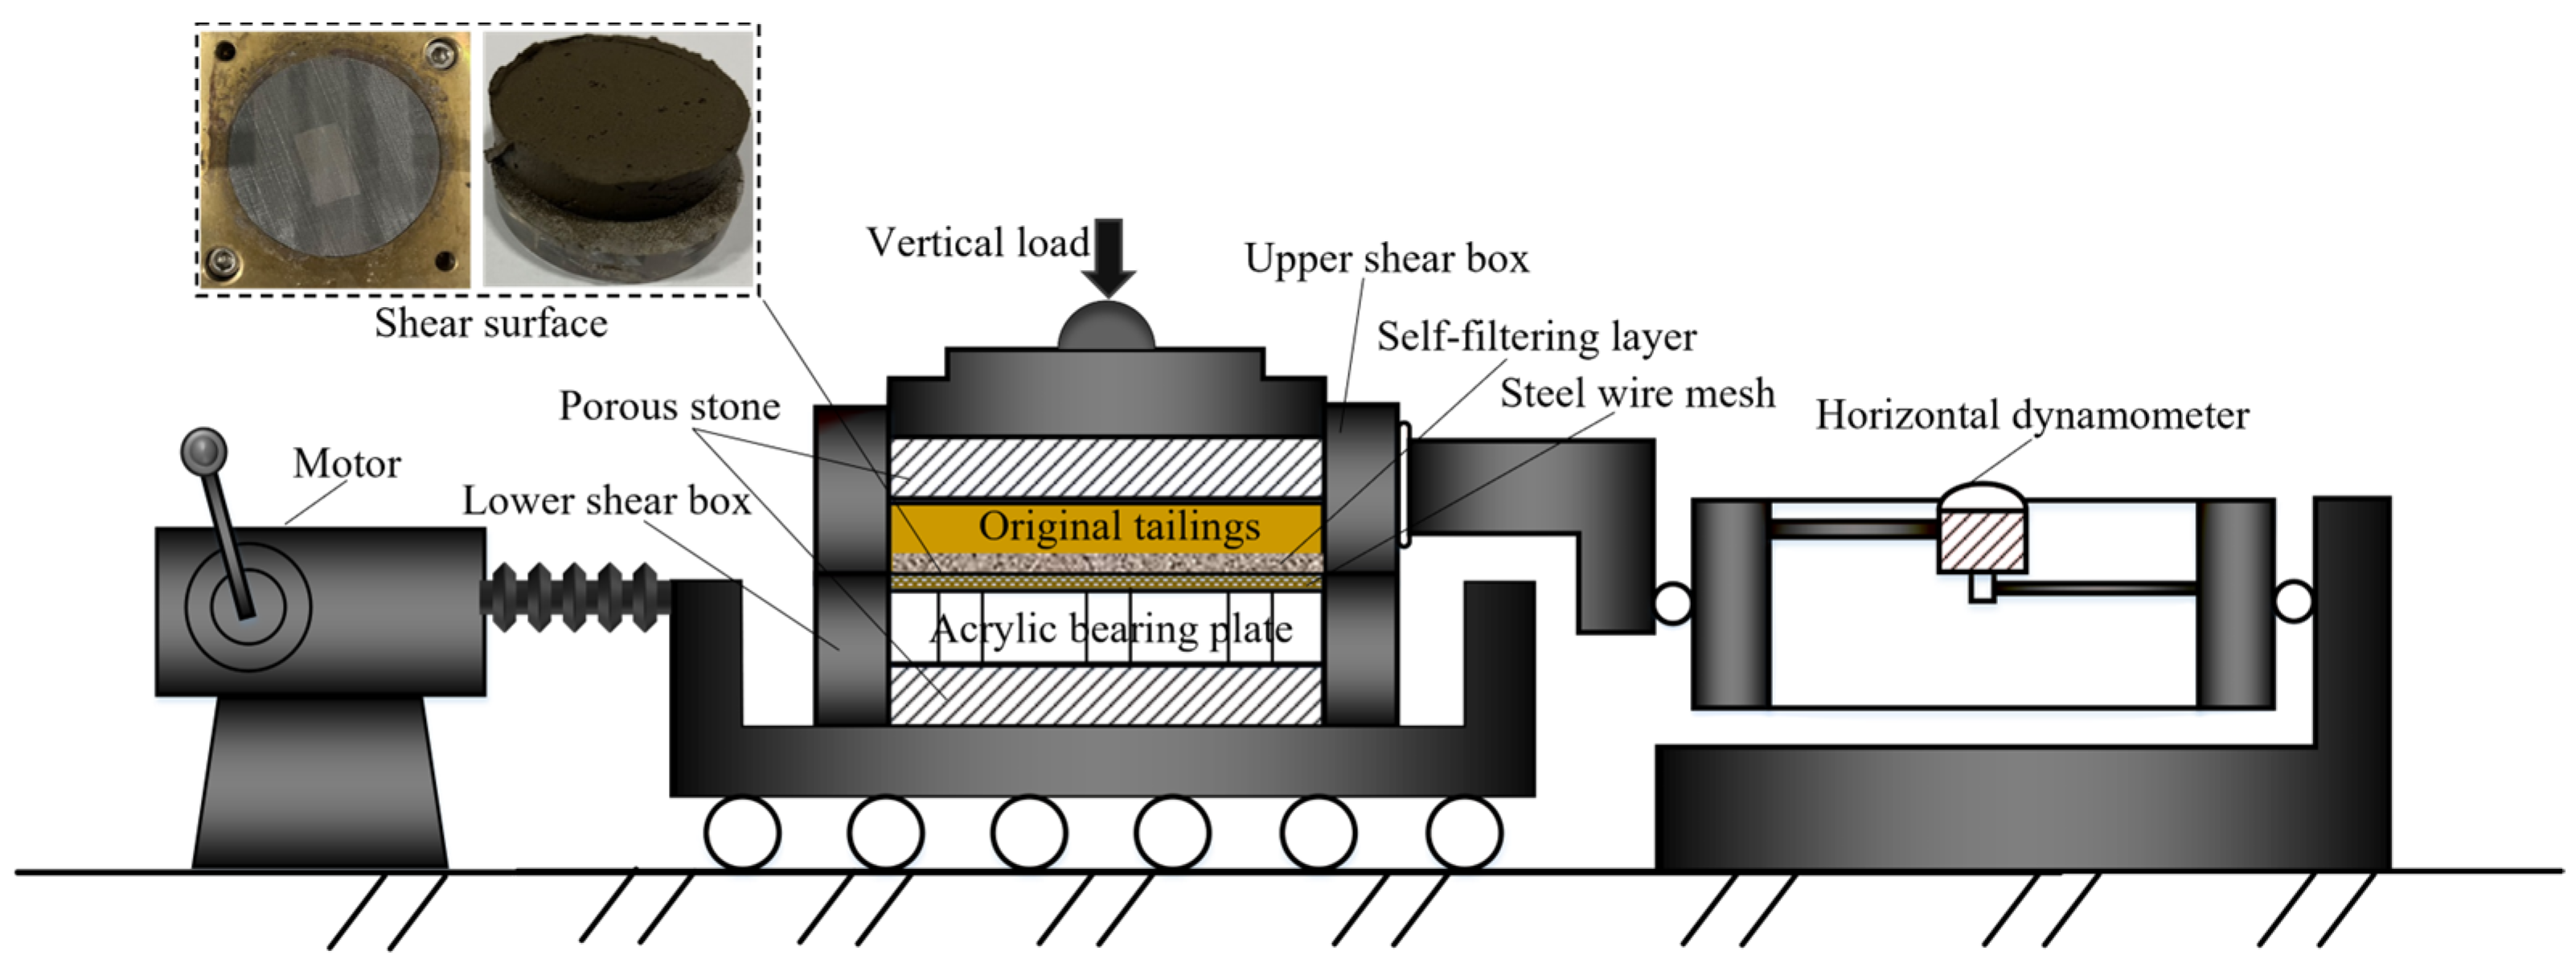
2.4. Testing Program
3. Experimental Result
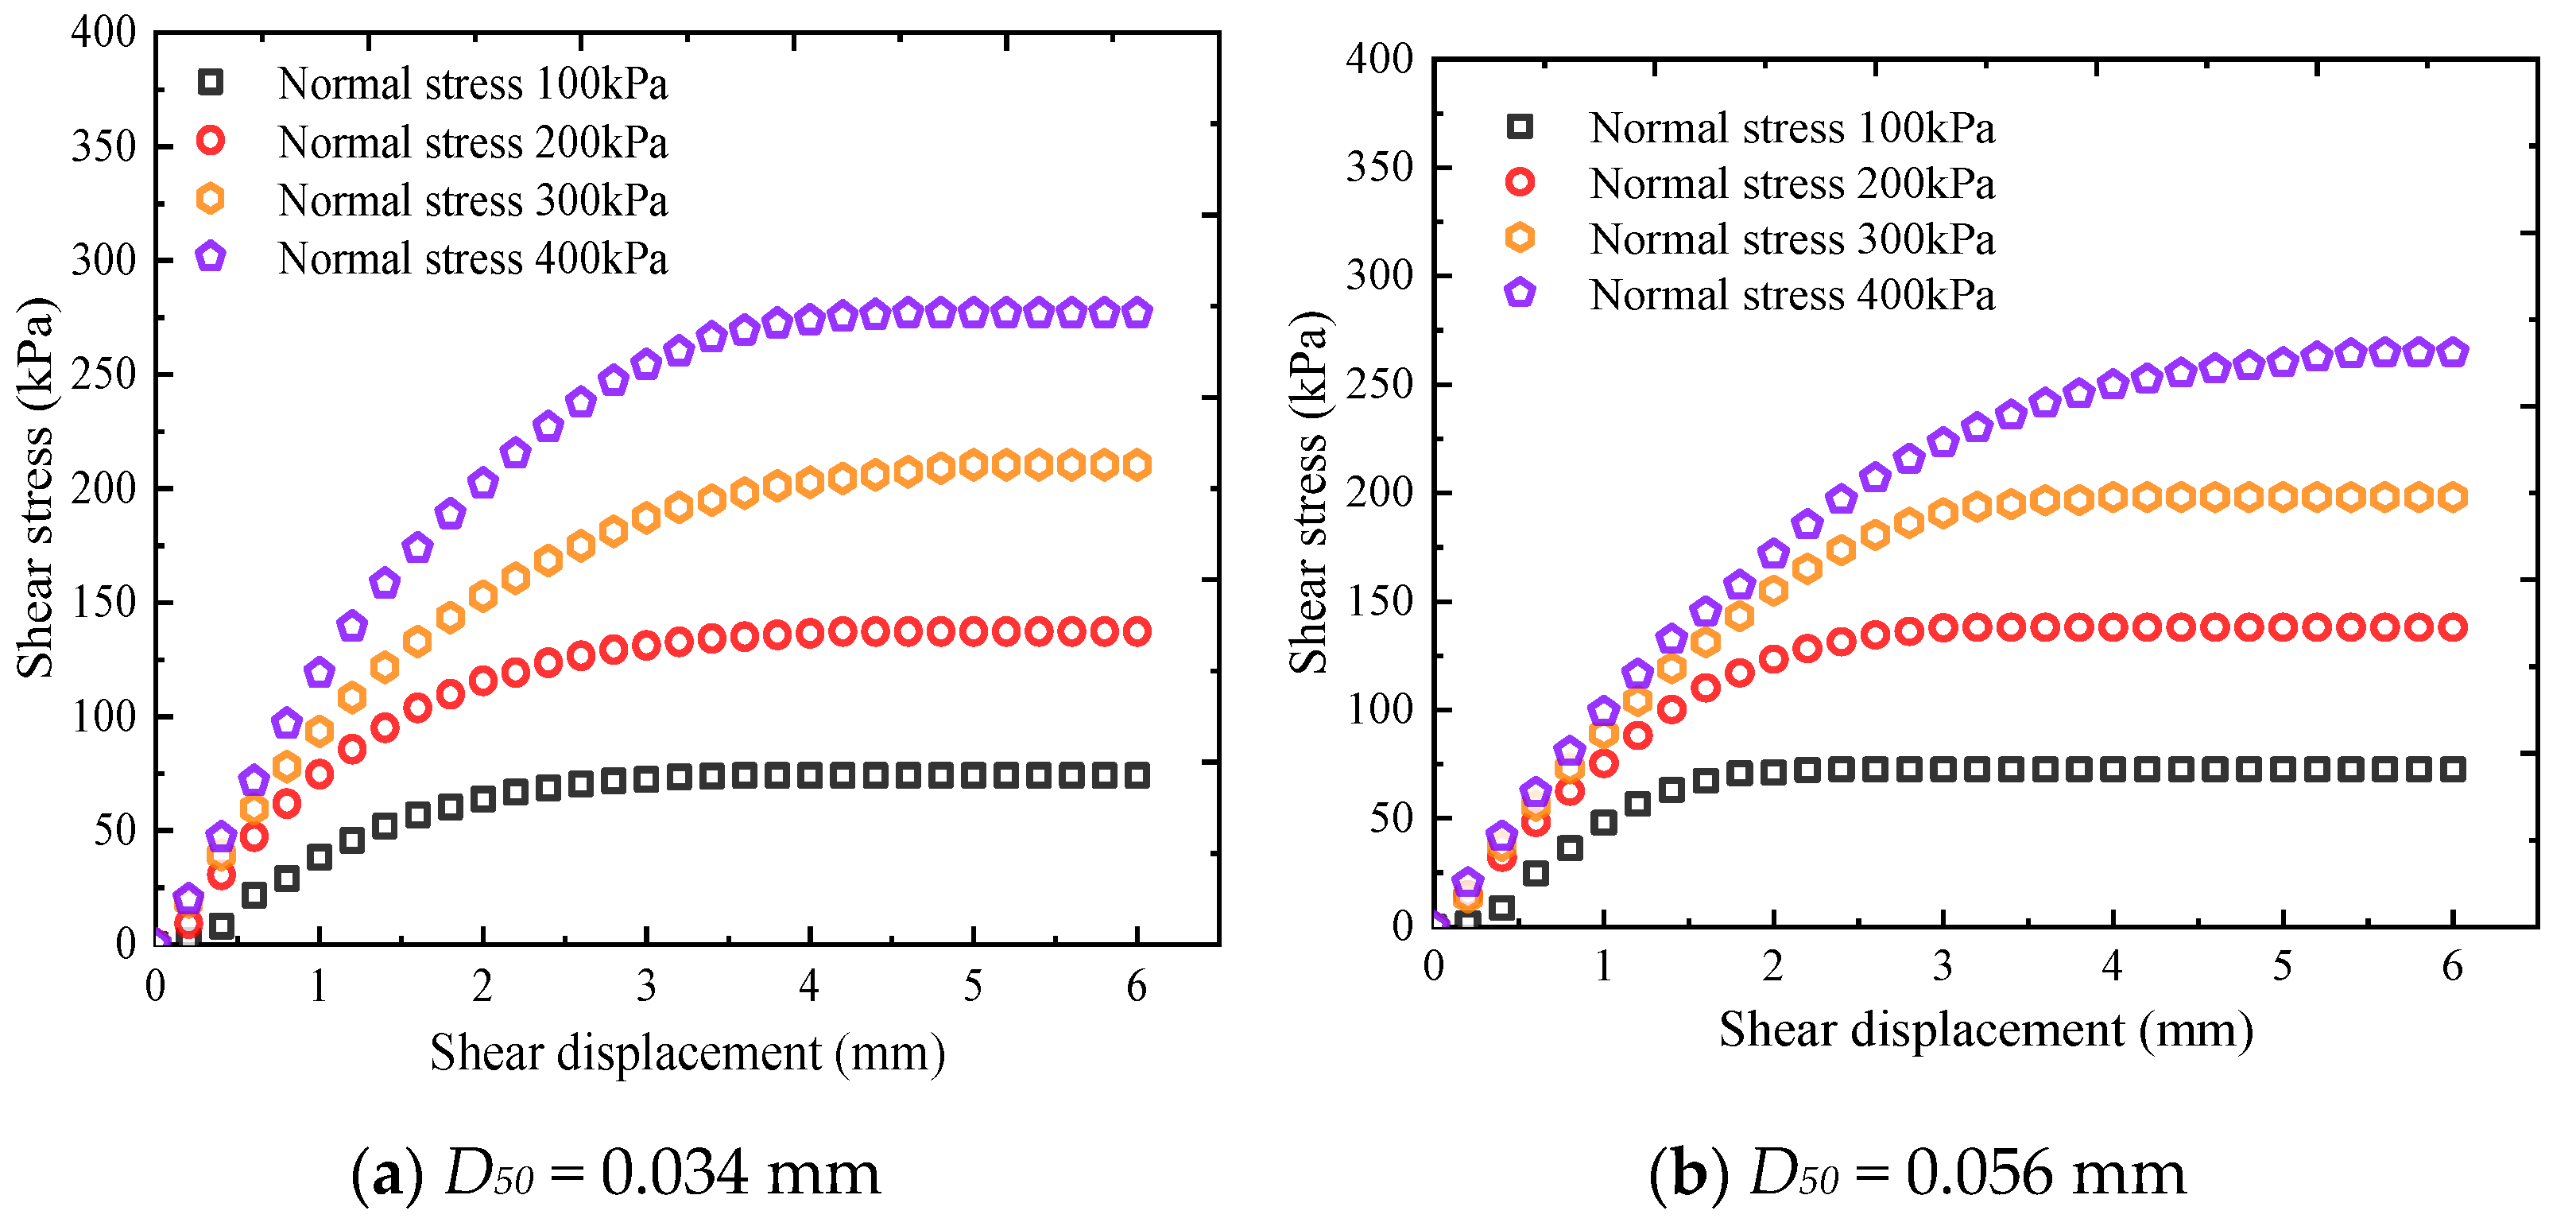
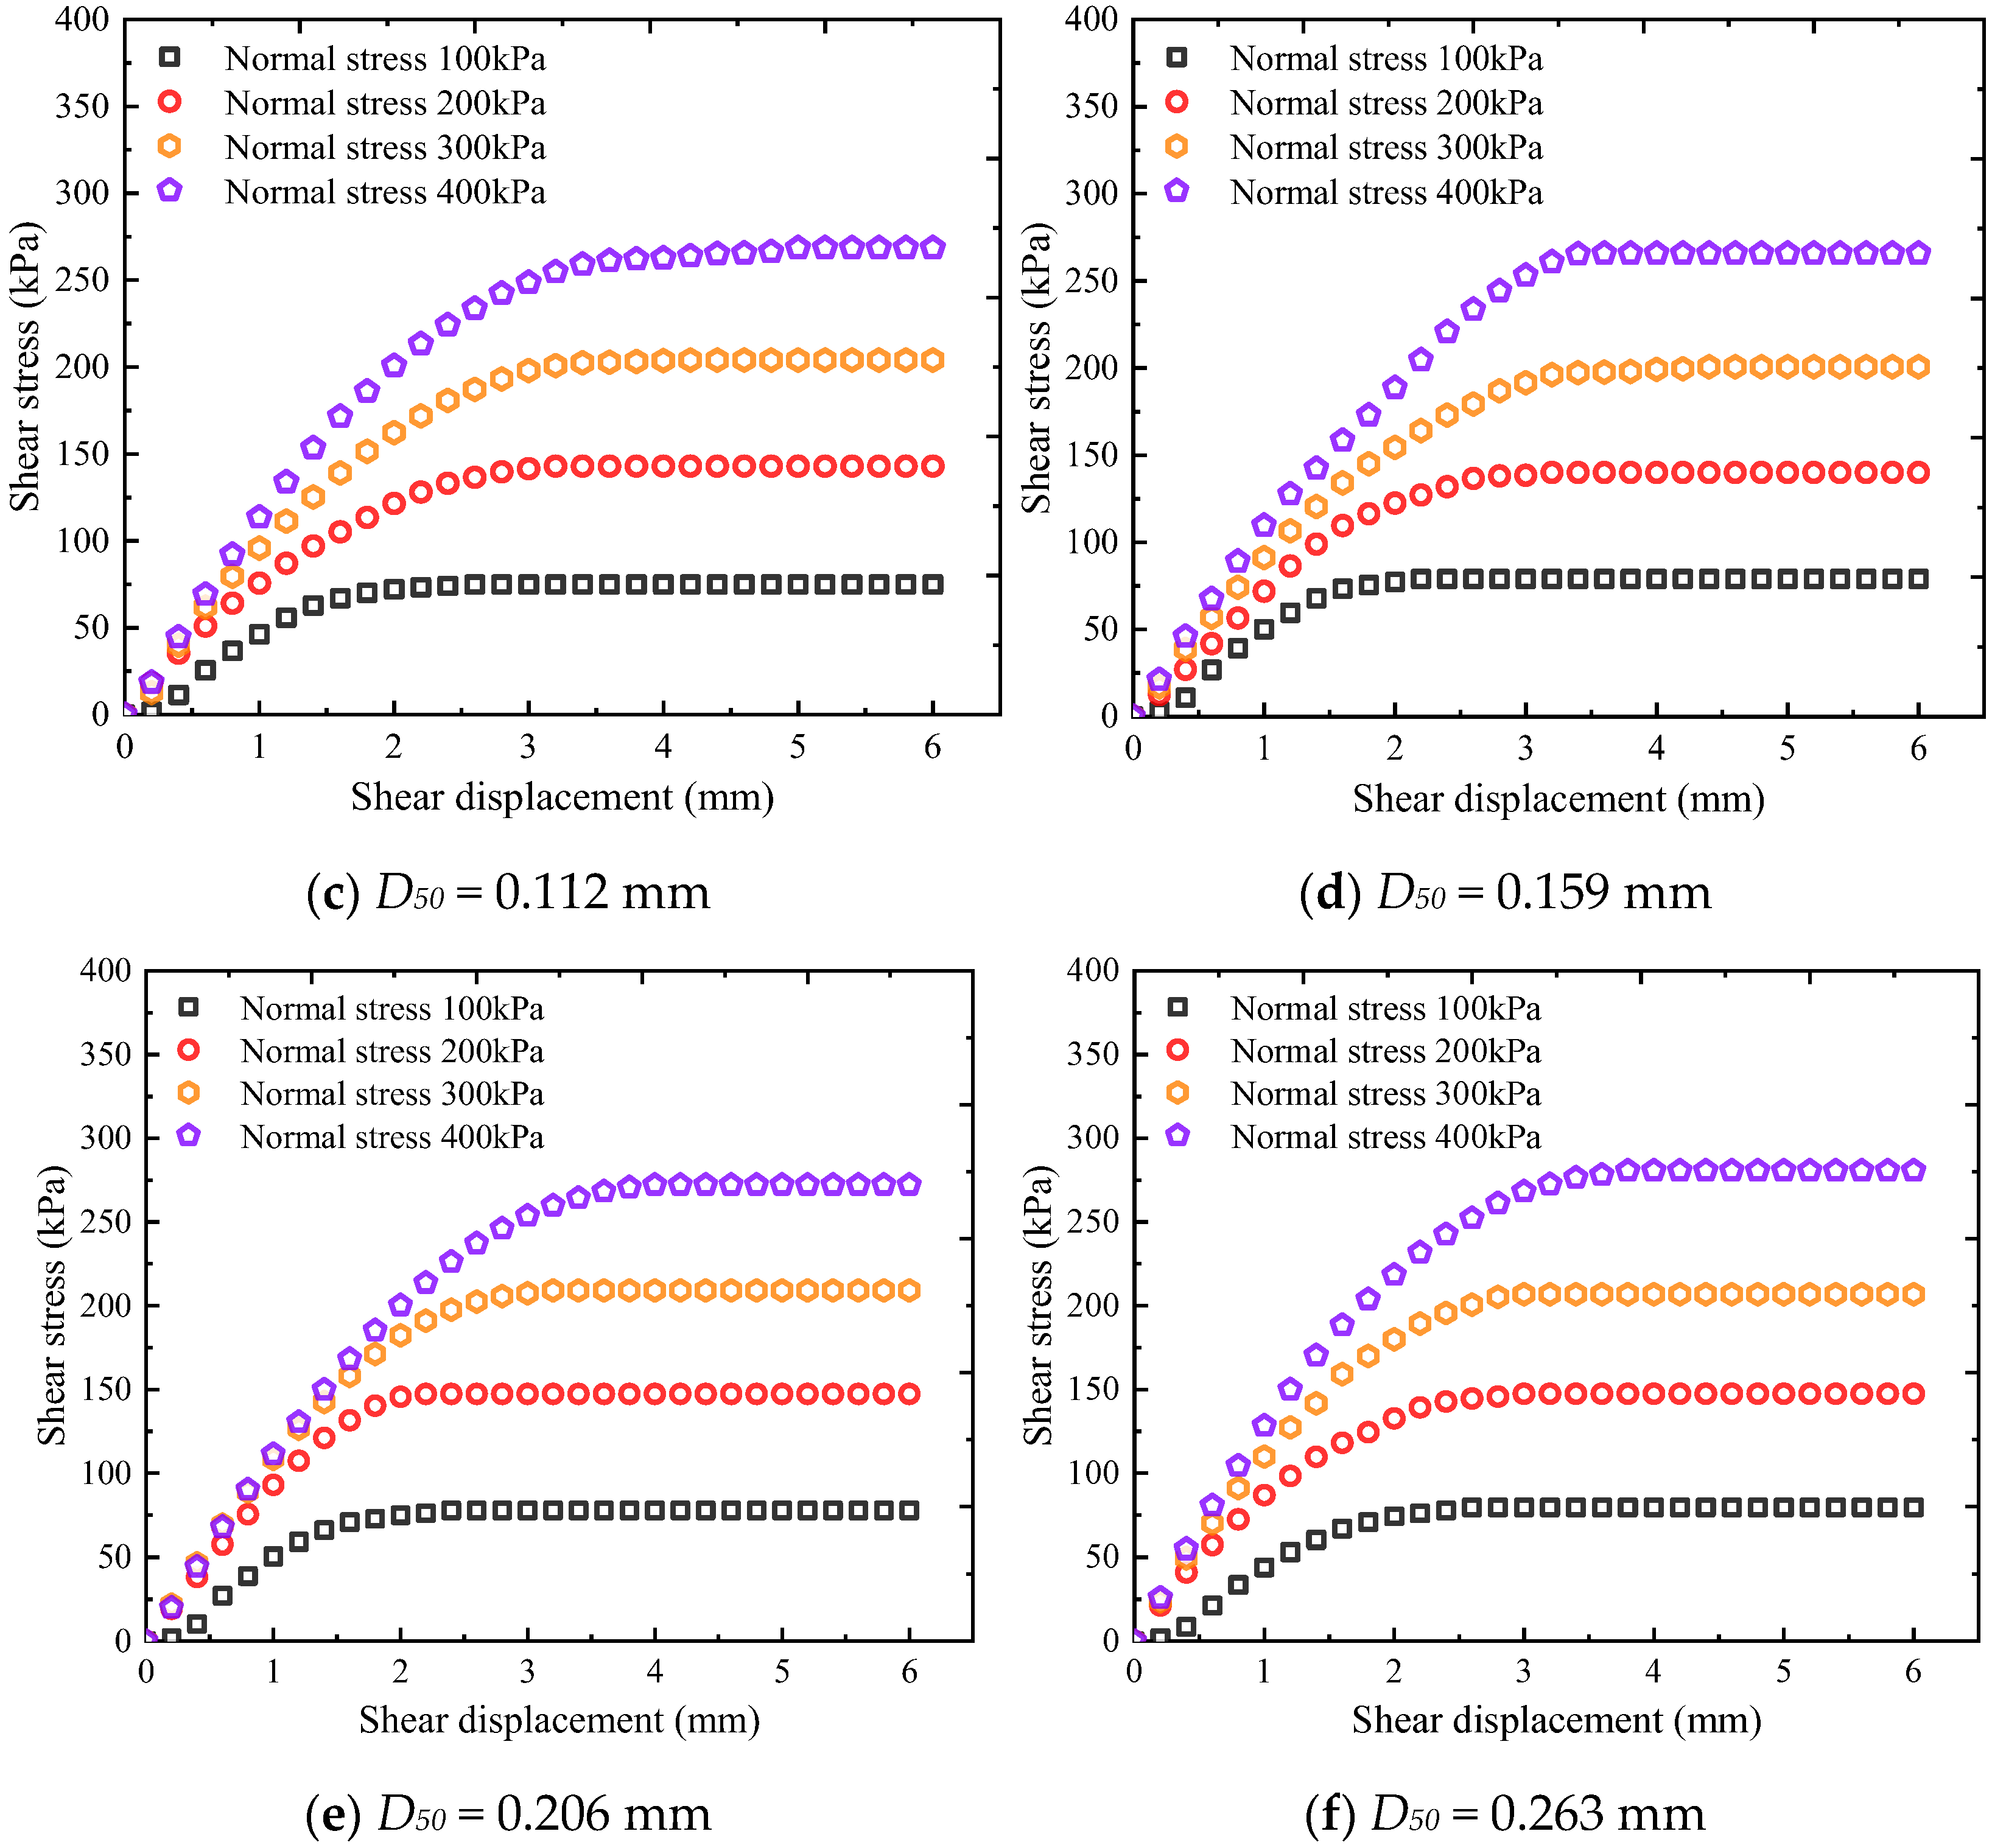
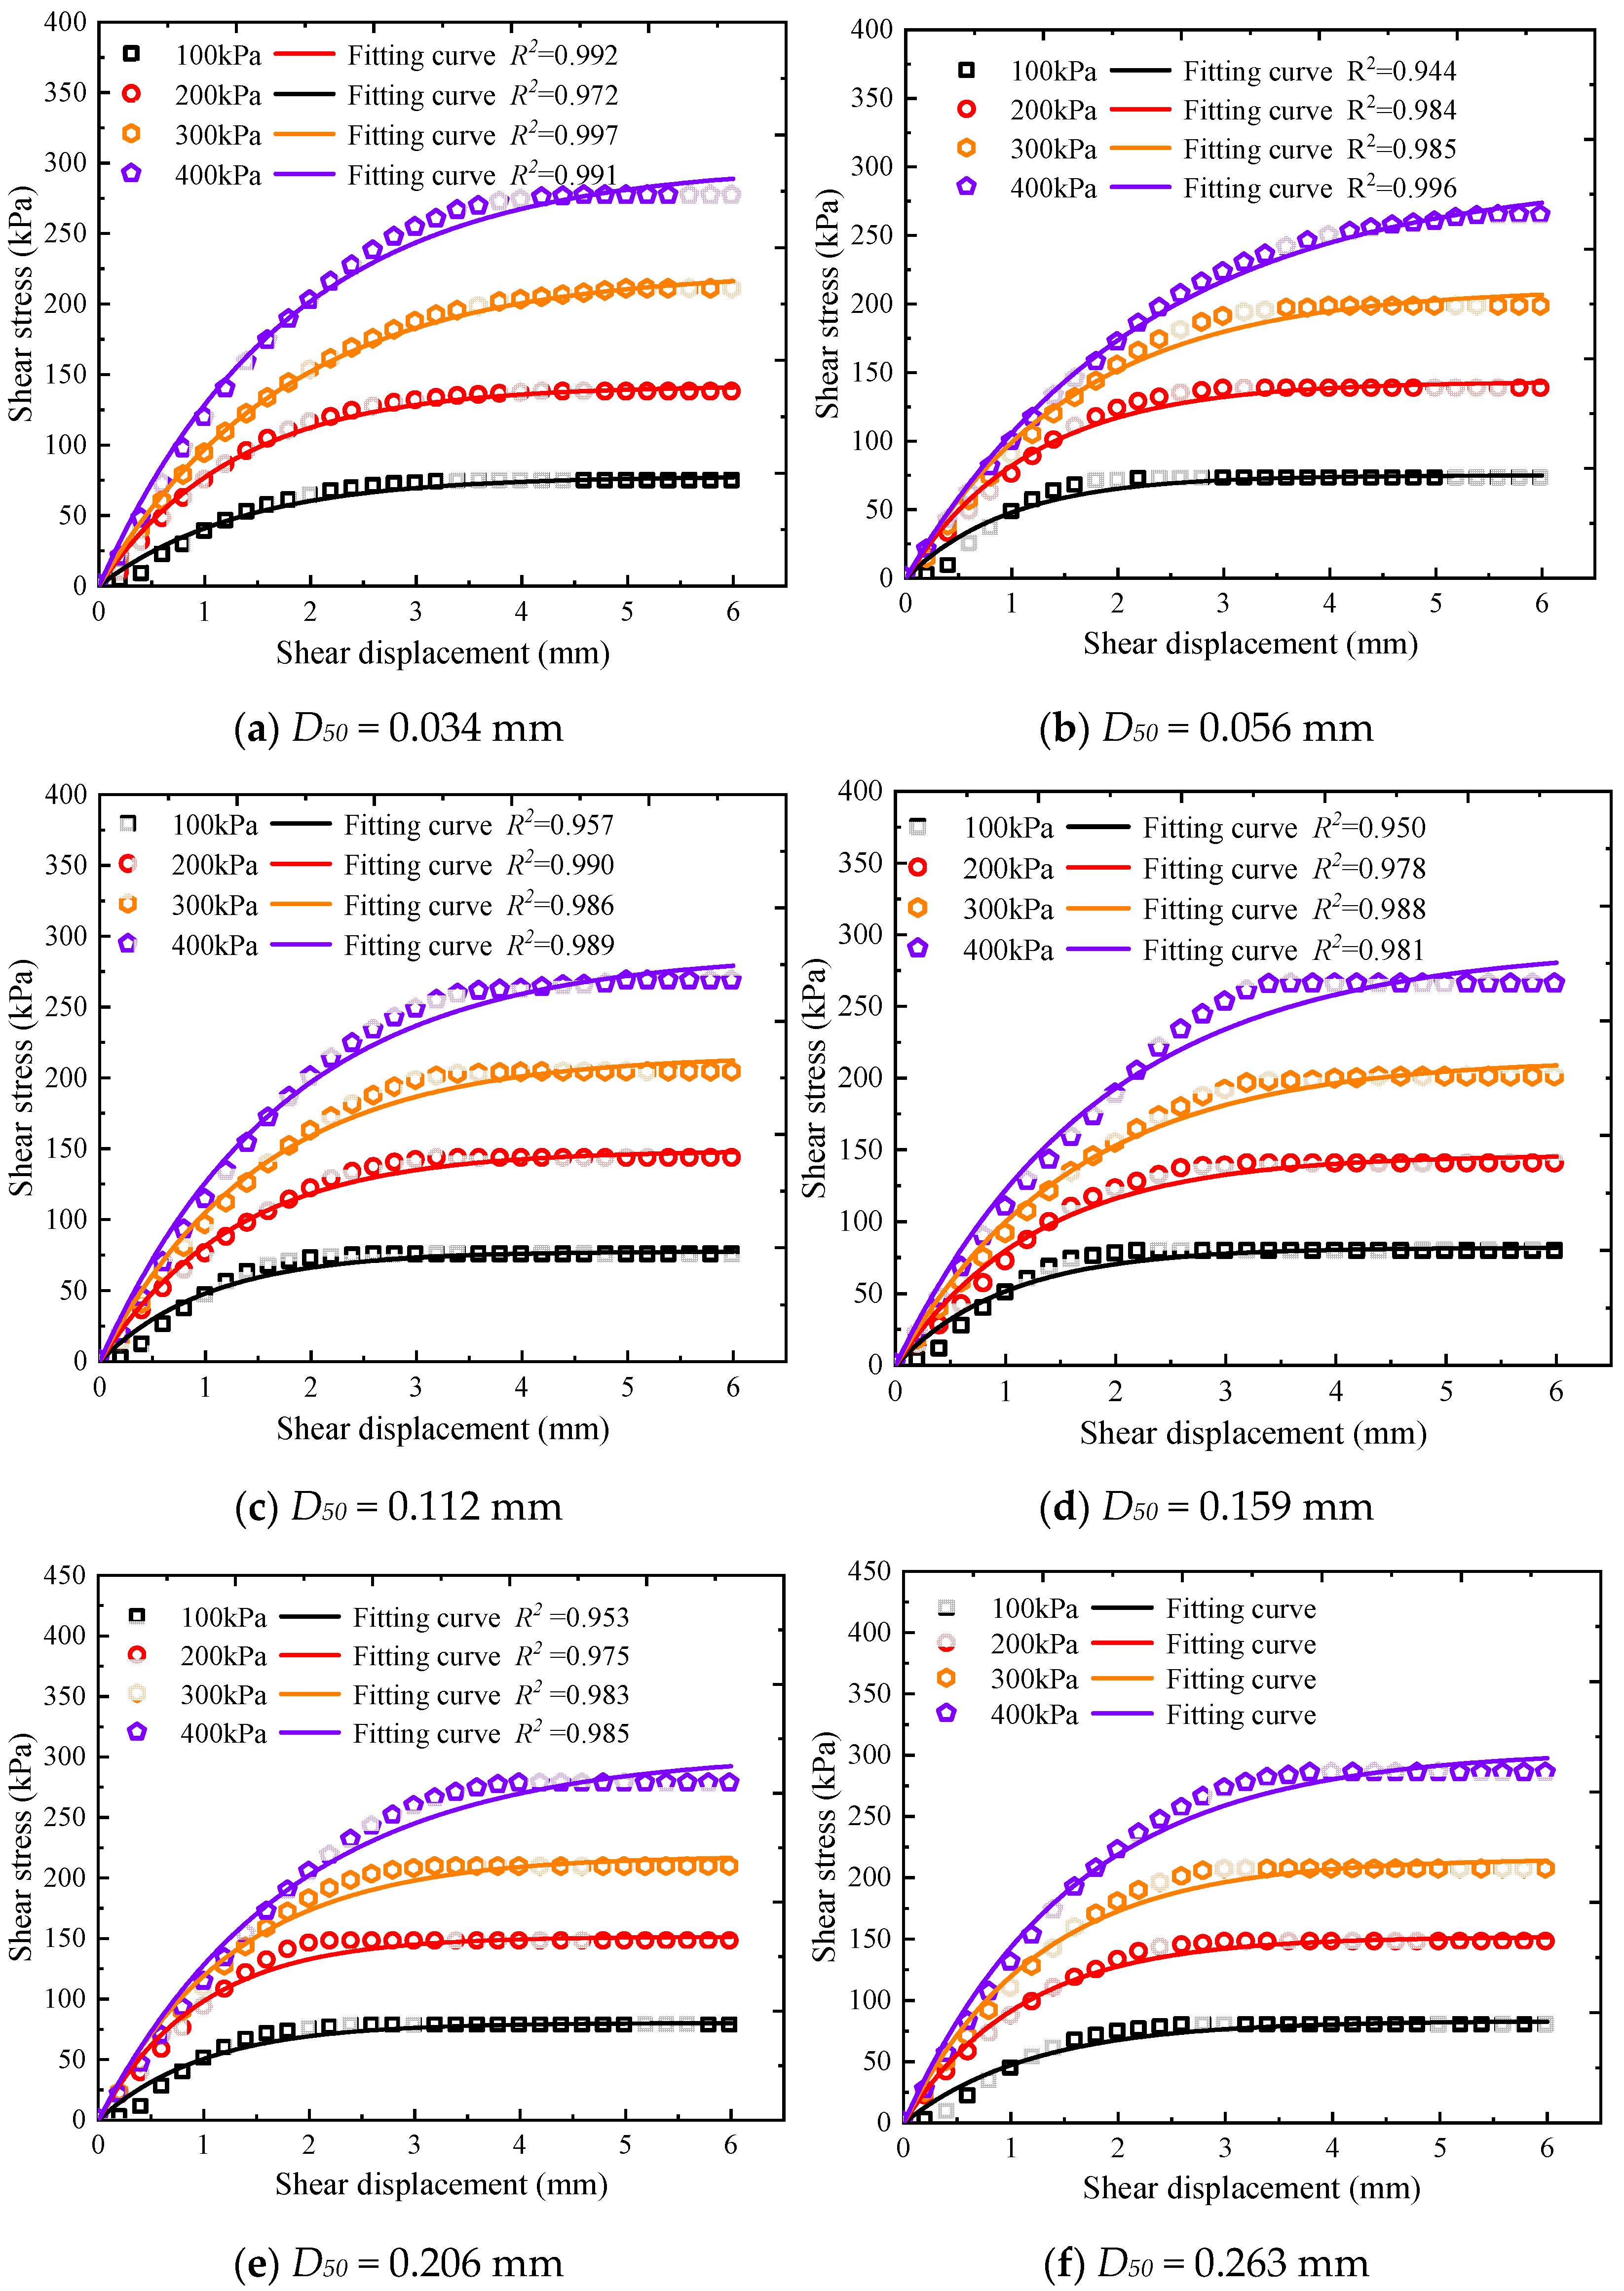
3.1. Interface Shear Stress–Displacement Curve
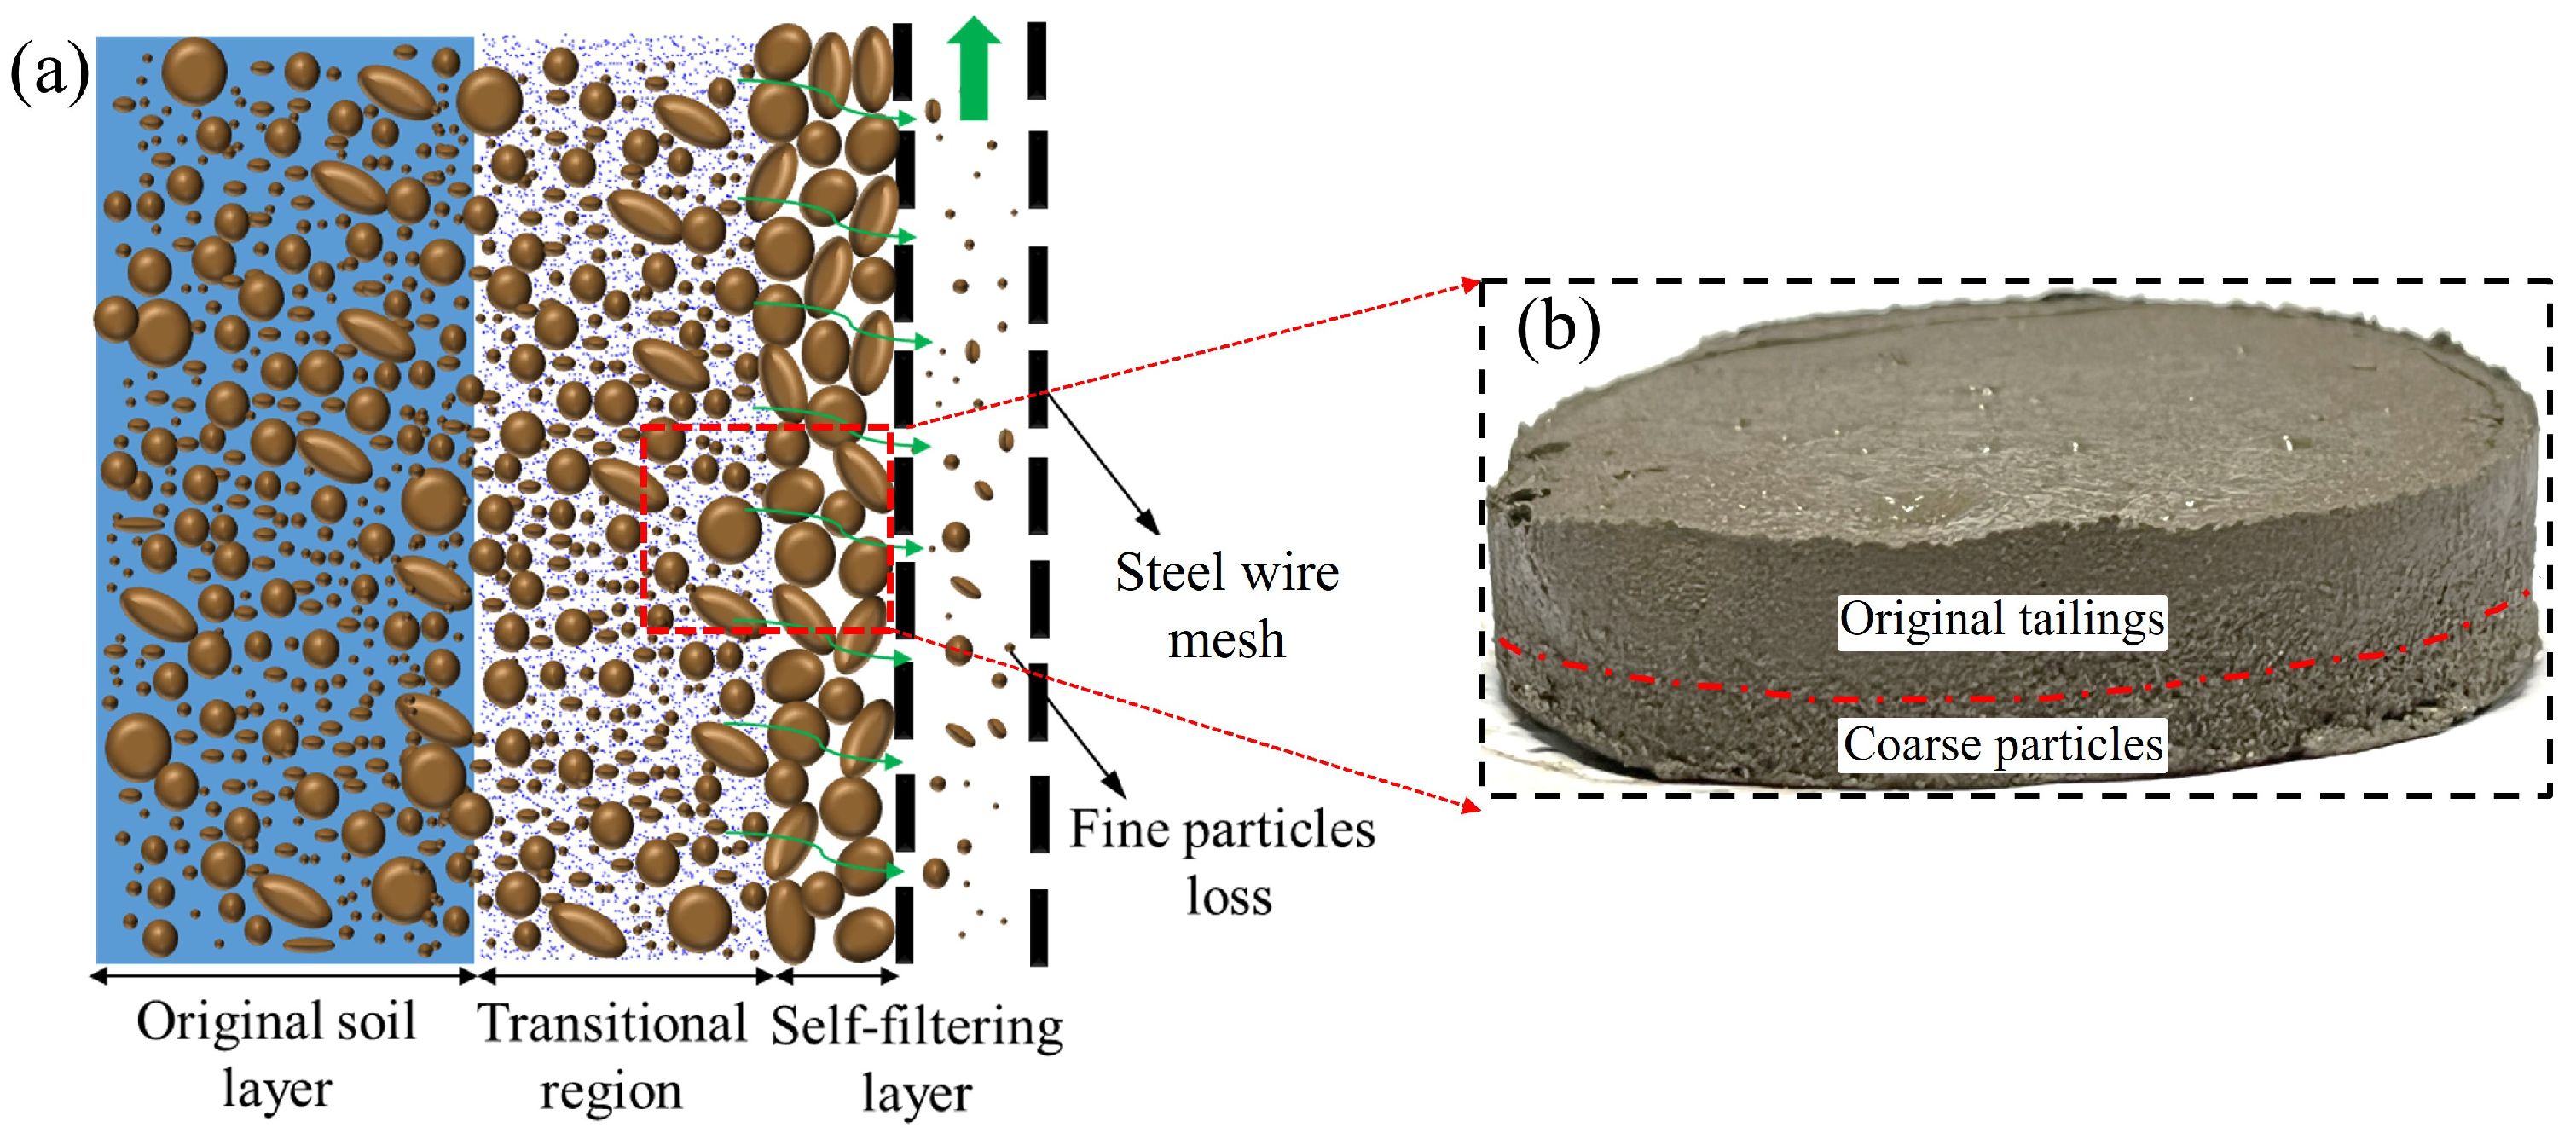
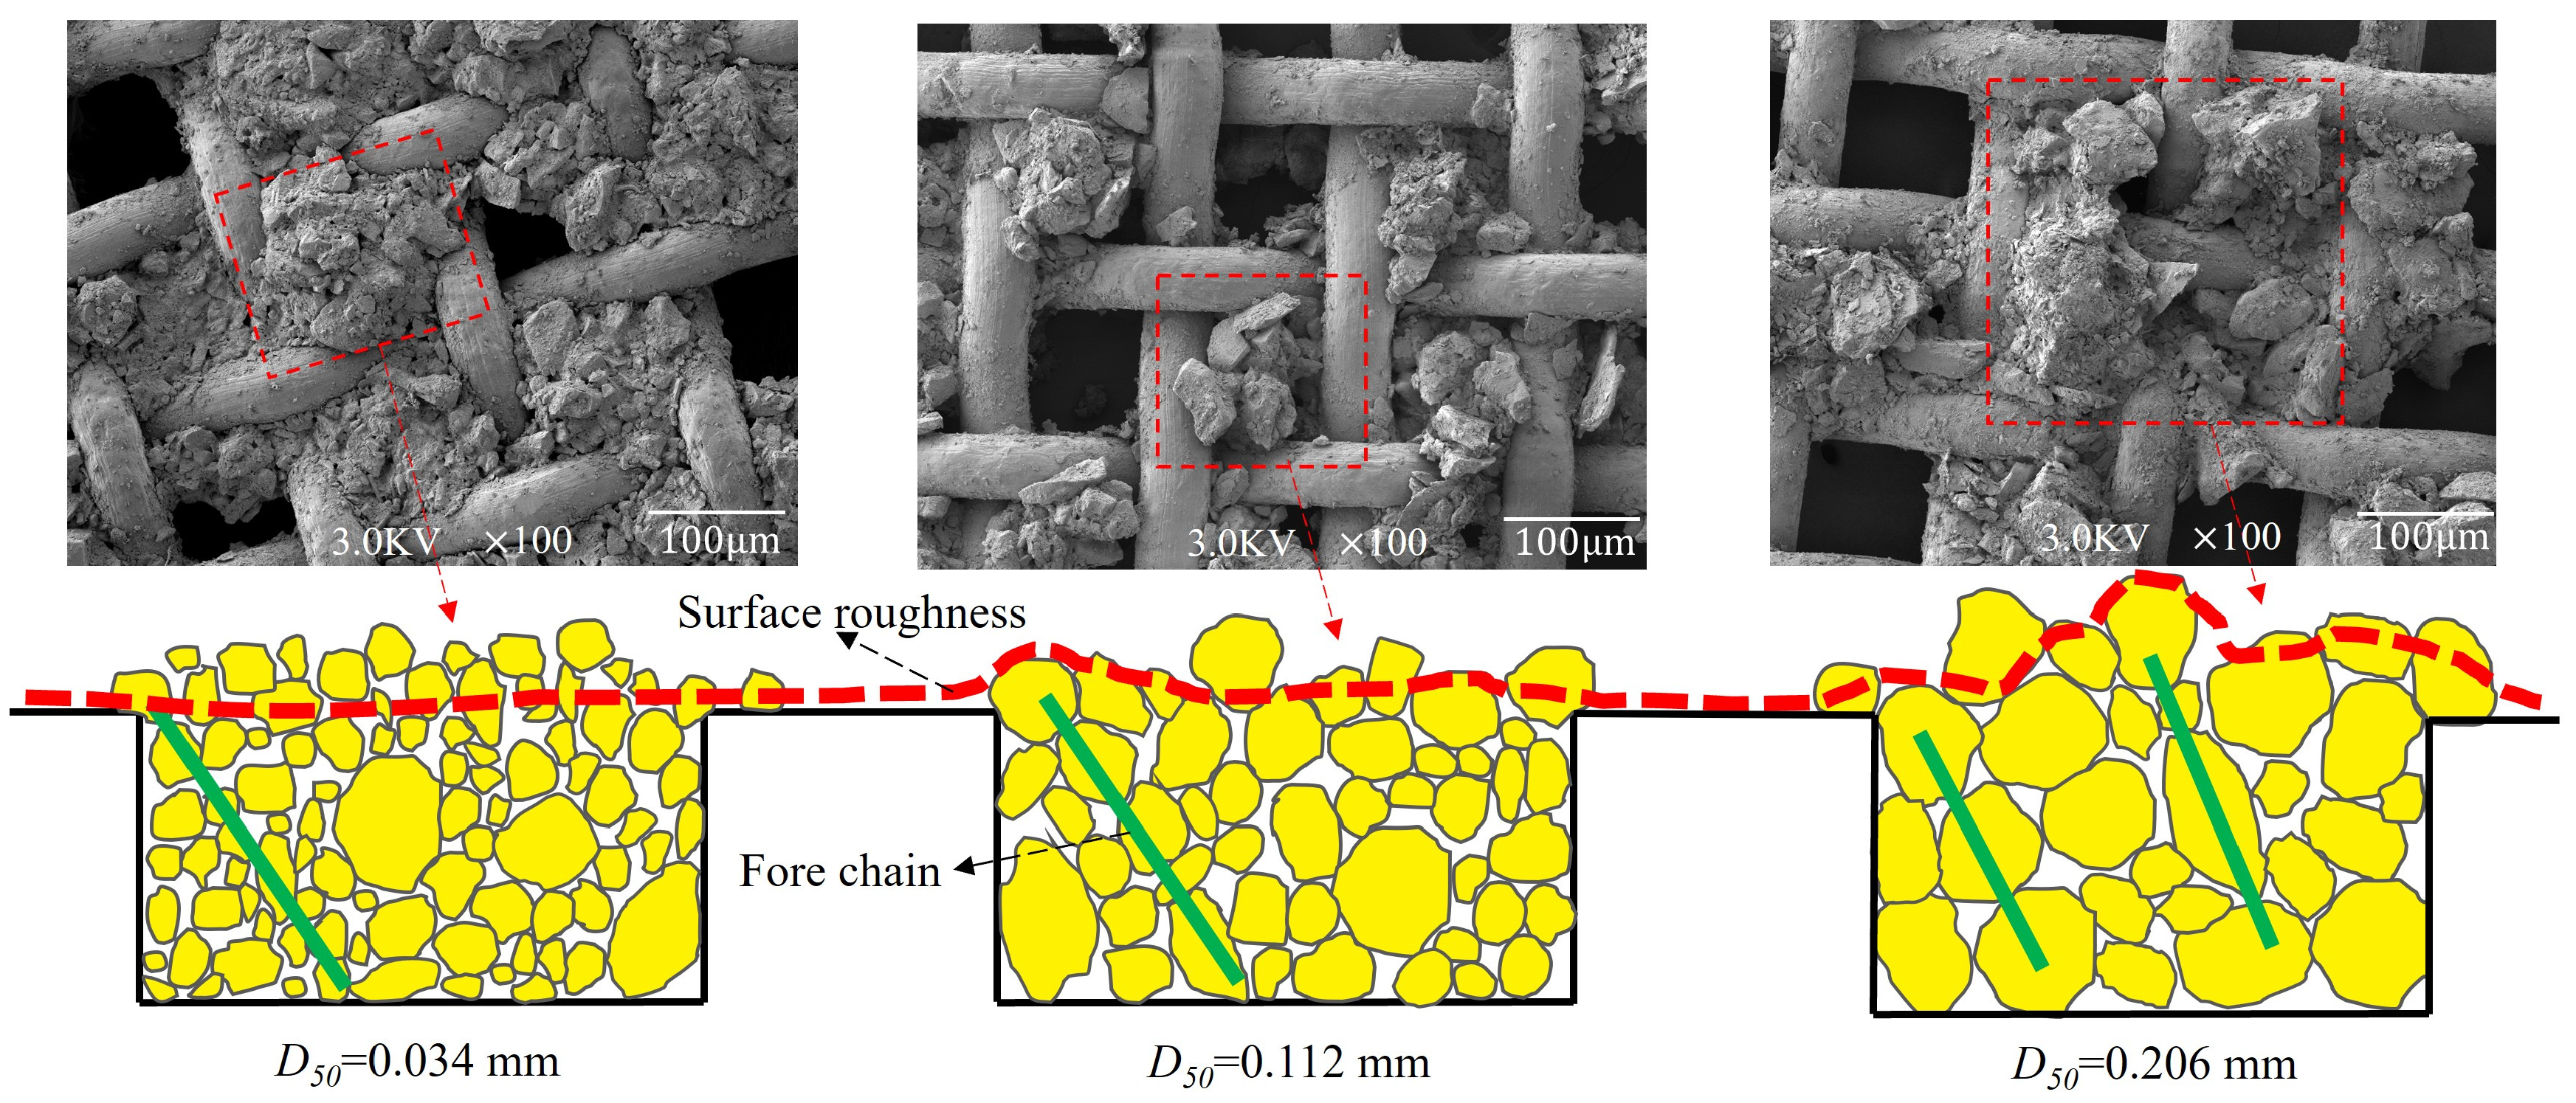
3.2. The Interlocking Mechanism
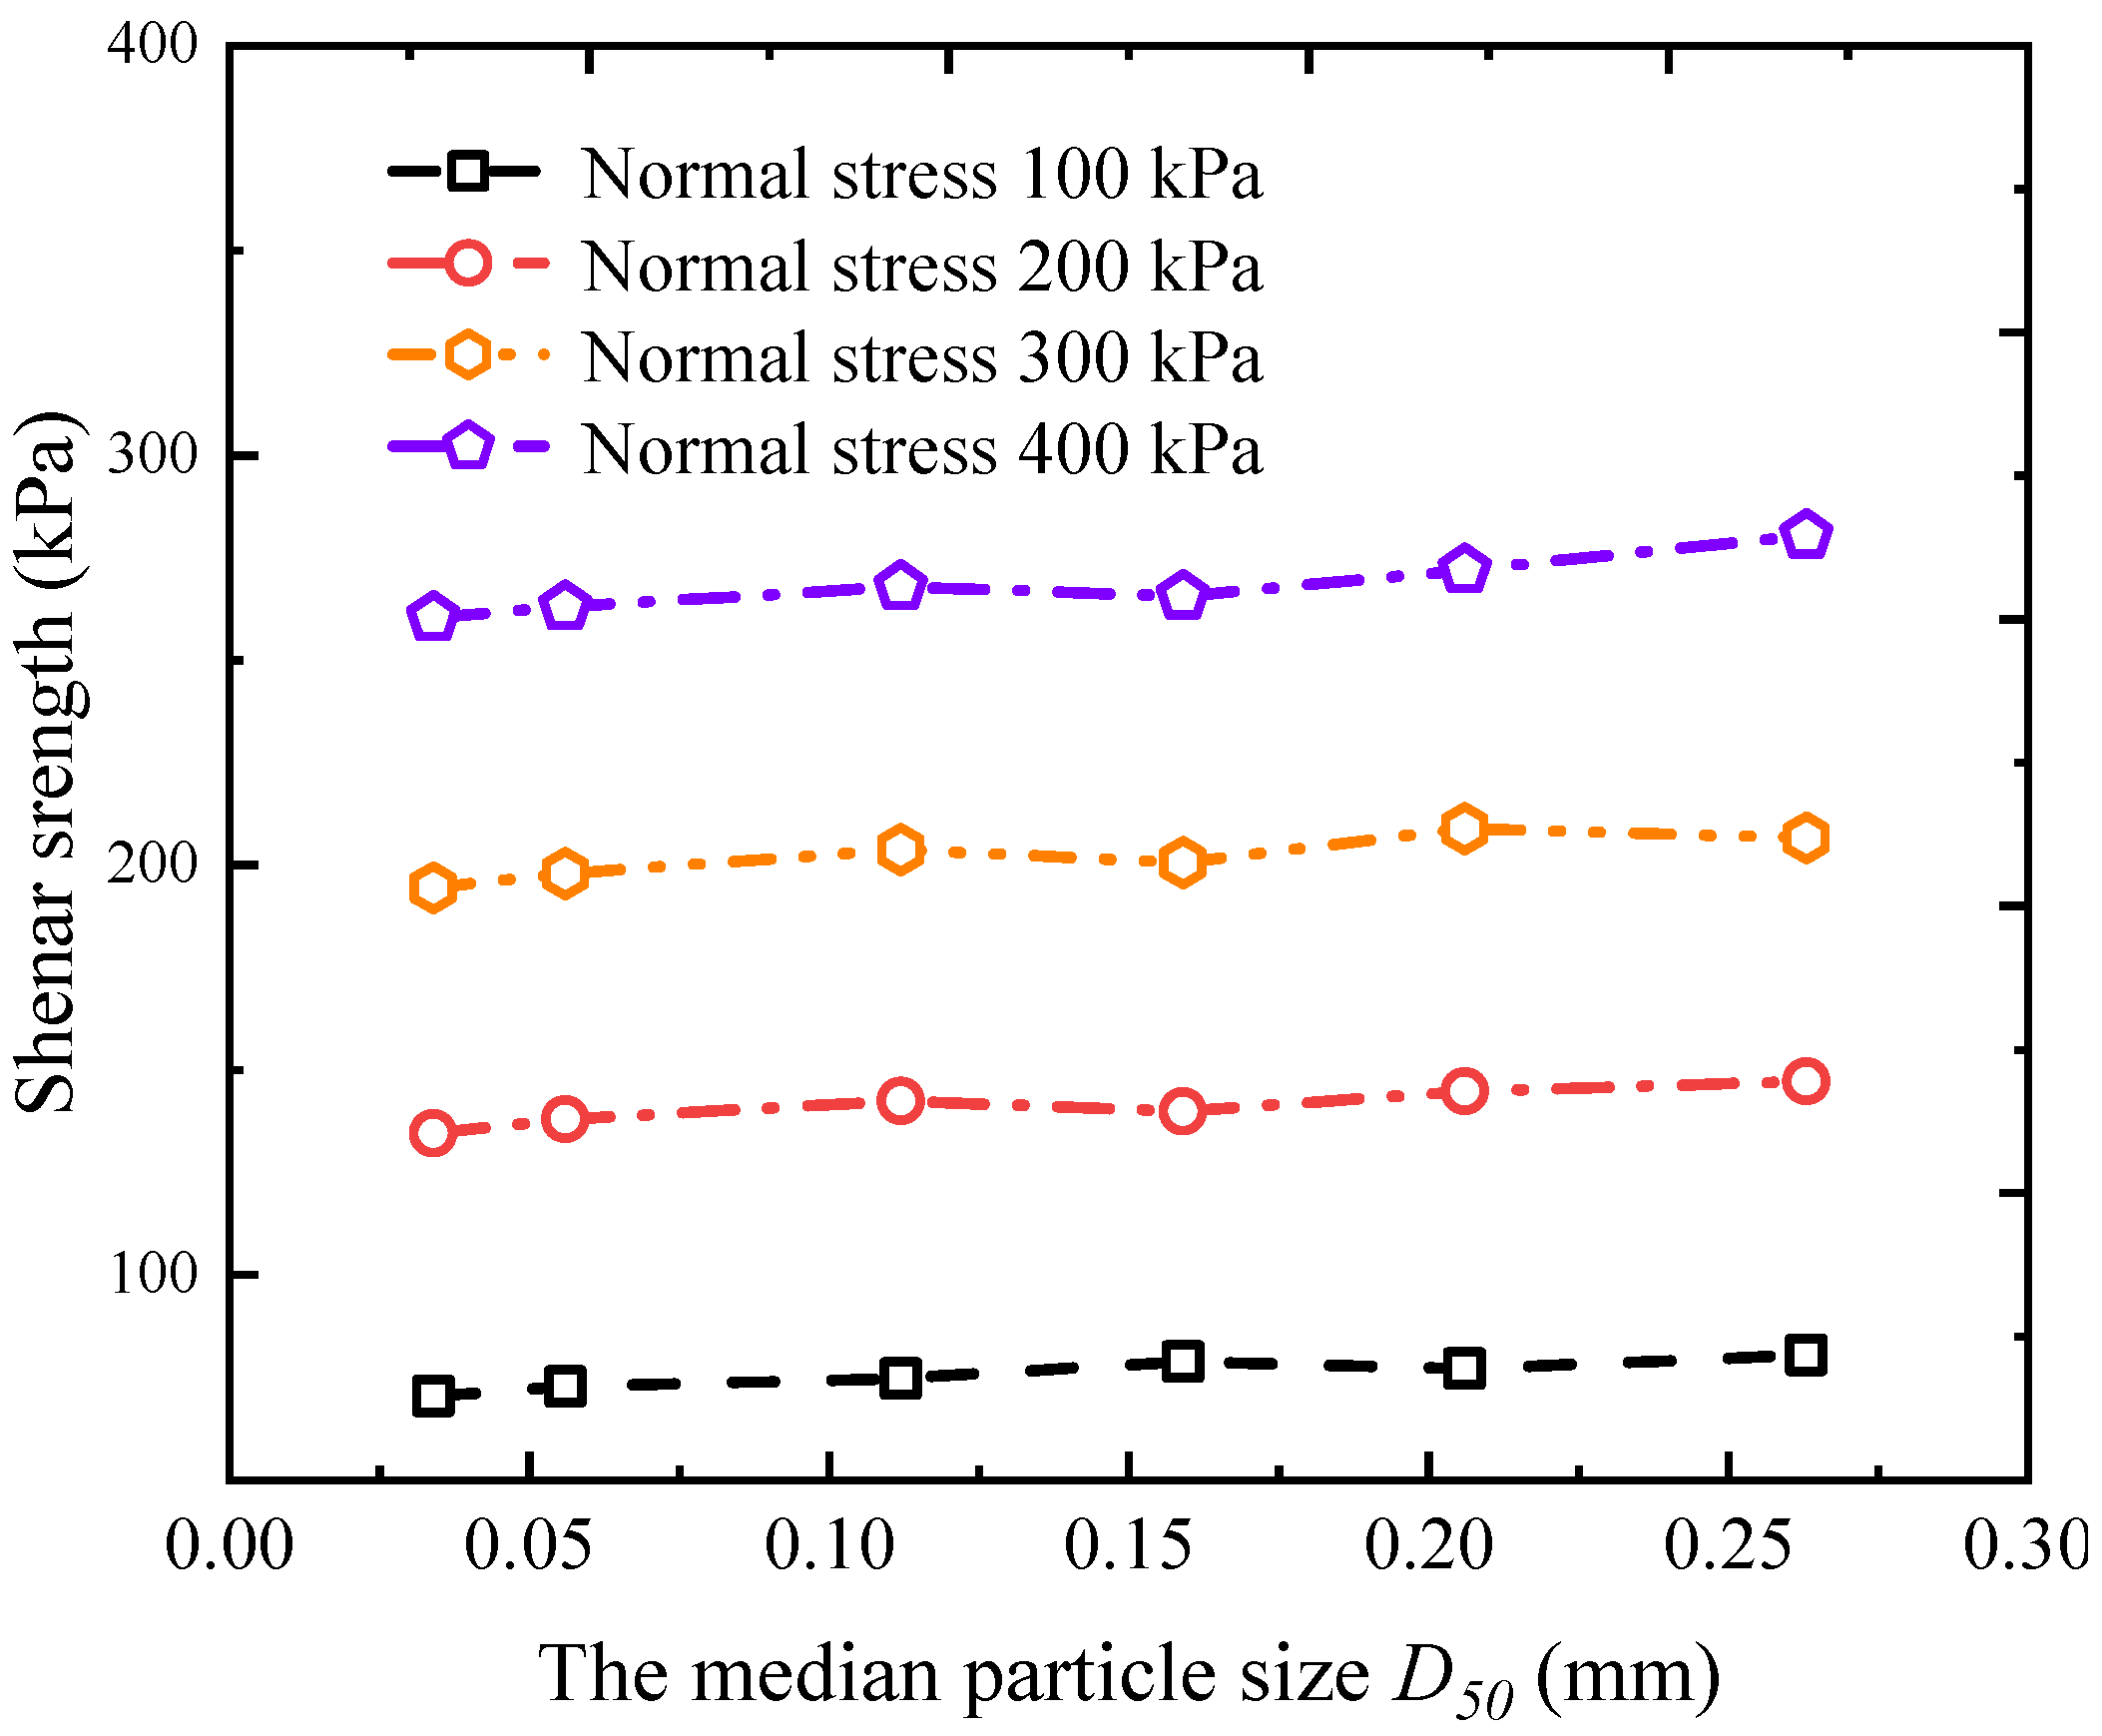
3.3. Shear Strength and Strength Parameters
4. Interface Constitutive Model
4.1. Exponential Model
4.2. Fitting Result
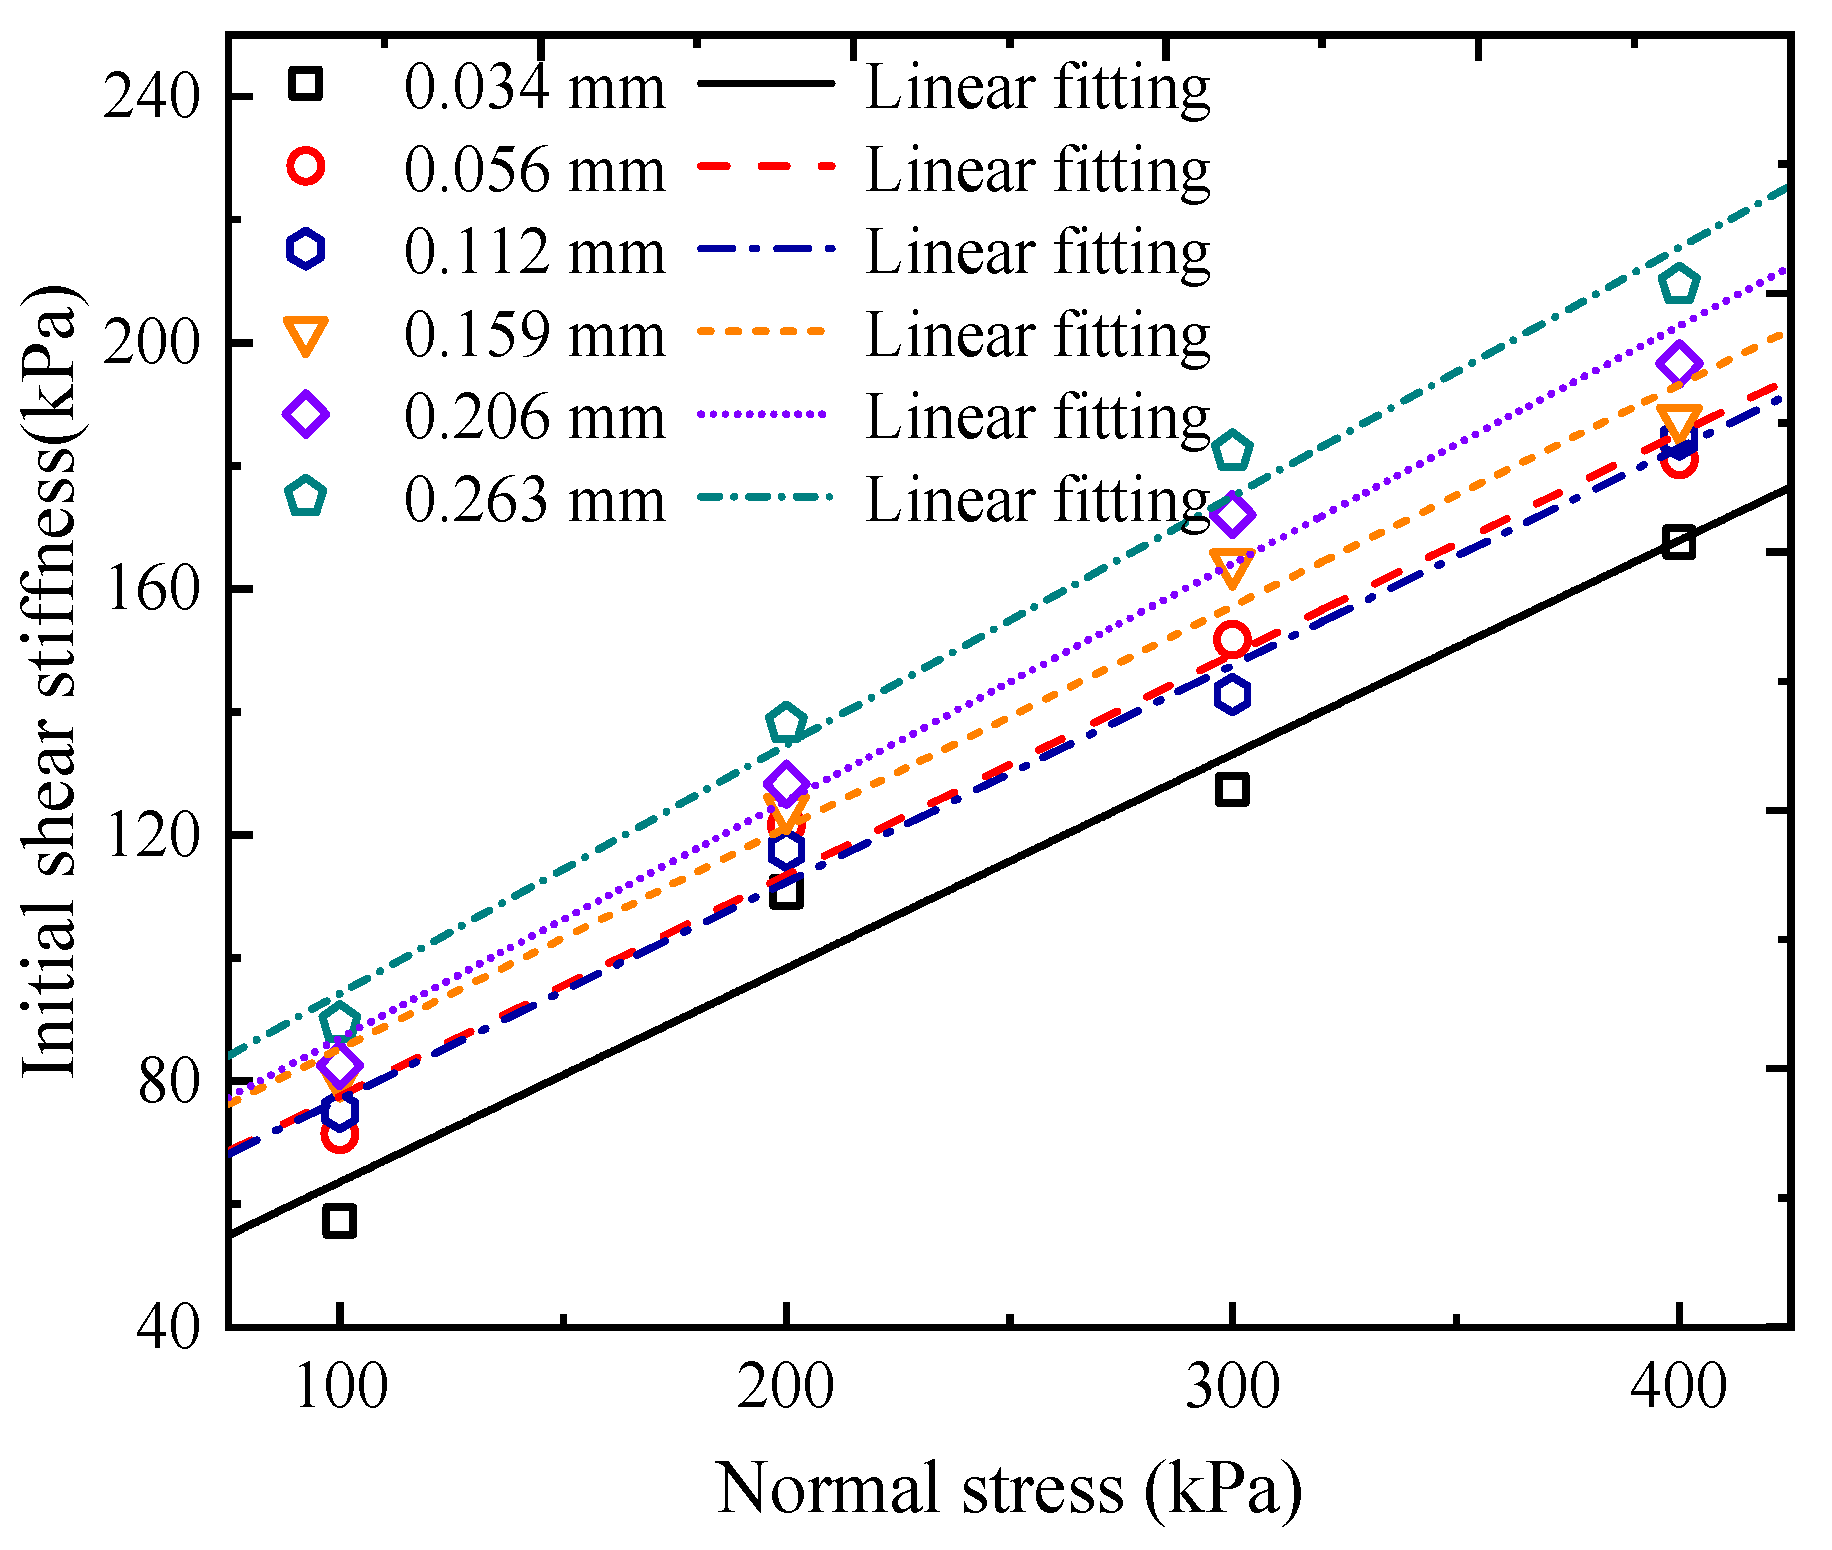
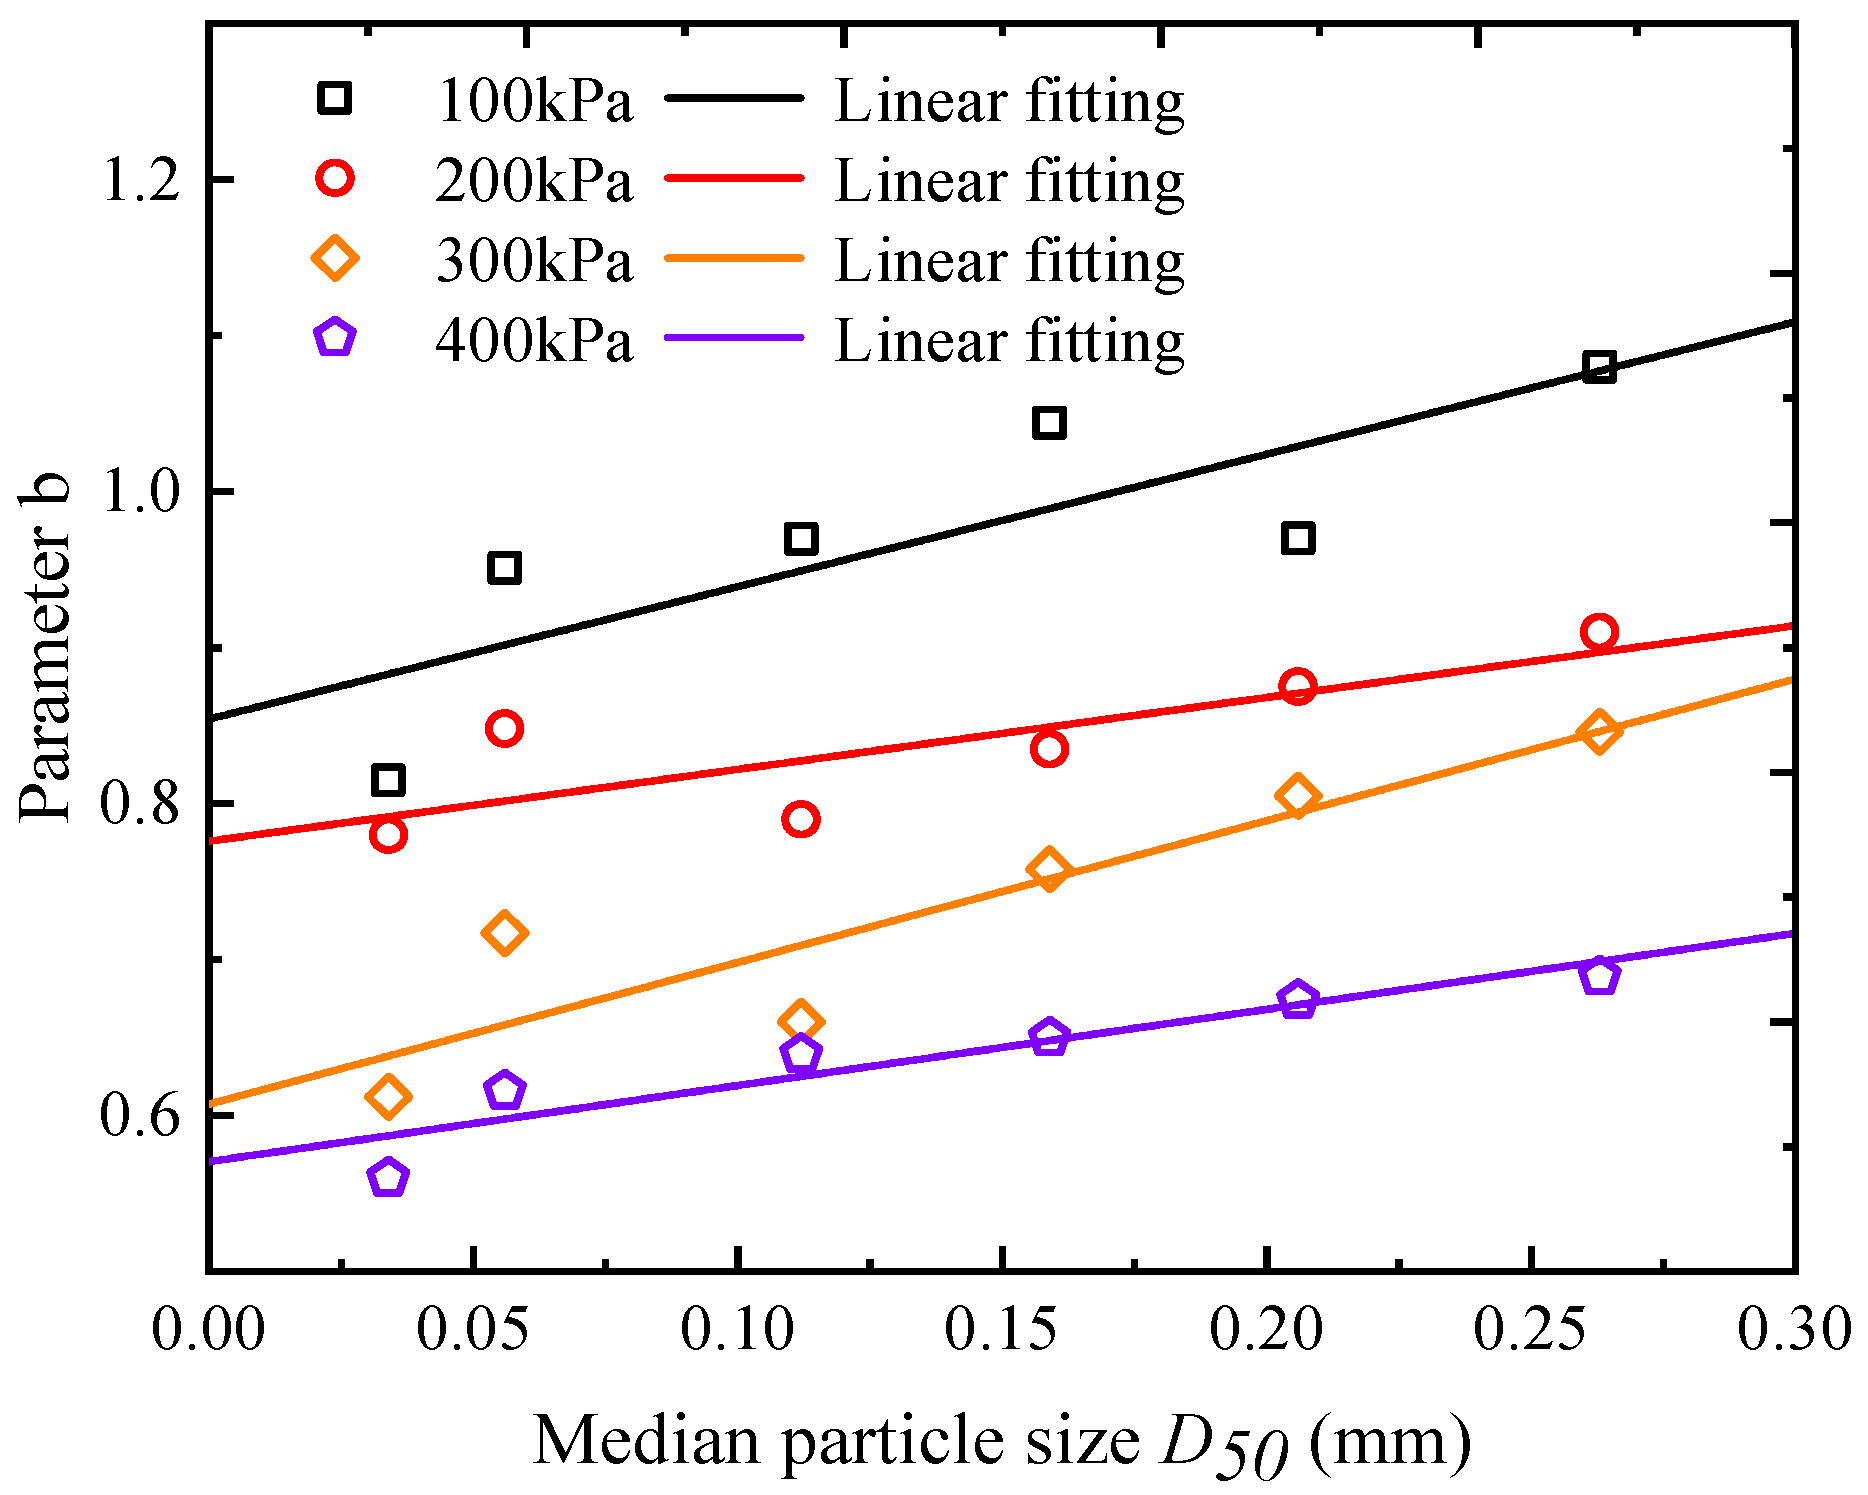
4.3. Parameter Analysis
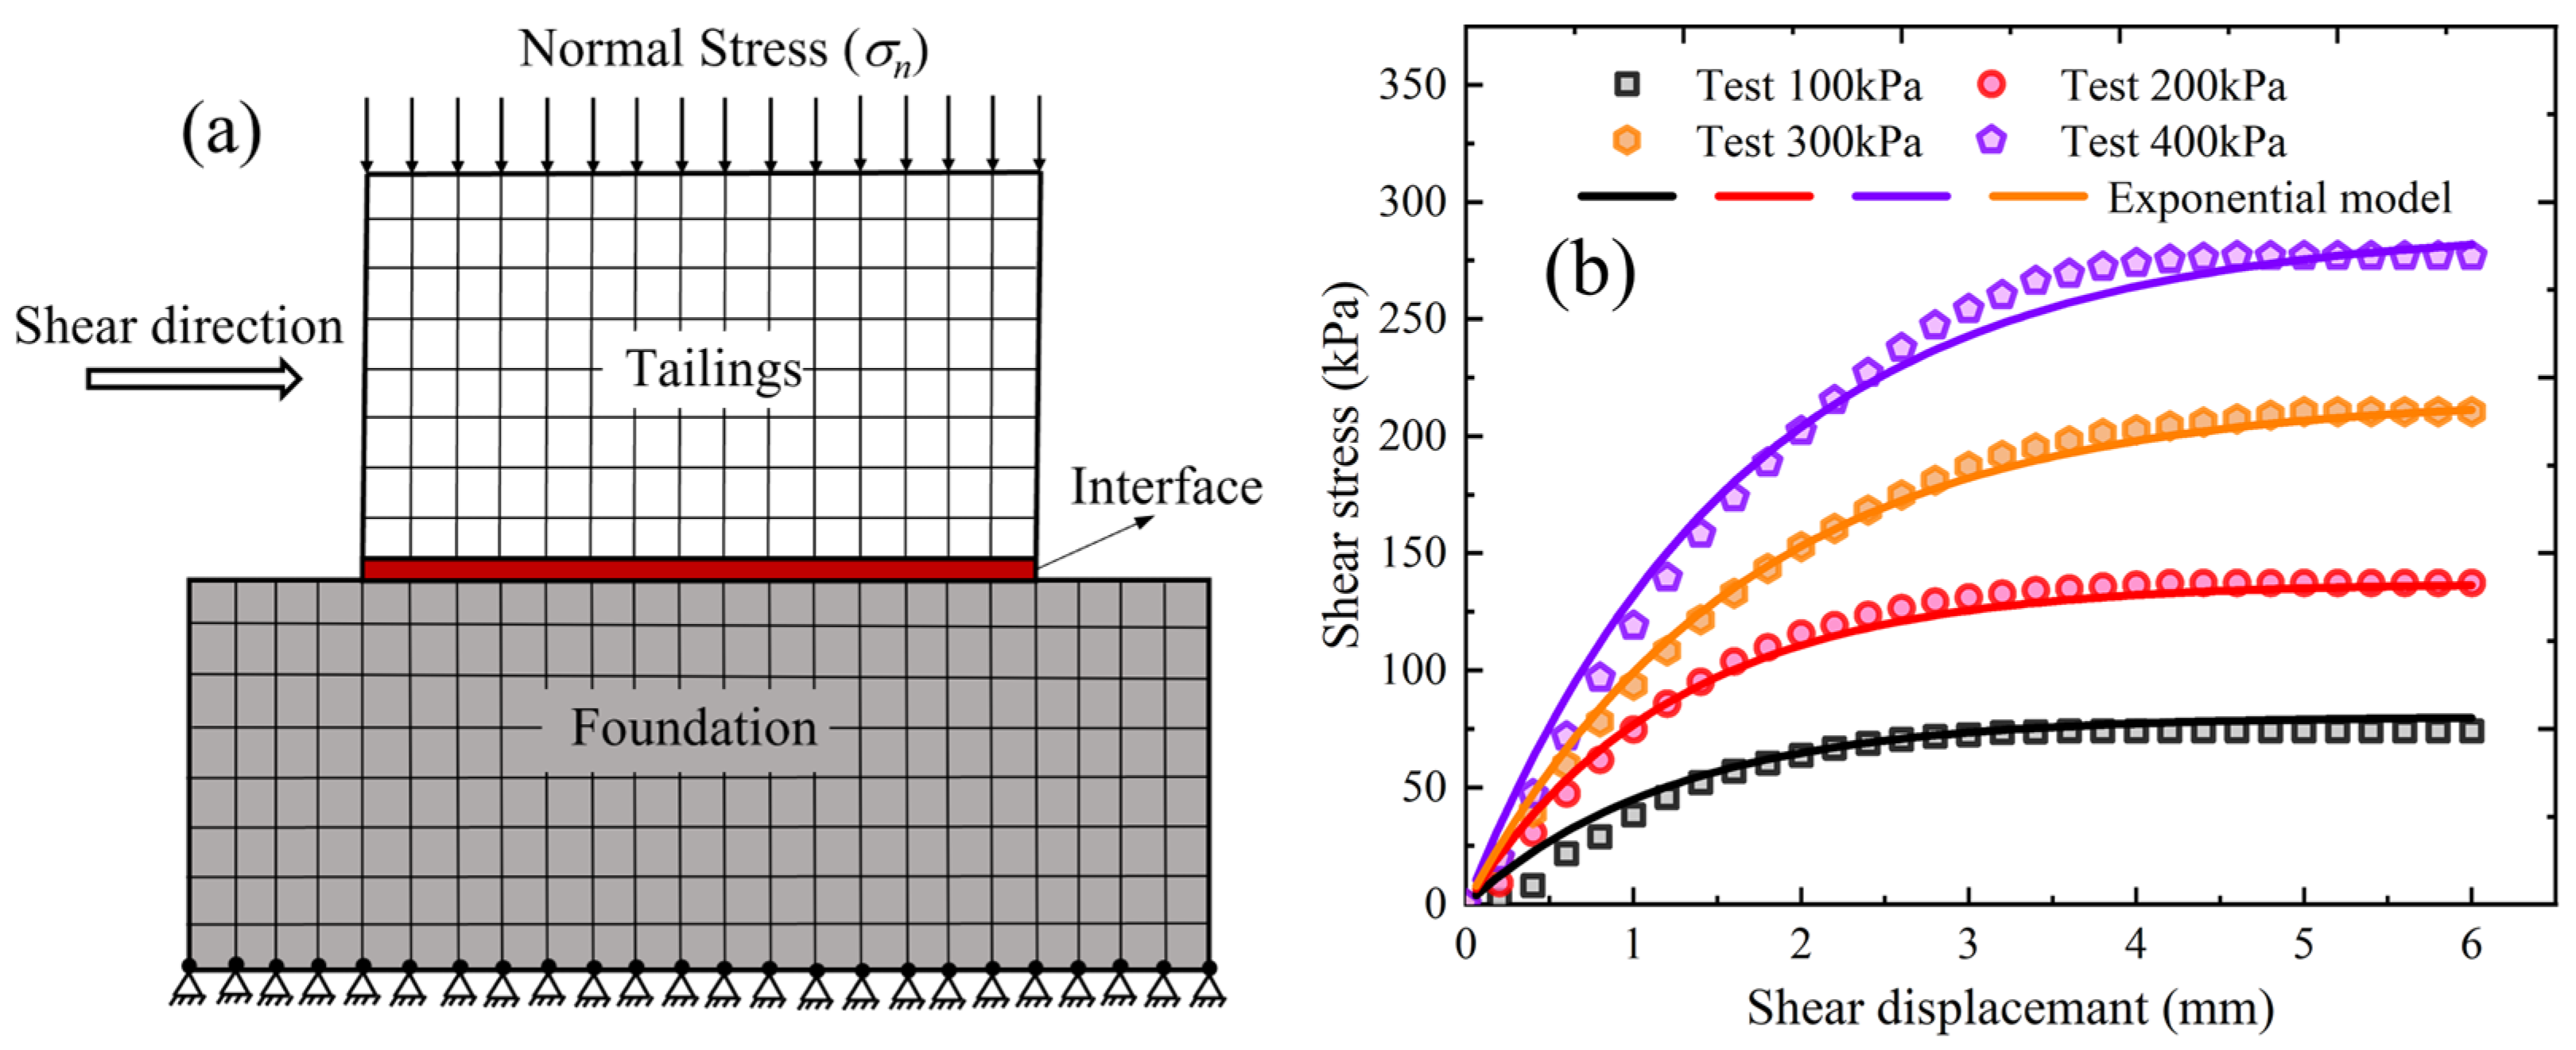
4.4. Goodman Contact Element Model
5. Effect of Self-Filtering Layer on Bearing Behavior of Drain Pipes
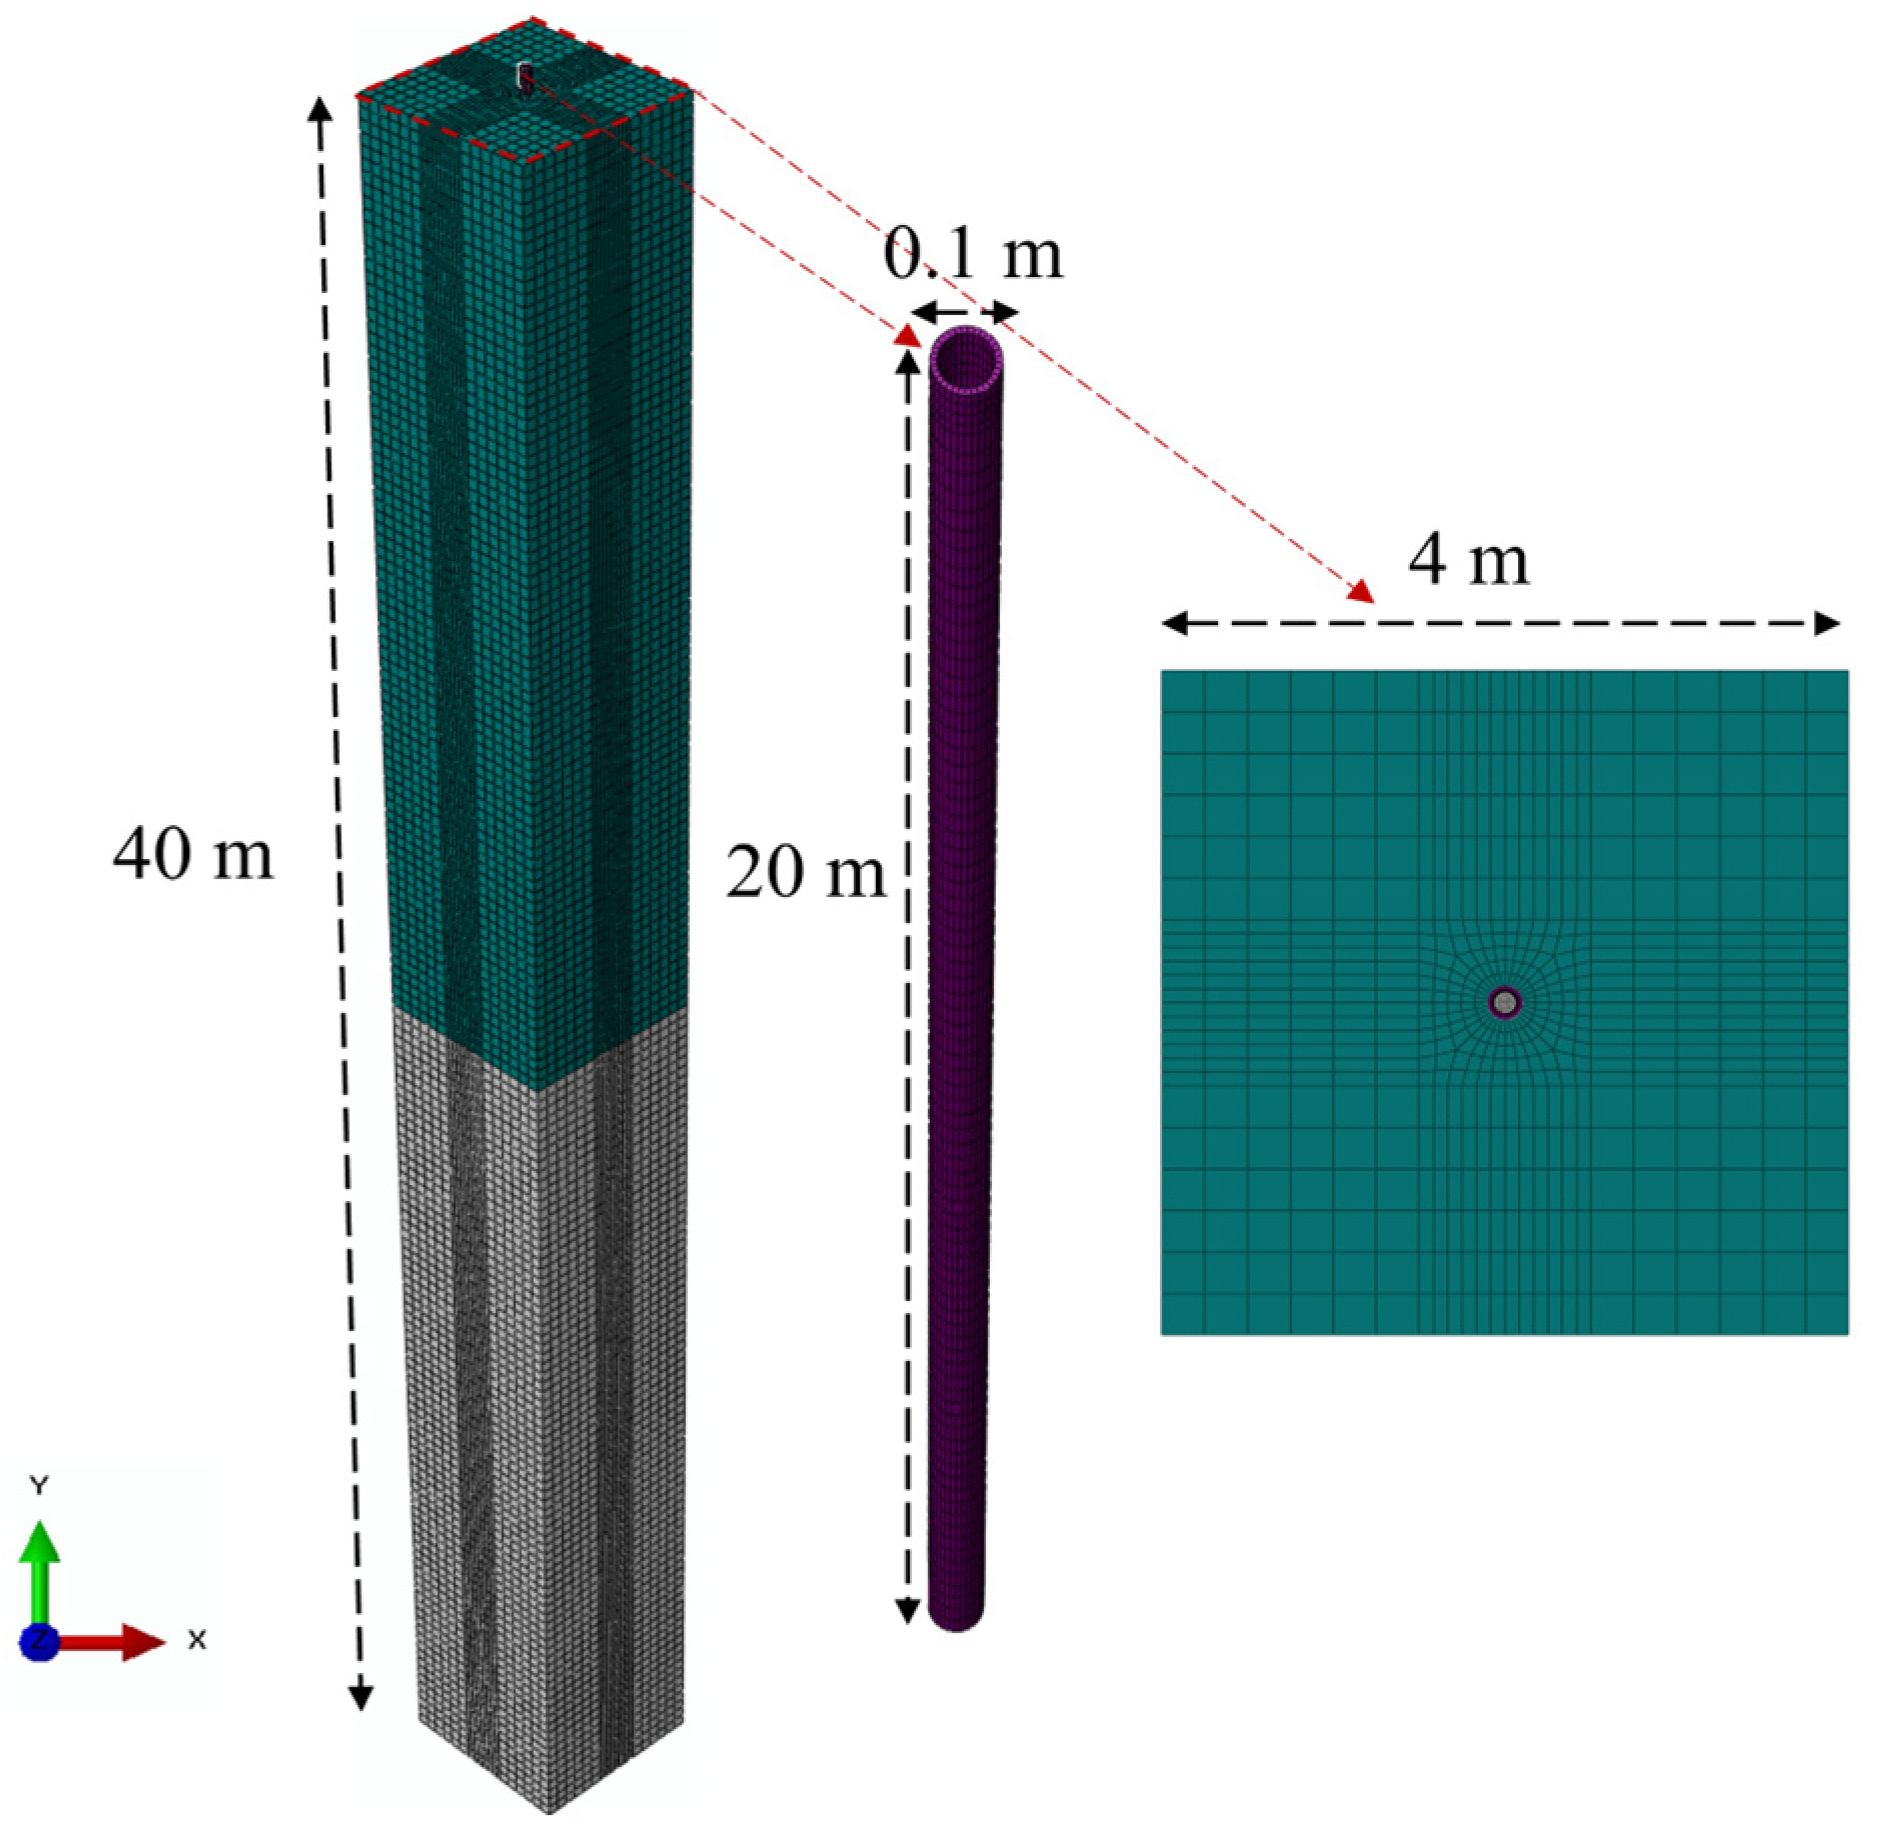
5.1. Finite-Element Model
5.2. Duncan–Chang Model for Tailing Medium
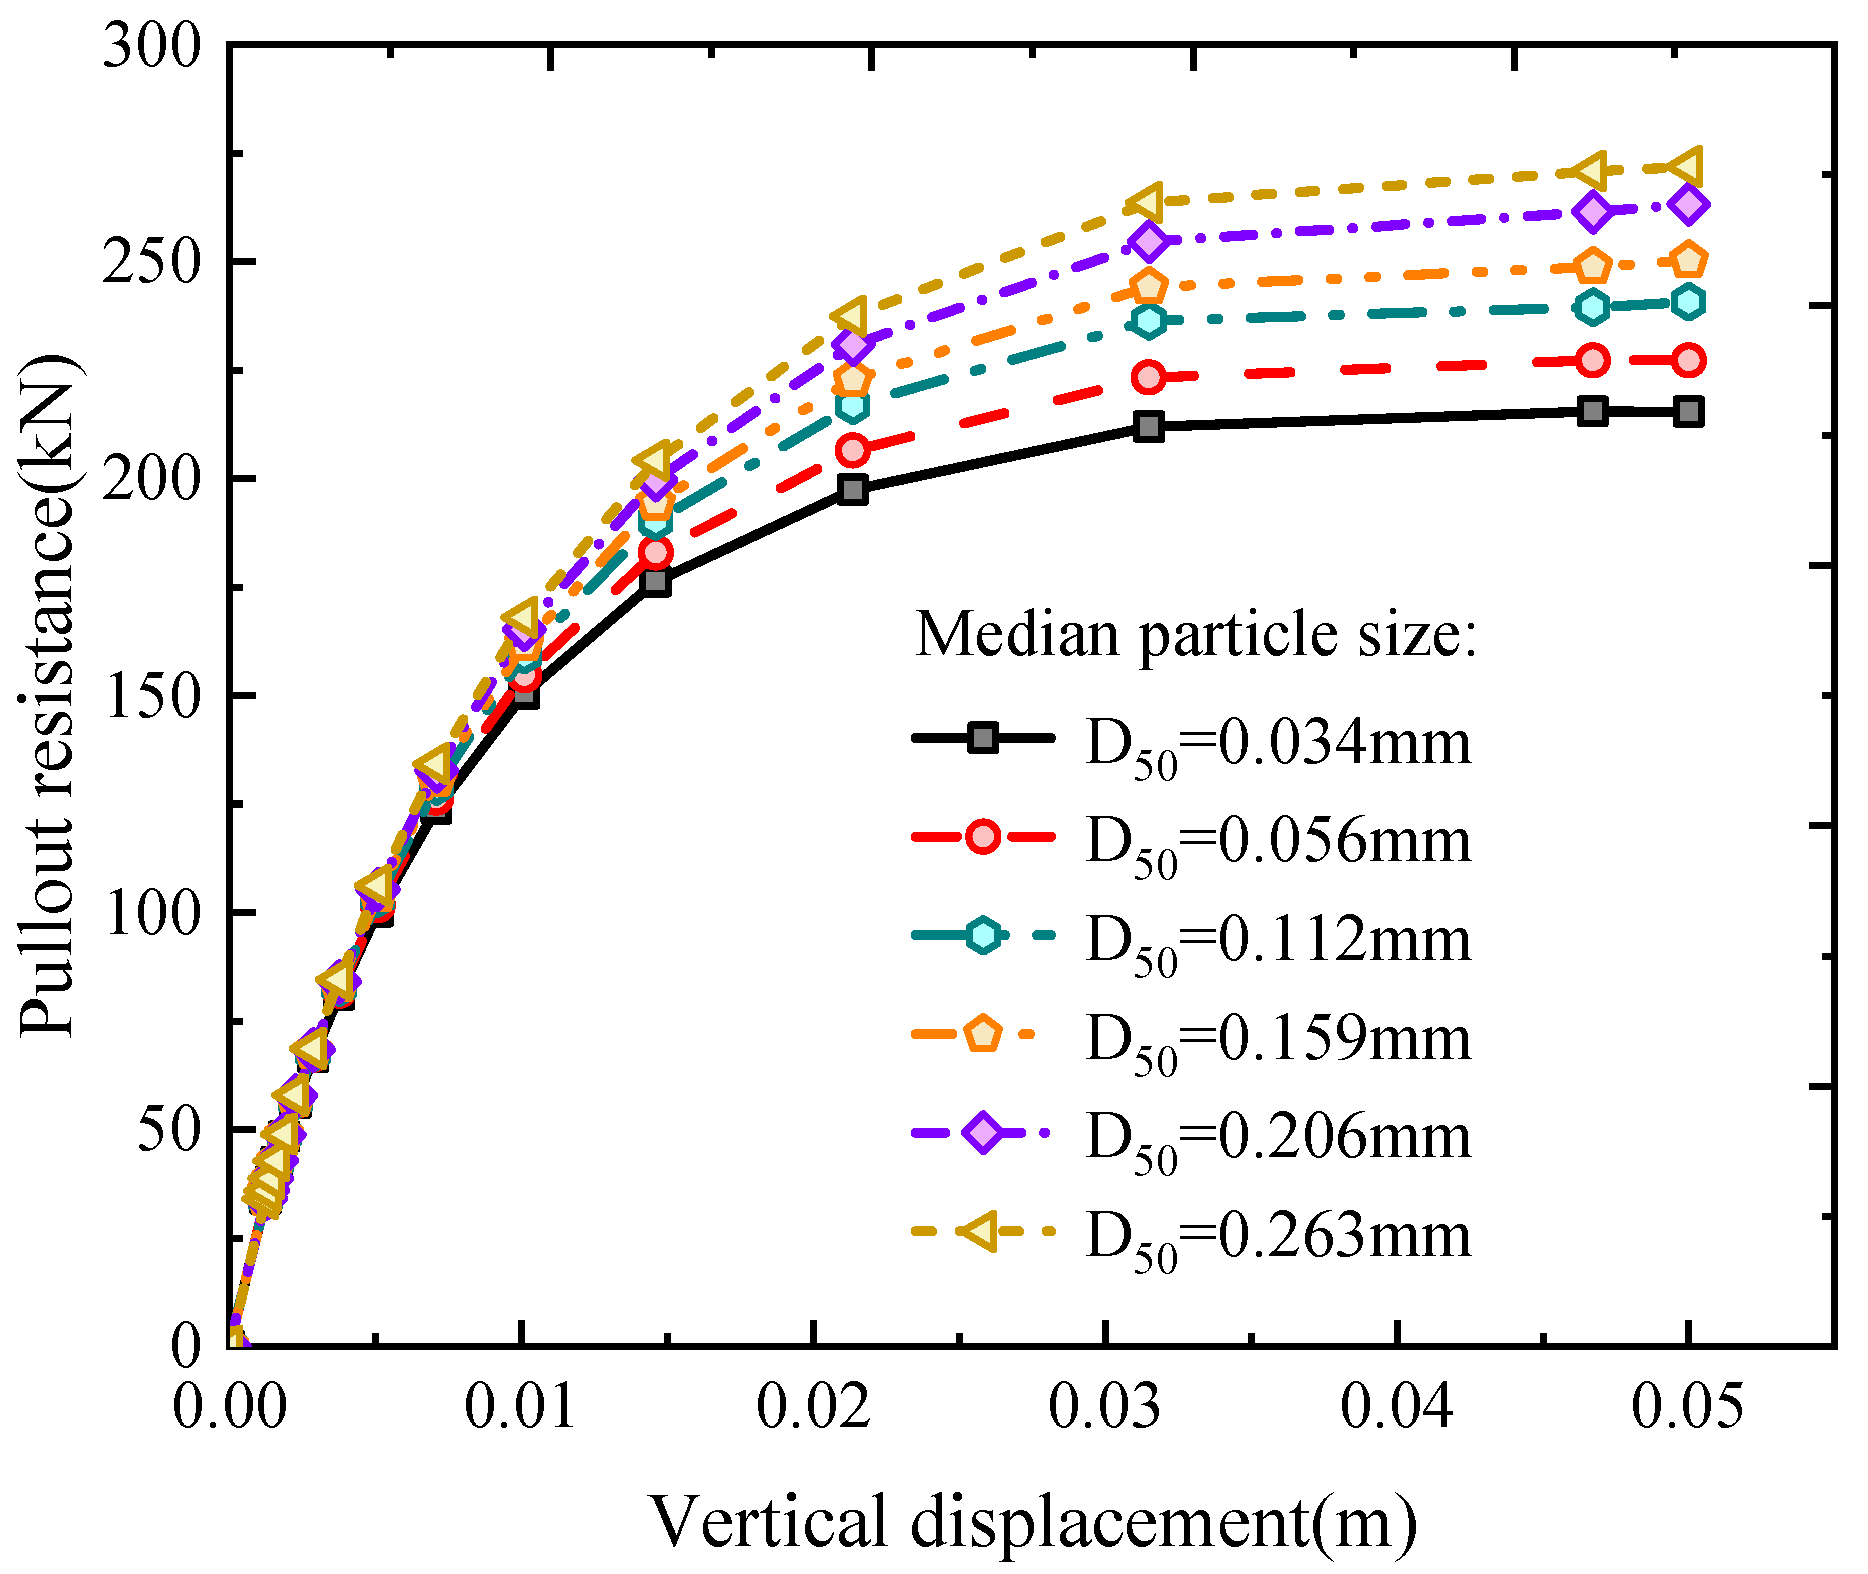
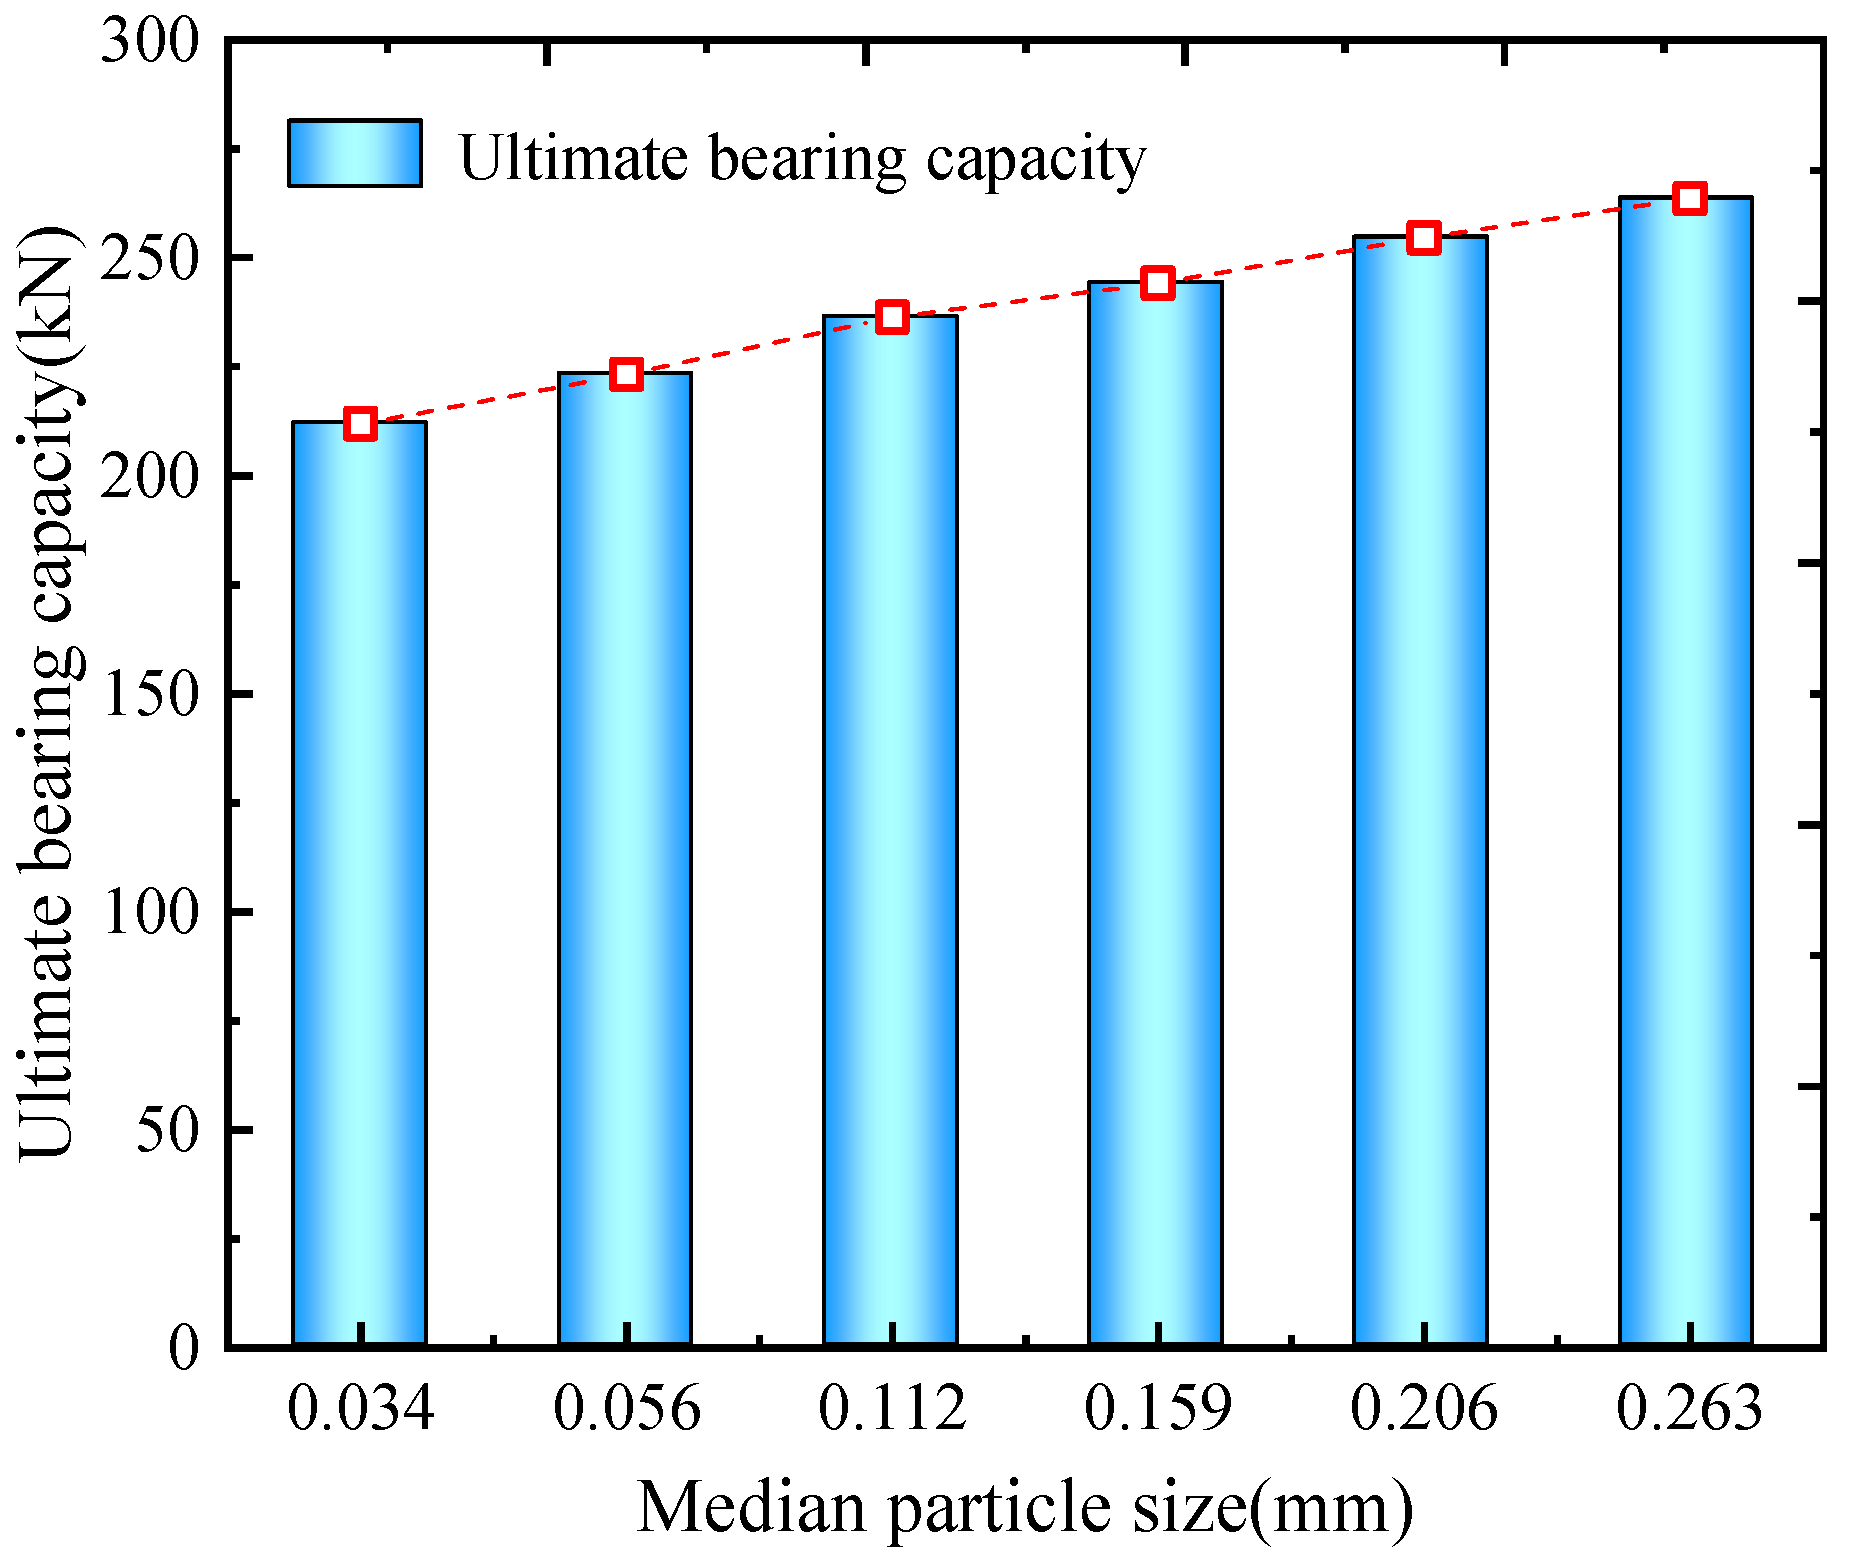
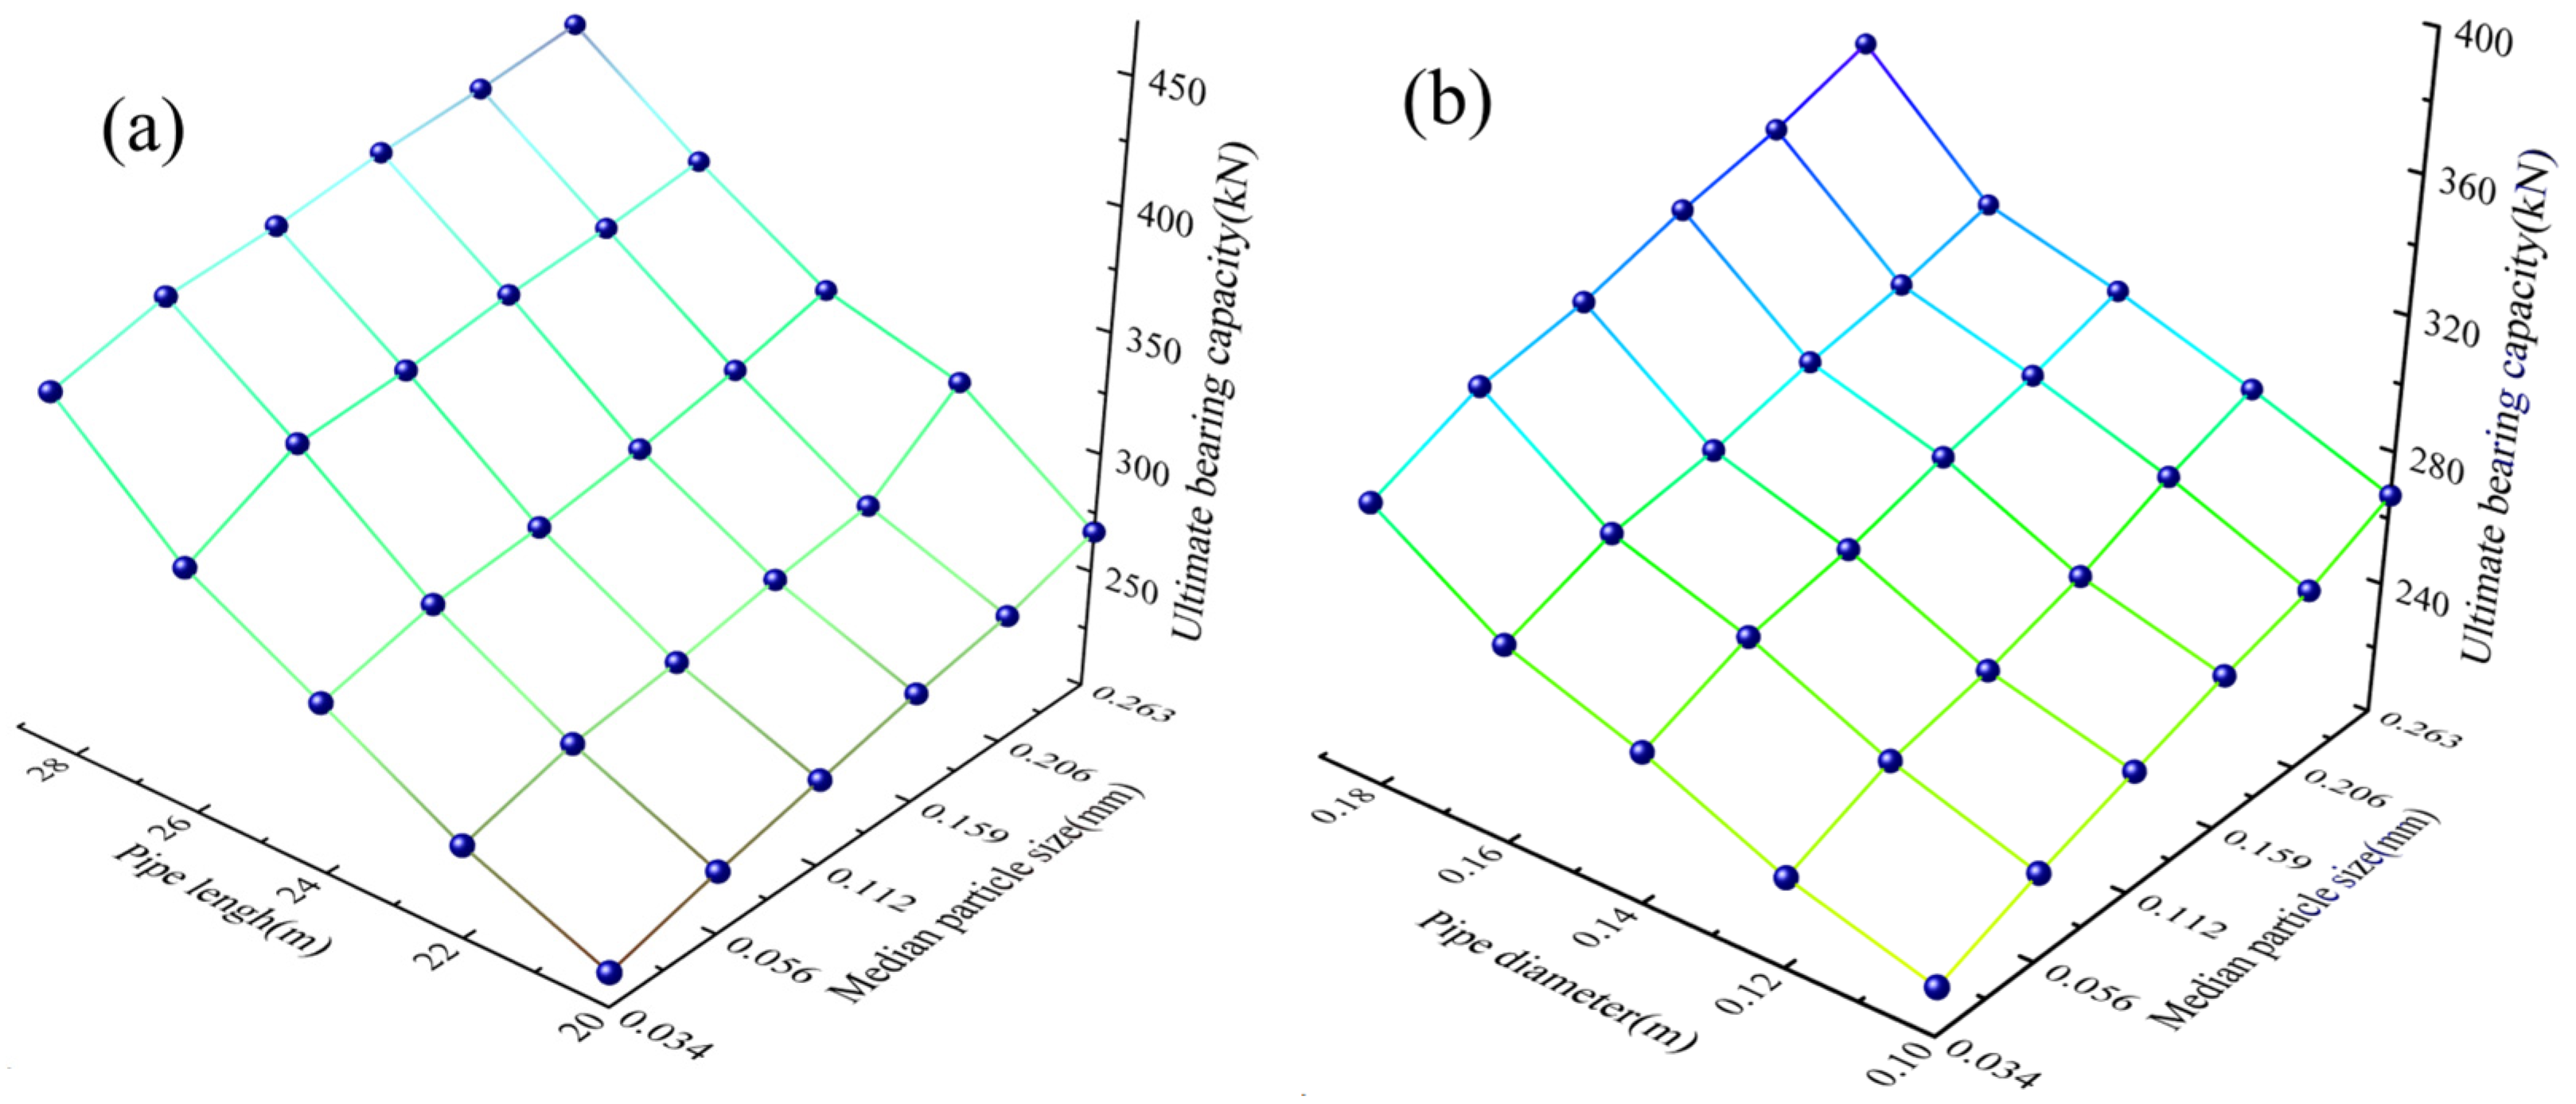
5.3. Numerical Results
6. Conclusions
- (1)
- The interface shear stress–displacement curves of tailing–steel wire mesh show a remarkable hardening characteristic, which is affected slightly by the self-filtering layer. In addition, the shear strength increases with the median particle size of the self-filtering layer, and the increasing tendency of shear strength with the median particle size is less affected by normal stress.
- (2)
- The interface shear strength of the tailing–steel wire mesh can be regarded as following Mohr–Coulomb strength theory. The interfacial cohesion decreases with increasing median particle size of the self-filtering layer, while the interfacial friction coefficient demonstrates an increasing trend. Specifically, when the median particle size reaches 0.263 mm, the friction coefficient increases by 17.2%.
- (3)
- A nonlinear exponential constitutive model for the interface is developed, capable of predicting the shear stress–strain relationship at the tailing–steel wire mesh interface. The initial shear stiffness ks0 and parameter b exhibit a linear increase with the median particle size.
- (4)
- The load–displacement curve of the drain pipe successively experiences a linear increasing stage, hardening stage, and stable stage. The presence of a self-filtering layer positively influences the bearing capacity of the drain pipe. Furthermore, the self-filtering layer significantly impacts the distribution of negative skin friction, with the axial force of the drain pipe decreasing with increasing median particle size of the self-filtering layer.
Author Contributions
Funding
Data Availability Statement
Conflicts of Interest
References
- Liu, C.; Shen, Z.Z.; Gan, L.; Xu, L.Q.; Zhang, K.L.; Jin, T. The seepage and stability performance assessment of a new drainage system to increase the height of a tailings dam. Appl. Sci. 2018, 8, 1840. [Google Scholar] [CrossRef]
- Yang, C.B.; Wang, Y.; Wang, L.B.; Huang, J.Q.; Li, Q.W.; Wu, L. The slotted tube overlay geotextile in tailing pond radial seepage test model and analysis of the permeation characteristics. Geofluids 2021, 2021, 4589533. [Google Scholar] [CrossRef]
- Cui, X.; Li, D.D.; Huang, J.Q.; Han, Y.B. Laboratory evaluation of the filtration behavior of three filters wrapped around drain pipes in fine tailings based on a radial flow test. Text. Res. J. 2023, 93, 3969–3981. [Google Scholar] [CrossRef]
- Mirzaeifar, H.; Hatami, K.; Abdi, M.R. Pullout testing and Particle Image Velocimetry (PIV) analysis of geogrid reinforcement embedded in granular drainage layers. Geotext. Geomembr. 2022, 50, 1083–1109. [Google Scholar] [CrossRef]
- Newman, P.; Hodgson, M.; Rosselot, E. The disposal of tailings and minewater sludge using geotextile dewatering techniques. Miner. Eng. 2004, 17, 115–121. [Google Scholar] [CrossRef]
- Liu, S.; Wang, Y.; Feng, D. Numerical research on two-dimensional bridge formation at the cohesionless sand-geotextile interface with the DEM method. Geomech. Eng. 2021, 27, 263–271. [Google Scholar]
- Dong, C.Y.; Gao, K.G.; Dong, S.X.; Shang, X.S.; Wu, Y.X.; Zhong, Y.X. A new integrated method for comprehensive performance of mechanical sand control screens testing and evaluation. J. Petrol. Sci. Eng. 2017, 158, 775–783. [Google Scholar] [CrossRef]
- Grubb, D.G.; Diesing, W.E.; Cheng, S.C.L.; Sabanas, R.M. Comparison of the durability of geotextiles in an alkaline mine tailings environment. Geosynth. Int. 2001, 8, 49–80. [Google Scholar] [CrossRef]
- Liu, S.; Wang, Y.; Feng, D. Compatibility of tailings-nonwoven geotextile under stress and the effect of sand filter. Geosynth. Int. 2020, 28, 206–213. [Google Scholar] [CrossRef]
- Khan, M.W.; Dawson, A.R.; Marshall, A.M. Filtration performance of non-woven geotextiles with internally-stable and -unstable soils under dynamic loading. Geotext. Geomembr. 2022, 50, 293–311. [Google Scholar] [CrossRef]
- DeJong, J.T.; Wetgate, Z.J. Role of overconsolidation on sand-geomembrane interface response and material damage evolution. Geotext. Geomembr. 2005, 23, 486–512. [Google Scholar] [CrossRef]
- Sayeed, M.M.A.; Ramaiah, B.J.; Rawal, A. Interface shear characteristics of jute/polypropylene hybrid nonwoven geotextiles and sand using large size direct shear test. Geotext. Geomembr. 2014, 42, 63–68. [Google Scholar] [CrossRef]
- Punetha, P.; Mohanty, P.; Samanta, M. Microstructural investigation on mechanical behavior of soil-geosynthetic interface in direct shear test. Geotext. Geomembr. 2017, 45, 197–210. [Google Scholar] [CrossRef]
- Manohar, D.R.; Anbazhagan, P. Shear strength characteristics of geosynthetic reinforced rubber-sand mixtures. Geotext. Geomembr. 2021, 49, 910–920. [Google Scholar] [CrossRef]
- Hassan, W.; Farooq, K.; Hassan, M.; Alshameri, B.; Shahzad, A.; Nawaz, M.N.; Azab, M. Experimental investigation of mechanical behavior of geosynthetics in different soil plasticity indexes. Transp. Geotech. 2023, 39, 100935. [Google Scholar] [CrossRef]
- Abdi, M.R.; Sadrnejad, A.; Arjomand, M.A. Strength enhancement of clay by encapsulating geogrids in thin layers of sand. Geotext. Geomembr. 2009, 27, 447–455. [Google Scholar] [CrossRef]
- Prabhakara, B.K.K.; Guda, P.V.; Balunaini, U. Interface shear stress properties of geogrids with mixtures of fly ash and granulated rubber. J. Mater. Civil. Eng. 2020, 32, 06020020. [Google Scholar] [CrossRef]
- Praveen, G.V.; Kurre, P. Large direct shear testing to evaluate the interaction behaviour of murrum soil and geosynthetics for the reinforced soil construction. Mater. Today. Proc. 2021, 39, 500–503. [Google Scholar] [CrossRef]
- Lopes, P.C.; Lopes, M.L.; Lopes, M.P. Shear behaviour of geosynthetics in the inclined plane test-influence of soil particle size and geosynthetic structure. Geosynth. Int. 2001, 8, 327–342. [Google Scholar] [CrossRef]
- Zhang, L.; Peng, B.C.; Xu, Z.Y.; Zhou, S. Shear performance of geosynthetic-encased stone column based on 3D-DEM simulation. Comput. Geotech. 2022, 151, 104952. [Google Scholar] [CrossRef]
- Ghazizadeh, S.; Bareither, C.A. Stress-controlled direct shear testing of geosynthetic clay liners II: Assessment of shear behavior. Geotext. Geomembr. 2018, 46, 667–677. [Google Scholar] [CrossRef]
- Triplett, E.J.; Fox, P.J. Shear strength of HDPE geomembrane/geosynthetic clay liner interfaces. J. Geotech. Geoenviron. 2001, 127, 543–552. [Google Scholar] [CrossRef]
- Selig, E.T.; Ingold, T.S. Laboratory pull-out testing of grid reinforcements in sand. Geotech. Test J. 1983, 6, 101–111. [Google Scholar]
- Alam, M.J.I.; Lo, S.R.; Karim, M.R. Pull-out behaviour of steel grid soil reinforcement embedded in silty sand. Comput. Geotech. 2014, 56, 216–226. [Google Scholar] [CrossRef]
- Palmeira, E.M. Soil-geosynthetic interaction: Modelling and analysis. Geotext. Geomembr. 2009, 27, 368–390. [Google Scholar] [CrossRef]
- Moraci, N.; Recalcati, P. Factors affecting the pullout behaviour of extruded geogrids embedded in a compacted granular soil. Geotext. Geomembr. 2006, 24, 220–242. [Google Scholar] [CrossRef]
- Gurung, N.A. Theoretical model for anchored geosynthetics in pull-out tests. Geosynth. Int. 2015, 7, 269–284. [Google Scholar] [CrossRef]
- Wang, Y.B.; Gao, D.L.; Fang, J. Finite element analysis of deepwater conductor bearing capacity to analyze the subsea wellhead stability with consideration of contact interface models between pile and soil. J. Petrol. Sci. Eng. 2015, 126, 48–54. [Google Scholar] [CrossRef]
- D’Aguiar, S.C.; Razavi, A.M.F.; Santos, J.A.; Caballero, F.L. Elastoplastic constitutive modelling of soil-structure interfaces under monotonic and cyclic loading. Comput. Geotech. 2011, 38, 430–447. [Google Scholar] [CrossRef]
- Abdelouhab, A.; Dias, D.; Freitag, N. Physical and analytical modelling of geosynthetic strip pull-out behaviour. Geotext. Geomembr. 2010, 28, 44–53. [Google Scholar] [CrossRef]
- Sugimoto, M.; Alagiyawanna, A.M.N. Pullout behavior of geogrid by test and numerical analysis. J. Geotech. Geoenviron. 2003, 129, 361–371. [Google Scholar] [CrossRef]
- Hussein, M.G.; Meguid, M.A. Improved understanding of geogrid response to pullout loading: Insights from three-dimensional finite-element analysis. Can. Geotech. J. 2020, 57, 277–293. [Google Scholar] [CrossRef]
- Ren, F.F.; Huang, Q.Q.; Liu, Q.; Wang, G. Numerical study on the pull-out behaviour of planar reinforcements with consideration of residual interfacial shear strength. Transp. Geotech. 2022, 35, 100766. [Google Scholar] [CrossRef]
- Saberi, M.; Annan, C.D.; Konrad, J.M. Implementation of a soil-structure interface constitutive model for application in geo-structures. Soil Dyn. Earthq. Eng. 2019, 116, 714–731. [Google Scholar] [CrossRef]
- ASTM. Standard Test Methods for Liquid Limit, Plastic Limit, and Plasticity Index of Soils; ASTM International: West Conshohocken, PA, USA, 2017. [Google Scholar]
- GB/T 50123-2019; Standard for Geotechnical Testing Method. China WaterPower Press: Beijing, China, 2019.
- Lin, C.; Wang, G.F.; Guan, C.; Feng, D.C.; Zhang, F. Experimental study on the shear characteristics of different pile-soil interfaces and the influencing factors. Cold Reg. Sci. Technol. 2023, 206, 103739. [Google Scholar] [CrossRef]
- Vangla, P.; Latha, G.M. Influence of particle size on the friction and interfacial shear strength of sands of similar morphology. Int. J. Geosynth. Groun. 2015, 1, 6. [Google Scholar] [CrossRef]
- Xu, L.J.; Wang, R.; Liu, Q.B.; Chen, J.F.; Wang, X.Z.; Meng, Q.S. Effect of particle size distribution on monotonic direct shear characteristics of geotextile/geogrid-calcareous sand interface. Appl. Ocean Res. 2023, 137, 103601. [Google Scholar] [CrossRef]
- Vangla, P.; Gali, M.L. Effect of particle size of sand and surface asperities of reinforcement on their interface shear behaviour. Geotext. Geomembr. 2016, 44, 254–268. [Google Scholar] [CrossRef]
- Namjoo, A.M.; Jafari, K.; Toufigh, V. Effect of particle size of sand and surface properties of reinforcement on sand-geosynthetics and sand-carbon fiber polymer interface shear behavior. Transp. Geotech. 2020, 24, 100403. [Google Scholar] [CrossRef]
- Gennaro, V.D.; Frank, R. Elasto-plastic analysis of the interface behaviour between granular media and structure. Comput. Geotech. 2002, 29, 547–572. [Google Scholar] [CrossRef]
- Duncan, J.M.; Chang, C.Y. Nonlinear analysis of stress and strain in soils. J. Soil Mech. Found. Div. 1970, 96, 1629–1653. [Google Scholar] [CrossRef]
- Xue, X.H.; Yang, X.G.; Liu, E.L. Application of the Modified Goodman Model in Soil Nailing. Int. J. Geomech. 2013, 13, 41–48. [Google Scholar] [CrossRef]
- Guo, Q.Q.; Pei, L.; Zhou, Z.J.; Chen, J.K.; Yao, F.H. Response surface and genetic method of deformation back analysis for high core rockfill dams. Comput. Geotech. 2016, 74, 132–140. [Google Scholar] [CrossRef]
- Daiyan, N.; Kenny, S.; Phillips, R.; Popescu, R. Investigating pipeline-soil interaction under axial–lateral relative movements in sand. Can. Geotech. J. Technol. 2011, 48, 1683–1695. [Google Scholar] [CrossRef]
- Saifi, F.; Javaud, M.; Haleem, A.; Anas, S.M. Computational fluid dynamics approach for predicting pipeline response to various blast scenarios: A numerical modeling study. CMES-Comp. Model. Eng. 2024, 140, 2747–2777. [Google Scholar] [CrossRef]
- Qiu, T.; Wang, W.B.; Höeg, K.; Feng, S.; Zhao, R. 3D analysis of the 174-m high Quxue asphalt-core rockfill dam in a narrow canyon. Soils Found. 2021, 61, 1645–1659. [Google Scholar] [CrossRef]
- Qu, Y.Q.; Zou, D.G.; Kong, X.J.; Xu, B. A novel interface element with asymmetric nodes and its application on concrete-faced rockfill dam. Comput. Geotech. 2016, 85, 103–116. [Google Scholar] [CrossRef]
- Shi, Y.Q.; Li, C.H.; Long, D.Y. Study of the microstructure characteristics of three different fine-grained tailings sand samples during penetration. Materials 2020, 13, 1585. [Google Scholar] [CrossRef]
- Bhardwaj, S.; Singh, S.K. Pile capacity under oblique loads-evaluation from load-displacement curves. Int. J. Geotech. Eng. 2015, 9, 341–347. [Google Scholar] [CrossRef]
- Wang, C.Y.; Ding, X.M.; Cao, G.W.; Jiang, C.Y.; Fang, H.Q.; Wang, C.L. Numerical investigation of the effect of particle gradation on the lateral response of pile in coral sand. Comput. Geotech. 2022, 152, 105012. [Google Scholar] [CrossRef]


| Specific Gravity | Dry Density (g/cm3) | Liquid Limit (%) | Plastic Limit (%) | Cu | Cc | Cohesion (kPa) | Internal Friction Angle (°) |
|---|---|---|---|---|---|---|---|
| 3.13 | 1.71 | 24.74 | 15.49 | 17.56 | 1.24 | 14.62 | 33.42 |
| K1 | K2 | n | Rf | δ | γw | Pa |
|---|---|---|---|---|---|---|
| 800 | 800 | 0.06 | 0.74 | 36.6 | 10 | 100 |
| Material | K0 | n | Rf | c | φ | G | D | F | Kur | Δφ |
|---|---|---|---|---|---|---|---|---|---|---|
| Silty | 428.8 | 0.32 | 0.8 | 20.56 | 28.6 | 0.38 | 0.27 | 0.187 | 900 | 0 |
| Silty sand | 315.7 | 0.25 | 0.85 | 14.56 | 36.5 | 0.42 | 0 | 0 | 1200 | 0 |
Disclaimer/Publisher’s Note: The statements, opinions and data contained in all publications are solely those of the individual author(s) and contributor(s) and not of MDPI and/or the editor(s). MDPI and/or the editor(s) disclaim responsibility for any injury to people or property resulting from any ideas, methods, instructions or products referred to in the content. |
© 2024 by the authors. Licensee MDPI, Basel, Switzerland. This article is an open access article distributed under the terms and conditions of the Creative Commons Attribution (CC BY) license (https://creativecommons.org/licenses/by/4.0/).
Share and Cite
Li, D.; Wang, Y.; Cui, X.; Huang, J. Effect of Self-Filtering Layer on Tailings–Steel Wire Mesh Interfacial Shearing Properties and Bearing Behavior of Drain Pipes. Buildings 2024, 14, 2554. https://doi.org/10.3390/buildings14082554
Li D, Wang Y, Cui X, Huang J. Effect of Self-Filtering Layer on Tailings–Steel Wire Mesh Interfacial Shearing Properties and Bearing Behavior of Drain Pipes. Buildings. 2024; 14(8):2554. https://doi.org/10.3390/buildings14082554
Chicago/Turabian StyleLi, Dongdong, Yuan Wang, Xuan Cui, and Jingqi Huang. 2024. "Effect of Self-Filtering Layer on Tailings–Steel Wire Mesh Interfacial Shearing Properties and Bearing Behavior of Drain Pipes" Buildings 14, no. 8: 2554. https://doi.org/10.3390/buildings14082554
APA StyleLi, D., Wang, Y., Cui, X., & Huang, J. (2024). Effect of Self-Filtering Layer on Tailings–Steel Wire Mesh Interfacial Shearing Properties and Bearing Behavior of Drain Pipes. Buildings, 14(8), 2554. https://doi.org/10.3390/buildings14082554