Abstract
This study aims to analyze the distribution characteristics of energy in deeply buried circular tunnels with a revealed cave. Analytical solutions for the stress and elastic strain energies in these tunnels are derived using the complex variable method and compared with numerical solutions obtained from finite element simulations. Subsequently, a parametric study investigates the effects of the cave’s orientation, shape, and protrusion on the distribution of elastic strain energy. Finally, the influence of the revealed cave on the stability of the surrounding rock is analyzed using the evaluation index based on energy theory. The conclusions are as follows: the presence of the cave causes elastic strain energy to accumulate in the surrounding rock near the middle of the cave. The smaller the angle between the cave direction and the minimum principal stress, the more severe the energy accumulation near the cave. As the cave’s protrusion increases and the b/a ratio of its shape decreases, energy accumulation near the cave becomes more severe. The presence of the cave increases the tendency for tunnel failure. The middle of the cave is susceptible to damage due to the accumulation of strain energy, while the intersection of the cave and the tunnel is more prone to damage because tensile stresses lower the energy threshold for surrounding rock failure. The study indicates that the middle of the cave and the junction between the cave and the tunnel are key areas requiring safety protection during construction.
1. Introduction
With the growing demand for transportation infrastructure, the number of deeply buried tunnels is increasing [1,2,3,4]. Tunneling in a deeply buried environment significantly weakens the stability of the surrounding rock under strong disturbances, leading to frequent geological hazards such as collapses and rock bursts [5]. Essentially, the damage process in the surrounding rock of a deeply buried tunnel is energy-driven. The surrounding rock accumulates high strain energy in a deeply buried environment [6,7,8]. Excavation affects the distribution of energy in the surrounding rock, and when the energy accumulation exceeds the storage limit, energy dissipation and release occur, causing damage to the surrounding rock [9,10]. During excavation, construction conditions, processes, and geological factors such as karst caves often cause revealed caves to appear in the tunnel profile [11,12], resulting in irregular and unsmooth tunnel cross-sections. The irregular and unsmooth tunnel cross-sections exacerbate the abnormal accumulation and release of energy in the surrounding rock, potentially affecting its stability [13,14]. Therefore, studying the energy distribution characteristics of deeply buried tunnels with revealed caves is crucial, as it can provide valuable references for stability evaluation.
As indicated in Table 1, numerous theoretical studies have been conducted on the energy distribution in the surrounding rock after tunnel excavation. Walsh [15] proposed a computational method using integral formulas to evaluate the individual energy components caused by tunnel excavation. He noted that energy input comes from gravitational work, and energy dissipation results from the development of rock fissures. Karamarenko and Revuzhenko [16] introduced the theory of energy flow lines, indicating that energy flows in a rocky medium in a definite direction. Lindin and Lobanova [17] further demonstrated that during deep rock-mass excavation, energy flows along energy lines from the outer boundary to the excavation face, aggregating energy in the surrounding rock. Dong et al. [13] derived an analytical solution for the energy distribution in surrounding rock after excavating an underground rectangular tunnel, analyzing the effects of initial stress and opening parameters on energy density distribution. Ge et al. [18] used the complex-variable method to study the elastic strain energy distribution and energy release law of square-tunnel-surrounding rock, finding that corners are the main energy-accumulation and -release areas. Xin et al. [19] revealed the energy distribution characteristics of a circular tunnel enclosure under hydrostatic pressure, analyzing the relationships among various energy densities. Zhao et al. [14] used the complex function method to establish an analytical solution for energy in the surrounding rock of a shallow rectangular tunnel, analyzing the effects of lateral pressure coefficients, burial depth, and chamber shape on energy distribution. Zheng et al. [20] proposed a calculation method for the energy evolution of strain-softened rock during circular-tunnel excavation based on triaxial stress paths, analyzing the energy distribution and evolution in deeply buried strain-softened rock tunnels.

Table 1.
Literature summary of energy evolution and distribution characteristics.
In summary, analyzing energy distribution characteristics has become a crucial method for evaluating the stability of deeply buried tunnels. However, most existing studies focus on regular tunnel shapes, such as circular and rectangular, and do not consider the possibility of a revealed cave on the excavation profile due to construction and geological factors. Therefore, this study uses the complex-variable method to solve the analytical solution for the strain energy of the surrounding rock in deep circular tunnels with a revealed cave, and to study the energy distribution characteristics in the surrounding rock. Using the conformal mapping method, the irregular tunnel-excavation contour with a revealed cave is mapped as a circular contour. The analytical solutions for stress and strain energies in deeply buried circular tunnels with a revealed cave are then derived using Cauchy’s integral formulae and the theory of elastic energy storage. To ensure accuracy and reliability, the proposed analytical solution is compared with results from the finite element method. Based on the derived analytical solution, the strain energy-distribution characteristics of the surrounding rock with a revealed cave are analyzed. Parametric analyses are then conducted to investigate the effects of cave orientation, cave shape parameters, and protrusion degree on strain energy-distribution characteristics. Finally, the effect of the cave on the stability of the surrounding rock in deeply buried circular tunnels is analyzed using the energy index and failure tendency index.
2. Materials and Methodology
2.1. Statement of the Problem
A deeply buried circular tunnel with a revealed cave is illustrated in Figure 1. This tunnel is excavated at great depth and is subject to far-field stress conditions defined by vertical pressure P0 and horizontal pressure λP0. A right-angle coordinate system is established with the center of the circular-tunnel section as the origin. The x-axis of this coordinate system is parallel to the direction of the horizontal pressure. The cave contour is defined as an elliptical arc, with one axis extending through the center of the circular-tunnel section. The length of this axis is defined as a, and its angle with the horizontal is defined as θ. The other axis of the ellipse has a length b. The center distance between the elliptical contour and the tunnel contour is r0.
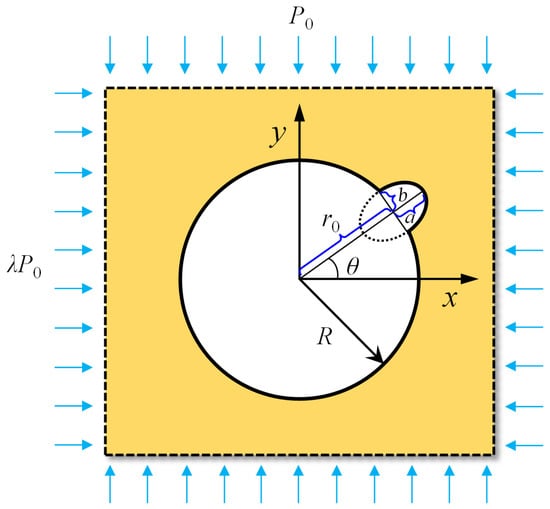
Figure 1.
Tunnel with cave under far-field stress conditions.
Throughout the analyses, the following assumptions are made:
- (1)
- The surrounding ground is assumed to be an elastic, homogeneous, and isotropic medium.
- (2)
- The excavation is assumed to be instantaneous, and the tunnel is not yet supported.
- (3)
- Compressive stress is considered positive.
2.2. Conformal Transformation
Conformal transformation is able to map the irregular tunnel contours in the Cartesian coordinate plane (z plane) to the unit circle region in the complex plane (ξ plane), as shown in Figure 2. For each point (z = x + iy) outside the tunnel contour line in the z plane, there exists a corresponding point (ξ = ρeiθj) in the external region of the unit circle in the ξ plane, represented by a mapping function expressed as a Laurent series:
where R and Ck are the constant numbers; ξ is the polar coordinate in complex plane; and ρ and θ are the polar diameter and polar angle in polar coordinates, respectively.
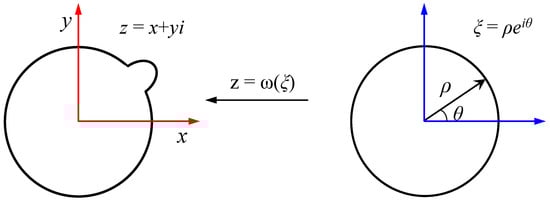
Figure 2.
Conformal mapping of tunnel excavation contour.
Bringing Equation (2) into Equation (1), the points on the z plane can be expressed by the trigonometric functions as
The mapping function z = w (ξ) is calculated as follows.
- (1)
- In z plane, m + 1 sample points zi (xi, yi) are picked with equal angles on the tunnel contour starting from the x-axis and following the counterclockwise direction. Similarly, m + 1 corresponding sample points ξi (1, θi) are extracted on the unit circle in ξ plane. The constant coefficients ak and bk in the first iteration are calculated aswith
- (2)
- A new set of points B1 = {(x0, y0), …, (xm, ym)} representing the mapping profile and the first mapping function is obtained after the first iteration. The accuracy of the mapping function is calculated by Equation (8). Keep performing Equation (4) until the mapping accuracy is achieved.
2.3. Complex-Variable Method
In this study, the complex-variable method is used to solve the analytical solution for stress and displacement in tunnels with a revealed cave. The complex variable-method is particularly advantageous for problems with multiply connected domains, complex geometries, and exotic stress fields.
2.3.1. Analytical Expressions of Stress and Displacement Fields
Two analytic functions, φ(z) and ψ(z) [21], are introduced, which are related to the Airy stress function U, as follows:
The stress function U is derived as follows:
Taking Equations (9) and (10) into Equation (11), the stress field of surrounding rock is expressed as
By bringing Equation (1) into Equation (12), the stress field of the surrounding rock can be expressed by coordinates in the complex plane, as follows:
where α is the relative rotation angle of the line element dz in z plane to the line element dξ in ξ plane, in counterclockwise positive.
2.3.2. Expressions of Complex Functions for Boundary Conditions
In a complex plane, the stress boundary conditions for single-connected domains can be written as
where σ is the boundary point in ξ plane; fx and fy are force components acting on the boundary in the x and y directions, and Ak and Bk are beginning and ending points of the boundary line, respectively.
2.3.3. Cauchy Integral Formula
The Cauchy integral formula is often used to simplify complex functions in the complex function method [21]. Assume that there exists a certain closed curve L in the study area and that the direction of L is positive in the clockwise direction. The inner region of the curve is S+, and the outer region is S−.
If the function f(z) is analytic on the inner domain and continuous on the inner domain and the boundary L, then
If the function f(z) is analytic on the exterior domain and continuous on the exterior domain and the boundary L, then
2.4. ElasticEnergy-Storage Theory
According to the principles of elasticity, the elastic strain-energy density can be expressed as [22,23]:
where E is the elastic modulus of the surrounding rock; σ1, σ2 and σ3 are the three principal stresses; and v is Poisson’s ratio.
The deformation damage of the surrounding rock is essentially the combined result of energy dissipation and energy release. During tunneling, part of the work carried out by the stress field on the surrounding rock is converted into dissipative energy of the medium, and the rest becomes releasable strain energy [23]. When the releasable strain energy in the surrounding rock unit reaches a certain surface energy, the surrounding rock unit will be damaged. The released strain energy required for an integral failure of surrounding rock under compression is as follows [24]:
As for the surrounding rock under tension, the following conditions need to be met for overall damage to occur:
Combining Equations (18) and (19), the failure tendency index (FTI) of the surrounding rock unit can be described as
2.5. Analytical Solution for Deeply Buried Circular Tunnel with a Revealed Cave
2.5.1. Solution of the Conformal Transformation Function
In this section, the conformal transformation function between the contour line of circular tunnels with a revealed cave and the unit circle is solved. The number of sampling points on the tunnel contour line is set to 10,000. The mapping accuracy ε is set to 1%. Moreover, the number of terms n for the mapping function has a large impact on the mapping accuracy. Higher values of n result in more accurate mapping functions but increased computational cost. Therefore, finding a suitable value of n is important. Figure 3 shows the mapping contours for different values of n. As the value of n increases, the mapped contours become more refined and closer to the actual contour. When the number of terms n increases to 90, the mapped contours are very close to the actual contours.
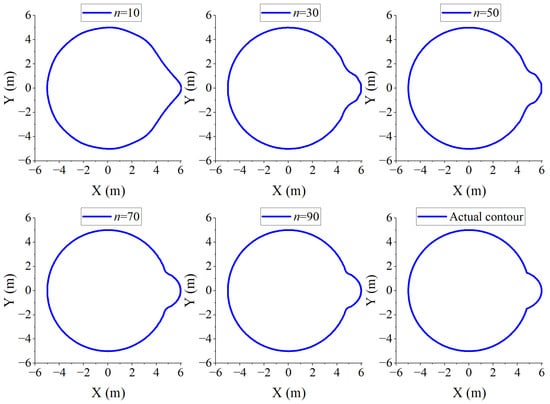
Figure 3.
Approximation of mapping contours for different n (R = 5 m, r0 = 4 m, a = 2 m, b = 1.6 m, θ = 0°).
2.5.2. Solution Procedure for Determining the Analytic Functions
In the single-hole infinite-field problem, the complex functions φ(ξ) and ψ(ξ) can be written as [21]
with
where A1 and B1 are coefficients determined by the external load at the hole edge. When no external load exists at the hole edge, A1 = B1 = 0; αk and βk are the two groups of complex coefficients to be determined.
In this study, there is no external force on the tunnel boundary. Therefore, Equation (21) can be simplified as
Similarly, Equation (14) can be simplified as
It can be found from Equation (23) that the solution process for stress and displacement fields is actually the calculation of the polynomial coefficients and . Taking Equation (23) into Equation (24) and simplifying it gives
Multiply on both sides of Equation (25) and integrate forward along the boundary line. Through the Cauchy integral formula, Equation (25) can be simplified to
with
Conjugate both sides of Equation (25) and multiply , then integrate forward along the boundary line. Finally, through the Cauchy integral formula, Equation (25) can be simplified to
To solve for and , the four integral equations in Equations (26) and (27) need to be transformed and simplified using the Cauchy integral formula.
First, the integral term at the left-hand side in Equation (26) is simplified. From Equation (21), can be expressed as
Substituting Equation (28) into Equation (26), the integral term on the left-hand side of Equation (26) can be expressed as
To simplify Equation (29), make the following function:
has only one (n − 2)-level pole in the inner domain, i.e., , so its Laurent series expansion is
Thus, by combining the Cauchy integral formula, the integral term on the left-hand side of Equation (26) can be reduced to
Next, the integral term on the right-hand side of Equation (26) is simplified. Substituting Equation (1) into Equation (26), the integral term on the right-hand side of Equation (26) can be expressed as
To solve Equation (33), a function is introduced, as shown in Equation (34).
Since in Equation (34) has only one pole of order n in the inner domain, i.e., , Equation (34) can be expanded as follows:
Since in Equation (33) is the boundary value of Equation (35), Equation (33) can be simplified to Equation (36) by using the Cauchy integral formula.
Substituting Equations (22), (32) and (36) into Equation (26), Equation (26) can be finally simplified as follows:
Next, the integral terms of Equation (27) are simplified. From Equation (32), the integral term on the left-hand side of Equation (27) can be expressed as
From Equation (35), can be transformed on the exterior domain as
Thus, the integral term on the right-hand side of Equation (27) can be transformed, using the Cauchy integral formula, as
Equation (27) can be finally simplified as follows, by substituting Equations (22), (37) and (40) into Equation (27).
From Equations (37) and (41), the values of the two sets of coefficients {αk} and {bt} can be obtained. Substituting the coefficients {αk} and {bt} into Equations (37) and (41) will obtain the analytic formula of the function and . Ultimately, by substituting these two functions into Equations (21) and (13), the expression for the stress state of the surrounding rock is obtained. Consequently, the stress state at any point in the surrounding rock can be determined, and from this, the elastic strain energy at the corresponding position can be calculated using Equation (17).
3. Results and Discussion
3.1. Numerical Validation and Stress Analysis
In this section, the proposed analytical solution is validated by comparing it with the numerical solution based on the finite element analysis software ABAQUS 2019 [25]. Since the numerical method also calculates strain energy using the stresses in the surrounding rock through Equation (17), the same as the analytical method, a direct comparison of stress fields from the analytical solution and the numerical method is performed to verify the validity of the analytical solution. As shown in Figure 4, the tunnel diameter (R) is 5 m, the cave shape parameter (a = b) is 2 m, r0 is 4 m, and σ1 = σ2 = 1 MPa. The elastic modulus of the surrounding rock is 1 GPa with a Poisson’s ratio of 0.3. In ABAQUS, the surrounding rock material is set to linear elastic, and the element type is CPE4 (four-node plane strain element). The numerical model has outer dimensions of 100 m in height and width. Given the potential for significant energy changes at the hole edge, the mesh near these areas, especially close to the cave, is refined. The numerical model contains 25,719 elements. Constraints are applied to the bottom and left boundaries, setting the vertical displacement at the bottom to zero and the horizontal displacement on the left to zero. A uniformly distributed pressure of 1 MPa is applied to the top and right boundaries. The distribution of the stress field in the surrounding rock for both numerical and analytical methods is shown in Figure 5.
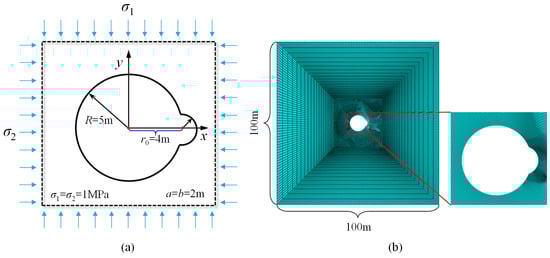
Figure 4.
The geometry of the tunnel and its FE model: (a) tunnel geometry, (b) ABAQUS model.
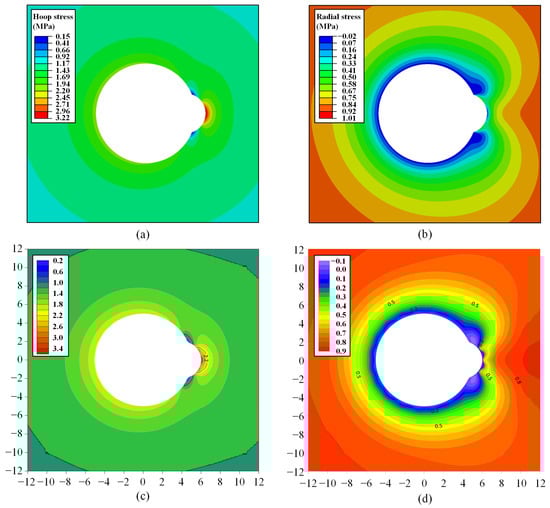
Figure 5.
Comparison of the stress field in the surrounding rock by numerical and analytical methods: (a) hoop stress for numerical method, (b) radial stress for numerical method, (c) hoop stress for analytical method, (d) radial stress for analytical method.
Figure 5 shows that the stress field distributions obtained by these two methods are essentially identical. This demonstrates that the analytical results have a high degree of accuracy. Additionally, the surrounding rock stress-field distribution reveals that the presence of the cave leads to hoop-stress concentration in the middle of the cave. The closer it is to the hole edge, the more intense the stress concentration, with a maximum stress of 3.22 MPa. At the intersection of the cave and tunnel, there is stress relief, with a minimum circumferential stress of 0.15 MPa at the hole edge. Radial stress at the hole edge is zero and gradually increases as it moves away, eventually reaching 1 MPa. Additionally, due to the presence of the cave, there are tensile stresses in the surrounding rock close to the cave and the tunnel profile, with a maximum of −0.02 MPa.
Due to the significant concentration phenomena and variations in hoop stresses at the hole edge, the analytical method is compared with the numerical method using different numbers of elements at the hole edge. Figure 6 shows that near the cave, the numerical method cannot accurately predict hoop stresses unless a very fine mesh is used. As the number of elements increases, the numerical results gradually approach the analytical results. This further validates the superiority of the analytical method in solving complex excavation contours over the numerical method. Additionally, there is a notable stress concentration in the middle of the cave, with a maximum value 1.61 times that of the tunnel without the cave, while there is a stress release at the intersection of the cave and the tunnel, where the hoop stress is only 7.65% that of the tunnel without the cave.
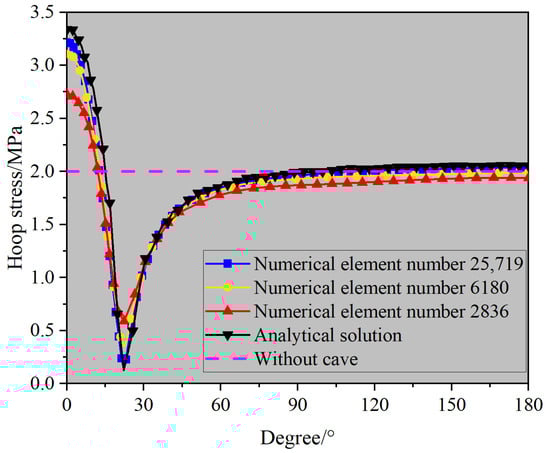
Figure 6.
Hoop-stress distribution at the hole edge by analytical and numerical methods.
To further analyze stress variation in the surrounding rock from the hole edge to the interior, four measurement lines are set up as shown in Figure 7. The stress results for different measurement lines are shown in Figure 8. As the distance from the hole edge increases, both the maximum and minimum principal stresses gradually approach the far-field stress of 1 MPa. The stress curves of measurement lines III and IV are essentially the same as those in the tunnel without a cave. Measurement lines I and II are affected by the cave, and their stress curves differ from the others. Specifically, for the minimum principal stress, the stress line of measurement I varies more drastically near the hole edge. In measurement line II, the stress curve first decreases from 0 to −0.07 MPa and then gradually increases to 1 MPa. For the maximum principal stress, line I has higher stress values near the hole edge and varies more intensely. The stress value of line II is close to zero at the hole edge, and increases and then decreases, with increasing distance.
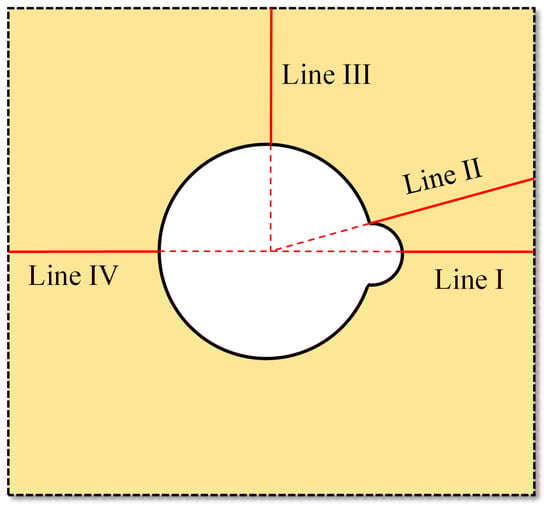
Figure 7.
The arrangement of measurement lines in the surrounding rock.
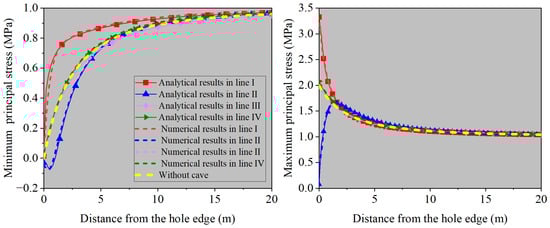
Figure 8.
Analytical and numerical results of stresses on different measurement lines.
3.2. Parametric Analysis
3.2.1. Effect of Cave Orientation on Energy Distribution Characteristics
This section discusses the effect of cave orientation on the energy distribution characteristics in the surrounding rock of circular tunnels. The mechanical and geometric parameters of the tunnel are presented in Table 2. The orientation of the cave is determined by the angle θ between its axis and the horizontal direction. Figure 9 illustrates the energy distribution characteristics under different cave orientations θ. Due to the deviatoric stress effect, the elastic strain energy mainly accumulates on both sides of the tunnel, increasing as it gets closer to the hole edge. Additionally, the presence of a cave results in more strain energy accumulating in the middle of the cave compared to a tunnel without a cave. The energy accumulated in the middle increases as θ decreases. The maximum values of elastic strain energy are 0.341 × 10⁶ J/m3, 1.554 × 10⁶ J/m3, 1.107 × 10⁶ J/m3, 0.478 × 10⁶ J/m3, and 0.353 × 10⁶ J/m3 for the tunnel without a cave and for θ of 0°, 30°, 60°, and 90°, respectively. The maximum value of elastic strain energy increases by a factor of 4.5 for θ of 0°, compared to the tunnel without cave.
Table 2.
Mechanical and geometric parameters of the tunnel.
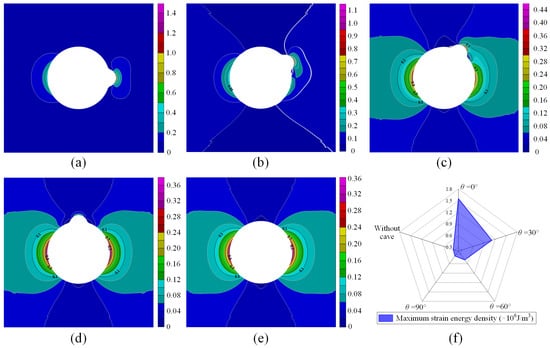
Figure 9.
Energy distribution characteristics in the surrounding rock under different cave orientations (unit: ×106 J/m3), (a) θ = 0°; (b) θ = 30°; (c) θ = 60°; (d) θ = 90°; (e) without cave, (f) maximum strain energy density.
To further discuss the effects of the cave and deviatoric stress on elastic strain-energy accumulation in surrounding rock, the hole edge, where elastic strain-energy accumulation is most pronounced, is studied to analyze the distribution of elastic strain energy under different deviatoric stresses and cave orientations. The vertical pressure is 40 MPa, and the lateral pressure coefficients λ are 0.25, 0.5, 0.75, and 1. The other mechanical and geometric parameters of the tunnel are consistent with those in Table 2. The results are shown in Figure 10.
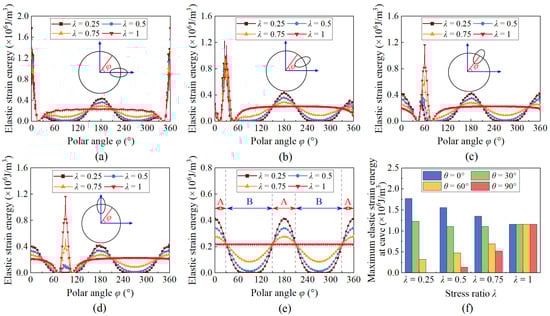
Figure 10.
Energy distribution characteristics at the hole edge for different deviatoric stress and cave orientations (unit: ×106 J/m3), (a) θ = 0°; (b) θ = 30°; (c) θ = 60°; (d) θ = 90°; (e) without cave, (f) maximum strain energy density at cave.
As shown in Figure 10, the presence of the cave significantly affects the energy distribution at the hole edge. Specifically, there is substantial energy accumulation at the cave and a significant reduction at the intersection of the cave and the tunnel. When λ = 1, the maximum elastic strain energy at the cave with different orientations is 1.61 × 10⁶ J/m3, which is 7.37 times higher than that in the tunnel without the cave. As λ decreases, the maximum elastic strain energy at the cave with a 0° cave orientation increases significantly, while at a 30° cave orientation, it increases slightly. However, at 60° and 90° orientations, the maximum elastic strain energy at the cave decreases gradually. This occurs because energy accumulation at the cave is influenced by the combination of cave orientation and deviatoric stress. Figure 10e shows the elastic strain-energy distribution of the tunnel without a cave under different deviatoric stresses. When λ = 1, there is no deviatoric stress, and the elastic strain energy at the hole edge shows a uniform distribution. As λ decreases, both elastic strain-energy accumulation zones and release zones appear at the hole edge. The region where the angle with the horizontal direction (minimum principal stress direction) is less than 30° is an elastic strain-energy accumulation zone (Zone A in Figure 10e), while the rest forms an elastic strain-energy release zone (Zone B in Figure 10e). Furthermore, as λ decreases, the effect of deviatoric stress increases, making the accumulation and release of elastic strain energy at the cave edge more pronounced. Therefore, when the cave is in the strain energy accumulation zone generated by deviatoric stress, the elastic strain-energy accumulation at the cave is further amplified, reaching a maximum when the cave direction is parallel to the minimum principal stress direction. For example, when λ = 0.25 and the cave orientation is 0°, the maximum elastic strain energy at the cave edge reaches 1.77 × 10⁶ J/m3, which is 4.32 times that of a tunnel without a cave. Conversely, when the cave is in the strain energy release zone created by deviatoric stress, the elastic strain-energy accumulation at the cave is weakened, with the weakening being most significant when the cave direction is vertical to the minimum principal stress direction. For instance, when λ = 0.25 and the cave orientation is 90°, the maximum elastic strain energy at the cave is only 7.45 × 10³ J/m3.
To further analyze the combined impact mechanism of deviatoric stress and the cave on the energy distribution in the surrounding rock, the energy accumulation and release zones under different lateral pressure coefficients are examined. The elastic strain energy at various locations in the surrounding rock is calculated for lateral pressure coefficients (λ) of 0.25, 0.5, and 0.75. The strain energy at these locations is then subtracted from the strain energy at the corresponding locations when the lateral pressure coefficient is 1. Regions where the difference is greater than 0 are energy accumulation zones generated by deviatoric stress, while regions where the difference is less than 0 are energy release zones. The results are shown in Figure 11. As the lateral pressure coefficient (λ) decreases, energy accumulation zones form on both sides of the tunnel, and energy release zones form at the top and bottom of the tunnel. The intensity of energy accumulation and release gradually increases. Therefore, when the cave orientation is horizontal, it is located in the region of the strongest energy accumulation, further increasing the energy near the cave. When the cave orientation is vertical, the deviatoric stress effect weakens energy accumulation the most, resulting in lower strain energy near the cave.
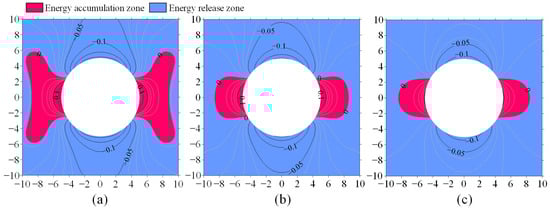
Figure 11.
The distribution of energy accumulation and release zones in the surrounding rock under different lateral pressure coefficients (a) λ = 0.25; (b) λ = 0.5; (c) λ = 0.75.
3.2.2. Effect of Cave Shape b/a on Energy Distribution along the Hole
This section focuses on the effect of cave shape, denoted by the b/a, on the distribution of elastic strain energy at the hole edge. The length of the ellipse’s axis pointing to the tunnel center is set to 2. The b/a values are 0.6, 0.8, 1.0, 1.2, and 1.4, with θ set to 0°, and other parameters remain the same as in Table 2. The distribution of elastic strain energy along the hole edge for different b/a ratios is shown in Figure 12.
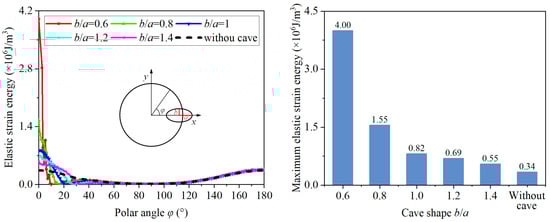
Figure 12.
Energy distribution characteristics along the hole with different cave shape b/a.
Figure 12 shows that as b/a increases, the elastic strain energy accumulation in the cave region gradually reduces, and the magnitude of the elastic strain-energy variation decreases. When b/a ratios are 0.6, 0.8, 1.0, 1.2, and 1.4, the maximum elastic strain energy in the cave is 4.00 × 10⁶ J/m3, 1.55 × 10⁶ J/m3, 0.82 × 10⁶ J/m3, 0.69 × 10⁶ J/m3, 0.55 × 10⁶ J/m3, and 0.34 × 10⁶ J/m3, respectively. These values are 11.76, 4.55, 2.41, 2.03, and 1.62 times higher than those in a tunnel without a cave.
3.2.3. Effect of the Cave Protrusion on Strain Energy along the Hole
An indicator, D, is introduced to describe the protrusion of the cave, which is calculated by Equation (42). In this section, the values of indicator D are 1.01, 1.05, 1.10, 1.15, and 1.20. The orientation angle θ is set to 0°, and the other parameters remain the same as in Table 2. The calculation results are shown in Figure 13. Notably, the elastic strain energy along the hole edge remains significantly disturbed, even with a slight cave projection. When indicator D is 1.01, the maximum elastic strain energy along the hole edge is 0.58 × 10⁶ J/m3, an increase of 70.59% compared to the case without a cave. As D increases, the maximum elastic strain energy along the hole edge gradually increases. When D is 1.20, the maximum elastic strain energy reaches 1.55 × 10⁶ J/m3.
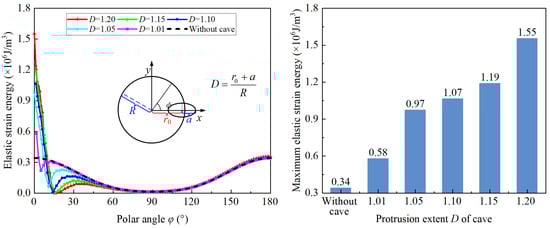
Figure 13.
Energy distribution characteristics along the hole with different protrusion extent D.
3.2.4. Effect of Cave on the Stability of the Surrounding Rock
This section uses the Failure Tendency Index (FTI), calculated by Equation (20), to assess the effect of a cave on surrounding rock stability from the perspective of energy release. The tunnel’s geometric and mechanical parameters are consistent with those in Table 2. The distribution of the FTI in the surrounding rock is illustrated in Figure 14.
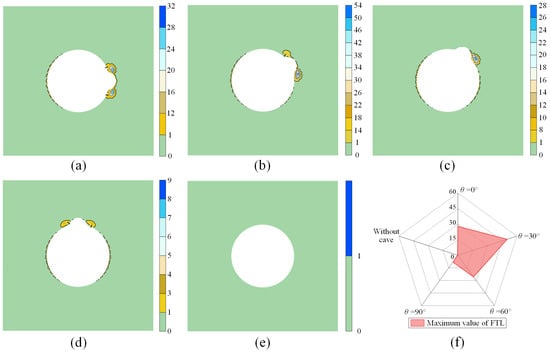
Figure 14.
Distribution of Failure Tendency Index in the surrounding rock: (a) θ = 0°; (b) θ = 30°; (c) θ = 60°; (d) θ = 90°; (e) without cave, (f) maximum Failure Tendency Index.
Figure 14 shows that the tunnel without a cave remains stable under the stress conditions of 40 MPa vertical pressure and 20 MPa horizontal pressure. The presence of the cave makes the surrounding rock more prone to failure. The greatest failure tendency is at the intersection between the cave and the tunnel, followed by the sides of the tunnel. Specifically, when θ = 0°, the FTI values in the surrounding rock are symmetrically distributed. On both sides of the tunnel, energy continuously accumulates under the influence of the cave and deviatoric stress, increasing the failure tendency in the surrounding rock. At the intersection between the cave and tunnel, tensile stress promotes energy release, significantly increasing the failure tendency in this area of the surrounding rock. When θ increases to 30°, the FTI values at the intersection between the cave and tunnel show different trends on both sides of the cave. On the side near the horizontal direction, which is the direction of the minimum principal stress, the FTI value significantly increases, while it decreases on the opposite side. This may be because as θ increases from 0° to 30° the intersection on the side close to the horizontal experiences higher energy accumulation from the bias stresses, and is thus more susceptible to damage. The other side of the intersection enters the energy release zone from the bias stress, resulting in a reduction in energy and hence a lower risk of damage. As θ further increases, the overall risk of failure in the surrounding rock decreases, likely because both the cave and the interface between the cave and the tunnel are situated in the energy release zone created by deviatoric stress, leading to generally lower strain energy and reducing the risk of failure.
The above results indicate that tunnels with a cave are more susceptible to failure. The middle of the cave has a certain failure tendency due to energy accumulation, while the cave–tunnel junction has a strong failure tendency due to the presence of tensile stresses. This conclusion can be verified in Figure 5 and Figure 10, which show a stress concentration and elastic strain-energy accumulation in the middle of the cave, and an area of tensile stress concentration at the junction of the cave and the tunnel. Furthermore, when the cave or the intersection between the cave and the tunnel is located in the energy accumulation zone formed by the deviatoric stress, the deviatoric stress effect will increase the risk of failure. Conversely, when they are located in the energy release zone, the deviatoric stress effect will reduce the risk of failure.
3.3. Limitations and Future Prospects
Although this study conducts a series of systematic and scientific analyses, there are still limitations and aspects that require further investigation. First, this study only analyzed the presence of one revealed cave at the tunnel excavation face. Future work could analyze the effect of the number of caves and the relative positions of multiple caves on the energy distribution of the surrounding rock. In addition, this study did not consider the influence of blasting load and dynamic unloading effects on the energy distribution of the surrounding rock during construction using the drilling and blasting method. Future studies can derive the analytical solution for the strain energy of tunnels with revealed caves, considering the coupled effects of blasting load and dynamic unloading. They can also analyze the effects of different excavation methods and unloading rates on energy distribution in the surrounding rock.
4. Conclusions
The stress and energy analytical solutions for the deep-buried circular tunnel with a revealed cave are derived using conformal mapping and complex-variable methods. Numerical methods validate the proposed analytical solutions. Parametric analyses are then conducted to investigate the effects of cave orientation, shape parameters, and protrusion degree on the energy distribution characteristics in the surrounding rock. Finally, the effect of the cave on the stability of the surrounding rock is analyzed based on energy theory. The following conclusions can be made:
The analytical solutions proposed in this study are in good agreement with the numerical simulation results. Additionally, the finer the mesh of the numerical model, the closer the results are to the analytical solution.
The presence of a cave significantly affects the energy distribution in the surrounding rock, with its influence mainly concentrated near the cave. Specifically, there is strong energy accumulation in the middle of the cave, while energy weakens at the junction of the cave and the tunnel.
Parametric analysis shows that cave orientation greatly influences energy distribution. Energy accumulation is most significant when the cave orientation is parallel to the minimum principal-stress direction and further intensifies with increased deviatoric stress. Additionally, energy accumulation increases with decreasing shape parameters (b/a) and increasing protrusion degree of the cave.
The presence of the cave increases the failure tendency of the surrounding rock. The intersection between the cave and the tunnel is the most susceptible to damage, due to tensile stresses reducing the energy storage limit of the surrounding rock. The middle of the cave follows, due to the accumulation of large amounts of energy.
Author Contributions
Conceptualization, Y.W.; Methodology, D.X. and J.H.; Software, D.X.; Writing—original draft, D.X.; Writing—review & editing, Y.W. and J.H.; Supervision, Y.W. All authors have read and agreed to the published version of the manuscript.
Funding
This research was supported by the National Natural Science Foundation of China (51608015; 51678015; 51478247; 41672289), the National Basic Research Program of China (2015CB057902), and Fundamental Research Funds for the Central Universities (FRF-TP-17-074A1). The support is gratefully acknowledged.
Data Availability Statement
Data are contained within the article.
Conflicts of Interest
The authors declare no conflict of interest.
References
- Li, C.C.; Zhao, T.; Zhang, Y.; Wan, W. A study on the energy sources and the role of the surrounding rock mass in strain burst. Int. J. Rock Mech. Min. Sci. 2022, 154, 105114. [Google Scholar] [CrossRef]
- Ma, C.S.; Chen, W.Z.; Tan, X.J.; Tian, H.M.; Yang, J.P.; Yu, J.X. Novel rockburst criterion based on the TBM tunnel construction of the Neelum–Jhelum (NJ) hydroelectric project in Pakistan. Tunn. Undergr. Space Technol. 2018, 81, 391–402. [Google Scholar] [CrossRef]
- Xue, T.; Zhang, Q.; Duan, K.; Wang, P.; Lin, H.; Fan, Q.; Liu, L. Geo-mechanical model test on the water inrush induced by zonal disintegration of deep tunnel under hydro-mechanical coupling. Int. J. Rock Mech. Min. Sci. 2022, 160, 105278. [Google Scholar] [CrossRef]
- Pei, Q.; Wang, X.; He, L.; Liu, L.; Tian, Y.; Wu, C. Estimation Method for an In Situ Stress Field along a Super-Long and Deep-Buried Tunnel and Its Application. Buildings 2023, 13, 1924. [Google Scholar] [CrossRef]
- Zhang, R.; Liu, Y.; Hou, S. Evaluation of rockburst risk in deep tunnels considering structural planes based on energy dissipation rate criterion and numerical simulation. Tunn. Undergr. Space Technol. 2023, 137, 105128. [Google Scholar] [CrossRef]
- Ortlepp, W.D. The behaviour of tunnels at great depth under large static and dynamic pressures. Tunn. Undergr. Space Technol. 2001, 16, 41–48. [Google Scholar] [CrossRef]
- Feng, X.-T.; Yang, C.-X.; Kong, R.; Zhao, J.; Zhou, Y.; Yao, Z.; Hu, L. Excavation-induced deep hard rock fracturing: Methodology and applications. J. Rock Mech. Geotech. Eng. 2022, 14, 1–34. [Google Scholar] [CrossRef]
- He, M.; Ding, M.; Yuan, Z.; Zhao, J.; Luo, B.; Ma, X. Numerical simulation of rock bursts triggered by blasting disturbance for deep-buried tunnels in jointed rock masses. Comput. Geotech. 2023, 161, 105609. [Google Scholar] [CrossRef]
- Kaiser, P.K.; Tang, C.A. Numerical Simulation of Damage Accumulation and Seismic Energy Release During Brittle Rock Failure—Part II: Rib Pillar Collapse. Int. J. Rock Mech. Min. Sci. 1998, 35, 123–134. [Google Scholar] [CrossRef]
- Lu, J.; Yin, G.; Gao, H.; Li, X.; Zhang, D.; Deng, B.; Wu, M.; Li, M. True Triaxial Experimental Study of Disturbed Compound Dynamic Disaster in Deep Underground Coal Mine. Rock Mech. Rock Eng. 2020, 53, 2347–2364. [Google Scholar] [CrossRef]
- Wu, B.; Sun, W.; Meng, G. A Calculation Method for Reliability Index of a Deep–Bedded Karst Tunnel Construction with Cavity Located Ahead of Tunnel Working Face. Buildings 2024, 14, 1349. [Google Scholar] [CrossRef]
- Fan, H.; Zhang, Y.; He, S.; Wang, K.; Wang, X.; Wang, H. Hazards and treatment of karst tunneling in Qinling-Daba mountainous area: Overview and lessons learnt from Yichang–Wanzhou railway system. Environ. Earth Sci. 2018, 77, 679. [Google Scholar] [CrossRef]
- Dong, X.; Karrech, A.; Basarir, H.; Elchalakani, M.; Qi, C. Analytical solution of energy redistribution in rectangular openings upon in-situ rock mass alteration. Int. J. Rock Mech. Min. Sci. 2018, 106, 74–83. [Google Scholar] [CrossRef]
- Zhao, Z.; Li, C.; Chen, S.; Zhang, M.; Ma, Q. Theoretical analysis of the surrounding rock stress field and energy field in shallow rectangular chambers during excavation. Comput. Geotech. 2024, 165, 105937. [Google Scholar] [CrossRef]
- Walsh, J.B. Energy changes due to mining. Int. J. Rock Mech. Min. Sci. Geomech. Abstr. 1977, 14, 25–33. [Google Scholar] [CrossRef]
- Kramarenko, V.I.; Revuzhenko, A.F. Flow of energy in a deformed medium. Sov. Min. Sci. 1988, 24, 536–540. [Google Scholar] [CrossRef]
- Lindin, G.L.; Lobanova, T.V. Energy sources of rockbursts. J. Min. Sci. 2013, 49, 36–43. [Google Scholar] [CrossRef]
- Ge, D.; Jiang, F.; Wang, C.; Chen, Y.; Dong, C.; Zhu, S.; Wang, Z.; Han, F. Sliding Impact Mechanism of Square Roadway Based on Complex Function Theory. Shock Vib. 2021, 2021, 6655694. [Google Scholar] [CrossRef]
- Xin, X.-K.; Meng, Q.-B.; Pu, H.; Wu, J.-Y. Theoretical analysis and numerical simulation analysis of energy distribution characteristics of surrounding rocks of roadways. Tunn. Undergr. Space Technol. 2024, 147, 105747. [Google Scholar] [CrossRef]
- Zheng, K.; Shi, C.; Lou, Y.; Jia, C.; Lei, M.; Yang, Y. A computational method for tunnel energy evolution in strain-softening rock mass during excavation unloading based on triaxial stress paths. Comput. Geotech. 2024, 169, 106212. [Google Scholar] [CrossRef]
- Muskhelishvili, N.I. Some Basic Problems of the Mathematical Theory of Elasticity; Noordhoff: Groningen, The Netherlands, 1953; Volume 15. [Google Scholar]
- Fan, Y.; Lu, W.B.; Yan, P.; Chen, M.; Zhang, Y.Z. Transient characters of energy changes induced by blasting excavation of deep-buried tunnels. Tunn. Undergr. Space Technol. 2015, 49, 9–17. [Google Scholar] [CrossRef]
- Xie, H.; Li, L.; Peng, R.; Ju, Y. Energy analysis and criteria for structural failure of rocks. J. Rock Mech. Geotech. Eng. 2009, 1, 11–20. [Google Scholar] [CrossRef]
- An, X.; Hu, Z.; Su, Y.; Cao, S.; Tao, L.; Zhang, Y. Initial support distance of a non-circular tunnel based on convergence constraint method and integral failure criteria of rock. J. Cent. South Univ. 2022, 29, 3732–3744. [Google Scholar] [CrossRef]
- Liu, S.; Liu, S.; Lu, S.; Ma, F.; Pei, G. Seismic Behaviour of Shallow Tunnelling Method Tunnels Accounting for Primary Lining Effects. Buildings 2023, 13, 20. [Google Scholar] [CrossRef]
Disclaimer/Publisher’s Note: The statements, opinions and data contained in all publications are solely those of the individual author(s) and contributor(s) and not of MDPI and/or the editor(s). MDPI and/or the editor(s) disclaim responsibility for any injury to people or property resulting from any ideas, methods, instructions or products referred to in the content. |
© 2024 by the authors. Licensee MDPI, Basel, Switzerland. This article is an open access article distributed under the terms and conditions of the Creative Commons Attribution (CC BY) license (https://creativecommons.org/licenses/by/4.0/).