Article

Effect of Self-Filtering Layer on Tailings–Steel Wire Mesh Interfacial Shearing Properties and Bearing Behavior of Drain Pipes

1
Civil and Resource Engineering School, University of Science and Technology Beijing, Beijing 100083, China
2
College of Water Conservancy and Hydropower Engineering, Hohai University, Nanjing 210024, China
3
BGRIMM Technology Group, Beijing 100081, China
*
Author to whom correspondence should be addressed.
Buildings 2024, 14(8), 2554; https://doi.org/10.3390/buildings14082554
Submission received: 24 July 2024 / Revised: 9 August 2024 / Accepted: 16 August 2024 / Published: 19 August 2024
(This article belongs to the Special Issue Seismic Response Analysis of Underground Structure)

Abstract

:
The drain pipe wrapped in steel wire mesh serves a dual purpose of drainage and reinforcement in tailings pond projects. The self-filtering layer that develops upstream of the steel wire mesh influences the reinforcement characteristics of the drainage pipe. This study first conducts interfacial shearing experiments to explore the impact of the self-filtering layer on the shearing properties between tailings and the steel wire mesh. An exponential interface constitutive model is then proposed to delineate the shear stress–displacement relationship. Finally, through finite element simulations, the study assesses the effect of the self-filtering layer on the load-bearing behavior of the drain pipe, considering the interactive dynamics between the tailings and the steel wire mesh. The results reveal that the interfacial shear strength, across varying median particle sizes of the self-filtering layer, adheres to Mohr–Coulomb strength theory. Specifically, as the median particle size of the self-filtering layer increases, interfacial cohesion diminishes while the friction coefficient rises. The initial shear stiffness demonstrates a linear increase with the median particle size. With the presence of the self-filtering layer, the pull-out resistance of the drainage pipe can be enhanced by up to 26%. Moreover, the self-filtering layer significantly affects the distribution of negative skin friction. This research enhances the safety assessment of tailings ponds by providing crucial insights and solutions, emphasizing the influence of the self-filtering layer on the bearing behavior of the drain pipe.

1. Introduction

The drain pipe wrapped in steel wire mesh has seen widespread application in geotechnical and hydraulic engineering, especially in fine tailings pond projects [1,2,3]. A notable advantage of employing these drainage pipes lies in their dual functionality: serving not only as drainage facilities but also as embedded reinforcements [4,5]. However, the effectiveness of this reinforcement hinges on the interaction between tailings and steel wire mesh. In addition, steel wire mesh, functioning as a filtration medium, can induce the fine particles upstream to be washed out and hold a coarse skeleton to form the self-filtering layer [6,7]. This phenomenon is common in tailings ponds owing to the complex nature of the fluid, high hydraulic gradients, and the weak cohesion of tailings [8,9,10]. The formed self-filtering layer can significantly influence the interfacial shearing properties between the tailings and the steel wire mesh, thereby impacting the load-bearing behavior of drain pipes. Hence, it is imperative and essential to investigate the impact of the self-filtering layer on the interfacial shearing properties between tailings and steel wire mesh, as well as on the load-bearing behavior of drain pipes, to ensure the safety of tailings ponds.
Several researchers have examined the interfacial shearing characteristics between soil and various types of reinforcement, such as geomembranes, geotextiles, geogrids, and other geosynthetics, using interface direct shear tests (IDST). By interface shear tests, DeJong [11] highlighted the significant influence of normal stress on the response of sand–geomembrane interfaces and the evolution of material damage. Sayeed et al. [12], through large-size direct shear testing, compared and analyzed the interfacial shearing characteristics of sand and geotextiles containing different weight proportions of jute and polypropylene fibers. Studies by Punetha et al. [13] and Manohar and Anbazhagan [14] demonstrated that the shear properties of the soil and reinforcement interface depend on the type of geosynthetics. They concluded that the types of geosynthetics significantly affect the roughness and interaction mechanism of the interface. Hassan et al. [15] discussed the impact of plasticity indices on the mechanical behavior of cohesive soil and geosynthetics interfaces using indoor triaxial compression and interface direct shear tests. Abdi et al. [16] inserted a thin layer of sand between clay and geogrids, observing enhanced drainage paths and substantially improved interfacial strength. Other relevant literature can be found in the works of Prabhakara et al. [17], Praveen and Kurre [18], Lopes et al. [19], Zhang et al. [20], Ghazizadeh and Bareither [21], Triplett and Fox [22], et al. While existing studies underscore the dependence of soil–reinforcement interface properties on factors such as normal stress, reinforcement type, and soil characteristics, limited experiments have explored interface properties in the presence of a self-filtering layer. It is well understood that the formation of a self-filtering layer alters the overall structural morphology and surface roughness characteristics of tailings, significantly impacting the shearing properties at the interface between tailings and steel wire mesh.
In recent years, extensive research has been conducted on the bearing behavior of embedded geosynthetic reinforcements using experimental, theoretical, and numerical methods, resulting in significant advancements [23,24,25,26,27]. Numerical simulation stands out as an effective tool for predicting the bearing capacity of geosynthetic reinforcements due to its ability to faithfully reproduce the full stress and strain fields within the foundation. The reliability of the numerical models in simulating soil–reinforcement interactions hinges on the choice of contact interface model employed to capture interface behavior [28,29]. Abdelouhab et al. [30] observed that the friction-slip model offers a superior description of geosynthetic strip pulling behavior compared to traditional anchorage models. Using the Coulomb friction model, Sugimoto and Alagiyawanna [31] and Hussein and Meguid [32] gave a comprehensive analysis of geogrid response under pullout loading, highlighting the crucial role of interface properties in simulating geogrid pullout behavior. Ren et al. [33] proposed a tri-linear shear slip model considering residual interfacial shearing strength to model the bearing behavior of planar reinforcements. A two-surface plasticity interface constitutive model was utilized by Saberi et al. [34] to describe the characteristics of the interface between soil and geo-structure. This approach contributes a simulating framework for the interface with softening behavior. Nonetheless, to the author’s best knowledge, little study has been devoted to establishing a proper interface model that can precisely capture the mechanical response of the tailing–steel wire mesh interface under a self-filtering layer and eventually predict the bearing behavior of the drain pipe.
This paper aims to explore the effect of the self-filtering layer on tailings–steel wire mesh interfacial shearing properties and bearing behavior of the drain pipe in tailing projects. Interfacial shear experiments were conducted using a direct shear apparatus to investigate the interfacial shearing properties between tailings with a self-filtering layer and steel wire mesh. Subsequently, an appropriate interface constitutive model was developed based on the relationship between shear stress and displacement. Finally, finite-element numerical simulations incorporating an interface constitutive model were performed to assess the impact of the self-filtering layer on the load-bearing behavior of drain pipes.

2. Interfacial Shearing Experiment

2.1. Engineering Background

The project examined in this study is the Xinshuicun tailings pond, which is an iron tailings pond located in Hebei province, north China. Tailings used as shear medium are taken from the dry beach of the tailings pond. To take advantage of the natural topography, the Xinshuicun tailings pond has been constructed using an upstream method in a valley, as shown in Figure 1. The tailings slurry from the concentrator will be discharged into the pond through pumping and piping. The initial dam, constructed with permeable rockfill material, is 21.0 m in height, and the crest width is 4.0 m with an upstream slope of 1V:2H and a downstream slope of 1V:1.75H. Each sub-dam, measuring 5.0 m in height and 3.0 m in width, is constructed with coarse sands excavated from the tailings beach. The total design height of the dam is 230 m. According to mine planning, vertical drain pipe with a diameter of 100 mm will be installed at the decant pond in order to discharge the pond flood.

2.2. Materials

2.2.1. Tailings

The particle gradation curve of the tailings is plotted in Figure 2. The tailings with diameters of less than 74 μm are determined to make up 72%, which can be classified as fine-grained tailings. An assessment based on the coefficient of uniformity (Cu (D60/D10)) and coefficient of curvature (Cc (D302/(D10 × D60)) suggests that the tailings exhibit good gradation continuity and uniformity. Mineralogical components analysis using the Ultima IV diffractometer reveals quartz as the primary mineral, with minor constituents including wermlandite, calcite, and magnetite, as illustrated in Figure 3. Furthermore, various fundamental geotechnical properties such as specific gravity, liquid/plastic limits, and internal friction angle are determined according to the test standard [35], detailed in Table 1. According to the range of plastic limit and liquid limit, the tailing samples with a target water content of 19% are prepared by blending oven-dried tailings with distilled water for subsequent shear tests.

2.2.2. Steel Wire Mesh

According to the design, a plain-weave steel wire mesh made of continuous 304-grade stainless steel wires has been chosen as the envelope of the drain pipe. The texture and filaments of the steel wire mesh can be observed through SEM photographs, as shown in Figure 4. It is noteworthy that the steel wire mesh exhibits properties of flexibility, anisotropy, inhomogeneity, and porosity, setting it distinctly apart from other reinforcing materials. The aperture size of the steel wire mesh measures 0.18 mm, with a wire diameter of 0.13 mm and overall thickness of 0.26 mm. The average ultimate tensile strength of the steel wire mesh is 32.4 MPa, and Young’s modulus is 1583.01 MPa. The raw wire mesh material is cut into a circular shape with a diameter of 61.8 mm, which is fixed to the acrylic bearing plate with strong adhesive in the shear tests.

2.3. Specimen Preparation

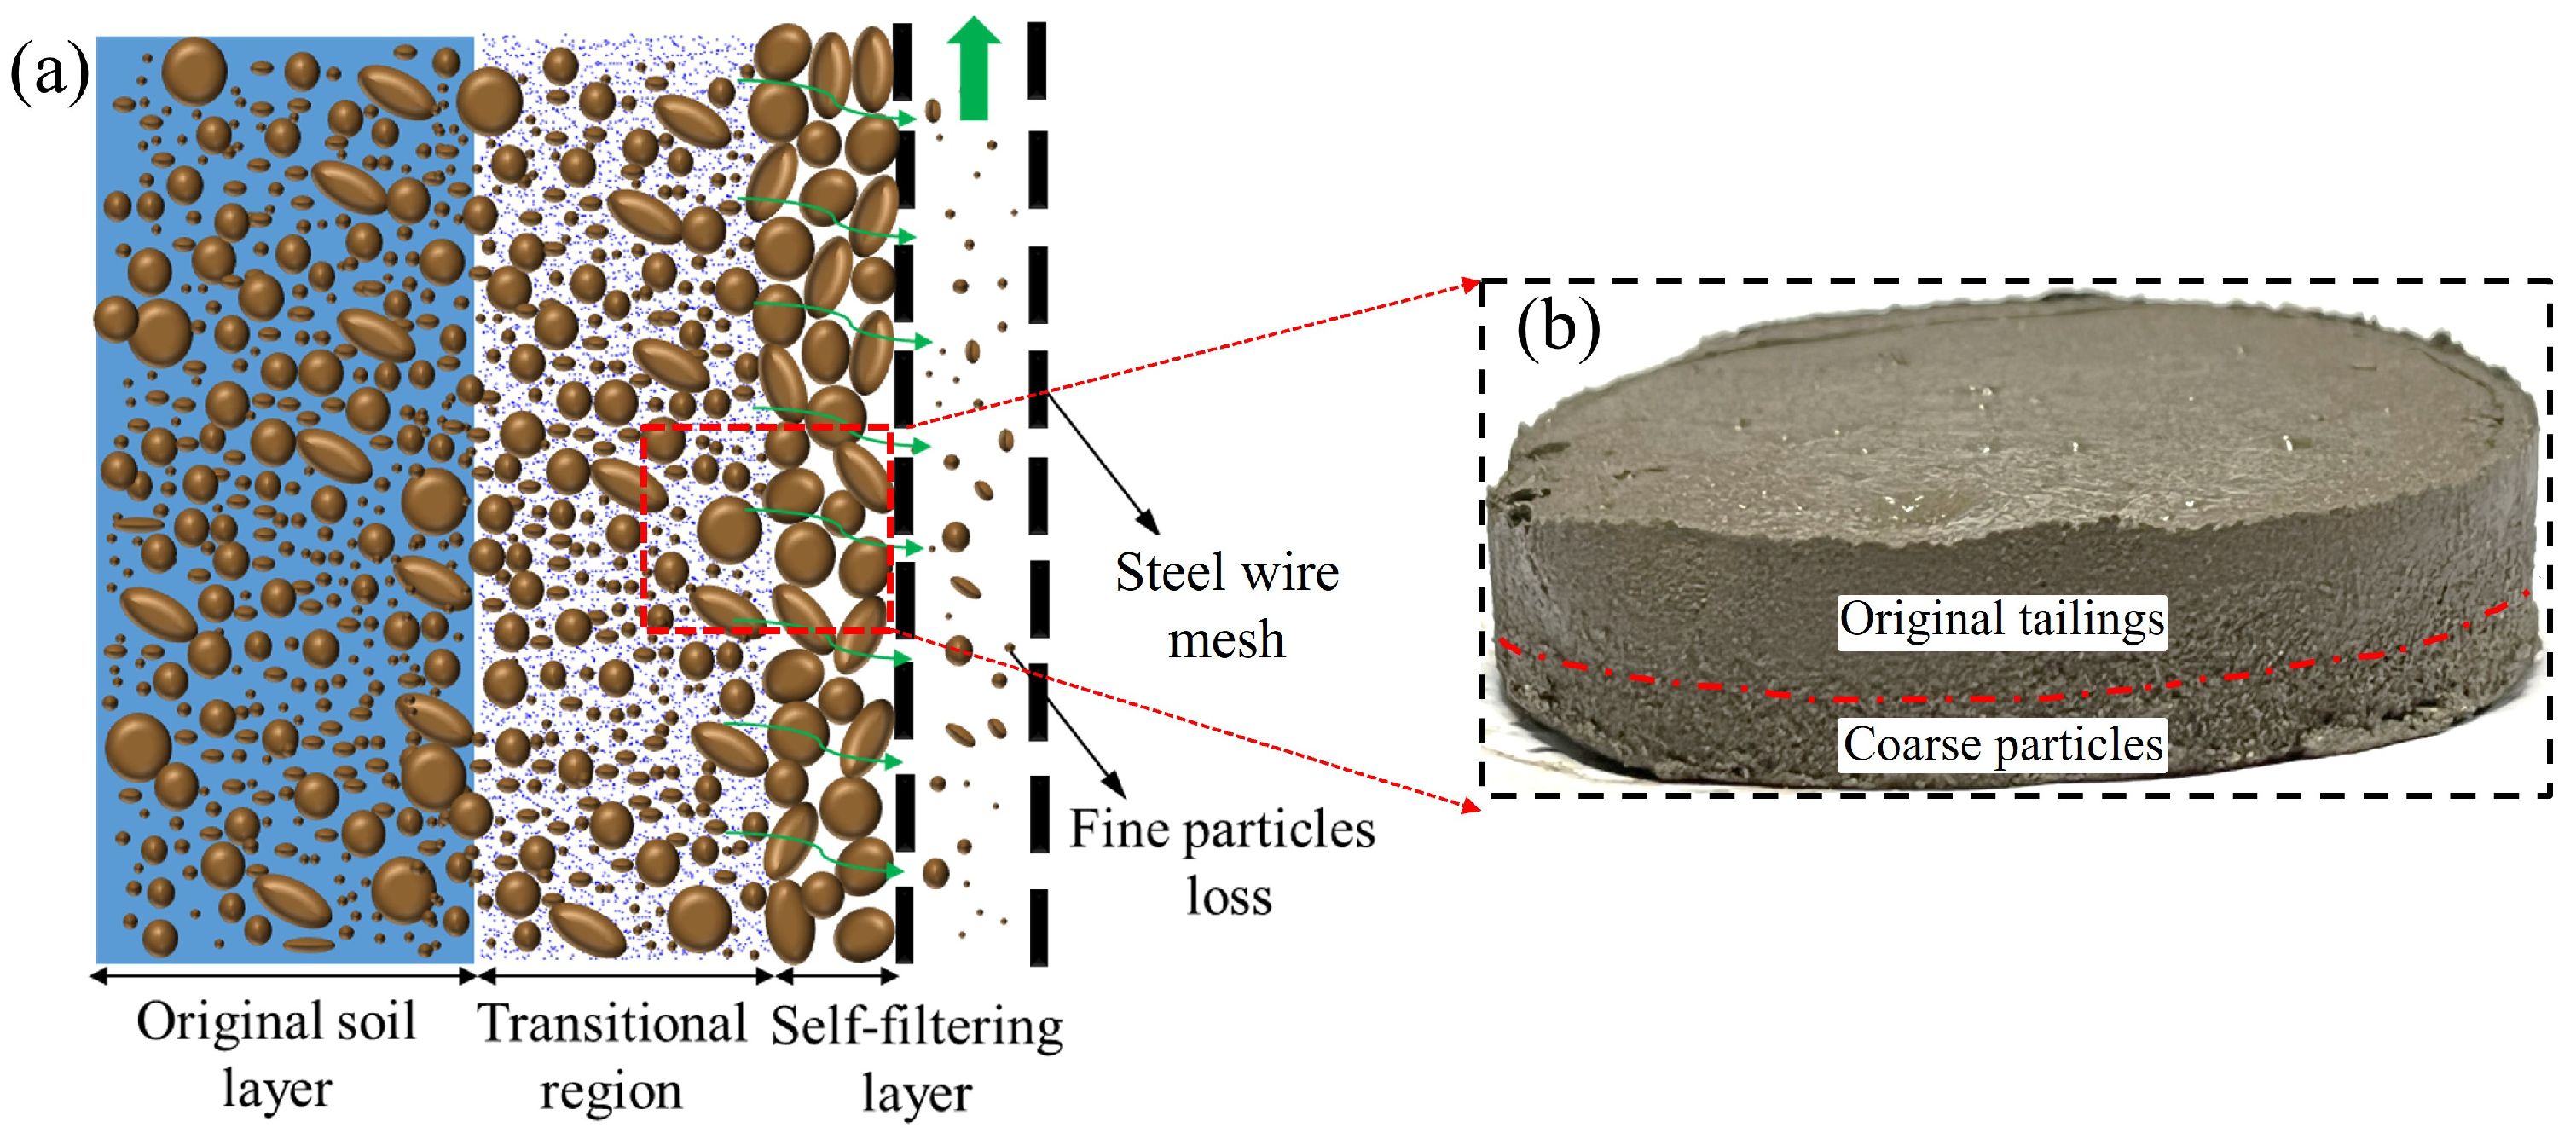
The self-filtering layer is formed by a coarse sand layer with a certain thickness due to the fine particles being washed out under hydraulic action, as shown in Figure 5a. This structure is reproduced in the shear tests by dividing the tailing specimen into upper and lower parts, the upper part consisting of the original tailing and the lower part consisting of coarse particles, illustrated in Figure 5b. The steel wire mesh selected has an aperture size of 0.18 mm, indicating that particles finer than this dimension are carried away by seepage. Particles larger than the mesh aperture serve as skeletal particles, constituting the self-filtering layer. The coarse tailings with particles larger than 118 µm are obtained using a 0.18 mm standard sieve.
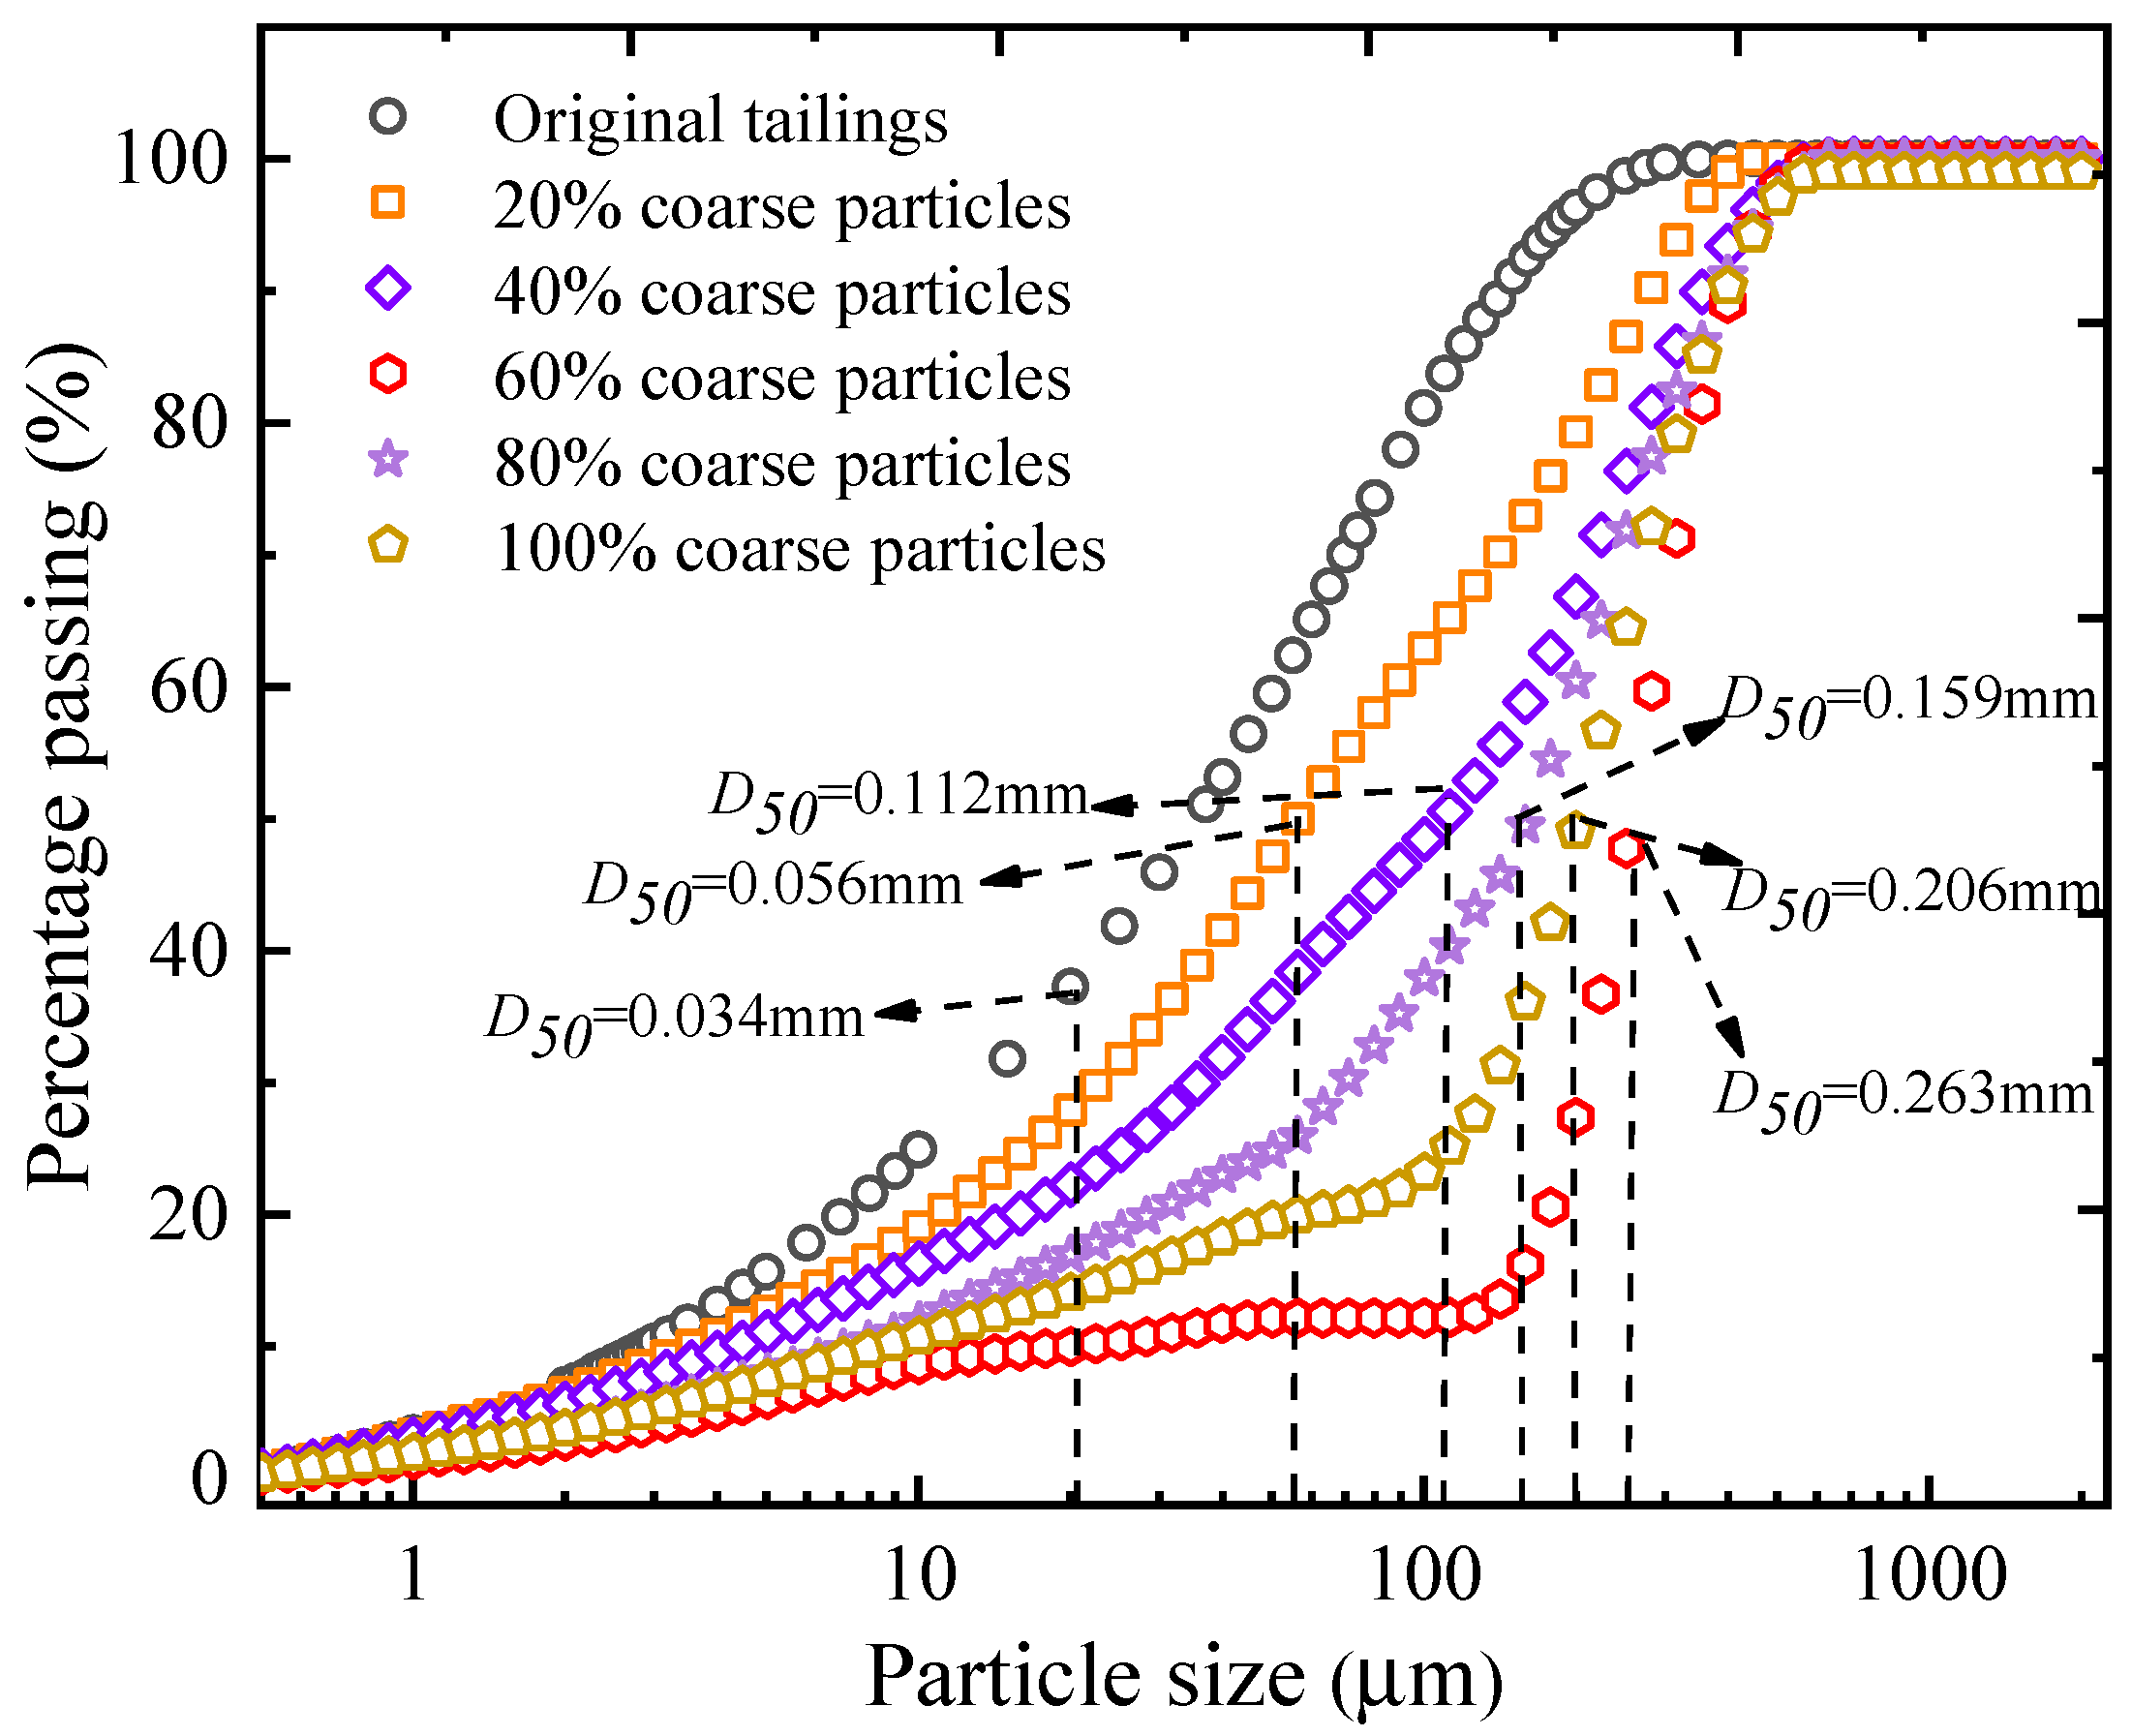
Furthermore, the loss of fine particles is influenced by the hydraulic gradient, stress levels, and the properties of the tailings, that is, the coarse particle content in the filter layer is not uniform. This study addresses the heterogeneity of the self-filtering layer by regulating the mass ratio of coarse particles (≥118 µm) in the lower segment of the specimen. The proportions of coarse particles in lower-part tailings are varied as 0%, 20%, 40%, 60%, 80%, and 100% to study the effect of the self-filtering layer. The particle size distribution curves of tailings with varying proportions of coarse particles are depicted in Figure 6. The median particle sizes of the six tailings (D50) are 0.034 mm (0%), 0.056 mm (20%), 0.112 mm (40%), 0.159 mm (60%), 0.206 mm (80%), 0.263 mm (100%), respectively, which are used to quantitatively describe the effect of the self-filtering layer in the following.
The sample is prepared within a consolidation ring measuring 61.8 mm in diameter and 20 mm in height. The interior surface of the ring is thinly coated with Vaseline. Water is then added separately to the coarse tailings and the original tailings to achieve the desired moisture content, using a sprayer. Subsequently, alternating layers of 30 g coarse tailings and 50 g original tailings are sequentially deposited into the ring and compacted using a compaction device to achieve the target density. Finally, the specimen is removed from the mold, wrapped in multiple layers of plastic film, and left undisturbed for 24 h to ensure even distribution of water throughout the tailings sample.

2.4. Testing Program

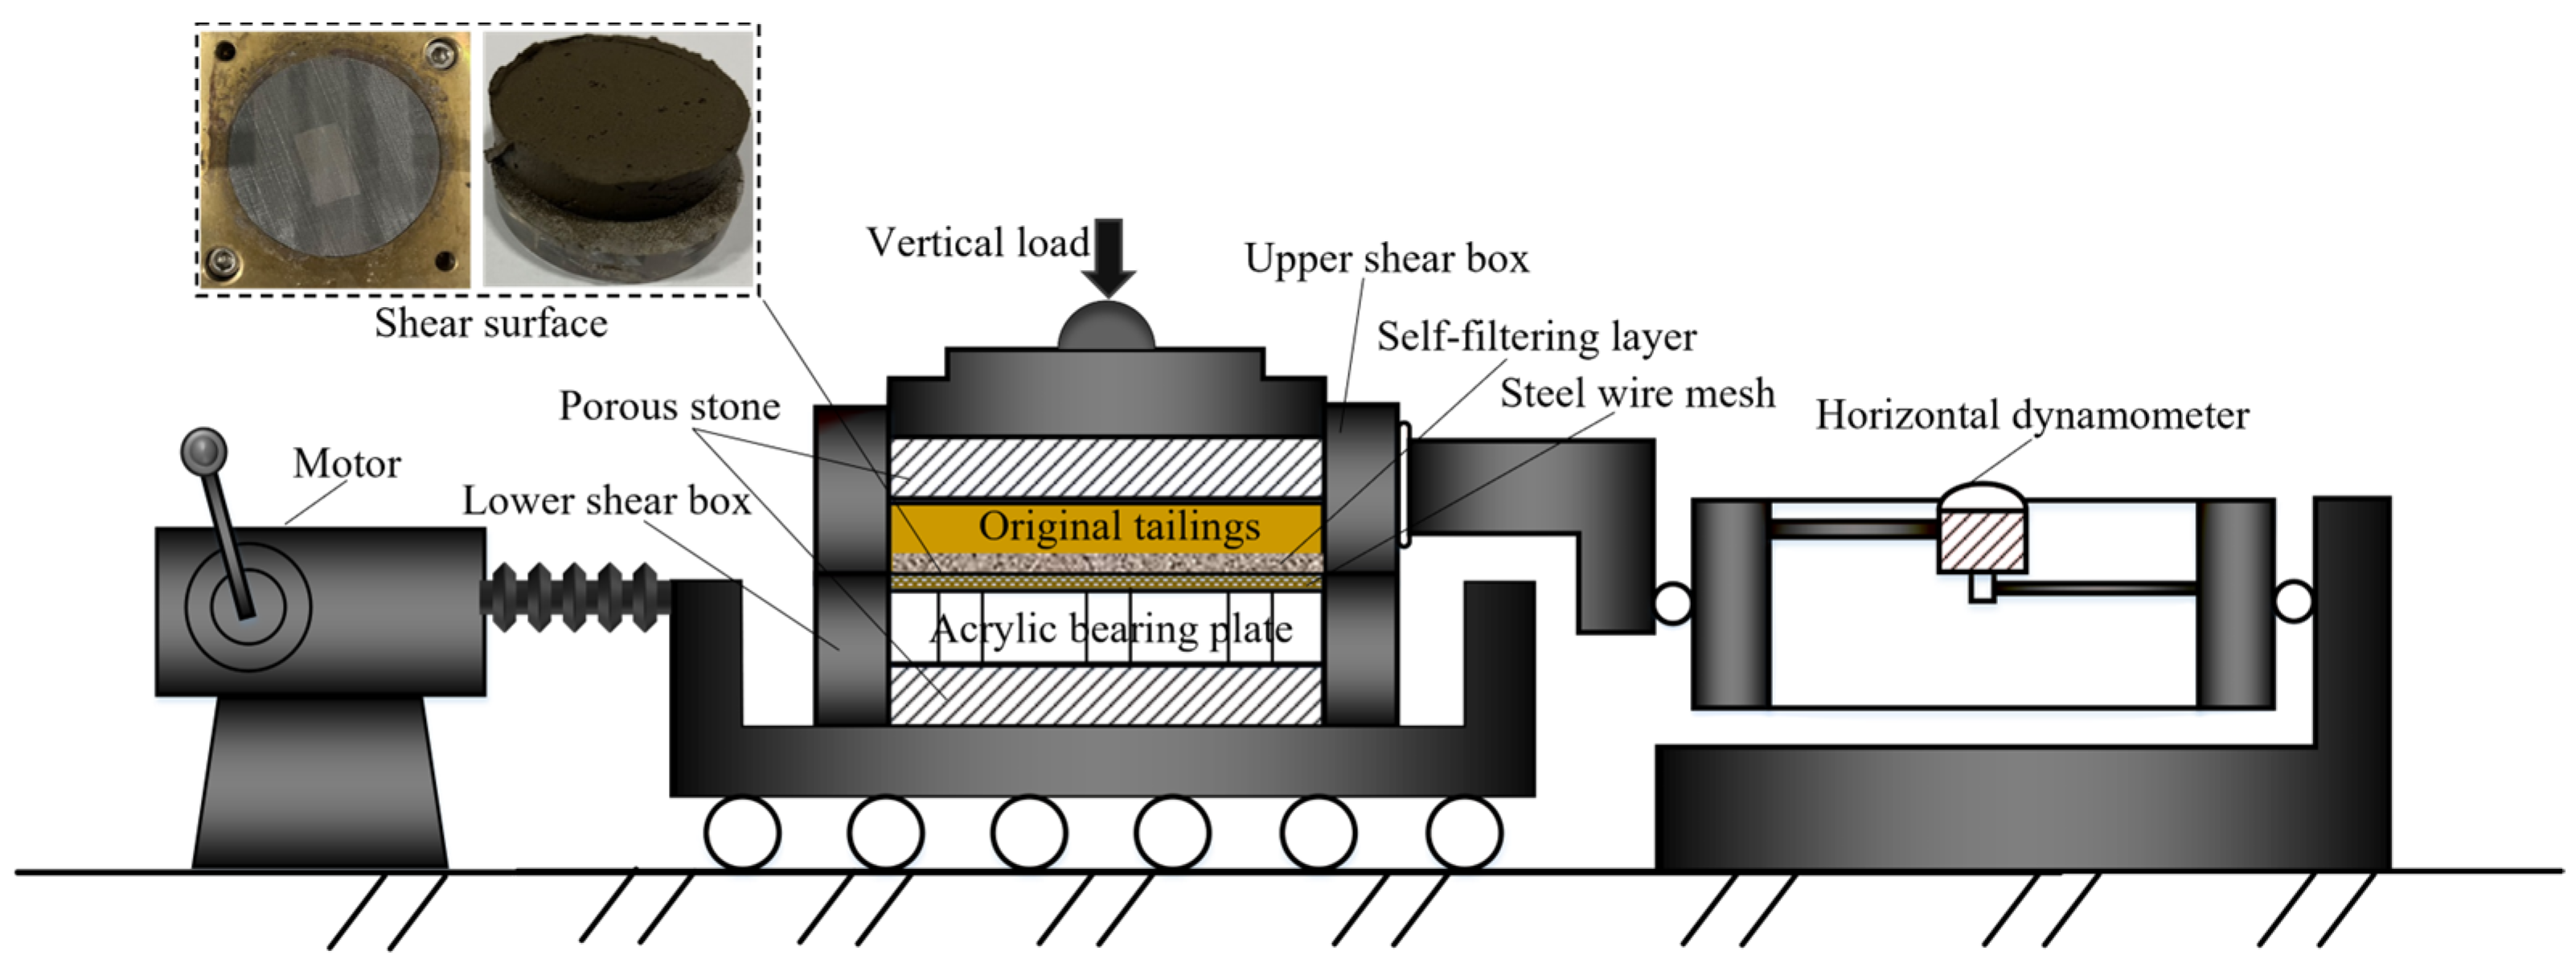
The strain-controlled direct shear testing apparatus is employed to assess the influence of a self-filtering layer on the interfacial shearing behavior between tailing and a steel wire mesh, as shown in Figure 7. The shear box comprises two components: the tailings specimen and an acrylic bearing plate equipped with a steel wire mesh. Each component measures 61.8 mm in diameter and 10 mm in height. The steel wire mesh is positioned against the self-filtering layer of the tailings sample, which keeps flush with the contact surfaces of the upper and lower shear boxes. Permeable stones are placed at both the top and bottom of the shear box. According to code GB/T50123-2019 [36], the direct shear test at the interface is conducted under undrained conditions, maintaining a shear rate of 0.8 mm/min. During testing, the upper shear box remains stationary while the lower shear box moves horizontally until reaching a maximum shear displacement of 6 mm [37]. Additionally, shear stress and displacement data are recorded at 15 s intervals throughout the test.
To ensure controlled variables, the water content and density of the tailings specimen are maintained consistent, with the focus solely on analyzing the impact of the self-filtering layer of the tailing. The authors have devised a testing regimen encompassing five groups of the self-filtering layer, each with varying median particle sizes, alongside one control group devoid of a self-filtering layer. Each set of interfacial shearing experiments is executed under normal stresses of 100 kPa, 200 kPa, 300 kPa, and 400 kPa.

3. Experimental Result

3.1. Interface Shear Stress–Displacement Curve

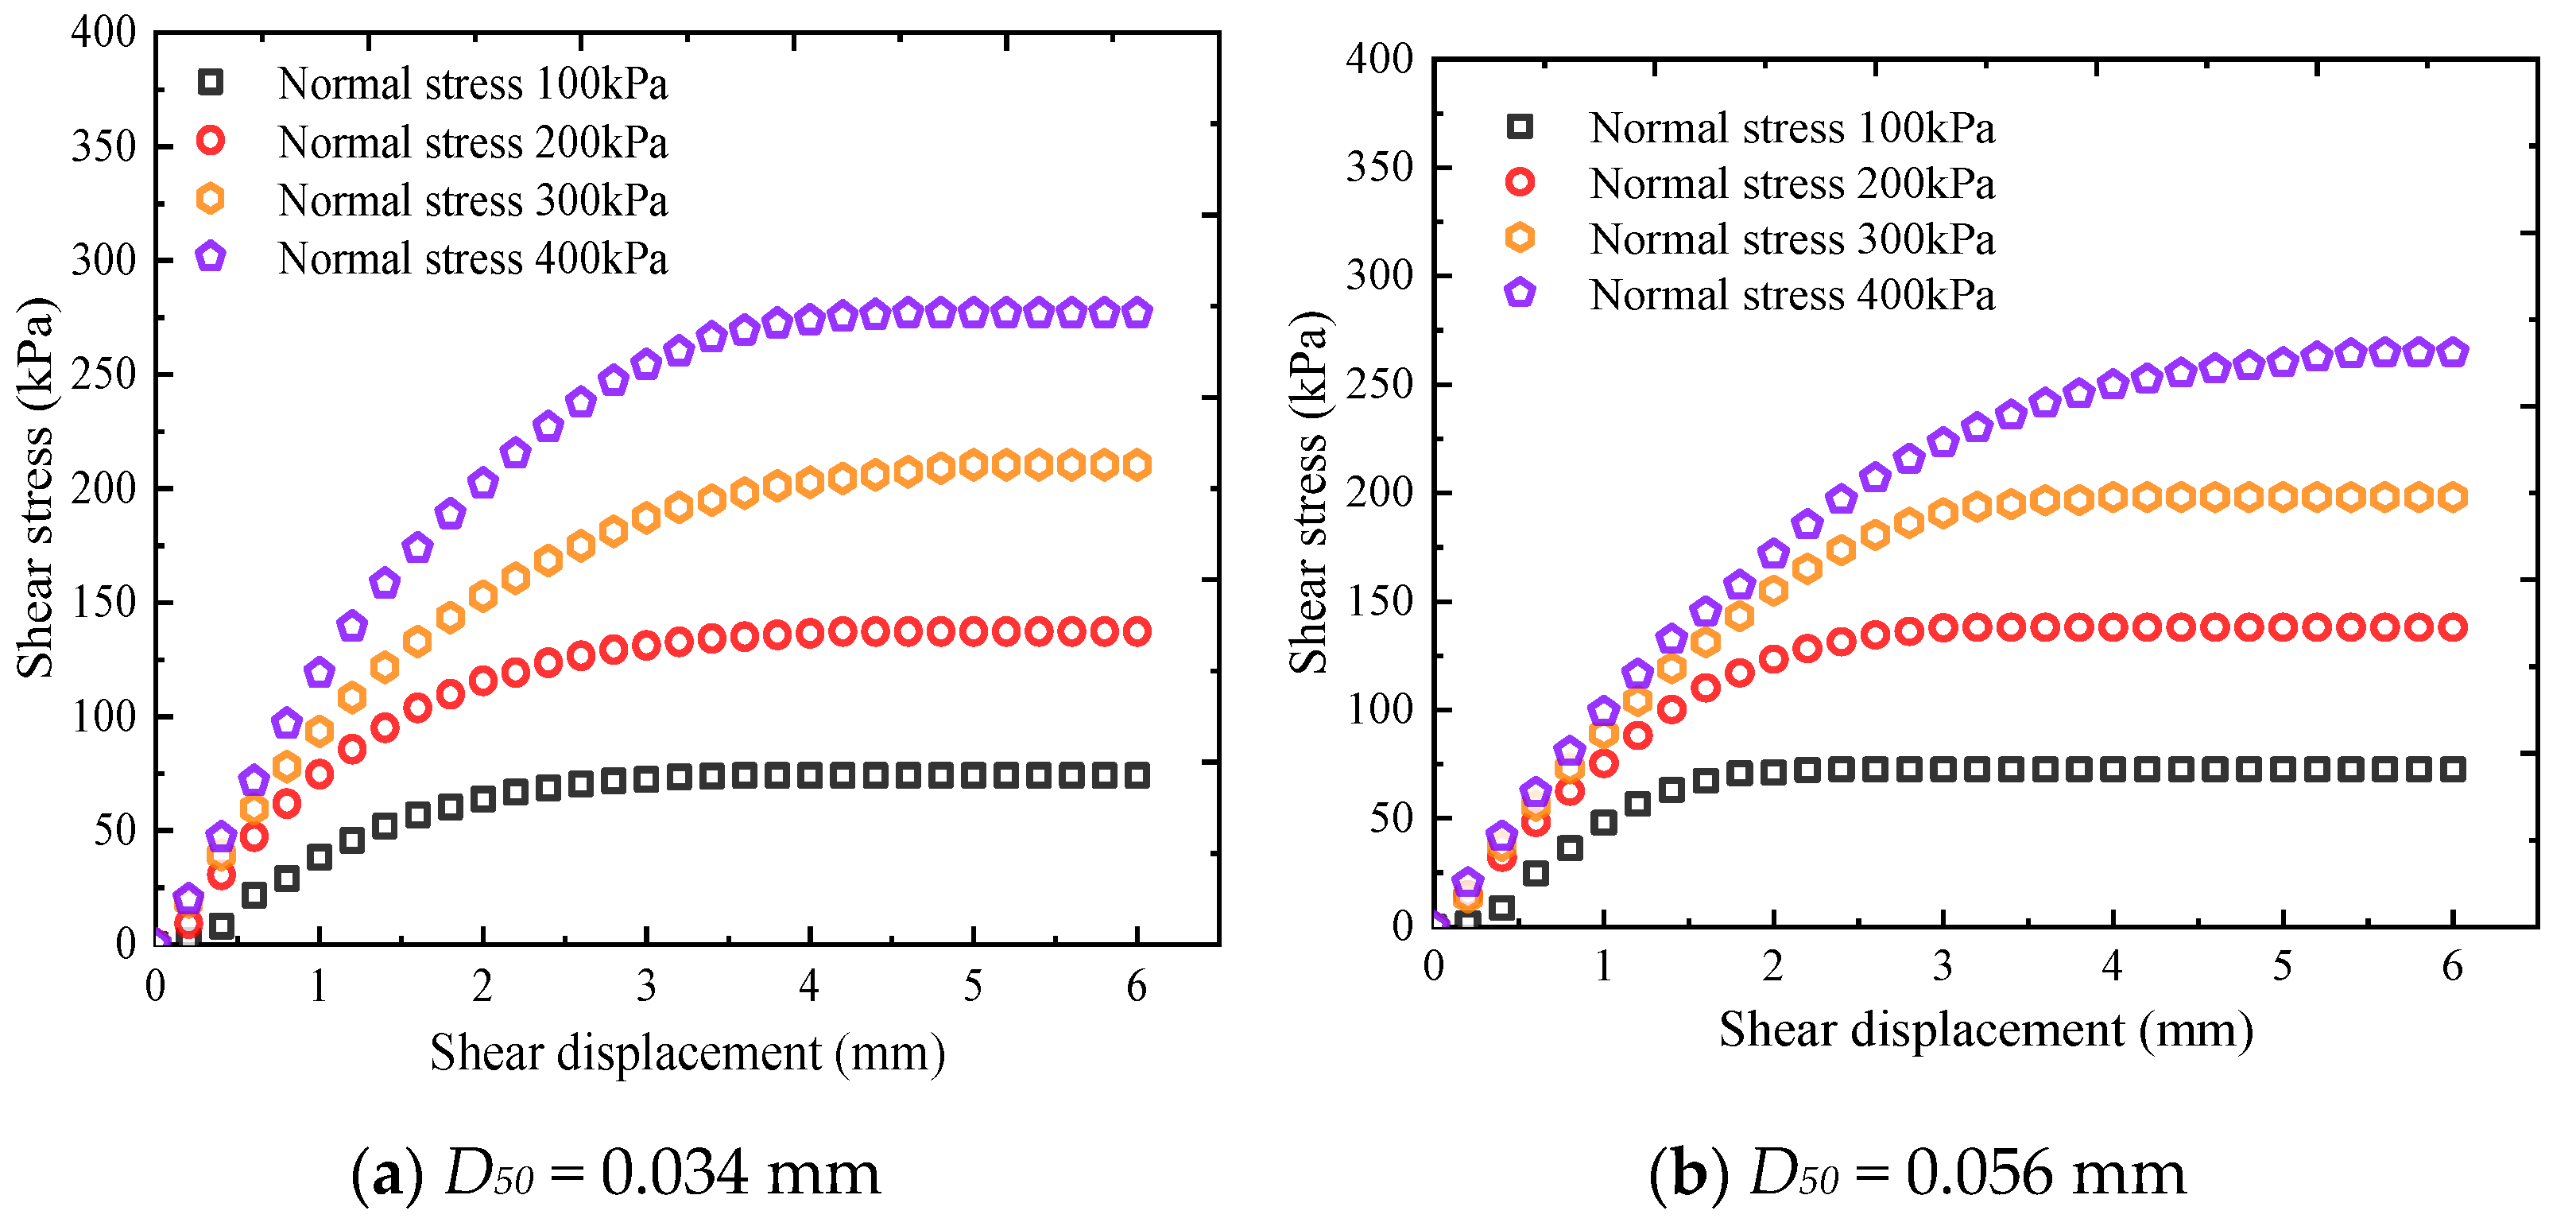
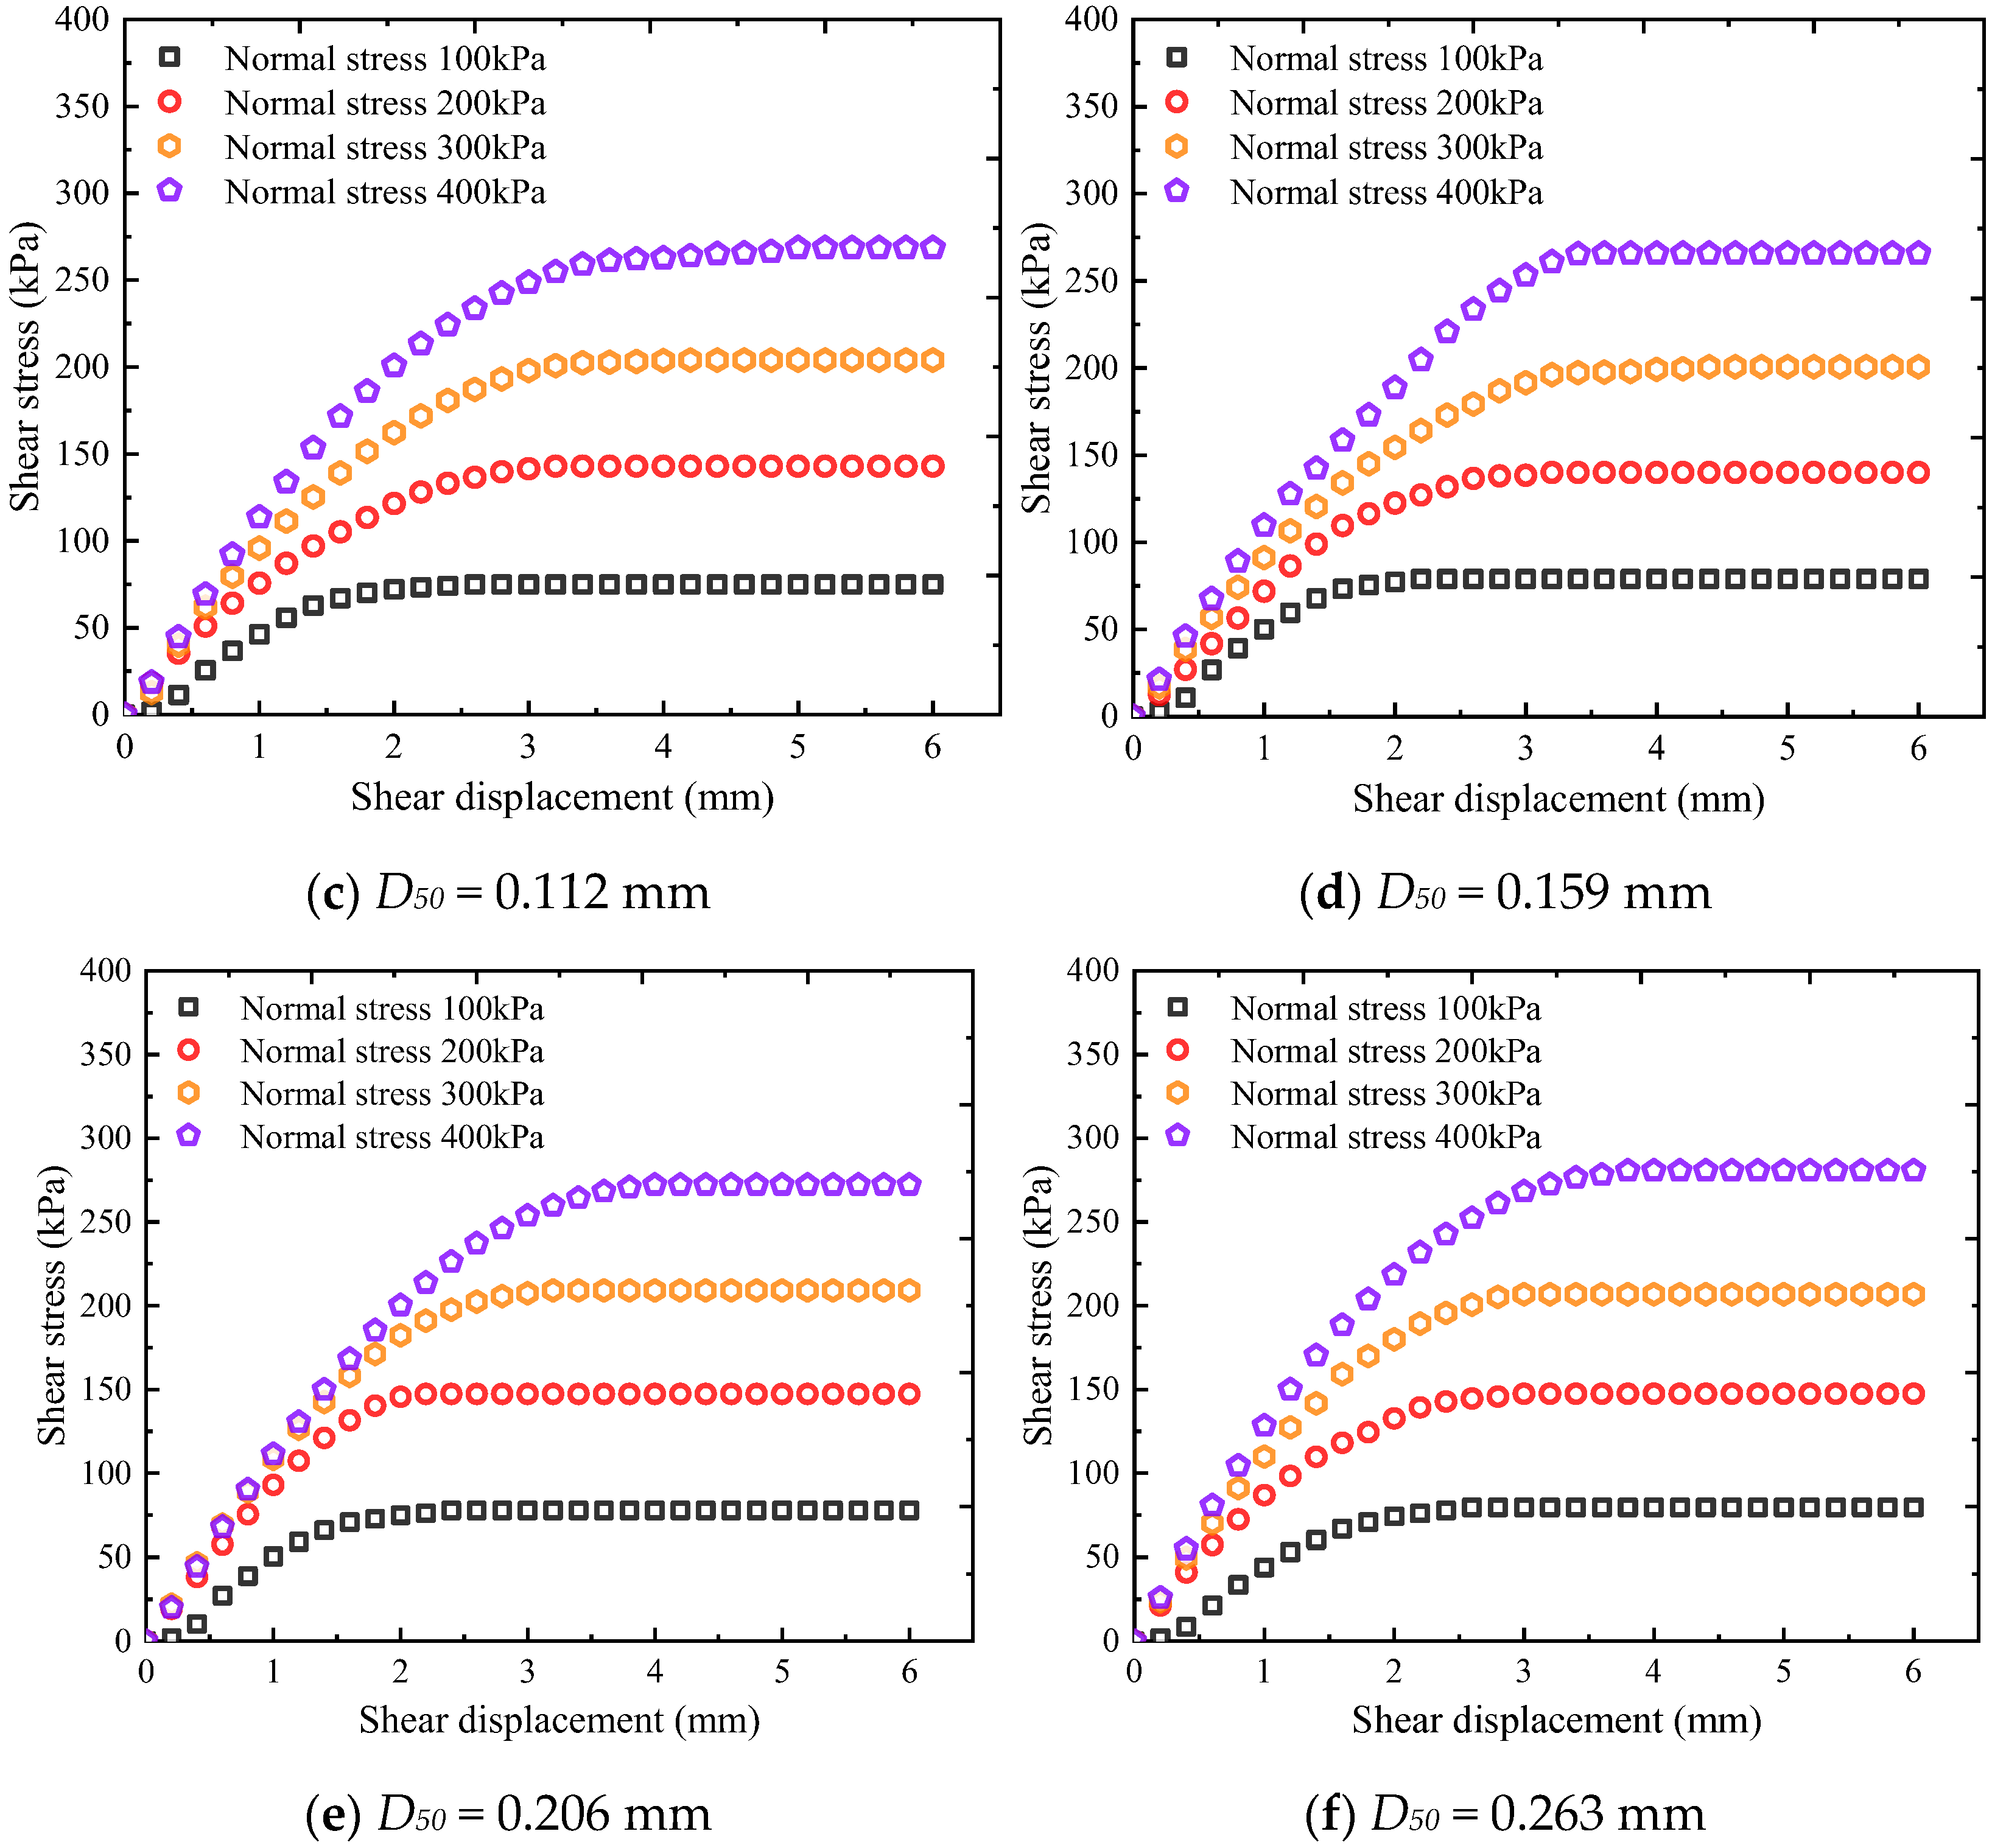
Figure 8 shows the shear stress–displacement curves of the tailings and steel wire mesh interface. These curves, which are mostly exponential, show that shear stress increases sharply with the shear displacement at the beginning of shearing load, gradually tends to flatter, and eventually remains approximately constant for any further increment in shear displacement. The interfacial shearing property of the tailings and steel wire mesh are notably affected by the normal stress, yet the characteristics of the interface shear stress–displacement curves remain unchanged. Despite an increase in coarse particles leading to higher porosity in the tailings, there is no observed softening phenomenon as reported by Vangla and Latha [38]. This is because the friction effect of the interface increases with the coarse particle content, resulting in more significant hardening properties of the interface. In addition, the interfacial shearing strength can always be defined as the peak value during the tests.

3.2. The Interlocking Mechanism

A close-up view of the tailings–steel wire mesh interface inspected by a camera after the tests is shown in Figure 9. The shear surface is basically flush with the contact surface between tailing specimen and steel wire mesh, which affirms that the failure of shearing experiments in this study happens on the contact surface. Examination of the shear plane reveals that failure still occurs on the contact surface. Furthermore, as the median particle size increases, both the shear surface of the tailings and the steel wire mesh become progressively cleaner, with a reduced presence of tailing particles embedded within the mesh.
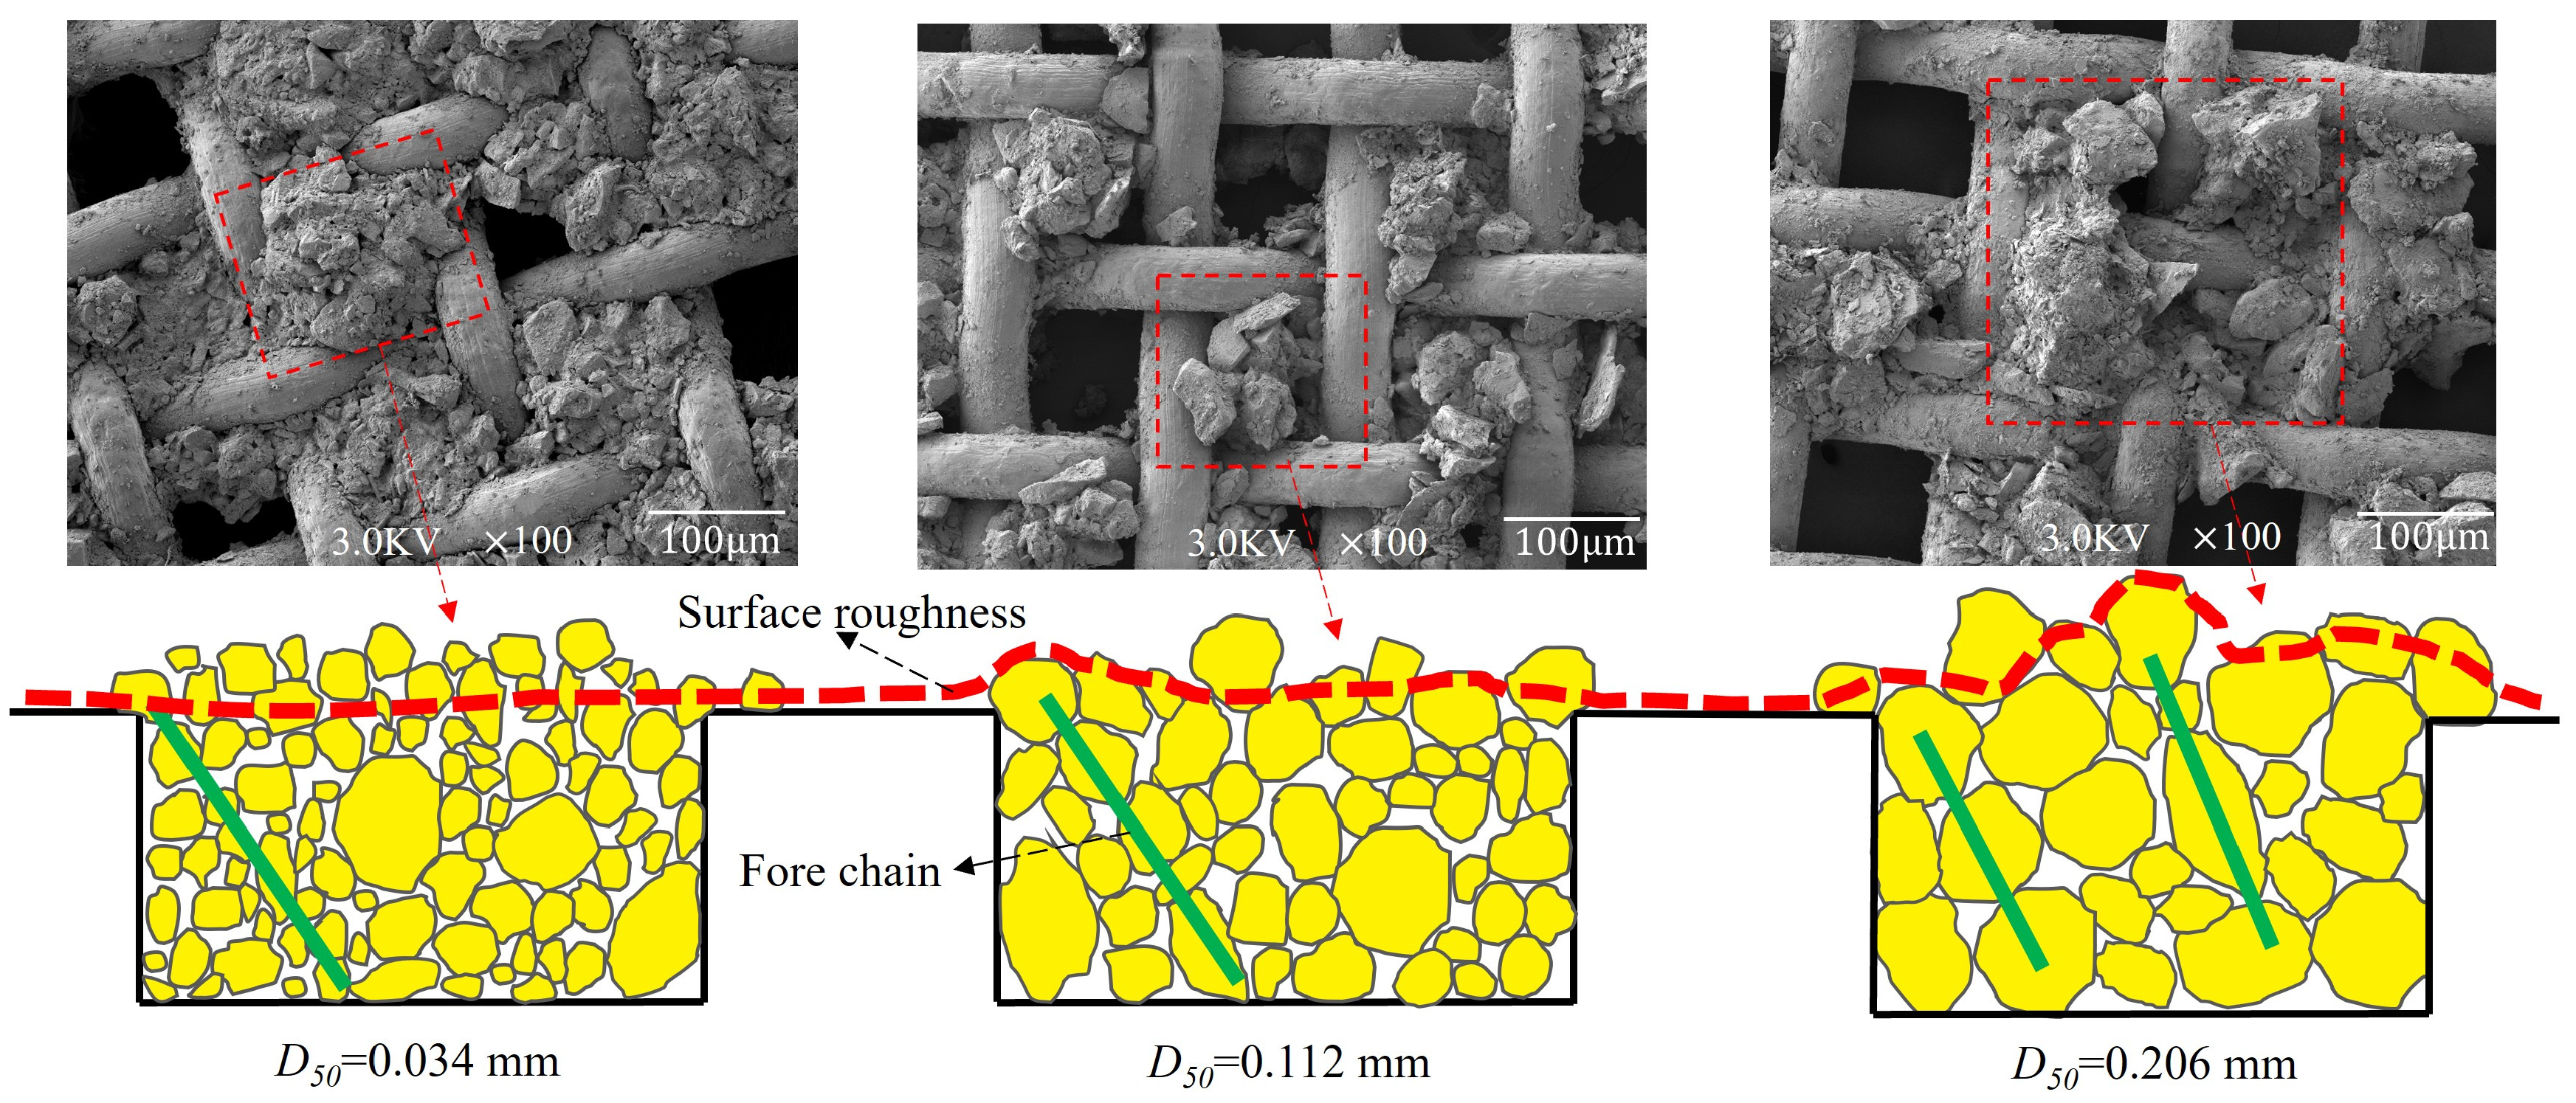
The interface shear strength of the tailings–steel wire mesh is determined through the interlocking effect [39]. Figure 10 presents a microstructural representation of the interlocking among three different particle sizes of tailings and the steel wire mesh. Tailings of D50 = 0.034 mm have a greater number of particles fitting into the mesh, whereas tailings of D50 = 0.112 mm and D50 = 0.206 mm have partial particles or a single particle fitting into the mesh. The transfer path of the force chain decreases with increasing median particle size, thereby enhancing the interlocking effect. Similarly, the roughness of the contact surface increases with D50, naturally boosting the interlocking effect. These results corroborate the findings of Vangla and Gali [40].

3.3. Shear Strength and Strength Parameters

The peak shear stress is determined as the interface shear strength. Figure 11 shows the strength envelope curve of the interface between tailings and steel wire mesh. The linear fitting curve results indicate adherence to the Mohr–Coulomb shear failure criterion in the relationship between normal stress and shear strength at the tailings and steel wire mesh interface. As the normal stress escalates from 100 kPa to 400 kPa, the shear strength at this interface exhibits varying degrees of increase. Under a normal stress of 400 kPa, the shear strength of the interface with a median particle size (D50) of 0.263 mm increases by 11.4% compared to that with a D50 of 0.034 mm. Moreover, a larger D50 corresponds to a steeper slope of the fitting line, suggesting that the rate of increase in shear strength rises with the median particle size under increasing normal stress.
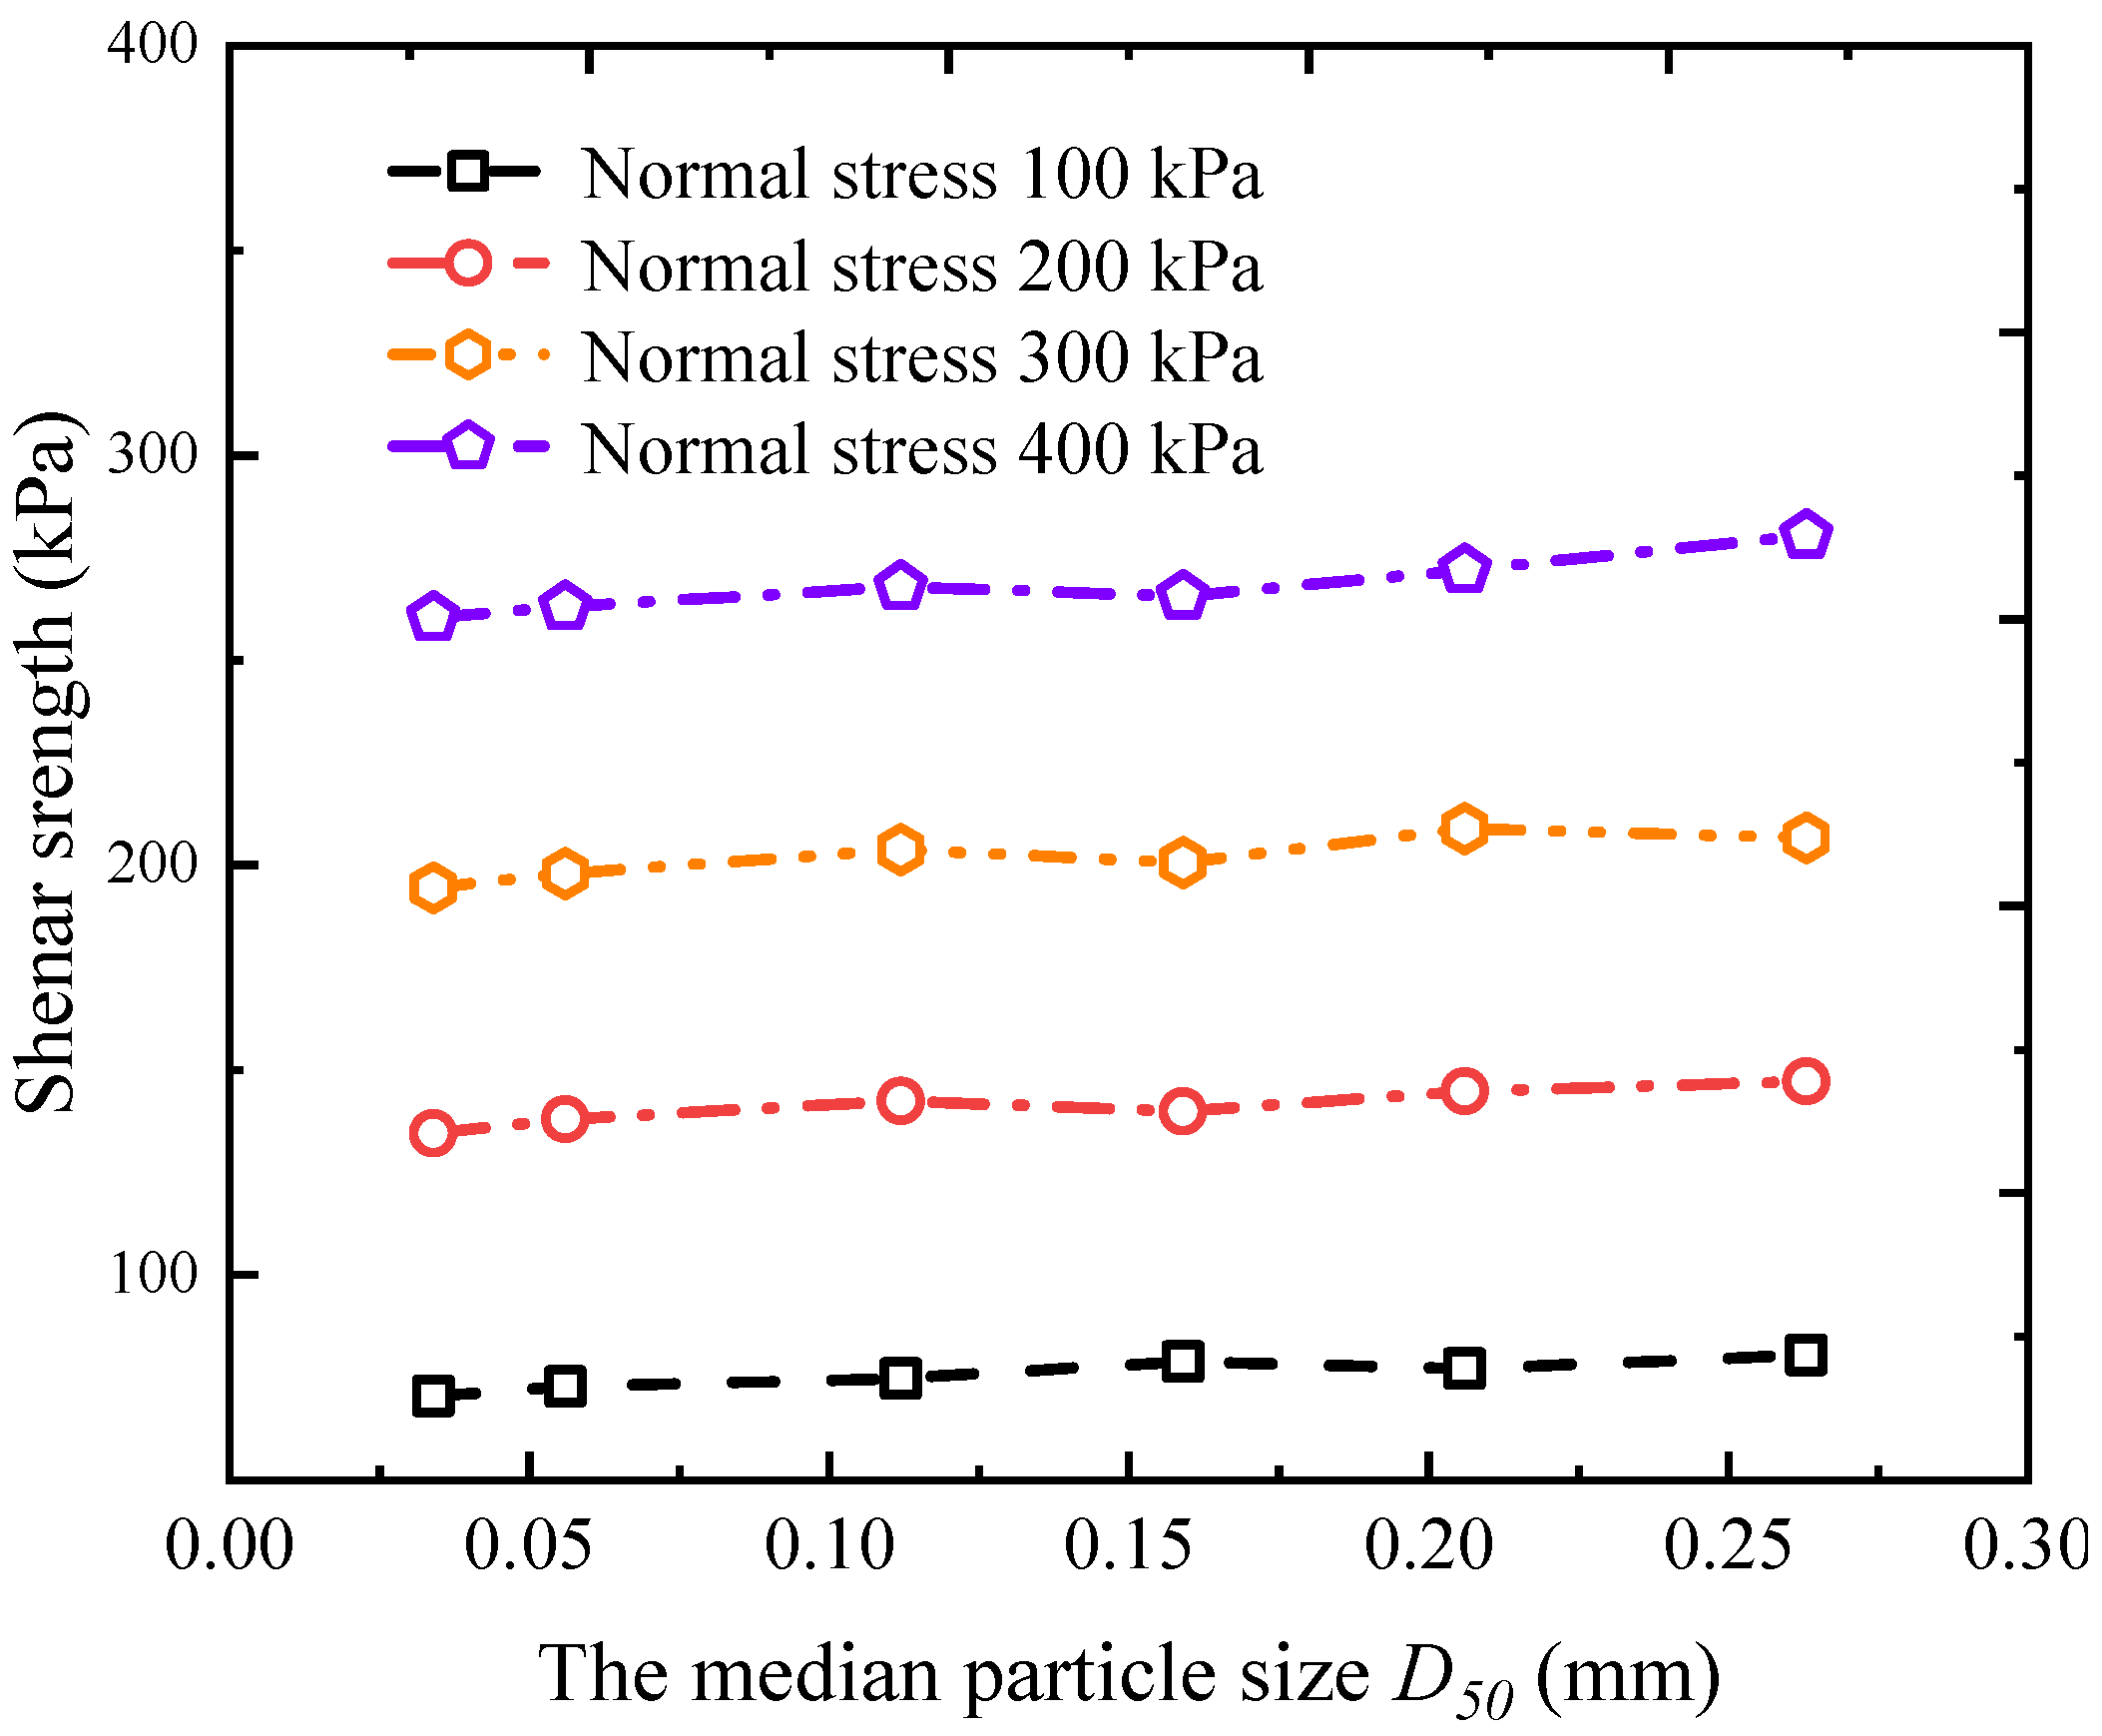
The variation of shear strength with median particle size of a self-filtering layer is plotted in Figure 12. It can be found that the shear strength almost increases with median particle size. Namjoo [41] demonstrated that the angularity of sands correlates positively with the median particle size, leading to enhanced peak shear strength attributed to heightened surface roughness. Moreover, across varying normal stresses, the trend of increasing shear strength with median particle size remains largely consistent. It is deduced that normal stress minimally influences the variation trend of shear strength concerning median particle size.
The variation of interfacial cohesion c and interfacial friction coefficient f with median particle size of the self-filtering layer is plotted in Figure 13. When the D50 reaches 0.263 mm, the interfacial friction coefficient increases by 17.2%, while the interfacial cohesion decreases by 73.5%. Specifically, as the median particle size increases, the interface between tailings and steel wire mesh becomes rougher, leading to a higher friction coefficient. Simultaneously, the porosity between particles increases with the median particle size, reducing the contact area between tailings and steel wire mesh. As a macroscopic indicator of the mutual attraction between tailings and the steel wire mesh interface, interfacial cohesion decreases with the diminishing contact area.

4. Interface Constitutive Model

4.1. Exponential Model

An appropriate constitutive model can reflect the stress and deformation law of the soil–reinforcement interface, and the reliability of the engineering design is closely related to the selected constitutive [42]. The shear loading–displacement curve in Figure 8 exhibits the strain-hardening behavior and obvious peak shear strength. Therefore, the exponential function model is used as the shear constitutive model for the tailing–steel wire mesh interface, which is expressed in the following form:
τ = a ( 1 exp ( b × u ) )
where τ is the shearing stress, u is the shear displacement, and a and b are fitting parameters.
According to Equation (1), the peak shear strength can be obtained when the shear displacement reaches infinity:
τ u | u = a
The shear stiffness ks of the interface is defined as the ratio of the shear stress τ to the corresponding shear-displacement amplitude u. The initial shear stiffness ksi can be obtained when the shear displacement reaches zero:
k s i | u 0 = a b exp ( b × u ) = a b
The relationship of initial shear modulus ksi and peak shear strength τu, respectively, with normal stress σn has been established by Clough and Duncan [43]:
k s i = K γ w ( σ n P a ) n
τ u = τ f R f = σ n tan φ R f K γ w ( σ n P a ) n
where K, n, and Rf are nonlinear indicators; φ is interfacial friction angle; γw is the bulk density of water; and Pa is atmospheric pressure.
Substituting Equations (4) and (5) into Equation (1) yields:
τ = σ n tan φ R f K γ w ( σ n P a ) n ( 1 exp ( R f σ n tan φ u ) )
Derivation of both ends of Equation (6) gives:
k s = b ( σ n tan φ R f K γ w ( σ n P a ) n τ )

4.2. Fitting Result

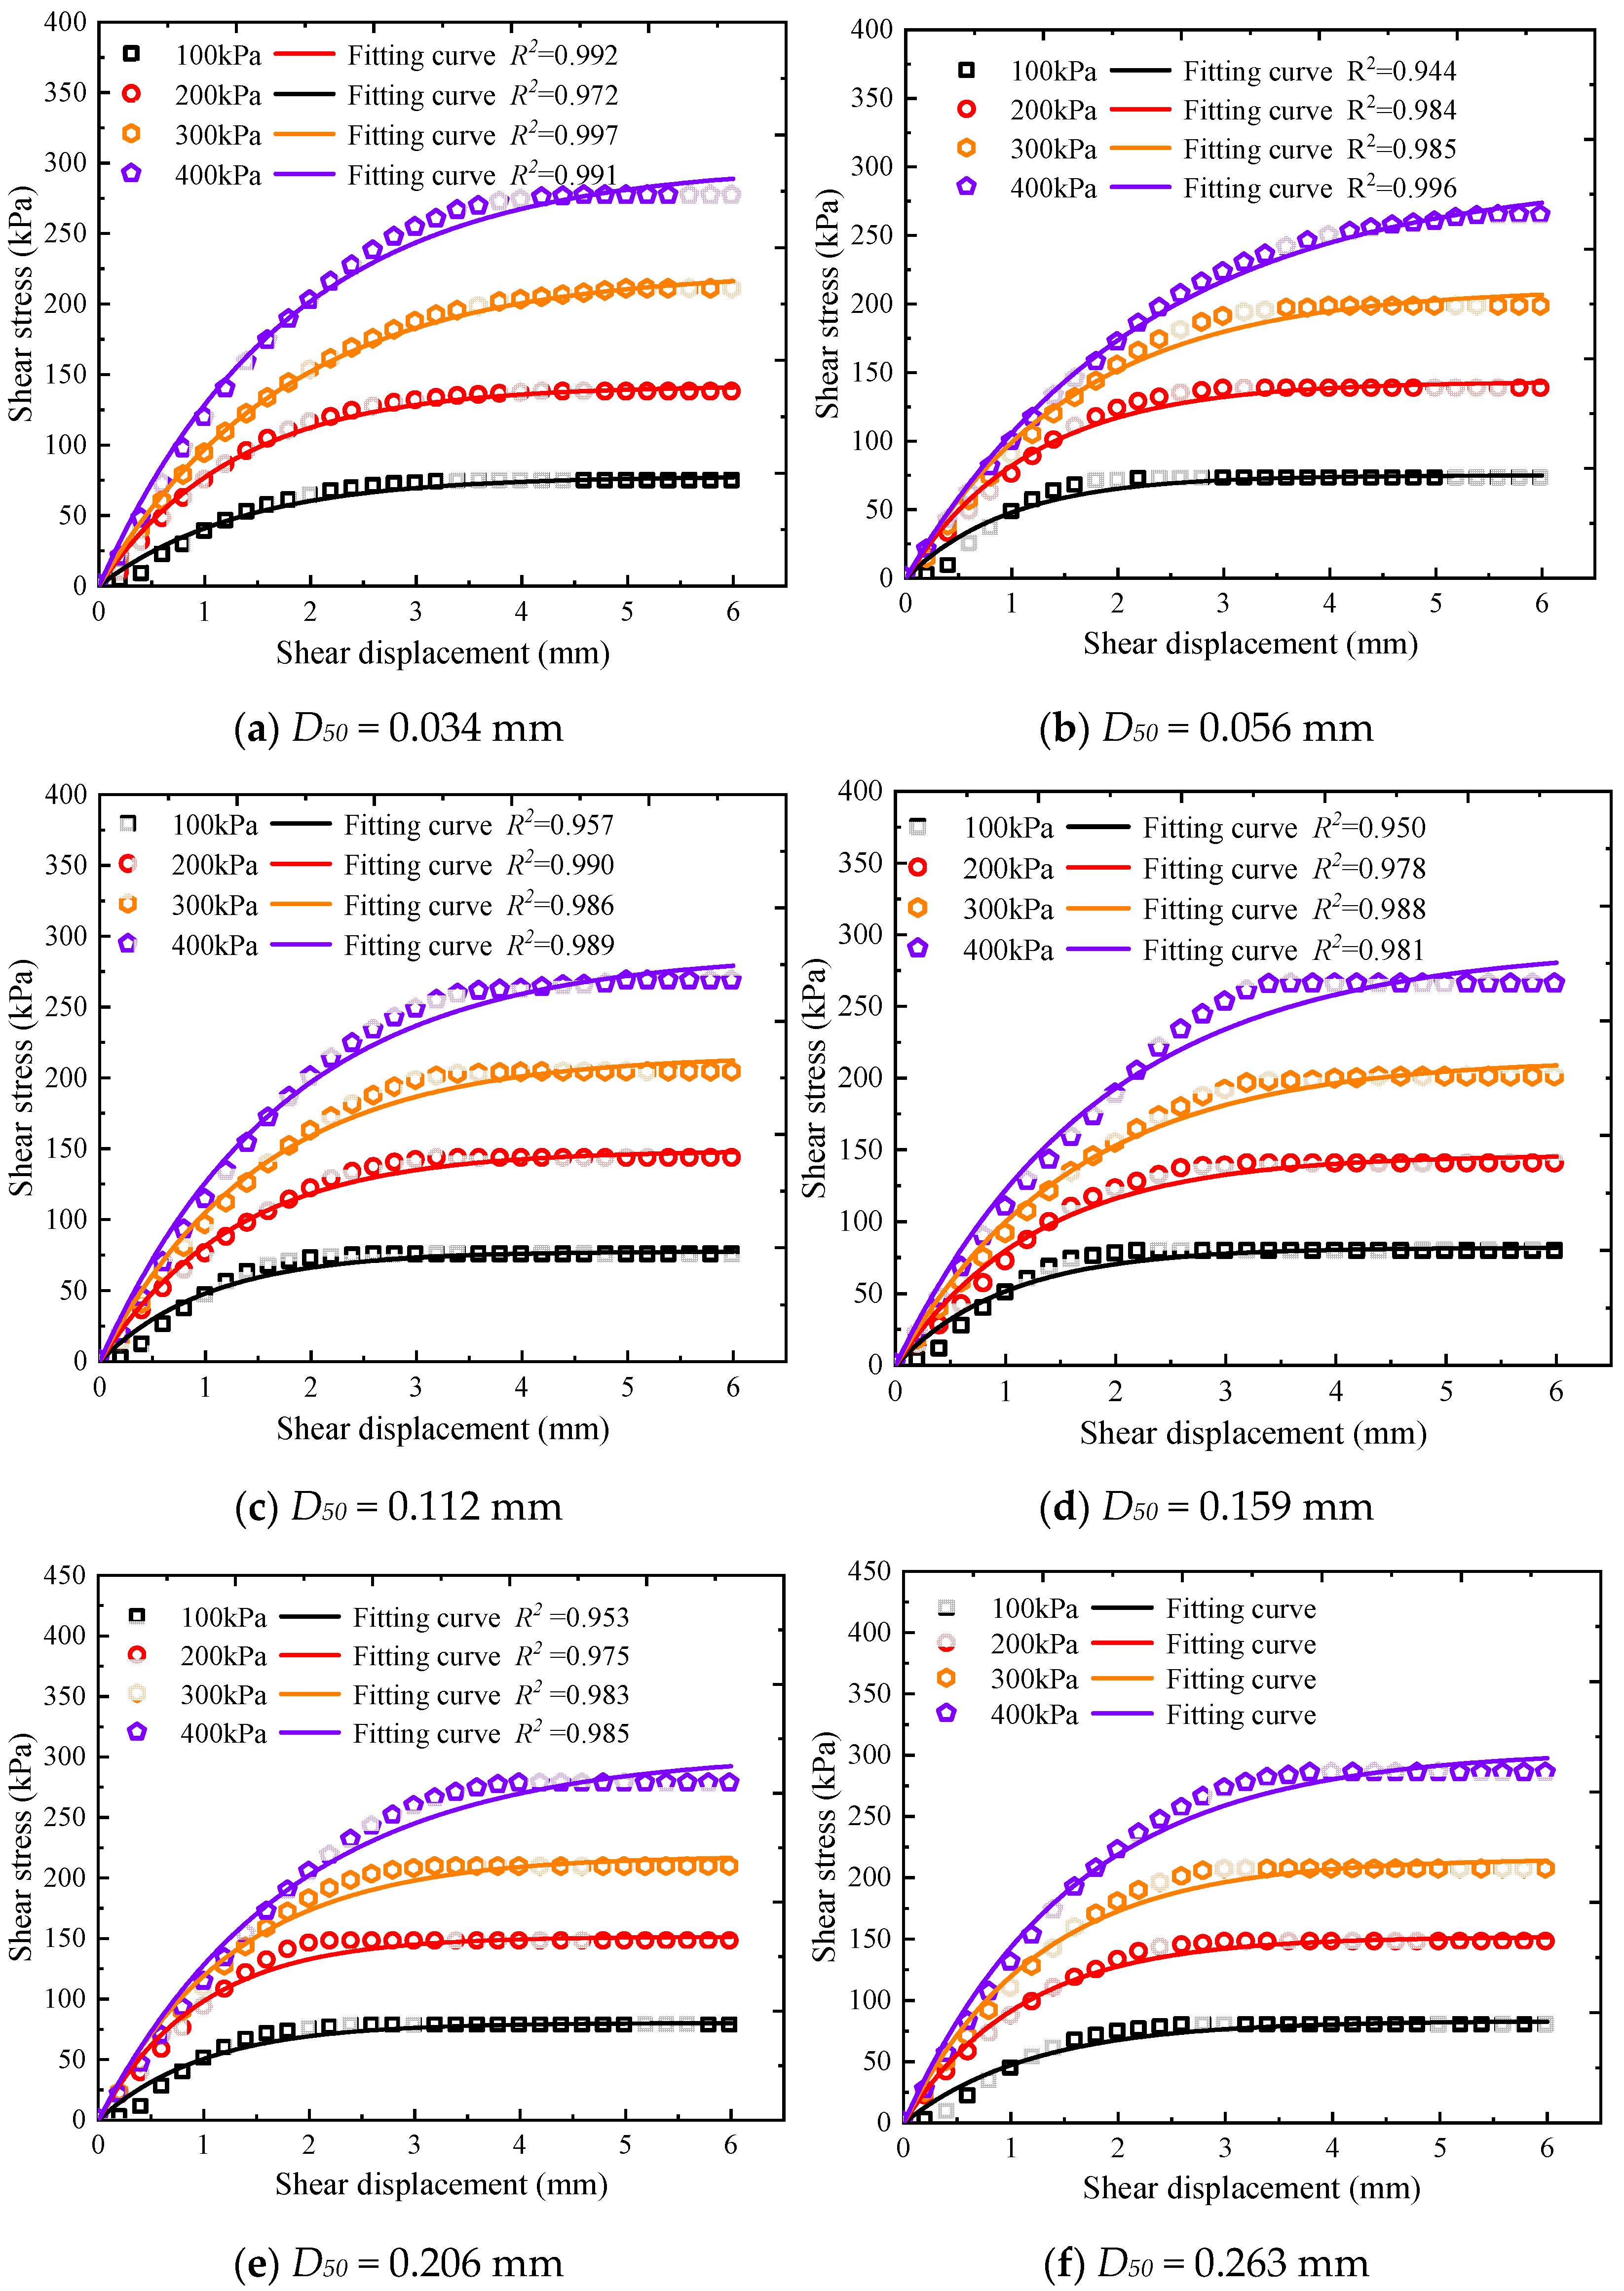
Figure 14 shows the comparison between the curve fitted by the exponential model and the shear test results under 100 kPa~400 kPa normal stress. It can be seen that the results obtained by direct shear test are in good agreement with the fitted curves. The better fit means that the exponential model has a good ability to represent the shear stress–displacement relationship of the tailing–steel wire mesh interface, which can be used in further research with confidence.

4.3. Parameter Analysis

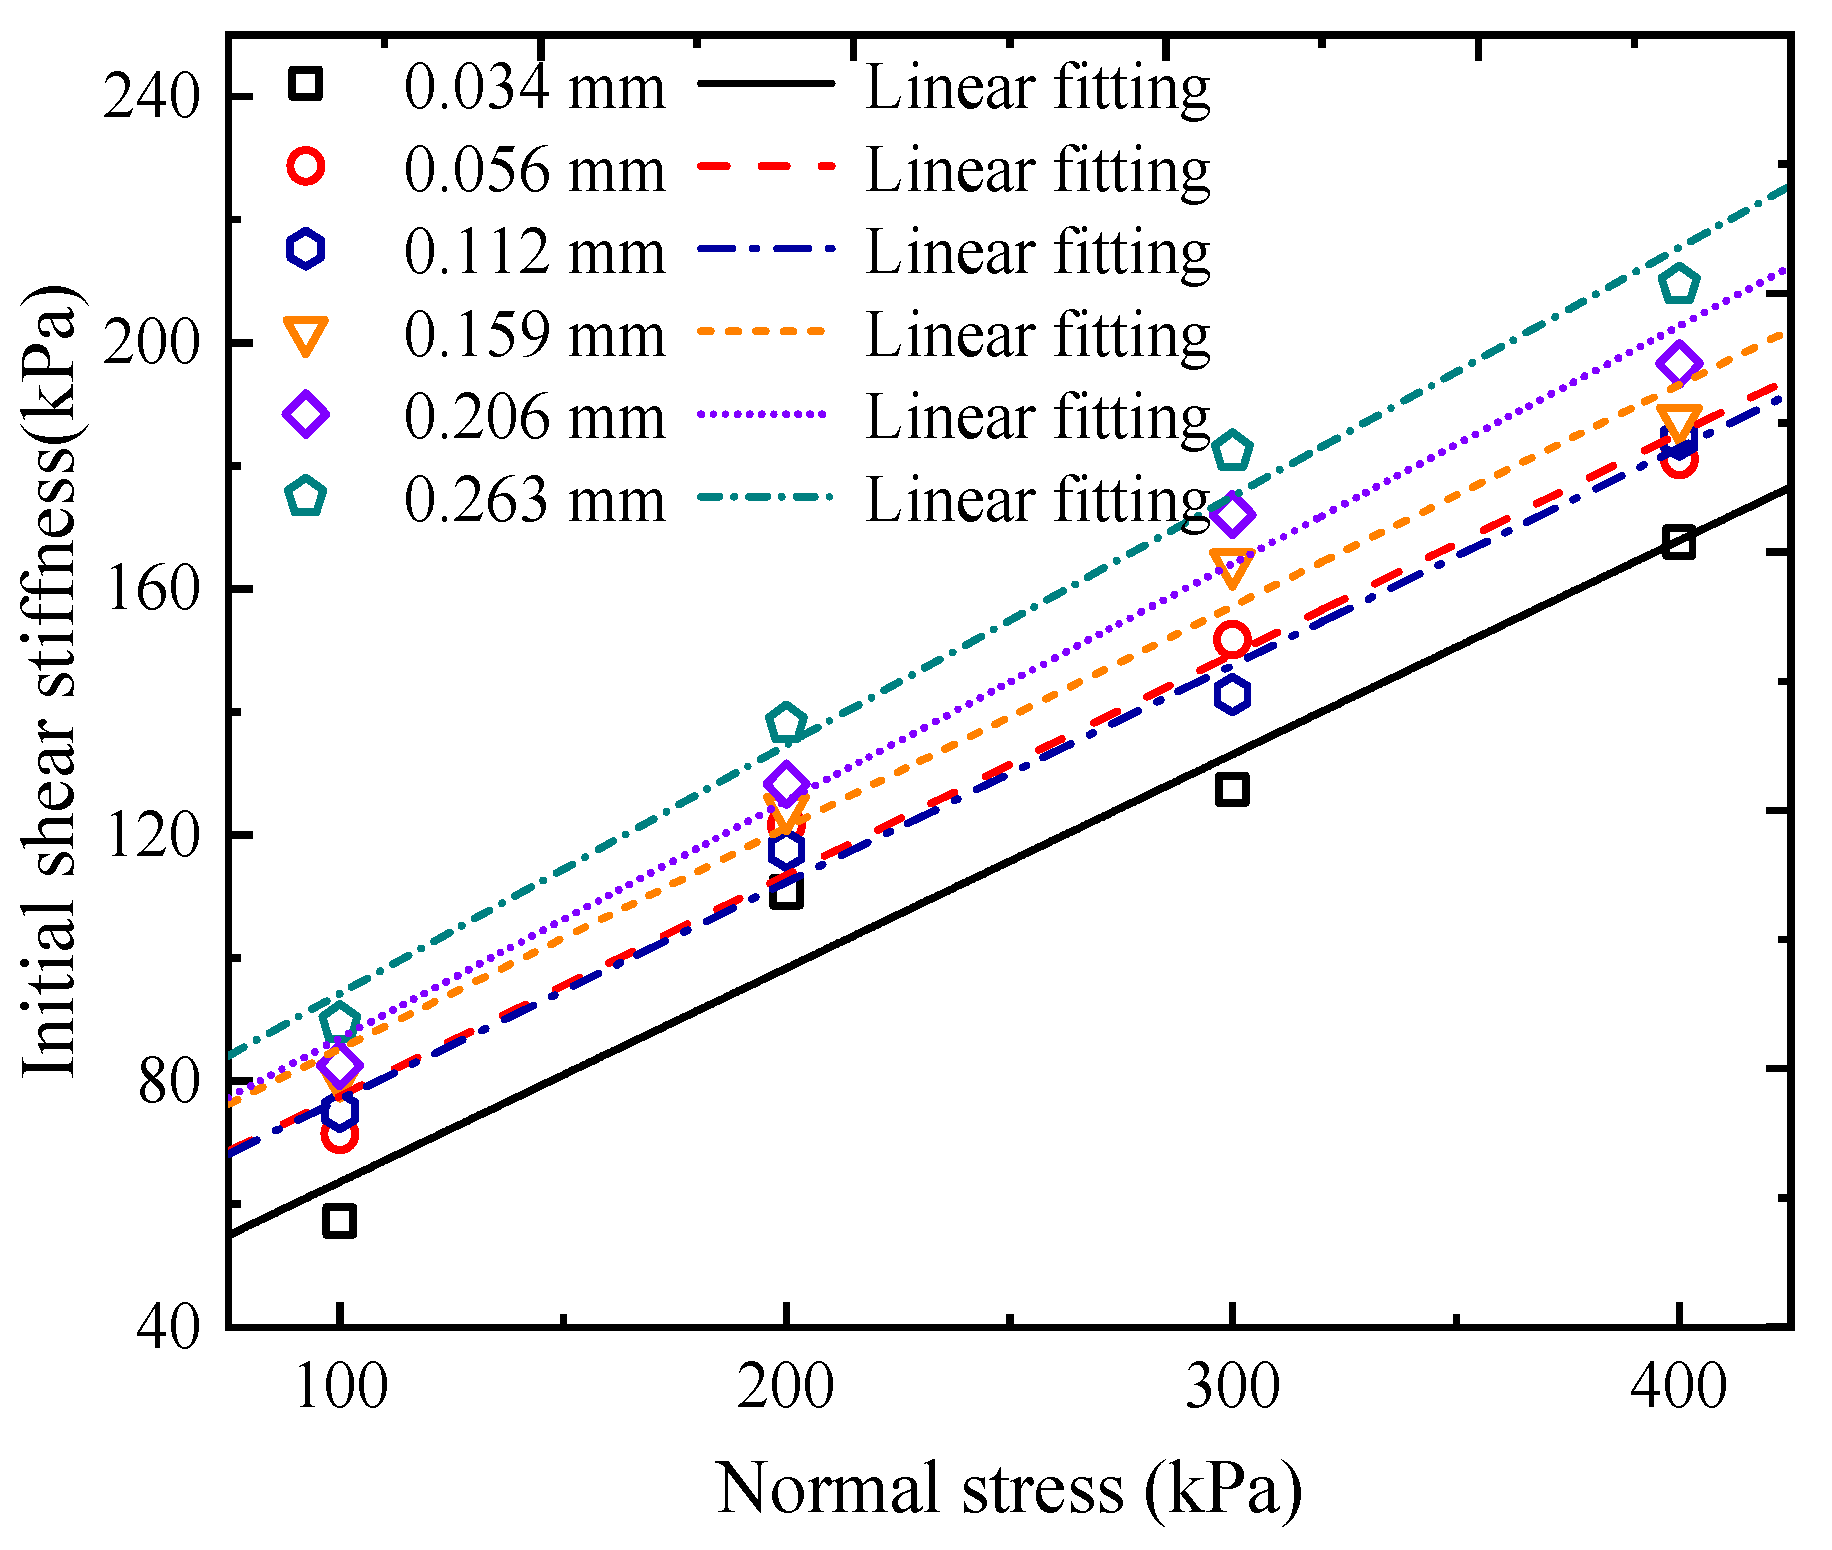
According to Equation (3), the shear stiffness is maximized at the beginning of the shear loading. With the increase of shear displacement, the shear stiffness gradually decreases and tends to be stable at 0. The initial shear stiffness of the interface is an important parameter describing the resistance of reinforcements to shear deformation. Figure 15 shows the variation curve of initial shear stiffness with median particle size. It can be obviously observed that the initial shear stiffness increases with median particle size under different normal stresses. This means that, with the increase of coarse particle content, the tailing–steel wire mesh interface has stronger resistance to shear deformation. The variation of initial shear stiffness with normal stress is plotted in Figure 16. It can be found that the initial shear stiffness almost has a linear increasing tendency with the normal stress for every median particle size. In addition, the straight slope of fitting line is almost consistent for different median particle size D50.
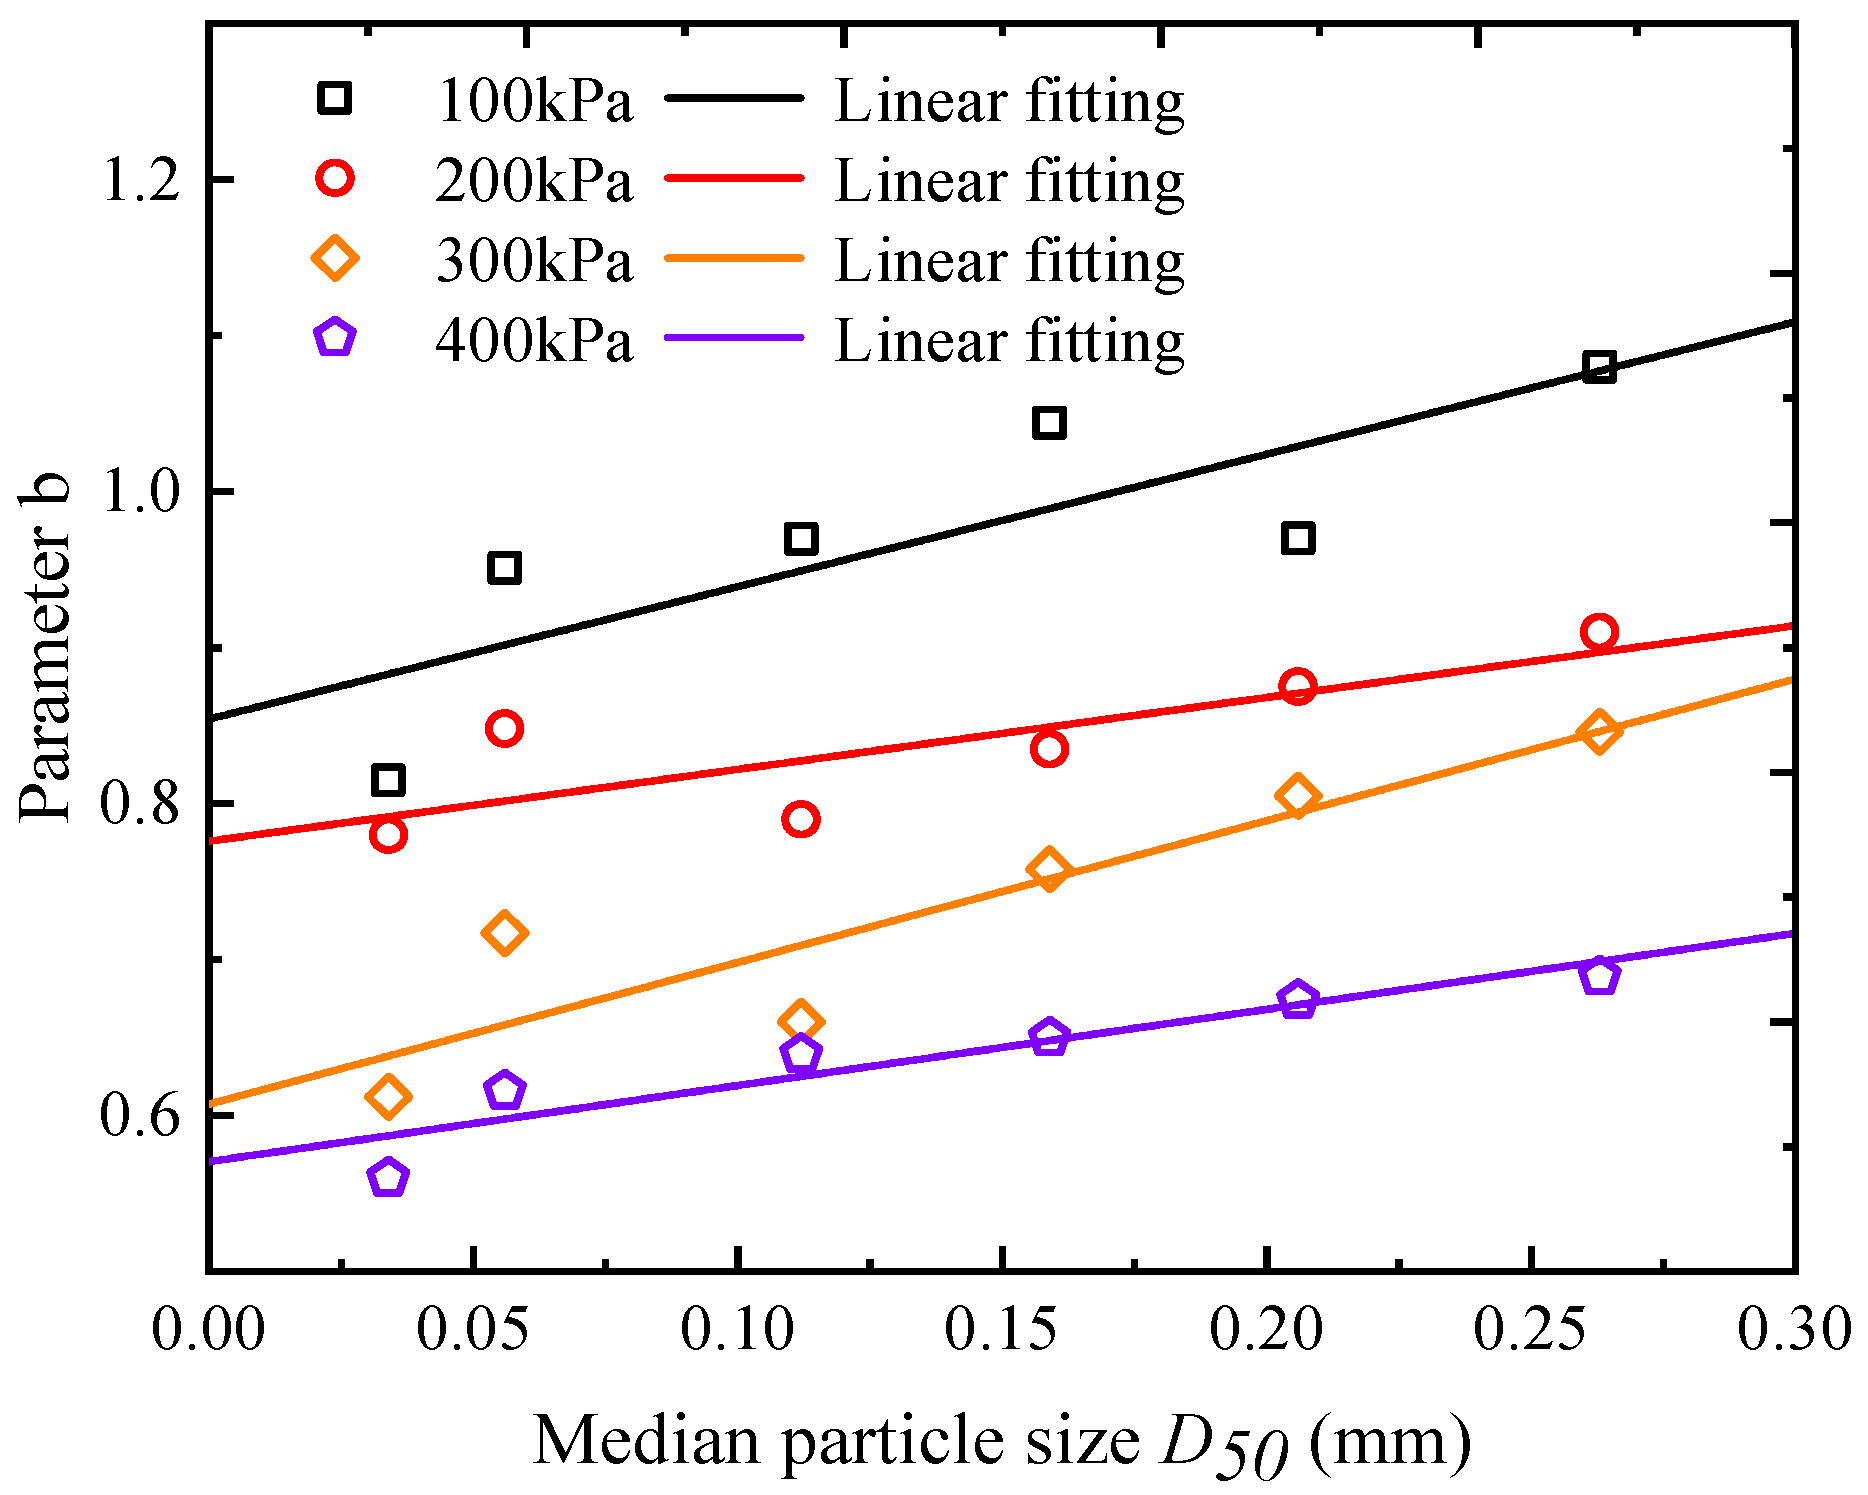
The parameter b does not have a definite physical meaning in the exponential model. Therefore, it needs to be calibrated based on the representation of the experimental data. The variation curve of parameter b with median particle size is shown in Figure 17. It is noticed that the parameter b increases continuously with the increase of median particle size D50, and they show an excellent positive linear relationship. As presented in Figure 18, the parameter b decreases with the increase of normal stress, which is contrary to the variation of the initial shear stiffness. The linear function is employed to fit the variation curves for initial shear stiffness. Based on the fitting linear function, the values of parameter b under different normal stress are determined for following numerical simulation.

4.4. Goodman Contact Element Model

To describe the mutual effect between drain pipe and tailing, the Goodman contact element model is adopted in this paper. The Goodman element model is a four-node element model with a thickness equal to zero, which can consider the nonlinear relation between interfacial shear stress and shear displacement [44,45]. The constitutive relation of contact surface is as follows:
Δ τ 1 Δ τ 2 = k s 1     0 0         k s 2 Δ γ 1 Δ γ 2
and k s 1 and k s 2 can be expressed according to Equation (7).
k s 1 = b ( σ n tan φ R f K 1 γ w ( σ n P a ) n τ 1 )
k s 2 = b ( σ n tan φ R f K 2 γ w ( σ n P a ) n τ 2 )
where K1, K2, n, and Rf are nonlinear indicators; φ is the interfacial friction angle; γw is the bulk density of water; Pa is atmospheric pressure; σn is normal contact stress; and τ1 and τ2 are shear stress along the two directions.
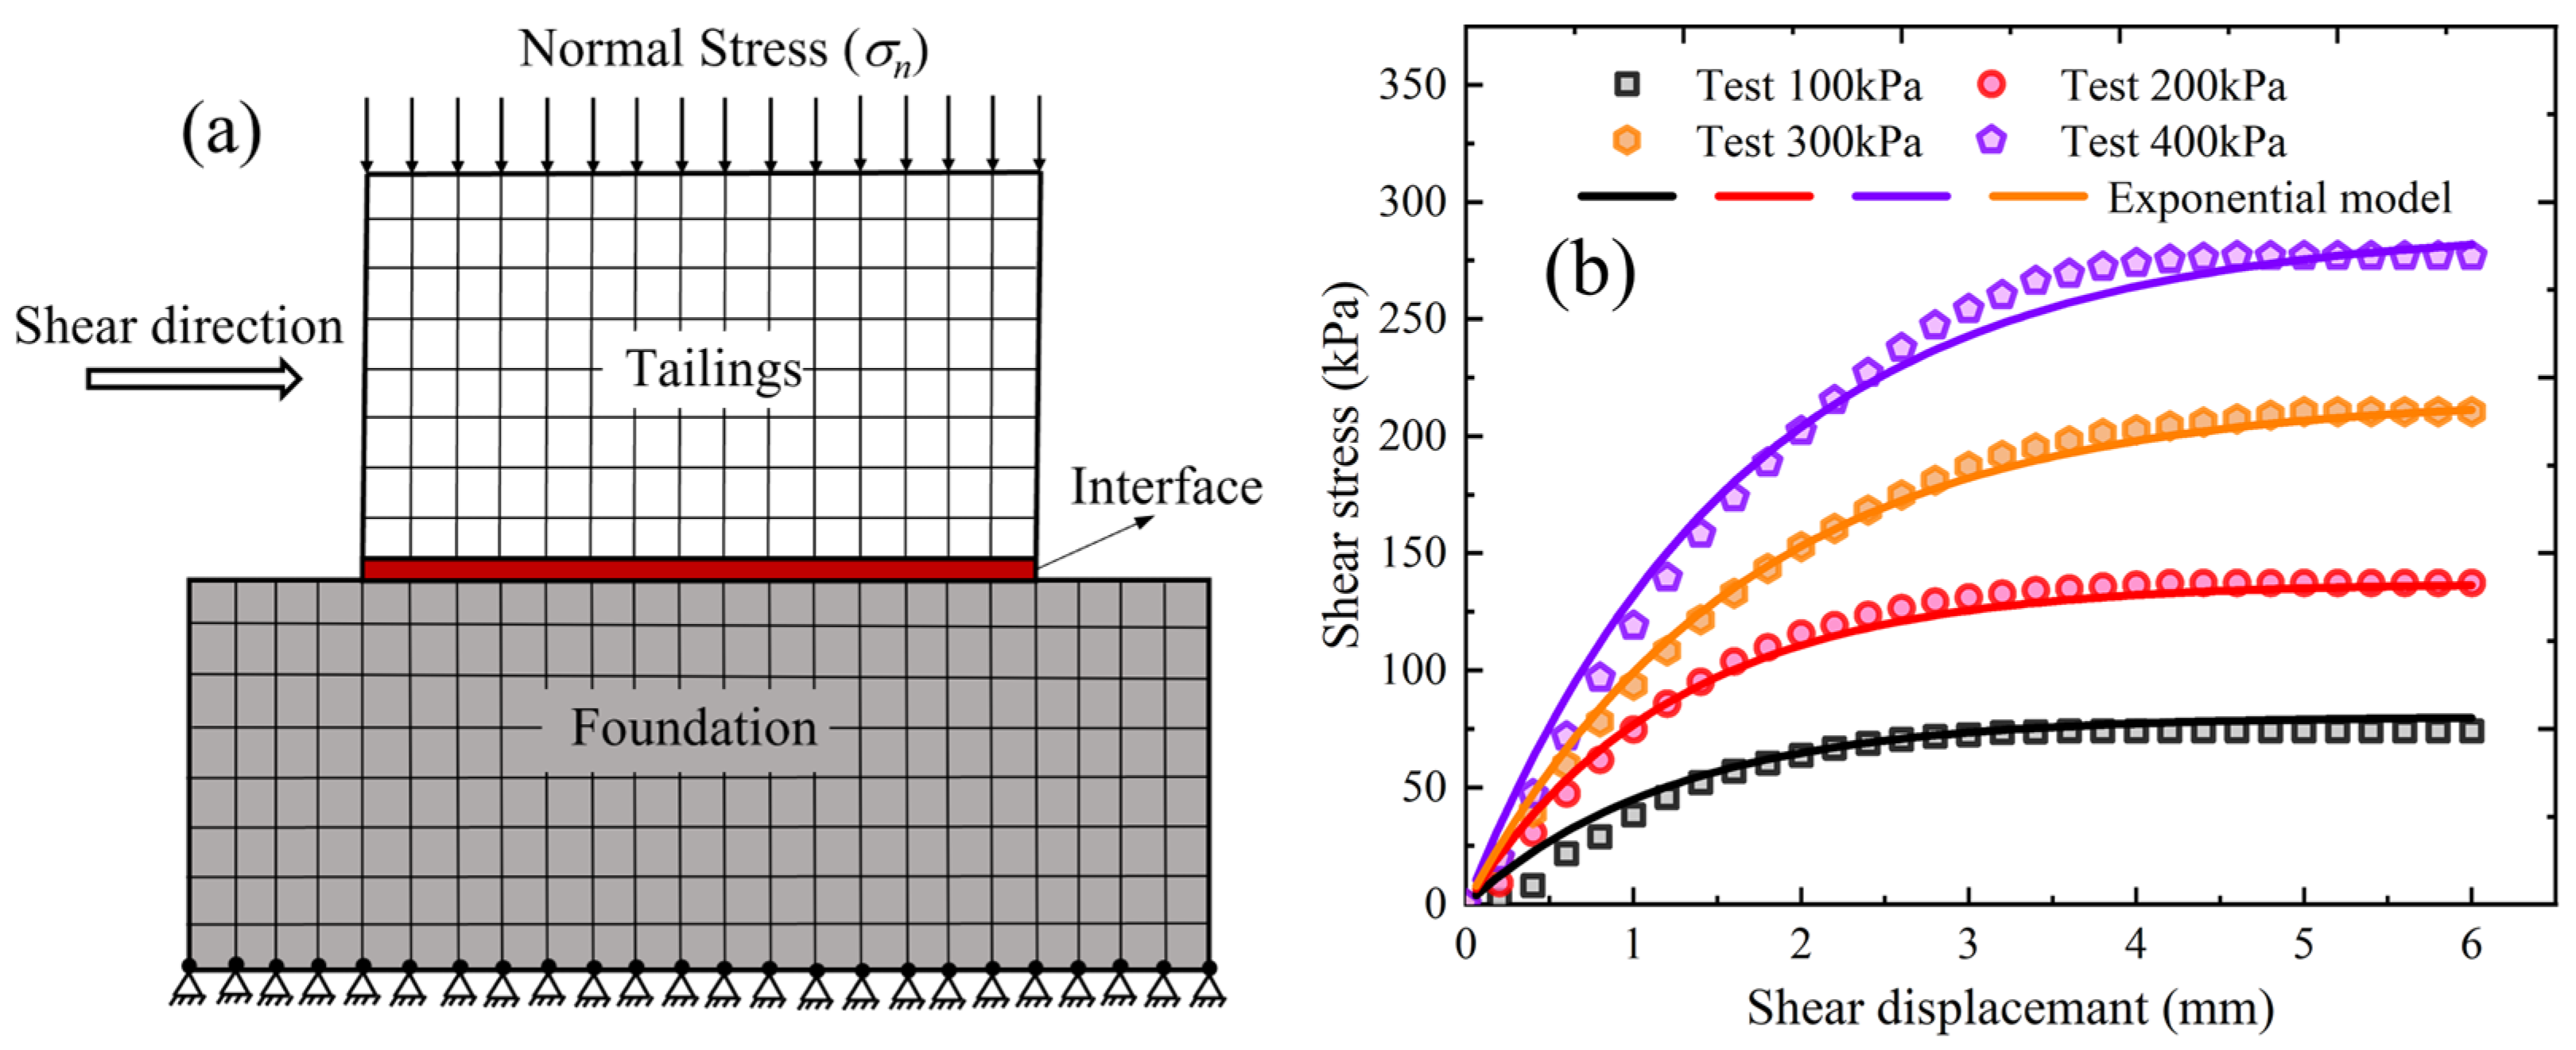
In this paper, the developed FRIC program based on FORTRAN language is loaded into ABAQUS for contact surface analysis. To validate both the developed program and its implementation procedure, a two-dimensional interface shear test was simulated, as depicted in Figure 19a. The test setup consisted of a foundational block with a fixed base, a freely sliding tailings block in the horizontal direction, and interface elements of negligible thickness between the tailings and foundation. Horizontal displacement was applied to the tailings block to induce shear loading, with contact parameters detailed in Table 2. Simulation results from the interface shear test between tailings and steel wire mesh, shown in Figure 19b, closely align with laboratory data. The median particle size is 0.034 mm. The closely aligning results can demonstrate the reliability of the developed FRIC program.

5. Effect of Self-Filtering Layer on Bearing Behavior of Drain Pipes

5.1. Finite-Element Model

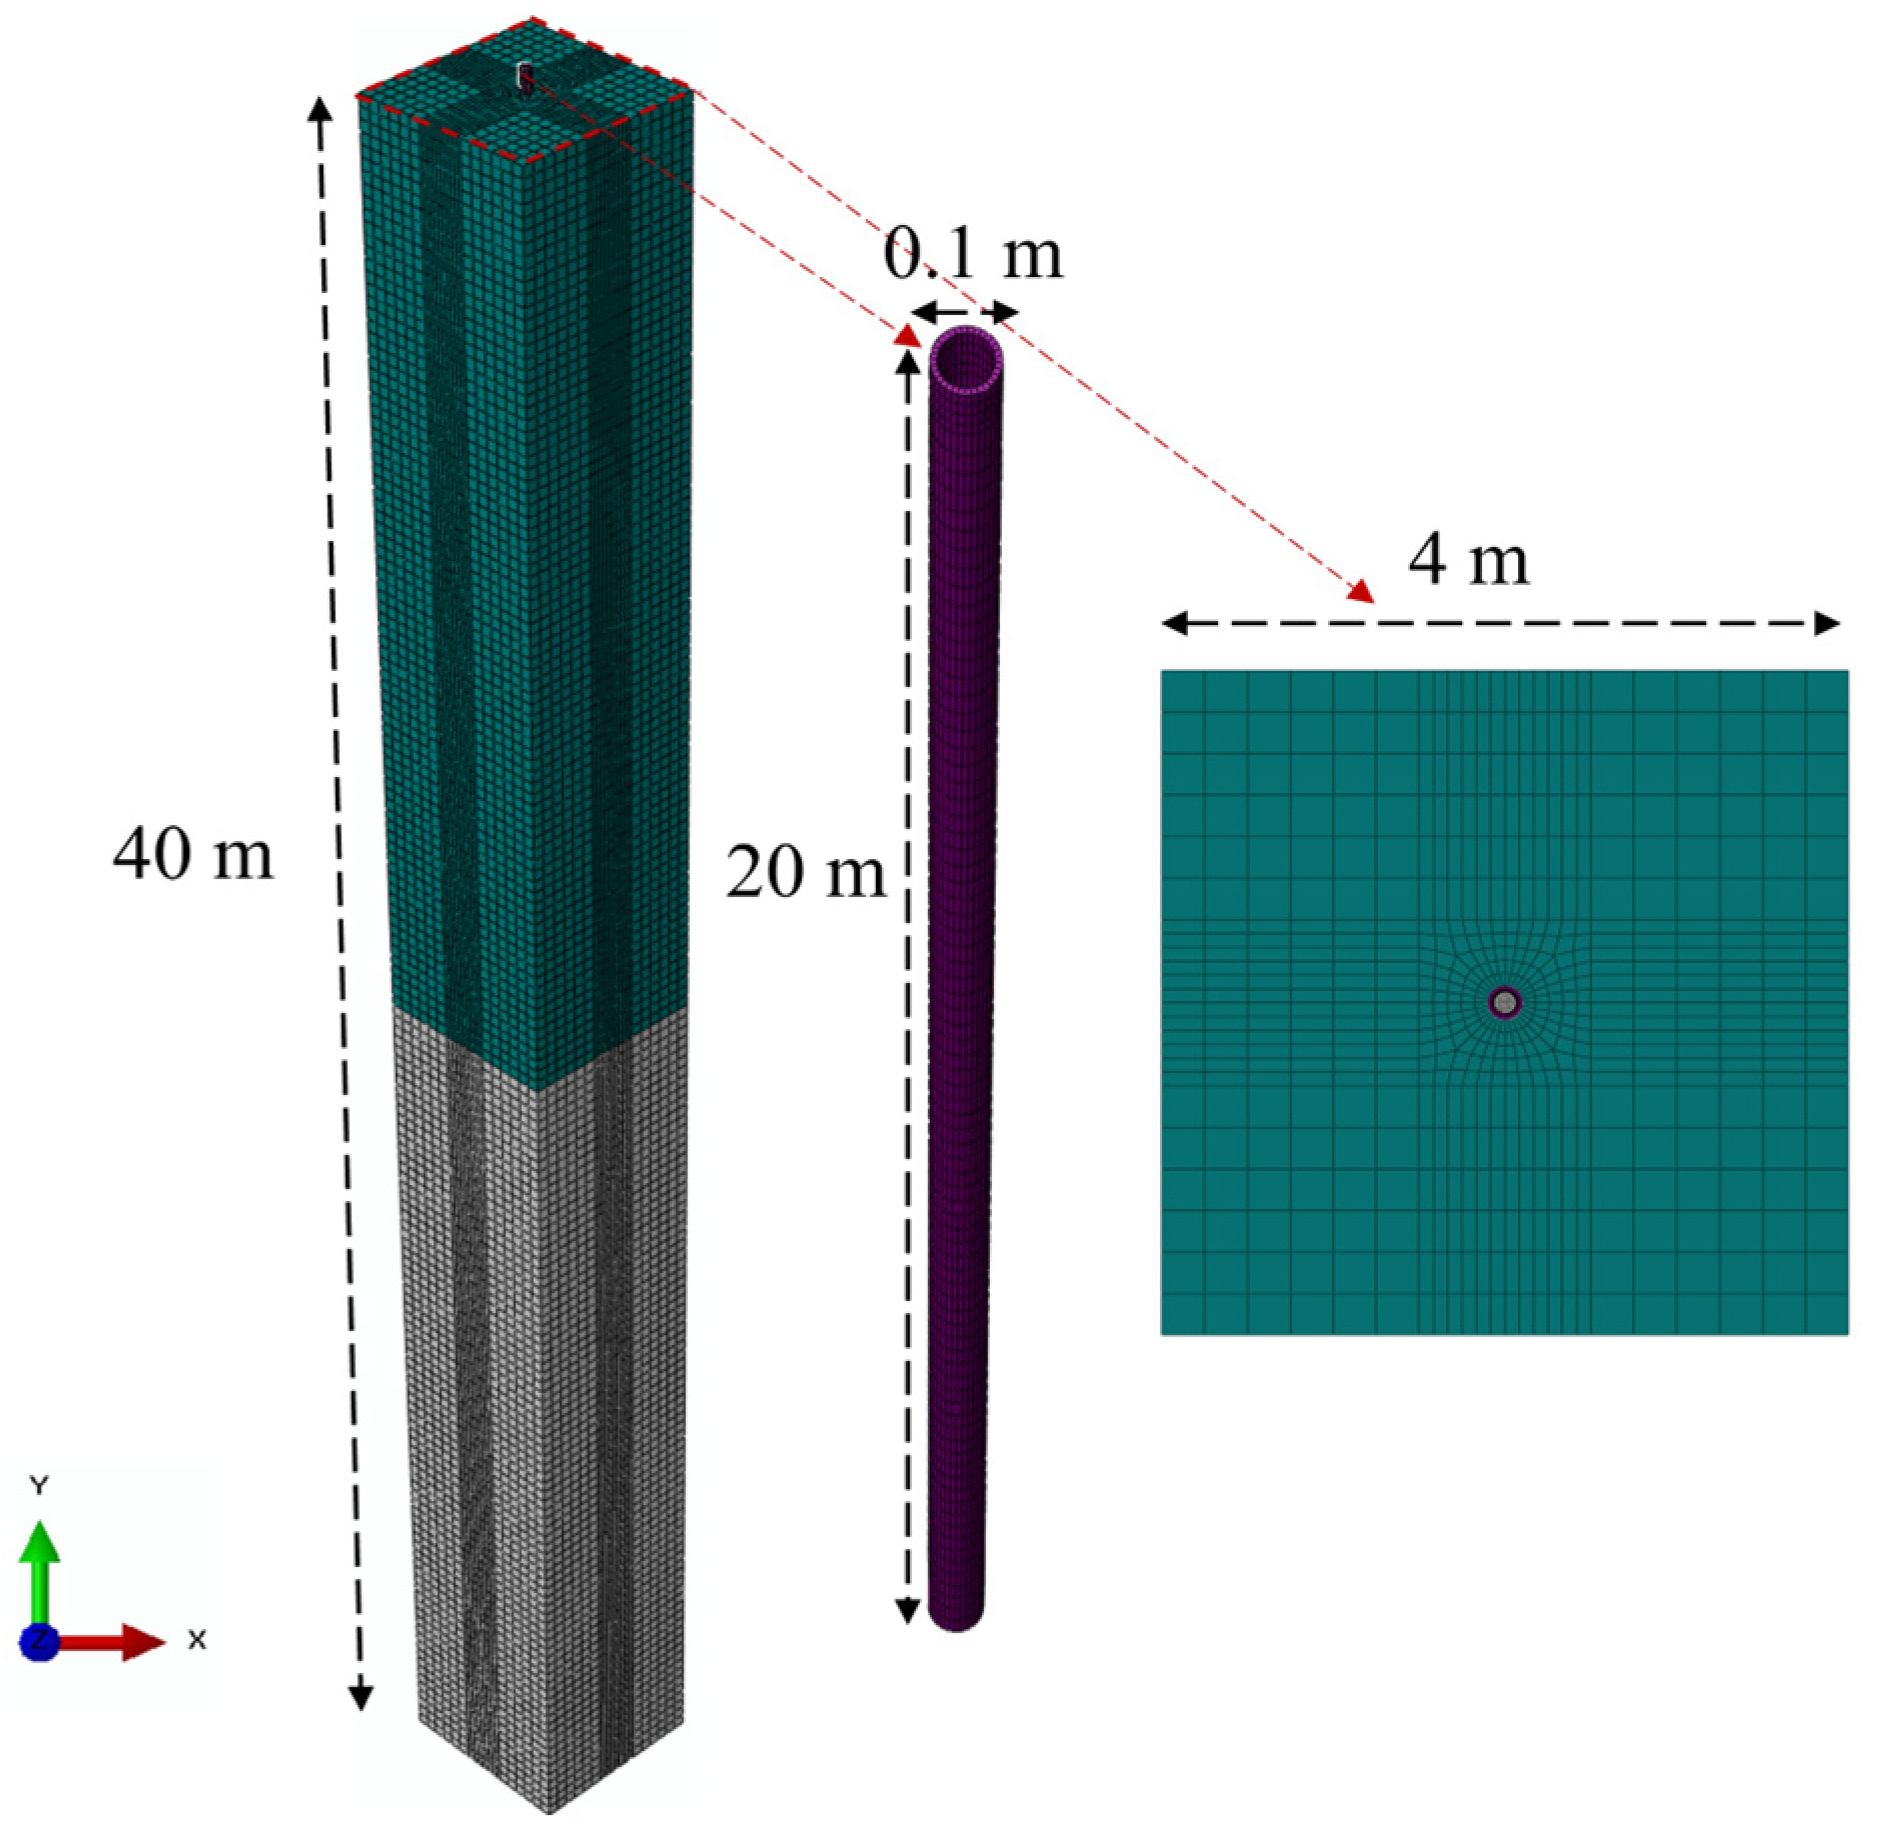
The finite-element model of the drain pipe–tailings interaction system is established using ABAQUS6.14 software, illustrated in Figure 20. Drawing from field investigations, the drain pipe is characterized by an outer diameter of 100 mm, an inner diameter of 80 mm, and a length of 20 m. To mitigate boundary effects, the depth of the tailings area is set at 40 m, nearly twice the length of the pipe, while the width spans 4 m, approximately 40 times the pipe’s outer diameter. The tailings are stratified into two layers: the first spanning 0 to 20 m, and the second from 20 to 40 m. Eight-node continuum brick elements with reduced integration (C3D8R) are used for the tailings domain [46]. The drain pipe is simulated by a linear elastic model, featuring a Young’s modulus of 23 GPa and a Poisson’s ratio of 0.35. Interaction between the drain pipe and tailing employs the Goodman element, governed by an exponential constitutive relationship, with contact defined at the interface between the pipe’s exterior surface and the surrounding tailing. Refer to Table 2 for specifics regarding the contact model parameters. Prior to the operational loading phase, geo-stress equilibrium is rigorously established [47].
The effect of the self-filtering layer on the pipe’s load-bearing capacity is simulated by enhancing the friction coefficient at the contact surface. To establish the load–displacement relationship and assess the bearing capacity, a displacement loading approach is employed, imposing a vertical displacement of 50 mm at the pipe’s top. Moreover, the pipe’s length l and diameter d, as parametric analysis for load-bearing performance of the pipe, are considered in this paper. Since the pipe experiences instability failure, the distribution of the negative skin friction and the axial force cannot be obtained by displacement loading method. For analyzing the negative skin friction and the axial force, five sets of vertical loads with values of 10 kN, 20 kN, 30 kN, 40 kN, and 50 kN are applied to the pipe’s head, respectively.

5.2. Duncan–Chang Model for Tailing Medium

To simulate the nonlinear behavior of the tailing medium before and after the peak shear capacity in the loading process, the Duncan–Chang model based on a hyperbolic form is chosen [43]. The D–C model has been used extensively to describe the behavior of dam materials owing to the easily determined model parameters [48,49]. The tangent modulus Et is expressed as follows:
E t = K P a ( σ 3 P a ) n 1 R f ( σ 1 σ 3 ) ( 1 sin φ ) 2 σ 3 sin φ + 2 c cos φ 2
where K is the tangent modulus coefficient; n is the tangent modulus exponent; Pa is the standard atmospheric pressure; Rf is the failure ratio; c is the cohesion intercept; φ is the friction angle; and σ1 and σ3 are the major and minor principal stresses.
The friction angle φ depends on the effective stress level, expressed by the equation:
φ = φ 0 Δ φ lg ( σ 3 P a )
The unloading elastic modulus (Eur) is given by:
E u r = K u r P a ( σ 3 P a ) n
where Kur is the unloading modulus coefficient.
The tangent Poisson ratio Vt is then written as:
V t = G F lg ( σ 3 / P a ) 1 D ( σ 1 σ 3 ) ( 1 sin φ ) K P a ( σ 3 / P a ) n [ 1 R f S ] 2
where G, F, and D are the three dimensionless parameters.
The Duncan–Chang model is programmed to incorporate the ABAQUS6.14 software by a user-defined material (UMAT) subroutine. To verify the D–C model, the laboratory conventional triaxial compression test conducted by Shi et al. [50] is simulated. The material properties of the tailings used in this study mirror those employed in Shi’s laboratory tests. A standard 3D model of a cylindrical soil specimen with a diameter of 39.1 mm and a height of 80 mm is established, as shown in Figure 21a. Mechanical parameters for the tailings in the numerical model are derived from calibration against triaxial test results of tailing specimens. The load–displacement curves of the numerical model compared with the laboratory test data are plotted in Figure 21b. It is evident that there is significant alignment between the numerical and experimental outcomes, affirming the reliability of the D–C model in describing the behavior of the tailings medium. This model can thus be applied in future investigations into the load-bearing behavior of drain pipes. All parameters of the D–C model are summarized in Table 3.

5.3. Numerical Results

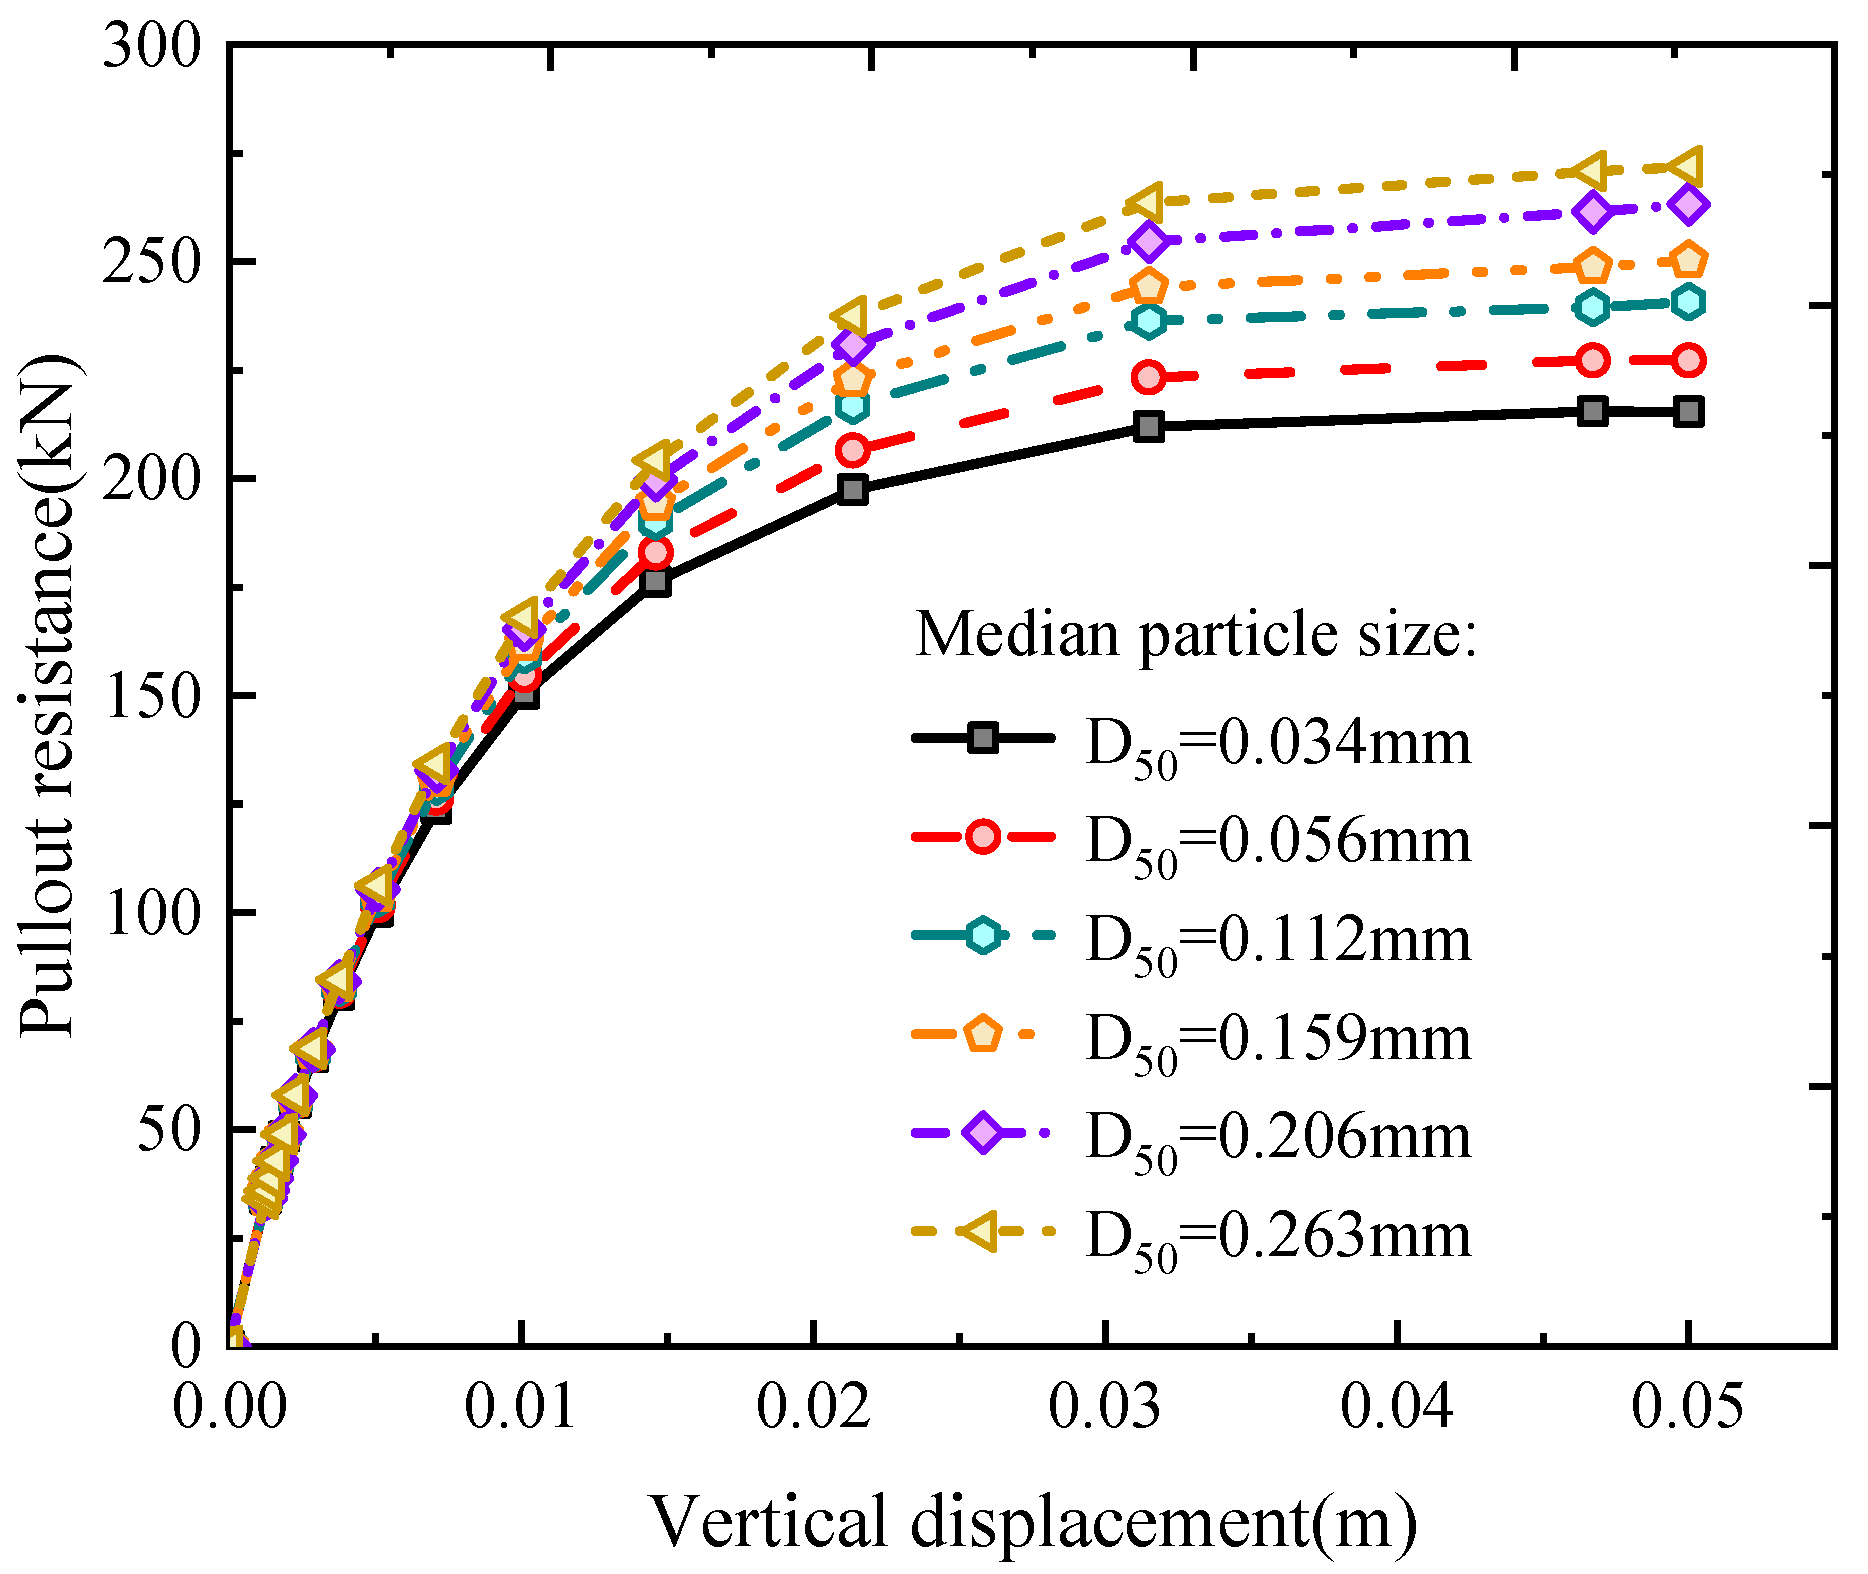
The pull-out load–displacement curve of drain pipes obtained by numerical techniques under different median particle size is shown in Figure 22. It is notable that the vertical loads display similar nonlinear behavior, characterized by phases of linear increase, hardening, and stabilization. Higher values of D50 correspond to increased maximum bearing capacity of the drain pipe, while exerting minimal influence on the initial stiffness of the drain pipe–tailings interface. Furthermore, the failure peak occurs almost at the displacement of 40 mm under different median particle size. That is to say that the initial linear stage and stable stage of pipe pull-out resistance are less affected by median particle size, while the nonlinear stage is greatly affected by the median particle size.
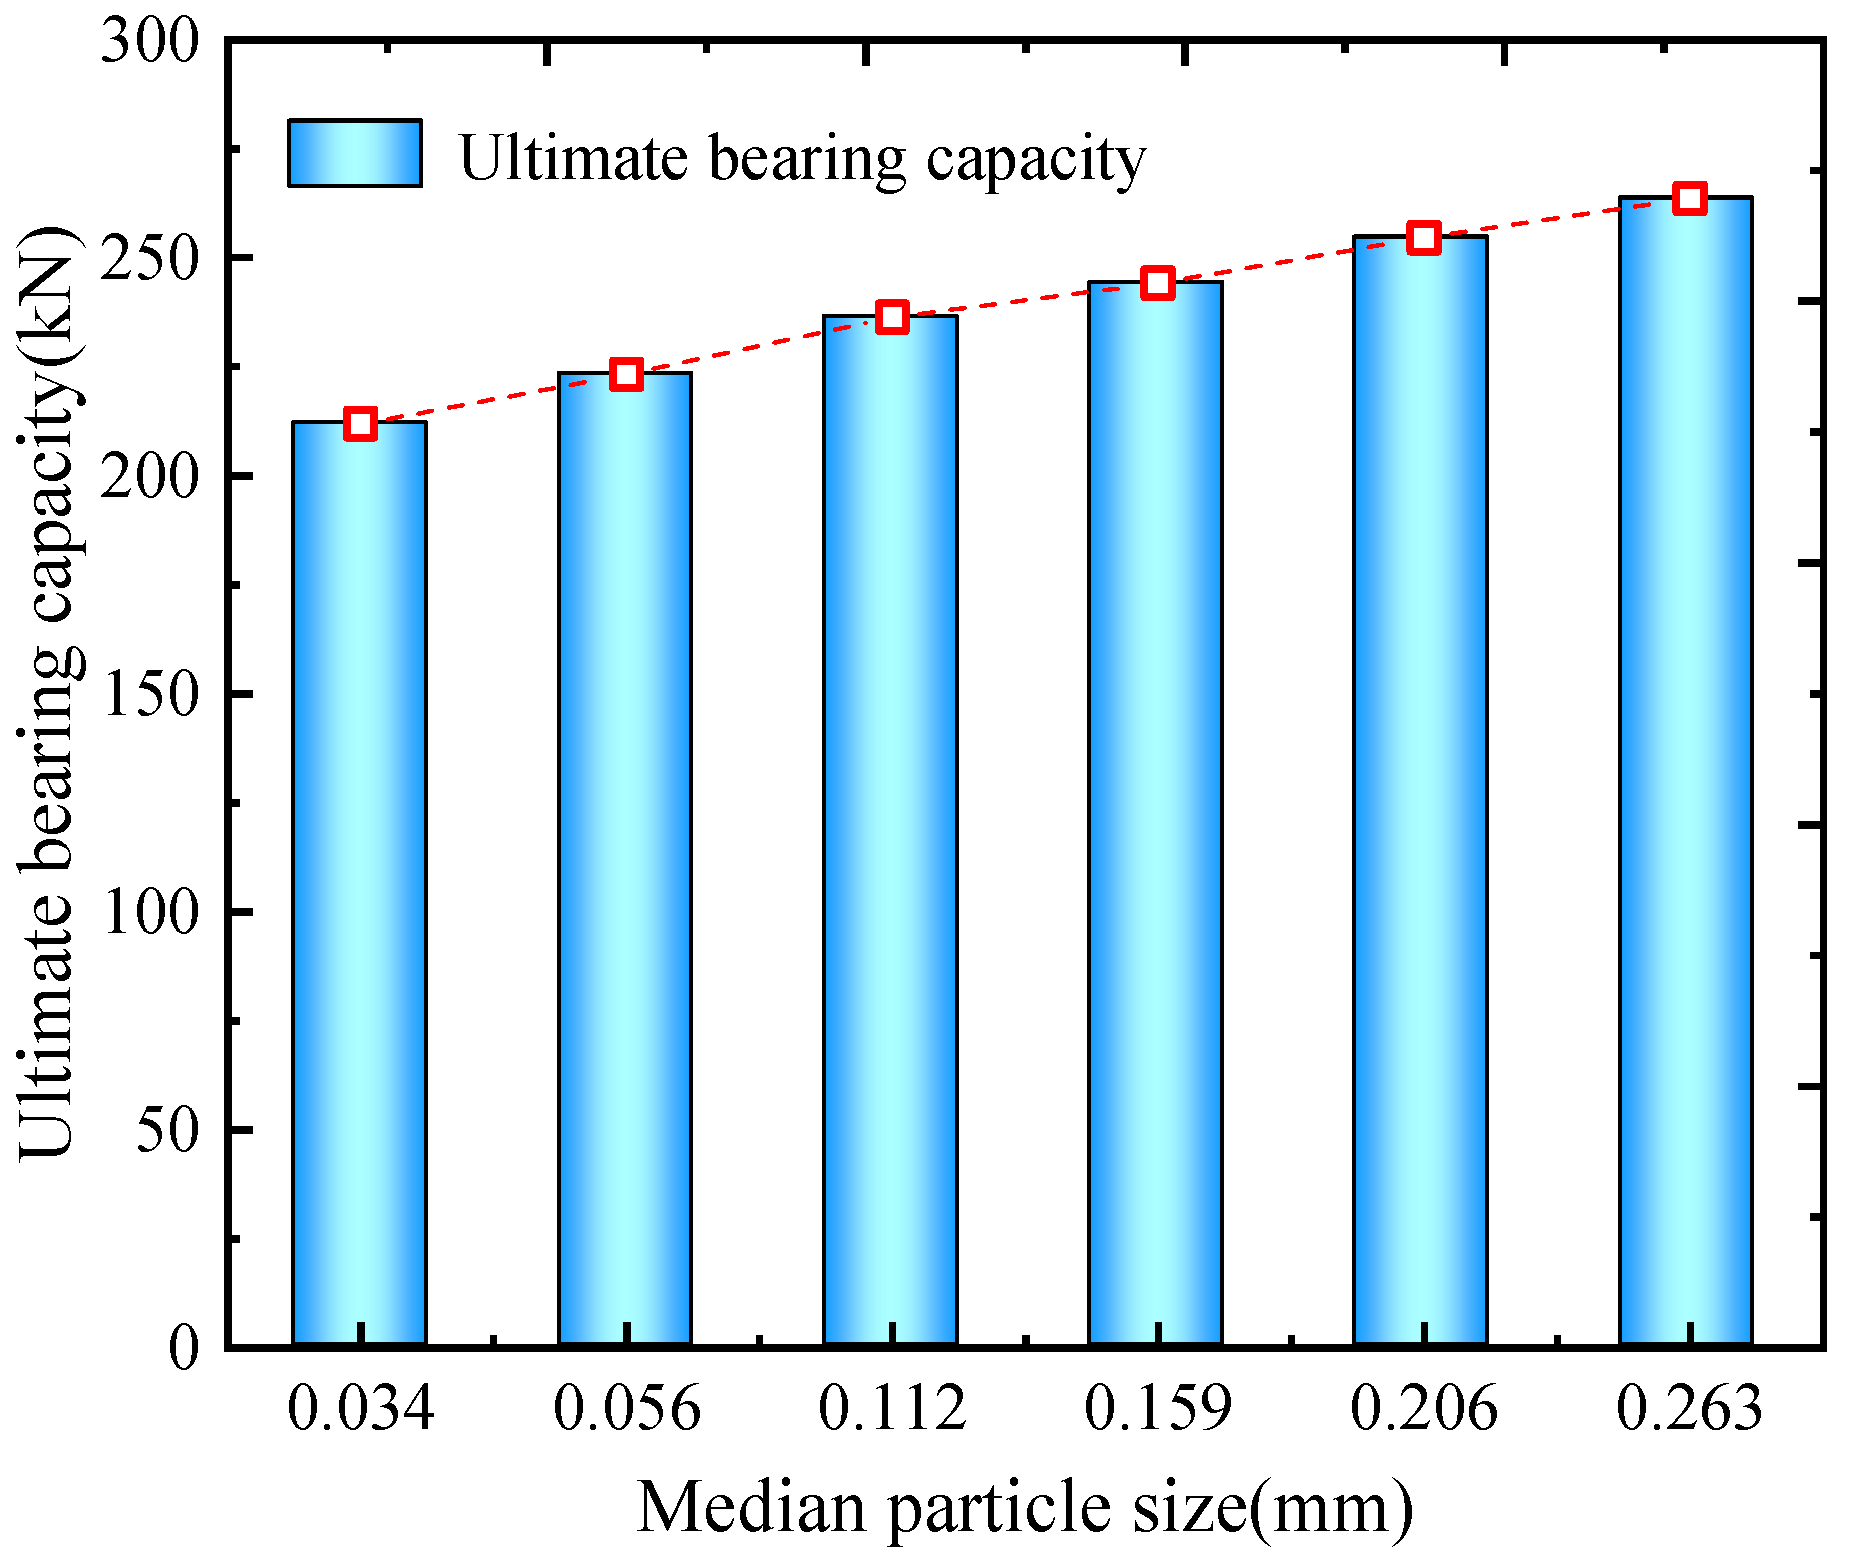
Based on the obtained pull-out load–displacement curves, the ultimate bearing capacity of the drain pipe can be further evaluated. Generally, for load–displacement curves, the flat portion means vertical pull-out failure of the pipe where a large displacement is derived for a small increment of load [51]. In this paper, the pull-out load with displacement of 40 mm is selected as the ultimate capacity. The variation of the ultimate capacity with median particle size is given in Figure 23. From Figure 23, one can easily find that the ultimate bearing capacity of pipes increases almost linearly with the median particle size. When the median particle size D50 increases to 0.263 mm, the bearing capacity of pipes increases by 24.4%.
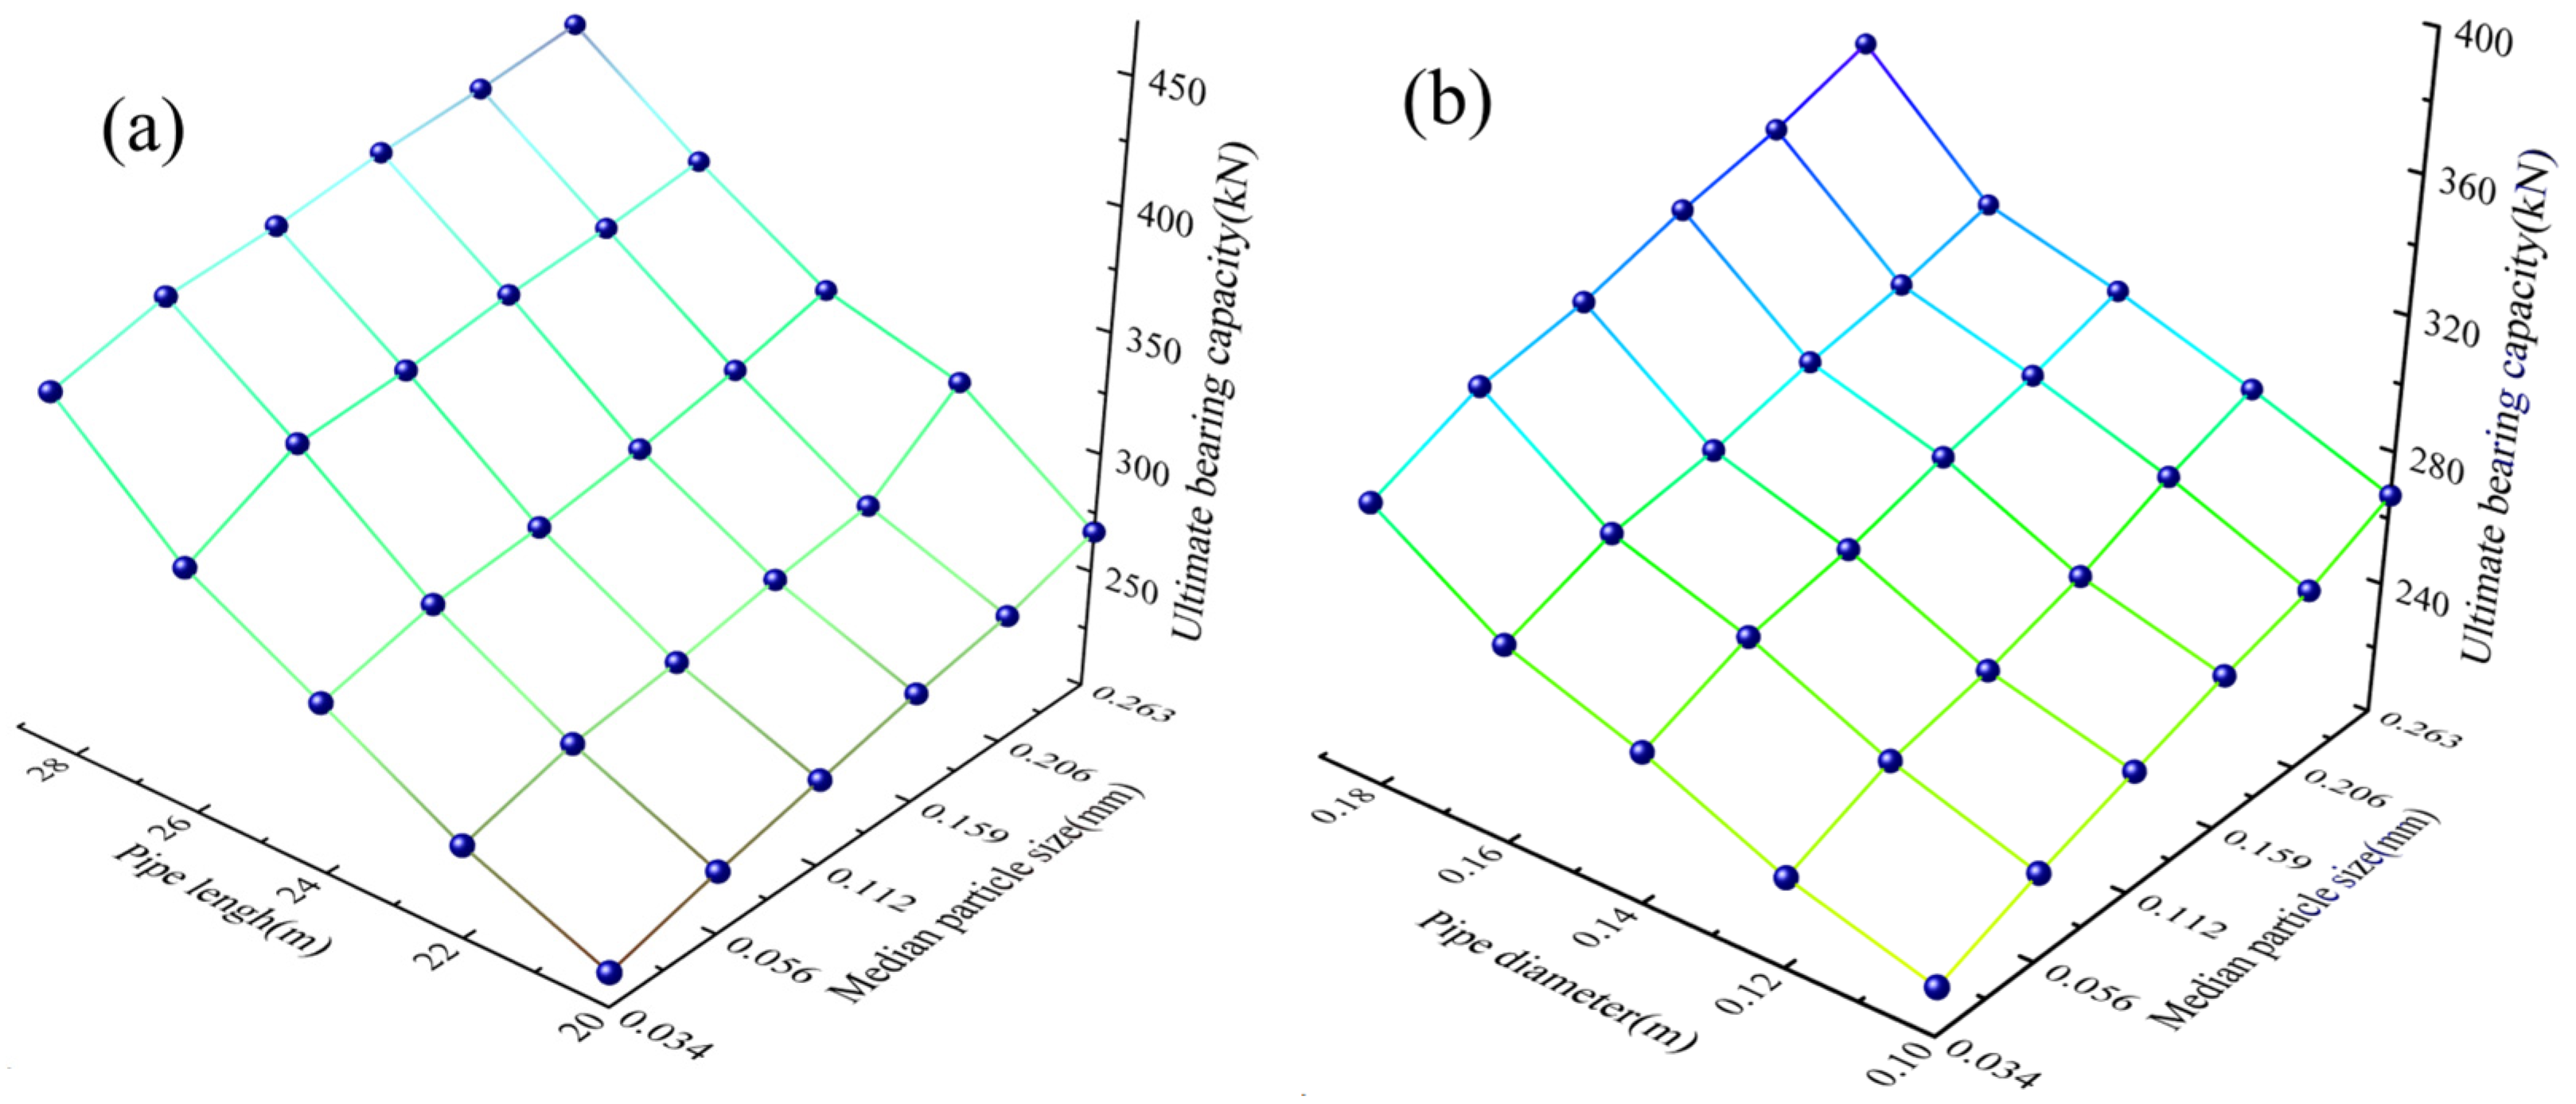
Figure 24a shows the variations of the ultimate bearing capacity of drain pipes with pipe length (i.e., l = 20, 22, 24, 26, and 28 m). It can be found from this figure that the ultimate bearing capacity of drainage pipes increases linearly as the length of the pipes increases. Specifically, for a median particle size of 0.034 mm, the bearing capacity of the pipes rises from 213.96 kN to 266.97 kN with an increment in pipe length from 20 m to 28 m, marking a 24.8% increase. Furthermore, for a fixed pipe length, the ultimate bearing capacity shows a linear growth pattern with respect to the median particle size. Figure 24b shows the variations of the ultimate bearing capacity of pipes with pipe diameter (i.e., d = 0.10, 0.12, 0.14, 0.16, and 0.18 m). It is observed that the ultimate bearing capacity increases with the diameter of the pipe. For instance, considering a median particle size of 0.263 mm, the pipe bearing capacity increases by 26.3% (from 283.17 to 355.02 kN) as the pipe diameter increases from 0.10 to 0.18 m. Additionally, for a given pipe diameter, the median particle size significantly enhances the ultimate bearing capacity. However, the median particle size has minimal influence on the increasing trend of ultimate bearing capacity with pipe diameter.
The bearing capacity of the drain pipe subjected to pull-out load is mainly generated by friction resistance along the pipe–tailings interface [52]. Figure 25a depicts the distribution curves of the negative skin friction along the pipe shaft under different vertical loads. It is observed from Figure 25a that the negative skin friction gradually increases from zero to the maximum under a certain load, and subsequently linearly reduces. The distribution of negative skin friction along the pipe resembles the shape of the letter “C”, with its maximum value occurring at approximately 6 m depth. This negative skin friction increases proportionally with the vertical load. Additionally, with increasing loads, the position of maximum negative skin friction on the pipe shaft slightly shifts downward. The negative skin friction along the pipe shaft with median particle size under 30 kN vertical loads is investigated, and the results are presented in Figure 25b. A higher negative skin friction located at the upper part of the pipe is observed with the increasing of median particle size. The negative skin friction located at the low part of the pipe shows a decreasing trend with D50. This phenomenon can be explained by the fact that most of the load applied on the pipe is consumed by the friction resistance of the upper interface with the increase of the friction coefficient. As expected, the location of the maximum negative skin friction along the pipe shaft moves up slightly.
Figure 26a shows the distributions of axial force along the pipe shaft under different loading levels. The axial force of the pipe almost has a linear decreasing tendency from the pipe head (z = 0 m) to the end (z = 20 m), and this trend gradually slows down with the increase in the load. The axial force at the bottom of the pipe (z = 20 m) decreases to 0 under different loading levels, which indicates that most of the vertical loads on the pipe top have not been directly transmitted to the pipe bottom. Figure 26b illustrates the distributions of axial force along the pipe shaft with median particle size D50 under 30 kN loading level. From this figure, it can be seen that the axial force almost decreases with D50. Additionally, the median particle size D50 has little effect on the variation tendency of axial force. The axial force of the pipe is shared by the interface friction resistance and the weight of the pipe. As analyzed above, the lateral friction resistance increases with the increase of the median particle size D50, so the axial force gradually decreases with D50 according to the principle of static equilibrium.

6. Conclusions

This paper investigates the influence of a self-filtering layer on the interfacial shear properties of tailings–steel wire mesh and the load-bearing behavior of drain pipes in a tailings pond. Initially, a series of direct shear experiments examines the shear properties of the tailings–steel wire mesh interface. Subsequently, an exponential constitutive model for the interface is formulated and validated against experimental results. Finally, employing the interface constitutive model, finite-element numerical simulations explore the impact of the self-filtering layer on the load-bearing capacity of drain pipes. The following conclusions are drawn:
(1)
The interface shear stress–displacement curves of tailing–steel wire mesh show a remarkable hardening characteristic, which is affected slightly by the self-filtering layer. In addition, the shear strength increases with the median particle size of the self-filtering layer, and the increasing tendency of shear strength with the median particle size is less affected by normal stress.
(2)
The interface shear strength of the tailing–steel wire mesh can be regarded as following Mohr–Coulomb strength theory. The interfacial cohesion decreases with increasing median particle size of the self-filtering layer, while the interfacial friction coefficient demonstrates an increasing trend. Specifically, when the median particle size reaches 0.263 mm, the friction coefficient increases by 17.2%.
(3)
A nonlinear exponential constitutive model for the interface is developed, capable of predicting the shear stress–strain relationship at the tailing–steel wire mesh interface. The initial shear stiffness ks0 and parameter b exhibit a linear increase with the median particle size.
(4)
The load–displacement curve of the drain pipe successively experiences a linear increasing stage, hardening stage, and stable stage. The presence of a self-filtering layer positively influences the bearing capacity of the drain pipe. Furthermore, the self-filtering layer significantly impacts the distribution of negative skin friction, with the axial force of the drain pipe decreasing with increasing median particle size of the self-filtering layer.

Author Contributions

Data curation, D.L.; writing—original draft preparation, D.L.; software, D.L.; Funding acquisition, Y.W.; supervision, Y.W.; project administration, Y.W.; investigation, X.C.; resources, X.C.; validation, X.C.; methodology, J.H.; writing—review & editing, J.H.; formal analysis, J.H.; All authors have read and agreed to the published version of the manuscript.

Funding

This research was supported by the National Key Research and Development Program of China (Grant No. 2017YFC0804600).

Data Availability Statement

The data presented in this study are available in the article.

Conflicts of Interest

Author Xuan Cui was employed by the company BGRIMM Technology Group. The remaining authors declare that the research was conducted in the absence of any commercial or financial relationships that could be construed as a potential conflict of interest.

References

  1. Liu, C.; Shen, Z.Z.; Gan, L.; Xu, L.Q.; Zhang, K.L.; Jin, T. The seepage and stability performance assessment of a new drainage system to increase the height of a tailings dam. Appl. Sci. 2018, 8, 1840. [Google Scholar] [CrossRef]
  2. Yang, C.B.; Wang, Y.; Wang, L.B.; Huang, J.Q.; Li, Q.W.; Wu, L. The slotted tube overlay geotextile in tailing pond radial seepage test model and analysis of the permeation characteristics. Geofluids 2021, 2021, 4589533. [Google Scholar] [CrossRef]
  3. Cui, X.; Li, D.D.; Huang, J.Q.; Han, Y.B. Laboratory evaluation of the filtration behavior of three filters wrapped around drain pipes in fine tailings based on a radial flow test. Text. Res. J. 2023, 93, 3969–3981. [Google Scholar] [CrossRef]
  4. Mirzaeifar, H.; Hatami, K.; Abdi, M.R. Pullout testing and Particle Image Velocimetry (PIV) analysis of geogrid reinforcement embedded in granular drainage layers. Geotext. Geomembr. 2022, 50, 1083–1109. [Google Scholar] [CrossRef]
  5. Newman, P.; Hodgson, M.; Rosselot, E. The disposal of tailings and minewater sludge using geotextile dewatering techniques. Miner. Eng. 2004, 17, 115–121. [Google Scholar] [CrossRef]
  6. Liu, S.; Wang, Y.; Feng, D. Numerical research on two-dimensional bridge formation at the cohesionless sand-geotextile interface with the DEM method. Geomech. Eng. 2021, 27, 263–271. [Google Scholar]
  7. Dong, C.Y.; Gao, K.G.; Dong, S.X.; Shang, X.S.; Wu, Y.X.; Zhong, Y.X. A new integrated method for comprehensive performance of mechanical sand control screens testing and evaluation. J. Petrol. Sci. Eng. 2017, 158, 775–783. [Google Scholar] [CrossRef]
  8. Grubb, D.G.; Diesing, W.E.; Cheng, S.C.L.; Sabanas, R.M. Comparison of the durability of geotextiles in an alkaline mine tailings environment. Geosynth. Int. 2001, 8, 49–80. [Google Scholar] [CrossRef]
  9. Liu, S.; Wang, Y.; Feng, D. Compatibility of tailings-nonwoven geotextile under stress and the effect of sand filter. Geosynth. Int. 2020, 28, 206–213. [Google Scholar] [CrossRef]
  10. Khan, M.W.; Dawson, A.R.; Marshall, A.M. Filtration performance of non-woven geotextiles with internally-stable and -unstable soils under dynamic loading. Geotext. Geomembr. 2022, 50, 293–311. [Google Scholar] [CrossRef]
  11. DeJong, J.T.; Wetgate, Z.J. Role of overconsolidation on sand-geomembrane interface response and material damage evolution. Geotext. Geomembr. 2005, 23, 486–512. [Google Scholar] [CrossRef]
  12. Sayeed, M.M.A.; Ramaiah, B.J.; Rawal, A. Interface shear characteristics of jute/polypropylene hybrid nonwoven geotextiles and sand using large size direct shear test. Geotext. Geomembr. 2014, 42, 63–68. [Google Scholar] [CrossRef]
  13. Punetha, P.; Mohanty, P.; Samanta, M. Microstructural investigation on mechanical behavior of soil-geosynthetic interface in direct shear test. Geotext. Geomembr. 2017, 45, 197–210. [Google Scholar] [CrossRef]
  14. Manohar, D.R.; Anbazhagan, P. Shear strength characteristics of geosynthetic reinforced rubber-sand mixtures. Geotext. Geomembr. 2021, 49, 910–920. [Google Scholar] [CrossRef]
  15. Hassan, W.; Farooq, K.; Hassan, M.; Alshameri, B.; Shahzad, A.; Nawaz, M.N.; Azab, M. Experimental investigation of mechanical behavior of geosynthetics in different soil plasticity indexes. Transp. Geotech. 2023, 39, 100935. [Google Scholar] [CrossRef]
  16. Abdi, M.R.; Sadrnejad, A.; Arjomand, M.A. Strength enhancement of clay by encapsulating geogrids in thin layers of sand. Geotext. Geomembr. 2009, 27, 447–455. [Google Scholar] [CrossRef]
  17. Prabhakara, B.K.K.; Guda, P.V.; Balunaini, U. Interface shear stress properties of geogrids with mixtures of fly ash and granulated rubber. J. Mater. Civil. Eng. 2020, 32, 06020020. [Google Scholar] [CrossRef]
  18. Praveen, G.V.; Kurre, P. Large direct shear testing to evaluate the interaction behaviour of murrum soil and geosynthetics for the reinforced soil construction. Mater. Today. Proc. 2021, 39, 500–503. [Google Scholar] [CrossRef]
  19. Lopes, P.C.; Lopes, M.L.; Lopes, M.P. Shear behaviour of geosynthetics in the inclined plane test-influence of soil particle size and geosynthetic structure. Geosynth. Int. 2001, 8, 327–342. [Google Scholar] [CrossRef]
  20. Zhang, L.; Peng, B.C.; Xu, Z.Y.; Zhou, S. Shear performance of geosynthetic-encased stone column based on 3D-DEM simulation. Comput. Geotech. 2022, 151, 104952. [Google Scholar] [CrossRef]
  21. Ghazizadeh, S.; Bareither, C.A. Stress-controlled direct shear testing of geosynthetic clay liners II: Assessment of shear behavior. Geotext. Geomembr. 2018, 46, 667–677. [Google Scholar] [CrossRef]
  22. Triplett, E.J.; Fox, P.J. Shear strength of HDPE geomembrane/geosynthetic clay liner interfaces. J. Geotech. Geoenviron. 2001, 127, 543–552. [Google Scholar] [CrossRef]
  23. Selig, E.T.; Ingold, T.S. Laboratory pull-out testing of grid reinforcements in sand. Geotech. Test J. 1983, 6, 101–111. [Google Scholar]
  24. Alam, M.J.I.; Lo, S.R.; Karim, M.R. Pull-out behaviour of steel grid soil reinforcement embedded in silty sand. Comput. Geotech. 2014, 56, 216–226. [Google Scholar] [CrossRef]
  25. Palmeira, E.M. Soil-geosynthetic interaction: Modelling and analysis. Geotext. Geomembr. 2009, 27, 368–390. [Google Scholar] [CrossRef]
  26. Moraci, N.; Recalcati, P. Factors affecting the pullout behaviour of extruded geogrids embedded in a compacted granular soil. Geotext. Geomembr. 2006, 24, 220–242. [Google Scholar] [CrossRef]
  27. Gurung, N.A. Theoretical model for anchored geosynthetics in pull-out tests. Geosynth. Int. 2015, 7, 269–284. [Google Scholar] [CrossRef]
  28. Wang, Y.B.; Gao, D.L.; Fang, J. Finite element analysis of deepwater conductor bearing capacity to analyze the subsea wellhead stability with consideration of contact interface models between pile and soil. J. Petrol. Sci. Eng. 2015, 126, 48–54. [Google Scholar] [CrossRef]
  29. D’Aguiar, S.C.; Razavi, A.M.F.; Santos, J.A.; Caballero, F.L. Elastoplastic constitutive modelling of soil-structure interfaces under monotonic and cyclic loading. Comput. Geotech. 2011, 38, 430–447. [Google Scholar] [CrossRef]
  30. Abdelouhab, A.; Dias, D.; Freitag, N. Physical and analytical modelling of geosynthetic strip pull-out behaviour. Geotext. Geomembr. 2010, 28, 44–53. [Google Scholar] [CrossRef]
  31. Sugimoto, M.; Alagiyawanna, A.M.N. Pullout behavior of geogrid by test and numerical analysis. J. Geotech. Geoenviron. 2003, 129, 361–371. [Google Scholar] [CrossRef]
  32. Hussein, M.G.; Meguid, M.A. Improved understanding of geogrid response to pullout loading: Insights from three-dimensional finite-element analysis. Can. Geotech. J. 2020, 57, 277–293. [Google Scholar] [CrossRef]
  33. Ren, F.F.; Huang, Q.Q.; Liu, Q.; Wang, G. Numerical study on the pull-out behaviour of planar reinforcements with consideration of residual interfacial shear strength. Transp. Geotech. 2022, 35, 100766. [Google Scholar] [CrossRef]
  34. Saberi, M.; Annan, C.D.; Konrad, J.M. Implementation of a soil-structure interface constitutive model for application in geo-structures. Soil Dyn. Earthq. Eng. 2019, 116, 714–731. [Google Scholar] [CrossRef]
  35. ASTM. Standard Test Methods for Liquid Limit, Plastic Limit, and Plasticity Index of Soils; ASTM International: West Conshohocken, PA, USA, 2017. [Google Scholar]
  36. GB/T 50123-2019; Standard for Geotechnical Testing Method. China WaterPower Press: Beijing, China, 2019.
  37. Lin, C.; Wang, G.F.; Guan, C.; Feng, D.C.; Zhang, F. Experimental study on the shear characteristics of different pile-soil interfaces and the influencing factors. Cold Reg. Sci. Technol. 2023, 206, 103739. [Google Scholar] [CrossRef]
  38. Vangla, P.; Latha, G.M. Influence of particle size on the friction and interfacial shear strength of sands of similar morphology. Int. J. Geosynth. Groun. 2015, 1, 6. [Google Scholar] [CrossRef]
  39. Xu, L.J.; Wang, R.; Liu, Q.B.; Chen, J.F.; Wang, X.Z.; Meng, Q.S. Effect of particle size distribution on monotonic direct shear characteristics of geotextile/geogrid-calcareous sand interface. Appl. Ocean Res. 2023, 137, 103601. [Google Scholar] [CrossRef]
  40. Vangla, P.; Gali, M.L. Effect of particle size of sand and surface asperities of reinforcement on their interface shear behaviour. Geotext. Geomembr. 2016, 44, 254–268. [Google Scholar] [CrossRef]
  41. Namjoo, A.M.; Jafari, K.; Toufigh, V. Effect of particle size of sand and surface properties of reinforcement on sand-geosynthetics and sand-carbon fiber polymer interface shear behavior. Transp. Geotech. 2020, 24, 100403. [Google Scholar] [CrossRef]
  42. Gennaro, V.D.; Frank, R. Elasto-plastic analysis of the interface behaviour between granular media and structure. Comput. Geotech. 2002, 29, 547–572. [Google Scholar] [CrossRef]
  43. Duncan, J.M.; Chang, C.Y. Nonlinear analysis of stress and strain in soils. J. Soil Mech. Found. Div. 1970, 96, 1629–1653. [Google Scholar] [CrossRef]
  44. Xue, X.H.; Yang, X.G.; Liu, E.L. Application of the Modified Goodman Model in Soil Nailing. Int. J. Geomech. 2013, 13, 41–48. [Google Scholar] [CrossRef]
  45. Guo, Q.Q.; Pei, L.; Zhou, Z.J.; Chen, J.K.; Yao, F.H. Response surface and genetic method of deformation back analysis for high core rockfill dams. Comput. Geotech. 2016, 74, 132–140. [Google Scholar] [CrossRef]
  46. Daiyan, N.; Kenny, S.; Phillips, R.; Popescu, R. Investigating pipeline-soil interaction under axial–lateral relative movements in sand. Can. Geotech. J. Technol. 2011, 48, 1683–1695. [Google Scholar] [CrossRef]
  47. Saifi, F.; Javaud, M.; Haleem, A.; Anas, S.M. Computational fluid dynamics approach for predicting pipeline response to various blast scenarios: A numerical modeling study. CMES-Comp. Model. Eng. 2024, 140, 2747–2777. [Google Scholar] [CrossRef]
  48. Qiu, T.; Wang, W.B.; Höeg, K.; Feng, S.; Zhao, R. 3D analysis of the 174-m high Quxue asphalt-core rockfill dam in a narrow canyon. Soils Found. 2021, 61, 1645–1659. [Google Scholar] [CrossRef]
  49. Qu, Y.Q.; Zou, D.G.; Kong, X.J.; Xu, B. A novel interface element with asymmetric nodes and its application on concrete-faced rockfill dam. Comput. Geotech. 2016, 85, 103–116. [Google Scholar] [CrossRef]
  50. Shi, Y.Q.; Li, C.H.; Long, D.Y. Study of the microstructure characteristics of three different fine-grained tailings sand samples during penetration. Materials 2020, 13, 1585. [Google Scholar] [CrossRef]
  51. Bhardwaj, S.; Singh, S.K. Pile capacity under oblique loads-evaluation from load-displacement curves. Int. J. Geotech. Eng. 2015, 9, 341–347. [Google Scholar] [CrossRef]
  52. Wang, C.Y.; Ding, X.M.; Cao, G.W.; Jiang, C.Y.; Fang, H.Q.; Wang, C.L. Numerical investigation of the effect of particle gradation on the lateral response of pile in coral sand. Comput. Geotech. 2022, 152, 105012. [Google Scholar] [CrossRef]
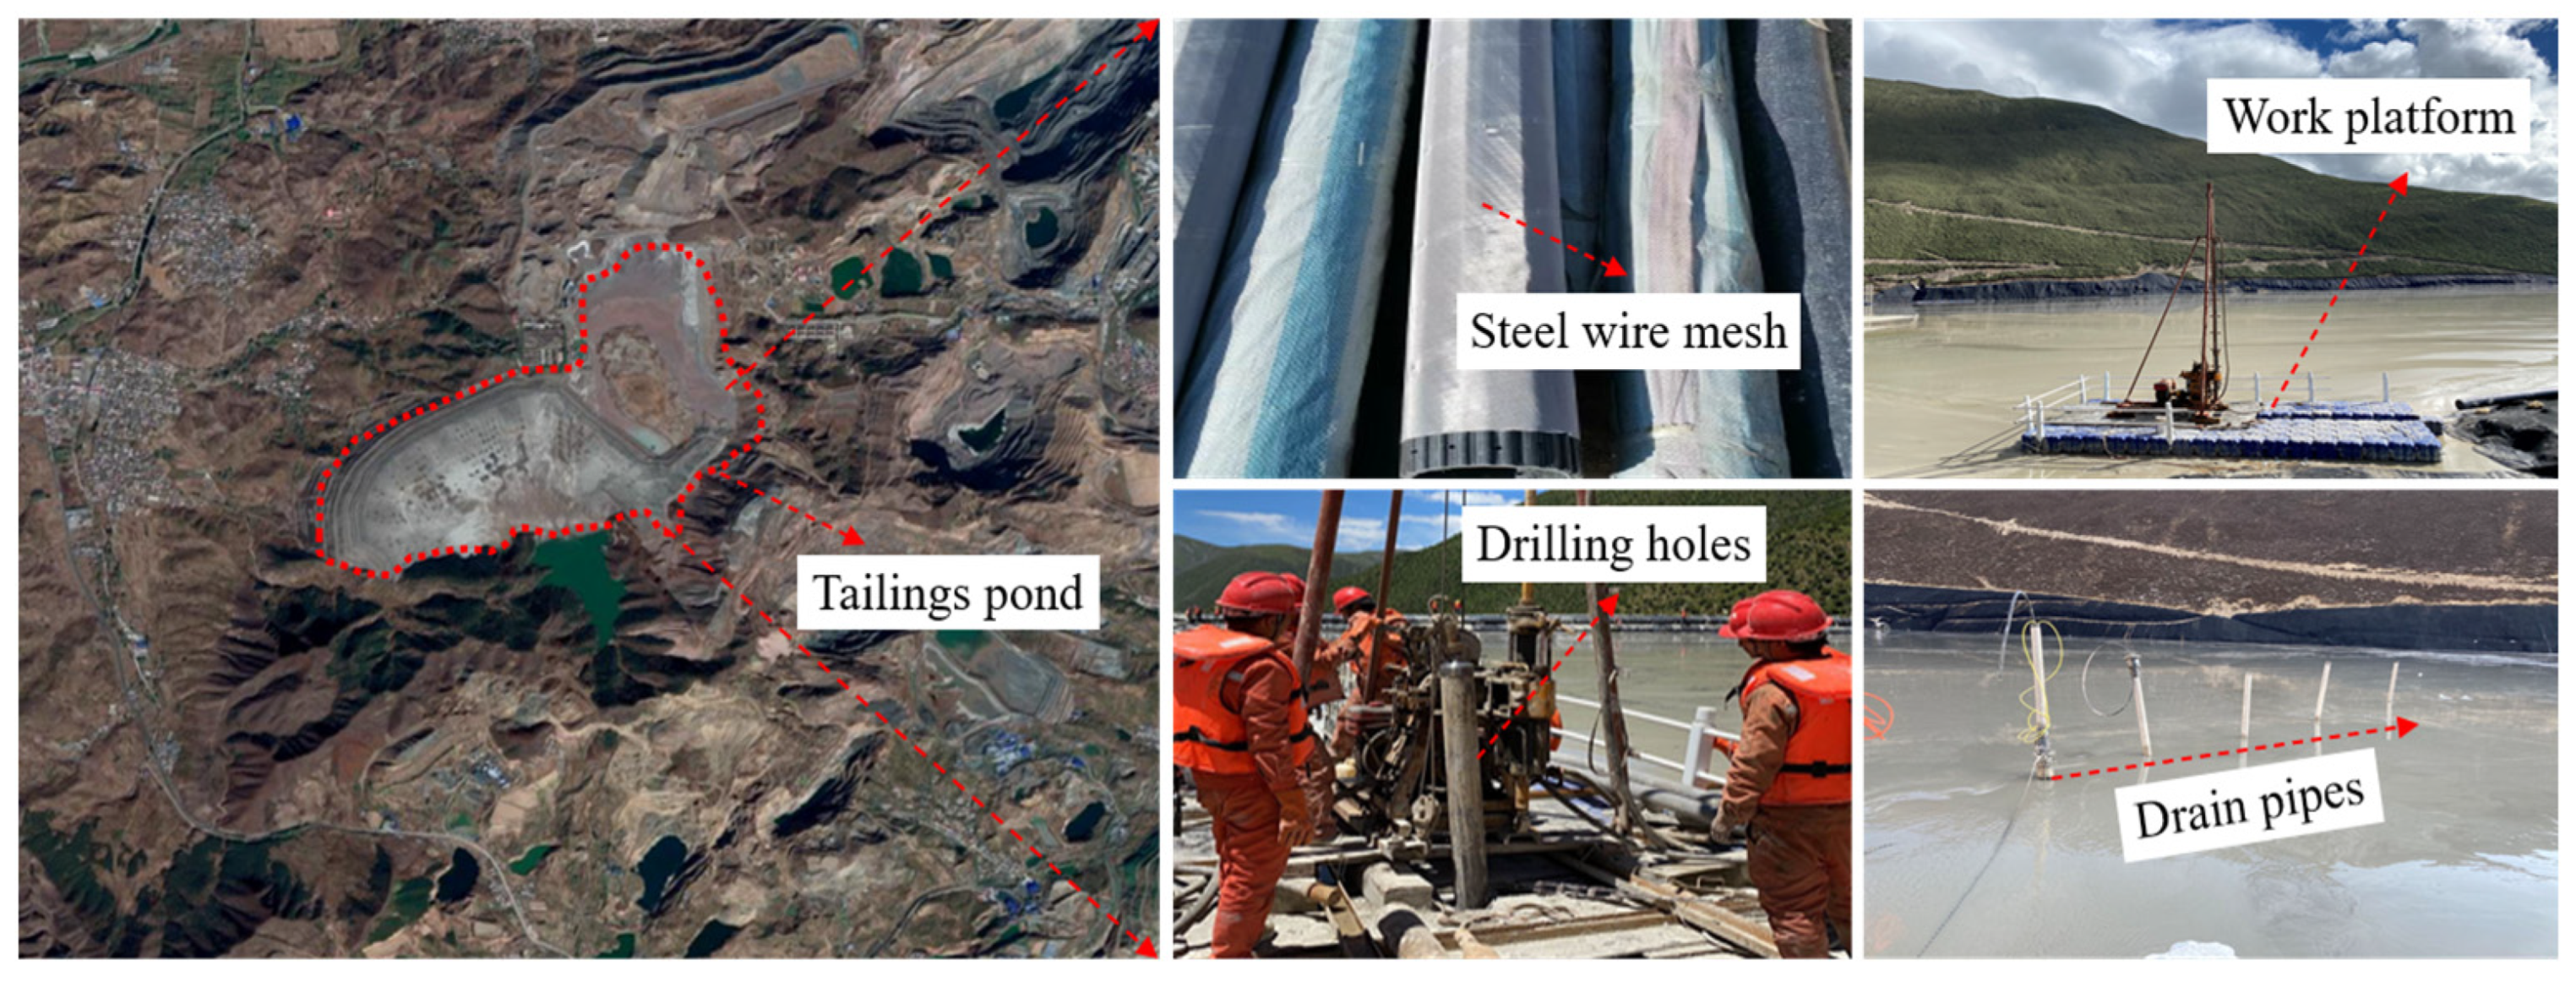
Figure 1. Satellite image of Xinshuicun tailings pond and layout of drain pipes on site.
Buildings 14 02554 g001
Figure 2. Grain size distribution of tailings.
Buildings 14 02554 g002
Figure 3. Mineral composition of tailings.
Buildings 14 02554 g003
Figure 4. Electronic microscope images of the steel wire mesh.
Buildings 14 02554 g004
Figure 5. Reproduction of the structure of the self-filtering layer. (a) Schematic diagram of self-filtering layer, and (b) tailings specimen.
Buildings 14 02554 g005
Figure 6. Grain size distribution of tailings adding coarse particles.
Buildings 14 02554 g006
Figure 7. Schematic diagram of interfacial shearing experiment.
Buildings 14 02554 g007
Figure 8. Shear stress–displacement curves of the tailings–steel wire mesh interface.
Buildings 14 02554 g008aBuildings 14 02554 g008b
Figure 9. Close-up view of tailing–steel wire mesh after shear test.
Buildings 14 02554 g009
Figure 10. Illustration of interlocking between tailings and steel wire mesh.
Buildings 14 02554 g010
Figure 11. Variation of shear strength with normal stress.
Buildings 14 02554 g011
Figure 12. Variation of shear strength with median particle size.
Buildings 14 02554 g012
Figure 13. Variation curve of interfacial cohesion and friction coefficient.
Buildings 14 02554 g013
Figure 14. Contrasts between exponential model and experimental results.
Buildings 14 02554 g014
Figure 15. Variation curve of initial shear stiffness with median particle size.
Buildings 14 02554 g015
Figure 16. Variation curve of initial shear stiffness with normal stress.
Buildings 14 02554 g016
Figure 17. Variation curve of parameter b with median particle size.
Buildings 14 02554 g017
Figure 18. Variation curve of parameter b with normal stress.
Buildings 14 02554 g018
Figure 19. Validation of the interface constitutive model: (a) 2D numerical model for interface shear test; (b) shear stress versus shear displacement.
Buildings 14 02554 g019
Figure 20. Mesh diagram of FEM.
Buildings 14 02554 g020
Figure 21. Validation of the D–C constitutive model: (a) 3D FE mesh for triaxial tailings specimen; (b) deviatoric stress versus axial strain.
Buildings 14 02554 g021
Figure 22. Load–displacement curves of drain pipes.
Buildings 14 02554 g022
Figure 23. Pull-out bearing capacity of drain pipes.
Buildings 14 02554 g023
Figure 24. Pull-out bearing capacity of drain pipes: (a) different pipe length; (b) different pipe diameter.
Buildings 14 02554 g024
Figure 25. Distribution of the negative skin friction: (a) different load; (b) different median particle size.
Buildings 14 02554 g025
Figure 26. Distribution of the axial force: (a) different load; (b) different median particle size.
Buildings 14 02554 g026
Table 1. Basic physical and mechanical indices of tailings.
Specific GravityDry
Density (g/cm3)
Liquid Limit
(%)
Plastic Limit
(%)
CuCcCohesion
(kPa)
Internal
Friction
Angle (°)
3.131.7124.7415.4917.561.2414.6233.42
Table 2. The Goodman contact parameters.
K1K2nRfδγwPa
8008000.060.7436.610100
Table 3. Parameters of Duncan–Chang model.
MaterialK0nRfcφGDFKurΔφ
Silty428.80.320.820.5628.60.380.270.1879000
Silty sand315.70.250.8514.5636.50.420012000
Disclaimer/Publisher’s Note: The statements, opinions and data contained in all publications are solely those of the individual author(s) and contributor(s) and not of MDPI and/or the editor(s). MDPI and/or the editor(s) disclaim responsibility for any injury to people or property resulting from any ideas, methods, instructions or products referred to in the content.