Article

Protective Effects of Small Molecular Inhibitors on Steel Corrosion: The Generation of a Multi-Electric Layer on Passivation Films

1
Department of Civil Engineering, Qingdao University of Technology, Qingdao 266520, China
2
Institute of Qingdao First Municipal Engineering, Qingdao 266033, China
3
Institute of Beijing Capital Transportation Development, Beijing 102628, China
4
Research Center of CCCC Second Harbour Engineering, Wuhan 430040, China
*
Author to whom correspondence should be addressed.
Buildings 2024, 14(8), 2558; https://doi.org/10.3390/buildings14082558
Submission received: 12 July 2024 / Revised: 12 August 2024 / Accepted: 15 August 2024 / Published: 20 August 2024
(This article belongs to the Special Issue Characterization and Design of Cement and Concrete Materials)

Abstract

:
The durability of reinforced concrete structures is significantly influenced by the effectiveness of small molecular inhibitors in preventing the corrosion of steel reinforcements. In a concrete environment, the passive film on steel bars serves as a critical protective component. In this study, a molecular dynamics (MD) simulation is used to study the inhibition mechanism of chloride ions by common corrosion inhibitors (2-Amino-2-thiazoline) in concrete in an excess chloride solution. The results reveal that inhibitors adsorb onto the steel surface primarily through van der Waals forces, with more than 90% of the adsorption occurring vertically. Despite this strong adsorption, inhibitors alone do not form a protective film. In the presence of chloride ions, which frequently penetrate concrete, the coverage rate of inhibitors on the steel surface decreases from 74% to 64%. Nevertheless, inhibitor molecules still provide substantial protection in chloride-rich concrete environments. Further analysis indicates that inhibitor molecules inhibit chloride ions in two ways. Corrosion inhibitor molecules actively desorb from the steel surface to capture chloride ions and prevent them from approaching. Additionally, inhibitors form a multi-electron layer on the steel surface to enhance passive film protection and hinder chloride ion diffusion through Coulombic interactions.

Graphical Abstract

1. Introduction

Reinforced concrete (RC) is a crucial foundation structure in marine engineering construction, but its durability is a significant challenge in civil engineering today [1,2,3,4,5,6,7,8]. The harsh ocean environment, characterized by high salt and humidity, causes the severe corrosion of steel bars in RC, leading to the deterioration of the structure and reduced durability. To address this issue, corrosion inhibitors are favored for their low cost and ease of handling [9,10,11]. These inhibitors can effectively slow down the corrosion of metals and alloys and have been widely used in the petroleum industry to prevent the corrosion of equipment by acidic media. In recent years, their application in concrete has gradually increased [12,13,14]. However, the inhibition mechanism of corrosion inhibitors in concrete, including physical and chemical actions, has not been thoroughly studied.
The steel in concrete is passive [15,16], and active corrosion occurs only when the steel’s passivation film is destroyed. In marine environments, chloride is the primary culprit responsible for the destruction of the passivation film of steel [17,18,19]. According to Díez-Pérez et al. [20], when the chloride content reaches a certain threshold, the passivation film’s structure changes, leading to pitting corrosion. Therefore, inhibiting chloride ions from reaching the steel surface is essential. Some researchers have investigated the effectiveness of corrosion inhibitors in chlorinated environments [21,22,23]. Organic inhibitors have received considerable attention due to their remarkable application effect and environmentally friendly nature. Organic corrosion inhibitors form a protective film by adsorbing onto the metal surface, and functional groups with electronegativities, such as the electron, conjugate double bond, and aromatic ring, play a critical role in improving the inhibitor’s effectiveness [24,25,26]. Tang [27] proposed that organic corrosion inhibitors are adsorbed on the metal surface by polar heads (physical and/or chemical adsorption), while non-polar tails are oriented and densely aligned perpendicular to the metal surface, forming a tight protective film. Souza et al. [28] investigated the corrosion inhibition of mild steel by caffeic acid and found that it decreased the effective area of the cathodic reaction and changed the activation energy of the anodic reaction. Moretti et al. [29] studied the effect of tryptamine (TA) on the corrosion behavior of ARMCO iron and found that TA acts through chemical adsorption on the metal surface or by forming an iron complex.
In recent years, there has been significant interest in thiazoline and its derivatives as a new organic corrosion inhibitor [30,31]. Numerous studies have demonstrated their efficacy in inhibiting the corrosion of metals, such as steel bars and copper. Additionally, thiazoline derivatives are five-membered aromatic heterocyclic compounds that can be designed with diverse structures. Shih et al. [32] discussed various methods for synthesizing thiazoline derivatives. However, the corrosion inhibition potential of thiazoline derivative 2-Amino-2-thiazoline (containing an amino group and double bonds) remains unclear. Zhang et al. [33] proposed using 2-Amino-2-thiazoline as a raw material to synthesize an adsorbent for precious metal recovery, suggesting that ATL (2-Amino-2-thiazoline) can adsorb on the metal surface. Nonetheless, it is still unknown whether a small amount of ATL can form an adsorption film on the surface of carbon steel to protect steel bars, and the specific mechanism of its action is difficult to elucidate experimentally. Thus, a further exploration at the nanoscale is necessary.
Molecular dynamics simulation has emerged as a powerful method for investigating the microscopic properties of materials at the nanoscale in recent decades [34,35]. It provides information that is challenging to obtain experimentally. Currently, some scholars are employing MD simulations to study surface interactions between inhibitors and metals/metal oxides. For instance, Zhang et al. [36] investigated the corrosion inhibition efficiency of 2-mercaptobenzothiazole derivatives on N80 steel. The MD simulation results showed that mercaptobenzothiazole rings attach to the surface, while the long nonpolar tail is orthogonal to the surface, leading to a significant inhibition of N80 steel corrosion. Similarly, Alibakhshi et al. [37] used MD simulations to study the effect of Glycyrrhiza glabra leaf extracts on the corrosion control of mild steel in a 1 M HCl solution. The results revealed that the organic inhibitor from Glycyrrhiza glabra leaves adsorbs to steel iron through donor–acceptor interactions of their reactive sites, forming an anti-corrosion film. These studies provide insights into the role of corrosion inhibitors at the nanoscale.
In this study, we studied the protective effect of the ATL molecule (containing an amino group, carbon–nitrogen double bonds, and hetero-atom sulfur as corrosion inhibitors) on a matrix in an excess chloride solution. We conducted a systematic study using MD simulations to investigate the adsorption model and inhibition effect at the nanoscale. Finally, the main functional groups of ATL and the mechanism of its inhibition of chloride ions were revealed. These findings provide valuable information for promoting and applying migratory inhibitors and designing anticorrosive materials for the marine environment.

2. Models and Simulation Details

2.1. Modeling Details

Previous studies have demonstrated the sustained-release inhibition capabilities of thiazoline derivatives [30,31]. In this research, 2-Amino-2-thiazoline (ATL) was utilized as a migration inhibitor in simulations, as depicted in Figure 1b. To simulate carbon steel, iron was employed, and its unit cell structure is illustrated in Figure 1a. The surface of carbon steel was modeled using the [010] direction of iron. To observe the inhibition effect of inhibitors on chloride ions, three models were established by considering corrosion inhibitor molecules and chloride ions as variables. The three models were defined as model 1, model 2, and model 3. In all models, the three-dimensional size of the iron was 30 Å × 22 Å × 30 Å, and 2000 water molecules were placed from 25 Å to 75 Å. The chloride concentration was 1.5%. In model 1, 20 ATL molecules were placed from 26 Å to 32 Å as depicted in Figure 1c. In model 2, 30 sodium and chloride ions were randomly distributed above the iron. In model 3, 20 ATL molecules and 30 sodium and chloride ions were added in the same position as model 1 and model 2, as shown in Figure 1e. The primal model was generated by Packmol software (Version 20.3.3) [38]. To eliminate the influence of periodic boundary conditions (PBCs) between the upper and lower interfaces, a vacuum layer with a height of 150 Å was set in the [010] direction.

2.2. Molecular Dynamics Simulation

Lammps (Large-scale Atomic/Molecular Massively Parallel Simulator) software (LAMMPS 2001) [39] is widely used for nanoscale molecular simulations in materials science. To make the model more reasonable, the iron was set to a rigid body during the simulation. The simulation began after energy minimization. We used the OPLS-AA force field by W. L. Jorgensen et al. [40] to describe the interaction between atoms in the simulation process. Ezquerro et al. [41] applied the OPLS-AA force field to the composite system of inorganic/organic nanomaterials. These parameters are taken from those distributed with BOSS Version 4.8. Water was Tip3 type. The PPPM summation [42] was used to treat the long-range electrostatic interactions. The Nosè–Hoover [43] thermostat was used to keep the model temperature at 298 K under the NVT ensemble. And each model was simulated at 2ns with a 0.25 fs time step. The output data every 1000 steps were calculated for later statistical processing. VMD [44] software (version 1.9.3) was used to observe the atomic movement process for the preliminary judgment. The microscopic mechanism of action is reflected by radial distribution functions (RDFs), time correlation functions (TCFs), and other data.

3. Results and Discussion

3.1. ATL Inhibiting Effect

The way the inhibitor molecule acts on the surface will directly affect its inhibitory effect. To understand the adsorption method of ATL and its inhibitory effect on chlorides ions, we selected the final stage of the simulation for analysis, as shown in Figure 2. It can be seen that many ATL molecules adsorb at the iron surface, but only a small part moves into the solution (Figure 2(a1)). At the same time, we can observe that their adsorption forms are different, but they are all close to vertical adsorption. And the surface of the iron is not completely covered. This indicates that some of the ATL cannot form a protective film on the surface of the iron. And more than 90% of the ATL use alkanes on the iron surface, as shown in Figure 2(b1,c1). This indicates they adsorb the iron surface by van der Waals forces [45].
Next, we considered model 2 that contains only chloride ions. The simulation results show that chloride ions can approach the surface of iron in the absence of corrosion inhibitors (Figure 2(a2)), as illustrated by the plane projection (X-Z planes) below 30 Å (Figure 2(b2)). In contrast, the simulation results for Model 3 show that chloride ions near the iron surface are replaced by sodium ions in the presence of ATL molecules (Figure 2(a3)). This indicates that there are no more chloride ions on the surface of the iron. Chloride ions cannot penetrate the layer where ATL molecules are present, and there are no chloride ions below 30Å in Figure 2(b3,c3). These findings suggest that, even though ATL molecules do not form a protective film on the surface of iron, they still exhibit substantial inhibitory effects in the presence of excessive chloride. In order to further understand the role of ATL molecules, we analyzed the one-dimensional density distributions of ATL molecules, chloride ions, and sodium ions.

3.2. Density Distribution of Each Part of the System

The one-dimensional density distribution is an effective means of assessing the centralized location of corrosion inhibitor molecules [46,47]. As demonstrated in Figure 3a, it is evident that the ATL molecules are highly concentrated at 28 Å, regardless of the presence of chloride ions. This observation indicates that a majority of the ATL molecules are absorbed into the iron surface. However, upon the addition of chloride ions, the peak value at the top decreases, indicating that some ATL molecules tend to desorb. Moreover, the density curve of chloride ions shifts to the right, and the first peak significantly decreases after the addition of ATL molecules, as depicted in Figure 3b. This suggests that ATL molecules not only increase the distance between chloride ions and the iron surface, but also prevent most of the chloride ions from reaching 32 Å, which is consistent with our preliminary observation in Figure 2(c3). Figure 3c illustrates that the minimum distance between sodium ions and the iron surface increases after adding ATL molecules. These data suggest that the presence of ATL molecules has an effect on the iron surface, which influences the diffusion of chloride and sodium ions, particularly chloride ions. In the following analysis, we will compare the differences in their adsorption planes through the two-dimensional density distribution.
The molecular distribution in the adsorption plane can reflect the aggregation degree and coverage ratio [48]. The adsorption plane (the X-Z surface, Y < 30 Å) data are counted. They are mainly divided into the ATL molecule, chloride ion, and water molecule systems. The red part represents the distribution of chloride ions. As shown in Figure 4(a1,a2), when there are only corrosion inhibitor molecules in the system, the coverage rate of ATL molecules for the iron is about 74%. The coverage rate was reduced to 64% after adding excessive chloride ions. It is further illustrated that the chloride ion induces its desorption behavior on the iron surface. By comparing Figure 4(b1,b2), it is found that model 3 does not have any chloride ions in the plane. The figure shows that ATL molecules exhibit good resistance to chloride ions. The distribution of water molecules on the iron surface is illustrated in Figure 4(c1,c2). Upon the addition of ATL molecules into the system, the number of water molecules reaching the surface of the iron decreases significantly. This reduction indicates that the transmission of chloride ions to the surface through water is inhibited by ATL molecules.
Even in an overchlorinated environment, the coverage of ATL molecules on the iron surface drops to two thirds. However, chloride ions still cannot reach the surface of the iron, which indicates that ATL molecules can still show a good inhibition ability concerning chloride ions, even if they cannot form films on the surface of iron. Therefore, our results suggest that ATL molecules have great potential as migration inhibitors. To provide further insights, we analyze the free energy variation (related to the free diffusion distribution) in the ATL molecules of chloride ions.
The diffusion of matter within a system is a thermodynamic process, and the free energy [49,50] represents the portion of the system’s reduced internal energy that can be converted into external work during a specific thermodynamic process. It is a crucial indicator that reflects the concentration position and free diffusion distribution of matter, and it helps in determining the primary factors that influence changes in free energy. The calculation method used in this study adheres to the Coulomb force formula, and we focus on computing the free energy changes for ATL, chloride ions, and sodium ions. The calculation formula is as follows:
E = −KbT lnρ(v)
Kb is the Boltzmann’s constant. T is the temperature of the system, and here it is 298 K. ρ(v) is the ratio of density to average density. From the Coulomb force formula, at infinity, the free energy is close to zero.
As shown in Figure 5a, ATL molecules’ potential wells appear at 28 Å. The lower the energy, the more stable the molecule is. It indicates most of the ATL molecules adsorb here. The weakening of the potential well after the addition of chloride ions indicates that part-ATL molecules do not easily appear there but enter the solution. The change in the free energy of chloride ions indicates that they are relatively concentrated around 33 Å, as shown in Figure 5b. After adding ATL, the first potential well at 33 Å is significantly weakened. And the second potential well forms at 44 Å. This indicates that most chloride ions are no longer readily present on the iron surface. Instead, they are trapped at the second potential well. This is consistent with our previous observations that the chloride ions’ diffusion process was inhibited by ATL molecules. As can be seen in Figure 5c, some sodium ions are concentrated at 35 Å. But, the overall change is a small and relatively uniform diffusion. When ATL molecules are added, the free energy curve of the sodium ion is a straight line. The difference between the two curves before and after the comparison is small, indicating that the ATL has less influence on it. These phenomena suggest that the action of ATL molecules on the iron surface can prevent the approach of chloride and sodium ions. And, they have a significant effect on chloride ions.
Figure 2, Figure 3, Figure 4 and Figure 5 show that the presence of chloride ions in the system reduces the coverage of ATL on the iron surface. However, it still shows good effectiveness when resisting chloride ions. Therefore, ATL molecules do not protect the substrate by forming a protective film on the iron surface. Even with small amounts of ATL molecules, excessive chloride ions are blocked. The interactions in the system can be divided into two parts: (1) between iron and chloride ions, and (2) between ATL and chloride ions. The fact that chloride ions are no longer in close proximity to the iron surface suggests that the addition of the corrosion inhibitor affects one or both of these interactions. However, it is unclear whether the ATL inhibitor works through its functional groups or as a whole. Additionally, the mechanism behind the weakening of the chloride ion’s potential and the desorption of ATL, as well as the mechanism underlying its anti-chloride ion behavior, remain largely unknown. To shed light on these questions, we need to understand the interactions between atoms at the nanoscale. We will conduct a deep analysis of the data using techniques such as radial distribution function, time correlation function, and charge distribution.

3.3. Micro-Data Analysis

The influence of different molecules on the microstructure of the system was evaluated by calculating the molecular configuration of the corrosion inhibitor, the configuration of the chloride ion, and the relative density distribution of the order parameter [51,52] (Sm) in both configurations, as shown in Figure 6a, which is an important parameter to evaluate the degree of molecular order. And Sm is expressed as:
S m = 1 2 3 c o s 2 β 1
In the equation, β is the angle between two orientations of the water dipole. The closer the value is to −0.5, the more disordered it is, and the closer to 1, the more ordered it is. The order indicates the greater influence of the external environment. The dipole distribution is an intuitive parameter reflecting the distribution of water molecules in different directions, which can directly reflect the degree of water aggregation and equilibrium, as shown in Figure 6b. It is of great value for us to evaluate the influence of different molecular additions and combined actions on water distribution.
Figure 6a shows that low-order water remains unchanged with the addition of chloride ions and ATL molecules to the solution for all three systems, while highly ordered water experiences weak changes without any apparent regular pattern, indicating that the water molecules are intricately influenced by the environment. Figure 6b illustrates the effects of chloride ions and ATL molecules on the dipole direction distribution of water molecules, which is a valuable parameter to evaluate the impact of different molecular additions and combined actions on water distribution. The distribution of water molecules is mostly uniform, except for high values at 0°, 180°, and between 260° and 280°. The 180° position represents the iron surface, indicating that some water molecules can reach the surface. The water distribution of the three systems shows regularity between 260° and 280°, with model 1 having the highest distribution, followed by model 2 and model 3. This suggests that both chloride ions and ATL molecules adsorb water to the left when they exist alone. When the two coexist, their interaction is prioritized, leading to decreased water adsorption. However, this effect is weak due to the overall larger quantity of water molecules compared to ATL molecules and chloride ions in the system.
What effect will the addition of ATL molecules have on chloride ions in the system? To explore this question, we utilized radial distribution functions (RDFs) [53,54,55], which are commonly used to characterize the interactions between atoms and structures within a given configuration. Further analyzing model 3, we observed that most ATL molecules use their amino groups to interact with chloride ions, as depicted in Figure 7(b1). Based on this finding, we postulated that the amino group likely plays a crucial role in mediating the interaction with the chloride ion. To further investigate this hypothesis, we calculated the interactions between carbon and nitrogen atoms located at various positions on the ATL molecule and chloride ions, as shown in Figure 7(a1–a3). In addition, we also analyzed the changes in the interaction between amino nitrogen and hydrogen atoms in different ATL molecules in the presence or absence of chloride ions. Our analysis focuses on the part of the ATL molecule that has the main inhibitory effect on chloride ions.
Figure 7(a1) illustrates the presence of three distinct types of carbon atoms on the ATL molecule. Notably, the interaction between C7 and chloride ions is the strongest, as indicated in Figure 7c, where the interaction peak between C4 and C5 and chloride ions occurs at 4.8 Å and is relatively higher for C4 than C5. Furthermore, carbon atoms with a C-S bond, C-N double bond, and amino triple bond attract more chloride ions and exhibit a strong interaction. A comparison of the Amino nitrogen and carbon–nitrogen double-bond revealed that the amino nitrogen displayed an earlier and more pronounced interaction peak with the chloride ion, as depicted in Figure 7d. Upon the addition of chloride ions (in model 3), the ATL molecule moved toward the chloride ion, as shown in Figure 7(b2). Consequently, the distance between the two amino groups decreased, and the density of hydrogen atoms around the amino nitrogen increased. Figure 7e highlights a significant enhancement in the interaction between amino groups in the presence of chloride ions, thereby further confirming our hypothesis that ATL relies on amino groups to resist chloride ions.
Based on RDF analysis, it can be concluded that the inhibitor molecule mainly relies on the amino group to resist chloride ions. The interaction of chloride ions with carbon–nitrogen double bonds on the chain is relatively small.
The stability of this interaction can be studied by using the time correlation function (TCF) [56,57]. The TCF of non-covalent bonds is calculated by the following formula:
C t = < δ b ( t ) δ b ( 0 ) > δ b ( 0 ) δ b ( 0 )
where δb(t) is a binary operator. If a non-covalent bond is formed, δb(t) is equal to 1; otherwise, it is equal to 0. Therefore, we can evaluate the average duration of the interacting pair by calculating the TCF. The TCF value decreases gradually from 1 to 0. The closer the TCF value is to 1, the more stable the interaction is, and the closer the TCF value is to 0, the more unstable the interaction is.
As shown in Figure 8a, the TCF value of interaction between carbon atoms and chloride ions at different positions drops rapidly within 100 ps and then tends to be stable. It means that most of the non-covalent bonds between carbon and chlorine have been broken. However, the destruction of non-covalent bonds by C7-chlorine is relatively less. This indicates its stability is higher than that of other interacting pairs. Nitrogen–chlorine pairs also showed a rapid decline and then a gentle trend within 100 ps, as shown in Figure 8b. Amino nitrogen interacts more stably with the chloride ion than the double-bonded nitrogen. Based on the previous RDF analysis, the interaction between amino and chloride ions is strong and relatively stable. As shown in Figure 8c, the TCF values of the internal nitrogen–hydrogen interaction pair of the amino group show a gentle downward trend with or without chloride ions. It indicates that most non-covalent bonds create damage, but the damage rate is relatively slow. However, in the presence of the chloride ion, the TCF value is lower, indicating that chloride ion promotes the destruction of the pair of nitrogen–hydrogen interaction.
RDF data show that the interaction between carbons (amino-linked) and chloride ions is the most obvious, and chloride ions enhance the interaction between amino groups. The stability of this interaction can also be observed by the time evolution of the relative content of the number of C-H bonds to chlorine and nitrogen at different locations [52]. As shown in Figure 9, 1 is the relative content of the stable value of the number of keys. If the ordinate value exceeds 1, this indicates the formation of a bond; if the ordinate value is lower than 1, this indicates the breaking of a bond.
Figure 9a shows that the bonding number between C4 (sulfur-linked) and C5 (nitrogen-linked) with chloride ions exhibits minor changes in the whole simulation process. In the later stages of the simulation, the number of carbon atoms near the amino group bonded to chlorine increased significantly. This indicates that the interaction between chloride ions and carbon atoms became more stable in the later stages. More C7-Cl bonds were generated, suggesting that ATL actively desorbs from the iron surface to bond with chloride ions. This observation is consistent with the calculated TCF value. In Figure 9b, we can observe an obvious periodic oscillation process in the number of nitrogen–hydrogen bonds in the amino group after the addition of chloride ions. This suggests that chloride ions are constantly moving around the amino group.
During the whole process, we found that ATL molecules prevent chloride ions from approaching the iron surface as an active process. First, the surface-adsorbed ATL molecules showed that chloride ions were about to approach the iron surface. Then, it actively desorbs the iron surface and moves toward chloride ions, as shown in Figure 10b,c. They move close to the chloride ions and capture it. Finally, the chloride ions are expelled so that they cannot continue to approach the iron surface. Therefore, in the presence of chloride ions, the density of ATL molecules near the surface of the iron decreases, as shown in Figure 3a. Next, we will explore the reasons for the weakening of the potential barrier by calculating the surface charge concentration.
The distribution of surface charge directly reflects the position and concentration of charges, allowing us to assess the interaction between different components [58,59]. Charge distribution is a critical parameter in determining whether electron transfer or an electron layer is present. In this study, we analyzed the total charges and their respective positive and negative charges of the ATL molecule, chloride, and sodium ions in the system alone and all three in the system in the vertical plane (Figure 11). We assumed that water molecules do not have any charge, and the iron surface has no charge.
As depicted in Figure 11a, there is no obvious difference between the positive and negative charge curves of ATL molecules and the whole system, which almost coincide on the surface of the iron (concentrated at 28 Å), indicating a state of charge equilibrium. These findings suggest that the iron surface is primarily coated with ATL. Upon further analysis of the ATL molecule, its total charge on the iron surface oscillates between positive and negative charges several times before becoming a straight line. This suggests that ATL molecules form a multi-electron layer on the iron surface. The Coulomb force between the multi-electron layer and chloride ions affects ions distribution. For instance, the chloride ion encounters the negative electron layer at 29 Å but cannot cross the potential barrier of the negative electron layer due to the Coulomb repulsion, thereby blocking the further movement of chloride ions toward the iron surface. On the other hand, the Coulomb attraction of sodium is strong when it hits the negative shell, allowing it to move further and closer to the iron surface. But, it is immediately blocked by the Coulomb repulsion of the adjacent positron shell. Consequently, sodium ions are closer to the iron surface than chloride ions but cannot reach it.
As shown in Figure 5b, in the molecular system without ATL, the chloride and sodium ions diffuse freely near the iron surface. We believe that the presence of the multi-electron layer on the iron surface is responsible for the change in the chloride ion barrier. Figure 11c is a simplified schematic diagram of the multi-electron layer formed by the ATL molecules. The outermost layer of the ATL molecule behaves as a negatively charged layer, and the negatively charged chloride ions are preferentially repelled due to the Coulomb force. This allows most chloride ions to be distributed higher up, forming a barrier curve at 40 Å (as shown in Figure 5b). There are fewer chloride ions close to the surface of the iron, resulting in a lowering of the potential barrier. The sodium ions are preferentially attracted to the negatively charged layer, but are repelled by the positively charged layer behind them. Therefore, the free energy of sodium ions changes less.
In summary, the ATL molecules on the iron surface resist chloride ions from approaching the iron through active desorption. And a multi-electric layer is formed on the vertical surface. The chloride ion is shielded by the Coulomb force so that it cannot cross the barrier of the negative layer. Obtaining fewer inhibitors can block more corrosive anions, indicating that the molecule has good engineering application prospects.

4. Conclusions

In this work, MD simulations were used to explore the mechanism by which ATL inhibits chloride ions. We found that a small amount of ATL molecules can inhibit excess chloride ions and revealed its nanoscale mechanism of inhibiting chloride ions. The ATL molecules actively prevent chloride ions from being close to the iron surface. The ATL molecules inhibit chloride ions in two ways: by actively trapping chloride ions, and by forming a double electric layer on the surface of the matrix to inhibit chloride ions by the Coulomb force. The major conclusions are as follows:
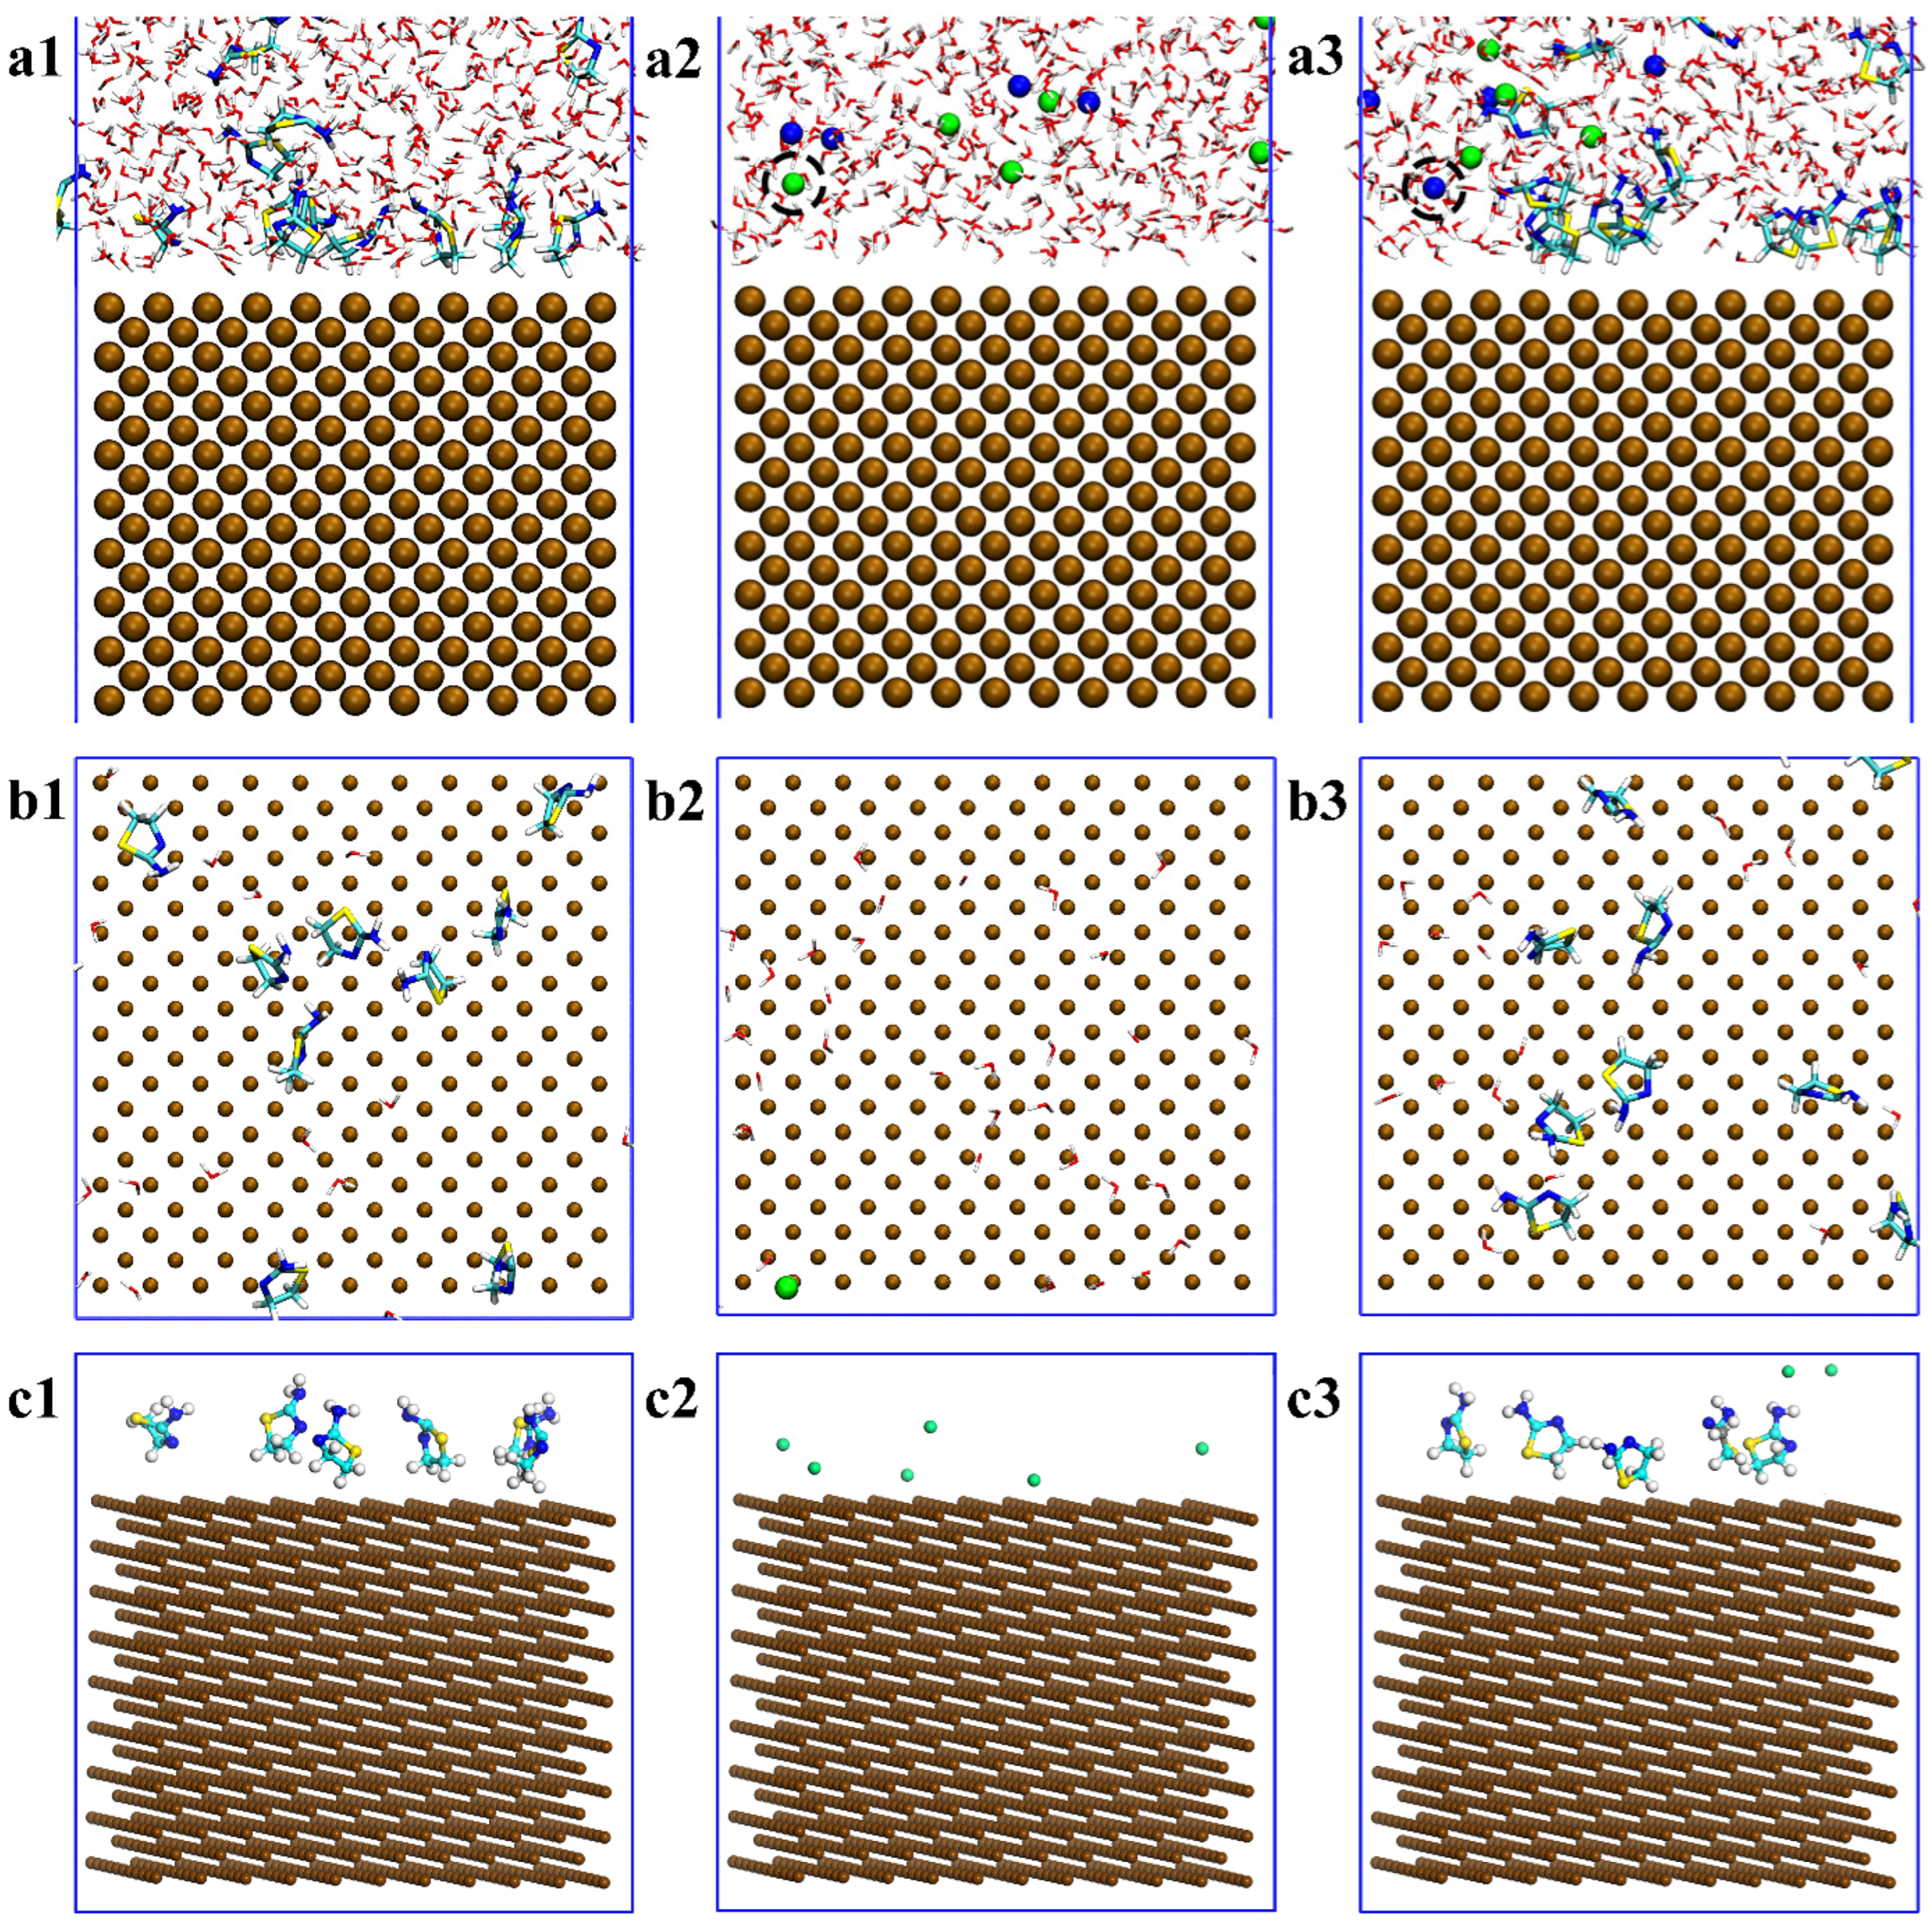
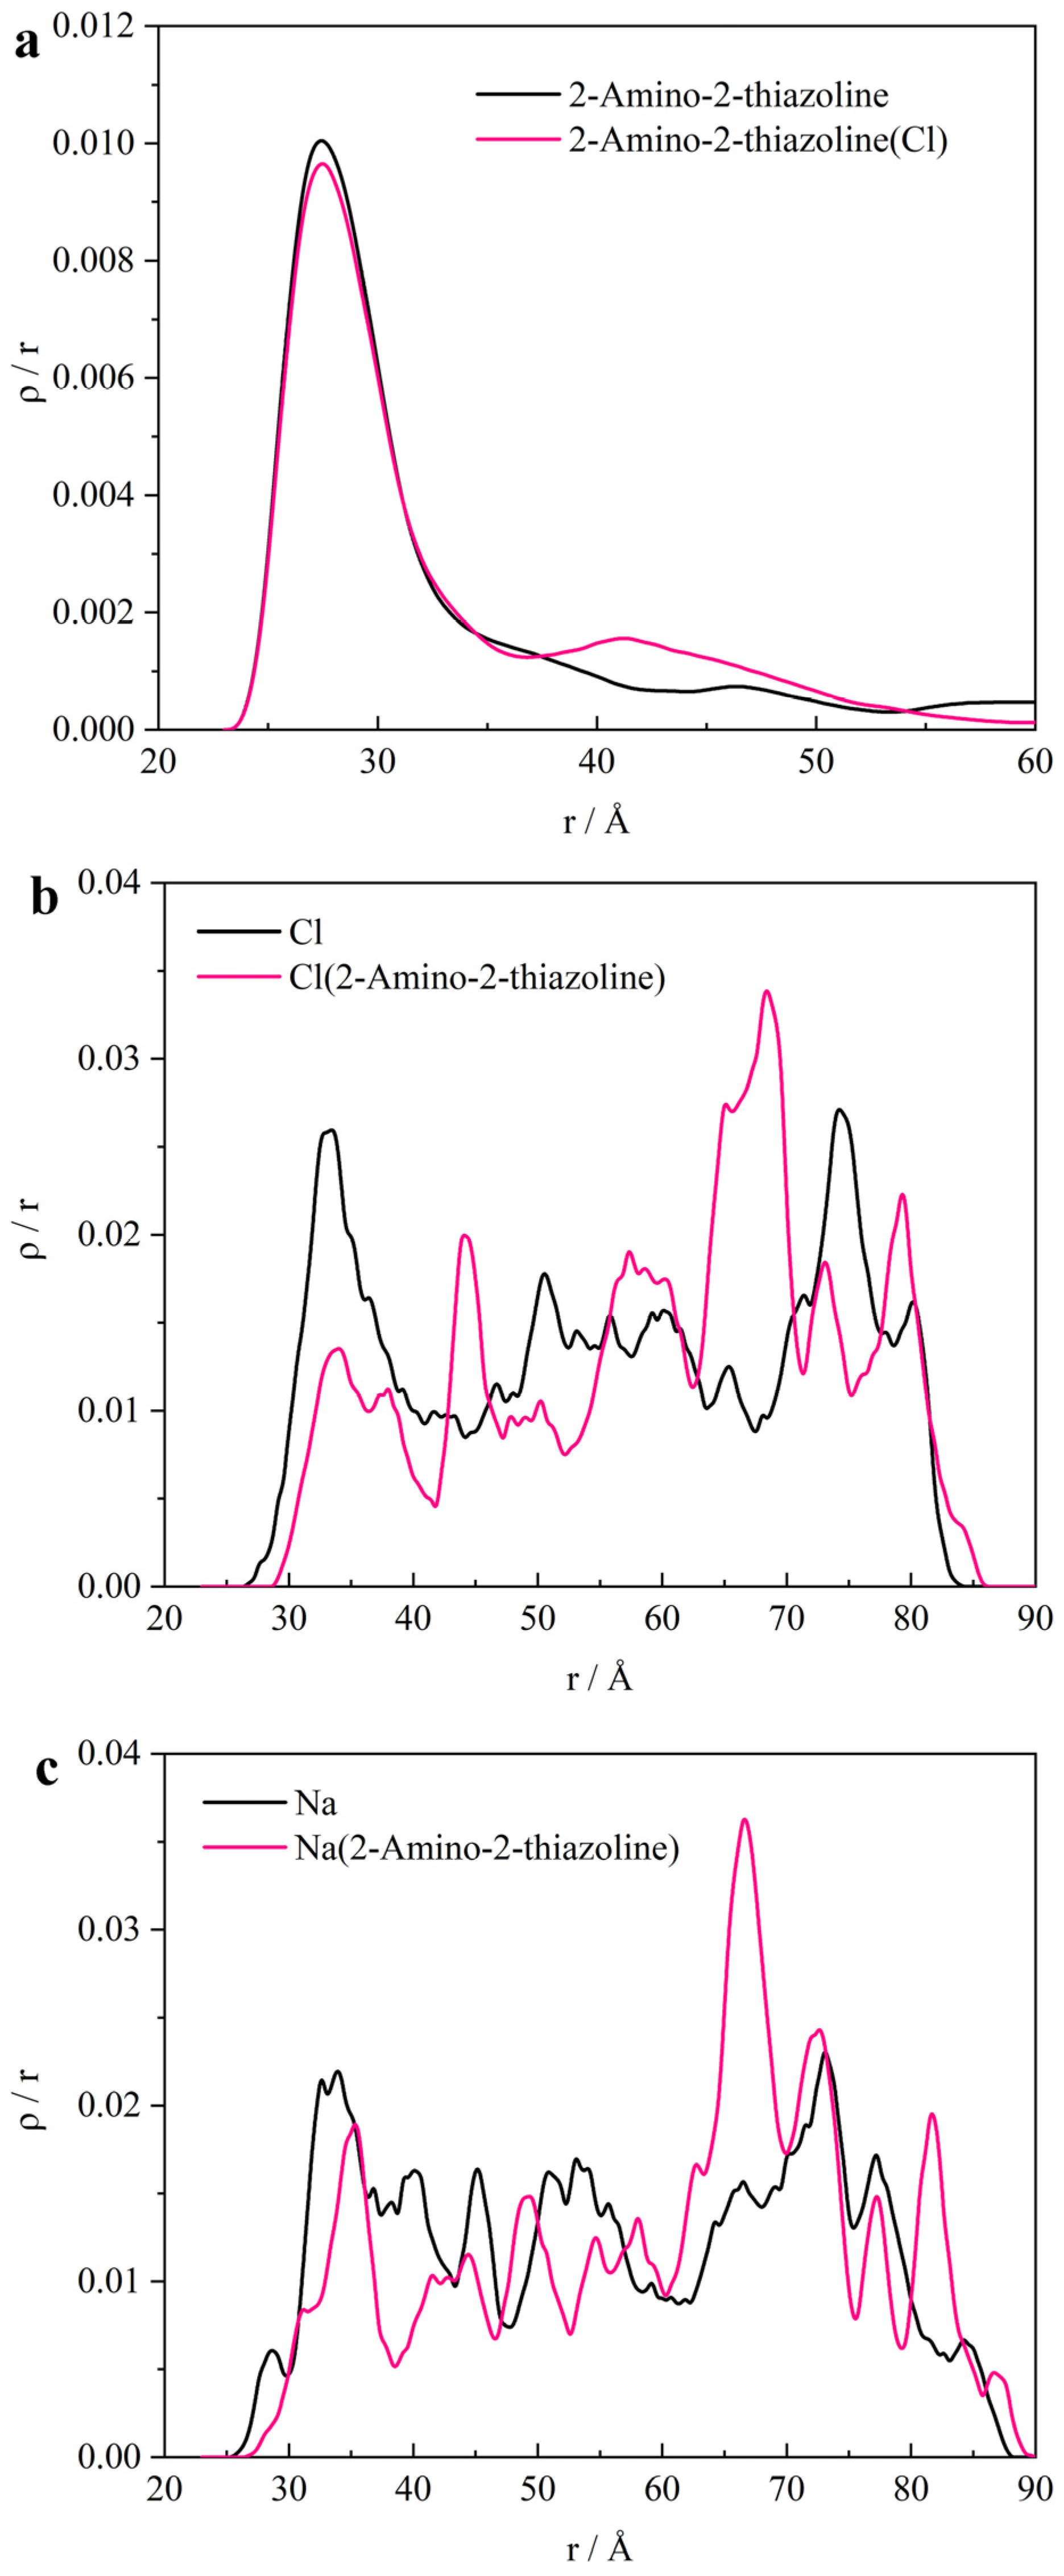
  • ATL molecules are adsorbed on the iron surface by the Van der Waals force between alkanes and surfaces. It is partially detached under the attack of chloride ions, and the surface coverage of iron decreases from 74% to 64%. But, it still has an overall protective effect on steel. The density distribution of chloride ions shows that there is no chloride distribution below 30 Å.
  • ATL molecules expelling chloride ions is an active capture process. (i) Monitor: the adsorption part discovers chloride ions. (ii) Desorption: actively desorbing from the iron surface. (iii) Movement: moving toward chloride ions to approach it. (iv) Control: capturing chloride ions and preventing them from approaching the steel surface.
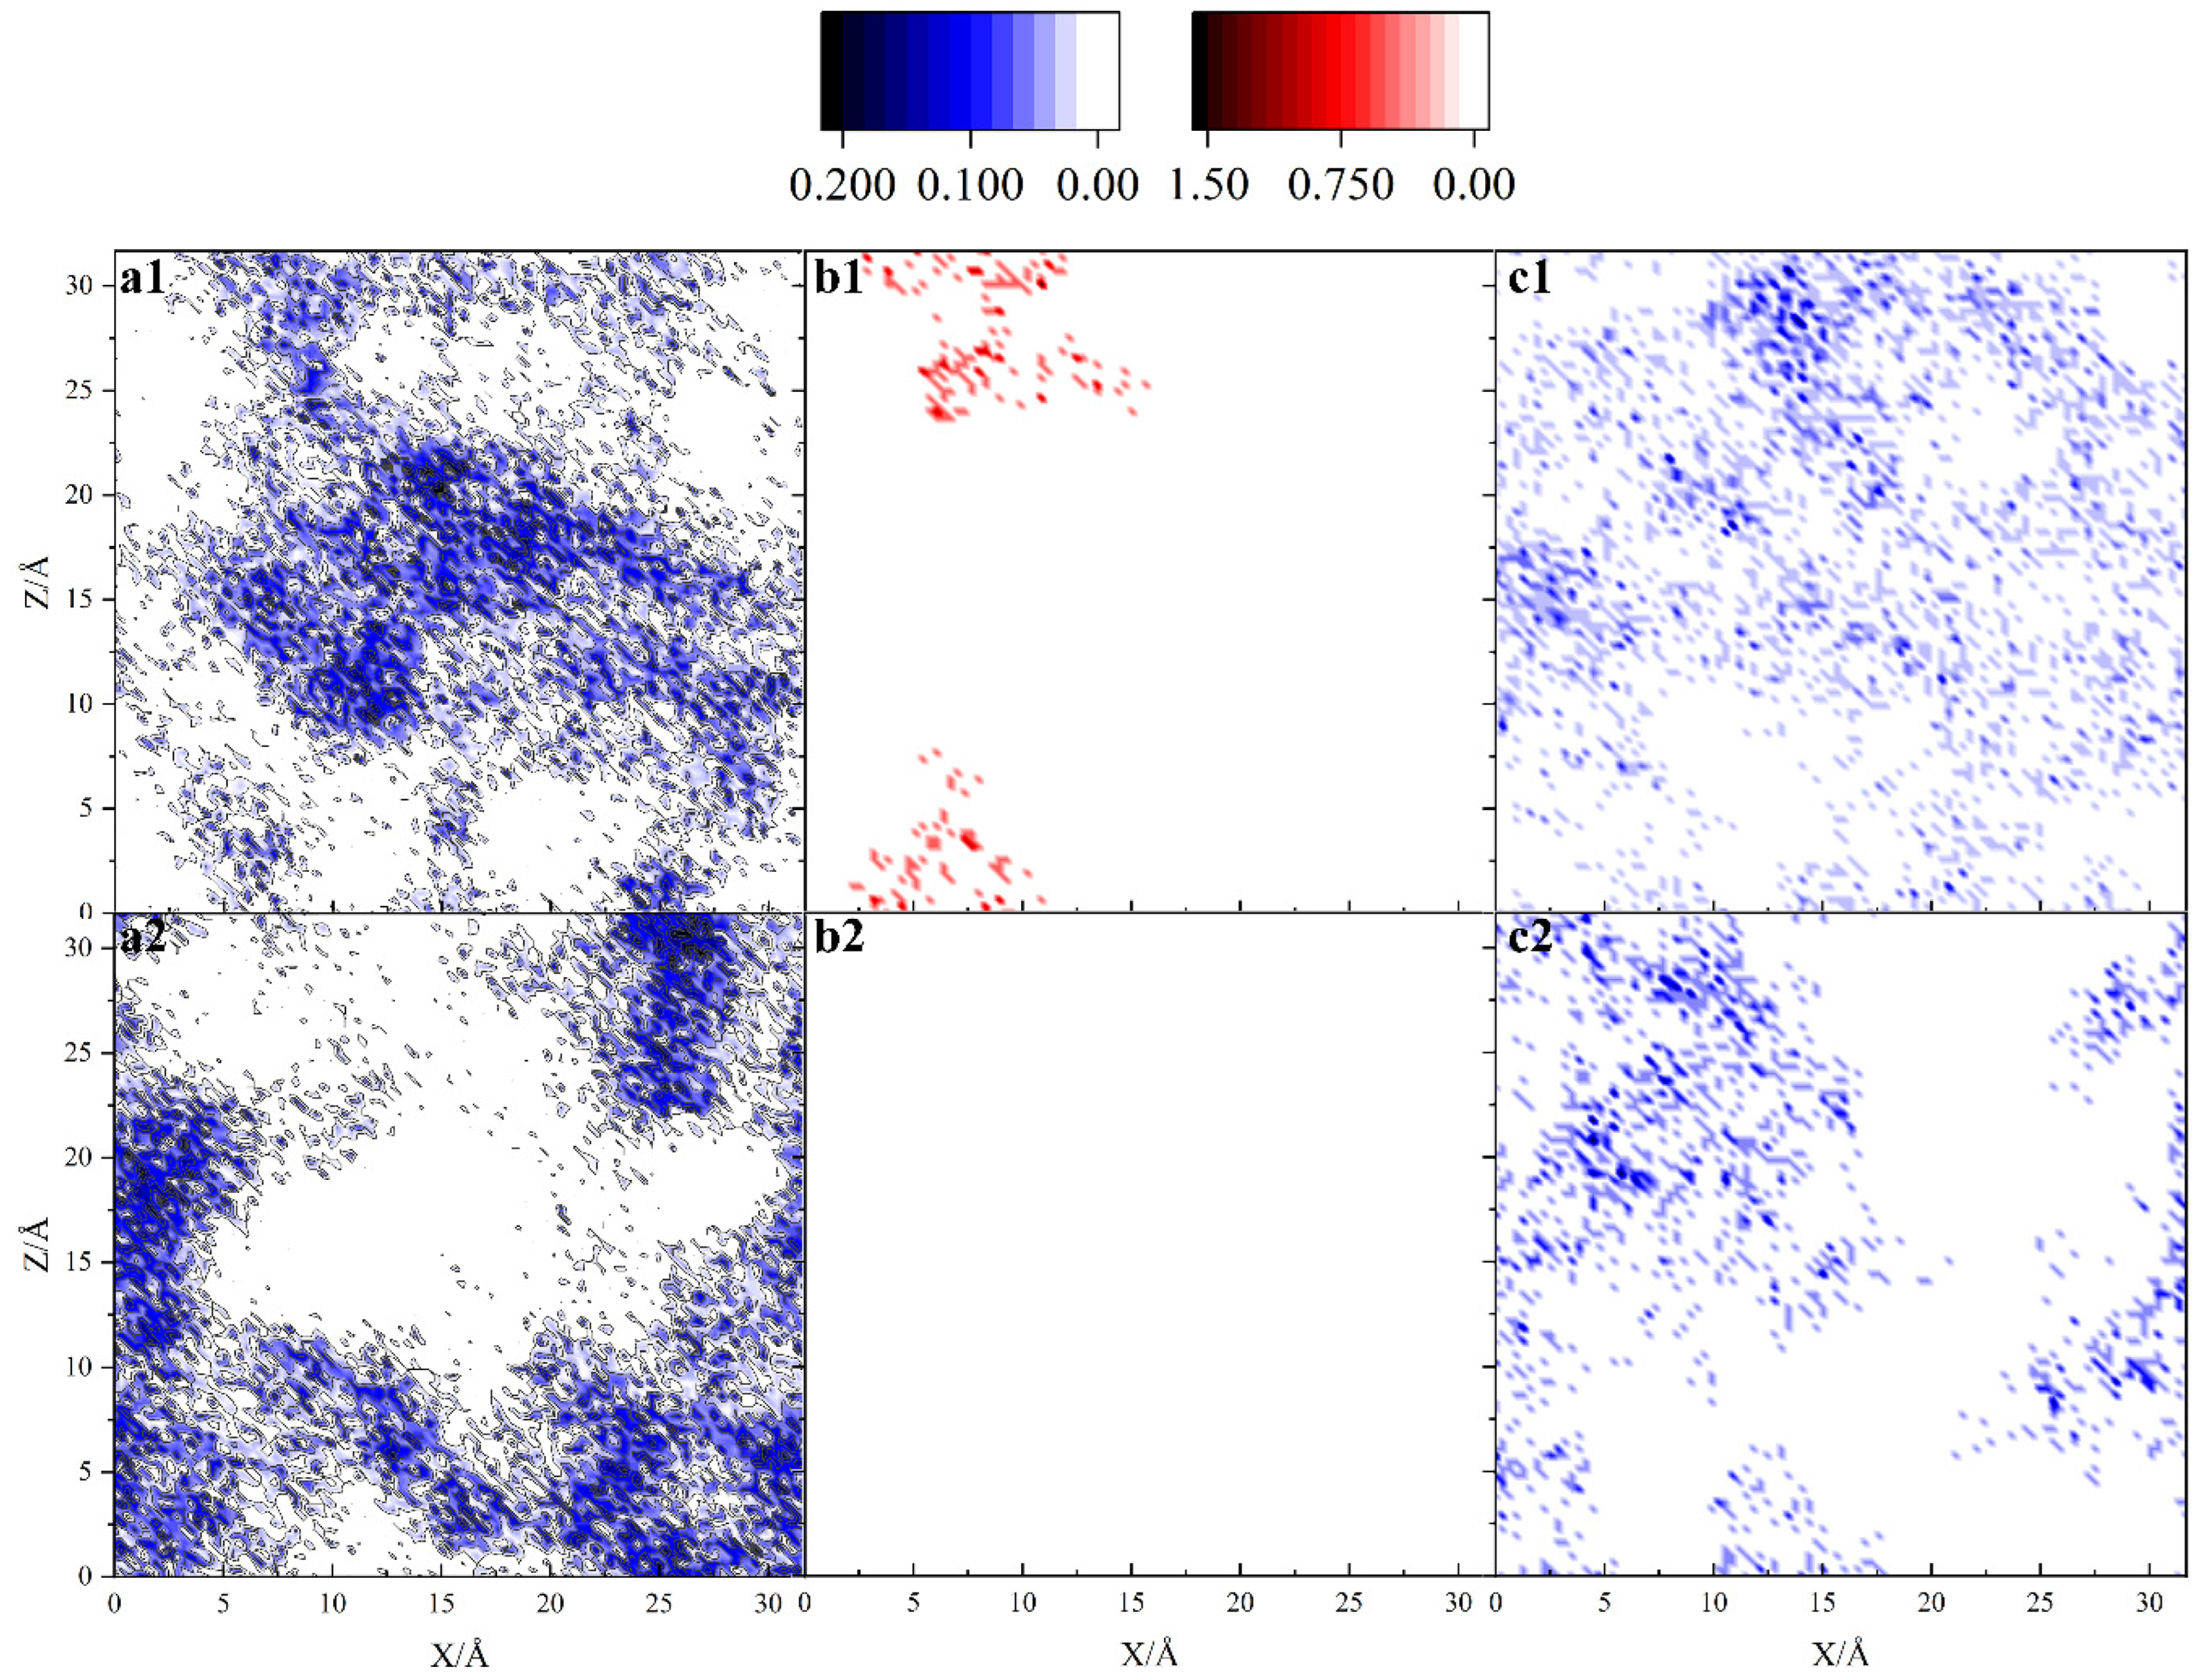
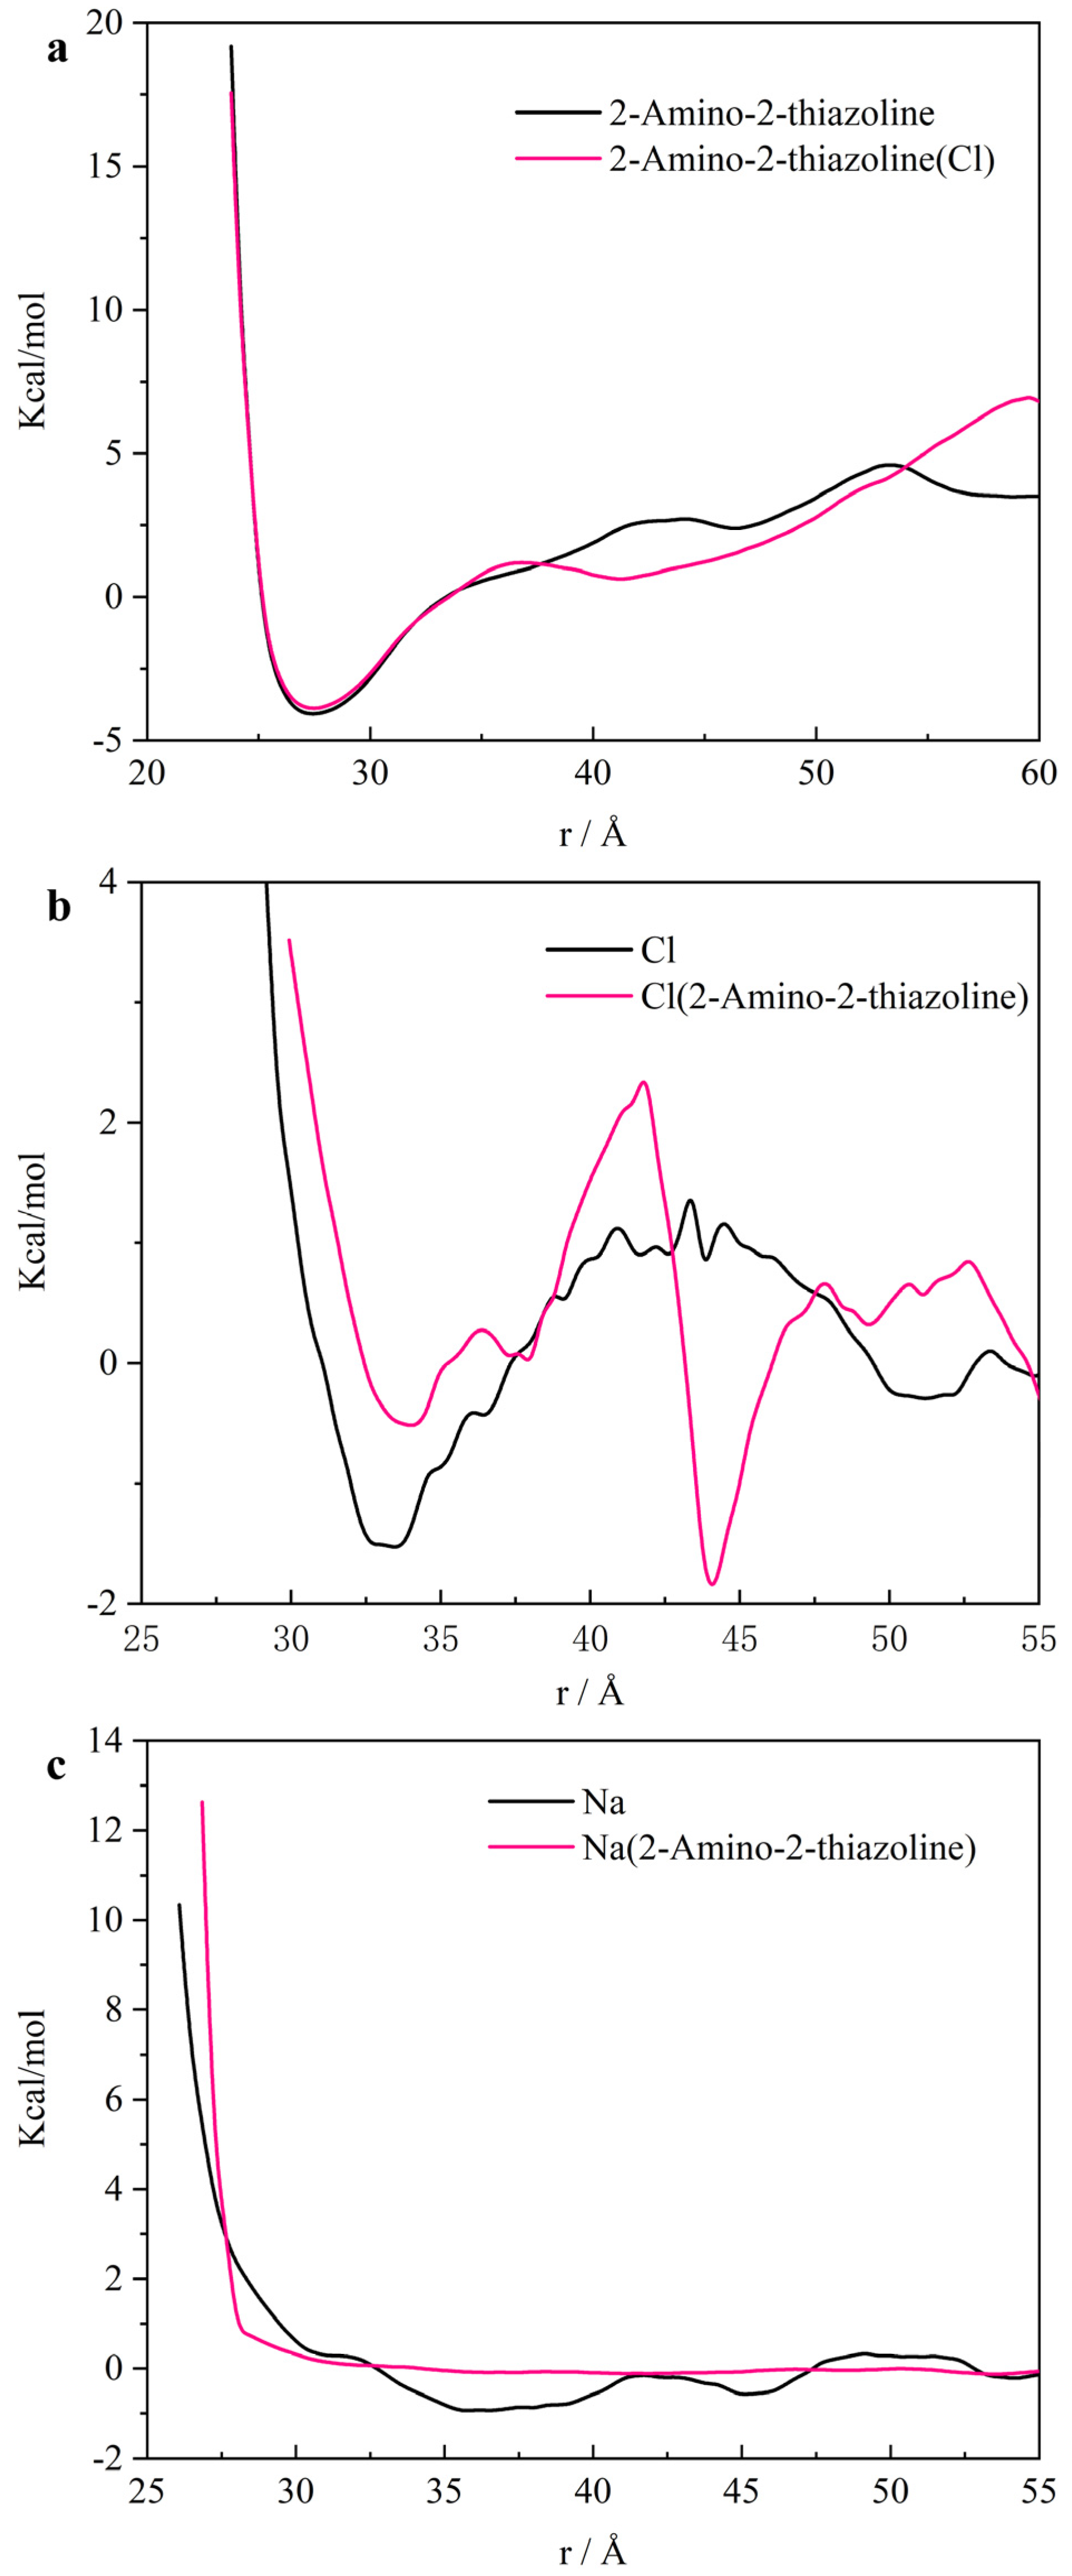
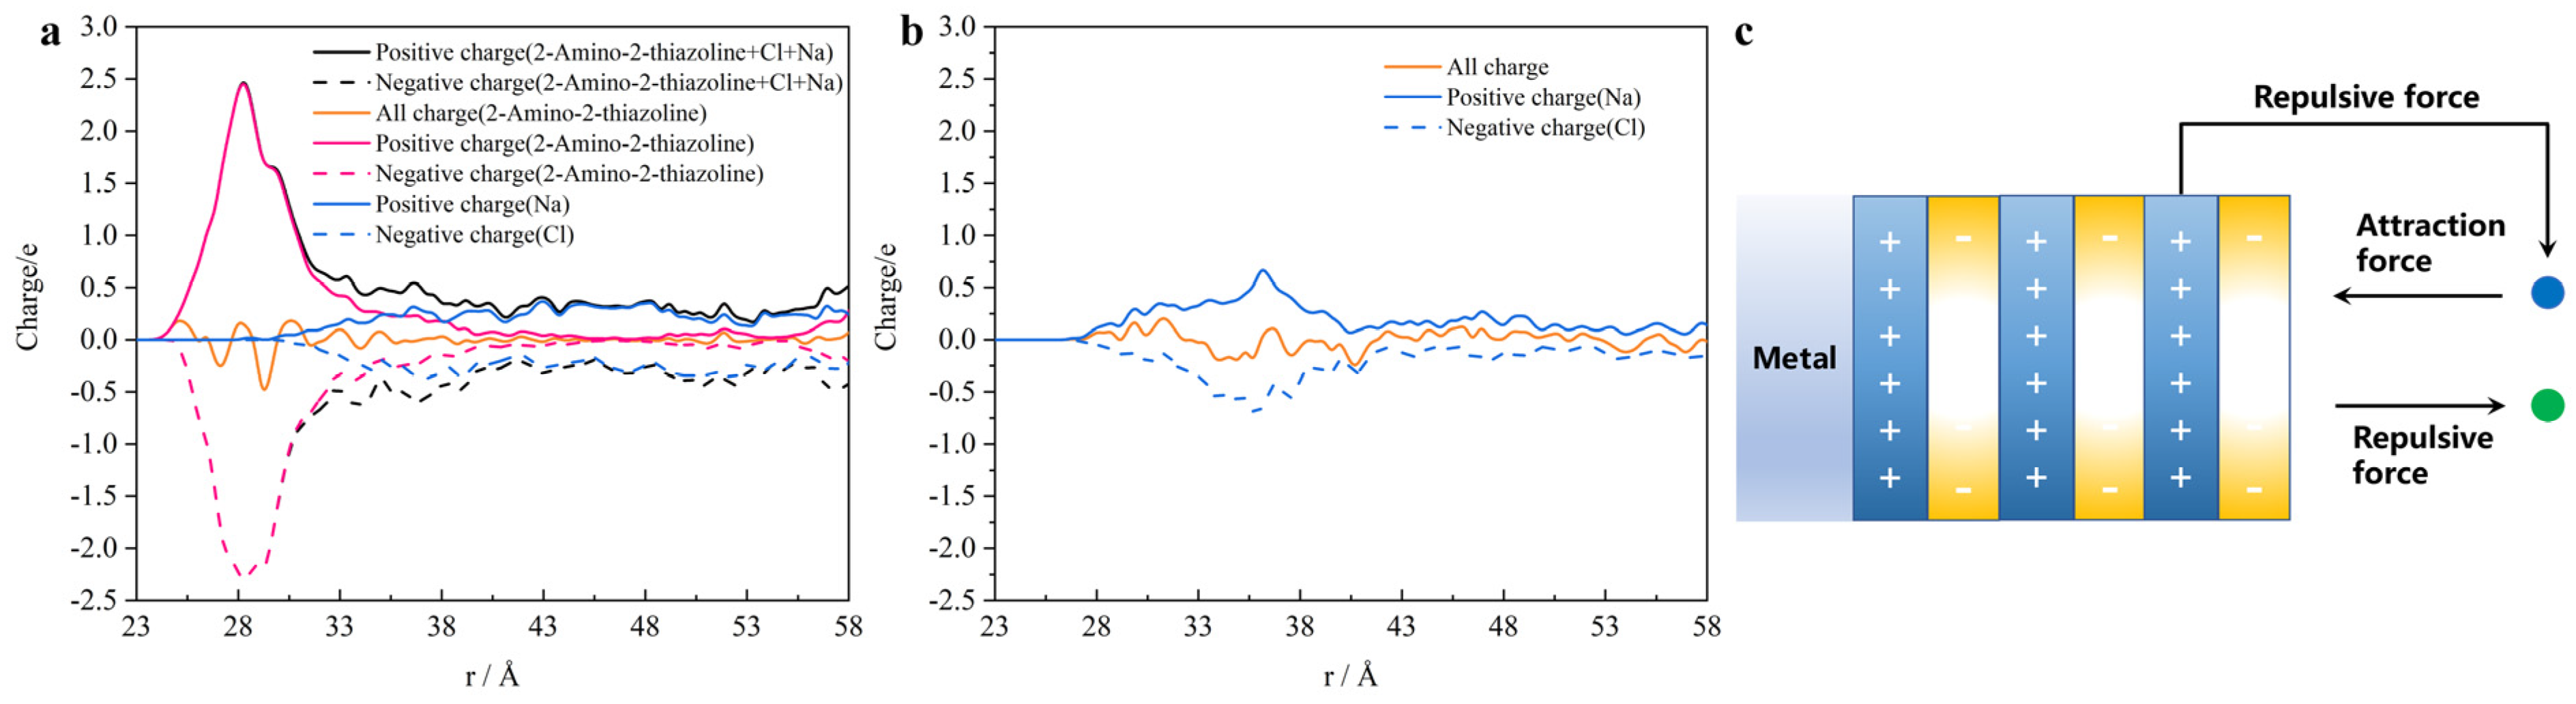
  • ATL forms multiple electron layers on the surface of iron in the [010] direction. The outermost layer is negatively charged. It blocks chloride ions passing through the negative electron barrier by the Coulomb force. This causes the free energy curve of the chloride ion barrier to weaken. And it continues to shield the sodium ion in the adjacent positive layer. Therefore, the sodium ion is closer to the iron surface than the chloride ion.
In this study, the inhibitory mechanism of a small amount of ATL molecules on excess chloride ions was revealed. It provides valuable information for the in-depth research and application of migration inhibitors. At the same time, it provides theoretical support for the design of new anti-corrosion materials.

Author Contributions

Methodology, H.X.; Formal analysis, C.L.; Data curation, F.G. and F.C.; Writing—original draft, S.W.; Writing—review & editing, M.L. and P.W. All authors have read and agreed to the published version of the manuscript.

Funding

Financial support from the National Natural Science foundation of China under Grants U2006224, 51978352, 51908308, and 52178221; Natural Science Foundation of Shandong Province under Grants ZR2020QE253, ZR2020JQ25, and ZR201910210098; and Shandong Provincial Education Department under Grant 2019KJG010, Qingdao Research Program 16-5-1-96-jch.

Data Availability Statement

The original contributions presented in the study are included in the article, further inquiries can be directed to the corresponding author.

Conflicts of Interest

The authors declare no conflict of interest.

References

  1. Alexander, M.; Beushausen, H. Durability, service life prediction, and modelling for reinforced concrete structures—Review and critique. Cem. Concr. Res. 2019, 122, 17–29. [Google Scholar] [CrossRef]
  2. Alexander, M.G.; Ballim, Y.; Stanish, K. A framework for use of durability indexes in performance-based design and specifications for reinforced concrete structures. Mater. Struct. 2007, 41, 921–936. [Google Scholar] [CrossRef]
  3. Angst, U.M.; Hooton, R.D.; Marchand, J.; Page, C.L.; Flatt, R.J.; Elsener, B.; Gehlen, C.; Gulikers, J. Present and future durability challenges for reinforced concrete structures. Mater. Corros. 2012, 63, 1047–1051. [Google Scholar] [CrossRef]
  4. Cheng, A.; Huang, R.; Wu, J.-K.; Chen, C.-H. Influence of GGBS on durability and corrosion behavior of reinforced concrete. Mater. Chem. Phys. 2005, 93, 404–411. [Google Scholar] [CrossRef]
  5. Deby, F.; Carcassès, M.; Sellier, A. Probabilistic approach for durability design of reinforced concrete in marine environment. Cem. Concr. Res. 2009, 39, 466–471. [Google Scholar] [CrossRef]
  6. Shi, X.; Xie, N.; Fortune, K.; Gong, J. Durability of steel reinforced concrete in chloride environments: An overview. Constr. Build. Mater. 2012, 30, 125–138. [Google Scholar] [CrossRef]
  7. Teng, S.; Afroughsabet, V.; Ostertag, C.P. Flexural behavior and durability properties of high performance hybrid-fiber-reinforced concrete. Constr. Build. Mater. 2018, 182, 504–515. [Google Scholar] [CrossRef]
  8. de Rincón, O.T.; Sánchez, M.; Millano, V.; Fernández, R.; de Partidas, E.A.; Andrade, C.; Martínez, I.; Castellote, M.; Barboza, M.; Irassar, F.; et al. Effect of the marine environment on reinforced concrete durability in Iberoamerican countries: DURACON project/CYTED. Corros. Sci. 2007, 49, 2832–2843. [Google Scholar] [CrossRef]
  9. Jang, S.; Song, J.; Amalnerkar, D.; Qin, H.; Kim, T. Effect of secondary inhibitors on material removal rate and nano-roughness of Cu chemical mechanical planarization. Mater. Express 2016, 6, 383–393. [Google Scholar] [CrossRef]
  10. Raja, P.B.; Sethuraman, M.G. Natural products as corrosion inhibitor for metals in corrosive media—A review. Mater. Lett. 2008, 62, 113–116. [Google Scholar] [CrossRef]
  11. Zhang, J.; Qiao, G.; Hu, S.; Yan, Y.; Ren, Z.; Yu, L. Theoretical evaluation of corrosion inhibition performance of imidazoline compounds with different hydrophilic groups. Corros. Sci. 2011, 53, 147–152. [Google Scholar] [CrossRef]
  12. Gece, G. The use of quantum chemical methods in corrosion inhibitor studies. Corros. Sci. 2008, 50, 2981–2992. [Google Scholar] [CrossRef]
  13. Şafak, S.; Duran, B.; Yurt, A.; Türkoğlu, G. Schiff bases as corrosion inhibitor for aluminium in HCl solution. Corros. Sci. 2012, 54, 251–259. [Google Scholar] [CrossRef]
  14. Branzoi, V.; Golgovici, F.; Branzoi, F. Aluminium corrosion in hydrochloric acid solutions and the effect of some organic inhibitors. Mater. Chem. Phys. 2002, 78, 122–131. [Google Scholar] [CrossRef]
  15. Salasi, M.; Stachowiak, G.B.; Stachowiak, G.W.; Kilburn, M.R. NanoSIMS investigation of passive oxide films on high-Cr cast iron. Corros. Sci. 2013, 67, 298–303. [Google Scholar] [CrossRef]
  16. Söylev, T.A.; Richardson, M.G. Corrosion inhibitors for steel in concrete: State-of-the-art report. Constr. Build. Mater. 2008, 22, 609–622. [Google Scholar] [CrossRef]
  17. Goyal, A.; Pouya, H.S.; Ganjian, E.; Claisse, P. A Review of Corrosion and Protection of Steel in Concrete. Arab. J. Sci. Eng. 2018, 43, 5035–5055. [Google Scholar] [CrossRef]
  18. Li, C.; Chen, Q.; Wang, R.; Wu, M.; Jiang, Z. Corrosion assessment of reinforced concrete structures exposed to chloride environments in underground tunnels: Theoretical insights and practical data interpretations. Cem. Concr. Compos. 2020, 112, 103652. [Google Scholar] [CrossRef]
  19. Zhou, H.; Chen, S.; Du, Y.; Lin, Z.; Liang, X.; Liu, J.; Xing, F. Field test of a reinforced concrete bridge under marine environmental corrosion. Eng. Fail. Anal. 2020, 115, 104669. [Google Scholar] [CrossRef]
  20. Díez-Pérez, I.; Vericat, C.; Gorostiza, P.; Sanz, F. The iron passive film breakdown in chloride media may be mediated by transient chloride-induced surface states located within the band gap. Electrochem. Commun. 2006, 8, 627–632. [Google Scholar] [CrossRef]
  21. Gaidis, J.M. Chemistry of corrosion inhibitors. Cem. Concr. Compos. 2004, 26, 181–189. [Google Scholar] [CrossRef]
  22. Ormellese, M.; Berra, M.; Bolzoni, F.; Pastore, T. Corrosion inhibitors for chlorides induced corrosion in reinforced concrete structures. Cem. Concr. Res. 2006, 36, 536–547. [Google Scholar] [CrossRef]
  23. Palanivel, V.; Huang, Y.; van Ooij, W.J. Effects of addition of corrosion inhibitors to silane films on the performance of AA2024-T3 in a 0.5M NaCl solution. Prog. Org. Coat. 2005, 53, 153–168. [Google Scholar] [CrossRef]
  24. John, S. Challenges of chromate inhibitor pigments replacement in organic coatings. Prog. Org. Coat. 2001, 42, 267–282. [Google Scholar]
  25. Nmai, C.K. Multi-functional organic corrosion inhibitor. Cem. Concr. Compos. 2004, 26, 199–207. [Google Scholar] [CrossRef]
  26. Raja, P.B.; Ismail, M.; Ghoreishiamiri, S.; Mirza, J.; Ismail, M.C.; Kakooei, S.; Rahim, A.A. Reviews on Corrosion Inhibitors: A Short View. Chem. Eng. Commun. 2016, 203, 1145–1156. [Google Scholar] [CrossRef]
  27. Tang, Z. A review of corrosion inhibitors for rust preventative fluids. Curr. Opin. Solid State Mater. Sci. 2019, 23, 100759. [Google Scholar] [CrossRef]
  28. de Souza, F.S.; Spinelli, A. Caffeic acid as a green corrosion inhibitor for mild steel. Corros. Sci. 2009, 51, 642–649. [Google Scholar] [CrossRef]
  29. Moretti, G.; Guidi, F.; Grion, G. Tryptamine as a green iron corrosion inhibitor in 0.5 M deaerated sulphuric acid. Corros. Sci. 2004, 46, 387–403. [Google Scholar] [CrossRef]
  30. Hoseinzadeh, A.R.; Javadpour, S. Electrochemical, thermodynamic and theoretical study on anticorrosion performance of a novel organic corrosion inhibitor in 3.5% NaCl solution for carbon steel. Bull. Mater. Sci. 2019, 42, 188. [Google Scholar] [CrossRef]
  31. Norman, A.B.; Simon, J.C.; Christopher, P.C.; David, E.H.; Michael, B.H.; Rafizah, M.; Eric, S.R.; Chris, S. Complexes of heterocyclic thiones and Group 12 metals Part 5. Reactions of 1,3-thiazolidine-2-thione and benzo-1,3-thiazoline-2-thione with mercury(II) halides in a 2:1 ratio. Crystal structures of bis(1,3-thiazolidine-2-thione) mercury(II) bromide and bis(benzo-1,3-thiazolinato)mercury(II). Inorganica Chim. Acta 2001, 323, 69–77. [Google Scholar]
  32. Shih, M.H.; Ke, F.Y. Syntheses and evaluation of antioxidant activity of sydnonyl substituted thiazolidinone and thiazoline derivatives. Bioorganic Med. Chem. 2004, 12, 4633–4643. [Google Scholar] [CrossRef] [PubMed]
  33. Zhang, W.; Wu, L.; Han, X.; Yao, L.; Zhao, S.; Sun, J.; Xu, Y.; Li, J.; Xiong, C. Green chemical synthesis of new chelating fiber and its mechanism for recovery gold from aqueous solution. J. Hazard. Mater. 2019, 378, 120674. [Google Scholar] [CrossRef] [PubMed]
  34. Hekmatifar, M.; Toghraie, D.; Khosravi, A.; Saberi, F.; Soltani, F.; Sabetvand, R.; Goldanlou, A.S. The study of asphaltene desorption from the iron surface with molecular dynamics method. J. Mol. Liq. 2020, 318, 114325. [Google Scholar] [CrossRef]
  35. Verma, C.; Lgaz, H.; Verma, D.K.; Ebenso, E.E.; Bahadur, I.; Quraishi, M.A. Molecular dynamics and Monte Carlo simulations as powerful tools for study of interfacial adsorption behavior of corrosion inhibitors in aqueous phase: A review. J. Mol. Liq. 2018, 260, 99–120. [Google Scholar] [CrossRef]
  36. Zhang, J.; Zhang, Q.; Ren, H.; Zhao, W.; Zhang, H. Inhibition performance of 2-mercaptobenzothiazole derivatives in CO2 saturated solution and its adsorption behavior at Fe surface. Appl. Surf. Sci. 2007, 253, 7416–7422. [Google Scholar] [CrossRef]
  37. Alibakhshi, E.; Ramezanzadeh, M.; Bahlakeh, G.; Ramezanzadeh, B.; Mahdavian, M.; Motamedi, M. Glycyrrhiza glabra leaves extract as a green corrosion inhibitor for mild steel in 1 M hydrochloric acid solution: Experimental, molecular dynamics, Monte Carlo and quantum mechanics study. J. Mol. Liq. 2018, 255, 185–198. [Google Scholar] [CrossRef]
  38. Martinez, L.; Andrade, R.; Birgin, E.G.; Martinez, J.M. PACKMOL: A package for building initial configurations for molecular dynamics simulations. J. Comput. Chem. 2009, 30, 2157–2164. [Google Scholar] [CrossRef]
  39. Thompson, A.P.; Aktulga, H.M.; Berger, R.; Bolintineanu, D.S.; Brown, W.M.; Crozier, P.S.; in’t Veld, P.J.; Kohlmeyer, A.; Moore, S.G.; Nguyen, T.D.; et al. LAMMPS—A flexible simulation tool for particle-based materials modeling at the atomic, meso, and continuum scales. Comput. Phys. Commun. 2022, 271, 108171. [Google Scholar] [CrossRef]
  40. Jorgensen, W.L.; Maxwell, D.S.; Tirado-Rives, J. Development and Testing of the OPLS All-Atom Force Field on Conformational Energetics and Properties of Organic Liquids. J. Am. Chem. Soc. 1996, 118, 11225–11236. [Google Scholar] [CrossRef]
  41. Ezquerro, C.S.; Aznar, J.M.G.; Laspalas, M. Prediction of the structure and mechanical properties of polycaprolactone-silica nanocomposites and the interphase region by molecular dynamics simulations: The effect of PEGylation. Soft Matter 2022, 18, 2800–2813. [Google Scholar] [CrossRef] [PubMed]
  42. Hockney, R.W.; Goel, S.P.; Eastwood, J.W. Quiet high-resolution computer models of a plasma. J. Comput. Phys. 1974, 14, 148–158. [Google Scholar] [CrossRef]
  43. Nosé, S. A unified formulation of the constant temperature molecular dynamics methods. J. Chem. Phys. 1984, 81, 511–519. [Google Scholar] [CrossRef]
  44. Humphrey, W.; Dalke, A.; Schulten, K. VMD: Visual molecular dynamics. J. Mol. Graph. 1996, 14, 33–38. [Google Scholar] [CrossRef]
  45. Margenau, H. Van der waals forces. Rev. Mod. Phys. 1939, 11, 1–35. [Google Scholar] [CrossRef]
  46. Jedicke, R.; Nesvorny, D.; Whiteley, R.; Ivezic, Z.Z.; Juric, M. An age-colour relationship for main-belt S-complex asteroids. Nature 2004, 429, 275–277. [Google Scholar] [CrossRef] [PubMed]
  47. Niermann, B.; Böke, M.; Sadeghi, N.; Winter, J. Space resolved density measurements of argon and helium metastable atoms in radio-frequency generated He-Ar micro-plasmas. Eur. Phys. J. D 2010, 60, 489–495. [Google Scholar] [CrossRef]
  48. Harmandaris, V.A.; Daoulas, K.C.; Mavrantzas, V.G. Molecular Dynamics Simulation of a Polymer Melt/Solid Interface:  Local Dynamics and Chain Mobility in a Thin Film of Polyethylene Melt Adsorbed on Graphite. Macromolecules 2005, 38, 5796–5809. [Google Scholar] [CrossRef]
  49. Domińczuk, J.; Krawczuk, A. Comparison of Surface Free Energy Calculation Methods. Appl. Mech. Mater. 2015, 791, 259–265. [Google Scholar] [CrossRef]
  50. Rodriguez-Gomez, D.; Darve, E.; Pohorille, A. Assessing the efficiency of free energy calculation methods. J. Chem. Phys. 2004, 120, 3563–3578. [Google Scholar] [CrossRef]
  51. Hou, D.; Zhang, K.; Hong, F.; Wu, S.; Wang, Z.; Li, M.; Wang, M. The corrosion deterioration of reinforced passivation Film: The impact of defects. Appl. Surf. Sci. 2022, 582, 152408. [Google Scholar] [CrossRef]
  52. Wang, M.; Zhang, K.; Ji, X.; Wang, P.; Ma, H.; Zhang, J.; Hou, D. Molecular insight into the fluidity of cement pastes: Nano-boundary lubrication of cementitious materials. Constr. Build. Mater. 2022, 316, 125800. [Google Scholar] [CrossRef]
  53. Han, Y.; Elliott, J. Molecular dynamics simulations of the elastic properties of polymer/carbon nanotube composites. Comput. Mater. Sci. 2007, 39, 315–323. [Google Scholar] [CrossRef]
  54. Hou, D.; Zhang, W.; Sun, M.; Wang, P.; Wang, M.; Zhang, J.; Li, Z. Modified Lucas-Washburn function of capillary transport in the calcium silicate hydrate gel pore: A coarse-grained molecular dynamics study. Cem. Concr. Res. 2020, 136, 106166. [Google Scholar] [CrossRef]
  55. Wang, M.; Fang, T.; Zhong, H.; Li, J.; Yan, Y.; Zhang, J. Optimal aggregation number of reverse micelles in supercritical carbon dioxide: A theoretical perspective. Soft Matter 2019, 15, 3323–3329. [Google Scholar] [CrossRef]
  56. Hou, D.; Yu, J.; Liu, Q.-F.; Dong, B.; Wang, X.; Wang, P.; Wang, M. Nanoscale insight on the epoxy-cement interface in salt solution: A molecular dynamics study. Appl. Surf. Sci. 2020, 509, 145322. [Google Scholar] [CrossRef]
  57. Wang, M.; Zhang, K.; Hou, D.; Wang, P. Microscopic insight into nanodiamond polymer composites: Reinforcement, structural, and interaction properties. Nanoscale 2020, 12, 24107–24118. [Google Scholar] [CrossRef]
  58. Stalke, D. Meaningful structural descriptors from charge density. Chemistry 2011, 17, 9264–9278. [Google Scholar] [CrossRef]
  59. Sun, X.D.; Yuan, X.Z.; Jia, Y.; Feng, L.J.; Zhu, F.P.; Dong, S.S.; Liu, J.; Kong, X.; Tian, H.; Duan, J.L.; et al. Differentially charged nanoplastics demonstrate distinct accumulation in Arabidopsis thaliana. Nat. Nanotechnol. 2020, 15, 755–760. [Google Scholar] [CrossRef] [PubMed]
Figure 1. (a) The crystal cell structure of Fe; (b) chemical structural formula of ATL; (c) ATL and iron system; (d) sodium chloride and iron system; (e) ATL, sodium chloride, and iron system. The color scheme of ATL: Yellow = Sulfur; White = Hydrogen; Blue = Nitrogen; Cyan = Carbon. Color scheme of the model: Red = Oxygen; White = Hydrogen; Green = Chlorine; Blue = Sodium; Brown = Iron.
Buildings 14 02558 g001
Figure 2. Last-frame snapshots in (a1) model 1, (a2) model 2, and (a3) model 3; the plane projections of the last frame (the X-Z surface) of (b1) model 1, (b2) model 2, and (b3) model 3; the side views (the [010] direction) of (c1) model 1, (c2) model 2, and (c3) model 3. The color scheme of ATL: Yellow = Sulfur; White = Hydrogen; Blue = Nitrogen; Cyan = Carbon. Color scheme of the model: Red = Oxygen; White = Hydrogen; Green = Chlorine; Blue = Sodium; Brown = Iron.
Buildings 14 02558 g002
Figure 3. One-dimensional density distribution (in the Y direction) of (a) the ATL molecules, (b) chloride ions, and (c) sodium ions.
Buildings 14 02558 g003
Figure 4. The two-dimensional density distributions of ATL, chloride ions, and water molecules on the iron surface layer in the X-Z surface in different systems. ATL in (a1) model 1 and (a2) model 3; chloride ions in (b1) model 2 and (b2) model 3; flat distribution of water molecules in (c1) model 1 and (c2) model 3.
Buildings 14 02558 g004
Figure 5. The molecular potential energy of (a) ATL in the system with or without chloride ions, and (b) chloride ions and (c) sodium ions in the system with or without ATL molecules.
Buildings 14 02558 g005
Figure 6. (a) Distribution of water-order parameters in different systems; (b) dipole-direction distribution of water molecules in different systems. Color scheme: Black = only ATL molecules; Orange = only sodium chloride; Pink = ATL molecule and sodium chloride.
Buildings 14 02558 g006
Figure 7. Microscopic interaction schematic of (a1) chloride ions and carbon atoms in different positions, (a2) chloride ions and different nitrogen atoms, and (a3) nitrogen and hydrogen atoms inside the amino group. The snapshot in the simulation process (b1,b2). Radial distribution function (RDF) of (c) chloride ion and different carbon atoms in ATL, (d) chloride ion and different nitrogen atoms in ATL, and (e) the interaction of nitrogen atoms and hydrogen atoms in ATL with or without chloride ions.
Buildings 14 02558 g007
Figure 8. The time correlation function (TCF) of the system with the interaction of corrosion inhibitor molecules and chloride ions. (a) The different carbon atoms in the chloride ion and ATL; (b) the different nitrogen atoms in the chloride ion and ATL; (c) the action of nitrogen atoms and hydrogen atoms in ATL in the system with or without chloride ions.
Buildings 14 02558 g008
Figure 9. Time evolution of the relative contents of the number of (a) nitrogen–hydrogen bonds on carbon and chlorine and (b) Amino groups at different positions.
Buildings 14 02558 g009
Figure 10. Snapshots of the ATL expelling chloride ions: (a) ATL adsorbing the iron surface, (b) ATL active desorption, (c) ATL moving to chloride, and (d) ATL expelling chloride ions.
Buildings 14 02558 g010
Figure 11. (a) The electric charge distribution (the [010] direction) in model 3 of all charges, positive charges, and negative charges of ATL, sodium, and chloride ions. (b) The electric charge distribution (Y direction) in model 2 of all charges, positive charges, and negative charges of sodium and chloride ions. (c) ATL molecules on the surface of the iron form a multi-layer electrostatic shielding potential simplified schematic diagram. The [010] direction is represented from left to right. Color scheme: Light blue = Positive charge; Light yellow = Negative charge; Blue = Sodium ions; Green = Chloride ions.
Buildings 14 02558 g011
Disclaimer/Publisher’s Note: The statements, opinions and data contained in all publications are solely those of the individual author(s) and contributor(s) and not of MDPI and/or the editor(s). MDPI and/or the editor(s) disclaim responsibility for any injury to people or property resulting from any ideas, methods, instructions or products referred to in the content.

