Article

Understanding Toughening Mechanisms and Damage Behavior in Hybrid-Fiber-Modified Mixtures Using Digital Imaging

1
Shandong Key Laboratory of Highway Technology and Safety Assessment, Jinan 250013, China
2
Innovation Research Institute, Shandong Hi-Speed Group Co., Ltd., Jinan 250013, China
3
School of Highway, Chang’an University, Xi’an 710064, China
4
Shandong Road and Bridge Group Co., Ltd., Jinan 250013, China
*
Author to whom correspondence should be addressed.
Buildings 2024, 14(8), 2562; https://doi.org/10.3390/buildings14082562
Submission received: 2 August 2024 / Revised: 15 August 2024 / Accepted: 19 August 2024 / Published: 20 August 2024
(This article belongs to the Special Issue Mechanical Properties of Asphalt and Asphalt Mixtures)

Abstract

:
Pavement cracking is a primary cause of early damage in asphalt pavements, and fiber-reinforcement technology is an effective method for enhancing the anti-cracking performance of pavement mixtures. However, due to the multi-scale dispersed structure of pavement mixtures, it is challenging to address cracking and damage with a single fiber type or fibers of the same scale. To investigate the toughening mechanisms and damage behavior of hybrid-fiber-modified mixtures, we analyzed the fracture process and damage behavior of these mixtures using a combination of basalt fiber and calcium sulfate whisker hybrid fiber modification, along with semicircular bending tests. Additionally, digital imaging was employed to examine the fracture interface characteristics, revealing the toughening mechanisms at play. The results demonstrated that basalt fibers effectively broaden the toughness range of the modified mixture at the same temperature, reduce mixture stiffness, increase residual load at the same displacement, and improve crack resistance in the mixture matrix. While calcium sulfate whiskers enhanced the peak load of the mixture, their high stiffness modulus was found to be detrimental to the mixture’s crack toughness. The fracture interface analysis indicated that the three-dimensionally distributed fibers form a spatial network within the mixture, restricting the relative movement of cement and aggregate, delaying crack propagation, and significantly improving the overall crack resistance of the mixture.

1. Introduction

Asphalt pavement is currently one of the most widely used forms of pavement globally. However, asphalt pavement is susceptible to environmental influences, which can lead to poor high-temperature stability, cracking, and water damage during service. These issues result in a decline in pavement service quality and durability, negatively impacting economic development and traffic operations [1,2,3,4]. Fiber additives have been shown to significantly enhance the high- and low-temperature performance as well as the fatigue resistance of asphalt pavement [5,6,7]. For instance, Liu et al. [8] found that anhydrous calcium sulfate whisker (CSW) can improve the high-temperature performance of asphalt mixtures, although it may have some negative effects on low-temperature performance. Similarly, Guan et al. [9] investigated the effects of CSW on the water stability and fatigue properties of asphalt mixtures, concluding that it could significantly enhance both properties, with a recommended dosage of 0.4%.
While fiber products can improve the performance of asphalt mixtures, the use of single fibers often fails to address the needs across different scales of research. Additionally, composite fibers of the same scale lack complementarity, resulting in suboptimal modification effects in fiber-reinforced asphalt concrete and affecting engineering quality [10,11]. This underscores the urgent need to develop multi-scale hybrid fiber asphalt concrete pavement materials that offer high strength and toughness to achieve sustainable asphalt pavements.
Fiber-reinforced materials are classified into three types: nano-scale, micro-scale, and millimeter-scale, corresponding to common nanomaterials, whisker materials, and fiber materials, respectively. For example, Javad Tanzadeh et al. [12] used basalt fiber (BF) and glass fiber to address drainage issues in nano-SiO2-SBS modified open-graded friction courses, finding that BF was more effective than glass fiber in reducing drainage. Gong et al. [13] optimized the mix ratio of nano-TiO2/CaCO3 (NTC)-BF-composite-modified asphalt mixtures using a response surface method and Box-Behnken Design (BBD) model. The analysis showed that the optimal content of NTC was 5.1%, BF was 3.9%, and the asphalt–aggregate ratio was 5.67%. Ren et al. [14] found that the interfacial adhesion between fiber and asphalt is stronger after fiber treatment with a coupling agent, which enhances the crack resistance of fiber asphalt mixtures. Despite the widespread interest in hybrid-fiber-modified asphalt mixtures, most research focuses on different types and scales of fiber combinations, and there is limited documentation on the modification mechanisms and crack resistance enhancement of multi-scale hybrid fiber asphalt concrete [11].
There are various test methods used to evaluate the crack resistance of asphalt mixtures both domestically and internationally, including indirect tensile tests (IDT), disc compact tension tests (DCT), thermal stress restrained stress tests (TSRST), low-temperature bending beam tests (BBT), semi-circular bending tests (SCB), and asphalt concrete cracking devices (ACCD) [10,14]. Among these, SCB is gaining increasing attention due to its simplicity, repeatability, and flexibility in testing and evaluation. Researchers primarily use SCB to evaluate the crack resistance of asphalt mixtures, applying fracture mechanics theory to characterize low-temperature and fatigue crack resistance. The specific parameters used include fracture toughness, fracture energy, and crack resistance index [15]. Compared to IDT and DCT tests, SCB testing concentrates stress at the notch, reducing the peak load and mitigating the local damage effect of cylindrical steel bars on the specimen. Unlike the TSRST test, SCB can use semi-circular specimens made from Marshall specimens, pavement drilling specimens, or rotary compaction specimens, making it widely applicable and reducing the difficulty of indoor test operations. Compared to BBT tests, SCB tests have a slower loading rate and a larger specimen cross-sectional area, making them more representative of actual pavement cracking conditions [10].
The use of digital image technology to study hybrid-fiber-modified mixtures is driven by its high precision, non-contact, and full-field measurement capabilities, which are crucial in studying the deformation and failure behavior of asphalt mixtures. Digital image technology provides detailed images of the internal structure, aiding in the observation of interfacial adhesion effects between fibers, asphalt, and aggregates, thereby revealing the influence of mixed fibers on asphalt mixture performance. For instance, Li et al. [16] applied digital image technology to SCB tests to observe the cracking behavior at the asphalt-coarse aggregate interface under load, offering valuable data for understanding the impact of fiber modification on crack development. Similarly, Kutuk-Sert et al. [17] used digital image technology to study the adhesion effect of nano-olivine in warm-mix modified asphalt, demonstrating the technology’s effectiveness in this area. This shows that digital image technology has clear advantages in revealing fiber distribution, adhesion, and structural changes in modified asphalt materials. Consequently, it can more accurately analyze microstructural changes, crack propagation, and fiber reinforcement effects in hybrid-fiber-modified mixtures, providing more comprehensive research data and helping to optimize asphalt mixture performance.
Moreover, current research on the toughening mechanism of hybrid-fiber-modified mixtures predominantly focuses on rheological perspectives. There is a notable lack of studies on the internal reinforcement and toughening fracture mechanisms of BF-CSW modified asphalt mixtures based on the digital image technology used in SCB tests.
In response to these research gaps, this study selects micron-scale calcium sulfate whiskers and millimeter-scale basalt fibers to prepare hybrid fiber asphalt mixtures. The crack resistance and toughening mechanisms of different types of asphalt mixtures are compared using pre-opened SCB tests. During the tests, an electronic extensometer and a camera are used to record the bending and tensile fracture processes of SCB specimens, allowing for the analysis of load–displacement–time trends and crack propagation speeds at different temperatures. Based on fracture mechanics theory, the crack resistance of various asphalt mixtures is comprehensively evaluated using fracture toughness, fracture energy, and crack resistance index. Additionally, the fracture interface characteristics of specimens are compared and analyzed to characterize the toughening mechanisms of hybrid-fiber-modified mixtures.

2. Materials and Methods

2.1. Raw Material

2.1.1. Calcium Sulfate Whisker

Calcium sulfate whisker (CSW) is a micron-sized fibrous powder prepared from chemical gypsum or industrial waste gypsum, which can be divided into three types according to the content of water bound by CSW: dihydrate CSW, hemihydrate CSW and anhydrous CSW. Because the dihydrate CSW and hemihydrate CSW would lose water in high-temperature asphalt, the interfacial adhesion between CSW and asphalt is weakened, so KH-550 (3-aminopropyltriethoxysilane) is used to modify the surface of anhydrous CSW to improve the compatibility of CSW with asphalt [9,18,19,20]. Anhydrous CSW is produced in Jiangxi Fengzhu New Materials Technology Co., Ltd., located in Yichun, China, and its basic physical indexes are shown in Table 1.
The macro and micro morphology of CSW are shown in Figure 1. It can be found that CSW has obvious edges and corners under SEM, showing a rod-like structure; its surface is rough and uneven, which is mainly caused by the rapid precipitation of calcium sulfate whiskers in the growth process [19,21]; and there is partial agglomeration without surface treatment.

2.1.2. Basalt Fiber

At present, basalt fiber (BF) produced by various manufacturers can be divided into bundle BF and flocculent BF according to the dispersion. Among them, chopped strand BF, as a millimeter-grade fiber reinforced material, is made of natural basalt as raw material and cut into chopped fibers by continuous BF at a fixed length, which has the advantages of high tensile strength, excellent thermal stability, excellent corrosion resistance and good surface wettability [5]. In this study, the chopped BF produced by Changzhou Bochao Engineering Materials Co., Ltd., located in Changzhou, China, after surface treatment with silane coupling agent was used. The technical indexes of BF are shown in Table 2.
The macro and micro morphology of BF are shown in Figure 2. From this, it can be found that BF has a slender cylindrical shape under SEM, and its surface is relatively smooth and uniform (Figure 1) compared to CSW, which can improve the stability of the matrix [22]. Additionally, Xing et al. [23] thought that BF can play a role in strengthening and toughening asphalt.

2.2. Design and Preparation of Mixture

2.2.1. Grading Design of Mixture

Asphalt mixtures with different mineral aggregate gradation have different road performance and different pavement layers. Considering that the maximum fiber length is 9 mm, AC-13C gradation was used for asphalt mixture in the test, and the synthetic gradation curve was the curve close to the median gradation in the Technical Specifications for Construction of Highway Asphalt Pavements (JTG F40-2004) [24], so the pass rate of key sieve holes (2.36 mm) was less than 40%.
Marshall compaction test was carried out in accordance with the Test Method of Aggregates for Highway Engineering (JTG E42-2005-T0702) [25]. With the median asphalt-aggregate ratio of 4.0%, it was divided into five groups according to 0.5%—that is, the molding asphalt–aggregate ratios were 3.0%, 3.5%, 4.0%, 4.5%, and 5%, respectively. The relative density of the gross volume of the specimen was measured by surface drying method, and the theoretical maximum relative density, stability, flow value, porosity, saturation, mineral aggregate porosity and other indicators were calculated, and the Marshall test was carried out in groups. The aggregate drying temperature and asphalt heating temperature were selected at 180 °C and 160 °C respectively. The mixing temperature and compaction temperature were 170 °C and 148 °C respectively. Marshall test results are shown in Table 3.
According to the Technical Specifications for Construction of Highway Asphalt Pavements (JTG F40-2004) [24], the optimal asphalt–aggregate ratio was determined. When there was no peak in the density or stability of the asphalt–aggregate ratio selected in the experiment, the asphalt–aggregate ratio a3 corresponding to the target void ratio could be directly taken as OAC1, and the median value of OACmin~OACmax was taken as OAC2, so the optimal asphalt–aggregate ratio of AC-13C matrix asphalt mixture was 4.3%.

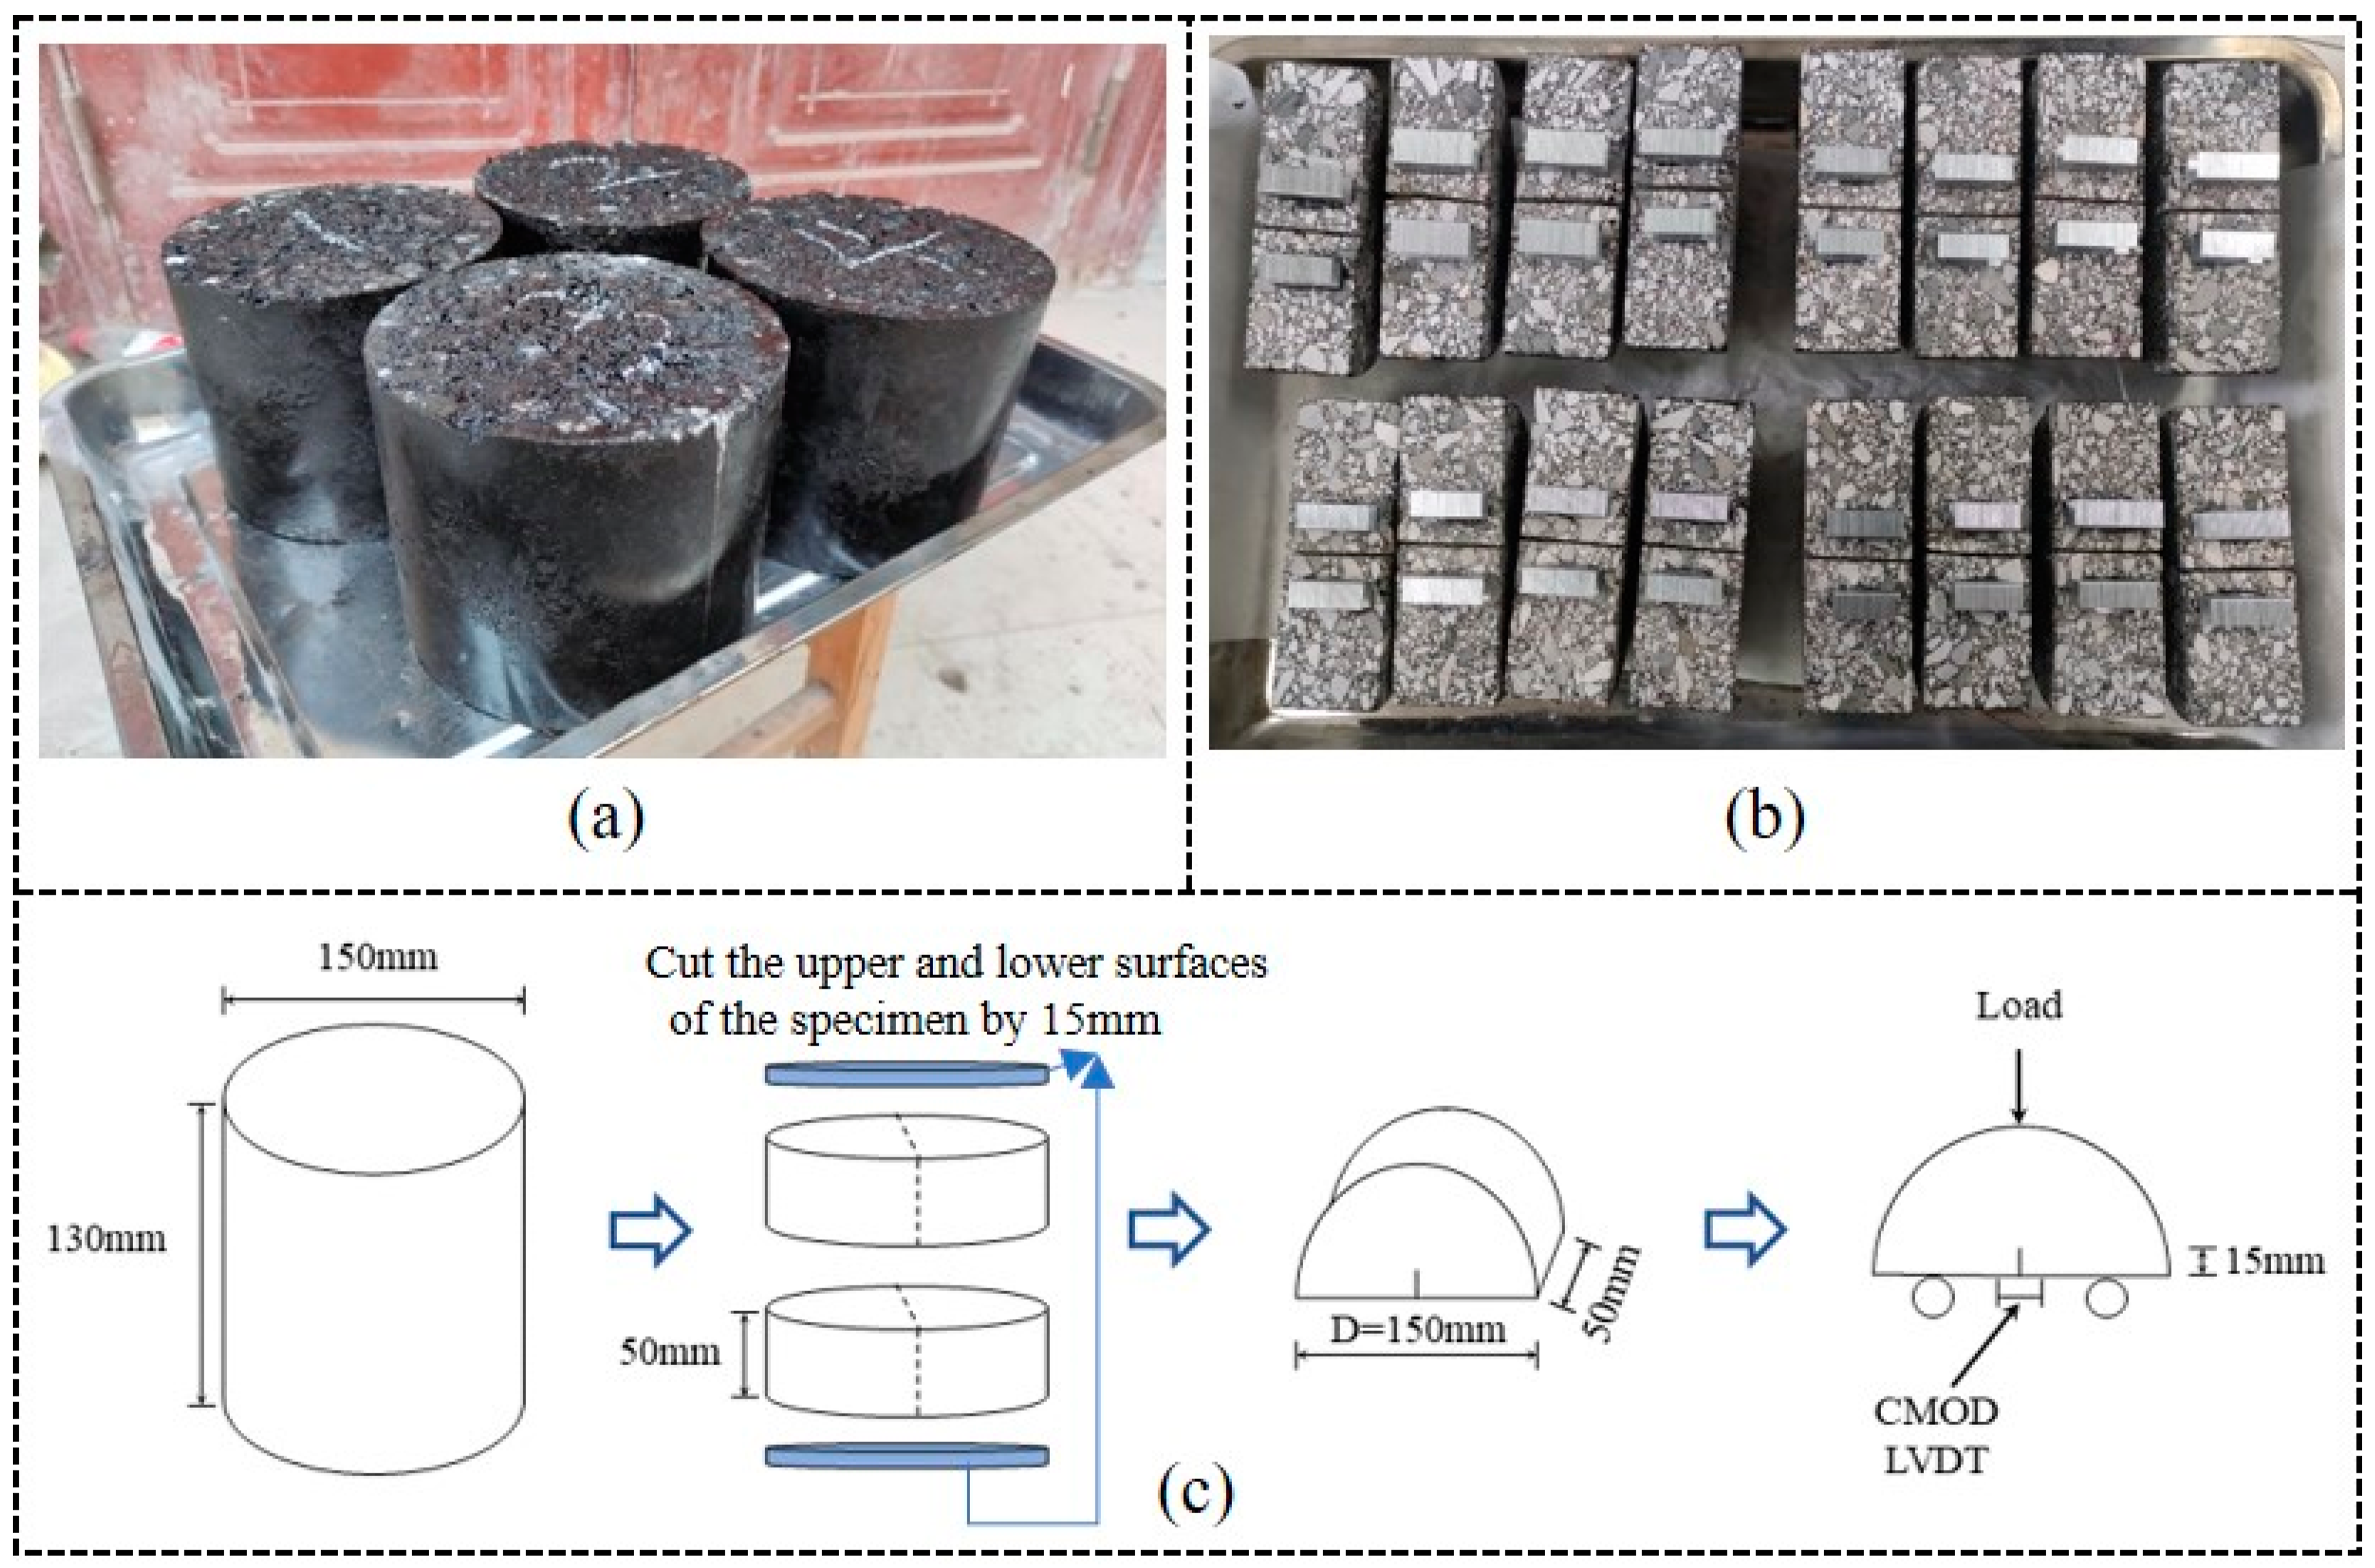
2.2.2. Preparation of SCB Test Sample

In this study, four types of asphalt mixture samples were prepared: matrix asphalt mixture (70#), BF modified asphalt mixture (BF), CSW modified asphalt mixture (CSW), and hybrid fiber modified mixture (CSW + BF). Six SCB specimens were prepared for each group to conduct parallel experiments. Based on the preliminary research by the team, the basalt fiber content was set at 0.32% (by aggregate weight) and the calcium sulfate whisker content at 5% (by asphalt weight). The CSW-modified asphalt was first prepared using the wet process, followed by the preparation of the CSW + BF asphalt mixture using the dry process. The detailed preparation process is outlined in references [5,9].
In this study, a superpave rotary compaction tester was used to form cylindrical specimens with radius: height = 75 mm × 130 mm, as shown in Figure 3a. Considering the difference in density between the top and bottom materials of rotary compaction specimens and the middle materials, before cutting semi-circular bending specimens, 15 mm was cut off from the upper and lower surfaces of cylindrical specimens; the remaining cylindrical specimens were cut according to the sample size of radius: height = 75 mm × 50 mm; and the two cut specimens were divided radially to make four semicircular specimens. Finally, the middle seam was cut at the bottom of each semicircular specimen, and the size of the middle seam was 15 mm × 1.5 mm. The semicircular bending specimen and its preparation process are shown in Figure 3b,c.

2.3. Experimental Design of SCB Based on Digital Image Method

In this study, an electronic extensometer produced by Steel Research and Testing Technology Co., Ltd., based in Shanghai, China, was used to record the central mouth opening displacement (CMOD) of SCB specimens. The extensometer model was YYU-10/25, with a range of 10 mm. To ensure that the crack path of the specimen was clearly recorded during the test, the surface of the prepared SCB specimen was manually dyed with red hand paint, as shown in Figure 4a,b. The extensometer was designed to move in real time with the opening of the middle seam, which was achieved by fixing an extended staple on both sides of the seam with AB glue and securing the extensometer clip to the staple with a rubber band.
Test temperature is a key factor affecting the low-temperature stiffness of asphalt materials. To prevent brittle fracture, rapid crack propagation, increased difficulty in test operation, and an incomplete load–displacement curve during the SCB test—factors that are not conducive to comparing different types of asphalt mixtures—the insulation temperatures of the specimens were set at −5 °C, 10 °C, and 25 °C. Each specimen was insulated using a material testing machine (MTS) temperature control box, and each group of specimens was insulated for 6 h to ensure that the internal and external temperatures were consistent, as shown in Figure 4c.
During the test, a semi-circular specimen with a middle seam was placed on a three-point bending bracket with adjustable spacing, and the distance between the two supporting points at the bottom of the specimen was adjusted to 0.8D (where D is the diameter of the specimen). After heat preservation, the specimen was quickly removed, the extensometer was fixed, and the specimen was placed on the loading bracket. The upper pressure head of the universal MTS was aligned with the middle seam of the specimen, ensuring the load direction and middle seam were in the same straight line, with a constant loading rate of 2 mm/min, as shown in Figure 4d. The real-time load, vertical displacement, and CMOD of the specimen were recorded by MTS software. Additionally, a high-resolution camera was positioned 1.5 m away from the MTS instrument, with its visual axis perpendicular to the specimen’s surface, to record the entire fracture process during loading, capturing all the damage and changes throughout, as shown in Figure 4e.

3. Results and Discussion

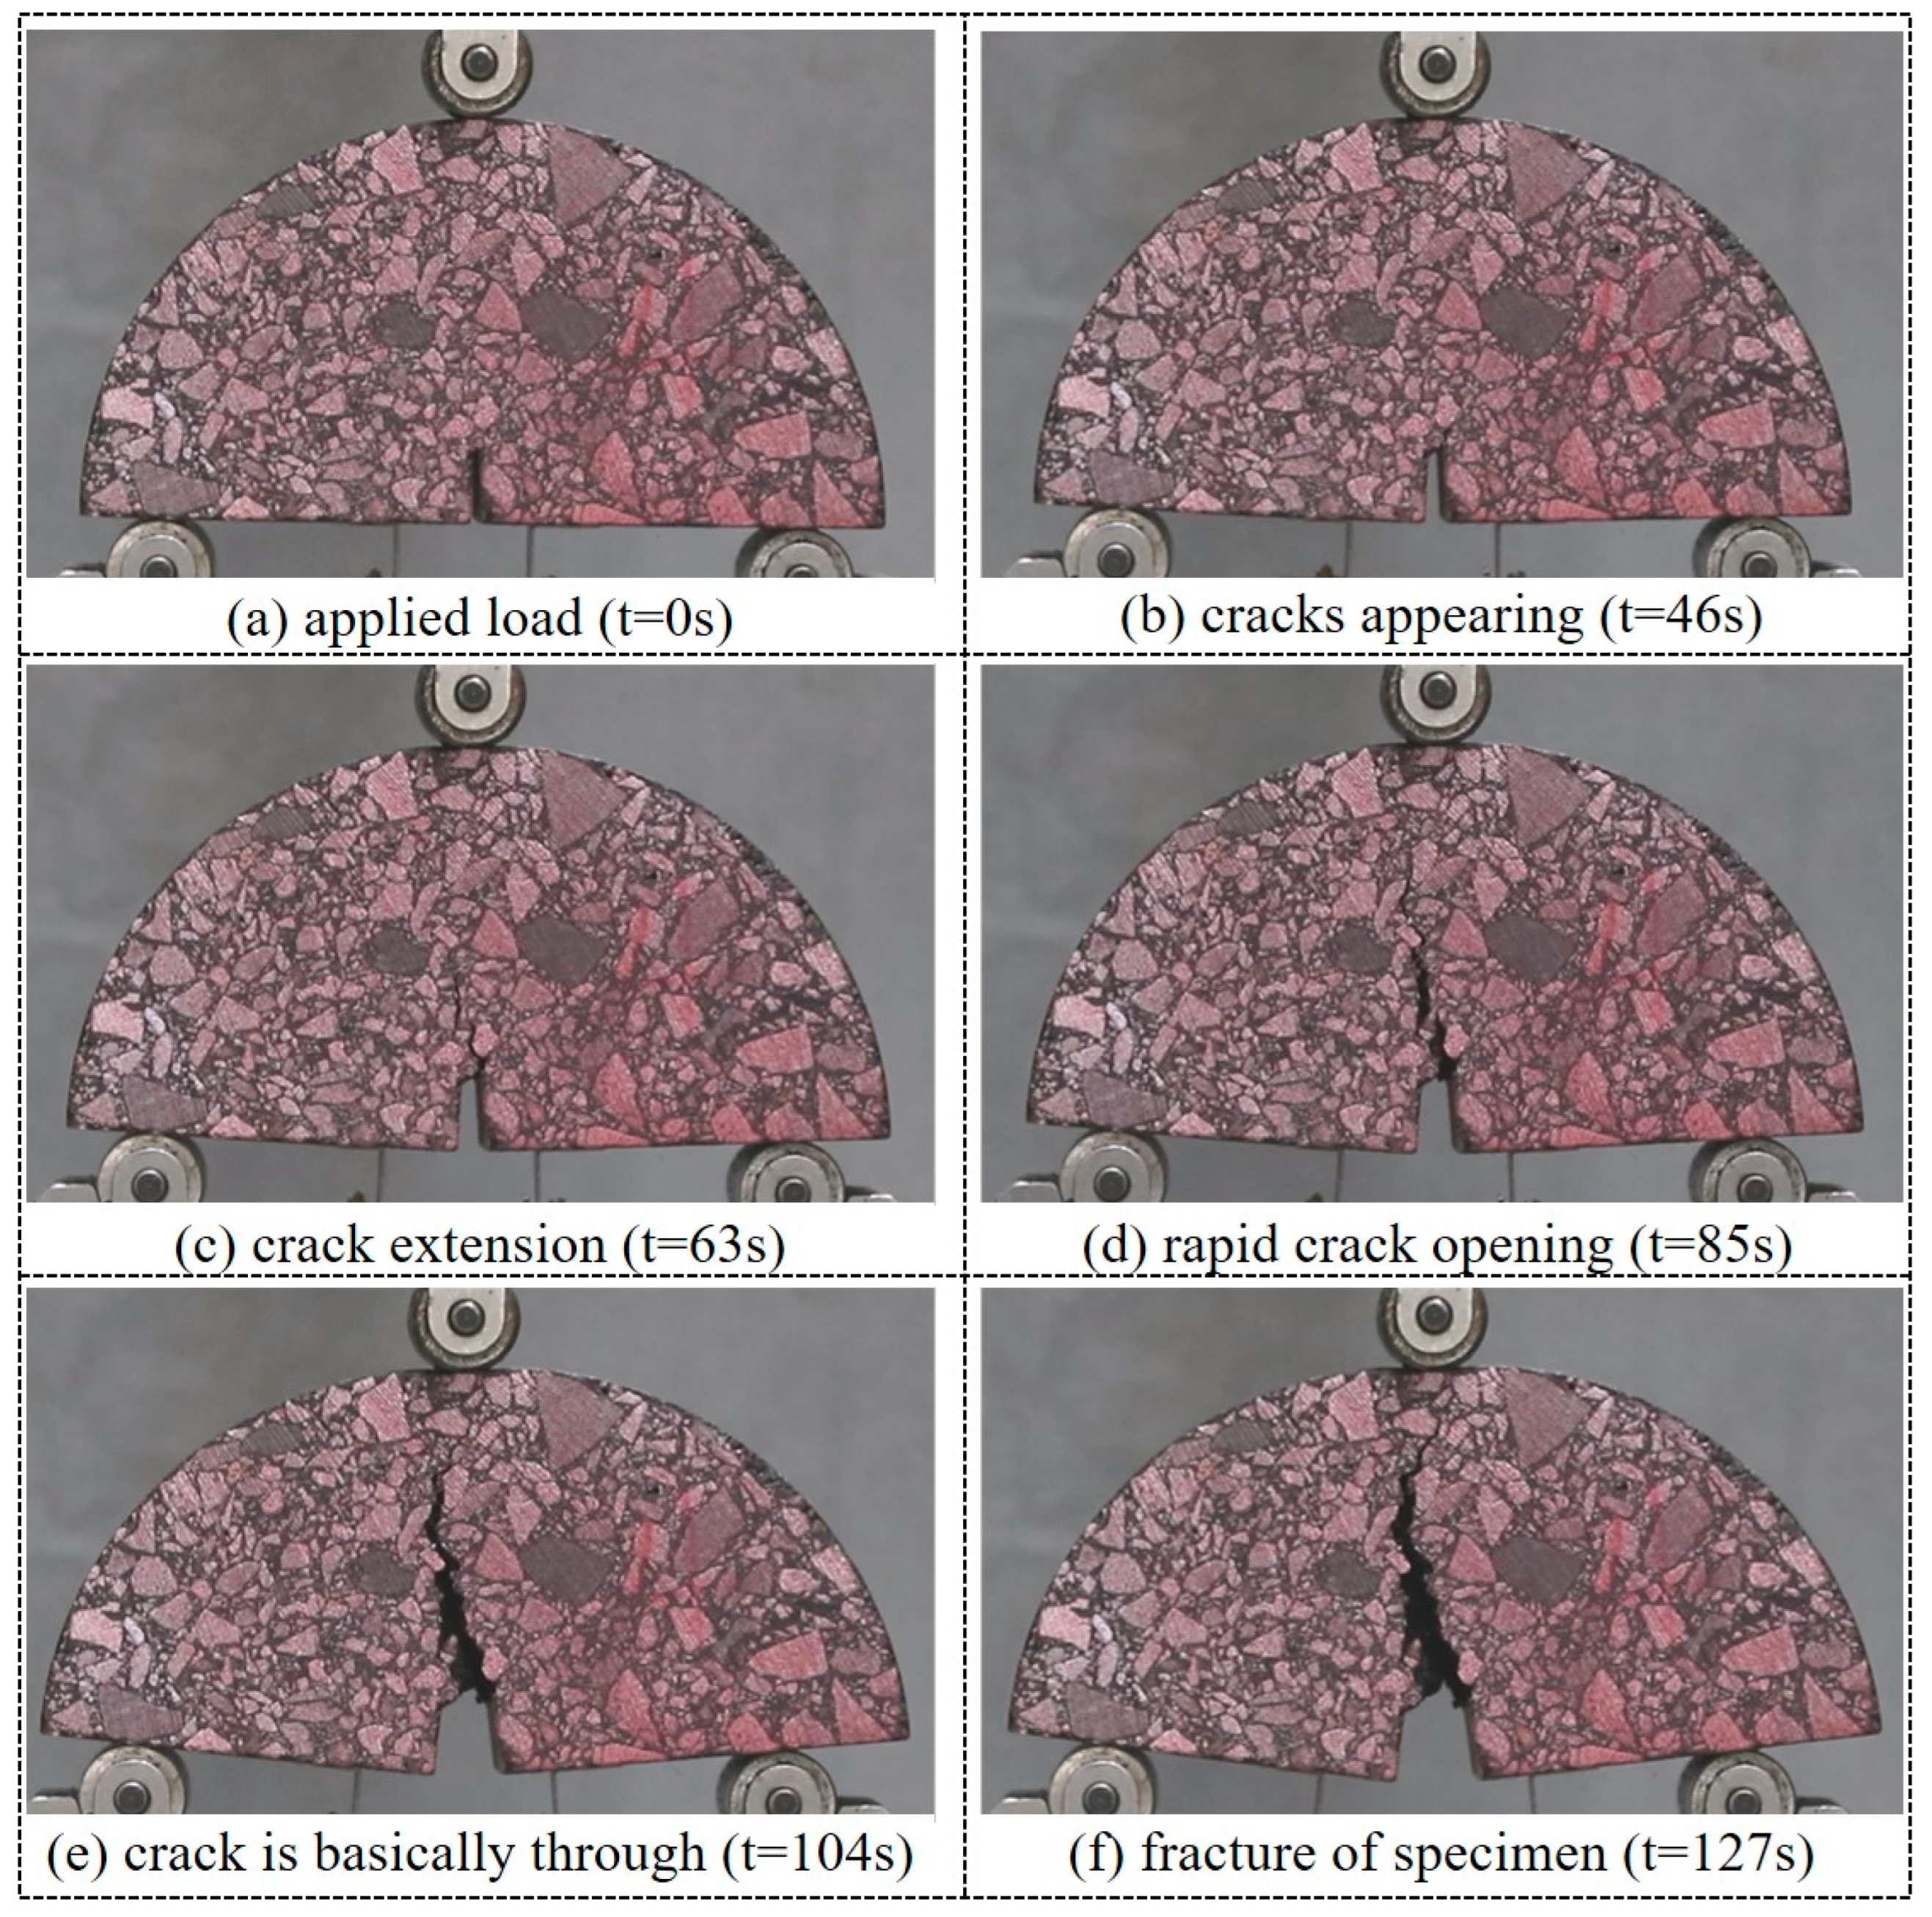
3.1. Analysis of Fracture Process of Mixture Based on SCB Test

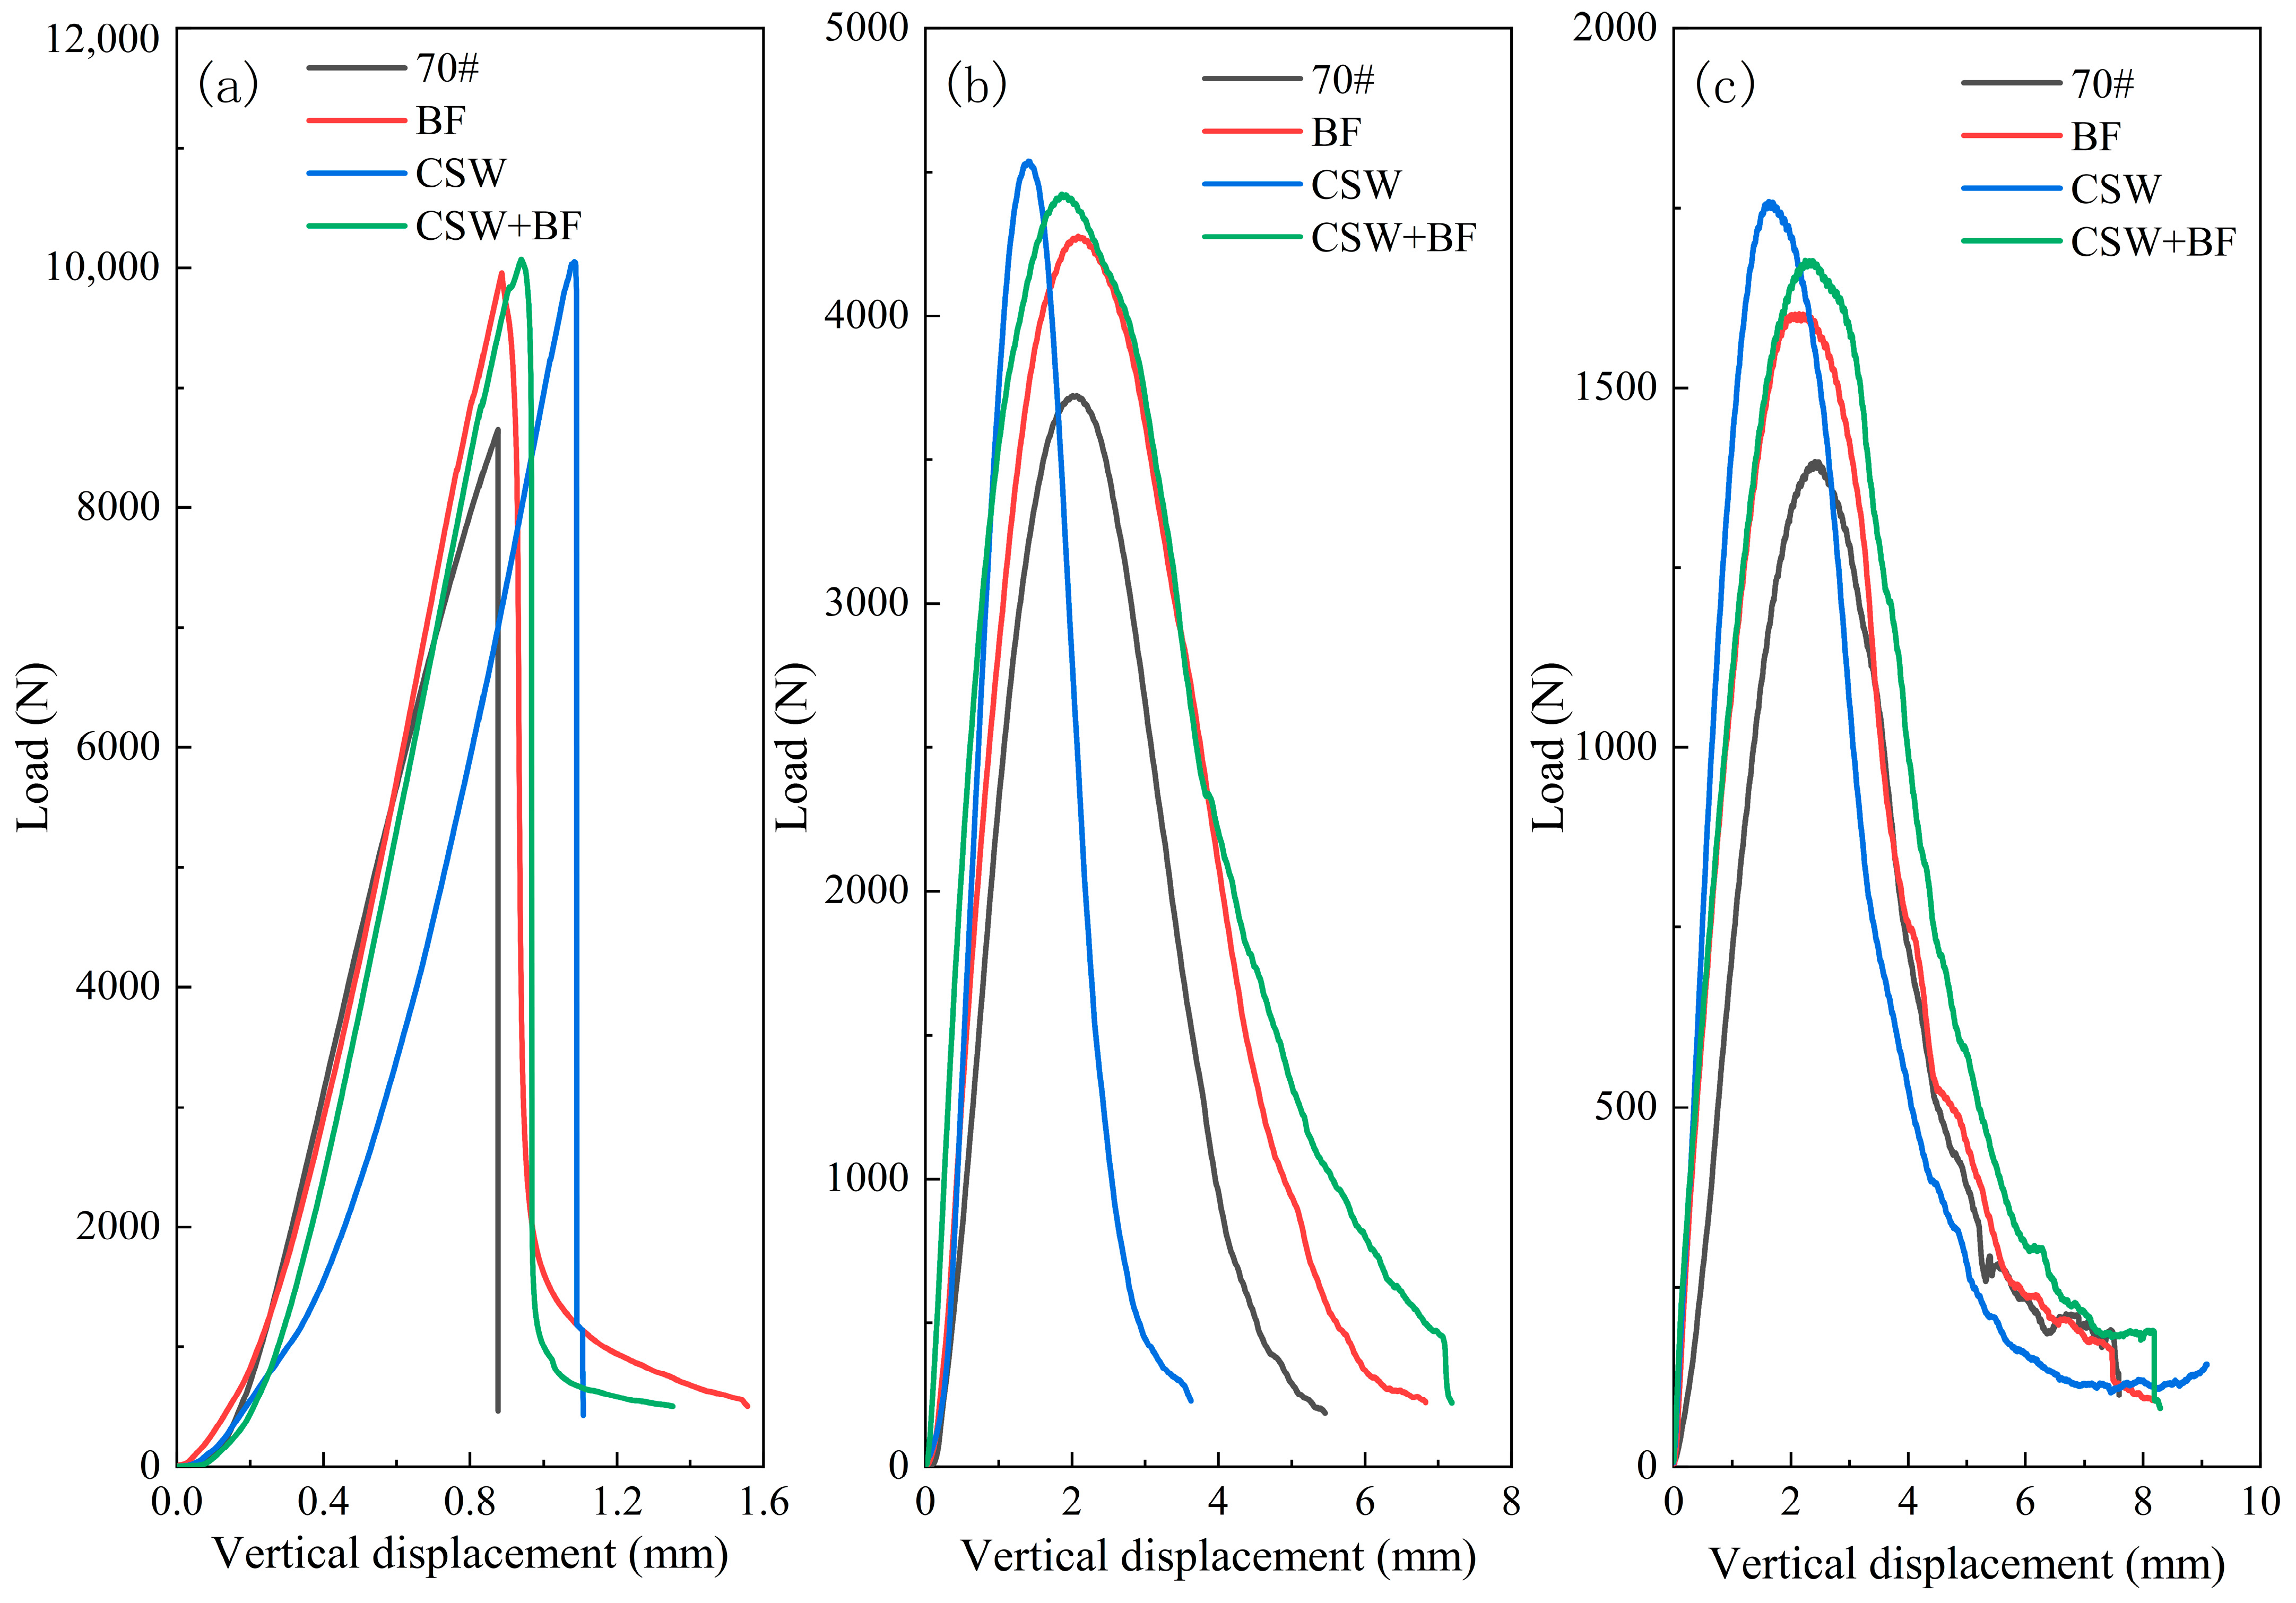
3.1.1. Load–Vertical Displacement Curve

The results of the SCB test, specifically the load–vertical displacement for different types of asphalt mixtures, are plotted on separate curves. The representative data from parallel tests are used as examples, as shown in Figure 5. The lower the temperature of SCB test, the smaller the vertical displacement and the greater the peak load when the specimen breaks under load. Among them, 70# asphalt and CSW show brittle fracture at −5 °C, and the low-temperature crack resistance is the worst. With the increase in test temperature, the elastic modulus of asphalt mixture decreases gradually, and the curve transitions to gentle type, and the vertical displacement corresponding to peak load increases gradually, and the toughness increases, indicating that temperature is the key factor to determine the viscoelasticity of asphalt mixture. There are four kinds of asphalt mixtures at different temperatures: the peak load of matrix asphalt mixture is the smallest and the curve is smoother; the peak load of BF is larger, and the vertical displacement under peak load is also larger; the peak load of CSW is basically the same as that of BF, but the vertical displacement at peak load is the smallest; the peak load of CSW + BF changes little, but the vertical displacement is larger, and the curve develops most gently after the peak load.
At low temperature, with the increase of the load at the top of the semi-circular specimen, the tensile stress at the bottom of the specimen gradually increases, and micro-cracks are generated at the tip of the middle seam, which quickly and gradually extend upward and reach the peak load in a very short time. At this time, the mixture is mainly elastic and shows brittle fracture. At room temperature, the cracking speed of the specimen is obviously slow, the crack breakthrough time is delayed, and the specimen can still bear a large residual load after reaching the peak load. At this time, the mixture is mainly in a viscoelastic state, showing ductile fracture.
At the same temperature, the peak load of fiber asphalt mixture is larger and the vertical displacement at the peak is larger, which shows that fiber materials can enhance the tensile strength of the mixture and reduce the crack propagation speed after the peak load of the mixture. When the fiber is tested in a specimen with a large cross-sectional area, it shows excellent reinforcement and crack resistance. Before the peak load, the fibers in the micro-cracks adhere to the asphalt material, fixing the aggregate in the mixture, and the peak load is enhanced. After the peak load, the crack width increases and expands into the main crack. Because BF has excellent tensile strength and is distributed perpendicularly to the crack interface, even if the interface adhesion fails, the pull-out effect still exists, and the macroscopic performance is that the residual load increases [19,23]. Compared to the matrix asphalt mixture, the curve slope of CSW modified asphalt mixture before peak load is larger and the vertical displacement under peak load is smaller, which shows that CSW material can strengthen the interface adhesion between asphalt and aggregate and increase the stiffness modulus of asphalt. However, the modulus is too large, which also leads to faster crack propagation and poor toughness performance of the mixture.

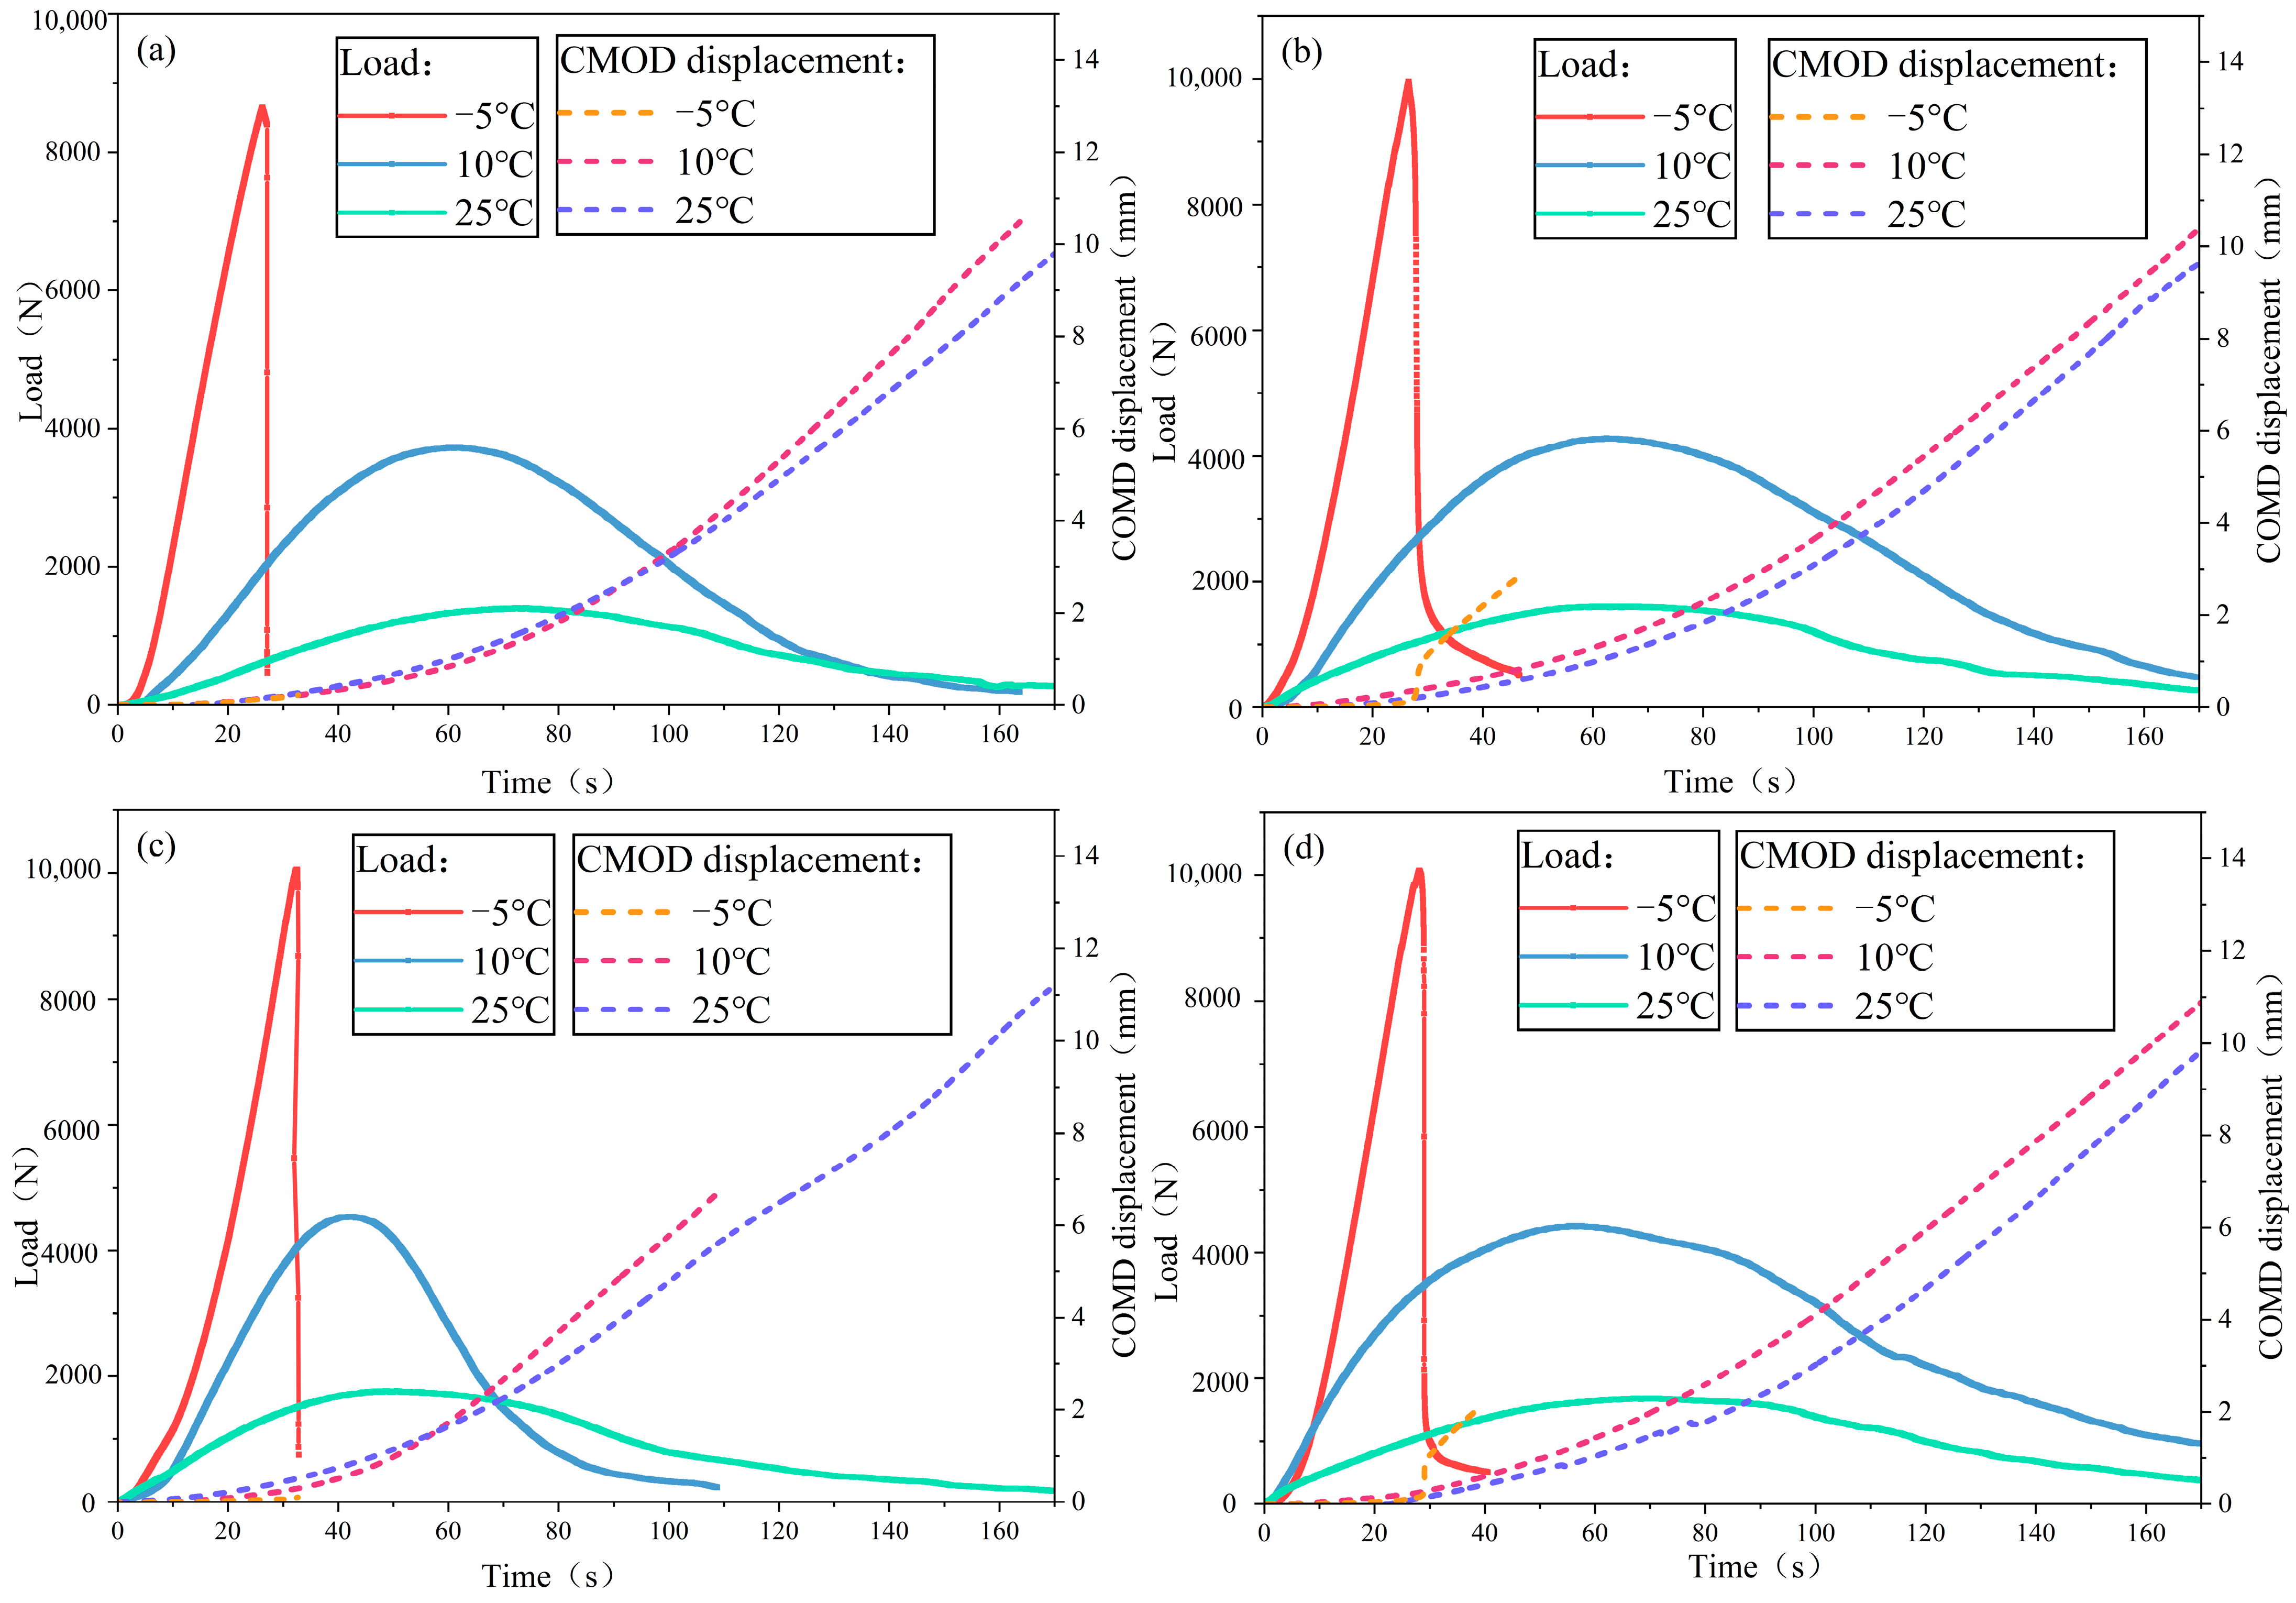
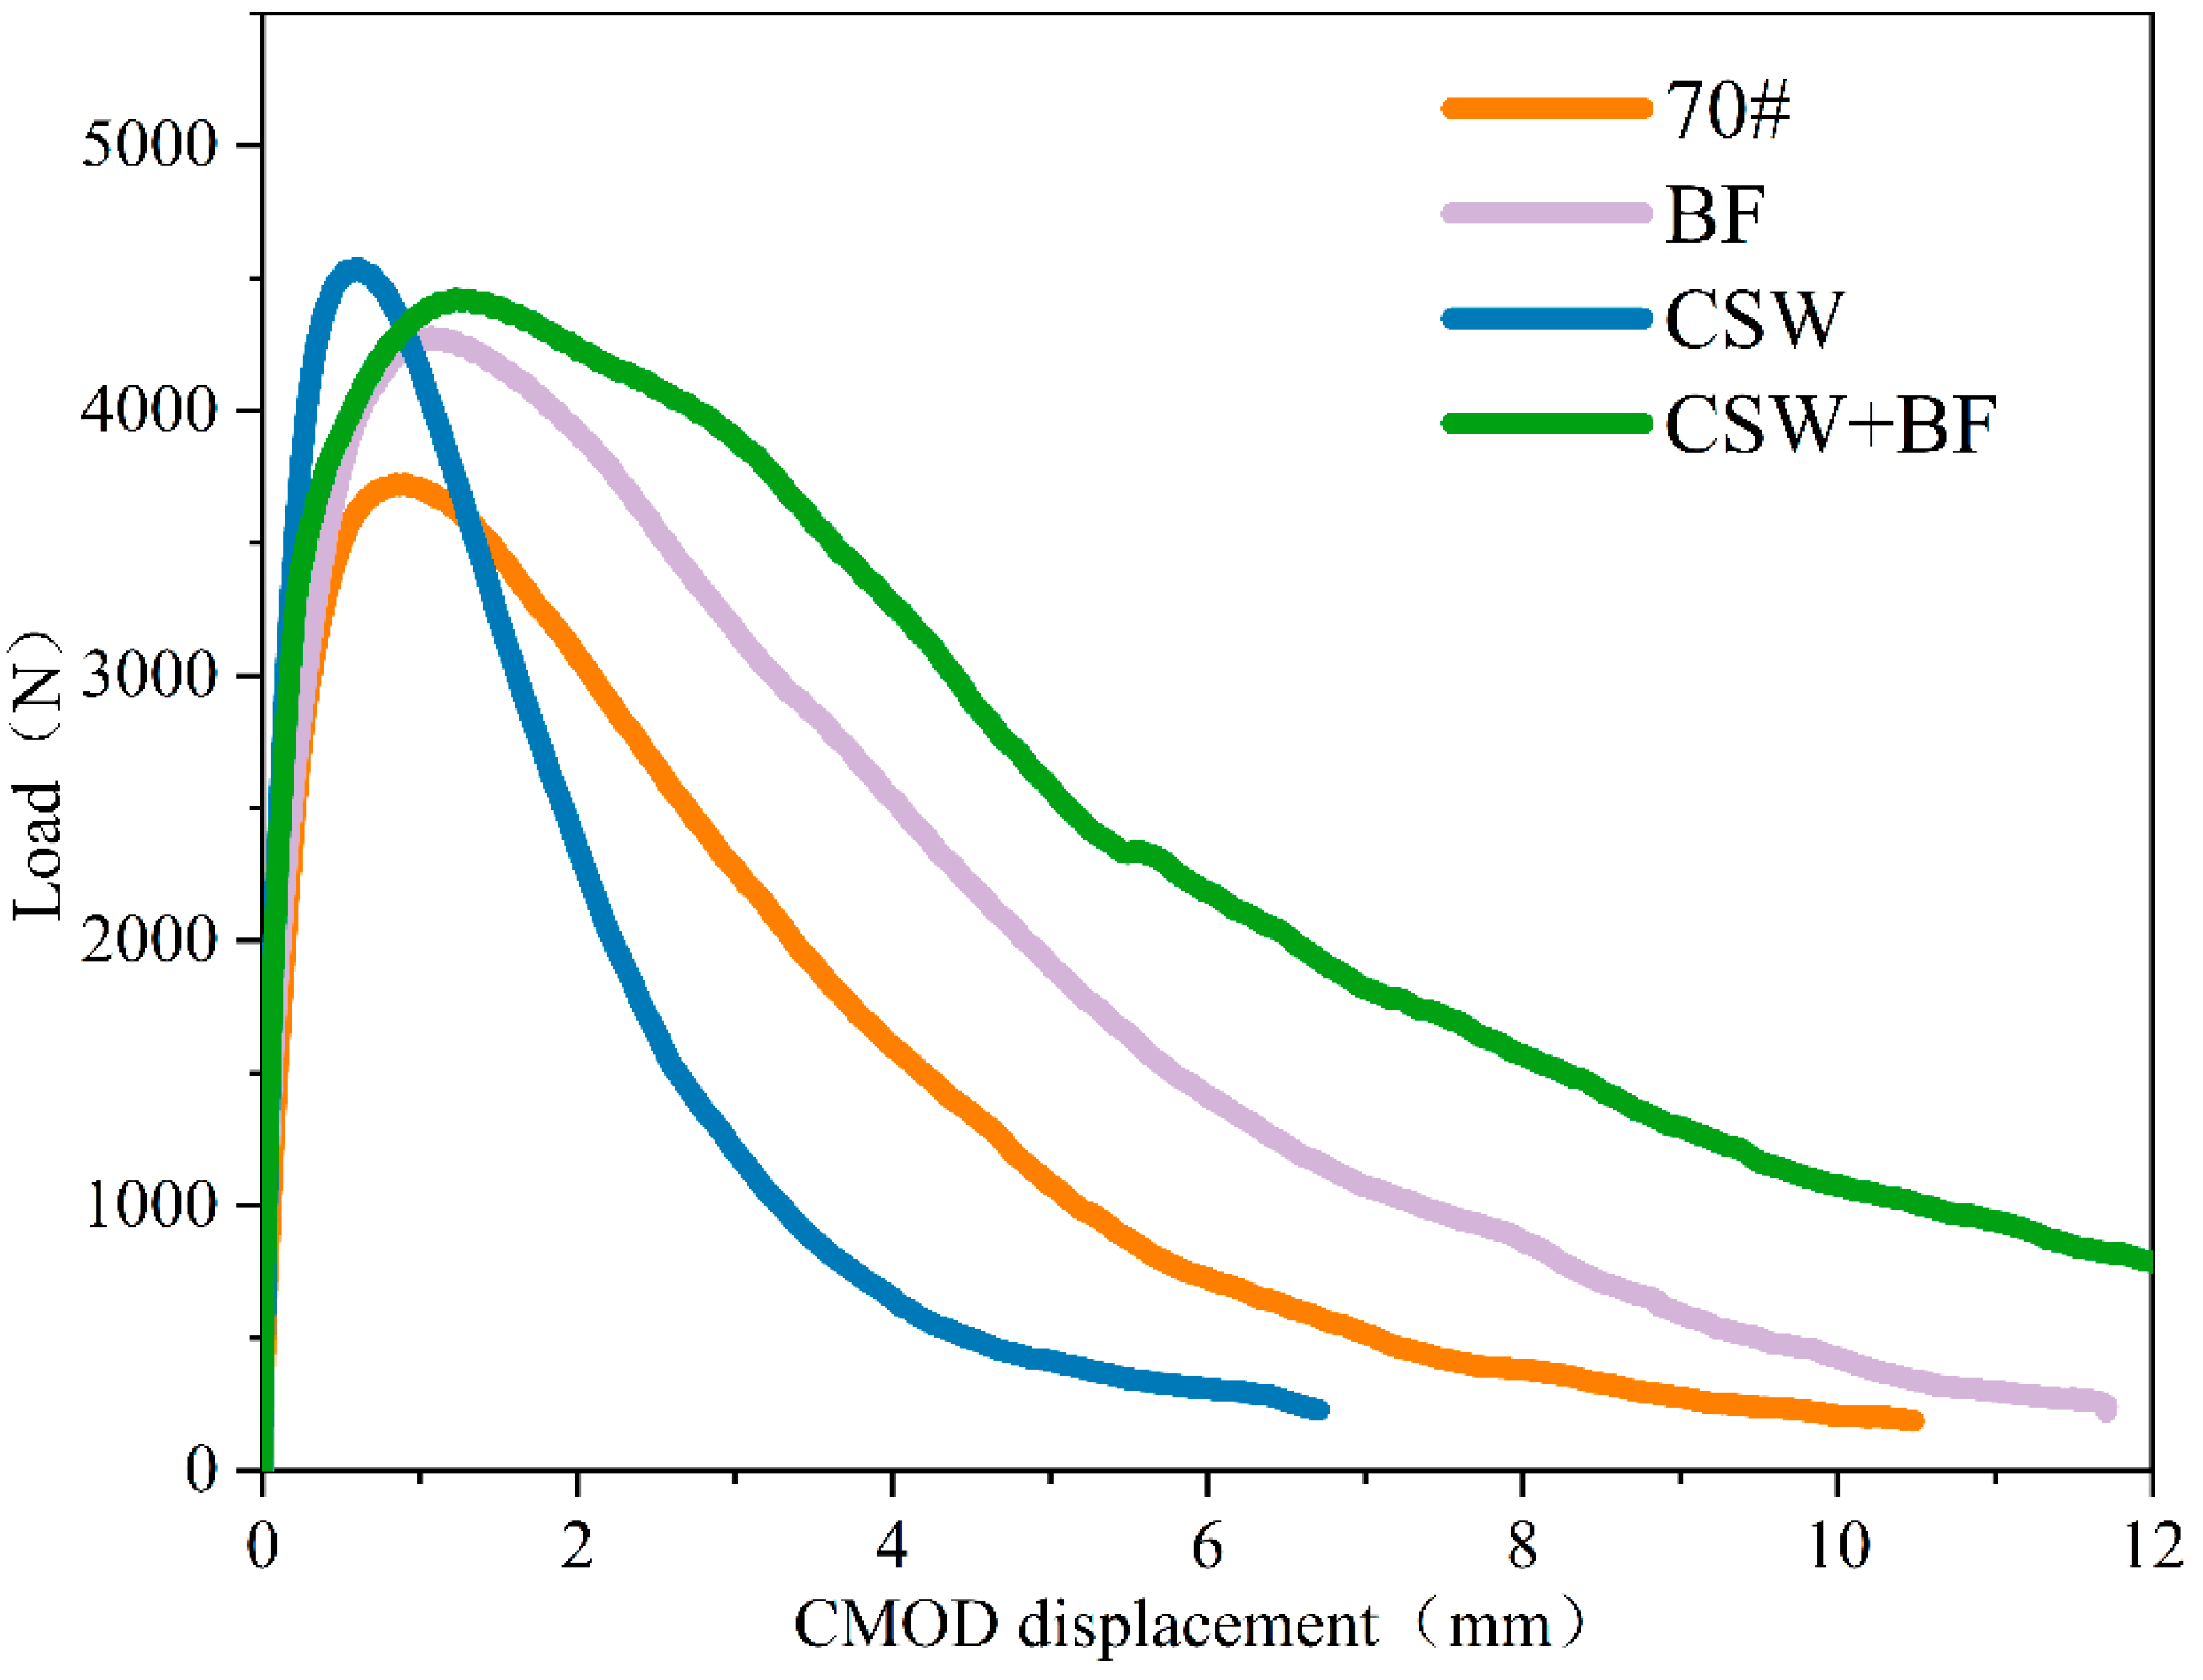
3.1.2. Load–CMOD Displacement–Time Curve

Time is the key factor of fracture toughness in a semi-circular bending test, and CMOD displacement is also an important evaluation index of fracture opening rate of specimens. The longer the fracture process, the smaller the crack opening rate of specimens and the stronger the low-temperature fracture toughness of asphalt mixture. Therefore, in this part, the load–time curve and CMOD displacement–time curve of different types of asphalt mixtures at different temperatures in SCB test were combined and analyzed, taking the representative data in parallel test as an example, and the results are shown in Figure 6.
Under a constant rate load, the load-time curves of different asphalt mixtures closely resemble the load-vertical displacement curves, displaying a pattern where the load initially increases with time and then decreases. The CMOD displacement also increases over time, and a steeper curve indicates a faster crack width expansion rate at the middle crack. The CMOD displacement curves show that as the temperature increases, the crack opening rate slows down. Notably, the specimen at −5 °C fractures too quickly, resulting in fewer recorded CMOD data points, which obscures long-term trends. By comparing the abrupt changes in CMOD displacement between the 10 °C and 25 °C curves, we can gauge the ability of different asphalt mixtures to delay crack growth as the temperature rises. The latest mutation point occurs in the 70# asphalt, followed by CSW, with BF and CSW + BF showing the earliest mutation points. This suggests that fibers effectively reduce the fracture rate through their adhesion with aggregate and asphalt [26], making them a valuable material for enhancing the toughness of asphalt mixtures.
By analyzing the characteristic points of load–time curve and CMOD displacement-time curve, it is found that the addition of BF delays the time corresponding to the peak load of load–time curve and reduces the fracture rate of asphalt mixture. The absolute value of the post-peak slope of the load–time curve is reduced, the stiffness modulus after cracking is reduced, the displacement–time curve of CMOD is shifted downward, and the residual load in the fracture process is increased. Combining Figure 6 and Figure 7 reveals that the addition of CSW increases the peak load, but the time to reach this peak is shortened, and the CMOD displacement at the same time increases. This suggests that CSW negatively impacts the low-temperature toughness of the asphalt mixture.
As can be seen from Figure 7, with the increase of CMOD displacement, the load on SCB specimens first rises and then falls, and the slope before peak load is greater than that after peak load. The order of peak load of different mixtures is CSW > CSW + BF > BF > 70#, which shows that CSW and BF can improve the tensile strength of asphalt mixture matrix, and the material is not easy to produce through cracks under the action of temperature stress and load. However, the CMOD displacement corresponding to the peak load of CSW decreases, which shows that CSW will reduce the flexural-tensile strain of asphalt mixture and increase the stiffness of asphalt, which is unfavorable to the crack toughness of materials at low temperature. The CMOD displacement of BF corresponding to the peak load of CSW + BF is large, which shows that fiber materials can toughen asphalt concrete and reduce its crack propagation speed.
The absolute value of the slope of the load-CMOD displacement curve after the peak load is ranked as CSW > 70# > BF > CSW + BF. The order shows that CSW increases the stiffness at the crack tip, CSW modified asphalt has greater stiffness, and low temperature conditions reduce the interfacial adhesion between asphalt and aggregate, which makes CSW’s crack resistance poor. The elastic modulus of BF and CSW + BF modified asphalt is the smallest at the crack tip. The reason may be that the temperature sensitivity of fiber is weak. Under the condition of 10 °C, the tensile strength of fiber is greater than the viscosity of asphalt itself. After the interface of asphalt cracks, the bridging and reinforcement of fiber improve the tensile strength at the crack, so the elastic modulus decreases under the condition of constant deformation. However, under the condition of −5 °C, the tensile strength of fiber is less than the interfacial adhesion between fiber and asphalt, and the brittle fracture of fiber and asphalt occurs directly, so the elastic modulus has little difference.

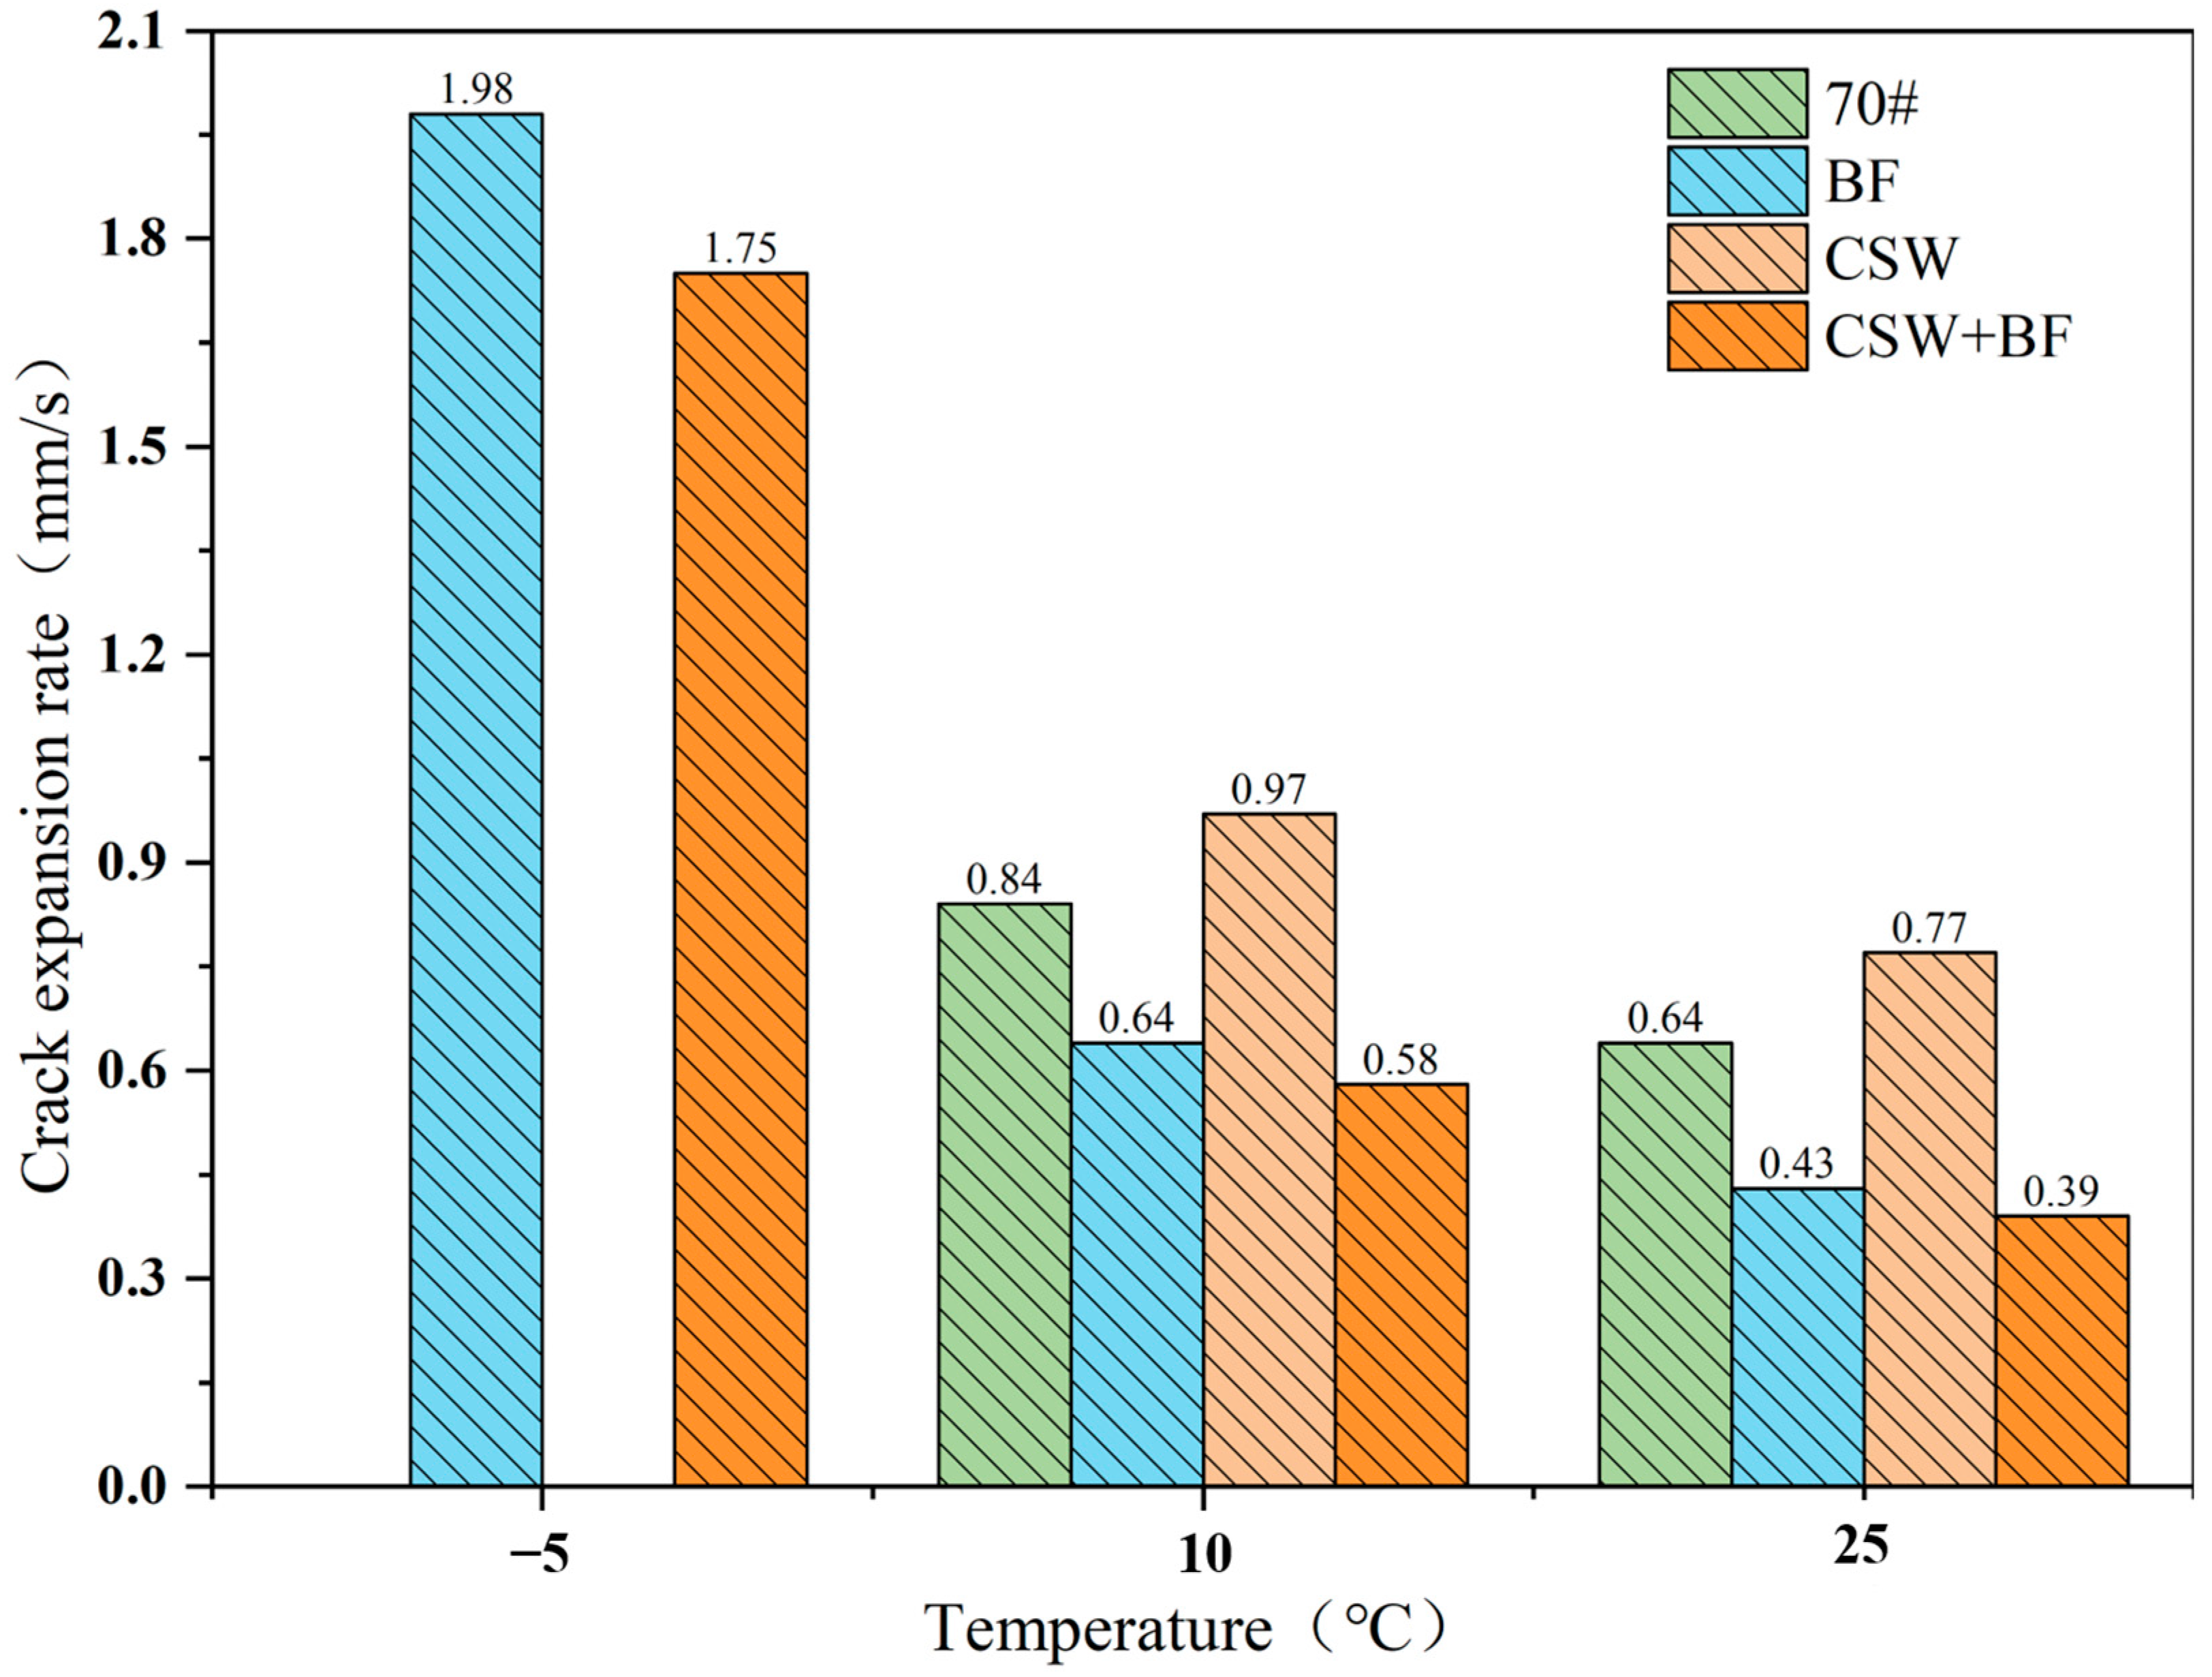
3.1.3. Crack Propagation Speed

In this study, the Potplayer video player v1.6.63891 was used to capture the images of SCB specimens at different cracking moments in the video of specimen cracking process. Taking the cracking process of CSW + BF modified asphalt mixture at 10 °C as an example, six representative moments were selected as the crack state images at different cracking stages, as shown in Figure 8. It can be found that macro cracks did not appear in the specimen for a long time after loading, and cracks appeared for the first time after loading for 52 s, but they were not clear, indicating that micro cracks had been produced. After loading for 84 s, the specimen has a clear crack propagation path, which indicates that it is in the stress attenuation stage after peak load, and at this time, the micro-cracks have expanded upward, and micro-cracks interweave at the upper part of the specimen. After loading for 103 s, the surface crack of the specimen has spread more than half, and the middle crack at the bottom has obvious deformation, and the crack width increases rapidly at this stage. After loading for 132 s, the cracks have basically penetrated, but the residual load of the material is still large, which does not meet the test minimum load condition and continues to be loaded. After loading for 164 s, the crack runs up to the top, which means that the specimen is completely broken.
During the SCB test, a Canon D80 high-resolution digital camera, manufactured by Canon Inc. in Japan, was utilized to capture the surface cracking process of the specimen. The width of open cracks at different cracking moments can be measured by ImageJ 1.54j software, and the crack resistance of the asphalt mixture can be evaluated by the crack propagation speed, which is the crack propagation path length per unit time [27,28], and the calculation formula is as follows:
v = Δ s Δ t
where Δ s is the crack propagation path length, mm; Δ t is the load application time, s.
In this study, ImageJ 1.54j software was used to calibrate and measure the paths of the pictures of the specimens during fracture, as shown in Figure 9. The yellow box in the figure marks the ductile zone of the crack, and the width of the ductile zone is small, indicating that the specimen is an obvious type I open crack at 10 °C. The fulcrum on both sides of the bottom of SCB specimen was selected as the calibration size, and its length was calibrated to be 120 mm. The crack path was marked using the software’s segmented line tool, and the length of the continuous broken line mark was read, which is the crack propagation path length. The crack propagation speed can be calculated from the crack propagation path length and load application time.
Figure 10 shows the crack propagation speed of different specimens. It can be observed that as the test temperature decreases, the crack propagation speed of SCB specimens with different asphalt mixtures gradually increases. The crack propagation speed of fiber asphalt mixtures remains relatively constant. In contrast, the CSW-modified asphalt mixture exhibits the fastest crack propagation speed, suggesting that while CSW alone may negatively impact the crack resistance of the mixture, the addition of BF can significantly enhance crack resistance during the crack development stage and improve the overall toughness of the mixture. Temperature is a key factor affecting the crack shape of SCB specimens; the lower the temperature, the more the crack tends to form a straight line connecting the middle crack and the apex of the specimen. Consequently, the characteristics of the crack propagation path in different asphalt mixtures are also consistent with the observed changes in crack propagation speed.
Drawing from the analyses in Section 3.1.1 and Section 3.1.2, the lowest crack propagation speed observed in the CSW + BF mixture may be attributed to the synergistic interaction between the different scales of CSW and BF. This synergy enhances the stability and toughness of the mixture, resulting in a slower crack propagation speed. It is also worth noting that at −5 °C, both 70# asphalt and CSW exhibit brittle fracture, characterized by a short fracture process and distorted crack propagation speed data, which have not been included in the figure.

3.2. Analysis of Crack Resistance of Mixture Based on Fracture Mechanics

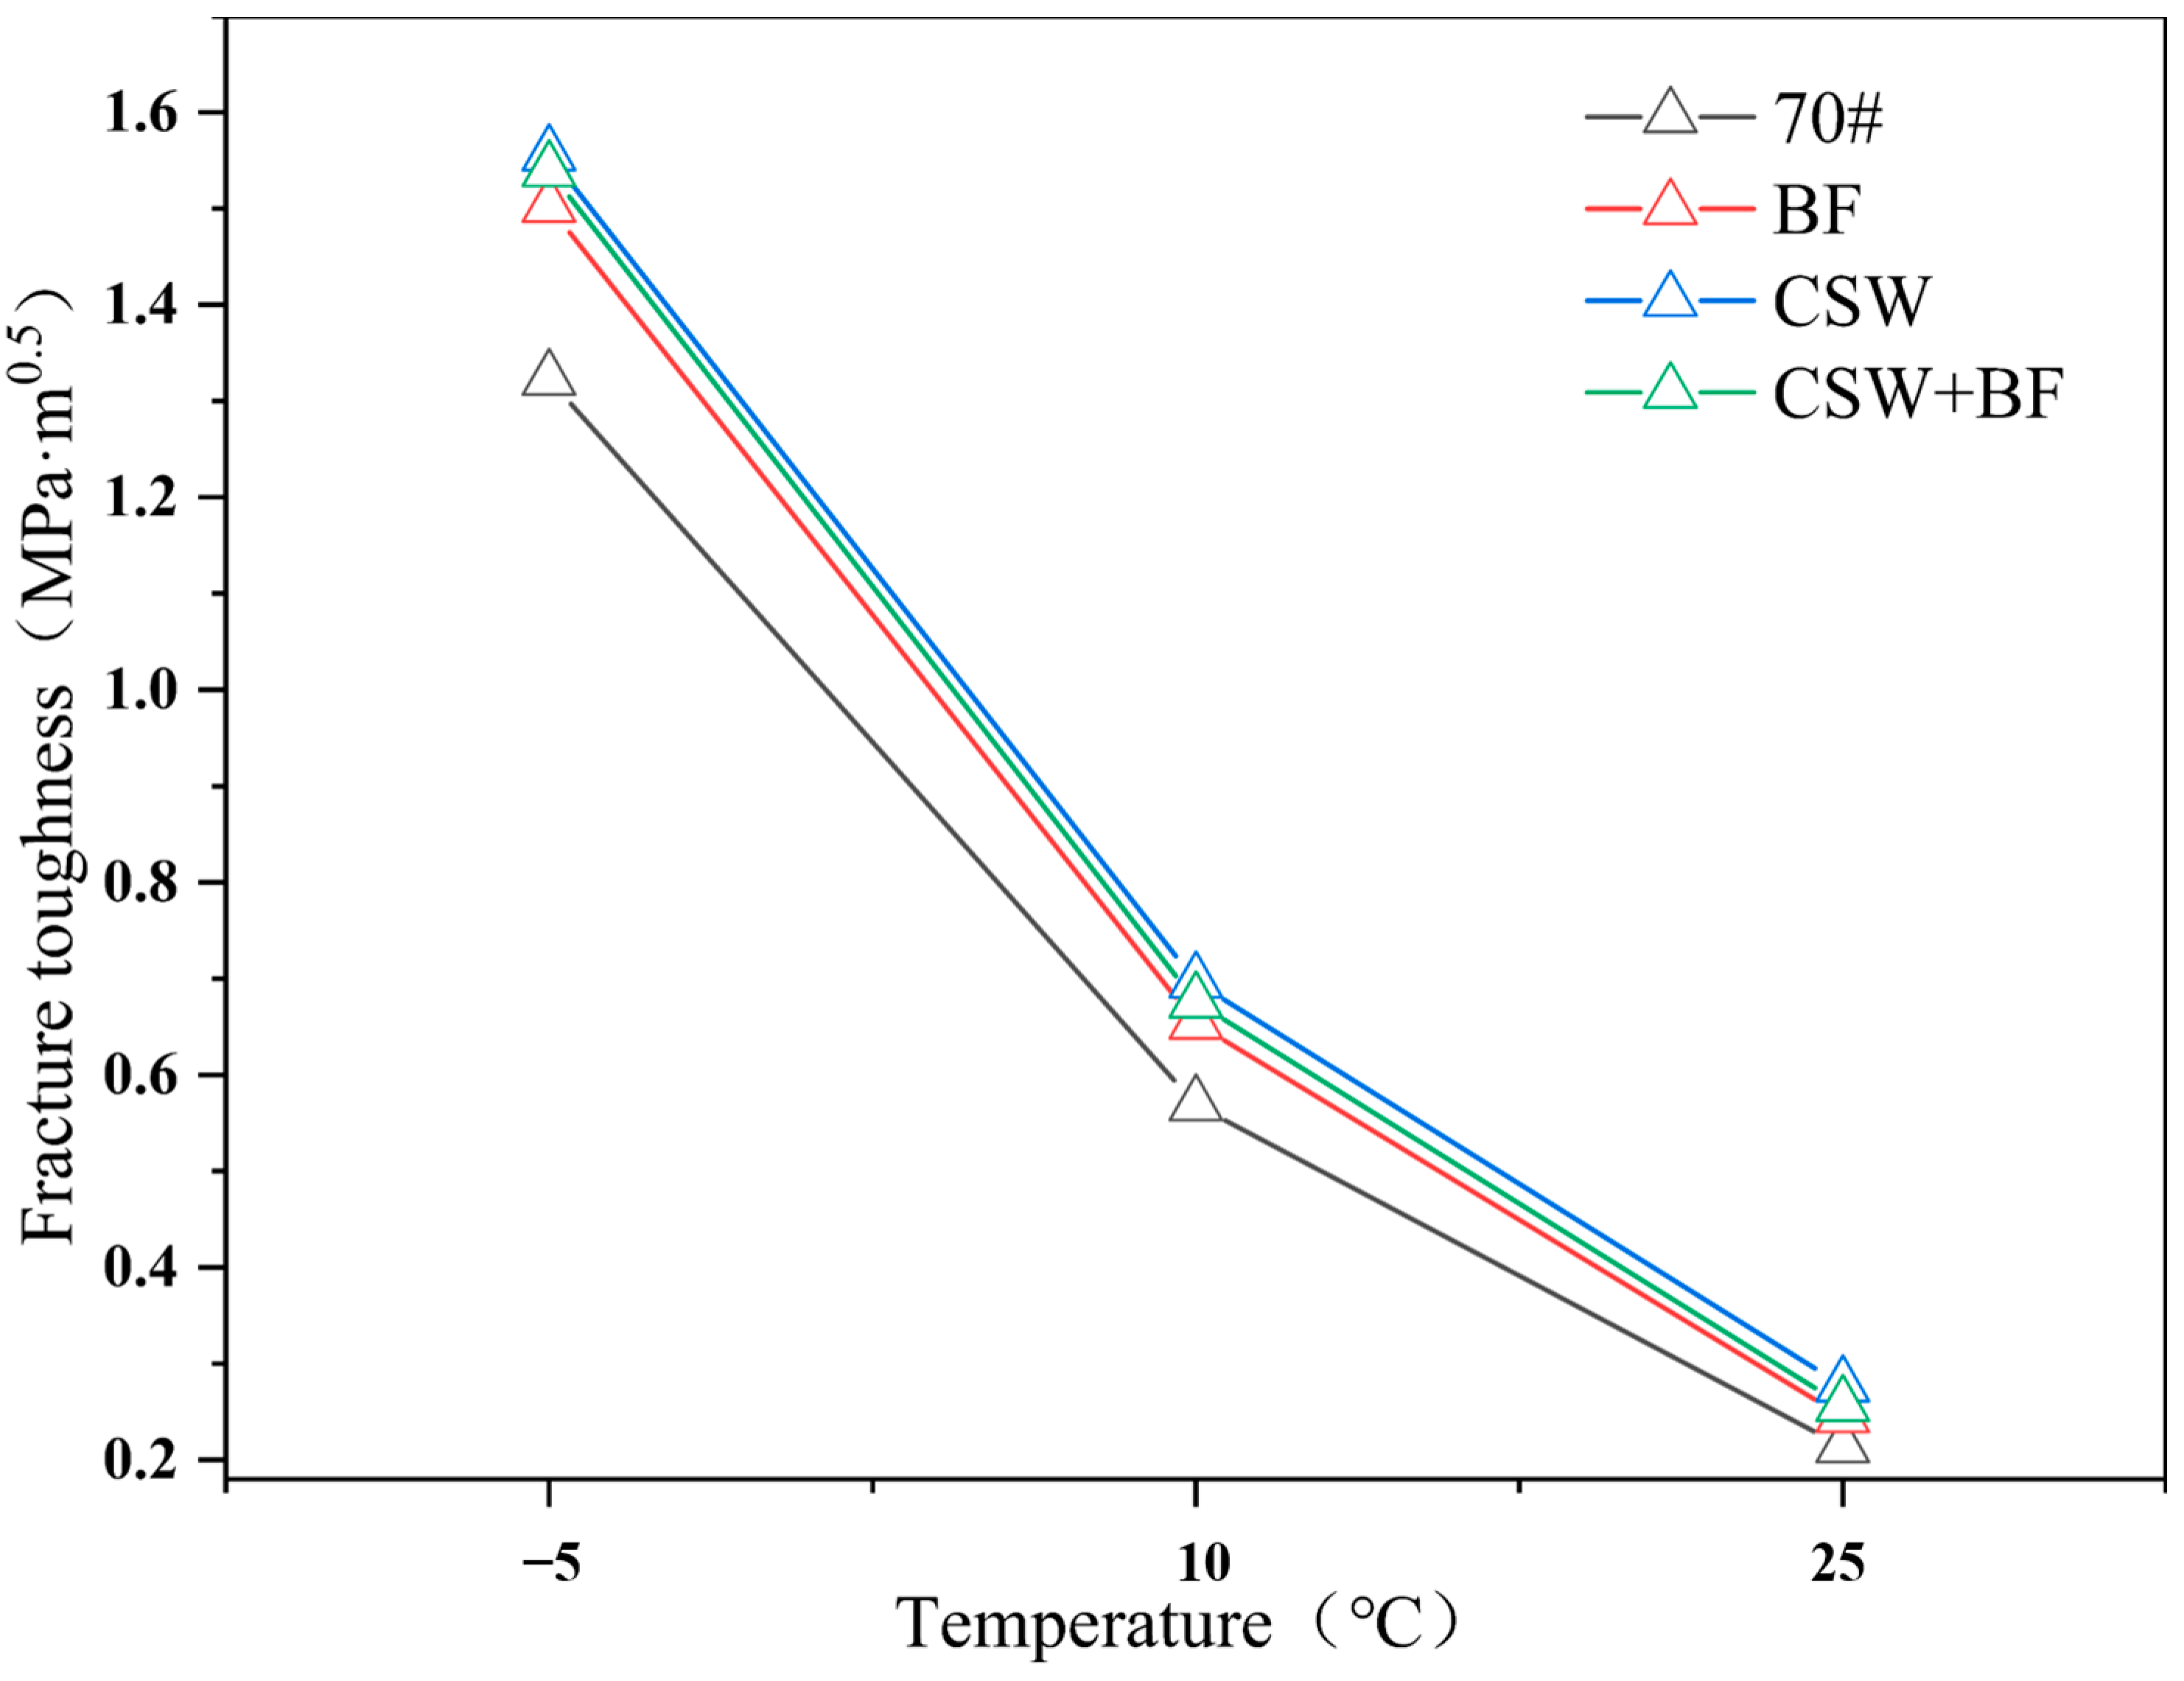
3.2.1. Fracture Toughness

The stress intensity factor KI is often used to describe the stress field at the crack tip during the fracture of the specimen, which is related to the load stress value, the width of the middle crack, the size of the specimen, and other factors. As the crack width increases, the stress intensity factor KI increases. When KI reaches the critical strength value KIC, cracks appear on the surface of the specimen, which means that the crack tip has become unstable [29]. The greater the KIC, the greater the energy absorbed by the material during the fracture process, and the stronger the crack resistance and toughness. The calculation formula of KIC is:
K I C = Y I ( 0.8 ) σ 0 π a
σ 0 = P max 2 r h
Y I ( 0.8 ) = 4.782 + 1.219 ( a r ) + 0.063 e 7.045 a r
where σ 0 is the stress corresponding to the peak load, kN; P max is the peak load, mN; Y I ( 0.8 ) is the standard stress intensity factor, dimensionless; r is the radius of the specimen, m; h is the thickness of the specimen, m; and a is the length of the middle seam, m.
Figure 11 depicts the change curves of fracture toughness of different mixture specimens at different temperatures. It can be found that the fracture toughness decreases significantly with the decrease of temperature, and the stiffness modulus of the mixture is improved at low temperature, which makes the mixture absorb more energy during the fracture process, indicating that the lower the temperature, the stronger the bearing capacity of the mixture. Among different types of asphalt mixtures, the fracture toughness of 70# asphalt is the worst, and that of CSW is the largest, which shows that CSW improves the low-temperature stiffness of asphalt mixtures and makes the physical properties of materials mainly elastic. The fracture toughness of BF and CSW + BF is similar to that of CSW, and the crack strength of the mixture is obviously improved. In addition, the fracture toughness is determined by the peak load Pmax without considering the displacement factor of specimen fracture, which cannot fully reflect the advantages and disadvantages of different types of asphalt mixtures.

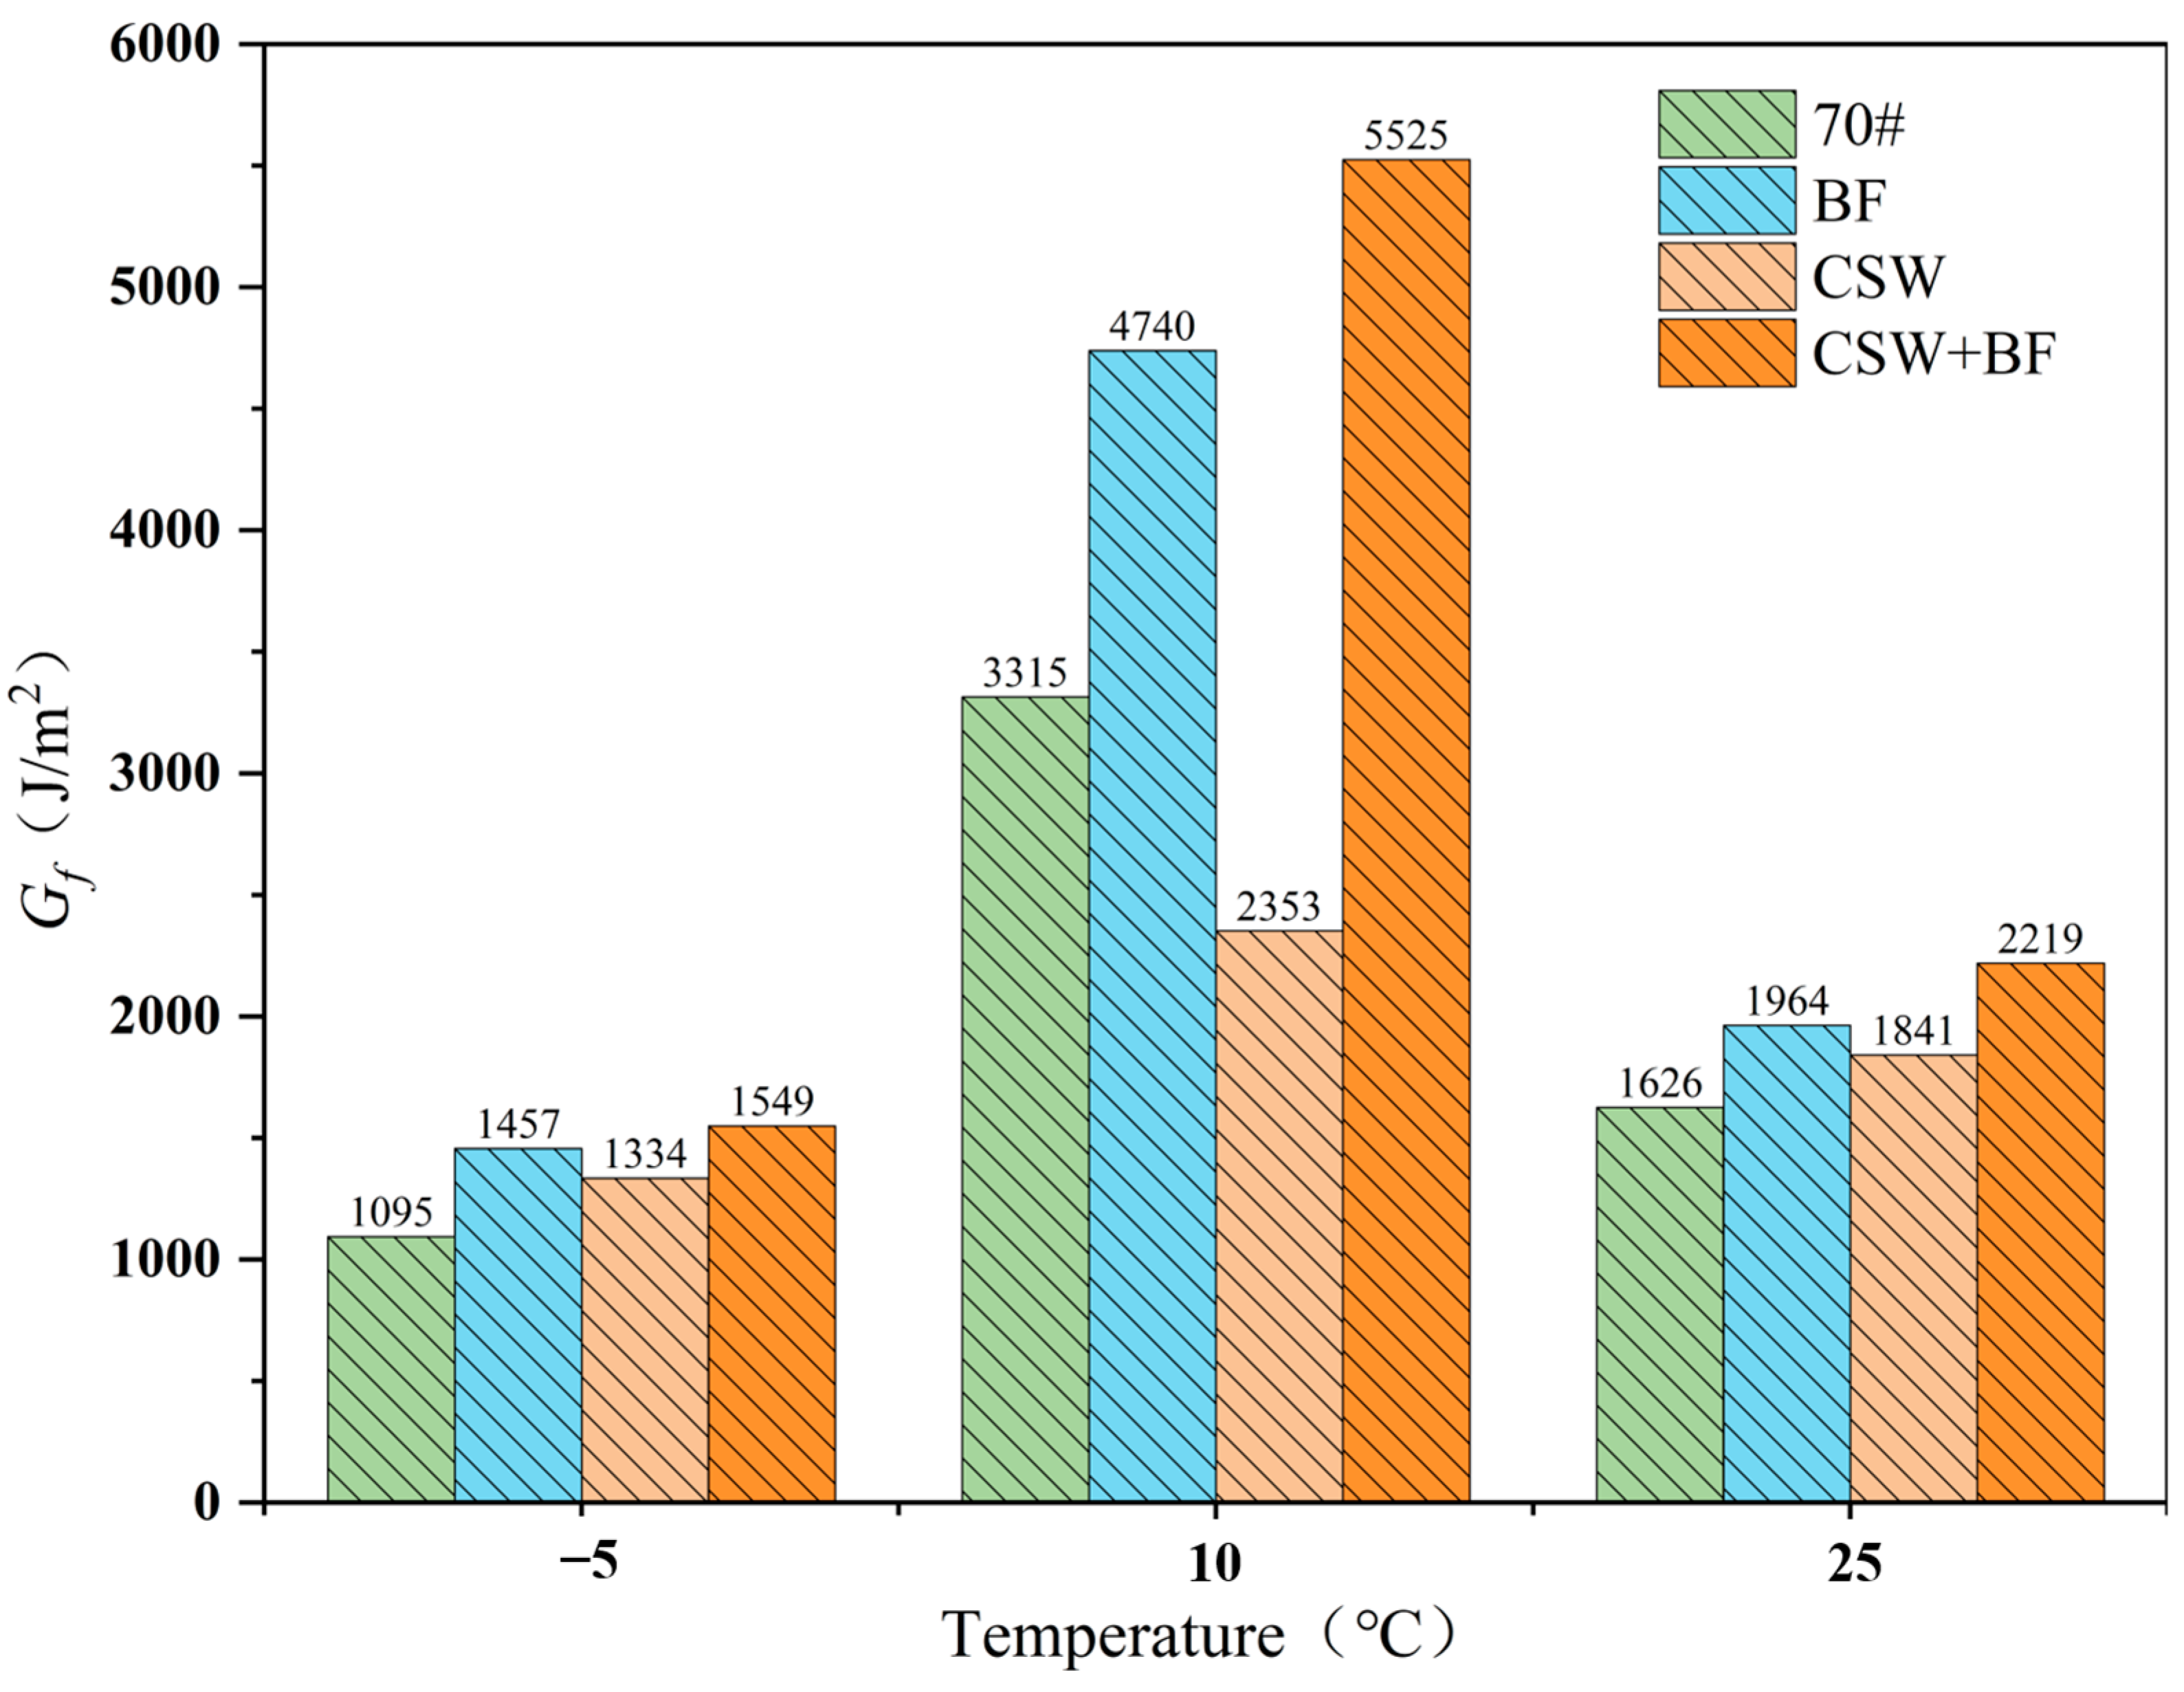
3.2.2. Fracture Energy

Fracture energy, Gf, also known as capacity release rate, is a main index to evaluate the crack resistance of asphalt mixture SCB specimens. The ratio of fracture work to crack propagation area is fracture energy, and the calculation formula of Gf is as follows:
G f = W f A l i g
where W f is the fracture work, J; W f = p d u , P is the load, N; u is the average load line displacement, m; A l i g is the crack propagation area, m2; A l i g = r a h , r is the radius of the specimen, m; a is the length of the middle seam, m; and h is the thickness of the specimen, m.
The fracture work is the total work done by the external load on the SCB specimen, that is, the X-axis integral of the load–displacement curve from the beginning of deformation to the moment when the residual load is 0.1 kN. In this study, Origin software 2021 was used to fit the curve before the peak with cubic polynomial, and the curve after the peak with exponential function. Finally, the integral of the whole curve on the X axis was calculated, and the area of the graph surrounded by the curve and the X axis was obtained. The calculation formula is as follows:
W f = 0 u 0 P 1 u d u + u 0 u f i n a l P 2 u d u
where P 1 u is the fitting curve before the peak; P 2 u is the fitting curve after peak; u0 is the displacement corresponding to the peak load, mm; and u f i n a l is the displacement corresponding to 0.1 kN residual load, mm.
Figure 12 shows the change in fracture energy of different mixture specimens at different temperatures. It can be seen that with the increase in temperature, the fracture energy of SCB specimen first rises and then falls. It is considered that with the increase in temperature, the specimen has better viscoelasticity and elastic–plastic deformation increases, but the peak load decreases and the vertical displacement of the load increases, so the fracture energy of the specimen at different temperatures cannot be compared. Under the condition of 5 °C, the specimen was mostly brittle fracture, the vertical displacement was too short, the work done by the external force during the whole process of fracture was the least, and the fracture energy was the smallest. Under the condition of 25 °C, the specimens were predominantly tough fracture, and the specimen cracks were not necessarily typical type I fracture but might be I–II composite fracture, which led to the peak load being too small. As a result, the external force did less work, and the fracture energy decreased. Among different types of asphalt mixtures, BF and CSW + BF have significantly larger fracture energies, and 70# is not much different from CSW, indicating that the fiber mesh structure in the interstices of the mineral material plays a role in reinforcing and resisting cracking, slowing down the crack development rate and improving the toughness of the asphalt mixtures.

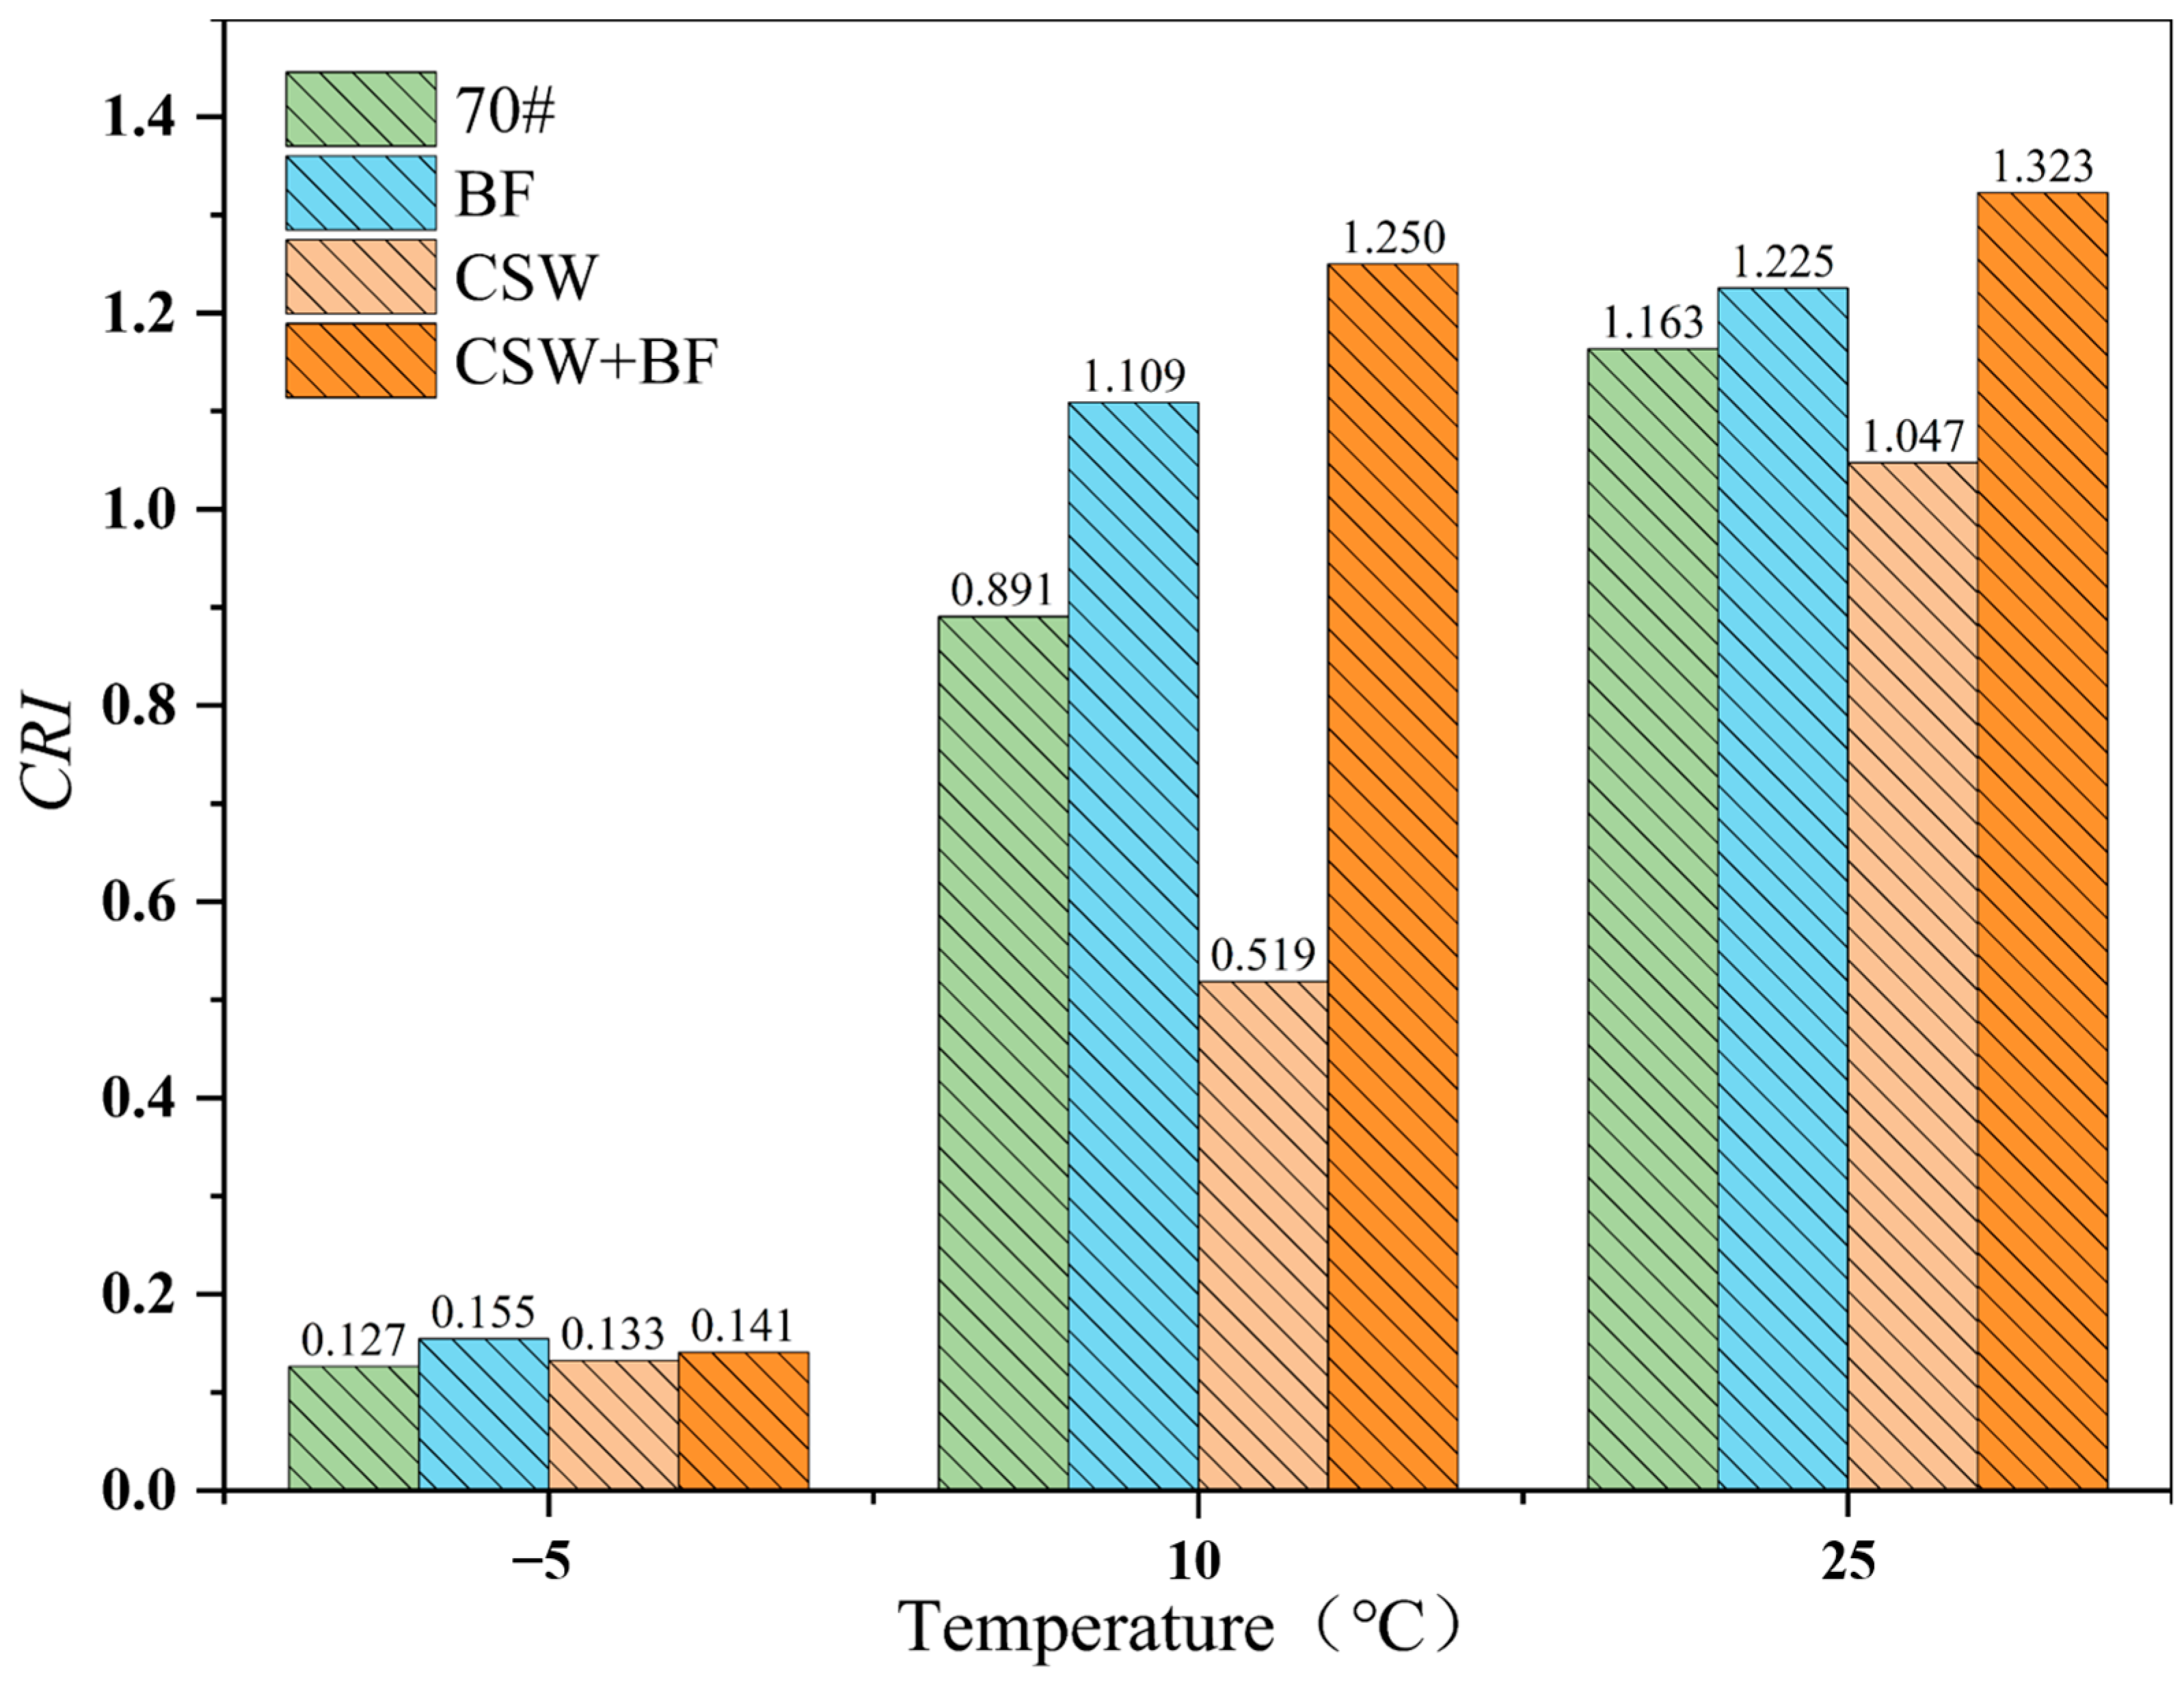
3.2.3. Crack Resistance Index

Once the brittle asphalt mixture reaches the peak load, it will break, resulting in no post-peak displacement data to calculate the flexibility index FI and m. The fracture work Wf and fracture energy Gf are determined by the peak load (Pmax) and final displacement (ufinal) of the specimen during fracture. Two kinds of mixtures with obviously different toughness characteristics can have similar Gf values, but because of the greater stiffness of brittle mixtures, they usually have higher peak load and smaller displacement than flexible mixtures. Therefore, in addition to Gf, peak load or final displacement can also be used to distinguish different types of asphalt mixtures. Zhu et al. [30] studied the calculation of fracture strength index (Sf) by using Pmax, and then normalized Gf with respect to Sf to obtain fracture strain tolerance value (FST). FST can distinguish mixtures with similar fracture energy but different peak load and post-peak displacement in the load–displacement curve. Subsequently, Fawaz Kaseer et al. [31] used Pmax to simplify the calculation method of cracking resistance index (CRI) and put forward CRI as an alternative SCB cracking parameter, which is defined as the ratio of total fracture energy to peak load. The calculation formulas of FST and CRI are as follows [32]:
S f = 2 P max 2 r + b h r b 2
F S T = G f S f
C R I = G f P max
where Pmax is the peak load, kN; r is the radius of the specimen, m; b is the length of ductile zone, and b = ra, m; h is the thickness of the specimen, m; Gf is the fracture energy, J/m2.
Figure 13 describes the change of CRI of different mixture specimens at different temperatures. It can be seen that with the increase in temperature, the CRI of the mixture shows an upward trend, and the CRI of CSW + BF is the largest at 10 °C and 25 °C, indicating that it has strong toughness and good crack resistance. The overall order of CRI value is: CSW + BF > BF > 70# > CSW, which shows that mixing CSW alone will reduce the toughness of asphalt mixture, but hybrid fiber will improve the overall crack resistance of asphalt mixture. This is different from the addition of single material characteristics. The mixing law in composite material theory has many application conditions, and many factors need to be considered in the performance prediction of fiber reinforced concrete materials.

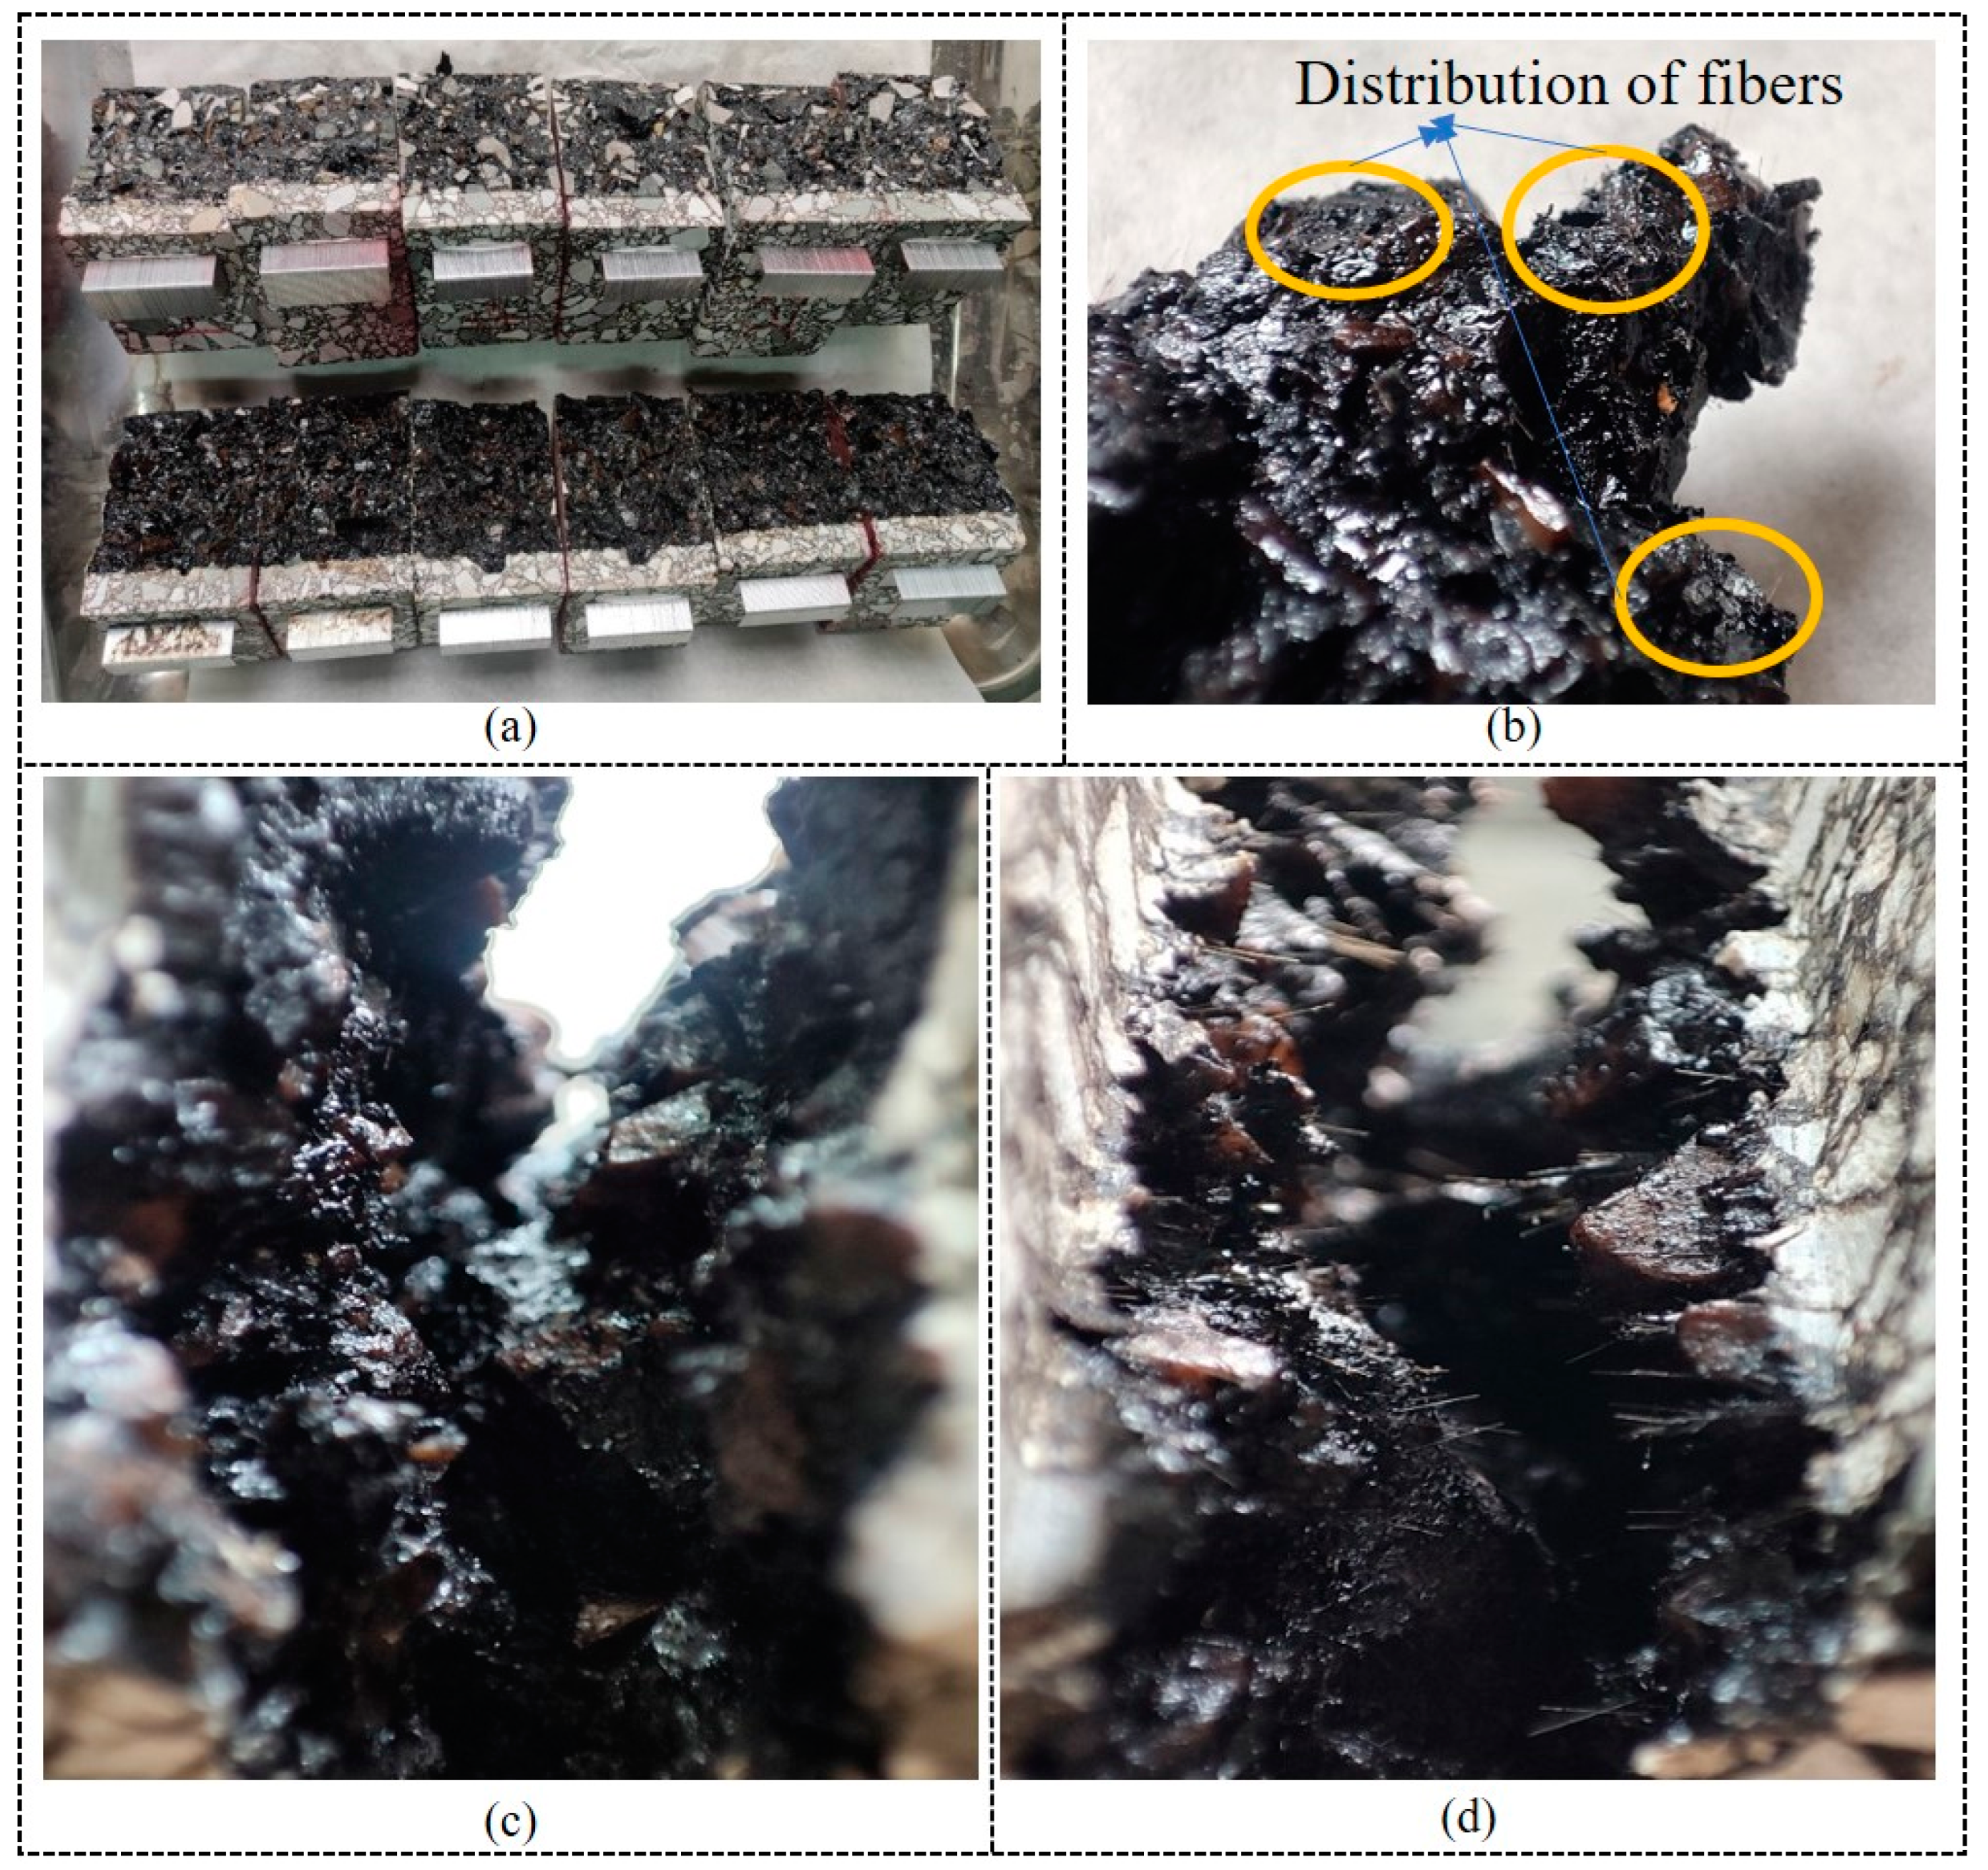
3.3. Characterization of Fracture Interfaces on the Toughening Mechanism of Hybrid Fiber Modified Mixture

The toughness of fiber asphalt mixture is outstanding in the SCB test, which shows that this test is an effective method for evaluating the toughening mechanism of the fiber asphalt mixture. Correspondingly, the material characteristics of the failure interface of the specimen should also contain the important information of fiber toughening, and the fracture area of SCB specimen is larger, so the material distribution characteristics can be observed more clearly. Therefore, in order to explore the macro-toughening mechanism of hybrid fiber modified mixture, a Canon camera was used to record the fracture interface of SCB fracture specimen, as shown in Figure 14. Generally speaking, the crack propagation path of SCB specimens has three forms: (1) fracture along the internal micro-cracks of asphalt; (2) adhesion failure occurs along the interface between asphalt mastic and aggregate; (3) when there is no obvious stress at the interface tip, the aggregate is directly broken and the cracks pass through the stone. From Figure 14a, it can be found that the first two forms are more common in matrix asphalt mixture. For the third form, cracks in fiber asphalt mixture pass through the stone at low temperature, indicating that fibers transfer dispersed stress in asphalt mastic, which increases the adhesion of asphalt mastic–aggregate interface and makes the stress distribution in asphalt mixture more uniform.
Figure 14b reveals that the fibers on the SCB fracture surface are uniformly and randomly dispersed, interlacing within the asphalt mastic. As a millimeter-scale BF material, these fibers not only enhance the adhesion at the asphalt–aggregate interface but also disperse concentrated stress within the micro-cracks of the asphalt mastic. This limits the relative deformation and displacement of the aggregate. It is known that a calcium-containing powder material of micron size improves the adhesion of the asphalt mixture and provides good thermal crack resistance [26]. CSW-modified asphalt further enhances the adhesion between the fiber–asphalt interface and the asphalt–aggregate interface through its excellent viscoelastic properties. These two materials complement each other by reducing the gaps between minerals and aggregates, increasing the overall tensile strength of the specimen, and improving the toughness of the hybrid-fiber-modified mixture.
From Figure 14c, it can be seen that the asphalt film thickness on the aggregate surface of matrix asphalt mixture is insufficient, and there are more irregular aggregates. On the aggregate surface of fiber asphalt mixture, CSW adheres to fibers together, the asphalt film thickness is large, and a large number of fibers are inserted between aggregate particles, dispersing the aggregates formed by asphalt mastic and fine aggregate. BF has great toughness and tensile strength. After the specimen is broken, the fiber is still in the distribution state of tensile stress direction, which shows that mineral fiber with reasonable length and reasonable content can reach the ideal distribution state and stress state in asphalt mixture. It can be seen from Figure 14d that a large number of fibers are randomly distributed in the asphalt mixture in three dimensions, and they are overlapped together to form a spatial network structure, which restricts the movement of asphalt mastic and aggregate. When the fiber asphalt mixture is stressed, the asphalt mixture matrix first deforms and transfers the force to the fiber network structure. The higher the strain of the asphalt mixture matrix, the greater the stress shared by the fiber network, and the more obvious the toughness strengthening effect of the fiber network on the matrix. Therefore, the fiber network can improve the toughness of asphalt mixture by delaying the development speed of cracks, increase the overall tensile strength of asphalt mixture, make asphalt mixture difficult to crack, and effectively improve the crack resistance of asphalt mixture.

4. Conclusions

In this study, the SCB test was used to test the crack resistance of different types of asphalt mixtures. Based on the fracture mechanics theory, three fracture performance parameters were introduced to study the crack resistance of hybrid fiber modified mixtures, and the toughening mechanism of the mixtures was characterized by analyzing the fracture development process and fracture interface morphology of the specimens.
(1)
At the same temperature, BF can widen the toughness area of asphalt mixture, reduce the stiffness of mixture, increase the residual load at the same displacement, and improve the crack resistance of asphalt mixture matrix. CSW increases the peak load of the mixture, but the stiffness modulus is large, which is unfavorable to the crack toughness of the mixture.
(2)
The hybrid-fiber-modified mixture has the slowest crack propagation speed, the smallest absolute value of post-peak curve slope, the largest toughness band width, the largest fracture energy and crack resistance index, the strongest ability to prevent crack propagation, and the best toughness at low temperature.
(3)
CSW-modified asphalt mixture absorbs the most energy in the process of fracture and has the highest fracture toughness, but the fracture energy and crack resistance index are small, the crack propagation speed is the fastest, and the toughness is poor, which indicates that the fracture toughness parameters have strong limitations.
(4)
The interface characteristics show that BF can increase the asphalt film thickness on the surface of aggregate, disperse the concentrated stress in asphalt mastic, and limit the relative displacement of fine aggregate. CSW can improve the viscoelastic properties of asphalt, improve the interfacial adhesion between materials, and strengthen the fiber reinforcement.
(5)
BF is randomly distributed in asphalt mixture in three dimensions and overlapped with each other to form a spatial network structure, which improves the overall tensile strength of asphalt mixture, delays the development speed of cracks, and effectively improves the crack resistance of asphalt mixture.
The findings of this study demonstrate that incorporating fibers of different scales can significantly enhance the strength and toughness of asphalt mixtures. These results are valuable for road engineering applications and can contribute to extending the service life of asphalt pavements while also supporting the development of a low-carbon, environmentally friendly society. However, the optimal fiber content and types may vary depending on the specific fiber materials and asphalt used. Additionally, the challenge of quantitatively assessing the dispersion of hybrid fibers in asphalt concrete persists. It is important to note that the methods employed in this study are limited to macro-scale approaches. Future research may integrate SEM techniques to investigate microstructural changes, which could provide a more comprehensive understanding of the toughening mechanisms at play. This future work will also focus on improving the uniformity of fiber dispersion through advancements in production processes.

Author Contributions

Methodology, Y.H. and C.M.; Validation, Y.H.; Formal analysis, Y.Y. and X.Z.; Resources, Y.Y. and X.Z.; Data curation, H.S.; Writing—original draft, Y.H.; Writing—review & editing, R.F.; Visualization, X.Z.; Supervision, Y.H.; Project administration, X.Z.; Funding acquisition, X.Z. All authors have read and agreed to the published version of the manuscript.

Funding

This study is supported by the Open Project of Shandong Key Laboratory of Highway Technology and Safety Assessment under Grant No. SH202202, the Shaanxi Natural Science Foundation under Grant No. 2024JC-YBMS-373, to which the authors are very grateful.

Data Availability Statement

Data are contained within the article.

Conflicts of Interest

Authors Yaohui Yang and Chuanyi Ma were employed by the company Shandong Hi-speed Group Co., Ltd. Author Rui Fu was employed by the company Shandong Road and Bridge Group Co., Ltd. The remaining authors declare that the research was conducted in the absence of any commercial or financial relationships that could be construed as a potential conflict of interest.

References

  1. He, Y.; Li, Y.; Zhang, J.; Xiong, K.; Huang, G.; Hu, Q.; Zhao, X. Performance evolution mechanism and affecting factors of emulsified asphalt cold recycled mixture performance: A state-of art review. Constr. Build. Mater. 2024, 411, 134545. [Google Scholar] [CrossRef]
  2. Joumblat, R.; Kassem, H.A.; Basiouni, A.; Masri, A.Z.; Khateeb, G.A.; Absi, J. Performance evaluation of hot-mix asphalt with municipal solid waste incineration fly ash using the stress sweep rutting test. Innov. Infrastruct. Solutons 2023, 8, 261. [Google Scholar] [CrossRef]
  3. He, Y.; Wang, Q.; Zhang, J.; Li, Y.; He, H.; Huang, G. Foamed crumb rubber asphalt binder: Preparation, rheological properties and adhesion characteristics. J. Clean. Prod. 2023, 396, 136516. [Google Scholar] [CrossRef]
  4. He, Y.; Zhang, J.; Gao, B.; Wang, L.; Li, Y.; Guo, F.; Huang, G. Experimental investigation of the interface interaction between asphalt binder and mineral filler from the aspects of materials properties. Constr. Build. Mater. 2023, 393, 132094. [Google Scholar] [CrossRef]
  5. Dai, J.; Jia, X. Fatigue Performance of High-Modulus Basalt Fiber-Reinforced Asphalt Mixture. J. Appl. Sci. Eng. 2023, 26, 1444. [Google Scholar] [CrossRef]
  6. He, Y.; Rao, R.; Zhang, J.; Li, Y.; Xiong, K.; Li, Y.; Hu, Q.; Huang, G. Investigation on the rheological properties and modification mechanism of waste badminton shuttlecock modified asphalt binder. Environ. Technol. Innov. 2024, 34, 103561. [Google Scholar] [CrossRef]
  7. Ai, X.; Yi, J.; Pei, Z.; Zhong, J.; Zhou, W.; Feng, D. Application of waste rice straw as fibre or filler in asphalt mixtures: Materials characterisation and performance evaluation. Int. J. Pavement Eng. 2024, 25, 2334307. [Google Scholar] [CrossRef]
  8. Liu, Y.; Yang, Z.; Luo, H. Experimental Investigation of Eco-Friendly Anhydrous Calcium Sulfate Whisker and Waste Cooking Oil Compound Modified Asphalt Mixture. Materials 2023, 16, 2409. [Google Scholar] [CrossRef]
  9. Guan, B.; Liu, J.; Wu, J.; Liu, J.; Tian, H.; Huang, T.; Liu, C.; Ren, T.; Grilli, A. Investigation of the Performance of the Ecofriendly Fiber-Reinforced Asphalt Mixture as a Sustainable Pavement Material. Adv. Mater. Sci. Eng. 2019, 2019, 6361032. [Google Scholar] [CrossRef]
  10. Bai, X.; Wang, L.; Chen, X. Multiscale Study on Low Temperature Crack Resistance Mechanism of Steel Slag Asphalt Mixture. J. Wuhan Univ. Technol.-Mat Sci Ed. 2024, 39, 705–715. [Google Scholar] [CrossRef]
  11. Wu, J.; Zhao, Z.; Jiang, C.; Yang, Y.; Zhishuai, S.; Jie, Y.; Feipeng, X. Recent development and application of natural fiber in asphalt pavement. J. Clean. Prod. 2024, 449, 141832. [Google Scholar] [CrossRef]
  12. Tanzadeh, J.; Shahrezagamasaei, R. Laboratory Assessment of Hybrid Fiber and Nano-silica on Reinforced Porous Asphalt Mixtures. Constr. Build. Mater. 2017, 144, 260–270. [Google Scholar] [CrossRef]
  13. Gong, Y.; Song, J.; Bi, H.; Tian, Z. Optimization Design of the Mix Ratio of a Nano-TiO2/CaCO3-Basalt Fiber Composite Modified Asphalt Mixture Based on Response Surface Methodology. Appl. Sci. 2020, 10, 4596. [Google Scholar] [CrossRef]
  14. Ren, D.; Luo, W.; Su, S.; Wang, Z.; Kong, L.; Ai, C. Study on crack resistance of basalt fiber reinforced asphalt mixture modified by titanate coupling agent based on digital image correlation. Constr. Build. Mater. 2024, 437, 136934. [Google Scholar] [CrossRef]
  15. Saha, G.; Biligiri, K.P. Fracture properties of asphalt mixtures using semi-circular bending test A state-of-the-art review and future research. Constr. Build. Mater. 2016, 105, 103–112. [Google Scholar] [CrossRef]
  16. Li, C.; Wang, L.; Wang, X. Crack and crack growth behavior analysis of asphalt mixtures based on the digital speckle correlation method. Constr. Build. Mater. 2017, 147, 227–238. [Google Scholar] [CrossRef]
  17. Kutuk-Sert, T.; Ozturk, M.; Kutuk, S. Digital image processing of warm mix asphalt enriched with nanocolemanite and nanoulexite minerals. Constr. Build. Mater. 2023, 399, 132542. [Google Scholar] [CrossRef]
  18. Rusli, R.; Shanmuganathan, K.; Rowan, S.J.; Wedar, C.; Eichorn, J.S. Stress Transfer in Cellulose Nanowhisker Composites—Influence of Whisker Aspect Ratio and Surface Charge. Biomacromolecules 2011, 12, 1363. [Google Scholar] [CrossRef]
  19. Saulat, H.; Cao, M.; Khan, M.M.; Khan, M.; Khan, M.M.; Rehman, A. Preparation and applications of calcium carbonate whisker with a special focus on construction materials. Constr. Build. Mater. 2020, 236, 117613. [Google Scholar] [CrossRef]
  20. Hu, K.; Zhou, J.; Han, S.; Chen, Y.; Zhang, W.; Fan, C.; Fan, C. Silane coupling agent enhances recycle aggregate/asphalt interfacial properties an experimental and molecular dynamics study. Mater. Today Commun. 2024, 39, 108681. [Google Scholar] [CrossRef]
  21. Fan, T.; Wang, X. Influence of calcium sulfate whisker on the high temperature performance of asphalt binder. Pet. Sci. Technol. 2020, 38, 303–308. [Google Scholar] [CrossRef]
  22. Ren, D.; Luo, W.; Wang, Z.; Su, S.; Kong, L.; Ai, C. Enhancing the Adhesion Interface Between Asphalt and Basalt Fibers Through Surface Modification with Titanate Coupling Agents. Arab. J. Sci. Eng. 2024, 49, 5547–5563. [Google Scholar] [CrossRef]
  23. Xing, X.; Chen, S.; Li, Y.; Pei, J.; Zhang, J.; Wen, Y.; Li, R.; Cui, S. Effect of different fibers on the properties of asphalt mastics. Constr. Build. Mater. 2020, 262, 120005. [Google Scholar] [CrossRef]
  24. JTG F40-2004; Technical Specifications for Construction of Highway Asphalt Pavements. Research Institute of Highway Ministry of Transport: Beijing, China, 2004.
  25. JTG E42-2005; Test Methods of Aggregate for Highway Engineering. Research Institute of Highway Ministry of Transport: Beijing, China, 2005.
  26. Kutuk, S.; Kutuk-Sert, T. An examination of nanoparticle colemanite mineral added warm mix asphalt. Constr. Build. Mater. 2020, 243, 118252. [Google Scholar] [CrossRef]
  27. Wu, H.; Ji, X.; Song, W.; Deng, Z. Multi-scale analysis on fracture behaviors of asphalt mixture considering moisture damage. Constr. Build. Mater. 2024, 416, 135234. [Google Scholar] [CrossRef]
  28. Tarefder, R.A.; Kias, E.M.; Ng, T. Factors affecting cracking of notched asphalt concrete. Int. J. Pavement Res. Technol. 2009, 2, 137–147. [Google Scholar]
  29. He, Y.; Xiong, K.; Zhang, J.; Guo, F.; Li, Y.; Hu, Q. A state-of-the-art review and prospectives on the self-healing repair technology for asphalt materials. Constr. Build. Mater. 2024, 421, 135660. [Google Scholar] [CrossRef]
  30. Zhu, Y.; Dave, E.V.; Rahbar-Rastegar, R.; Sias, D.J.; Zofka, A. Comprehensive evaluation of low-temperature fracture indices for asphalt mixtures. Road Mater. Pavement Des. 2017, 18, 467–490. [Google Scholar] [CrossRef]
  31. Kaseer, F.; Yin, F.; Arámbula-Mercado, E.; Amy Epps, M.; Jo Sias, D.; Saman, S. Development of an index to evaluate the cracking potential of asphalt mixtures using the semi-circular bending test. Constr. Build. Mater. 2018, 167, 286–298. [Google Scholar] [CrossRef]
  32. Nian, T.; Wang, M.; Ge, J.; Guo, R.; Li, P.; Song, J. Enhancing low-temperature crack resistance, A method for establishing meso-models and evaluating steel fiber-reinforced hot recycled asphalt mixtures. Constr. Build. Mater. 2024, 438, 137026. [Google Scholar] [CrossRef]
Figure 1. CSW (a) macro morphology; (b) microscopic morphology under SEM.
Buildings 14 02562 g001
Figure 2. Basalt fiber (a) macro morphology; (b) microscopic morphology under SEM.
Buildings 14 02562 g002
Figure 3. (a) Rotary compaction test piece; (b) SCB specimen; (c) specimen preparation process.
Buildings 14 02562 g003
Figure 4. SCB test process (a) before specimen dyeing; (b) after specimen dyeing; (c) heat preservation of the test piece; (d) installation of extensometer; (e) camera video recording to record the cracking process.
Buildings 14 02562 g004
Figure 5. Load–vertical displacement curve (a) −5 °C; (b) 10 °C; (c) 25 °C.
Buildings 14 02562 g005
Figure 6. Load and CMOD displacement–time curve (a) 70#; (b) BF; (c) CSW; (d) CSW + BF.
Buildings 14 02562 g006
Figure 7. Load–CMOD displacement curves of different types of asphalt mixtures.
Buildings 14 02562 g007
Figure 8. Cracking process of CSW + BF modified mixture specimen (10 °C).
Buildings 14 02562 g008
Figure 9. Calibration and measurement of crack propagation path of SCB specimen (a) calibration size; (b) route marking measurement.
Buildings 14 02562 g009
Figure 10. Crack growth rate of SCB test at different temperatures.
Buildings 14 02562 g010
Figure 11. Effect of temperature on fracture toughness of specimen.
Buildings 14 02562 g011
Figure 12. Effect of temperature on fracture energy of specimens.
Buildings 14 02562 g012
Figure 13. Effect of temperature on CRI of specimen.
Buildings 14 02562 g013
Figure 14. (a) Fracture interface of SCB specimen; (b) fiber distribution of CSW + BF modified mixture specimen; (c) interface between two sides of crack of 70# modified mixture specimen; (d) interface between two sides of crack of CSW + BF modified mixture specimen.
Buildings 14 02562 g014
Table 1. Basic physical indexes of anhydrous CSW.
ProjectResultUnit
AppearanceWhite powder--
Loose density0.15–0.3g·cm−3
Density2.69g·cm−3
Diameter1–15μm
Average length20–35μm
Aspect ratio20–35--
Mohs hardness3--
Table 2. Basic technical indexes of basalt fiber.
ProjectResultUnit
Length6Mm
Diameter15Μm
Density2.64g·cm−3
Tensile strength3000MPa
Elasticity modulus65.2GPa
Elongation at break2.58%
Melting point79.1°C
Mass loss (thermal stability)0.47%
Moisture absorption rate (water stability)0.8%
Oil absorption multiple (oil absorption)6.048--
Table 3. Marshall test results of AC-13C asphalt mixture.
Oil-Stone Ratio (%)Relative Density of Gross Volume (g/cm3)Void Ratio (%)Gap Rate of Mineral Aggregate (%)Saturation (%)Stability (kN)Flow Value (0.1 mm)
3.02.3867.113.9048.36.543.59
3.52.4015.813.7257.68.022.79
4.02.4204.313.4367.510.232.38
4.52.4453.013.1778.19.572.70
5.02.4681.913.0686.27.063.48
Disclaimer/Publisher’s Note: The statements, opinions and data contained in all publications are solely those of the individual author(s) and contributor(s) and not of MDPI and/or the editor(s). MDPI and/or the editor(s) disclaim responsibility for any injury to people or property resulting from any ideas, methods, instructions or products referred to in the content.

