Article

Research on Urban Resilience from the Perspective of Land Intensive Use: Indicator Measurement, Impact and Policy Implications

1
School of Civil Engineering and Architecture, Wuhan Institute of Technology, Wuhan 430070, China
2
School of Management, Wuhan Institute of Technology, Wuhan 430205, China
*
Author to whom correspondence should be addressed.
Buildings 2024, 14(8), 2564; https://doi.org/10.3390/buildings14082564
Submission received: 9 July 2024 / Revised: 6 August 2024 / Accepted: 14 August 2024 / Published: 20 August 2024
(This article belongs to the Special Issue Sustainable City Development: Urban Planning and Housing Management)

Abstract

:
Land intensive use reflects the spatial structure, agglomeration characteristics, and internal mechanisms of urban economic, social, and ecological system development, significantly impacting urban resilience. Based on panel data from 287 cities in China from 2010 to 2020, this paper measures the levels of land intensive use and urban resilience, and empirically examines the impact mechanism of land intensive use on urban resilience through baseline regression and panel quantile regression. The results reveal that: (1) During the study period, China’s urban land intensive use level has significantly improved. The land intensive use level shows a trend of “the strong become stronger, and the weak are always weak” and “high in the east and low in the west” spatial differentiation, while the urban resilience level showed a trend of accelerated “catching up” of low-resilience cities towards high-resilience cities and “high in the east and low in the west” spatial differentiation as well. (2) Land intensive use significantly promotes effect on urban resilience, and the effect depends on different conditions. (3) Among all dimensions of land intensive use, both land input intensity and land use benefits significantly promote urban resilience, while land use intensity shows an insignificant effect. (4) The impact of land intensive use on urban resilience demonstrates significant scale heterogeneity and geographic regional heterogeneity. Based on these findings, the paper proposes relevant policy suggestions for land intensive use aimed at improving urban resilience, offering guidance for promoting high-quality land use and sustainable urban resilience development.

1. Introduction

Urbanization is one of the most transformative and challenging trends in global human society since the beginning of the 21st century. According to the United Nations World Cities Study Report (2019), more than 50% of the global population currently lives in cities, with this proportion expected to exceed 70% by 2050 [1]. With the further agglomeration of population, land, capital, and other factors, cities are becoming more complex and powerful, yet they face increasingly complex exogenous disturbances and endogenous risks. When confronted with risk impacts, urban composite systems are often highly vulnerable, where disruption of any subsystem or failure to adapt to new changes may lead to a chain of crises, which may even threaten the survival and development of the entire city. Hence, all modern cities are confronted with the issues of active adaptation to disaster risks and improvement of urban resistance and resilience [2]. In 2002, the International Council for Sustainable Regional Development (ICLEI) first proposed the concept of “Urban Resilience” at the United Nations Global Summit on Sustainable Development. This concept was subsequently introduced into research on urban safety and disaster prevention and reduction [3], initiating a surge in research on resilient cities for urban disaster risk management. Since then, urban resilience research has gradually extended to encompass more comprehensive fields such as economy, society, and ecology, with the improvement of urban resilience becoming a global consensus for achieving sustainable urban development.
As an important spatial carrier of urban systems, land supports and accomodates urban production, life, and ecological spaces. It determines the development modes and operation law of urban economic, social, and ecological systems, providing a medium basis for systematically investigating and intervening in urban resilience [4]. In terms of economy, sustained and stable growth is a basic feature of resilient cities and a vital guarantee for coping with disaster shocks. Land intensive use plays a significant role in promoting urban economic development. Chen Tiantian and Zhang Hong (2017) conducted a study on land intensive use and urban economic development in 13 cities in the Beijing-Tianjin-Hebei region, and their results indicated that the improvement of land use structure, land use degree, and land use economic benefits can significantly promote urban economic development [5]. In terms of the action mechanism, land intensive use can optimize the spatial distribution of production factors, thereby fully tapping into the potential of the land and improving land use efficiency, such as capital, technology, and labor, through optimized allocation of land resources, and then improve the scale and agglomeration benefits to promote the growth of economic quality [6]. Chen Cuifang et al. (2019) also proposed that land intensive use can promote high-quality economic growth through the micro-level reorganization of production factors and technological progress, meso-level industrial structure upgrading, and macro-level government behavior. They also took 30 provinces and cities in mainland China as the subjects, and empirically validated the promoting effect of land intensive use on the quality of urban economic growth [7]. In terms of society, land intensive use not only improves the welfare of the whole society but also has significant impacts on the health and well-being of individuals. At the macro-level, Wang Weitong (2016) showed that population agglomeration improves the efficiency of public service facilities, thereby enhancing their scale effects and social resilience [8]. Su Hongjian (2021) tested the internal mechanism by which urban scale affects urban well-being through agglomeration economy and crowding effects in China using a simultaneous equation model. He proposed that improvements in urban well-being attract further population agglomeration, thereby promoting urban growth [9]. However, the flow of production factors caused by land intensive also introduces potential social risks. Yang Shangguang and Ding Jinhong (2004) studied the polarization development strategy of the Pudong New Area in Shanghai and proposed that the agglomeration of production factors in land space could cause regional population flow and social effects such as community reconstruction, social polarization, social isolation, and class conflicts, which may affect stable development of urban society in the short term [10]. At the micro-level, moderately intensive and compact urban land development can improve quality of life [11], and compact urban spaces can enhance interpersonal relationships, as well as improve residents’ physical health perception level and leisure satisfaction level [12]. Mouratidis (2021) further found that high-density development, dependence on public transport, and reduced public green space in compact cities may lower residents’ happiness and health indices, but a high agglomeration of service facilities promotes the residents’ health and well-being [13]. Improved individual well-being is a basis for enhancing overall resilience of the society. In terms of ecology, land intensive use is an important means of improving the efficiency of land green use, significantly contributing to urban ecological and environmental improvement [14]. Promoting land intensive use can curb the disordered expansion of urban construction land, free up more land for ecological green space construction, and help build a resilient urban ecological basis. Wang Zhenshan et al. (2017) analyzed the grey correlation between land intensive use and land ecological use in 31 provincial capitals in inland China, finding that improving land intensive use enhances urban green construction and environmental pollution control, thus boosting urban ecological effects [15]. Moreover, previous studies consistently conclude that urban land development and utilization activities are important factors affecting energy consumption and pollution emission. Land intensive use can effectively enhance “energy conservation and emission reduction” effects, reducing pressure on the urban ecological environment [16]. In addition, moderate population agglomeration is conducive to the optimization of resource allocation, promotion of sharing of pollution control facilities, and alleviation of production and household pollution within and in neighboring areas, whereas excessive population agglomeration may lead to pollution intensification [17].
Overall, a number of empirical studies have extensively investigated the impact of land intensive use on urban economic, social, and ecological subsystems. However, there has been a lack of sufficient and clear evidence to demonstrate how land intensive use affects urban resilience. Based on panel data from 287 cities in China from 2010 to 2020, this study investigates the overall level and spatiotemporal characteristics of urban resilience in China, constructs a research framework for the impact of land intensive use on urban resilience, and employs baseline regression and panel quantile regression to test the impact and heterogeneity of land intensive use on urban resilience. Finally, some policy suggestions are put forward. The innovation of this study mainly lies in two aspects. First, based on the idea of Bayesian estimation, geographic spatial heterogeneity is incorporated into the spatial hierarchy factor model as a prior assumption to measure the urban resilience index. Compared with traditional measurement methods, this method is closer to real-world events and more scientifically and reasonably investigates urban resilience levels. The second is to embed the resilience goal into the research of land use, investigate the impact of land intensive use on urban resilience and the process law, which can systematically reveal the operation mechanism of the “man-land-city” composite system, and formulate more targeted policies for land intensive use, urban security, and sustainable development.

2. Theoretical Analysis

2.1. Concept Connotation of Urban Resilience

The idea of resilience originated in the field of physics and is often understood as “restoring to the initial state”, referring to the capacity of an object to recover to the initial state after being deformed by external forces [18]. In 1973, Holling, a Canadian ecologist, first introduced this concept into the study of ecosystems [19]. Since then, it has been widely applied to studies in economics, sociology, urban safety, and disaster prevention and reduction. The idea of resilience has undergone three typical development stages, including “Engineering Resilience”, “Ecological Resilience”, and “Evolutionary Resilience” [20]. These three mainstream views are based on different theoretical support and system cognitions, reflecting the deepening understanding of the academic community on the operation mechanism of complex systems, and also lay the theoretical foundation for understanding the concept and connotation of modern urban resilience.
Existing definitions on the concept of resilience can be summarized into two viewpoints. Some scholars understand the connotation of urban resilience from the perspective of evolutionary resilience, endogenizing urban resilience as a dynamic capability of cities. Alberti et al. (2003) defined urban resilience as the ability and degree to absorb and resolve changes after alterations occur in an urban system and its internal functional structure before system reorganization. In fact, the ability of resilient cities not only includes the ability to timely adjust their systems when faced with the impact of external risks but also includes the ability to effectively convert positive opportunities in risk into capital for future development [21]. The Resilience Alliance (2007) believes that urban resilience refers to the ability of an urban system to resist external shocks and disturbances while maintaining the original main characteristics, structure, and key functions of a city without damaging changes [22]. In other words, urban resilience is not a static ability but a process of mutual adaptation and continuous evolution with the external environment, including the resilience, adaptability, and evolution of the city. Another study interprets urban resilience from the perspective of system theory, considering a city as a complex giant system, where each internal system must have the ability to cope with risk disturbances. Jha et al. (2013) regarded urban resilience as a collection of four subsystems, including infrastructure resilience, institutional resilience, economic resilience, and social resilience [23]. ARUP & The Rockefeller Foundation (2014) defined urban resilience as the ability of individuals, communities, institutions, businesses, and systems in a city to survive, recover, adapt, and continue to develop under various types of chronic stress or acute disaster shocks [24]. After reviewing 25 definitions of urban resilience in the literature, Meerow et al. (2016) pointed out that urban resilience is the ability of urban systems and their components to maintain their functions (or quickly recover their expected functions) in the face of external disturbances [25]. Specifically, urban resilience is not only about the city itself but also closely related to the various components within the urban system, which is the sum of the resilience of the urban system and all its social, ecological, and technological network elements.
Although the definitions provided by different scholars and institutions have different emphasis, there is a general consensus that the nature of urban resilience is systemic and dynamic. This paper holds that the definition of urban resilience should be understood from the two dimensions of time and space. From the spatial dimension, urban resilience should be the comprehensive ability of the city’s economic, social, and ecological complex systems; from the temporal dimension, it should be the comprehensive short-term and long-term ability of a city. In the short term, cities should have the ability to resist and recover from acute shocks; in the long term, they should have the ability to adapt and transform to cope with chronic disturbances.

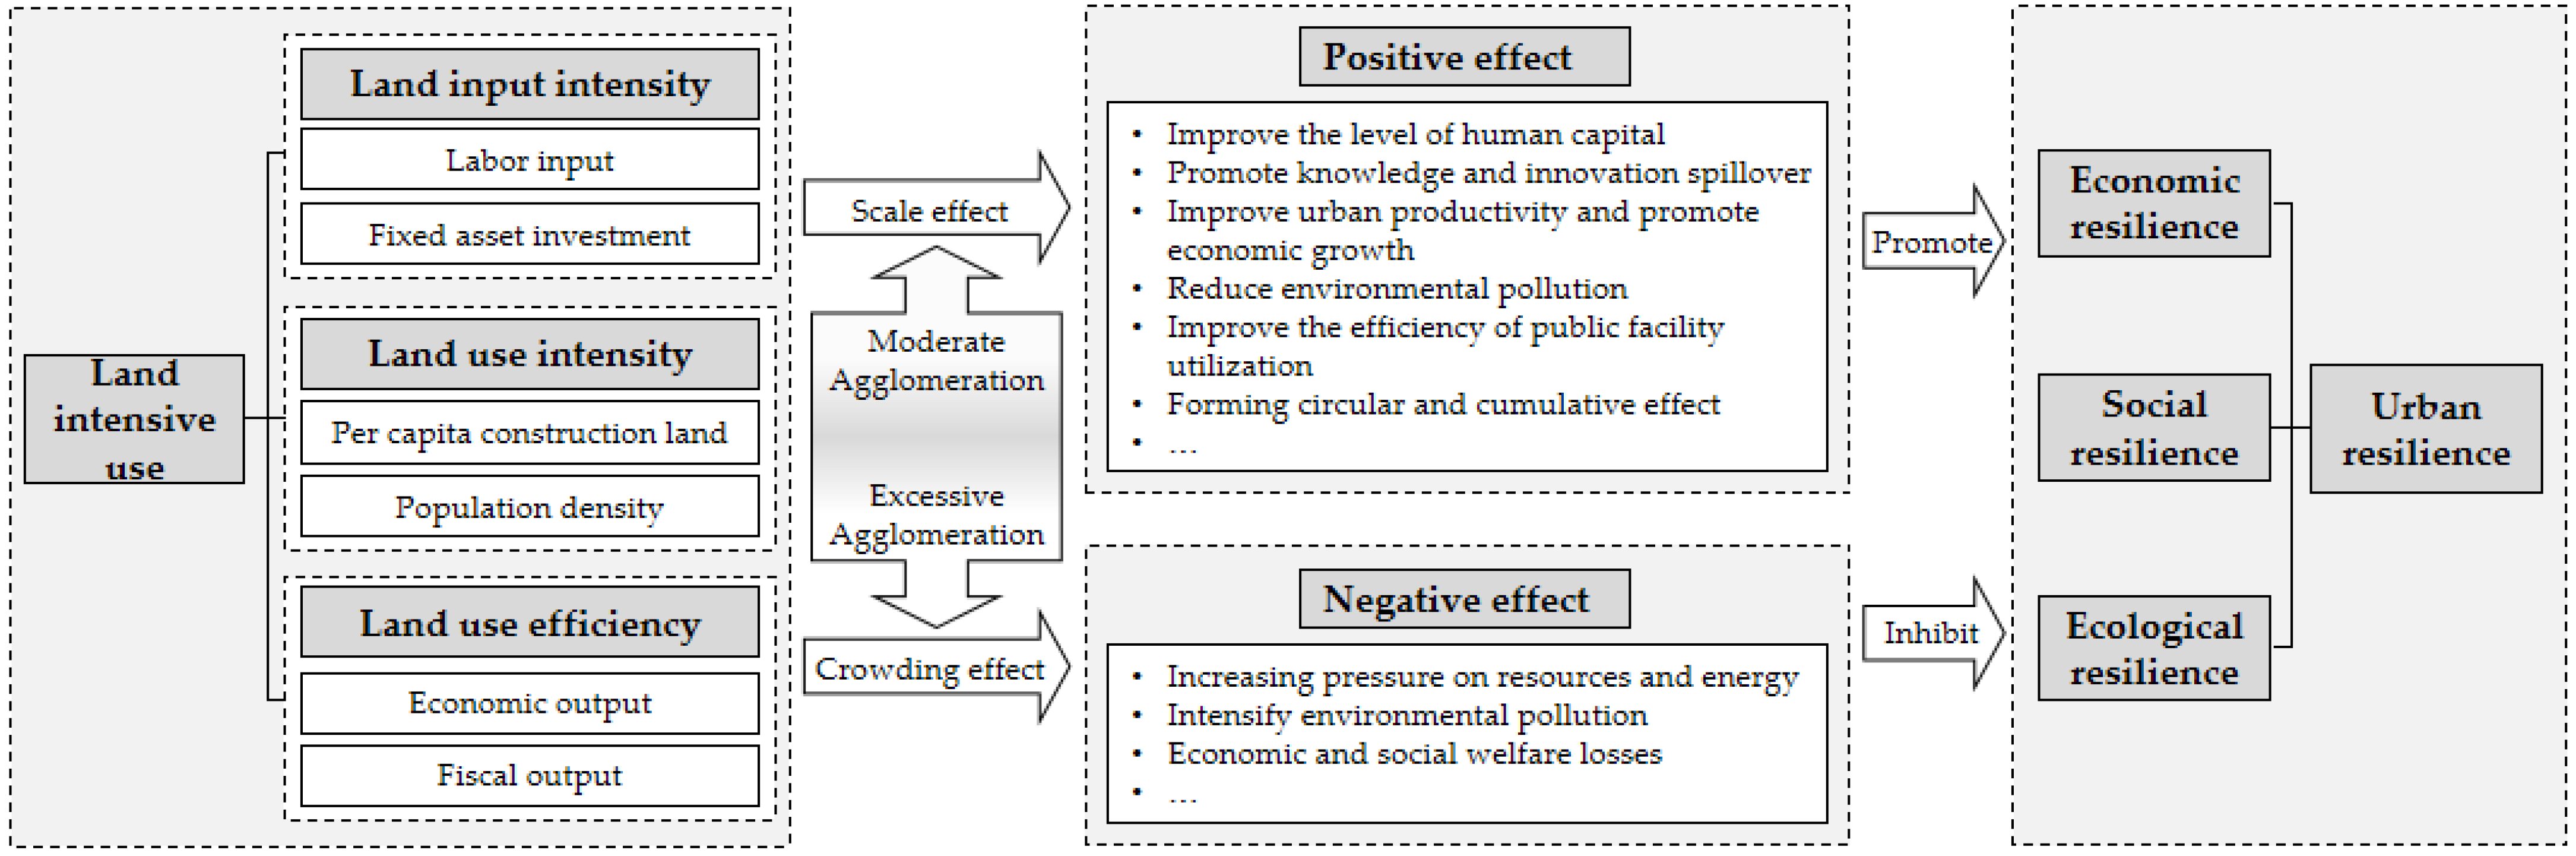
2.2. Theoretical Analysis of the Impact of Land Intensification on Urban Resilience

Urban land intensive use is a concept relative to extensive land use, with no absolute standard to measure the boundary. It lays emphasis on a process that constantly develops towards intensive use. Firstly, different cities have different resource endowments, developmental stages, and land intensive use levels, which always change with increasing land carrying capacity. Secondly, land intensive use is a comprehensive concept reflecting the continuous optimization of the relationship between input and output, which not only includes the input intensity and utilization intensity of land, but also reflects the comprehensive output benefits of land, thereby realizing the organic unity of the economic and social value of land. From the concept connotation of land intensive use, it has a direct impact on urban resilience mainly through land input intensity, land use intensity, and land use benefits (Figure 1).
First of all, from the perspective of land input intensity, as labor and capital factors gathered in a unit land area become increasingly intensive, there will be a scale agglomeration effect of production factors, and the operation efficiency of urban systems can be promoted to enhance resilience. For example, the spatial agglomeration of the labor force can form a “labor reserve pool”, improving the level of urban human capital. The mutual exchange of labor forces can promote the effects of knowledge spillover and innovation, thereby improving urban production efficiency. Moreover, labor-intensive cities often show stronger economic resilience when faced with external risks [26]. On the other hand, increased investment intensity in land fixed assets reflects the continuous use of new equipment and technologies in the production and construction of the national economy, which not only promotes sustainable economic growth but also reduces the pressure of ecological environmental pollution, which is conducive to improvement of ecological resilience. Second, from the perspective of land use intensity, it has both positive and negative impacts on urban resilience. On the one hand, the agglomeration of population in urban areas facilitates the efficient allocation of resources and the sharing of public service facilities and infrastructure [27], particularly safety facilities crucial for urban disaster prevention and mitigation. This also leads to an increase in the utilization rate of these facilities, thereby enhancing urban resilience. On the other hand, excessive population agglomeration can generate demand pressures on urban resources, energy, and public facilities, resulting in traffic congestion, insufficient supply of public goods, and other problems, and then lead to ecological environmental pollution, economic and social welfare losses, and other negative external effects [28], which is not conducive to urban resilience. Williamson (1965) believed that spatial agglomeration promote the improvement of economic efficiency in the initial stages, but after exceeding the threshold value, the promoting effect on the economy decreases and even become negative, that is, the influence of agglomeration on economic growth shows an “inverted U” shape [29]. Many recent empirical studies have further verified this “inverted U” relationship [30,31]. Finally, improving the economic and social benefits of land use can provide basic guarantee for the construction and development of urban resilience. To some extent, improvement of land average output efficiency indicates better internal resource allocation and system operation state of the city, as well as a stronger debugging ability of the city. More importantly, higher land benefit output represents more advantageous city comprehensive development level, governance ability, and public services, which in turn attracts the gathering of more production factors, forming a circular cumulative effect [32] and promoting urban resilience.
In summary, the entire process of land intensive use impacts urban resilience. The spatial agglomeration of production factors and land output benefits together constitute the power source of urban resilience, providing a solid guarantee for cities to cope with complex risks. Moreover, the agglomeration of population and production factors also brings resource and environmental pressures and crowds public goods, which form a pressure source for urban resilience system and increase the vulnerability of cities to cope with risks. When the power source is greater than the pressure source, land intensive use enhances urban resilience; otherwise it is not conducive to urban resilience and may even lead to systemic urban risks.
Figure 1. Theoretical analysis framework of the impact of land intensive use on urban resilience.
Buildings 14 02564 g001

3. Research Design

3.1. Study Sample and Data Description

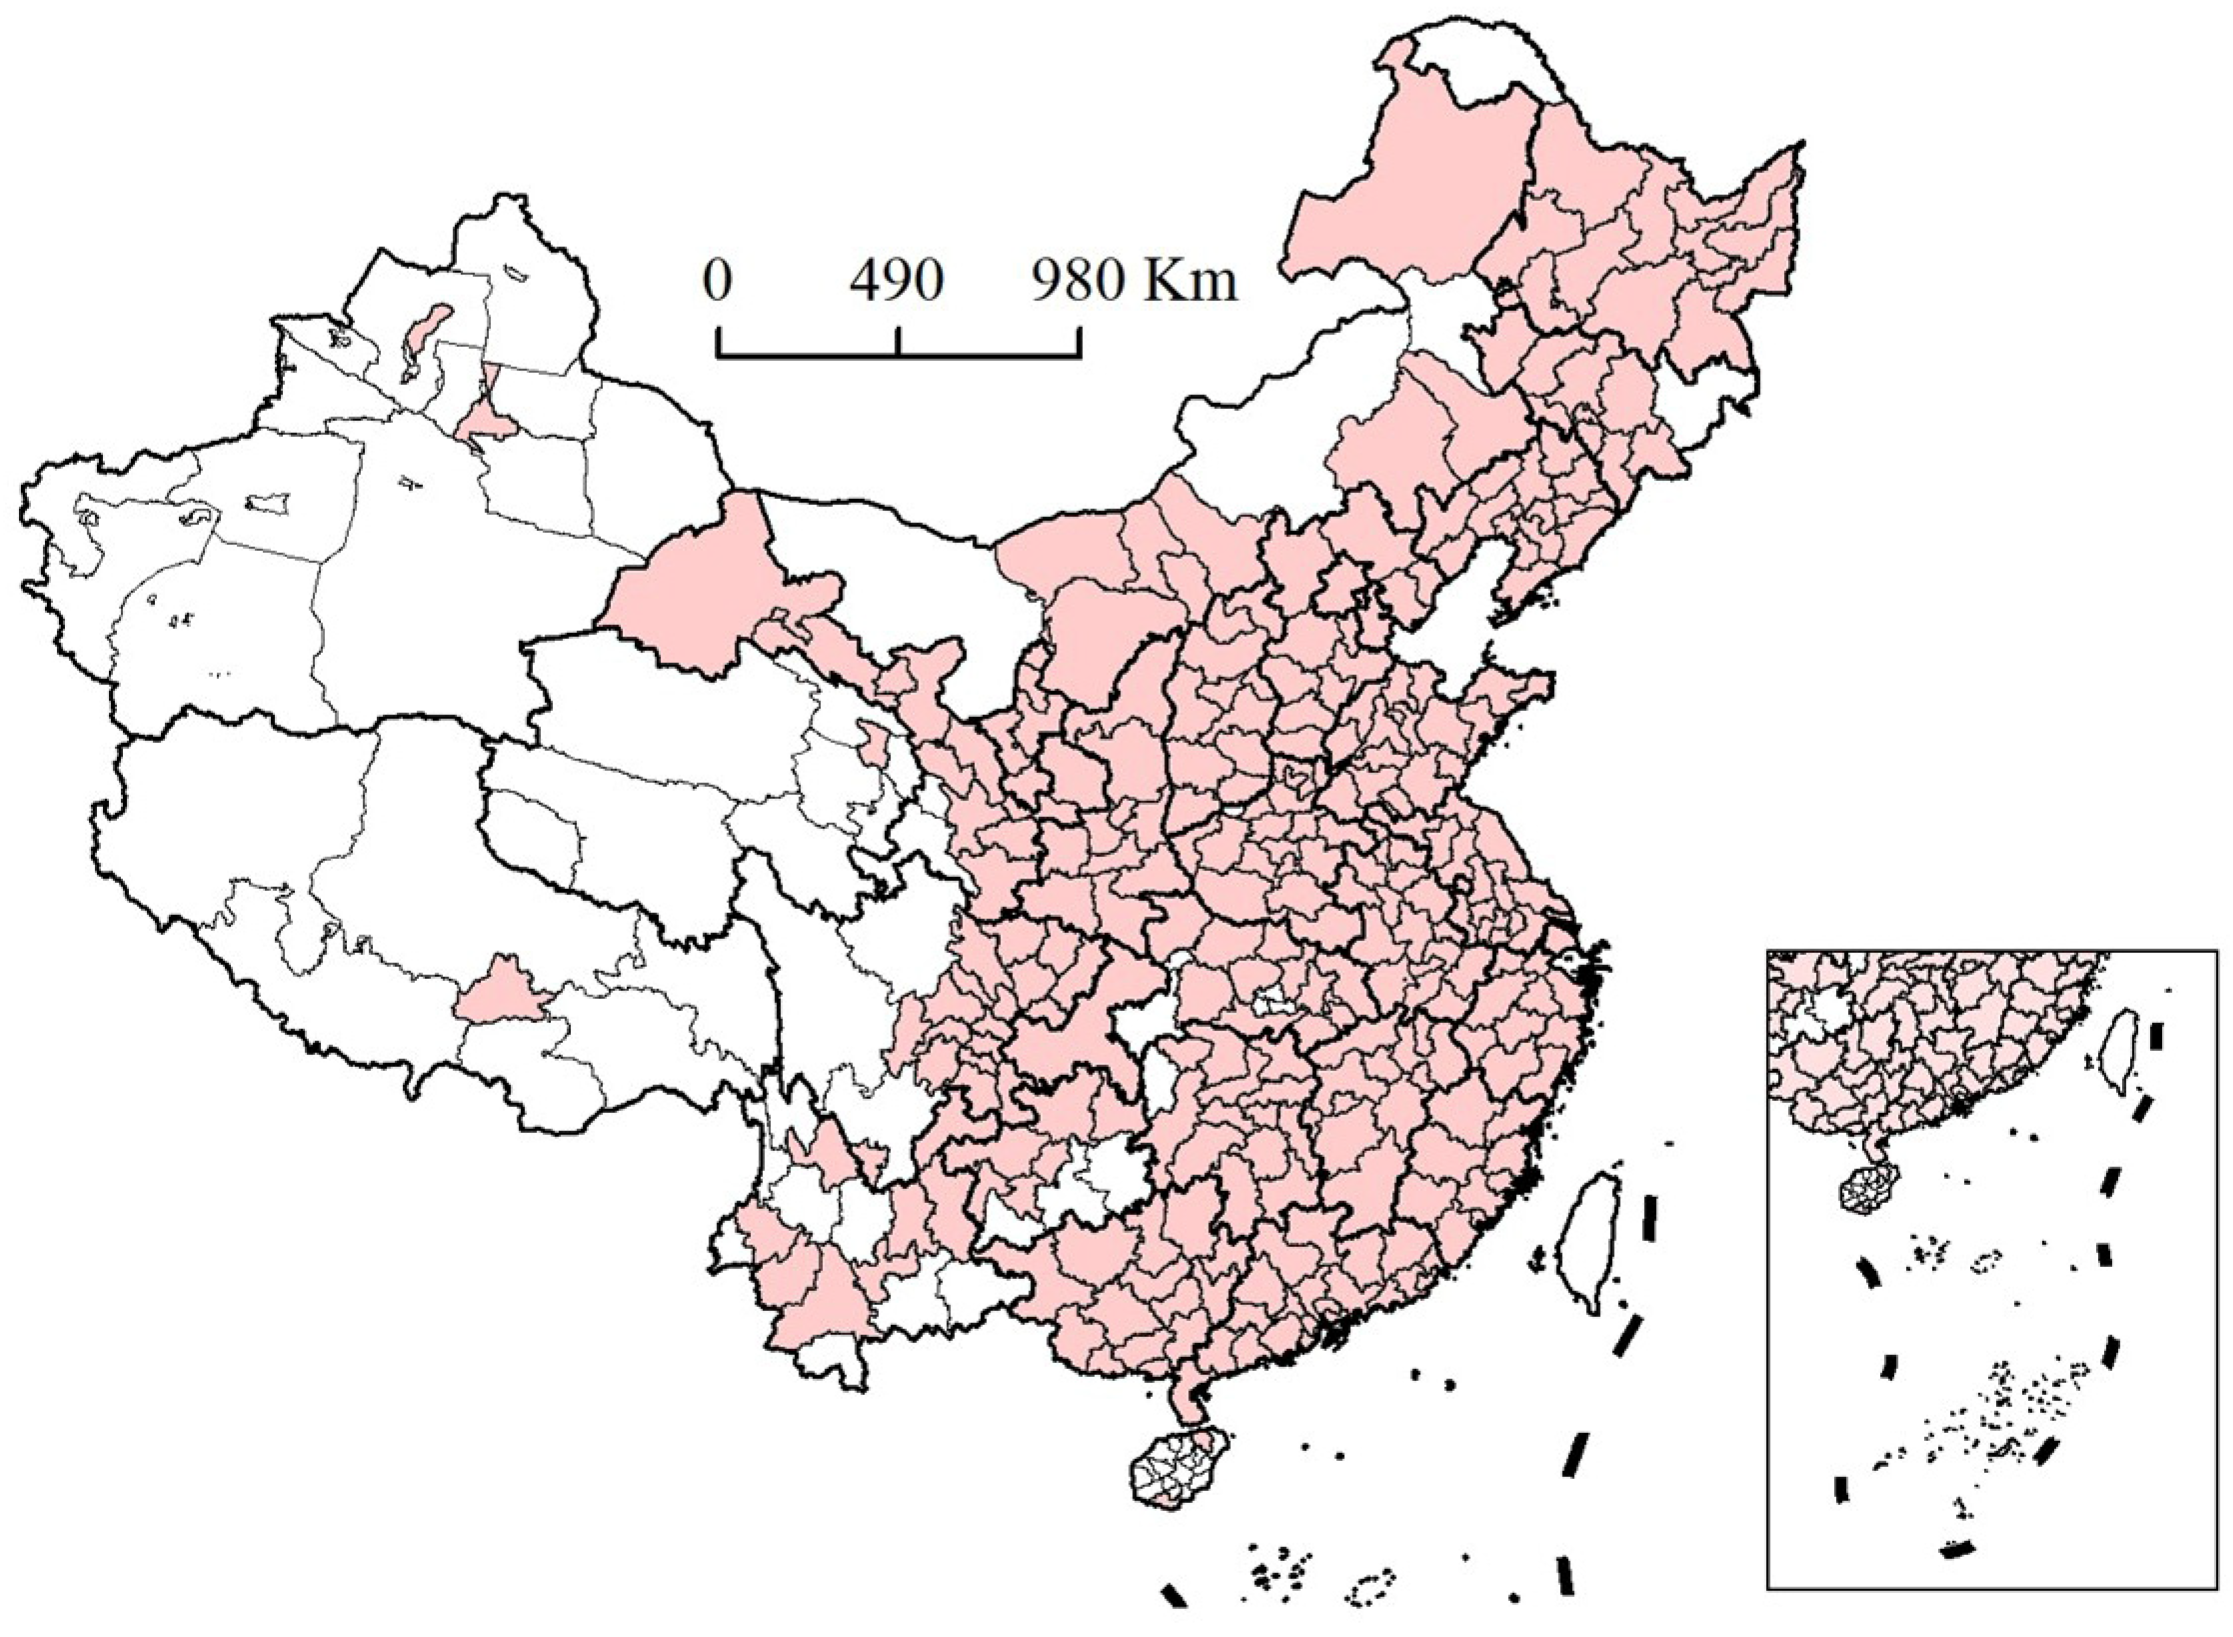
3.1.1. Research Sample

China has a vast territory with complex geographical and climatic conditions. It is one of the countries with the world’s most serious natural and climatic disasters. It not only experiences many types of disasters but also has a high frequency of disasters, a deep impact degree, and affects wide range. Moreover, China has experienced the largest and fastest urbanization process in world history, which has greatly promoted the development of the national economy and society, but also caused a series of prominent problems and contradictions. Due to urban sprawl, resource pressure, welfare loss, and environmental pollution caused by extensive land use, the development of urban resilience has been severely restricted, and the cities are faced with greater pressure than cities in developed countries. Improving urban resilience in the context of rapid urbanization has become an important issue for sustainable urban development in China. Therefore, it is important to study the effectiveness of urban resilience construction in China and the impact of land intensive use on urban resilience, and the policy implications also have strong reference significance for other countries.
The research object of this paper consists of 287 cities in China (Figure 2). Due to changes in statistical caliber and the difficulty of obtaining complete statistical data for some cities during the study period, the research object does not include Hong Kong, Macao, and Taiwan, as well as some cities in Xizang, Qinghai, Xinjiang, Yunnan, and Hainan provinces. At the same time, in order to maintain the consistency and continuity of samples and data during the study period, newly established or abolished cities (such as Sansha City and Chaohu City) are not included.

3.1.2. Data Sources

In this paper, the index data for evaluating land intensive use and urban resilience involve economic, social, and urban construction data. Among them, the economic and social data were mainly obtained from the China Urban Statistical Yearbook, various city statistical yearbooks, and statistical bulletins from 2010 to 2020, while the urban construction data were mainly sourced from the China Urban Construction Statistical Yearbook. Some outliers and missing data were linearly interpolated using the three-year average growth rate for the region or substituted using the mean for the province. The boundaries of administrative divisions of each city were obtained from the 1:1,000,000 public edition basic geographic information data of the National Geographic Information Resource Catalog Service System (https://www.webmap.cn/ (accessed on 8 June 2024)), which were obtained through a series of processing, including merging, fusion, and screening of the ArcGIS10.6 software. The geospatial coordinate information of each city was extracted using ArcGIS10.6 software.

3.2. Core Index Measurement

3.2.1. Land Intensive Use Index

The core explanatory variable of this paper is the urban land intensive use index (ULIU). There have been numerous studies of the measurement methods for urban land intensive use. Based on the measurement indicators of land intensive use level in previous studies [33,34,35,36], this paper selects consensus indicators from empirical studies, including six indicators from three dimensions of land input intensity, land use intensity, and land use benefit, to build an evaluation index system (Table 1). Furthermore, the entropy method is used to calculate the ULIU, which has been widely used in measurement research. The specific calculation process will not be described here.
(1) Land input intensity refers to the level of input into the production factors of land, which is a prerequisite for land intensive use. Generally, a higher investment of production factors (such as capital and labor) in a unit land area represents more adequate land development and utilization. In this paper, the capital factor level and labor factor level of land input are represented by fixed asset investment of unit land and employment of unit land, respectively.
(2) Land use intensity indicates the level of conservation and utilization of land. This paper selects two indicators of per capita urban construction land area and population density to measure land use intensity.
(3) Land use benefit is the most important index to measure the effective use of land, reflecting the benefit output of land input and development and utilization. Economic attribute is a basic attribute of land use. A higher economic output per unit of land represents more effective use of land. Moreover, government financial revenue is also closely related to land management and utilization. In this paper, GDP of unit land and fiscal revenue of unit land are selected to measure the economic and social benefits of land use.

3.2.2. Urban Resilience Index

(1) Measurement method
To date, there has been no consensus or unified standard on the index measurement of urban resilience. Traditional measurement methods, such as the entropy method and analytic hierarchy process, often regard the research sample as a whole, without considering geographical space as an important influencing factor in measuring the urban resilience index. However, once geospatial factors are taken into account, traditional methods or calculating the urban resilience index reveal obvious disadvantages. According to the adaptive cycle theory and multi-scale nested adaptive cycle theory [37], the urban resilience level of a region depends not only on the running state of economic, social, and ecological systems but also is closely related to the natural environment state and regional integration development. First, natural and climatic disasters have significant regional characteristics, leading to similar resilience construction among cities located in the same natural disaster area. For instance, in areas prone to rainstorms and floods, cities generally strengthen the construction of municipal drainage networks to improve their adaptability to extreme rainstorm weather. Second, the regional characteristics of urban resilience are reflected not only in the response to natural disasters but also in the spatial dependence of economic and social aspects [38]. Geographically, neighboring cities have similar or correlated characteristics in the development of economic industries. In addition, another spatial factor that cannot be ignored is that the resilience level of cities can be improved through regional integration; that is, cities can improve their resilience levels with the assistance of neighboring cities [39]. Of course, when a city is affected by risks, the negative effects are also transmitted to neighboring cities through regional linkages [40].
In existing studies, scholars generally believe that there are significant spatial differences and spatial agglomeration characteristics in urban resilience. Bai Limin et al. (2019) comprehensively assessed the resilience level of 259 cities in China from 2005 to 2015, finding that the resilience level of cities presents a “clustering” feature, indicating spatial autocorrelation [41]. Zheng Tao et al. (2022) reported similar findings in their study of cities in the Yangtze River Delta region. With the implementation of regional integration policies and planning, urban resilience in the region tends to be clustered [42]. It is evident that with the continuous improvement of the overall level of urban resilience in China, the urban resilience index among regions shows significant spatial differences, which may be related to spatial factors that are “naturally” ignored by traditional methods of resilience index measurement. Therefore, without taking into account geospatial factors, it will be difficult to accurately capture the impact of large differences within countries on the level of urban resilience, resulting in incorrect estimation of the urban resilience index in some regions.
To sum up, it is imperative to include geospatial factors in the investigation of urban resilience. At the methodological level, the “prior” distribution of Bayesian estimation provides a convenient analytical tool for incorporating geospatial factors into the measurement of urban resilience based on the available data. By referring to the method proposed by Qiu et al. [43] and based on the idea of Bayesian estimation, this paper incorporates spatial heterogeneity (population and geography) into the measurement of urban resilience in the form of a prior assumption by constructing a spatial hierarchy factor model. The specific measurement process is as follows:
① Space weight matrix selection:
Before construction of the spatial hierarchy factor model, in order to incorporate the geospatial dependency and interaction into the model, it is necessary to first establish a weight matrix that can effectively express the spatial interactions between cities, so as to make the metrological model closer to the events in the real world. In other words, the closer two regions are in space, the stronger the spatial autocorrelation of their urban resilience will be. Weight matrices commonly used in empirical research on spatial metrology include adjacency matrices, geographical distance matrices, inverse distance matrices, economic matrices, and economic geography nested matrices [44]. The basic expression is as follows:
W i j = 0 ω 12 ω 1 n ω 21 0 ω 2 n ω n 1 ω n 2 0
Based on geospatial attributes, this paper assumes a spatial autocorrelation of urban resilience between neighboring cities and constructs a geographic adjacency matrix based on the Queen’s Law, that is, if the administrative boundaries of two cities are adjacent, then W i j = 1 ; if the administrative boundary is not adjacent, then W i j = 0 .
② The spatial hierarchy factor model constructs the urban resilience index:
First, a basic hierarchical factor analysis model is constructed with reference to Hoyland et al. (2011) [45]. The specific form is as follows:
Y i j = μ j + λ j δ i + ε i j
In this equation, the left side Y i j represents the value of the j -th observable variable for the i -th city; on the right side of the equation, δ i represents the potential urban resilience index of a region, which is the core measurement index value of the model, μ j is the sample mean of variable j, λ j is the factor loading, specifically the covariance between the resilience level of the city δ i and the observable variable Y i j , and ε i j ~ N ( 0 , σ j 2 ) is the disturbance term subject to a normal distribution and satisfies the independent IID hypothesis. This means that the urban resilience index δ i is only related to the observable variable Y i j .
Next, geospatial factors are included in Equation (2) to build the spatial hierarchy factor analysis model. First, the conditional distribution form of the urban resilience index, including geospatial factors, is set as follows:
δ i | δ j ~ N ( j ϕ i ω δ j , υ )
where ω is the degree of regional integration, j ϕ i defined as the domain set of the i region, and υ is the conditional variance. The conditional variance is normalized as υ = 1 . At the same time, it is assumed that regional integration is incorporated into the model using the queen rule of “whether it is bordering or not”, and the marginal distribution of Equation (3) is obtained.
δ ~ N ( 0 , ( I ω W ) 1 )
where W is a non-random geographic spatial adjacency matrix of N × N order. Then, the urban population size m i is introduced into Equation (4), because according to existing literature, population size is a very important endogenous factor affecting the urban resilience index [46,47,48]. On the one hand, regional population size, to a certain extent, represents the complexity of urban development and is directly related to the internal disturbances of the city. On the other hand, a region with a large population size faces relatively small external uncertainty risks in urban resilience. Therefore, the vector form of the urban resilience index constructed by the spatial hierarchy factor model can be expressed as follows:
Y | δ ~ N ( μ + Λ δ , M 1 Σ ) δ ~ N ( 0 , M 1 2 ψ M 1 2 )
where Y is the vector that Y i j superimposes on j ; Λ = I N λ , I N is the identity matrix of order N × N ; Σ is a diagonal matrix, and the elements on the main diagonal are δ j 2 ; ψ = ( I ω W ) 1 ; M is a N × N rank matrix of the population of a region, with diagonal elements being m 1 , m 2 , , m N .
③ Markov chain Monte Carlo (MCMC) sampling:
Based on Equation (5), this study refers to Hogan and Tchernis (2004), who used Markov chain Monte Carlo (MCMC) sampling [49] to calculate the resilience index values of all cities. The specific steps are as follows:
Step 1: Estimate factor load λ . Ream 1 N is the N × 1 vector with all elements equal to 1. For arbitrary λ j , the estimation equation is Y j 1 N μ j = λ j δ + ε j , where, Y j is the N × 1 vector of the observable variable Y i j , and ε j ~ N ( 0 , σ j 2 / M ) . Let the prior distribution be λ j ~ N ( a , A ) , where a = 0 ; A = 1000 . Thus, the posterior distribution Λ j that can be derived from the conditional distribution shown N ( b , B ) in Equation (6).
B = ( 1 / A + δ M δ / σ j 2 ) 1 b = B [ a / A + δ M ( Y j 1 N μ j ) / σ j 2 ]
Step 2: Estimate potential urban resilience   δ . Let the estimate equation be Y μ 1 N = Λ δ + ε , where Y is the N J × 1 vector of the observable variables Y i , and ε ~ N ( 0 , M 1 ) . As can be seen from Equation (5), the prior distribution of δ satisfies δ ~ N ( 0 , M 1 2 ψ M 1 2 ) . Therefore, the posterior distribution of δ can be derived from the conditional distribution N ( d , D ) as shown in Equation (7).
D = [ ( M 1 2 ψ M 1 2 ) 1 + Λ ( M 1 ) 1 Λ ] 1 d = D [ Λ ( M 1 ) 1 ( Y μ 1 N ) ]
Step 3: Sample the spatial correlation ω using the Metropolis-Hastings algorithm in Markov chain Monte Carlo (MCMC). Assume that the prior distribution of ω is π ( ω ) = N ( 0,1000 ) I ( η 1 1 < ω < η N 1 ) , where η 1 1   and η N 1 respectively represent the minimum and maximum eigenvalues of the spatial weight matrix W , so the density function of ω can then be expressed as η N f ( δ | ψ ( ω ) ) π ( ω ) . Further, let the proposal density be q ( ω | ω ) ~ N ( ω , ρ 2 ) . This can be derived ω from a random walk equation ω = ω + ε . Here, ε is the perturbation term and satisfies ε ~ N ( 0 , ρ 2 ) , ρ 2 for the adjustment parameter. Therefore, the range of ω values generated by the sample are limited to η 1 1 < ω < η N 1 . Accordingly, the probability of ω being accepted is
min 1 , f ( δ | ψ ( ω ) ) π ( ω ) q ( ω | ω ) f ( δ | ψ ( ω ) ) π ( ω ) q ( ω | ω )
(2) Index system construction
In empirical studies, there are three main approaches to constructing an urban resilience index system. The first approach is from the perspective of system theory, which regards a resilient city as a complex of economic, social, ecological, engineering, institutional, and other subsystems, and constructs an evaluation system for each subsystem [50,51]. The second approach is based on the typical characteristics of resilient cities, constructing the index system from the aspects of robustness, rapidity, redundancy, and flexibility [52]. The third approach starts with the process sequence of resilience, measuring resilience from the stages of disaster prevention, disaster absorption, and system recovery [53]. The indicators of urban resilience under these three approaches overlap to some extent. Based on the above approaches, this paper considers that urban resilience is not only an organic combination of the resilience of urban economic, social, and ecological subsystems but also a dynamic evolving process. Following these approaches, this paper constructs a comprehensive urban resilience evaluation index system from the three major systems of economy, society, and ecology, along with their internal operational rules. Referring to existing literature [54,55,56,57,58,59], a total of 18 typical indicators are screened to represent the resilience of each system. The specific indicators are shown in Table 1.
Economic resilience:
Economic resilience refers to the ability of an urban economic system to cope with internal and external risks and resist market shocks to achieve stable economic growth, which is specifically reflected in economic development strength, economic reserve capacity, economic operational vitality, and economic transformation potential [60]. Total GDP and per capita GDP represent the economic strength and operational status of a region, with stronger economic strength of the city representing higher resistance to risk shocks. Financial reserves are an important guarantee for coping with economic crises, and the economic reserve absorption capacity can be measured by the per capita deposit balance of financial institutions. Per capita retail sales of consumer goods reflect the vitality of economic operations, while electricity consumption and water consumption per 10,000 yuan of GDP indicate the dependence of urban economic development on energy and resources. A lower value indicates weaker dependence of economic development on energy and resources and stronger potential for economic transformation.
Social resilience:
Social resilience reflects the ability of urban social systems to maintain social integration and orderly operation in the face of shocks and disturbances, specifically reflected in residents’ risk resistance, social assistance ability, social stability, and social transformation potential [61]. Per capita disposable income of urban residents and the Engel coefficient are important indicators to measure people’s living standards and reflect the ability of social individuals to resist risks. Adequate medical assistance resources are necessary for a city to prevent and respond to acute events, with social assistance ability represented by the number of hospital beds per 10,000 people. To some extent, the number of unemployed per 10,000 people reflects social stability, with a higher value indicating a more unstable society. The number of patents granted per 10,000 people indicates the vitality of mass innovation and the potential for social transformation.
Ecological resilience:
Ecological resilience refers to the ability of an urban ecosystem to maintain its original infrastructure and functions when faced with risks and to absorb and resolve those risks. It can be measured by ecological stability, ecological response capacity, and ecological environmental pressure [62]. Green space is an important ecological barrier for ensuring urban safety, providing not only emergency space to avoid disasters but also buffer space for various risk shocks. Ecological stability is measured by the green land rate and per capita green space in built-up areas. Green environmental protection has become an important goal for the high-quality development of cities. The response capacity of cities to the ecological environment can be reflected through the treatment rate of urban domestic sewage and the harmless treatment rate of domestic garbage. Industrial “three wastes” emissions from 10,000 yuan GDP can reflect the interference pressure of urban economic development on the ecological environment.
Table 1. Evaluation index of land intensive use and urban resilience.
Destination LayerSystem LayerEvaluation MetricsIndicator Meaning
Land intensive useLand input intensityFixed asset investment of unit land (10,000 yuan/km2)Capital factor input
Employment of unit land (person/km2)Labor factor input
Land use intensityPer capita urban construction land area (m2/person)Land conservation level
Population density (people/km2)Population carrying level
Land use efficiencyGDP of unit land (10,000 yuan/km2)Land output benefit
Fiscal revenue of unit land (10,000 yuan/km2)
Urban resilienceEconomic resilienceTotal GDP (billion yuan)Economic development strength
Per capita GDP (yuan)
Per capita deposit balance of financial institutions (yuan)Economic reserve capacity
Per capita retail sales of consumer goods (yuan)Economic operation vitality
Electricity consumption per 10,000 yuan GDP (kW)Economic transformation potential
Water consumption per 10,000 yuan GDP (tons)
Social resiliencePer capita disposable income of urban residents (yuan)Residents’ risk resistance
Engel coefficient for urban residents
Number of hospital beds per 10,000 people (zhang)Social assistance ability
Number of unemployed per 10,000 people (people)Social stability
Number of patents granted per 10,000 people (pieces)Social transformation potential
Ecological resilienceGreen land rate of built-up area (%)Ecological stability
Per capita green space (m2)
Urban domestic sewage treatment rate (%)Ecological response capacity
Harmless treatment rate of household waste (%)
Industrial wastewater discharge of per 10,000 yuan GDP (kg)Ecological environment pressure
Industrial SO2 emissions per 10,000 yuan GDP (kg)
Industrial fumes emission per 10,000 yuan GDP (kg)

3.3. Measurement Model Setting and Description

3.3.1. Measurement Model Setting

(1) Baseline regression model
According to the above theoretical analysis on the impact of land intensive use on urban resilience, the following baseline regression model can be set:
U R E S i , t = a 0 + a 1 U L I U i , t + β   C o n t r o l s i , t + ε i , t
where U R E S i , t indicates the level of urban resilience; U L I U i , t indicates the level of land intensive use; a 1 represents the influence coefficient of land intensive use on urban resilience; C o n t r o l s i , t stands for a series of control variables; and ε i , t is a random error term.
(2) Quantile regression model
Baseline regression is based on the effect of land intensive use on the conditional expectations of urban resilience. According to the above theoretical analysis, it is assumed that the impact of land intensive use on urban resilience may have marginal effects with the gradual increase in negative externalities of agglomeration, that is, for cities with different levels of resilience, land intensive use may have different impacts on resilience. Therefore, we hope to detect the change in the influence of land intensive use on urban resilience under various conditions more specifically, so as to reveal the law of its influence process.
To this end, a quantile regression model is used in this paper to further expand the benchmark model. Quantile regression was first proposed by Koenker & Bassett (1978) [63]. The model has the following advantages. First, it uses the weighted average of the absolute residual value as the minimized objective function, which is more robust for extreme values. Second, it can estimate several important conditional quantiles of the conditional distribution, such as the median (1/2) and quartile (1/4) quantiles, and can estimate the different impacts of explanatory variables on the explained variables under different quantiles. In addition, compared with least square estimation, quantile regression does not require the “normal distribution of error term”; hence, for non-normal distributions, the quantile regression coefficient estimator is more robust. The formula for the quantile regression model is as follows:
U R E S i , t = θ i + a 1 ( τ k ) U L I U i , t + β   C o n t r o l s i , t + ε i , t
where τ is the decimal point of observation, and the explanation of other variables are the same as Equation (9).

3.3.2. Variables and Explanation

(1) Explained variables and core explanatory variables
The explained variable of this paper is the urban resilience index (URES), and the core explanatory variable is the land intensive use index (ULIU), which is calculated by the method described above and will not be repeated here.
(2) Control variables
Urban resilience is also influenced by many other factors. To prevent the omission of relevant variables and the resulting bias in the regression results, based on relevant literature and considering the reality of urban development in China and the availability of data, the following control variables were included in the regression model. ① Urbanization: Urbanization promotes the concentration of production factors in cities, forming a large-scale agglomeration effect and improving resilience. However, rapid urbanization can also bring about a series of disadvantages, such as insufficient supply of infrastructure facilities due to rapid population agglomeration in cities and ecological environment destruction caused by large-scale construction and development, which will increase the vulnerability of cities [64]. This paper uses the proportion of permanent residents in the total population to measure the level of urbanization. ② Infrastructure: Infrastructure is the skeleton network of the urban system, also known as “urban lifeline engineering” [65], and is the most important support system for maintaining the normal operation of a city. This paper uses the density of the road network in the built-up area to measure the level of infrastructure. ③ Technology: Generally, a higher level of scientific research investment can stimulate the vitality of innovative factors, improve production methods and technical equipment, and enhance cities’ ability to cope with disasters. In this paper, the proportion of the sum of employees in the scientific research, technical service, geological survey industry, information transmission, computer service, and software industries to total employment is used to measure the level of scientific research investment. ④ Information: Information technology has gradually penetrated all walks of life and become an important productive factor in urban development. This paper uses thousands of Internet users to measure the level of information development. ⑤ Openness: On the one hand, foreign direct investment can introduce advanced foreign technologies and concepts, promoting the exchange of production factors and local economic and social development; on the other hand, compared with local investment, foreign investment has external dependence and sensitivity to the investment environment. Once hit by market shocks, it is more likely to affect urban economic and social resilience. In addition, according to the “pollution refuge hypothesis”, the transfer of low-end foreign-funded enterprises to developing countries will exacerbate environmental pollution in the host country and inhibit ecological resilience [66]. Openness is measured by the proportion of FDI in GDP in this paper. ⑥ Labor: Human capital reflects the quantity and quality of high-quality labor in the process of economic and social development of a region. Improvements in human capital also improve the level of scientific and technological innovation and the technological empowerment of the entire city, driving urban transformation and upgrading and enhancing urban resilience. This paper uses the number of college students per 1000 people to measure the level of human capital.
To reduce the influence of heteroscedasticity and solve possible nonlinear problems of variables, three variables—road network density in the built-up area, the number of college students per 1000 people, and the number of Internet users per 1000 people—were logarithmically processed and then included in the regression model. At the same time, to avoid bias in the regression results caused by the mutual influence of variables, multicollinearity diagnosis was carried out on the core explanatory and control variables. The VIF of all variables are lower than 10, indicating that there is no multicollinearity. The statistical descriptions of all variables are shown in Table 2.

4. Empirical Results and Analysis

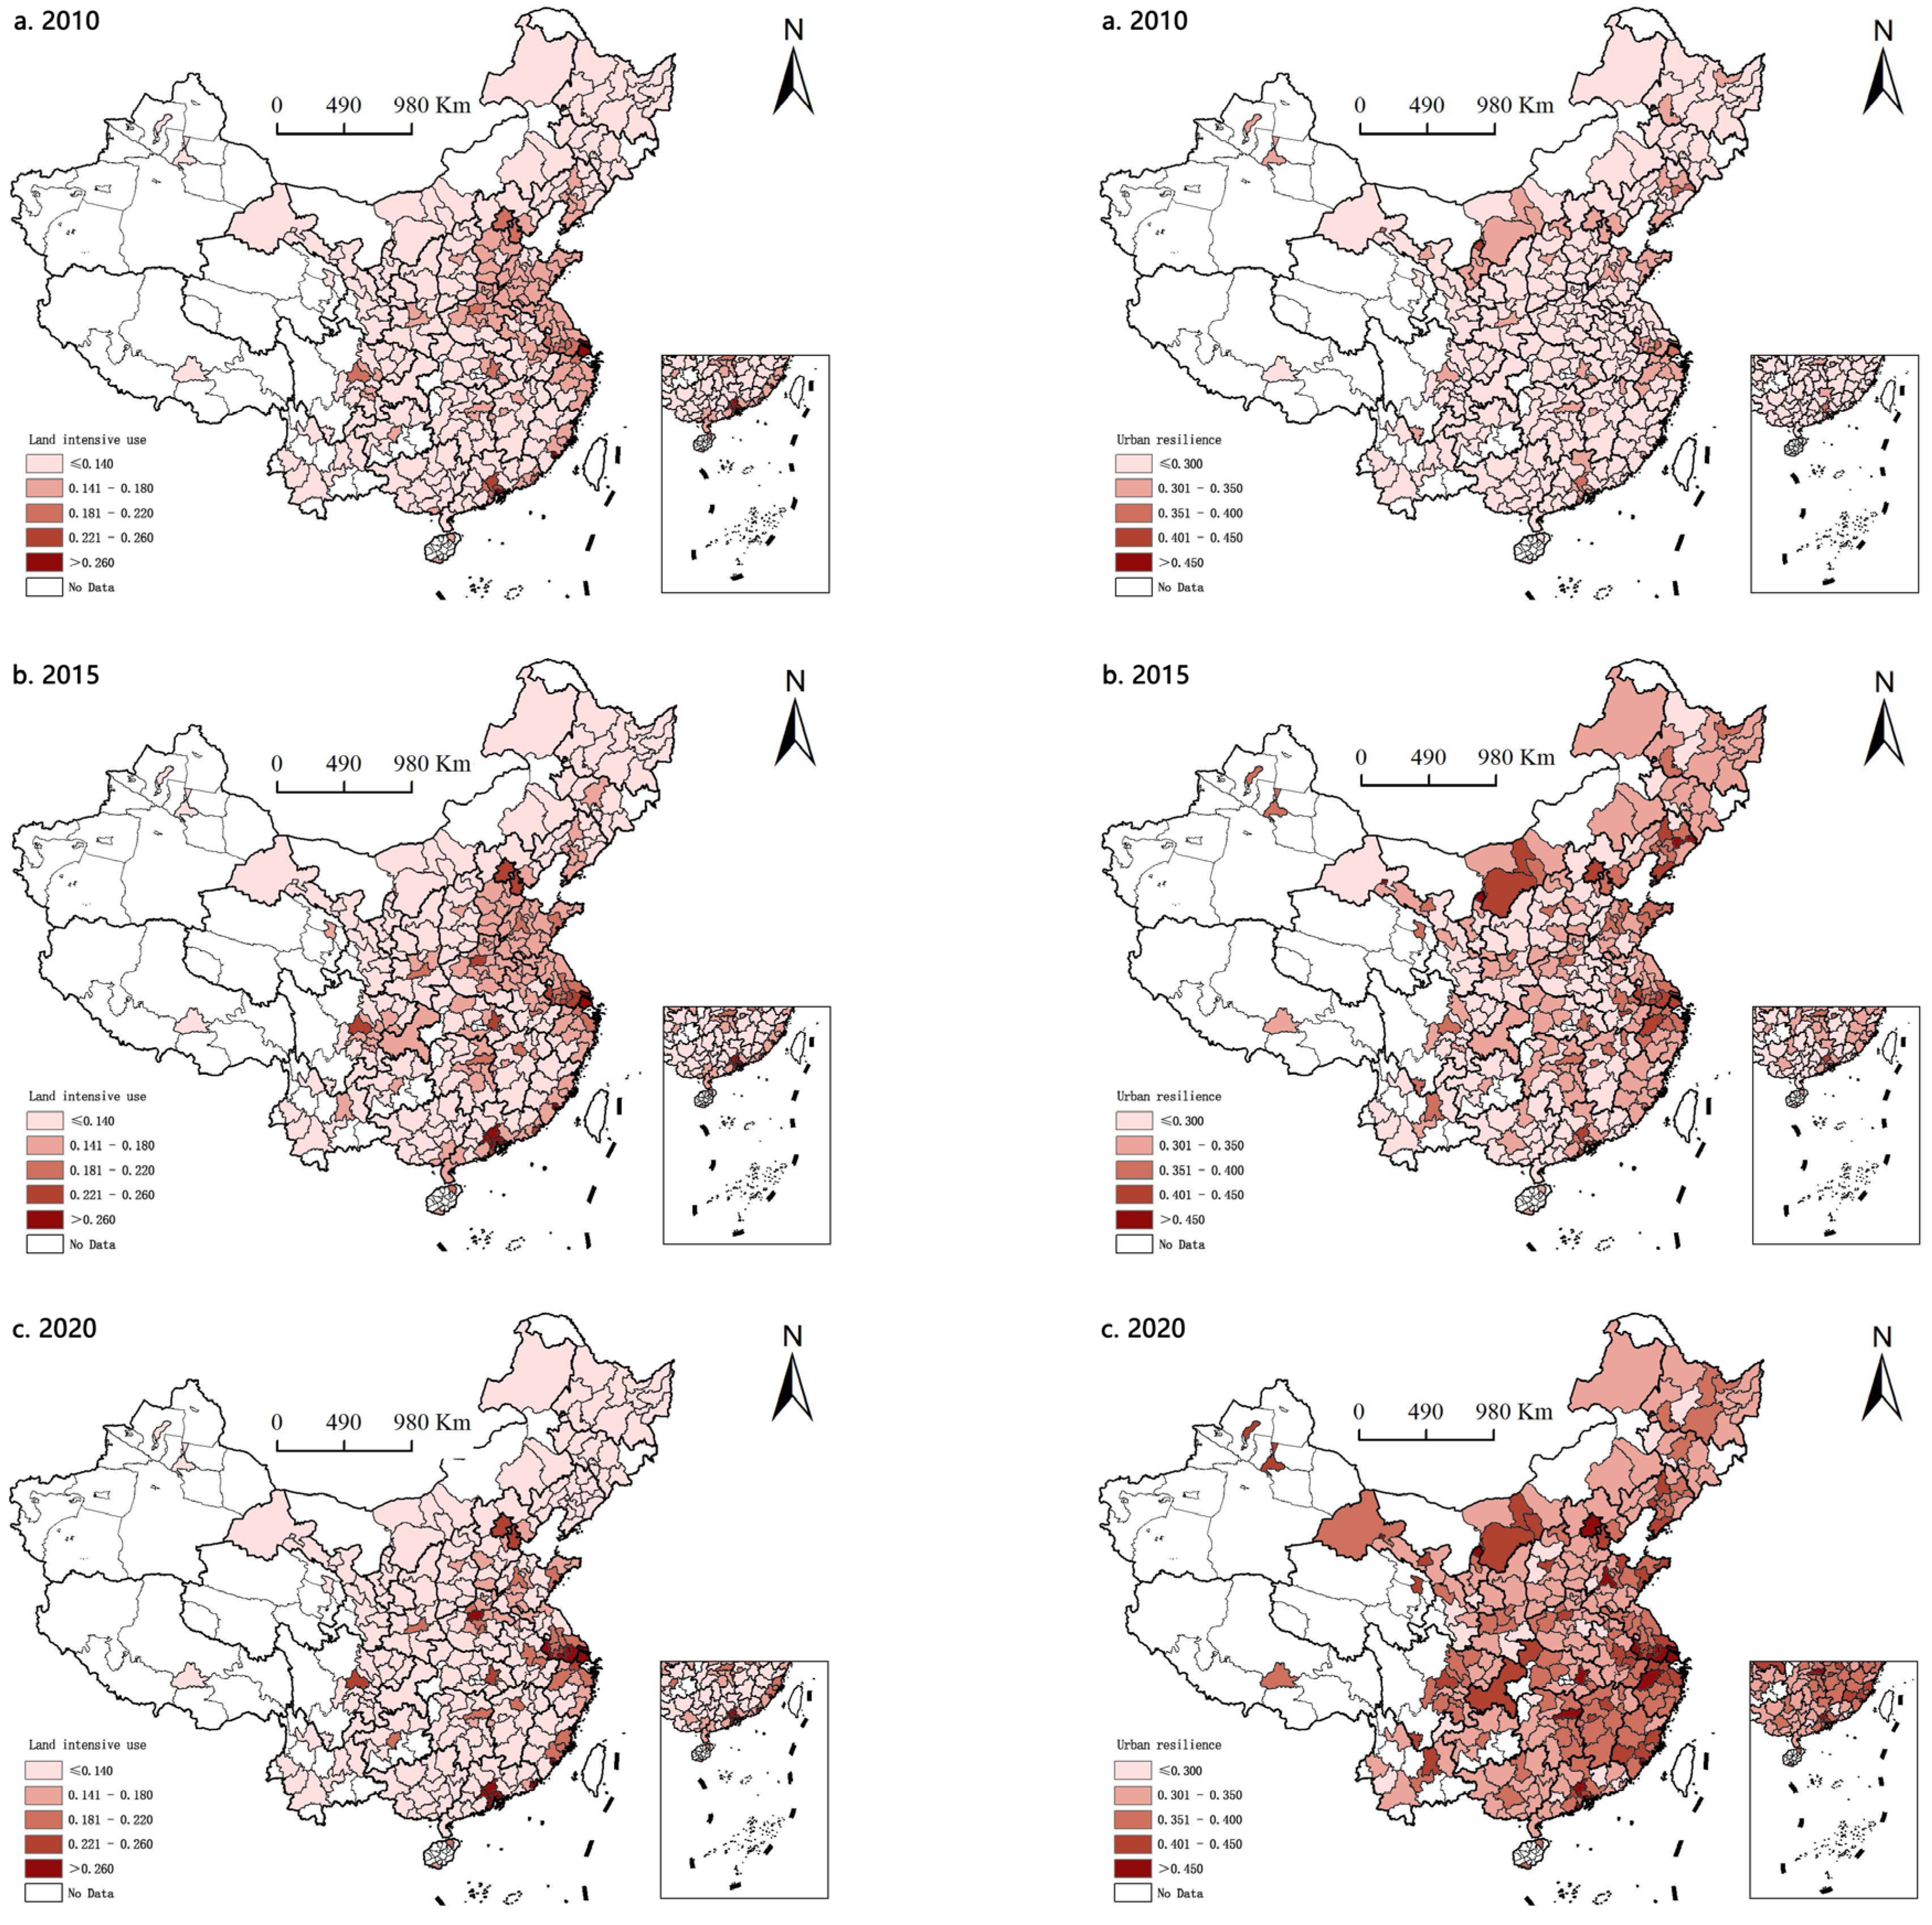
4.1. Spatiotemporal Evolution Characteristics of Land Intensive Use and Urban Resilience

4.1.1. Spatiotemporal Evolution Characteristics of Land Intensive Use

During the study period, the average level of urban land intensive use in China continuously rose from 0.143 to 0.157, with an increase of about 9.79%. The lowest value of land intensive use always fluctuated around 0.110, while the highest value increased from 0.470 to 0.995, indicating that after entering the post-urbanization stage, with the adjustment of economic structure and improvement of land resource management, the overall level of urban land intensive use in China has greatly improved. The standard deviation increased from 0.031 to 0.067, and the coefficient of variation grew from 0.217 to 0.427, indicating that during the study period, the absolute and relative gaps in the level of land intensive use among Chinese cities continuously expanded, showing a trend of “the strong becomes stronger, and the weak are always weak”. In other words, in cities at low levels, the improvement speed of land intensive use is relatively slow, while cities at high levels have more significant increases in land intensive use. In recent years, due to the continuous advancement of China’s urbanization level and transformation of old and new economic drivers, the urban land intensive use has been promoted. However, it cannot be ignored that cities with low levels of land intensive use are easy to fall into the “trap” of inefficient circulation of land development due to a lack of new development drivers and the lagging land management policies.
Further, the land intensive use index is divided into five levels, including low (ULIU ≤ 0.140), relatively low (0.140 < ULIU ≤ 0.180), medium (0.180 < ULIU ≤ 0.220), relatively high (0.220 < ULIU ≤ 0.260), and high (ULIU > 0.260). The spatial distribution of urban resilience levels in 2010, 2015, and 2020 were selected for visualization (Figure 3). Obvious spatial differences can be observed in China’s urban land intensive use, showing a spatial pattern of “high in the east and low in the west” and “high in the south and low in the north”. Specifically, (1) the areas with high levels of land intensive use are mainly distributed along the developed eastern coast and in some provincial capitals. The Yangtze River Delta, the Pearl River Delta, and the Beijing-Tianjin-Hebei city clusters show obvious high-value agglomeration cores. These regions lead China’s economic development. After experiencing rapid urbanization, the land use mode has gradually transformed from “extension and expansion” to “quality improvement and potential exploitation”. Therefore, the levels of land intensive use in these regions is higher. (2) Areas with low and relatively low levels of land intensive use are mainly distributed in the northeast, northwest, southwest, and mountainous and hilly areas in the south. The three Northeastern provinces are traditional heavy industry bases in early China, with extensive land resource utilization, and low land input and output benefits. The northwest and southwest regions are restricted by natural climate and geographical transportation location, and the economic development is relatively slow, which leads to low levels of land intensive use. The southern mountainous and hilly areas are mainly restricted by landform and the insufficient utilization rate of land resources. (3) During the study period, regions with significant improvements in land intensive use included the Pearl River Delta, the Yangtze River Delta city cluster, the Beijing-Tianjin-Hebei city cluster, the Central Plains city cluster, and the middle reaches of the Yangtze River city clusters, among which Shenzhen, Shanghai, Dongguan, Nanjing, Zhengzhou, Chengdu, and other cities have the fastest growth rate, and the above regions are “leaders” of regional economic development in China. These regions are also key regions in the rapid development of urbanization in China at this stage, with high degrees of economic and population agglomeration and a circular cumulative effect, which promotes significant improvement of land intensive use. Areas with slow improvement in land intensive use are mainly distributed in the northeast and northwest regions, among them 43 cities showed a decrease in land intensive use levels in the study. The transformation and development of traditional industries in Northeast China are slow, the input of innovation factors is insufficient, and it is difficult to significantly improve land use efficiency in the short term. The northwest region is an important ecological barrier in China, and it is also an extremely sensitive and fragile. Under the guidance of the national ecological protection strategy, no large-scale development and construction is carried out, and the land development is always kept at a low-intensity level.

4.1.2. Spatiotemporal Evolution Characteristics of Urban Resilience

During the study period, the average resilience level of Chinese cities continuously rose from 0.268 to 0.359, with an increase of about 33.96%. The lowest value of urban resilience increased from 0.163 to 0.271, while the highest value grew from 0.445 to 0.556, indicating that with the increasingly complex acute shocks and chronic disturbances faced by cities, more attention has been paid to the construction of resilient cities. Since 2010, various cities have successively issued relevant documents on the construction of resilient cities, and the “resilience enhancing” action measures have been gradually implemented, resulting in a significant improvement in resilience levels in most cities. The standard deviation increased from 0.040 to 0.049, while the coefficient of variation fluctuated and decreased from 0.149 to 0.136, indicating that during the study period, the absolute gap in resilience levels among Chinese cities slowly expanded. While the relative difference fluctuated to some extent, the gaps generally narrowed, that is, there was an accelerated trend of “catching up” by low-resilience cities towards high-resilience cities. This also reflects that in recent years, the investment in disaster prevention and reduction in low-resilience cities has been increasing, and the “resilience enhancing“ effect is very obvious, which has promoted the balanced development of regional resilience.
Similarly, the urban resilience index is divided into five levels, including low (URES ≤ 0.300), relatively low (0.300 < URES ≤ 0.350), medium (0.350 < URES ≤ 0.400), relatively high (0.400 < URES ≤ 0.450), and high (URES > 0.450). The spatial distribution of urban resilience levels in 2010, 2015, and 2020 was visualized (Figure 3). Overall, the resilience level of Chinese cities shows a spatial differentiation pattern of “high in the east and low in the west”. Specifically, (1) cities with relatively high and high resilience are mainly distributed in the eastern coastal areas, along the Yangtze River Economic Belt, and in some provincial capitals. Among them, the Beijing-Tianjin-Hebei, Yangtze River Delta, Pearl River Delta, Sichuan and Chongqing, and Hohhot-Baotou-Ordos city clusters show obvious high-value agglomerations. The Beijing-Tianjin-Hebei city cluster is China’s important political and cultural center; the Yangtze River Delta and Pearl River Delta city clusters are China’s economic and trade centers; the Chengdu-Chongqing city cluster is China’s western economic science and technology innovation center; and the Hohhot-Baotou-Ordos city cluster is China’s northbound opening frontier. These regions have a good economic foundation, high levels of social welfare, and intensive innovation factors, aal of which contribute to their relatively high urban resilience. Moreover, these urban agglomerations have high degrees of regional integration, close connections between cities, and convenient transportation networks, making it easy to form a network resilience of “neighborhood help”. (2) Cities with relatively low and low resilience are mainly distributed in the northeast and southwest regions. The three northeastern provinces, which are dominated by agriculture and forestry and resource-dependent, energy-consuming traditional industries, experience slow economic growth and poor adaptability and transformation ability to changes in the external market environment. Resulting problems, such as population outflow, unemployment, and lagging public services reduce social resilience. The ecosystem is also vulnerable as a whole. As a superimposed region of ecological security and concentrated contiguity of poverty in China, the southwest region has a poor foundation of economic development, low levels of social well-being, and a sensitive and fragile ecological environment, resulting in overall low levels of urban resilience. (3) During the study period, regions with significant improvements in urban resilience were mainly distributed in the Chengdu-Chongqing city cluster, Gansu Province, Anhui Province, and other regions. The Chengdu-Chongqing city cluster is the regional center of western China. With the dividend effect brought by the western development strategies, the cities in this region have achieved remarkable results in economic, social, and ecological construction, and the urban resilience level has improved rapidly. With the support of major national policies such as the Western Development, the Belt and Road Initiative, and the environmental protection of the Yellow River Basin, Gansu Province has invested heavily in the construction of urban resilience and achieved remarkable results. In recent years, Anhui Province has actively engaged in the regional integration development of the Yangtze River Delta, vigorously undertaking industrial transfers from the core region of the Yangtze River Delta, increasing investments in urban construction, and significantly improving its resilience levels. Regions with slow improvements in urban resilience are mainly distributed in Northeast and North China. Cities in these regions are mainly limited by weak development in resource and energy industries and a lack of new driving forces for economic development, resulting in relatively slow social and ecological construction, and the improvement in urban resilience is not significant.
Figure 3. Spatial pattern characteristics of land intensive use (left) and urban resilience (right) in China from 2010 to 2020.
Buildings 14 02564 g003

4.2. Effects of Land Intensive Use on Urban Resilience

4.2.1. Analysis of Baseline Regression Results

According to the results of the Hausman test, a dual-fixed effect regression model of time and individual effects was selected for analysis. Table 3 presents the baseline regression results of the impact of land intensive use on urban resilience at the national level. In model (1), without the addition of any control variables, the estimated coefficient for the impact of land intensive use on urban resilience is 0.237, which passes the significance level test of 1%. After the sequential addition of control variables of urbanization level, infrastructure level, scientific research input level, informatization level, openness level and human capital level, the estimated coefficient of the impact of land intensive use on urban resilience is always positive, and all pass the significance level test of 1%. These results suggest that improvements in land intensive use can significantly promote the improvement of urban resilience.
In terms of the regression coefficients of control variables, the coefficient for urbanization level is significantly positive at the level of 1%, indicating that at the current development stage, it can promote the continuous improvement of urban resilience with the gradual improvement of China’s urbanization level. The coefficient for infrastructure level is positive and also passes the significance level test of 1%, indicating that a relatively complete infrastructure system can indeed provide strong support for a city in resisting external shocks. The coefficient for scientific research investment level is also positive and passes the significance level test of 1% and 5%, respectively, indicating that increasing scientific research investment can promote the formation of urban innovation networks, produce a technology empowerment effect, and provide a driving force for cities to cope with uncertain risks, especially for urban transformation and upgrading. Information development also significantly promotes urban resilience at the 1% confidence level. Informatization has become an efficient carrier for the effective allocation of urban resources and the circulation of production factors, flattening the urban system and improving the efficiency and resilience of the city. At the 1% confidence level, the openness level significantly inhibits urban resilience. The possible reason is that although foreign investment brings new ideas, technologies, and equipment, it is highly sensitive to and dependent on changes in the international market environment and is more vulnerable to external shocks, thus affecting the normal operation of urban economies and societies, which may weaken a city’s resilience to some extent. In addition, although the regression coefficient for human capital level is positive, it fails to pass the significance level test. The possible reason is that while a high-quality labor force is one of the important driving forces for promoting urban development and talent accumulation forms an intellectual reserve for urban resilience development, this promotion effect may have a certain lag. In addition, it may also be due to the inter-city flow of labor force, where a considerable part of college students will not stay and work in their place of study after graduation. Instead, they choose to move to coastal areas and economically developed big cities for employment. Therefore, it cannot significantly promote the development of local urban resilience.

4.2.2. Robustness Test

To verify the robustness of the estimated results in Table 3, a robustness test of the baseline regression conclusion was carried out after the exclusion of outliers. The results are shown in Table 4. Models (1) and (2) report the regression results of 1% with and without the inclusion of control variables, respectively. Models (3) and (4) report the regression results of 5%. The coefficient of land intensive use is significantly positive, aligning with theoretical expectations. After controlling for all variables, under the condition of bilateral winsorizing 1%, urban resilience increases by 0.545% for every 1% increase in land intensive use. In the case of bilateral winsorizing 5%, urban resilience increases by 0.840% for every 1% increase in land intensive use. In addition, although the significance of the coefficients for the control variables differs slightly from those in Table 4, the symbols are generally consistent, which aligns with theoretical expectations and confirms the robustness of the results of the baseline regression.

4.2.3. Quantile Regression Analysis

A panel quantile regression model with double fixed effects was used to further examine the differences in the impact of land intensive use on urban resilience under different distribution conditions. Five of the most commonly used and representative quantiles, including 10%, 25%, 50%, 75%, and 90%, were selected as the conditional distribution values of urban resilience (Table 5). According to the regression results of Models (2)–(6) in Table 5, the coefficients at the 10% and 90% quantiles are positive at the significance level of 5%, while those at other quantiles are positive at the significance level of 1%. Moreover, the regression results at the median (50% quantile) for most variables are very close to the mean estimation results reported in Table 3. These results further verify that land intensive use is an important factor affecting urban resilience, and improvements in land intensive use are conducive to enhancing of urban resilience. Furthermore, from the 10% quantile to the 90% quantile, the regression coefficients for land intensive use are 0.289, 0.284, 0.277, 0.268, and 0.263, respectively, showing a decreasing trend. These results indicate that the promoting effect of land intensive use on urban resilience gradually decreases as the resilience level increases. In other words, in cities with lower urban resilience levels, land intensive use has a more pronounced promoting effect on urban resilience. The possible reason is that these cities usually have lower operating efficiencies in their economic and social systems, more fragile ecological and environmental systems, and lower resistance and adaptability to external shocks. The root cause may be the unreasonable allocation of factors due to non-intensive utilization of territorial space resources. Therefore, improvements in land intensive use can more significantly enhance urban resilience in these cities. It can be observed that cities with poor resilience should pay more attention to the role of land use in optimizing the allocation of production factors and promote the scientific and efficient use of land resources.

4.3. Effects of Different Dimensions of Land Intensive Use on Urban Resilience

According to the measurement index system of land intensive use, the heterogeneity of the impact of three dimensions, including land input intensity, utilization intensity, and utilization benefit, on urban resilience was further analyzed to better understand the effects of each aspect of land intensive use on urban resilience. The regression results are shown in Table 6.
Model (1) and Model (3) respectively report the regression results of the impacts of land input intensity, utilization intensity, and utilization benefit on urban resilience with the inclusion of control variables. The results show that the coefficients of land input intensity and utilization benefit are both positive and pass the significance level test of 1%, indicating that both of them promote urban resilience. In the process of land development, more attention should be paid to the rational input and output benefits of land to promote urban resilience. Regarding two coefficients, the coefficient value for land use benefit (0.259) is slightly larger than that for land input intensity (0.246), which also indicates that land use benefit has a greater impact on urban resilience than land input intensity. Generally, there is a significant positive correlation between the input of production factors and output benefit. However, there is a law of progressive decrease in marginal output returns on land input. When the input of production factors reaches a certain intensity, further increases in input will not increase output but lead to resource waste. Therefore, in the process of land development, the output benefit of land should be the most important measurement criterion for land-intensive use. The traditional mode of improving land output benefit through high input should be changed, and more attention should be given to optimizing and adjusting of the allocation structure of production factors to achieve Pareto optimization of resource utilization efficiency, thereby more effectively improving urban resilience. The coefficient of land use intensity in Model (2) is –0.009 and fails to pass the significance test. The possible reason is that population agglomeration does not always promote improvements in urban resilience. Large-scale population agglomeration puts forward more demands for urban resources and energy, which aggravates pressure on urban resources and the environment. Moreover, at China’s current development stage, the supply of public service facilities in most cities still lags behind the speed of population urbanization, resulting in inadequate supply of public resources. In this context, improvements in land use intensity is not conducive to the improvement of urban resilience in the short term and may even inhibit it. Therefore, during the process of urbanization, population agglomeration intensity should be properly controlled, and the population size of large and megacities should be reduced in an orderly manner, to promote the coordinated development of high-quality intensive land use and urban resilience.
Table 6. Regression results of the impact of various dimensions of land intensive use on urban resilience.
VariableModel (1)Model (2)Model (3)
ULIU- Land input intensity0.246 ***
(16.69)
ULIU- Land use intensity −0.009
(−0.33)
ULIU- Landuse benefit 0.259 ***
(16.81)
Urban0.001 ***0.000 ***0.001 ***
(5.16)(2.71)(5.74)
Infrastructure0.007 ***0.006 ***0.007 ***
(4.38)(3.38)(4.28)
Technology0.002 ***0.004 ***0.002 ***
(3.54)(5.63)(3.46)
Information0.011 ***0.0020.009 ***
(5.45)(1.04)(4.25)
Open0.001 ***0.001 **0.001 ***
(3.92)(2.51)(3.09)
Labor0.003 *0.004 **0.002
(1.75)(2.29)(1.26)
Cons.0.122 ***0.227 ***0.135 ***
(8.41)(14.91)(9.54)
Time effectYesYesYes
Individual effectYesYesYes
R-squared0.8750.8650.875
Note: The t values are in brackets, with *, **, and *** representing statistical levels of 10%, 5%, and 1%, respectively.

4.4. Heterogeneity of the Impact of Land Intensive Use on Urban Resilience

The above quantile regression reveals that the impact of land intensive use on urban resilience varies with increasing resilience levels. There are obvious differences in development level, resource endowment, and geographical location across Chinese cities. Therefore, the impact of land intensive use on urban resilience may be affected by urban heterogeneity. In particular, attention should be paid to the relationship between urban size and geographical location with urban resilience. In terms of city size, the scale agglomeration effect of large cities is generally more significant than that of small- and medium-sized cities, but they also face more complex and diverse fragility-causing factors. Therefore, the impact of land intensive use on urban resilience may exhibit scale heterogeneity. In addition, China has a vast territory, and geographical location is the most important factor leading to differences in urban development. Compared with the central and western regions, the eastern region has higher levels of economic and social development, the industrial structure is also significantly different, and the influencing relationship between the two may have regional heterogeneity. Therefore, this paper classifies all urban samples according to size and geographical location and further examines the scale heterogeneity and location heterogeneity of urban resilience under the influence of land intensive use.

4.4.1. Scale Heterogeneity

Based on the purpose of this study, the 287 cities were divided into megacities and non-megacities according to whether their permanent population exceeds 5 million as the demarcating point, with reference to the definition of city size in the Notice on Adjusting the Classification Standards of City Size issued by The State Council in 2014. Models (1) and (2) in Table 7 show the scale heterogeneity regression results of the impact of land intensive use on urban resilience.
According to the regression results, whether in megacities or non-megacities, land intensive use has a significant enhancing effect on urban resilience. Based on the coefficient values, the estimated coefficient for megacities is 0.141, while that for non-megacities is 0.555, indicating that the enhancing effect of land intensive use on urban resilience is more significant in non-megacities than in megacities. Generally, megacities have the advantage of first-mover scale markets, which has a siphon effect on surrounding areas. The improving effect of land intensive use further strengthens the “polarization effect” of megacities, promoting the agglomeration of advanced production factors and produce the scale agglomeration effect. Moreover, under the action of comparative advantage, backward production factors will be “squeezed out” of megacities, resulting in an iterative upgrading effect, which will together improve the level of urban resilience. However, the effect of land intensive use on factor agglomeration and crowding out follows a law of progressive decrease in marginal returns. Moreover, with the excessive agglomeration of population and economic factors to megacities, negative external effects of agglomeration, such as resource run, public goods shortages, environmental pollution, and other contradictions gradually emerge, which may inhibit the resilience of megacities to some extent. For non-megacities, the agglomeration level of production factors is relatively low, with the advantage of later-mover advantage. Land intensive use has a more significant effect on the agglomeration and reallocation of factors, resulting in a more obvious improvement in urban resilience.

4.4.2. Locational Heterogeneity

This paper further explores the differences in the impact of land intensive use on urban resilience across different regional dimensions. According to the classification standard of the National Bureau of Statistics in 2003, the 287 cities were divided into eastern/central and western cities for regression analysis. Models (3) and (4) in Table 7 show the regression results of locational heterogeneity in the impact of land intensive use on urban resilience.
According to the regression results, land intensive use has a significant enhancing effect in both eastern/central and western cities. Based on the coefficient values, the estimated coefficient for eastern cities is 0.176, while that for central/western cities is 0.725, indicating that land intensive use has a stronger enhancing effect on urban resilience in central/western cities compared to eastern cities. The main reason is that the eastern region is the leading demonstration area of China’s reform and opening up. Urbanization has greatly promoted continuous improvements in land intensive use, and the scale agglomeration effect has reached a relatively high level. The marginal improvement of land intensive use on urban resilience by increasing factor input to improve economic, social, and ecological benefits has gradually become prominent. The improvement of urban resilience in these areas depends more on the structural adjustment of land and the reconfiguration of factors. The central/western regions are relatively backward in economic development and have low levels of land intensive use. At present, they are still in the stage of rapid urbanization. With the improvement of land input intensity and utilization intensity, the economic, social, and ecological level can be significantly improved. Hence, the impact of land intensive use on urban resilience is more significant in these regions.
Table 7. Heterogeneity regression results of the impact of land intensive use on urban resilience.
VariableScale HeterogeneityLocation Heterogeneity
Model (1)Model (2)Model (3)Model (4)
MegacitiesNon-MegacitiesEastern CitiesCentral/Western Cities
ULIU0.141 ***
(6.68)
0.555 ***
(9.93)
0.176 ***
(8.48)
0.725 ***
(11.54)
Urban0.000 **
(2.22)
0.001 ***
(4.76)
0.000 **
(2.39)
0.001 ***
(4.01)
Infrastructure0.011 ***
(3.99)
0.005 ***
(2.94)
0.013 ***
(4.75)
0.005 **
(2.46)
Technology0.002
(1.53)
0.001
(0.84)
0.006 ***
(5.73)
0.001
(1.06)
Information0.008 **
(2.06)
0.016 ***
(6.71)
0.007 **
(2.07)
0.023 ***
(9.01)
Open0.002 ***
(3.20)
0.001 **
(2.15)
0.001 **
(2.16)
0.001 ***
(2.78)
Labor0.020 ***
(5.18)
0.006 ***
(3.63)
0.002
(0.59)
0.003 *
(1.78)
Cons.0.257 ***
(9.33)
0.036 **
(1.98)
0.300 ***
(11.74)
0.021
(1.04)
Sample size1001215612541903
Number of cities91196114173
TimeeffectYesYesYesYes
Individual effectYesYesYesYes
R-squared0.8890.8380.8470.861
Note: The t values are in brackets, with *, **, and *** representing statistical levels of 10%, 5%, and 1%, respectively.

5. Research Conclusions and Policy Implications

5.1. Research Conclusions

In the context of sustainable development, it is very important to promote high-quality and intensive use of urban land and realize the safe and resilient development of cities. This paper examines 287 cities in China from 2010 to 2020 as the research object, using the entropy method to measure the level of land intensive use and the spatial hierarchy factor model to measure the level of urban resilience, and empirically tests the influence of land intensive use on urban resilience and its process rule through baseline regression and panel quantile regression models. The paper also analyzes the different characteristics of the effects of each dimension of land intensive use. The main findings are as follows. (1) During the study period, China’s urban land intensive use level and urban resilience level increased significantly. The land intensive use level shows a trend of “the strong become stronger, and the weak are always weak” with spatial differentiation of “high in the east and low in the west”. The Yangtze River Delta, Pearl River Delta, and Beijing-Tianjin-Hebei city clusters are notable high-value agglomeration cores. The mountainous and hilly areas in the northeast, northwest, southwest, and south are low-value areas. The urban resilience level shows a trend of “catching up” from low-resilience cities to high-resilience cities, with spatial differentiation of “high in the east and low in the west”. Cities with relatively high and high resilience are mainly distributed in the eastern coastal areas, along the Yangtze River Economic Belt and some provincial capitals, while cities with relatively low and low resilience are mainly distributed in the northeast and southwest regions. (2) The improvement of land intensive use can significantly promote the development of urban resilience, and this effect gradually decreases as the resilience level increases. In other words, land intensive use has a stronger effect on improving urban resilience in cities with low resilience levels, while its effect is less pronounced in cities with high resilience levels. (3) Among the different dimensions of land intensive use, both land input intensity and land use efficiency significantly promote urban resilience, particularly the latter. Land use intensity has a negative effect on urban resilience, but it does not pass the significance level test. (4) There is scale heterogeneity and geographical location heterogeneity in the impact of land intensive use on urban resilience. In terms of scale heterogeneity, land intensive use has a more obvious effect on urban resilience in non-megacities than in megacities. In terms of geographical location heterogeneity, compared with eastern cities, the promotion effect of land intensive use on urban resilience is more significant in central/western cities.

5.2. Policy Implications

Driven by high-speed urbanization and large-scale urban construction since the reform and opening up, China has made remarkable achievements in economic and social development. However, the inefficient and extensive use of national land space and the resulting structural weaknesses within cities have become increasingly serious. As China enters a stage of high-quality development, increasing attention has been paid to the development and management of the entire life cycle of land space. The utilization of land resources should be re-examined from the perspective of sustainable development, to fully utilize the economic, social, and ecological benefits of land intensive use and find scientific strategies to improve the quality and efficiency of land development and urban resilience. Based on the theoretical research and empirical findings of this paper, the following three policy suggestions are put forward. (1) Building resilient cities is an urgent need for safe and sustainable urban development in the new era, but its realization is a long process. The government should give full play to the role of land development in remodeling urban systems, integrating the concept of resilience into the entire process of urban land use, and establishing a mechanism linking incremental land use with stock land use. Moreover, the government should strengthen the transformation, redevelopment, and utilization of idle and inefficient land in urban built-up areas, guide the transformation of urban construction from “extensional” expansion to “convolution” filling, and promote the high-quality intensive use of construction land to enhance urban resilience. (2) As China enters the new normal of decelerated capital accumulation and diminishing labor dividend, the traditional development model of promoting economic growth through increased factor input should be adjusted by further optimizing the factor allocation structure, promoting the development of new quality productivity, and realizing the “Pareto optimal” of resource utilization efficiency, so as to give better play to the “toughening” effect of land intensive use. (3) According to heterogeneity analysis, different types of cities should adopt differential strategies to enhance urban land intensive use and urban resilience based on their own development stages. Specifically, megacities and eastern coastal cities should focus on improving levels of land intensification, removing excessively concentrated urban functions, reasonably reducing the development intensity and population density of central urban areas, and forming a large and sparse urban spatial form, to improve urban resilience. Non-megacities and central/western cities should strictly control the expansion and inefficient use of construction land, regulate the behavior of various types of urban construction land by delineating urban development boundaries and setting access standards, increase the intensity of development of stock land, and promote the development of land in the direction of intensification, efficiency, and sustainability.
This paper combines theoretical analysis with empirical research, building a theoretical analysis framework for the impact of land intensive use on urban resilience and conducting a series of empirical tests. The research conclusions offer guidance for promoting high-quality land intensive use and the safe and sustainable development of cities. However, the systematic study of urban resilience is a complex issue, and its evaluation index system and measurement methods need further optimization and improvement with the expansion of the concept connotation. In addition, this study only discusses the effect of land intensive use on urban resilience, but its internal mechanism needs to be further dissected, which can be the focus of subsequent research.

Author Contributions

Conceptualization, Y.P. and C.C.; methodology, Y.P. and C.C.; implementation, C.C. and J.L.; supervision, Y.P.; writing—original draft preparation, J.L. and C.C.; writing—review and editing, Y.P. and C.C. All authors have read and agreed to the published version of the manuscript.

Funding

This research was funded by the National Natural Science Foundation of China (52278076).

Data Availability Statement

The data presented in this study are available on request from the corresponding author.

Conflicts of Interest

The authors declare no conflict of interest.

References

  1. UN Habitat. World Cities Report 2019; United Nations Publications: New York, NY, USA, 2019. [Google Scholar]
  2. Hernantes, J.; Maraña, P.; Gimenez, R.; Sarriegi, J.M.; Labaka, L. Towards resilient cities: A maturity model for operationalizing resilience. Cities 2019, 84, 96–103. [Google Scholar] [CrossRef]
  3. Safa, M.; Jorge, R.; Eugenia, K.; Asrar, G.R.; Busalacchi, A.J.; Cahalan, R.F.; Cane, M.A.; Colwell, R.R.; Feng, K.; Franklin, R.S.; et al. Modeling sustainability: Population, inequality, consumption, and bidirectional coupling of the earth and human systems. Natl. Sci. Rev. 2016, 3, 470–494. [Google Scholar]
  4. Liu, Z.; Xiu, C.; Song, W. Landscape-based assessment of urban resilience and its evolution: A case study of the central city of Shenyang. Sustainability 2019, 11, 2964. [Google Scholar] [CrossRef]
  5. Chen, T.T.; Zhang, H. Impact of Intensive Land Use on Urban Economic Development in Beijing-Tianjin-Hebei Region. Urban Issues 2017, 6, 60–67. [Google Scholar]
  6. Lu, X.H.; Chen, D.L.; Kuang, B. Influence of Regional Integration on Urban Land Use Efficiency: A Case Study of Wuhan Urban Agglomeration. Urban Issues 2018, 3, 19–26. [Google Scholar]
  7. Chen, C.F.; Lu, X.H.; Liu, Q.; Chen, D.; Tan, J. Can Intensive Land Use in Cities Enhance the Quality of Economic Growth? Resour. Ind. 2019, 21, 67–74. [Google Scholar]
  8. Wang, W.T.; Wei, S.G. Does Population Agglomeration in Small Cities Save Public Costs? Financ. Trade Econ. 2016, 6, 146–160. [Google Scholar]
  9. Su, H.J. Urban Scale and Urban Well-being: Effects, Evaluation, and Development Orientation. J. Shenzhen Univ. (Humanit. Soc. Sci. Ed.) 2021, 38, 116–124. [Google Scholar]
  10. Yang, S.G.; Ding, J.H. Population spatial response and Social effects of polarization development: A case study of Pudong New Area, Shanghai. J. East China Norm. Univ. (Philos. Soc. Sci. Ed.) 2004, 05, 66–71. [Google Scholar]
  11. Bardhan, R.; Kurisu, K.; Hanaki, K. Does compact urban forms relate to good quality of life in high density cities of India? Case of Kolkata. Cities 2015, 48, 55–65. [Google Scholar] [CrossRef]
  12. Mouratidis, K. Compact city, urban sprawl, and subjective well-being. Cities 2019, 92, 261–272. [Google Scholar] [CrossRef]
  13. Mouratidis, K. COVID-19 and the compact city: Implications for well-being and sustainable urban planning. Sci. Total Environ. 2021, 811, 152332. [Google Scholar] [CrossRef]
  14. Zhou, J.R.; Zhao, H.F.; Wu, J.H. Evolution Characteristics of the Relationship between Intensive Land Use and Carbon Emissions in the Guanzhong Urban Agglomeration. Chin. J. Land Sci. 2017, 31, 55–61. [Google Scholar]
  15. Wang, Z.S.; Zhang, S.L.; Chen, F.; Hou, H.; Gao, K.; Zhou, X. Grey Relational Analysis of Intensive Land Use and Ecological Use in Urban Areas. Reg. Res. Dev. 2017, 36, 121–124. [Google Scholar]
  16. Lu, M.; Feng, H. Agglomeration and Emission Reduction: An Empirical Study on the Impact of Urban Scale Differences on Industrial Pollution Intensity. World Econ. 2014, 7, 86–114. [Google Scholar]
  17. Xiao, Z.Y.; Li, H.H.; Sun, L. Effects of Population and Industrial Agglomeration on Production and Living Pollution and Spatial Spillover. Resour. Environ. Yangtze River Basin 2022, 31, 851–861. [Google Scholar]
  18. Alexander, D.E. Resilience and Disaster Risk Reduction: An Etymological Journey. Nat. Hazards Earth Syst. Sci. 2013, 13, 2707–2716. [Google Scholar] [CrossRef]
  19. Holling, C.S. Resilience and stability of ecological systems. Annu. Rev. Ecol. Syst. 1973, 4, 1–23. [Google Scholar] [CrossRef]
  20. Shao, Y.W.; Xu, J. Urban Resilience: Concept Analysis Based on an International Literature Review. Int. Urban Plan. 2015, 30, 48–54. [Google Scholar]
  21. Alberti, M.; Marzluff, J.; Shulenberger, E. Integrating Humans into Ecosystems: Opportunities and Challenges for Urban Ecology. BioScience 2003, 53, 1169–1179. [Google Scholar] [CrossRef]
  22. Resilience Alliance. Urban Resilience Research Prospectus; CSIRO: Canberra, Australia, 2007. [Google Scholar]
  23. Jha, A.K.; Miner, T.W.; Stanton-Geddes, Z. Building Urban Resilience: Principles, Tools, and Practice; World Bank Publications: Washington, DC, USA, 2013. [Google Scholar]
  24. ARUP. The Rockefeller Foundation. City Resilience Framework; The Rockefeller Foundation: New York, NY, USA, 2014. [Google Scholar]
  25. Meerow, S.; Newell, J.P.; Stults, M. Defining Urban Resilience: A Review. Landsc. Urban Plan. 2016, 147, 38–49. [Google Scholar] [CrossRef]
  26. Chen, A.P. Agglomeration and urban economic resilience in China. World Econ. 2022, 45, 158–181. [Google Scholar]
  27. Zhang, S.S.; Ma, X.J.; Xiong, J.L. The impact of population agglomeration on urban resilience. Northwest. Popul. 2023, 44, 76–90. [Google Scholar]
  28. Feng, J.Y.; Liu, Y.L.; Wang, J. The impact of economic development and environmental pressure on urban resilience: A panel data analysis of 11 prefecture-level cities in Shanxi Province. Ecol. Econ. 2020, 36, 101–106. [Google Scholar]
  29. Williamson, J.G. Regional inequality and the process of national development: A description of the patterns. Econ. Dev. Cult. Change 1965, 13, 1–84. [Google Scholar] [CrossRef]
  30. Wang, Z.Y. Population Agglomeration and Regional Economic Growth: A Test of Williamson’s Hypothesis. Nanjing Soc. Sci. 2018, 3, 60–69. [Google Scholar]
  31. Liu, J.; Zhang, X.L.; Chen, H.B. Impact of Population Agglomeration in the Yangtze River Delta on High-Quality Economic Development. East China Econ. Manag. 2022, 36, 93–106. [Google Scholar]
  32. Yuan, J.D.; Zhang, J.; Wang, Y.C. Coupling Coordination and Driving Factors of Urban Resilience and Land Use Efficiency in the Yangtze River Delta Urban Agglomeration. J. Shaanxi Norm. Univ. (Nat. Sci. Ed.) 2023, 51, 72–83. [Google Scholar]
  33. Wang, W.M. Land Resource Management, 2nd ed.; Higher Education Press: Beijing, China, 2010. [Google Scholar]
  34. Peng, C.; Xiao, H.; Han, F. Spatial agglomeration evolution and differentiation characteristics of intensive land use in Chinese cities from 2003 to 2012. China Land Sci. 2014, 28, 24–31. [Google Scholar]
  35. Li, X.Q.; Jiang, B.; Chu, N.C. Coupling analysis of intensive land use in urban agglomerations and new urbanization: A case study of three major urban agglomerations in China. Resour. Environ. Yangtze Basin 2017, 26, 983–991. [Google Scholar]
  36. Zhang, M.D.; Weng, A.H. Optimization of industrial structure in Northeast China and coordination of intensive land use in cities. J. Nat. Resour. 2022, 37, 734–752. [Google Scholar]
  37. Gunderson, L.H.; Holling, C.S. Panarchy: Understanding Transformations in Human and Natural Systems; Island Press: Washington, DC, USA, 2001. [Google Scholar]
  38. Li, Y.; Zhai, G.F. Research on urban disaster resilience assessment and enhancement strategies in China. Planner 2017, 33, 5–11. [Google Scholar]
  39. Wang, X.L. Regional integration, economic resilience, and technological innovation. Sci. Sci. Manag. Sci. Technol. 2023, 44, 101–117. [Google Scholar]
  40. Lu, L.; Zhou, H.W.; Xu, Q.Q. Comprehensive evaluation and application research on urban resilience from the perspective of multidimensional associative networks. Urban Probl. 2020, 08, 42–55. [Google Scholar]
  41. Bai, L.M.; Xiu, C.L.; Feng, X.H.; Mei, D.W.; Wei, Y. Comprehensive assessment of urban resilience in China and its spatiotemporal differentiation characteristics. World Geogr. Res. 2019, 28, 77–87. [Google Scholar]
  42. Zheng, T.; Sun, B.D.; Wang, Y.X. Evaluation of resilient cities from the perspective of regional integration: A case study of the Yangtze River Delta region. Sci. Geogr. Sin. 2022, 42, 863–873. [Google Scholar]
  43. Qiu, Q.; Sung, J.; Davis, W.; Tchernis, R. Using spatial factor analysis to measure human development. J. Dev. Econ. 2018, 132, 130–149. [Google Scholar] [CrossRef]
  44. Wang, S.K. Types and selection of weight matrices in spatial econometric models. Econ. Math. 2013, 30, 57–63. [Google Scholar]
  45. Hoyland, B.; Moene, K.; Willumsen, F. The tyranny of international index rankings. J. Dev. Econ. 2012, 97, 1–14. [Google Scholar] [CrossRef]
  46. Li, Y. Research on Urban Disaster Resilience Measurement and Evaluation. Master’s Thesis, Nanjing University, Nanjing, China, 2017. [Google Scholar]
  47. Mei, D.W.; Xiu, C.L.; Feng, X.H.; Li, X.L.; Bai, L.M. Spatiotemporal changes and intrinsic mechanisms of urban vulnerability in China: Analysis based on the data of the Fifth and Sixth National Population Census and “China Urban Statistical Yearbook”. Urban Probl. 2018, 9, 13–19. [Google Scholar]
  48. Wu, Y.C. Can smart city construction enhance urban resilience? A quasi-natural experiment. Public Adm. Rev. 2021, 14, 25–44. [Google Scholar]
  49. Hogan, J.W.; Tchernis, R. Bayesian factor analysis for spatially correlated data, with application to summarizing area-level material deprivation from census data. J. Am. Stat. Assoc. 2004, 99, 314–324. [Google Scholar] [CrossRef]
  50. Fu, X.; Hopton, M.E.; Wang, X.H. Assessment of green infrastructure performance through an urban resilience lens. J. Clean. Prod. 2021, 289, 125146. [Google Scholar] [CrossRef] [PubMed]
  51. Sajjad, M.; Chan, J.C.L.; Chopra, S.S. Rethinking disaster resilience in high-density cities: Towards an urban resilience knowledge system. Sustain. Cities Soc. 2021, 69, 102850. [Google Scholar] [CrossRef]
  52. Huang, G.Y.; Li, D.Z.; Zhu, X.W.; Zhu, J. Influencing factors and their influencing mechanisms on urban resilience in China. Sustain. Cities Soc. 2021, 74, 103210. [Google Scholar] [CrossRef]
  53. Zhu, S.; Li, D.; Huang, G.; Chhipi-Shrestha, G.; Nahiduzzaman, K.M.; Hewage, K.; Sadiq, R. Enhancing urban flood resilience: A holistic framework incorporating historic worst flood to Yangtze River Delta, China. Int. J. Disaster Risk Reduct. 2021, 61, 102355. [Google Scholar] [CrossRef]
  54. Tang, D.C.; Li, J.N.; Zhao, Z.Q.; Boamah, V.; Lansana, D.D. The influence of industrial structure transformation on urban resilience based on 110 prefecture-level cities in the Yangtze River. Sustain. Cities Soc. 2023, 96, 104621. [Google Scholar] [CrossRef]
  55. Liu, Y.P. Measurement of urban resilience system development: An empirical study of 288 cities in China. Urban Dev. Res. 2021, 28, 93–100. [Google Scholar]
  56. Shi, L.Y.; Zheng, Q.Y.; Yang, M.; Liu, L. Concept, influencing factors, and evaluation research progress of urban resilience. Acta Ecol. Sin. 2022, 42, 6016–6029. [Google Scholar]
  57. Ying, C.; Li, J.L.; Liu, Y.C.; Zhang, H.; Tian, P.; Gong, H. Evolution of county-level urban resilience in the East China Sea coastal zone and its influencing factors. Acta Geogr. Sin. 2024, 79, 462–483. [Google Scholar]
  58. Sun, Y.; Zhang, L.C.; Yao, S.M. Evaluation of resilience degree of prefecture-level cities in the Yangtze River Delta from the perspective of social-ecological systems. China Popul. Resour. Environ. 2017, 27, 151–158. [Google Scholar]
  59. Fang, C.L.; Wang, Y. Comprehensive measurement and spatial differentiation characteristics of urban vulnerability in China. Acta Geogr. Sin. 2015, 70, 234–247. [Google Scholar]
  60. Su, H. Research progress on economic resilience. Econ. Dyn. 2015, 8, 144–151. [Google Scholar]
  61. Wang, S.B. Relationship and construction of social resilience and economic resilience. Explor. Contention 2016, 3, 2+4–8. [Google Scholar]
  62. Bai, L.M. Evaluation and Optimization Research on Urban Ecological Resilience of Changchun City from the Perspective of Landscape Pattern. Ph.D. Thesis, Northeast Normal University, Changchun, China, 2020. [Google Scholar]
  63. Koenker, R.; Bassett, G. Regression Quantiles. Econometrica 1978, 46, 107–112. [Google Scholar] [CrossRef]
  64. Zhang, Y.Q.; Liu, Q.L.; Li, X.Q. Coupling coordination research on urban resilience of the Yangtze River Delta urban agglomeration and new urbanization. Urban Probl. 2022, 5, 17–27. [Google Scholar]
  65. Li, Y.; Zhai, G.F.; Gu, F.M. Review on quantitative evaluation methods of urban infrastructure resilience. Urban Dev. Res. 2016, 23, 113–122. [Google Scholar]
  66. Jin, C.Y.; Wang, W.Q. Does the “pollution refuge hypothesis” really hold in China? An empirical test based on spatial VAR model. Int. Trade Issues 2016, 8, 108–118. [Google Scholar]
Figure 2. Study sample distribution.
Buildings 14 02564 g002
Table 2. Descriptive statistics of variables.
VariableIndicator MeaningMinMaxMeanStd. Dev
Explained variableURESUrban resilience0.1630.5560.3150.053
Explanatory variableULIULand intensive use0.1070.9950.1510.052
Control variableUrbanLevel of urbanization19.700100.00055.47415.006
InfrastructureLevel of infrastructure0.2982.9531.8660.338
TechnologyLevel of scientific research investment0.1519.3891.6181.205
InformationLevel of information development5.1787.8076.8170.317
OpenLevel of openness0.00013.1641.6331.648
LaborLevel of human capital0.0004.7092.4880.875
Table 3. Regression results of the impact of land intensive use on urban resilience.
VariableModel (1)Model (2)Model (3)Model (4)Model (5)Model (6)Model (7)
ULIU0.237 ***0.250 ***0.254 ***0.247 ***0.272 ***0.276 ***0.276 ***
(13.61)(14.04)(14.30)(13.72)(14.71)(14.93)(14.92)
Urban 0.000 ***0.000 ***0.000 ***0.000 ***0.000 ***0.000 ***
(3.40)(3.57)(3.67)(2.78)(3.39)(3.38)
Infrastructure 0.007 ***0.007 ***0.007 ***0.007 ***0.007 ***
(4.44)(4.46)(4.22)(4.42)(4.40)
Technology 0.002 **0.002 ***0.002 ***0.002 ***
(2.38)(2.80)(2.79)(2.79)
Information 0.011 ***0.012 ***0.012 ***
(5.40)(5.84)(5.64)
Open 0.001 ***0.001 ***
(3.58)(3.58)
Labor 0.000
(0.16)
Cons.0.234 ***0.214 ***0.200 ***0.198 ***0.130 ***0.121 ***0.121 ***
(90.30)(32.85)(27.61)(27.21)(8.94)(8.22)(8.22)
Time effectYesYesYesYesYesYesYes
Individual effectYesYesYesYesYesYesYes
R-squared0.8420.8430.8440.8440.8460.8460.846
Note: The t values are in brackets, with *, **, and *** representing statistical levels of 10%, 5%, and 1%, respectively.
Table 4. Robustness test of regression results: Bilateral winsorization to remove outliers.
VariableBilateral Winsorizing 1%Bilateral Winsorizing 5%
Model (1)Model (2)Model (3)Model (4)
ULIU0.449 ***0.545 ***0.756 ***0.840 ***
(14.28)(16.34)(16.18)(17.81)
Urban 0.000 *** 0.001 ***
(3.75) (7.04)
Infrastructure 0.008 *** 0.010 ***
(4.82) (6.27)
Technology 0.001 0.000
(1.17) (0.32)
Information 0.014 *** 0.011 ***
(6.37) (5.10)
Open 0.001 *** 0.002 ***
(4.61) (7.07)
Labor 0.003 0.011 ***
(1.55) (6.19)
Cons.0.205 ***0.065 ***0.166 ***0.008
(45.29)(4.00)(24.99)(0.48)
Time effectYesYesYesYes
Individual effectYesYesYesYes
R-squared0.8480.8540.8400.852
Note: The t values are in brackets, with *, **, and *** representing statistical levels of 10%, 5%, and 1%, respectively.
Table 5. Panel quantile regression results of the impact of land intensive use on urban resilience.
VariableModel (1)
OLS
Model (2)
Q10
Model (3)
Q25
Model (4)
Q50
Model (5)
Q75
Model (6)
Q90
ULIU0.276 ***
(14.93)
0.289 **
(2.18)
0.284 ***
(2.81)
0.277 ***
(3.99)
0.268 ***
(3.06)
0.263 **
(2.18)
Urban0.000 ***
(3.39)
0.000
(1.03)
0.000
(1.26)
0.000
(1.61)
0.000
(1.09)
0.000
(0.70)
Infrastructure0.007 ***
(4.40)
0.008
(1.42)
0.008 *
(1.74)
0.007 **
(2.27)
0.006
(1.55)
0.006
(1.02)
Technology0.002 ***
(2.79)
0.001
(0.49)
0.001
(0.76)
0.002
(1.35)
0.002
(1.29)
0.002
(1.04)
Information0.012 ***
(5.64)
0.008
(0.91)
0.009
(1.39)
0.011 **
(2.45)
0.014 **
(2.31)
0.015 *
(1.86)
Open0.001 ***
(−3.58)
0.000
(−0.23)
0.001
(−0.74)
0.001 *
(−1.79)
0.001 **
(−2.04)
0.002 *
(−1.78)
Labor0.000
(0.17)
0.000
(−0.000)
0.000
(0.02)
0.000
(0.08)
0.000
(0.10)
0.001
(0.09)
Time effectYesYesYesYesYesYes
Individual effectYesYesYesYesYesYes
Note: The t values are in brackets, with *, **, and *** representing statistical levels of 10%, 5%, and 1%, respectively.
Disclaimer/Publisher’s Note: The statements, opinions and data contained in all publications are solely those of the individual author(s) and contributor(s) and not of MDPI and/or the editor(s). MDPI and/or the editor(s) disclaim responsibility for any injury to people or property resulting from any ideas, methods, instructions or products referred to in the content.

