Abstract
Portal frames with built-up cold-formed cross-sections hold significant potential; however, there is a notable gap in the analysis of cross-section types and connections. In this study, an optimization algorithm was developed for the closed cross-sections of portal frame members. An optimization algorithm was tested against optimized open cold-formed cross-sections. The results indicated a portal frame volume up to 38% lower where members were assembled of optimal closed cross-sections when compared to frames with optimal open cross-sections. Parametric analysis was carried out, where two types of cross-sections were examined: Type A, with four web stiffeners bent inwards, and Type B, with four web stiffeners bent outwards. The optimization was conducted using a Genetic Algorithm in MATLAB R2022b. Portal frames with optimal Type B cross-sections had a volume that was up to 22% lower when compared to frames with optimal Type A cross-sections. Significant differences were noted between the optimal beam and column cross-sections, with the optimal column cross-section thickness being on average 74% greater, but the optimal beam cross-section height being on average 81% greater than those of the respective counterparts. In this article, a practical assembly solution for the connection of the frame members was proposed for the optimized novel closed cross-section types in portal frames. However, the strength and stiffness of these connections were not analyzed in this research.
1. Introduction
Cold-formed thin-walled structures have found their application in different structures for their sustainability, economical savings, and weight reduction [1,2]. However, several issues must be addressed to effectively use thin-walled structures in load-bearing applications, which include stability issues, the need for specifically adapted structural calculation methods, and the complexity of connection designs. Under compression, bending, or combined loading, thin-walled structures are prone not only to global buckling modes, similar to regular members, but also to local buckling of the plate parts, distortional buckling of the cross-section bends and stiffeners, and combinations of these effects.
Extensive research has been dedicated to analyzing the stability issues of thin-walled structures. Dubina and Ungureanu [3] in their research on interactive buckling modes of thin-walled column cross-sections concluded that the design approach should be capable of handling interactive local–distortional failures for both columns and beams. Gatheeshgar et al. [4] analyzed shear design provisions in EN1993-1-3 and concluded that these provisions provide overly conservative predictions for cold-formed cross-sections.
Specifically adapted techniques are necessary for analyzing thin-walled members, especially under compression or bending loads. One type of buckling, local buckling of the cross-section, was traditionally analyzed using the Effective Width Method, which evaluates the effects of local buckling on the plate components of the cross-section [5]. Another analytical calculation method applied to the analysis of thin-walled structures is the Direct Strength Method, which was adopted in North American cold-formed steel design specifications in 2004 [6]. Thin-walled member resistance is calculated using the Direct Strength Method by considering local, distortional, and global buckling modes [7]. The Finite Element Method was developed to simulate the realistic structural response of thin-walled structures, typically validated through experimental studies [8]. Another widely used method is the Finite Strip Method [9], which has since evolved into the Constrained Finite Strip Method [10]. Both this method and the Generalized Beam Theory [11] are extensively used for linear buckling analysis and buckling mode decomposition [12]. Finally, empirical and semi-empirical methods utilize experimental data to derive design formulas and guidelines, as seen in the design provisions of the American Iron and Steel Institute [13], the Australian/New Zealand Standard [14], and Eurocode 3 [15].
The optimization of cold-formed cross-sections in members is a frequent research topic. Shimoda et al. [16] proposed a parameter-free method for optimizing the cross-section shape of thin-walled structures. It is known that incorporating stiffeners into the cross-section is one of the most effective solutions for addressing local buckling issues in thin-walled structures. Li and Young [17] compared Z sections with varying edge stiffener shapes and they found that implementing edge stiffener to the Z-shape profile may increase the bending resistance of the profile by up to 53%. Recently, Jůza and Jandera [18] have developed a numerical model of a compressed stainless steel thin-walled element with an intermediate stiffener.
Analyzing connections in thin-walled structures, particularly rigid or semi-rigid types, presents an even greater challenge. This is especially critical in frame structures, where the stability and displacements of the structure heavily depend on the rigidity of the connections [19]. Disturbed regions are induced in beam–column joints [20,21] and as a result this is where the portal frames collapse may begin [22]. Chen et al. [23] proposed an equation to predict the moment capacity of the portal frame apex bracket for built-up open cross-section members. Other research has focused on applying the component method from Eurocode 3-1-8 [24] for determining the rigidity of thin-walled connections, where the component method was successfully applied to open built-up members connected with bolts using a gusset plate [25]. Advances have also been made in numerical methods, for instance in analyzing connections with fasteners, where practical the Finite Element Method model was proposed, which accurately captures plate–fastener interactions [26]. Despite these efforts, there remains a lack of research in this field, particularly regarding semi-rigid connections and connections for portal frame members assembled of closed cold-formed thin-walled cross-sections.
Extensive research has been conducted on optimizing thin-walled members. Xiao et al. [27] optimized open and closed built-up column cross-sections and managed to enhance the resistance of the cross-sections by 21% for closed and 91% for open cross-sections. Gatheeshgar et al. [28] optimized the Sigma shape profile for beams and proposed innovative designs where the flexural capacity was enhanced by up to 60%. Parastesh et al. [29] optimized the Z-profile for beam–column applications and increased the strength of short members by 62%, the medium length by 92%, and the long members by 188% when compared to standard Z-profiles.
Limited optimization efforts have been dedicated to portal frames constructed from cold-formed thin-walled cross-sections. Previous research was focused on optimizing portal frames using cold-formed built-up open cross-sections [30]. In this recent study, researchers resolved the optimization of portal frames featuring semi-rigid column–beam connections, evaluating the impact of stressed-skin action. The frame members were formed by connecting two cold-formed C-profiles back-to-back. Using Limit State analysis, researchers applied a Genetic Algorithm to solve the optimization problem. They concluded that the cost of the portal frames can be reduced by 53% for structures with two internal portal frames and by 42% for structures with three internal portal frames when stressed-skin action is considered.
Another investigation aimed to enhance the performance of a portal frame constructed from cold-formed built-up open cross-sections, incorporating knee braces and pinned column–beam connections [31]. The open cross-section was optimized using the Genetic Algorithm, where calculations were based on Eurocode standards. The optimal beam pitch was identified at the minimum value, with a frame spacing of 4.30 m optimal under Ultimate Limit State conditions, and 2.21 m optimal when considering both Ultimate Limit State and Serviceability Limit State criteria.
Recent studies on portal frames have focused on cold-formed cross-sections, analyzing only open cross-section members assembled from C-profiles, and developing their connections [30,31,32,33]. However, closed cold-formed cross-sections in portal frames have not yet been analyzed. One reason for the lack of attention to closed cross-sections in portal frames is the difficulty in forming connections between members composed of thin-walled closed cross-sections. This research aims to address these gaps by formulating an optimization problem for portal frames constructed with closed built-up thin-walled cross-sections, analyzing optimal column and beam cross-sections within the same frame, considering factors such as the shape and thickness of the cross-section. Because the connection of members in frames is the key when considering cross-section application, this paper also introduced a novel solution for the connection design of members with the proposed cross-sections.
2. Formulation of the Optimization Problem
In this article, the goal was to formulate an optimization problem for different cross-section types of built-up members in portal frames. An optimization algorithm was considered for varying frame geometries and loadings.
2.1. Objective for the Optimization Problem
In this article, the chosen optimization objective was to minimize the volume of a simply supported portal frame with rigid connections under defined loading, by optimizing the cross-sections of the portal frame members. Symmetrical portal frame geometry was considered. The cross-section of the members was assumed to be constant along their length, allowing the volume of the members to be expressed as the product of the cross-sectional area and the member length. Therefore, the optimization objective function was formulated as follows:
In this study, thin-walled cross-sections were analyzed, where the cross-sectional area of each member is assumed to be the product of the midline perimeter and the thickness. The most variables are required for a problem where both the thickness and the cross-sectional outline is simultaneously optimized. This approach is the most versatile and it generally yields the most effective results.
2.2. Variables for the Optimization Problem
The shape of the beam and column cross-sections were defined by the coordinates of cross-section corners and stiffener bends. These coordinates, along with the cross-section thickness of the column and the beam, were the variables in the optimization problem. Variables for the optimization problem are given in Table 1.

Table 1.
Variables for the optimization problem.
2.3. Constraints for the Optimization Problem
Constraints for the optimization problem of the portal frame can be categorized into three general groups: geometrical restrictions for the variables, structural requirements, and lower and upper bounds for the variables. The constraints for the optimization problem were defined as follows:
The constraint function defines geometrical restrictions, such as preventing intersections within the cross-section or width-to-thickness ratio of the plate parts. The constraint function refers to the structural requirements of the analyzed portal frame and its members. For this optimization problem, a portal frame assembled from cold-formed thin-walled profiles was considered. Thus, structural requirement constraints, based on the requirements from design codes, specifically Eurocodes, were implemented. These include verifications for the Ultimate and Serviceability Limit States. The constraints for structural requirements were defined as follows:
The design buckling resistance of the column and the beam was defined by the Ultimate Limit State requirements. For the Serviceability Limit State, the largest horizontal and vertical displacements were evaluated against the largest allowed displacements of the frame nodes.
The design buckling resistance of the column and the beam was defined based on the methodology provided in Eurocode 3 for frame members with effective cross-section properties. The resistance of the portal frame column and beam was verified using the interaction formula specified in Eurocode 3-1-3 [15] while considering the additional bending moment resulting from the shift in the centroid:
Linear Finite Element Method calculations for forces and displacements were incorporated into the optimization algorithm. The stiffness matrix [34] of the frame members was defined based on the effective cross-sectional properties:
Two separate Finite Element Method simulations were incorporated into the optimization algorithm: one for analyzing member resistance and another for calculating displacements, incorporating constraints. Nodal displacements were determined as follows [34]:
The global force vector of the frame represents either ULS or SLS loading. Forces in each member were calculated [34]:
Effective cross-section parameters were computed by accounting for both the local buckling of plate sections within the cross-section and the distortional buckling of cross-section stiffeners. The influence of local buckling was assessed using the Effective Width Theorem, which involves reducing the plate width based on a calculated reduction factor [35]:
Distortional buckling of the stiffeners was evaluated by reducing the cross-section area of the stiffeners [35]:
To determine the stress distribution in the cross-sections, Finite Element Method analysis was incorporated into the optimization algorithm again. Starting forces in the frame members were calculated with gross cross-section properties.
The cross-section analysis algorithm utilized in the optimization problem has been detailed and validated in recent research [36], where different cross-sections were analyzed by defining each bent-in web as a separate web stiffener. These stiffeners are illustrated in Figure 1.

Figure 1.
Assembly of column and beam cross-section: (a) Type A; (b) Type B.
3. Structure for Optimization Examples
The closed cross-section shape was assembled of two Sigma profiles connected at their overlapping flanges, reinforced with web stiffeners [37]. The flange width was considered wider for attachment of claddings, and other cross-section part widths were considered for production restrictions. Figure 1 illustrates the assembly of this cross-section.
The closed configuration of the column cross-section was found to be more effective due to its increased resistance to torsional buckling and buckling according to the weak axis, when compared to open cross-sections.
The connection between the beam and column should be considered in portal frames. With the proposed cross-sections for columns and beams, members can be connected by cutting certain column parts and inserting the beam, as illustrated in Figure 2. Fasteners could be used to connect the overlapping parts. This connection is assumed in the optimization problem as a rigid connection.
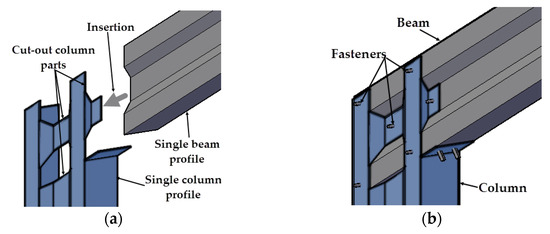
Figure 2.
Assembly of the column and beam connection with possible fastener positions: (a) profile of a column and beam profile cut for connection; (b) assembled proposed column–beam connection.
3.1. Cross-Section Geometry Definition
Variables for the optimization problem were defined to identify the optimal newly proposed cross-section for portal frames. Figure 3 illustrates the variables used for each cross-section type in columns and beams.

Figure 3.
Variables for the optimization problem and cross-section type selection.
The variables represent the coordinates defining the first quarter of the column and beam cross-section. The remaining sections are generated by mirroring these coordinates along the y and z axes.
Two types of column and beam cross-sections were analyzed, both featuring a closed outline with web stiffeners. Type A cross-sections were rectangular with web stiffeners bent inward. Conversely, Type B cross-sections had web stiffeners bent outwards. These cross-section types are given in Figure 1 and Figure 3. The key difference between these types is the distance of the web plate from the center of the cross-section. The Type B cross-section was expected to be more resistant to buckling according to the z-z axis due to an increased moment of inertia according to this axis when compared to the Type A cross-section.
Geometrical cross-section constraints were used in optimization problems. For frames with Type A and Type B cross-sections, these constraints were as follows:
Both the columns and the beams had the same cross-section types assigned to the same frame configuration.
3.2. Structure Geometry
The cross-sections of various frame geometries, characterized by span, column height, beam pitch, and frame spacing, can be optimized using the formulated optimization problem. Figure 4 illustrates the frame geometry for the optimization problem.
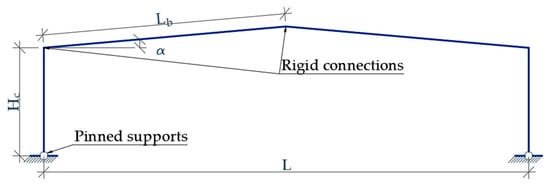
Figure 4.
Geometry of the portal frame for the optimization problem.
Two-hinge frames were chosen for the analysis, defining hinges at the column bases. The frame configuration assumes a simply supported design, supported by bracing beams and purlins. The buckling lengths of columns and beams are defined to suit this bracing arrangement.
3.3. Portal Frame Loading and Displacements
The portal frame was designed to withstand practical loads as specified by Eurocodes, which include dead, snow, and wind loads. The dead load of the column cladding is applied directly to the top of the column. The loads are illustrated in Figure 5, outlining the basic load configuration for clarity and reference in the analysis.
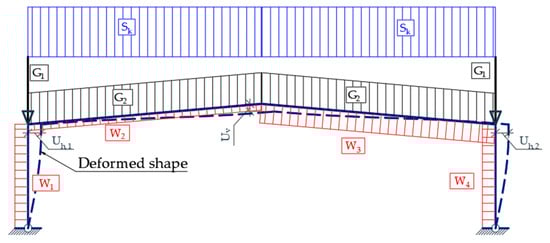
Figure 5.
Basic load configuration on the portal frame: Sk—snow load; G1—dead load on columns; G2—dead load on beams; and W1, W2, W3, and W4—calculated wind loads on members according to design codes.
In Figure 5, the general deformed shape of the structure is given in dashed lines. This deformed shape is constant with each optimized solution under predefined loading with varying displacement values.
4. Optimization Algorithm
The optimization problem was solved using the Genetic Algorithm [34] within the MATLAB R2022b optimization toolbox [38]. The Genetic Algorithm showed efficiency in similar constrained minimization problem solving. It is effective in finding the global minimum because it randomly picks solutions and then improves them. However, more complicated problems may take longer periods of time to solve. This algorithm is the most popular and is widely used in solving optimization problems of different structures, including those containing cold-formed members.
Before initiating the optimization, certain solver settings must be configured. It was observed that minimizing the number of elite members while maximizing the population size yields solutions with higher fitness values. However, increasing the population size also extends the time required to solve the optimization problem. In this study, the number of elite members was set to 1, and the population size was set to 1000.
The optimization variables, objective function, and constraint function from Section 2 and Section 3 of this paper are implemented into the optimization algorithm. The flowchart of the optimization algorithm is presented in Figure 6.
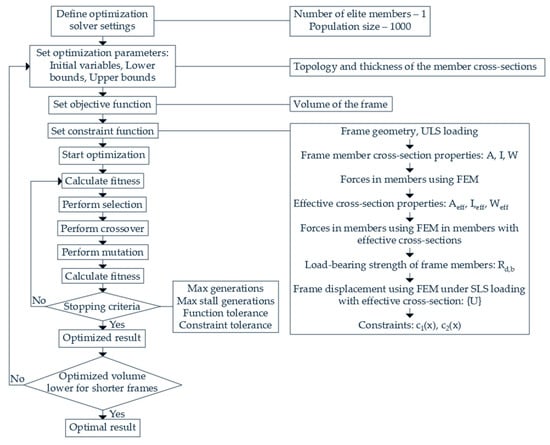
Figure 6.
Optimization algorithm flowchart.
The Genetic Algorithm operates by generating a population of potential solutions and evaluating them based on the performance of an objective function. The algorithm then ranks these solutions and selects those with higher fitness values to generate a new population. Elite solutions, which represent the best individuals in the current population, are automatically passed to the next generation to ensure that high-quality solutions are retained.
To create new solutions, the algorithm performs crossover operations, where pairs of selected solutions combine their genetic information. Additionally, random changes, or mutations, are introduced to some solutions to maintain genetic diversity within the population.
Once a new solution is generated, its fitness is calculated using the objective function. The optimization process continues until one of the specified stopping criteria is met. These criteria include the following:
- Maximum Generations: The algorithm stops when the specified number of generations is reached. Set to 2000;
- Maximum Stall Generations: The algorithm stops if there is no significant improvement in fitness values over a set number of generations. Set to 50;
- Function Tolerance: The algorithm stops when the average relative change in fitness values over a specified number of generations falls below a certain threshold. Set to 0.000001;
- Constraint Tolerance: This criterion determines the feasibility of solutions concerning nonlinear constraints but is not a stopping criterion. Set to 0.001.
To overcome local extremums, possible with the Genetic Algorithm, the optimization problem was restarted with varied initial points in cases where frames with a higher column length had a smaller optimized volume than those with a shorter column length.
Validation of Optimization Algorithm through Comparative Analysis
After an extensive literature search and review, the conclusion was made that there is a lack of optimization problems solved for cold-formed portal frames, making it difficult to validate the optimization of such frames. Phan et al. [31] optimized an open cross-section outline with a constant thickness, beam pitch and spacing of 13.6 m span, and 5.4 m-column-height frames with knee braces.
The verification of the optimization algorithm described in this article was performed for the same-thickness closed cross-sections. The volume of the frame with optimized closed cross-sections was 3% higher. A very similar optimal frame volume when optimizing open and closed cross-sections with a predefined thickness shows a good compliance between optimization algorithms.
Cross-section constraints were modified to examine closed cross-section performance in the same frame geometry and loading conditions. The optimization algorithm was performed with a free thickness variable and a height constrained to be not higher than the optimal Phan et al. cross-section. The volume of the optimized closed cross-section frame was 21% lower. When the cross-section geometry had no height or thickness restrictions, the volume of the frame with optimal closed member cross-sections was 38% lower. These results and optimized cross-sections are given in Table 2.
Table 2.
Comparison of optimal cross-sections.
The results indicate that the volume of frame members with optimized cross-sections under the restriction of the same cross-section thickness is very similar whether the optimization was performed for an open cross-section by Phan et al. or by the optimization algorithm provided in this paper for the closed cross-section. However, when the thickness is unconstrained in the optimization algorithm in this article, the frame volume can be reduced greatly when using closed cold-formed cross-sections for members.
5. Optimized Examples and Discussion
We determined the optimized member cross-sections for portal frames spanning L = 12 m, 18 m, and 24 m, with column heights of Hc = 4 m, 5 m, and 6 m, a beam angle of α = 5 degrees, and a frame spacing of 3 m. The frame geometry is given in Figure 4. Previous studies have demonstrated the efficiency of a minimal beam pitch for portal frames constructed with cold-formed sections [31].
Various load conditions were considered. These included, with characteristic values, a snow load of 4.8 kN/m, dead loads of 1.2 kN/m for columns, and 2.4 kN/m for the roof. The calculated wind pressure was 1.65 kN/m, the pressure coefficients corresponding to W1 and W4 were 0.6, the coefficient corresponding to W2 was 0, and corresponding to W3 was 0.6. S355NC (fy = 355 MPa) [39] steel was considered. Values of the partial safety factors and combination coefficients used in the Ultimate Limit State (ULS) and Serviceability Limit State (SLS) analysis are given in Table 3.
Table 3.
Portal frame loading combinations.
The maximum allowed displacements for the SLS load combination were set to Hc/400 for horizontal and L/400 for vertical displacements, where Hc is the height of the column and L is the span of the frame.
Type A optimal cross-section shapes were similar to I-shapes, which are known for a high bending capacity according to the strong cross-section axis. The stiffeners were positioned near the flanges to increase the effective cross-sectional area away from the center. However, the best performing were the Type B optimal cross-sections, because the columns were subjected to buckling according to the weak cross-section axis as well.
The portal frame with optimal Type B member cross-sections demonstrated the smallest volume. These optimal Type B cross-sections were rectangular in shape, with stiffener bends positioned close to the flanges. Portal frames utilizing these cross-sections exhibited a volume reduction of 17% to 22% compared to frames with optimal Type A cross-sections. Figure 7 illustrates the comparison of the optimal column and beam volumes between the two types, with the area between the lines indicating the difference. Detailed parameters of optimal cross-sections are provided in Table 4.
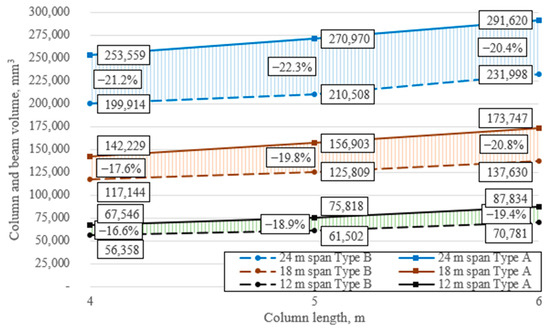
Figure 7.
Volume of the optimized portal frame.
Table 4.
Optimal portal frame member parameters.
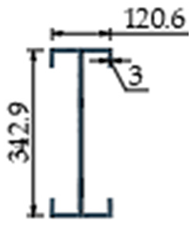
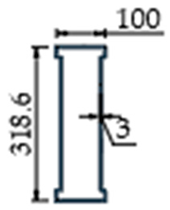
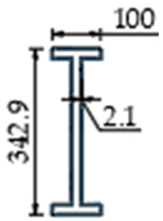
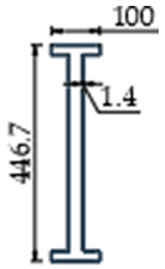
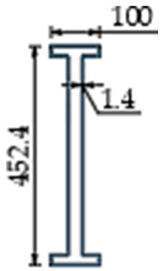
On average, beam cross-section heights were 81% greater than those of columns. Figure 8 illustrates the optimized Type A and Type B cross-sections, depicting their scale in terms of thickness-to-width ratio, with thin lines indicating ineffective parts of the cross-section plates due to local buckling.
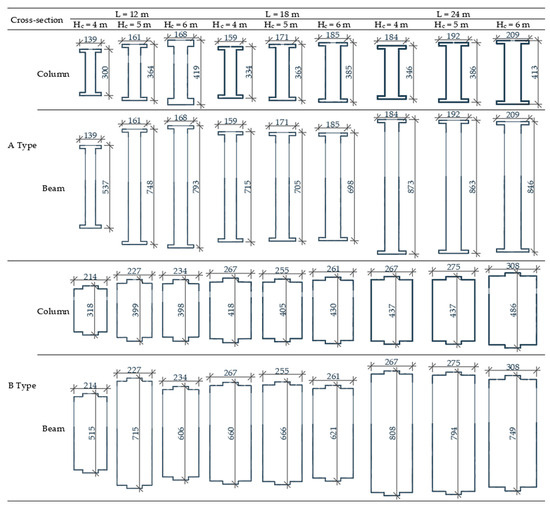
Figure 8.
Cross-sections of optimized frame members.
When analyzing the optimal cross-section shapes of frame members with varying column heights within the same span, certain expected dependencies become clear. For Type A optimal columns and beams with a 12 m span, the heights of the cross-sections generally increase with the column height. However, in many instances, especially for Type B optimal beam cross-sections, the cross-section height decreases as the column height increases. This trend is particularly evident in a 12 m span frame with column heights of 5 m and 6 m for Type B optimal cross-sections. The frame with a 6 m column height has smaller optimal Type B cross-section heights compared to the same frame with shorter columns. Nonetheless, the cross-sections of frames with 6 m columns are wider and have thicker cross-sections, resulting in a higher cross-sectional area.
For instance, in a 12 m span frame with a 6 m column height, the optimal cross-sectional area is 3198 mm² for the column and 2690 mm² for the beam. Conversely, for the same frame with 5 m columns, the optimal Type B cross-sectional area is smaller, with 2960 mm² for the column and 2648 mm² for the beam.
These variations can be attributed to the increased buckling length of the column along both cross-sectional axes as the column height increases. The width of the column cross-section increases to enhance buckling resistance along the weaker axis. Since the beam’s width is designed to match that of the column, the height of the optimal beam cross-section decreases accordingly. As a result, the buckling resistance of the column and the beam with optimal cross-sections were utilized at maximum according to both the strong and weak axis.
Optimal frame members with Type B cross-sections showed a total cross-sectional area for columns and beams that was 18% to 24% smaller, compared to those with Type A optimal cross-sections. Figure 9 illustrates the combined optimal frame column and beam cross-sectional areas, where the shaded area indicates the percentage difference between Type A and Type B cross-sections. The combined cross-section area of the column and beam increased significantly with an increased span of the frame; however, the cross-section area varied slightly with a varying column height.
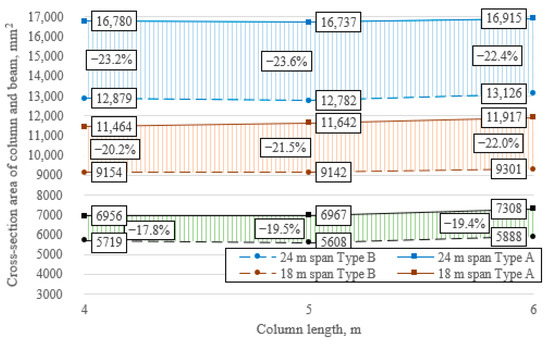
Figure 9.
Cross-section area of optimized frame members.
The optimal column cross-sections had a slightly higher cross-section area when compared to optimal beam cross-sections. This ratio was similar through all portal frame variants. This can be explained by an increased axial load on the portal frame columns carried by longer beams. Figure 10, Figure 11 and Figure 12 present the optimal column and beam cross-section areas for frames spanning 12 m, 18 m, and 24 m, respectively. In these figures, the shaded area illustrates the ratio between the column and beam cross-section areas.
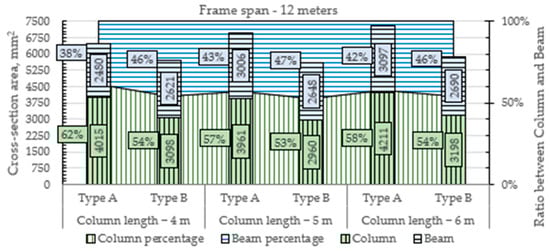
Figure 10.
Cross-section area of optimized 12 m span frame members.
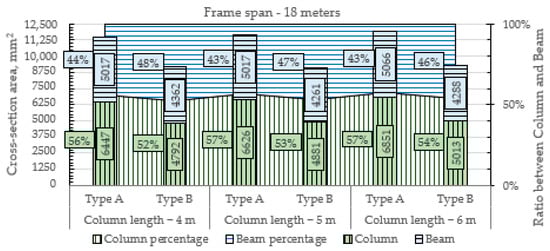
Figure 11.
Cross-section area of optimized 18 m span frame members.
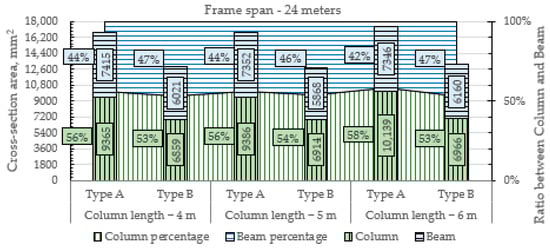
Figure 12.
Cross-section area of optimized 24 m span frame members.
In the analyzed cases of proposed cross-section types, the optimal cross-sections of frame members maximized their capacity utilization. However, frames with optimal cross-sections did not reach the maximum allowed displacement.
The height difference between optimal Type A and Type B columns varied significantly, with Type B column cross-section heights ranging from 16% smaller to 26% higher. On average, Type B optimal column cross-section heights exceeded Type A cross-section heights by 9%. Conversely, for beams, Type B optimal cross-section heights ranged from 4% to 23% smaller when compared to Type A. Type B beam cross-sections were on average 9% smaller in height. While in columns cross-section height reduction is not constant over different frame variants, clearly smaller in height were Type B optimal cross-sections. This height reduction in beam cross-sections occurs as a result of a wider cross-section width in optimal Type B cross-sections.
In terms of width, a consistent trend appeared where Type B cross-sections were wider, averaging 51% greater in width when compared to Type A cross-sections across all variants. The greater width of Type B optimal cross-sections was a consequence of stiffener arrangement. The web in this configuration was positioned further from the center than the flange edge. Flange width was smaller for Type B optimal cross-sections when compared to Type A optimal cross-sections.
Type A optimal columns exhibited the thickest cross-sections, averaging 30% thicker than Type B optimal columns and 93% thicker than Type A optimal beam cross-sections. On the other hand, Type B optimal columns were, on average, 55% thicker than Type B optimal beams. It is observed that smaller cross-section sizes with a consequence of decreased member stiffness in optimal cross-sections were compensated by an increased thickness.
The lower height and increased thickness of optimal column cross-sections were significant factors contributing to smaller ineffective areas. On average, Type A optimal column cross-sections exhibited a 28% ineffective area, whereas Type B optimal column cross-sections had a moderately smaller ineffective area of 19%. These percentages were higher for beam cross-sections, reaching 41% for Type A and 34% for Type B.
Summarizing the optimized results, optimal beam cross-sections had a slightly smaller cross-section area, being higher in cross-section height because of a dominant bending moment. On the other hand, optimal column cross-sections were thicker and more compact because of the dominant compressive force.
This study showed the important role of cross-sectional geometry in optimal cold-formed steel structures. Although larger cross-section sizes generally enhance overall stiffness, the higher width-to-thickness ratio increases the ratio of ineffective areas in the plates due to local buckling.
The developed optimization algorithm in this article proved to be adaptable to different constraints, portal frame geometries, and loadings. The optimization algorithm was specifically adapted for closed cold-formed thin-walled cross-sections, which have not been analyzed before. Two closed cross-section types, built of simple Sigma profiles, were optimized using this optimization algorithm. However, optimization examples could expand to different cross-section types with varying stiffener amounts.
Connections in frames are also especially important, because they have a rotational stiffness. This stiffness has a high impact on the stress and displacement of the frame. However, it is complicated to implement a connection stiffness calculation to the optimization algorithm, because it is dependent on frame member cross-sections, which are not constant in the optimization problem. The proposed frame connection for the optimized examples could be a good starting framework for the implementation of connection stiffness analysis into the optimization problem.
6. Conclusions
Open cold-formed built-up cross-sections were always used for frame structures; however, this study extended closed built-up cross-section applicability for portal frames and determined optimal member cross-sections.
The optimization algorithm of the cold-formed thin-walled cross-sections in portal frames composed in this paper based on the Genetic Algorithm allowed us to determine optimal cross-section shape and thickness.
The requirements by the design codes for actions and for steel structures are implemented in the portal frame optimization algorithm, allowing the application of this algorithm in the practical design of thin-walled portal frames.
This article presented a parametric optimization case study of portal frames, with column heights ranging from 4 to 6 m and spans ranging from 12 to 24 m. The results provide a foundation for future parametric comparisons when applying various portal frame optimization goals.
Closed rectangular cross-sections with web stiffeners bent inwards, named Type A, and bent outwards, named Type B, were selected for optimization. The analysis of optimal frame member cross-sections highlighted that Type B cross-sections, characterized by a wider and thinner profile, offered material savings of up to 22% compared to Type A cross-sections.
Columns and beams with optimal cross-sections had similar cross-sectional areas, although columns featured on average 74% thicker sections because of a high compressive force. However, beams on average had an 81% higher optimal cross-section height because of a dominant bending moment.
Author Contributions
Conceptualization, M.S. and A.D.; methodology, M.S. and A.D.; software, M.S.; validation, M.S. and A.D.; formal analysis, M.S. and A.D.; investigation, M.S.; resources, M.S.; data curation, M.S. and A.D.; writing—original draft preparation, M.S. and A.D.; writing—review and editing, M.S. and A.D.; visualization, M.S.; supervision, A.D.; project administration, M.S.; funding acquisition, M.S. All authors have read and agreed to the published version of the manuscript.
Funding
This research received no external funding.
Data Availability Statement
Data are contained within this article.
Conflicts of Interest
The authors declare no conflicts of interest.
Glossary
| Notation | |||
| SLS | serviceability limit state | horizontal displacement | |
| ULS | ultimate limit state | maximum allowed horizontal displacement | |
| cross-section area of the beam | global displacement vector of the frame | ||
| cross-section area of the column | vertical displacement | ||
| cross-section area of the i-th member | maximum allowed vertical displacement | ||
| cross-section area of the i-th stiffener | Wi | wind load on portal frame members | |
| reduced cross-section area of the i-th stiffener | width of the i-th cross-section plate part | ||
| [BC] | boundary condition matrix | effective width of the i-th section plate part | |
| E | elasticity modulus | i-th constraint function | |
| global force vector | f | optimization objective function | |
| Gi | dead load on columns and beams | local force vector | |
| length of the column | fy | yielding strength | |
| moment of inertia of the i-th member | basic yield strength | ||
| global stiffness matrix of the frame | h | height of the cross-section | |
| L | portal frame span | k | number of stiffeners |
| length of the beam | stiffness matrix for members | ||
| length of the i-th member | lb | lower bounds | |
| buckling resistance to bending of the beam | n | number of variables | |
| buckling resistance to bending of the column | t | thickness of the cross-section | |
| bending moment in the beam for eff. sections | ub | upper bounds | |
| bending moment in the column for eff. sections | displacement vector of the i-th member | ||
| buckling resistance for torsion of the beam | i-th variable | ||
| buckling resistance for torsion of the column | shift of the centroid for beam cross-section | ||
| buckling resistance at y-y axis of the beam | shift of the centroid for column cross-section | ||
| buckling resistance at y-y axis of the column | α | portal frame beam pitch | |
| buckling resistance at z-z axis of the beam | γG | partial safety factor of the permanent action | |
| buckling resistance at z-z axis of the column | γQ | partial safety factor of the variable action | |
| axial force in the beam for eff. cross-sections | partial safety factor of the material | ||
| axial force in the column for eff. cross-sections | reduction factor of the i-th section plate part | ||
| design buckling resistance of the beam | compressive stress at the centerline of stiffener | ||
| design buckling resistance of the column | reduction factor of the stiffener cross-section | ||
| Sk | snow load | ψ0 | combination factor |
References
- Usefi, N.; Sharafi, P.; Mortazavi, M.; Ronagh, H.; Samali, B. Structural performance and sustainability assessment of hybrid-cold formed modular steel frame. J. Build. Eng. 2021, 34, 101895. [Google Scholar] [CrossRef]
- Liu, C.; Chen, X.; Mao, X.; He, L.; Yuan, J. Study on flexural and demountable behavior of a modular light-gauge steel framed wall. J. Civ. Eng. Manag. 2023, 29, 143–156. [Google Scholar] [CrossRef]
- Dubina, D.; Ungureanu, V. Local/distortional and overall interactive buckling of thin-walled cold-formed steel columns with open cross-section. Thin-Walled Struct. 2023, 182, 110172. [Google Scholar] [CrossRef]
- Gatheeshgar, P.; Bock, M.; Chandrasiri, D.; Suntharalingam, T. Assessment of Eurocode shear design provisions for cold-formed steel sections. Structures 2023, 47, 2066–2073. [Google Scholar] [CrossRef]
- de Miranda Batista, E. Local-global buckling interaction procedures for the design of cold-formed columns: Effective width and direct method integrated approach. Thin-Walled Struct. 2009, 47, 1218–1231. [Google Scholar] [CrossRef]
- Schafer, B.W. Review: The Direct Strength Method of cold-formed steel member design. J. Constr. Steel Res. 2008, 64, 766–778. [Google Scholar] [CrossRef]
- Camotim, D.; Martins, A.D.; Dinis, P.B. Towards the next-generation design of cold-formed steel structures. In Recent Trends in Cold-Formed Steel Construction; Yu, C., Ed.; Elsevier: Amsterdam, The Netherlands, 2024; pp. 101–173. [Google Scholar] [CrossRef]
- Zhang, J.H.; Young, B. Finite element analysis and design of cold-formed steel built-up closed section columns with web stiffeners. Thin-Walled Struct. 2018, 131, 223–237. [Google Scholar] [CrossRef]
- Chaudhari, S.R.; Maheshwari, P.B. Finite strip method for the analysis of diaphragm supported cylindrical shell. Mater. Today Proc. 2019, 28, 846–851. [Google Scholar] [CrossRef]
- Hoang, T.; Adany, S. New transverse extension modes for buckling analysis of thin-walled members by using the constrained finite strip method. Thin-Walled Struct. 2022, 179, 109634. [Google Scholar] [CrossRef]
- Bebiano, R.; Camotim, D.; Gonçalves, R. GBTUL 2.0—A second-generation code for the GBT-based buckling and vibration analysis of thin-walled members. Thin-Walled Struct. 2018, 124, 235–257. [Google Scholar] [CrossRef]
- Ádány, S.; Schafer, B.W. Generalized constrained finite strip method for thin-walled members with arbitrary cross-section: Primary modes. Thin-Walled Struct. 2014, 84, 150–169. [Google Scholar] [CrossRef]
- AISI S100-16; North American Specification for the Design of Cold-Formed Steel Structural Members. AISI: Washington, DC, USA, 2016.
- AS/NZS 4600:2005; Cold-Formed Steel Structures. Australian/New Zealand Standard: Sydney, Australia, 2005.
- EN 1993-1-3; Eurocode 3: Design of Steel Structures—Part 1–3: General Rules—Supplementary Rules for Cold-Formed Members and Sheeting. European Committee for Standardization: Brussels, Belgium, 2006.
- Shimoda, M.; Liu, Y.; Ishikawa, K. Optimum shape design of thin-walled cross sections using a parameter-free optimization method. Thin-Walled Struct. 2020, 148, 106603. [Google Scholar] [CrossRef]
- Li, Q.Y.; Young, B. Experimental and numerical investigation on cold-formed steel zed section beams with complex edge stiffeners. Thin-Walled Struct. 2024, 194, 111315. [Google Scholar] [CrossRef]
- Jůza, J.; Jandera, M. Distortional buckling resistance of intermediate stiffeners in stainless steel cold-formed profiles. Thin-Walled Struct. 2021, 169, 108390. [Google Scholar] [CrossRef]
- Daniunas, A.; Urbonas, K. Influence of the semi-rigid bolted steel joints on the frame behaviour. J. Civ. Eng. Manag. 2010, 16, 237–241. [Google Scholar] [CrossRef]
- Shakir, Q.M.; Alliwe, R. Upgrading of Deficient Disturbed Regions in Precast RC beams with Near Surface Mounted (NSM) Steel Bars. J. Mater. Eng. Struct. 2020, 7, 167–184. Available online: https://www.researchgate.net/publication/342247661 (accessed on 19 August 2024).
- Shakir, Q.M.; Hanoon, H.K. New models for reinforced concrete precast hybrid deep beams under static loads with curved hybridization. Structures 2023, 54, 1007–1025. [Google Scholar] [CrossRef]
- El-Hadary, M.R.; El-Aghoury, I.M.; Ibrahim, S.A.B. Behavior of different bolted connection configurations in frames composed of cold-formed sections. Ain Shams Eng. J. 2022, 13, 101500. [Google Scholar] [CrossRef]
- Chen, X.; Blum, H.B.; Roy, K.; Pouladi, P.; Uzzaman, A.; Lim, J.B.P. Cold-formed steel portal frame moment-resisting joints: Behaviour, capacity and design. J. Constr. Steel Res. 2021, 183, 106718. [Google Scholar] [CrossRef]
- EN 1993-1-8; Eurocode 3: Design of Steel Structures—Part 1–8: Design of Joints. European Committee for Standardization: Brussels, Belgium, 2005.
- Bučmys, Ž.; Daniūnas, A.; Jaspart, J.P.; Demonceau, J.F. A component method for cold-formed steel beam-to-column bolted gusset plate joints. Thin-Walled Struct. 2018, 123, 520–527. [Google Scholar] [CrossRef]
- Ye, J.; Quan, G.; Kyvelou, P.; Teh, L.; Gardner, L. A practical numerical model for thin-walled steel connections and built-up members. Structures 2022, 38, 753–764. [Google Scholar] [CrossRef]
- Xiao, L.; Li, Q.Y.; Li, H.; Ren, Q. Loading capacity prediction and optimization of cold-formed steel built-up section columns based on machine learning methods. Thin-Walled Struct. 2022, 180, 109826. [Google Scholar] [CrossRef]
- Gatheeshgar, P.; Poologanathan, K.; Gunalan, S.; Tsavdaridis, K.D.; Nagaratnam, B.; Iacovidou, E. Optimised cold-formed steel beams in modular building applications. J. Build. Eng. 2020, 32, 101607. [Google Scholar] [CrossRef]
- Parastesh, H.; Mohammad Mojtabaei, S.; Taji, H.; Hajirasouliha, I.; Bagheri Sabbagh, A. Constrained optimization of anti-symmetric cold-formed steel beam-column sections. Eng. Struct. 2021, 228, 111452. [Google Scholar] [CrossRef]
- Phan, D.T.; Lim, J.B.P.; Tanyimboh, T.T.; Wrzesien, A.M.; Sha, W.; Lawson, R.M. Optimal design of cold-formed steel portal frames for stressed-skin action using genetic algorithm. Eng. Struct. 2015, 93, 36–49. [Google Scholar] [CrossRef]
- Phan, D.T.; Mojtabaei, S.M.; Hajirasouliha, I.; Ye, J.; Lim, J.B.P. Coupled element and structural level optimisation framework for cold-formed steel frames. J. Constr. Steel Res. 2020, 168, 105867. [Google Scholar] [CrossRef]
- Wrzesien, A.M.; Lim, J.B.P.; Nethercot, D.A. Sustainable applications of cold-formed steel structures. In Recent Trends in Cold-Formed Steel Construction; Elsevier: Amsterdam, The Netherlands, 2024; pp. 387–483. [Google Scholar] [CrossRef]
- Rinchen, R.; Rasmussen, K.J.R. Experiments on Long-Span Cold-Formed Steel Single C-Section Portal Frames. J. Struct. Eng. 2020, 146, 04019187. [Google Scholar] [CrossRef]
- Rao, S.S. The Finite Element Method in Engineering, 6th ed.; Butterworth-Heinemann: Oxford, UK, 2018. [Google Scholar]
- EN 1993-1-5; Eurocode 3: Design of Steel Structures—Part 1–5: Plated Structural Elements. European Committee for Standardization: Brussels, Belgium, 2006.
- Stulpinas, M.; Daniūnas, A. An approach of web stiffener calculation in thin-walled columns. J. Civ. Eng. Manag. 2024, 30, 551–565. [Google Scholar] [CrossRef]
- Stulpinas, M.; Daniūnas, A. Selection of an Optimum Axially Compressed Closed Cross-Section Thin-Walled Built-Up Column. Lect. Notes Civ. Eng. 2024, 392, 194–203. [Google Scholar] [CrossRef]
- López, P.C. MATLAB Optimization Techniques; Apress: New York, NY, USA, 2014. [Google Scholar] [CrossRef]
- EN 10149-3:2013; Hot Rolled Flat Products Made of High Yield Strength Steels for Cold-Forming—Part 3: Technical Delivery Conditions for Normalized or Normalized Rolled Steels. European Committee for Standardization: Brussels, Belgium, 2013.


Disclaimer/Publisher’s Note: The statements, opinions and data contained in all publications are solely those of the individual author(s) and contributor(s) and not of MDPI and/or the editor(s). MDPI and/or the editor(s) disclaim responsibility for any injury to people or property resulting from any ideas, methods, instructions or products referred to in the content. |
© 2024 by the authors. Licensee MDPI, Basel, Switzerland. This article is an open access article distributed under the terms and conditions of the Creative Commons Attribution (CC BY) license (https://creativecommons.org/licenses/by/4.0/).