Article

Efficacy of Accelerated Carbonation Curing and Its Influence on the Strength Development of Concrete

1
Architecture, Planning and Energy Efficiency, CSIR-Central Building Research Institute, Roorkee 247667, Uttarakhand, India
2
Department of Civil Engineering, Manipal Institute of Technology, Manipal 576104, Karnataka, India
*
Author to whom correspondence should be addressed.
Buildings 2024, 14(8), 2573; https://doi.org/10.3390/buildings14082573
Submission received: 12 May 2024 / Revised: 19 June 2024 / Accepted: 16 August 2024 / Published: 21 August 2024
(This article belongs to the Special Issue Advanced Building Technologies for Energy Savings and Decarbonization)

Abstract

:
The building sector is figuring out how to lower its embodied CO2 in a sustainable way. The technology, known as Carbon Capture, Utilization, and Storage (CCUS), offers a possible remedy for this issue. Accelerated carbonation is one method of sequestering CO2 in concrete. In this study, an M25 grade of concrete is made using Ordinary Portland Cement with 0–30% replacements of Class F fly ash. The specimens were exposed to accelerated carbonation curing for 6 h, 24 h, and 72 h, and then the specimens were tested for their compressive strength, carbonation depth, and pH. The CO2 uptake was measured by Thermogravimetric analysis (TGA), and the occurrence of carbonation was confirmed using X-ray diffraction (XRD) and Scanning Electron Microscopy (SEM). The results of the study indicate a significant improvement in the compressive strength with a percentage increase of 70.46%, 111.28%, 30.36%, and 36.69%, respectively, for 0%, 10%, 20%, and 30% fly ash contents in concrete samples subjected to 72 h of accelerated carbonation curing without affecting its alkalinity. The study reiterated that accelerated carbon curing is an advisable method for countries like India that are undergoing rapid economic developments.

1. Introduction

The current environmental landscape is marked by a series of unprecedented challenges, and global warming has emerged as a critical issue threatening the planet’s future, especially its biological richness and diversity. The scientific consensus is unequivocal: human activities, particularly the emission of greenhouse gases, are driving an alarming rise in global temperatures [1,2]. While several industries contribute to this environmental crisis, the construction industry stands out as a prime sector that demands heightened scrutiny [3]. The construction industry is widely considered as a vital contributor to social and economic development, playing an important role in shaping the environment. As buildings rise and infrastructure expands, the construction industry’s reliance on resource-intensive processes and materials becomes increasingly evident and more pressing than even before. From energy-intensive construction methods to the production of emissions, this sector’s carbon footprint extends far beyond the completed structures it leaves in its wake [4].
Cement is an indispensable component of the construction industry, with widespread use around the globe. However, the production of cement is also known to be one of the most carbon-intensive processes in the lifecycle of concrete [5,6]. Current estimates indicate that global cement plants are accountable for about 8% of annual CO2 emissions. The emission of about 1 tonne of carbon dioxide (CO2) into the environment is a consequence of producing 1 tonne of Ordinary Portland Cement (OPC), and kiln operation is responsible for 50% of CO2 emissions, which result from the combustion of fossil fuel [7,8,9]. This underscores the urgent need for the industry to explore more sustainable production methods and to reduce its environmental impact. Carbon Capture, Utilization, and Storage (CCUS) has become an excellent means to address the problems of rising temperatures and carbon dioxide emissions related to the construction industry. The technique has become well-known recently as a way to lessen greenhouse gas emissions and the effects of climate change [10]. Accelerated Carbonation Curing (ACC) presents a viable method for the construction industry to implement CCUS. By leveraging the inherent properties of CO2, ACC offers the potential to reduce carbon emissions and promote sustainable practices within the sector [11].
Accelerated Carbonation Curing stands out as a highly efficient curing method for precast concrete, offering the dual benefit of sequestering CO2 and aligning with global sustainability goals. Its application not only aids in reducing carbon footprints but also enhances the mechanical and durability properties of concrete, establishing it as a superior option [10,12]. Initially investigated in the early 1970s, ACC did not gain traction due to the high costs associated with CO2 capture [13,14]. However, recent decades have witnessed significant technological advancements in CO2 capture, making it more economical and feasible. This has reignited interest worldwide, prompting researchers to explore ACC as a viable alternative to steam curing in the concrete precast industry. The newfound availability of captured CO2 on a large scale has further propelled investigations into construction materials’ potential to sequester CO2 in a stable form [11].
Accelerated Carbonation Curing during concrete production has the ability to capture CO2 within a short span of time, ranging from a few hours to a few days. Studies have indicated that this method can enhance the strength and durability of concrete products by modifying their chemical composition and microstructure [15,16]. The literature indicates that adding a high concentration of CO2 to cement-based materials during their initial hydration process can improve those materials’ mechanical qualities, hardening rate, and resistance to a variety of environmental conditions, including sulphate attack, acid erosion, wetting and drying, and freeze-thaw cycles. As such, adopting ACC technology is a viable means of reducing carbon emissions and enhancing the overall performance of these materials [17,18]. Equations (1)–(4) depict the reaction taking place during ACC [19].
3(3CaO · SiO2) + (3 − x)CO2 + yH2O → xCaO · SiO3 · yH2O + (3 − x)CaCO3
2(2CaO · SiO2) + (2 − x) CO2 + yH2O → xCaO · SiO2 · yH2O + (2 − x)CaCO3
Ca(OH)2 + CO2 → CaCO3 + H2O
3CaO · 2SiO2 · 3H2O + 3CO2 → 2SiO2 + 3CaCO3 + 3H2O
It is axiomatic that the level of relative humidity in concrete-based products has a significant impact on the degree of carbonation. Reduced levels of relative humidity can expedite the carbonation process, as a dry environment allows greater CO2 diffusion in the concrete. Both experimental and modelling data suggest that, to attain carbonation, the referred relative humidity range of 50% to 70% is required [20]. At this level, the concrete is neither too dry to restrict carbonation reactions, nor too damp for capillary pores to be fully saturated, which limits CO2 diffusion [21]. Another prime variable that affects the amount of carbon absorbed during carbonation curing is the length of time exposed to CO2. According to earlier research, most carbonation reactions seem to happen in the first 6 h of curing. However, this result may vary depending on the concrete mixture design and curing settings [22].
Although many studies related to ACC have been carried out in the world, studies using cementitious products in Indian conditions are meagre. Therefore, the present study has been undertaken to understand the efficiency of ACC over other conventional methods. Thus, the study delves into the efficacy of ACC as a curing method and its influence on the strength development of concrete, considering varied cementitious contents with fly ash replacements. The parameters scrutinized incorporate compressive strength, carbonation depth, pH analysis, and carbonation uptake.

2. Materials and Methods
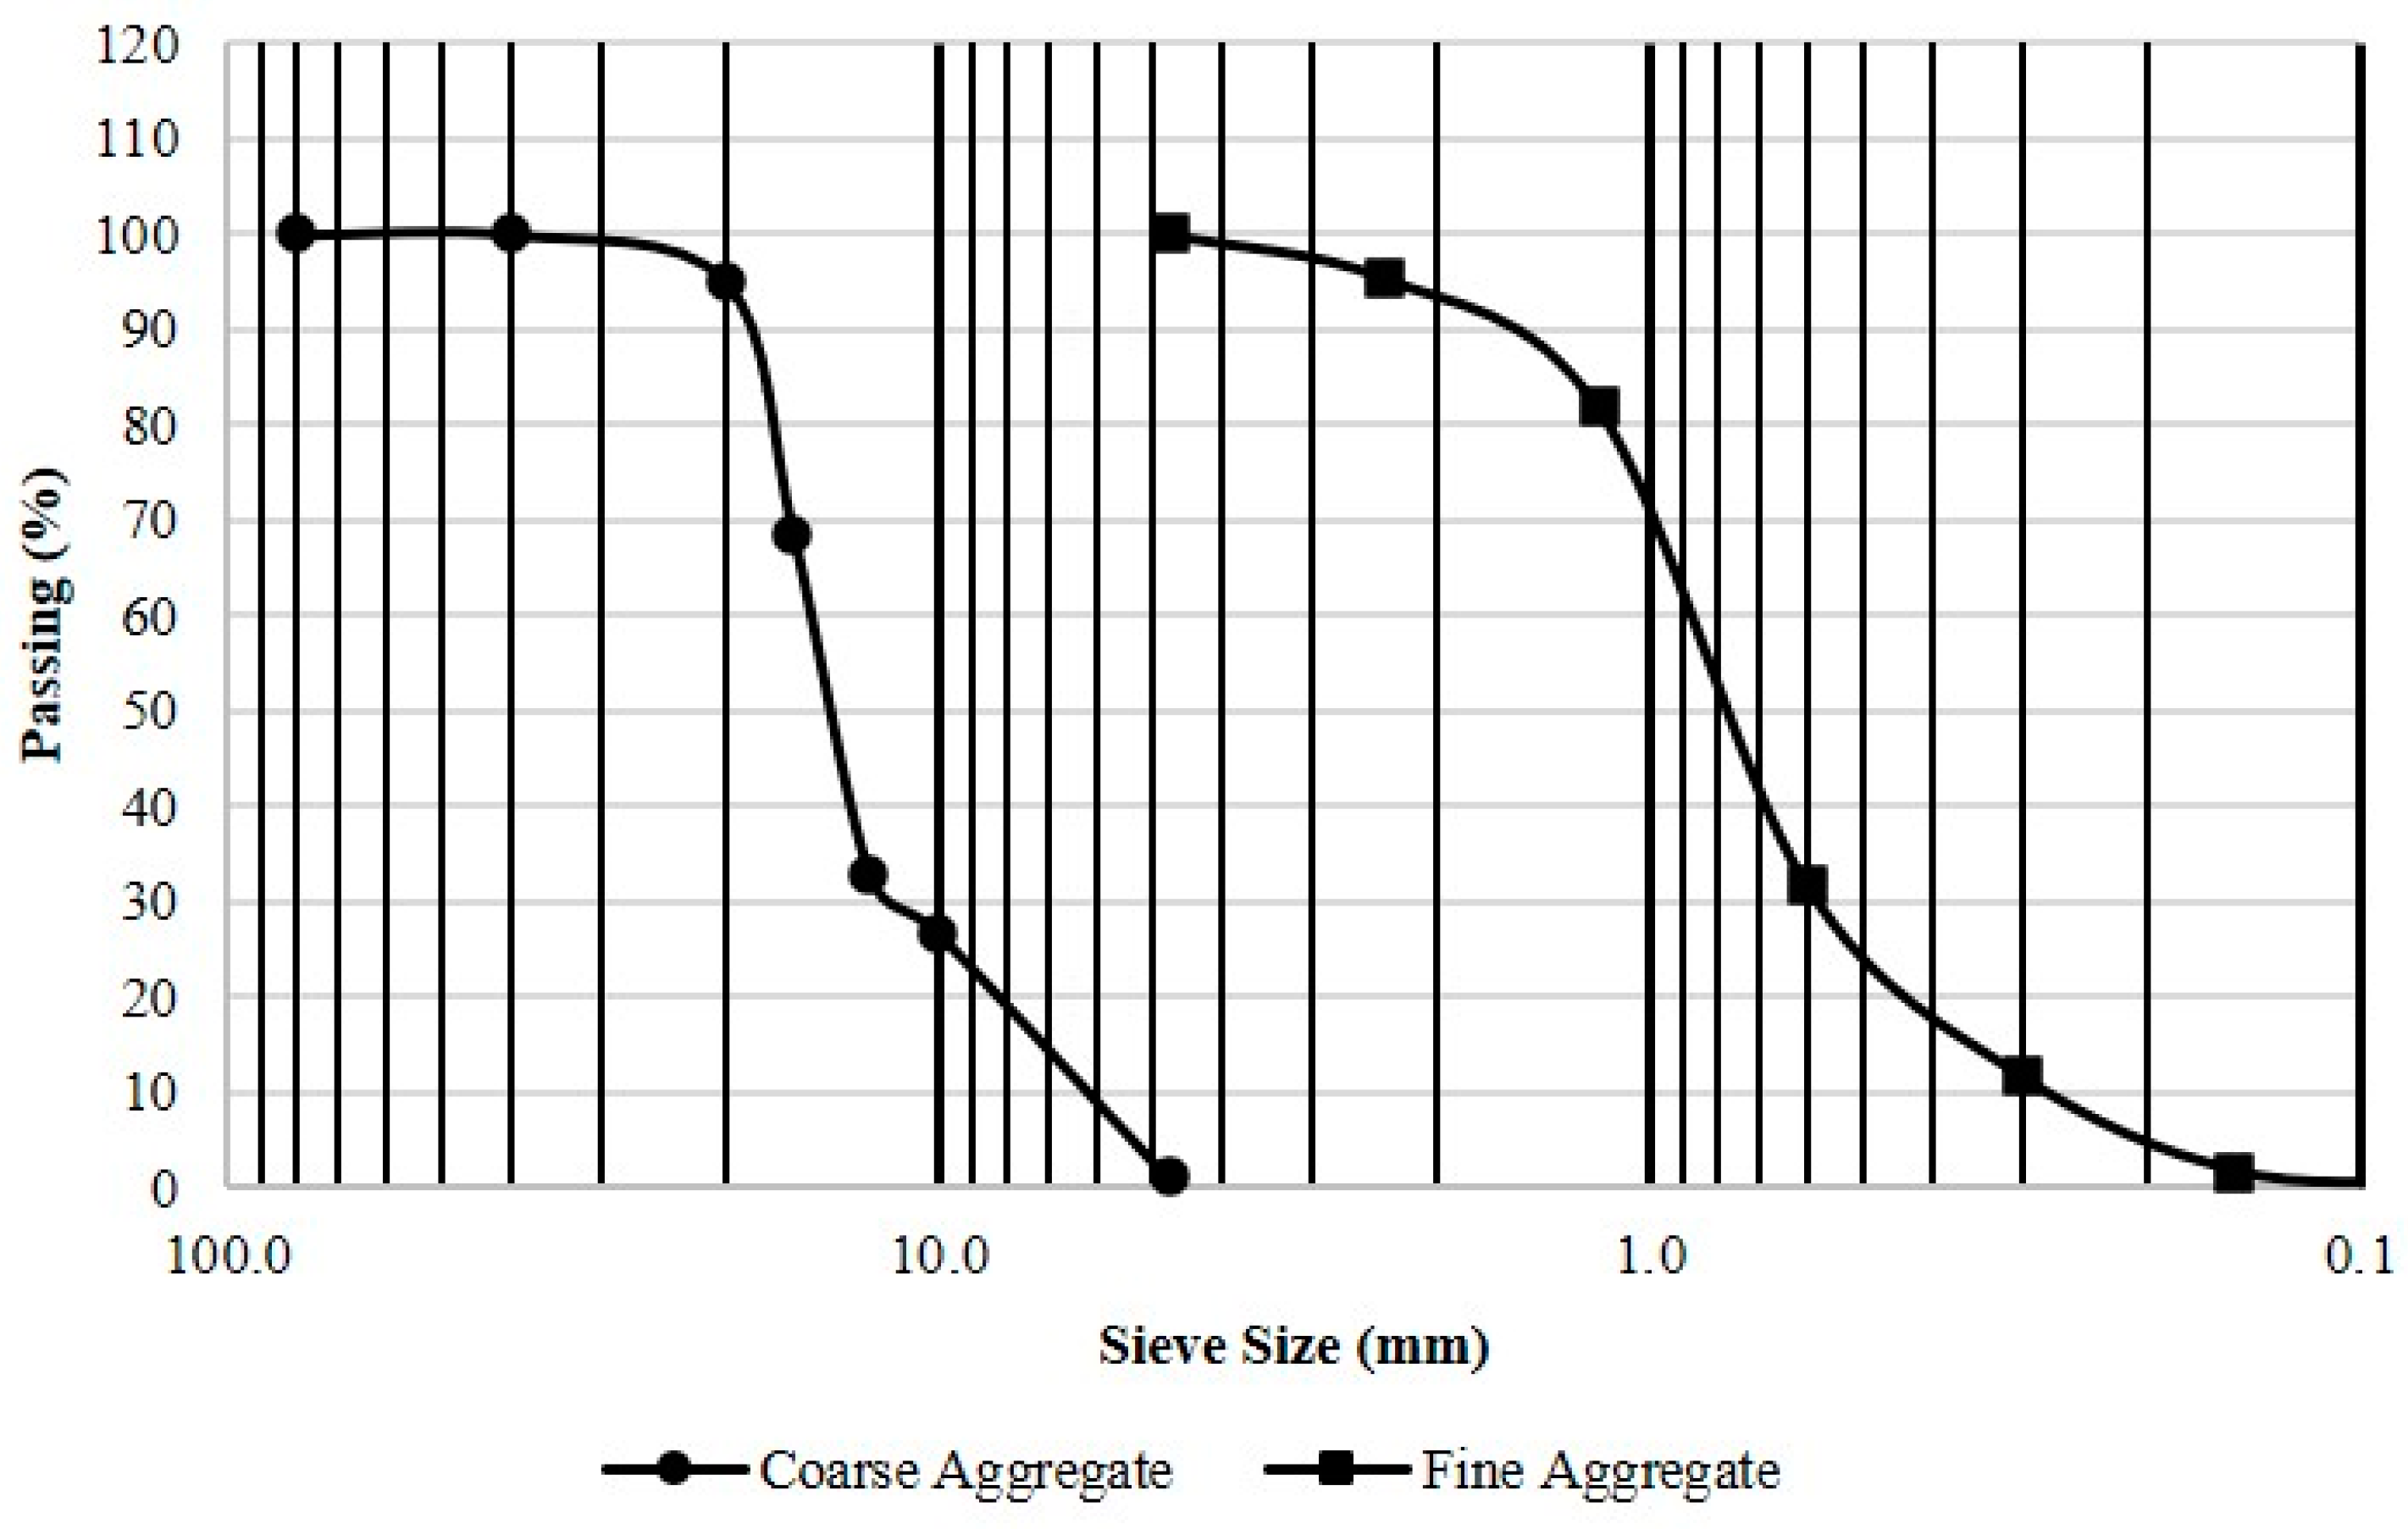
2.1. Material

Grade 43 OPC conforming to IS:8112-2013 [23] and Class F fly ash in accordance with IS:3812-2003 [24] were utilized. The cement has a fineness of 327 m2/kg and a specific gravity of 3.15, while the fly ash has a fineness of 290 m2/kg and a specific gravity of 2.20. Chemical properties of both binders are detailed in Table 1.
River sand from zone II, as specified by IS:383-2016 [25], served as the fine aggregates. Coarse aggregates were composed of crushed granite gravels with nominal sizes of 20 mm and 12.5 mm, blended in a ratio of 3:2. The specific gravities of the fine and coarse aggregates were 2.70 and 2.65, respectively. Figure 1 depicts the grading curve of coarse aggregate and fine aggregate used for the present study.

2.2. Concrete Mixtures

The study considered four different concrete mixtures with different cementitious materials. The first mixture, abbreviated as M1, was prepared using Ordinary Portland Cement (OPC) as the cementitious material. In the second, third, and fourth mixtures, a blend of fly ash and OPC was used, and these concrete mixtures were represented as M2, M3, and M4, respectively. To prepare one cubic meter of concrete mixtures, the constituent materials’ weights are shown in Table 2. A water-to-cementitious material ratio of 0.45 was used to maintain a zero slump for each of these mixtures.

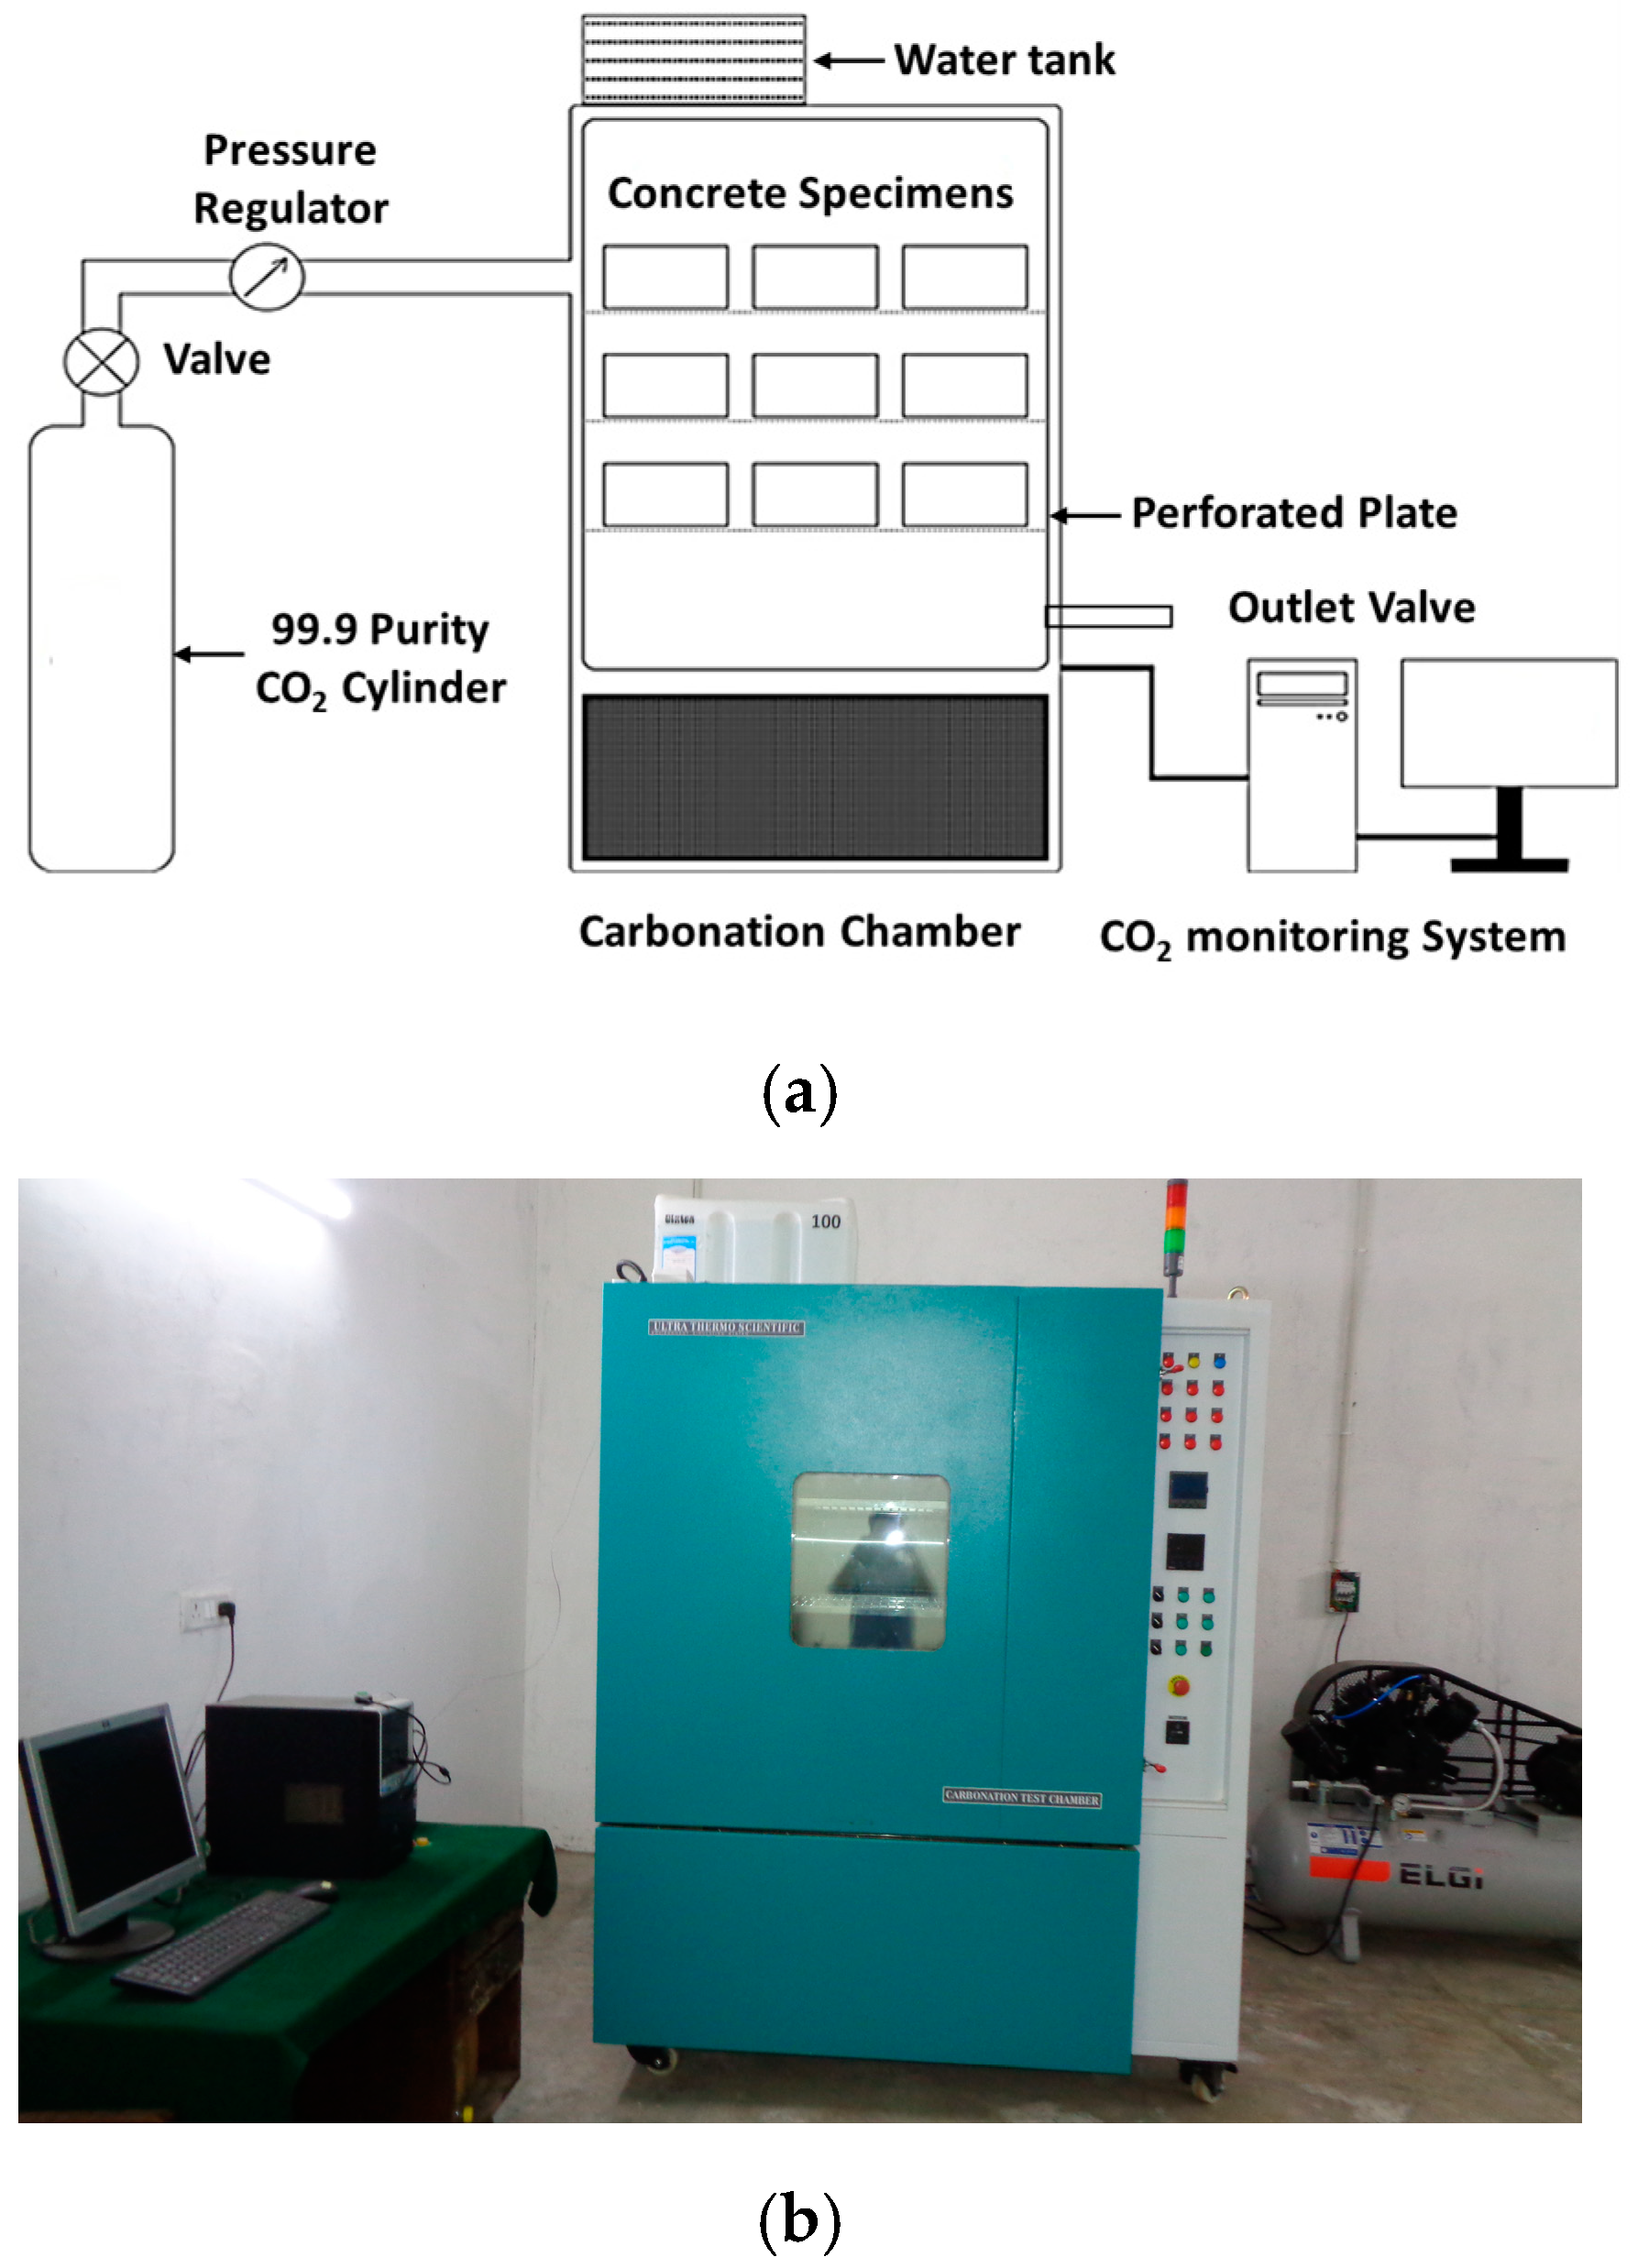
2.3. Experimental Setup for Carbonation

The arrangement depicted in Figure 2a,b illustrates the configuration for Accelerated Carbonation Curing of concrete samples. The valve and pressure regulator assembly located on the CO2 gas cylinder are connected to the inlet pipe of the chamber. To regulate relative humidity and temperature within the system, a water tank and heating mechanism are included. Additionally, a computerized system facilitates data collection and adjustment of humidity, temperature, and CO2 levels within the chamber.

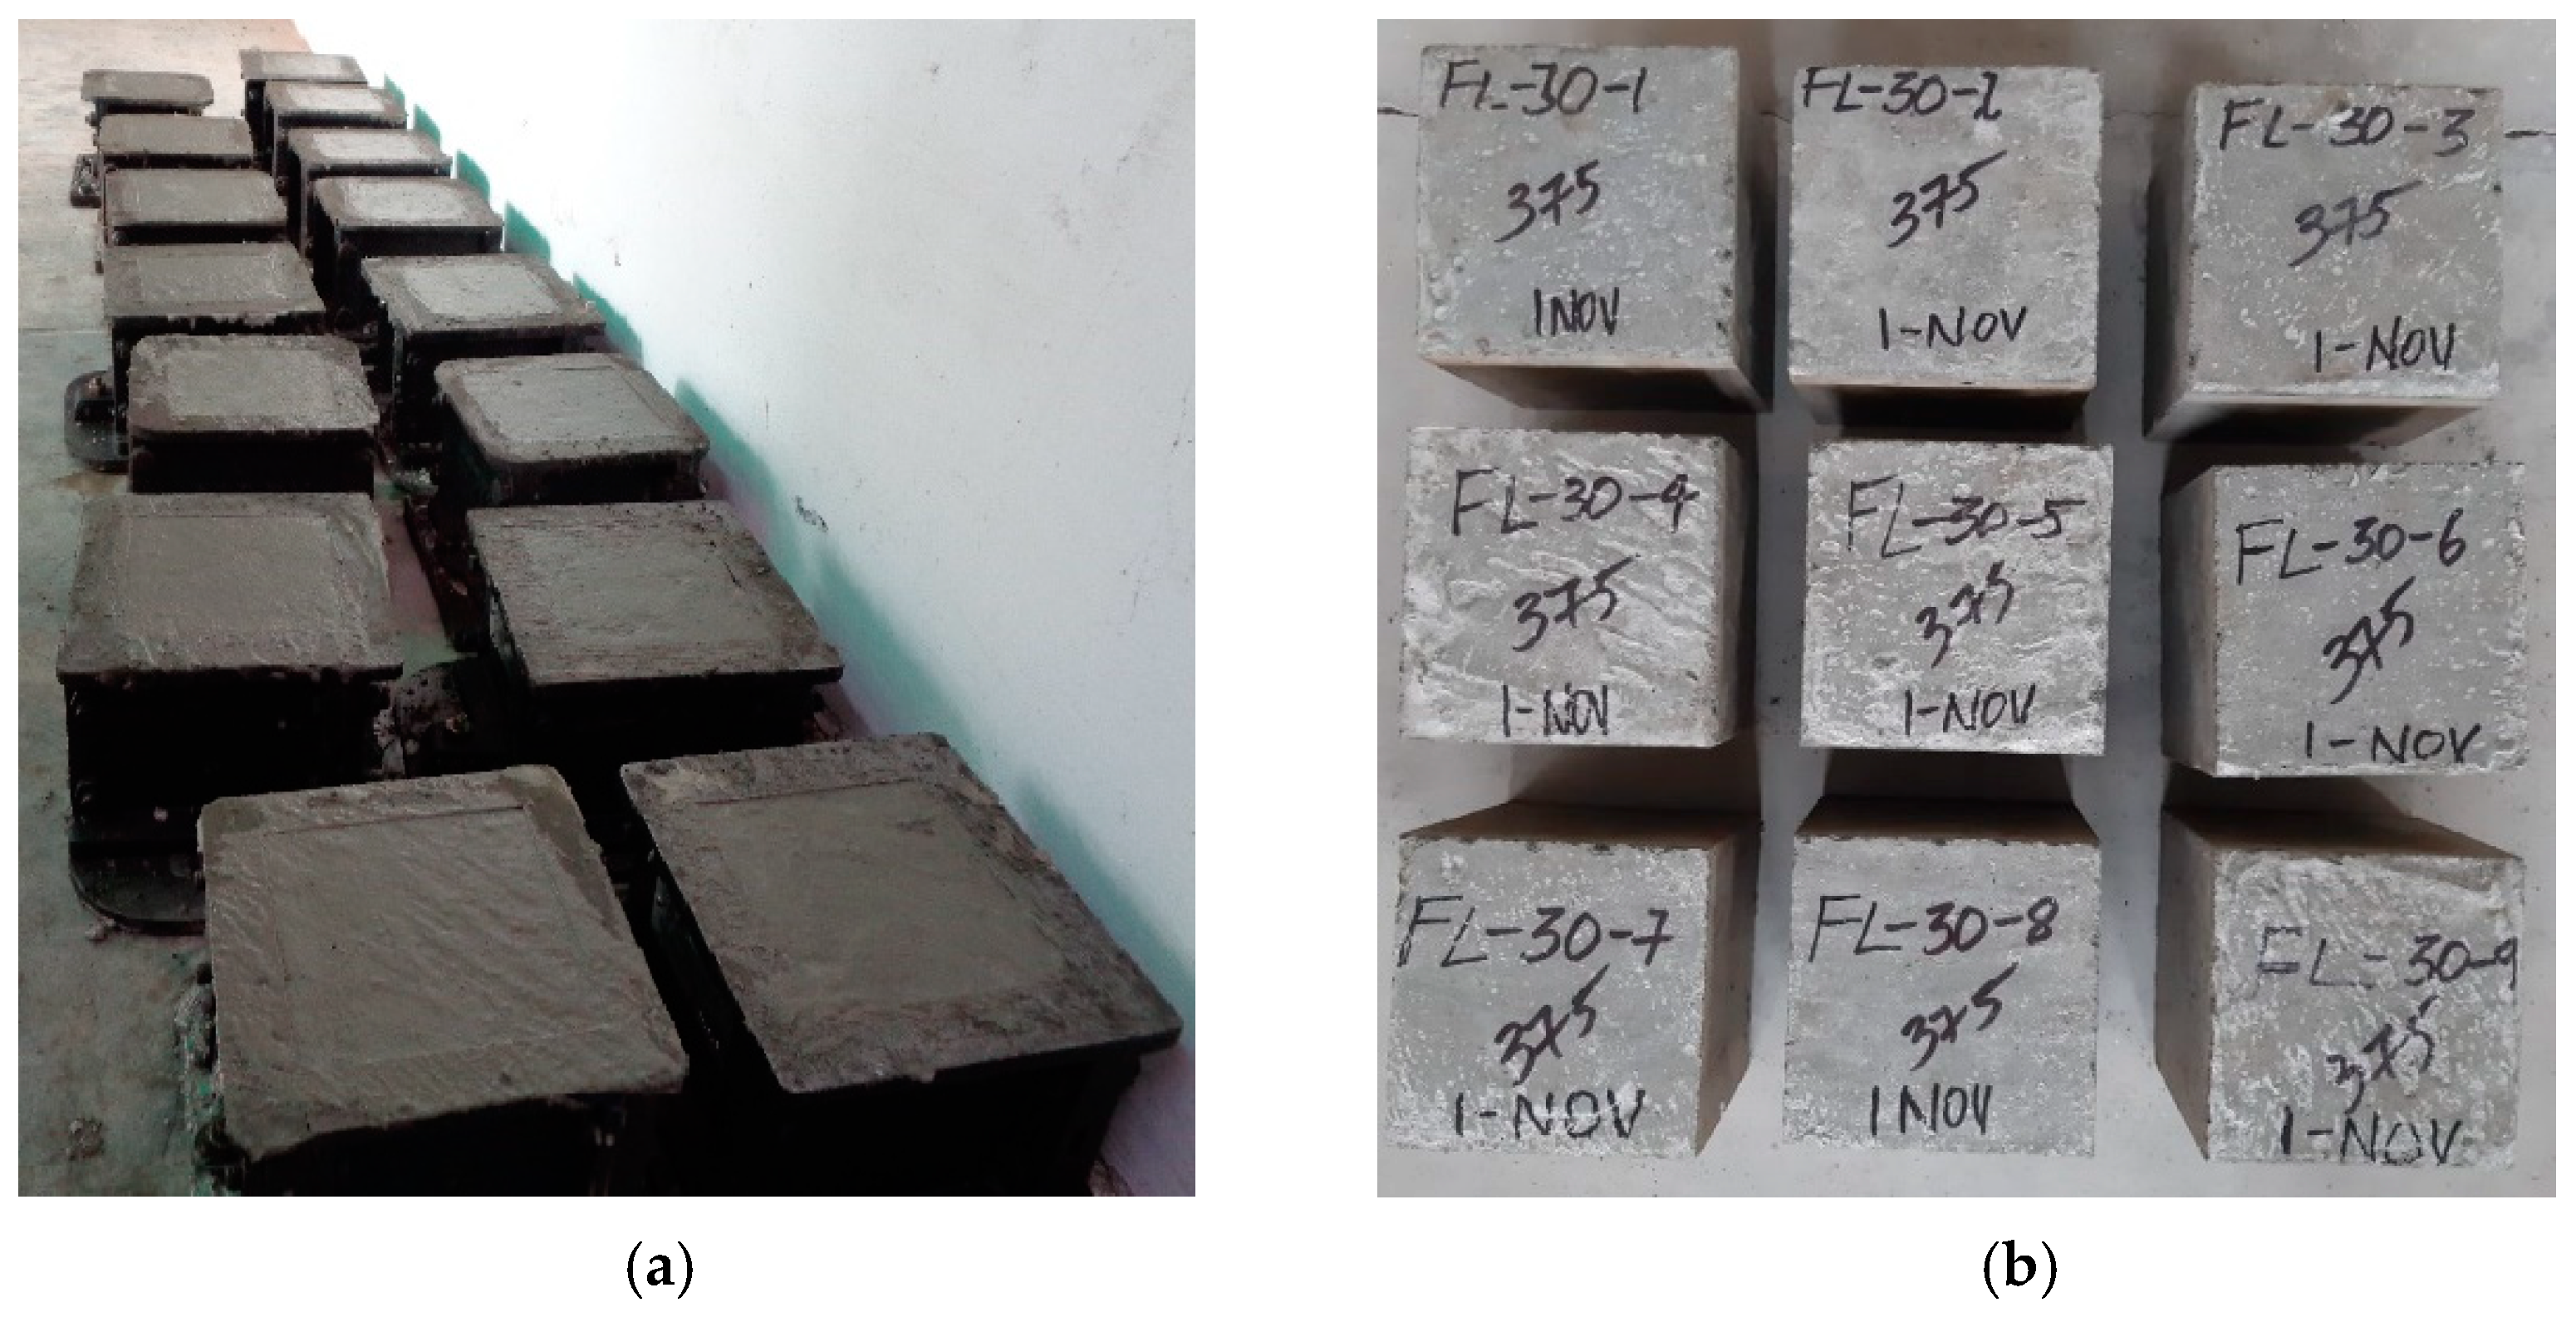
2.4. Preparation and Curing of Sample

All the ingredients were mixed, and then water was added to make a consistent mixture. Three layers of concrete were poured into moulds, and the voids were eliminated by vibrating the material. After 24 h of casting, the samples of all four concrete samples were taken out of the moulds, and each set of the four concrete mixtures was divided into two groups. One group of samples was treated with ACC for 6, 24, and 72 h at 10% CO2 concentration, at 35 °C temperature, and at 70% relative humidity, while the other group was water-cured for the same amount of time as the ACC. For the concrete sample ACC, 99.9% pure CO2 was used from a gas cylinder with pressure regulation. Figure 3a,b shows the preparation and curing of samples.

2.5. Testing of Specimens

To examine the alteration in the concrete matrix with ACC, assessments were carried out after 6, 24, and 72 h of ACC. Additionally, a batch of water-curing specimens was tested for comparison at the same intervals. Compressive strength analysis was utilized to gauge the mechanical robustness of the concrete. To investigate any significant pH variations resulting from the consumption of Ca(OH)2 during the ACC process, the pH of the concrete was measured. This was done to assess any potential impact on the formation of the passivation layer on the rebar. To conduct this measurement near the surface, a sample was collected. Three grams of powdered sample were taken from the desired location and dissolved in 10 mL of distilled water. The mixture was stirred automatically for 15 min, followed by filtration using Whatman filter paper. The pH of the resulting solution was then measured using a digital pH meter following previous studies [10,19]. In order to find the carbonation depth, phenolphthalein solution was applied to the specimen’s cross-section. To understand changes in mineralogical compositions, XRD, TGA, and SEM were performed on samples collected from the near surface of concrete. Before testing, samples were immersed in acetone to stop further hydration. XRD was recorded on a RIGAKU D-Max 2000 X-ray diffractometer (Make: Rigaku Corporation, Osaka, Japan) equipped with a Gobel mirror for Cu-Kα radiation. The measurements were carried out in a 2θ range from 5–70° with a step of 0.02° and counting time of 5 s/step. The Xpert High Score Plus programme was used to match the obtained peaks with the ICDD reference database. Measurements were also made of the mass loss within a specific temperature range and the CO2 uptake by carbonated specimens using TGA data. The mass loss in a specific temperature range was measured and correlated to Ca(OH)2 and CaCO3 that formed during the curing process. A TGA test was conducted using an INSEIS STA PT 1600 analyzer. A part of the powder sample was heated in a nitrogen atmosphere between 50 and 900 °C at a heating rate of 10 °C per minute. Morphological analysis of the specimens utilising SEM images taken using a TESCAN MIRA3 microscope was performed. The specimens underwent an ion sputter procedure to cover them in gold before imaging.

3. Results and Discussion

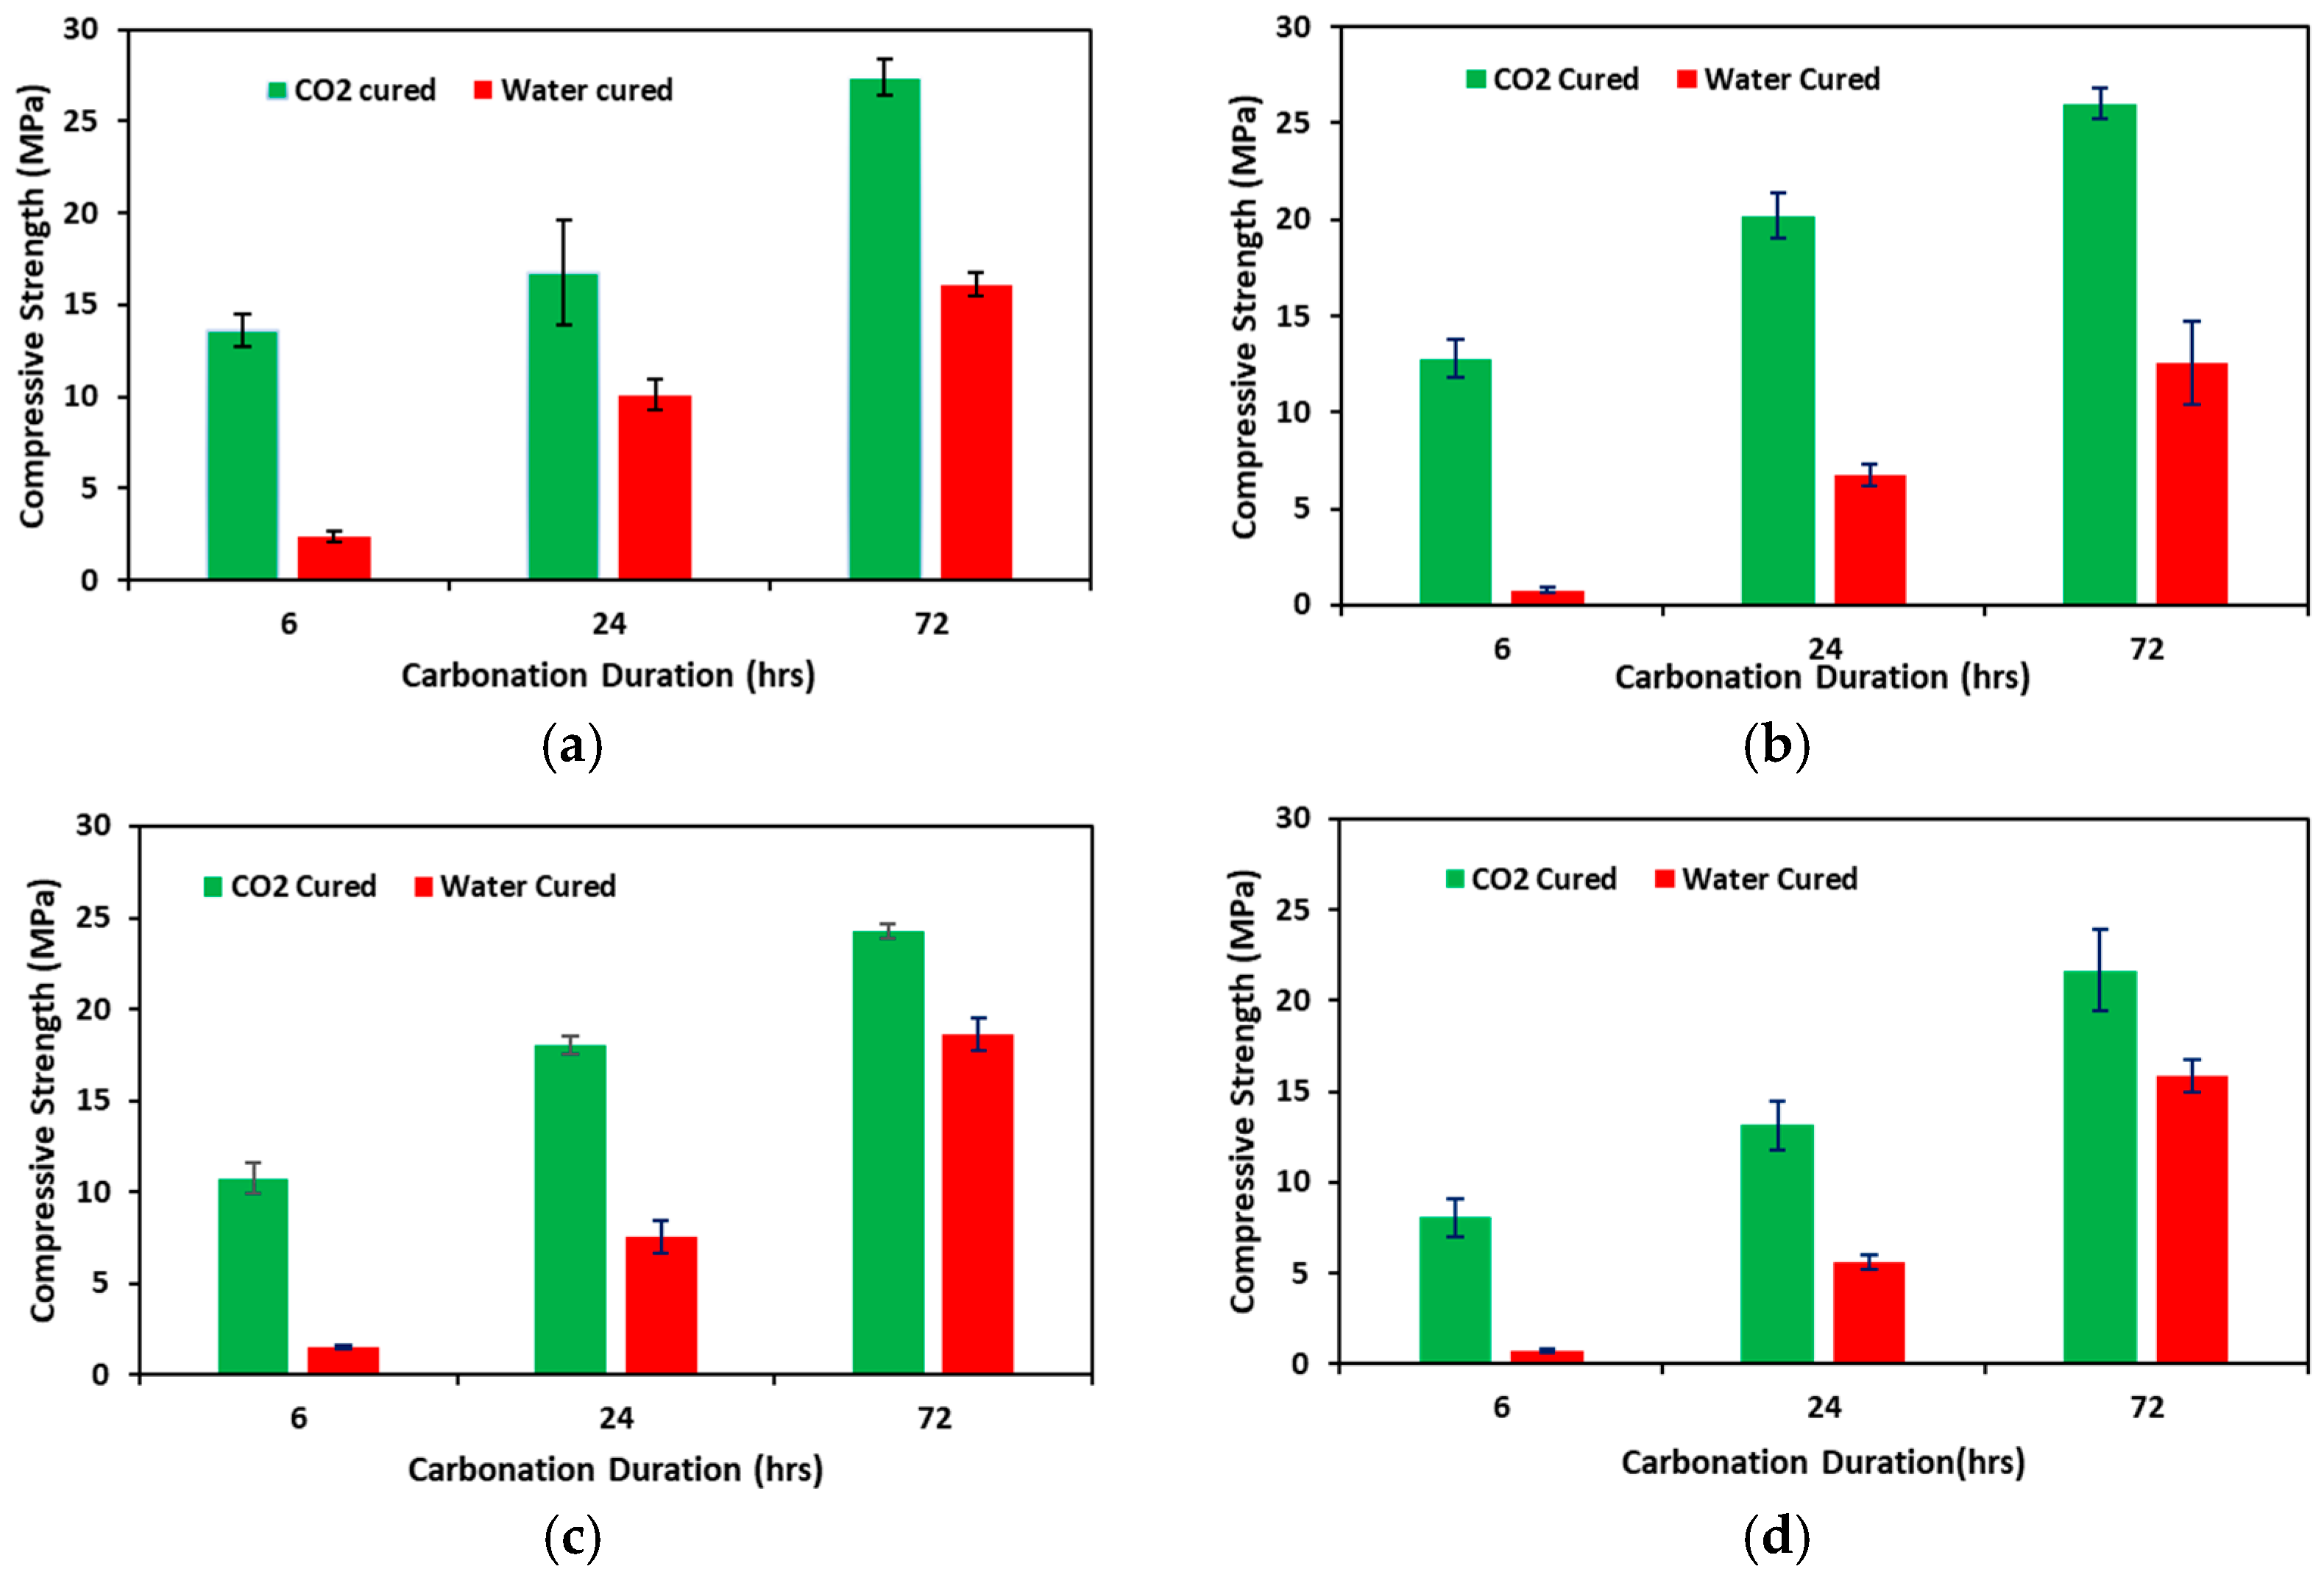
3.1. Compressive Strength

The mechanical performance of concrete at 6, 24, and 72 h after ACC was examined in the study in relation to water curing. 100-mm cube specimens were examined to assess the compressive strength of the concrete. Figure 4a–d shows the results of compressive strength at different hours of carbonation curing and compared with water-cured specimens. The data suggest that the compressive strength of the ACC specimens was higher than that of the water-cured specimens with a percentage increase of 70.46%, 111.28%, 30.36%, and 36.69% for the M1, M2, M3 and M4 sample, respectively, after 72 h. Furthermore, mixes M1 and M2 during 72 h of carbonation cure reached the desired strength. Previous researchers reported that enhanced strength development is due to the higher rate of carbonation reaction, which turns C2S and C3S into CaCO3 and C-S-H gel; thus, ACC specimens have better strength development [19]. Furthermore, the hydration event that yields Ca(OH)2 is transformed into thermodynamically stable CaCO3 by the carbonation reaction that occurs during ACC.

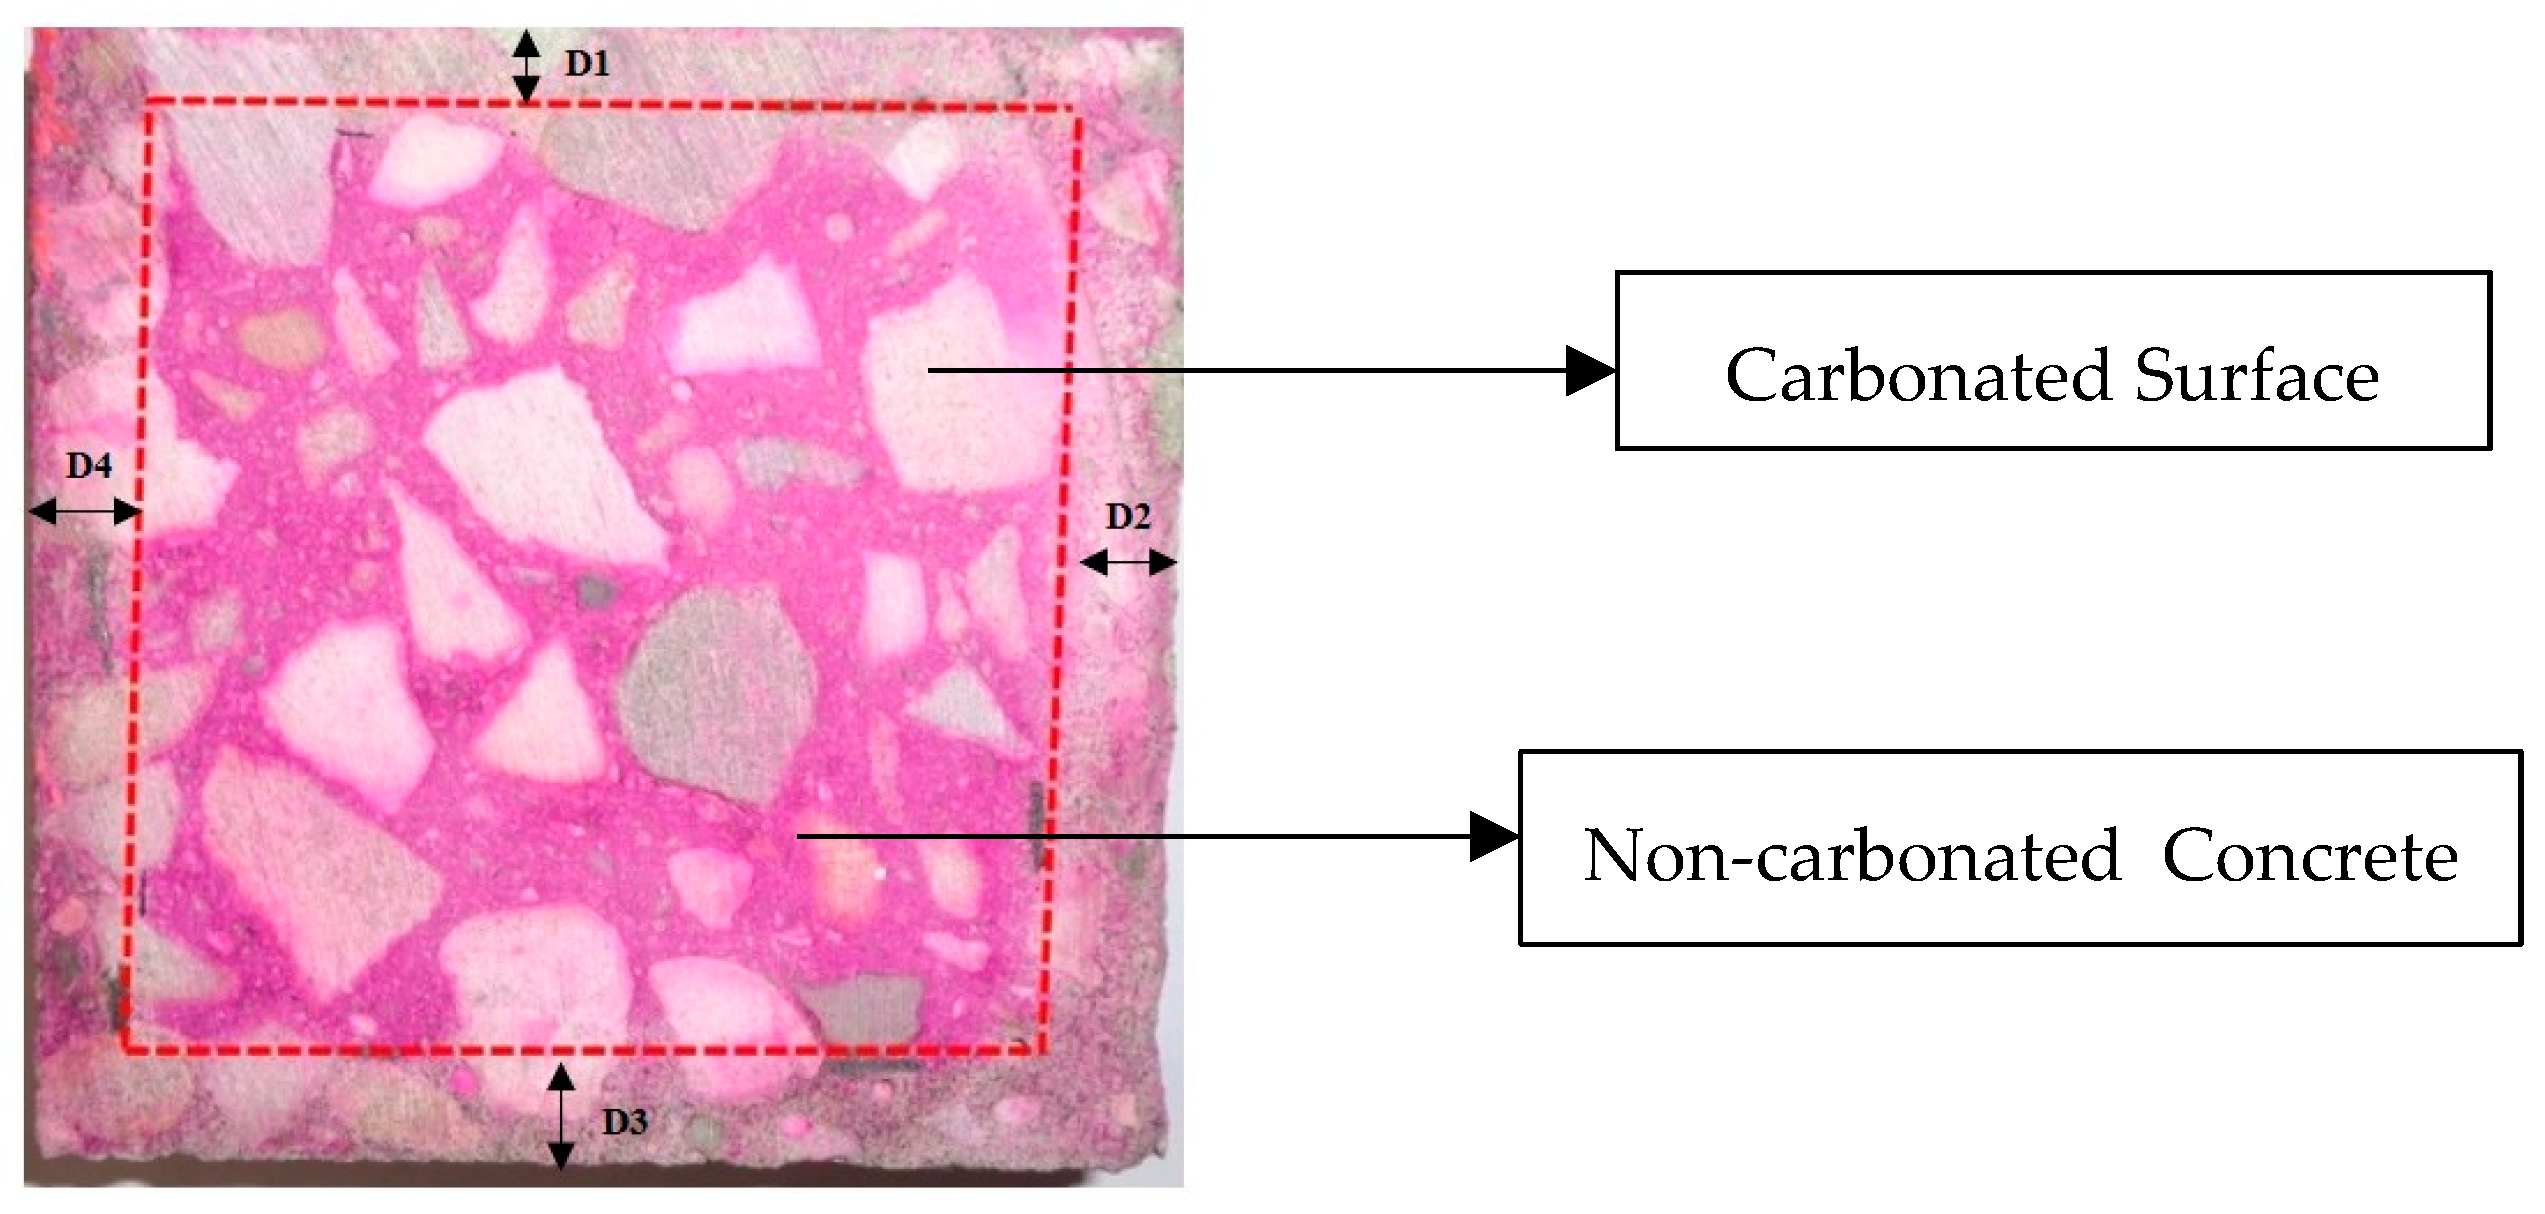
3.2. Carbonation Depth and pH Analysis

Figure 5 shows the image of a typical phenolphthalein-stained concrete specimen after ACC. During the phenolphthalein test for the calculation of carbonation depth, it is observed that the carbonation depth of all the samples is below 5 mm. Carbonation depth was calculated using Equation (5) [26]. So, the chance of carbonation-induced corrosion is negligible. This statement is verified using pH analysis. pH results are depicted in Figure 6. In the pH analysis, even though there is a drop in the pH of ACC samples compared to water-cured samples, it is well above 10, which is in the tolerable limit to avoid deterioration of passivating film over the rebar [10,11,27].
C a r b o n a t i o n   D e p t h = D 1 + D 2 + D 3 + D 4 4

3.3. Microstructural Study

Curing of the concrete undergoes various physical and chemical reactions. Therefore, microstructural study of the concrete is necessary for understanding the physiochemical changes taking place in different curing regimes. Three different methods were employed to analyze the microstructure of the concrete in this research, namely XRD, TGA, and SEM.

3.3.1. XRD Analysis

XRD is a crucial technique for analyzing hydrated cement concrete samples in both quantitative and qualitative ways. This analysis can detect the mineralogical changes, if any, that can occur due to carbonation. By studying XRD patterns of carbonated and non-carbonated concrete samples, it is possible to determine the extent of carbonation. Bragg’s law is the foundation of XRD. By analyzing the results of the XRD test, the angle at which the wave was diffracted and the intensity of the X-ray can be determined [28]. In Figure 7, the XRD patterns of the M1 and M2 samples subjected to accelerated carbonation curing and water curing are depicted. The graphs reveal a notable increase in the peaks corresponding to CaCO3 and a decrease in those related to Ca(OH)2 following carbonation curing. This phenomenon can be attributed to the reaction between cement hydration products and CO2.

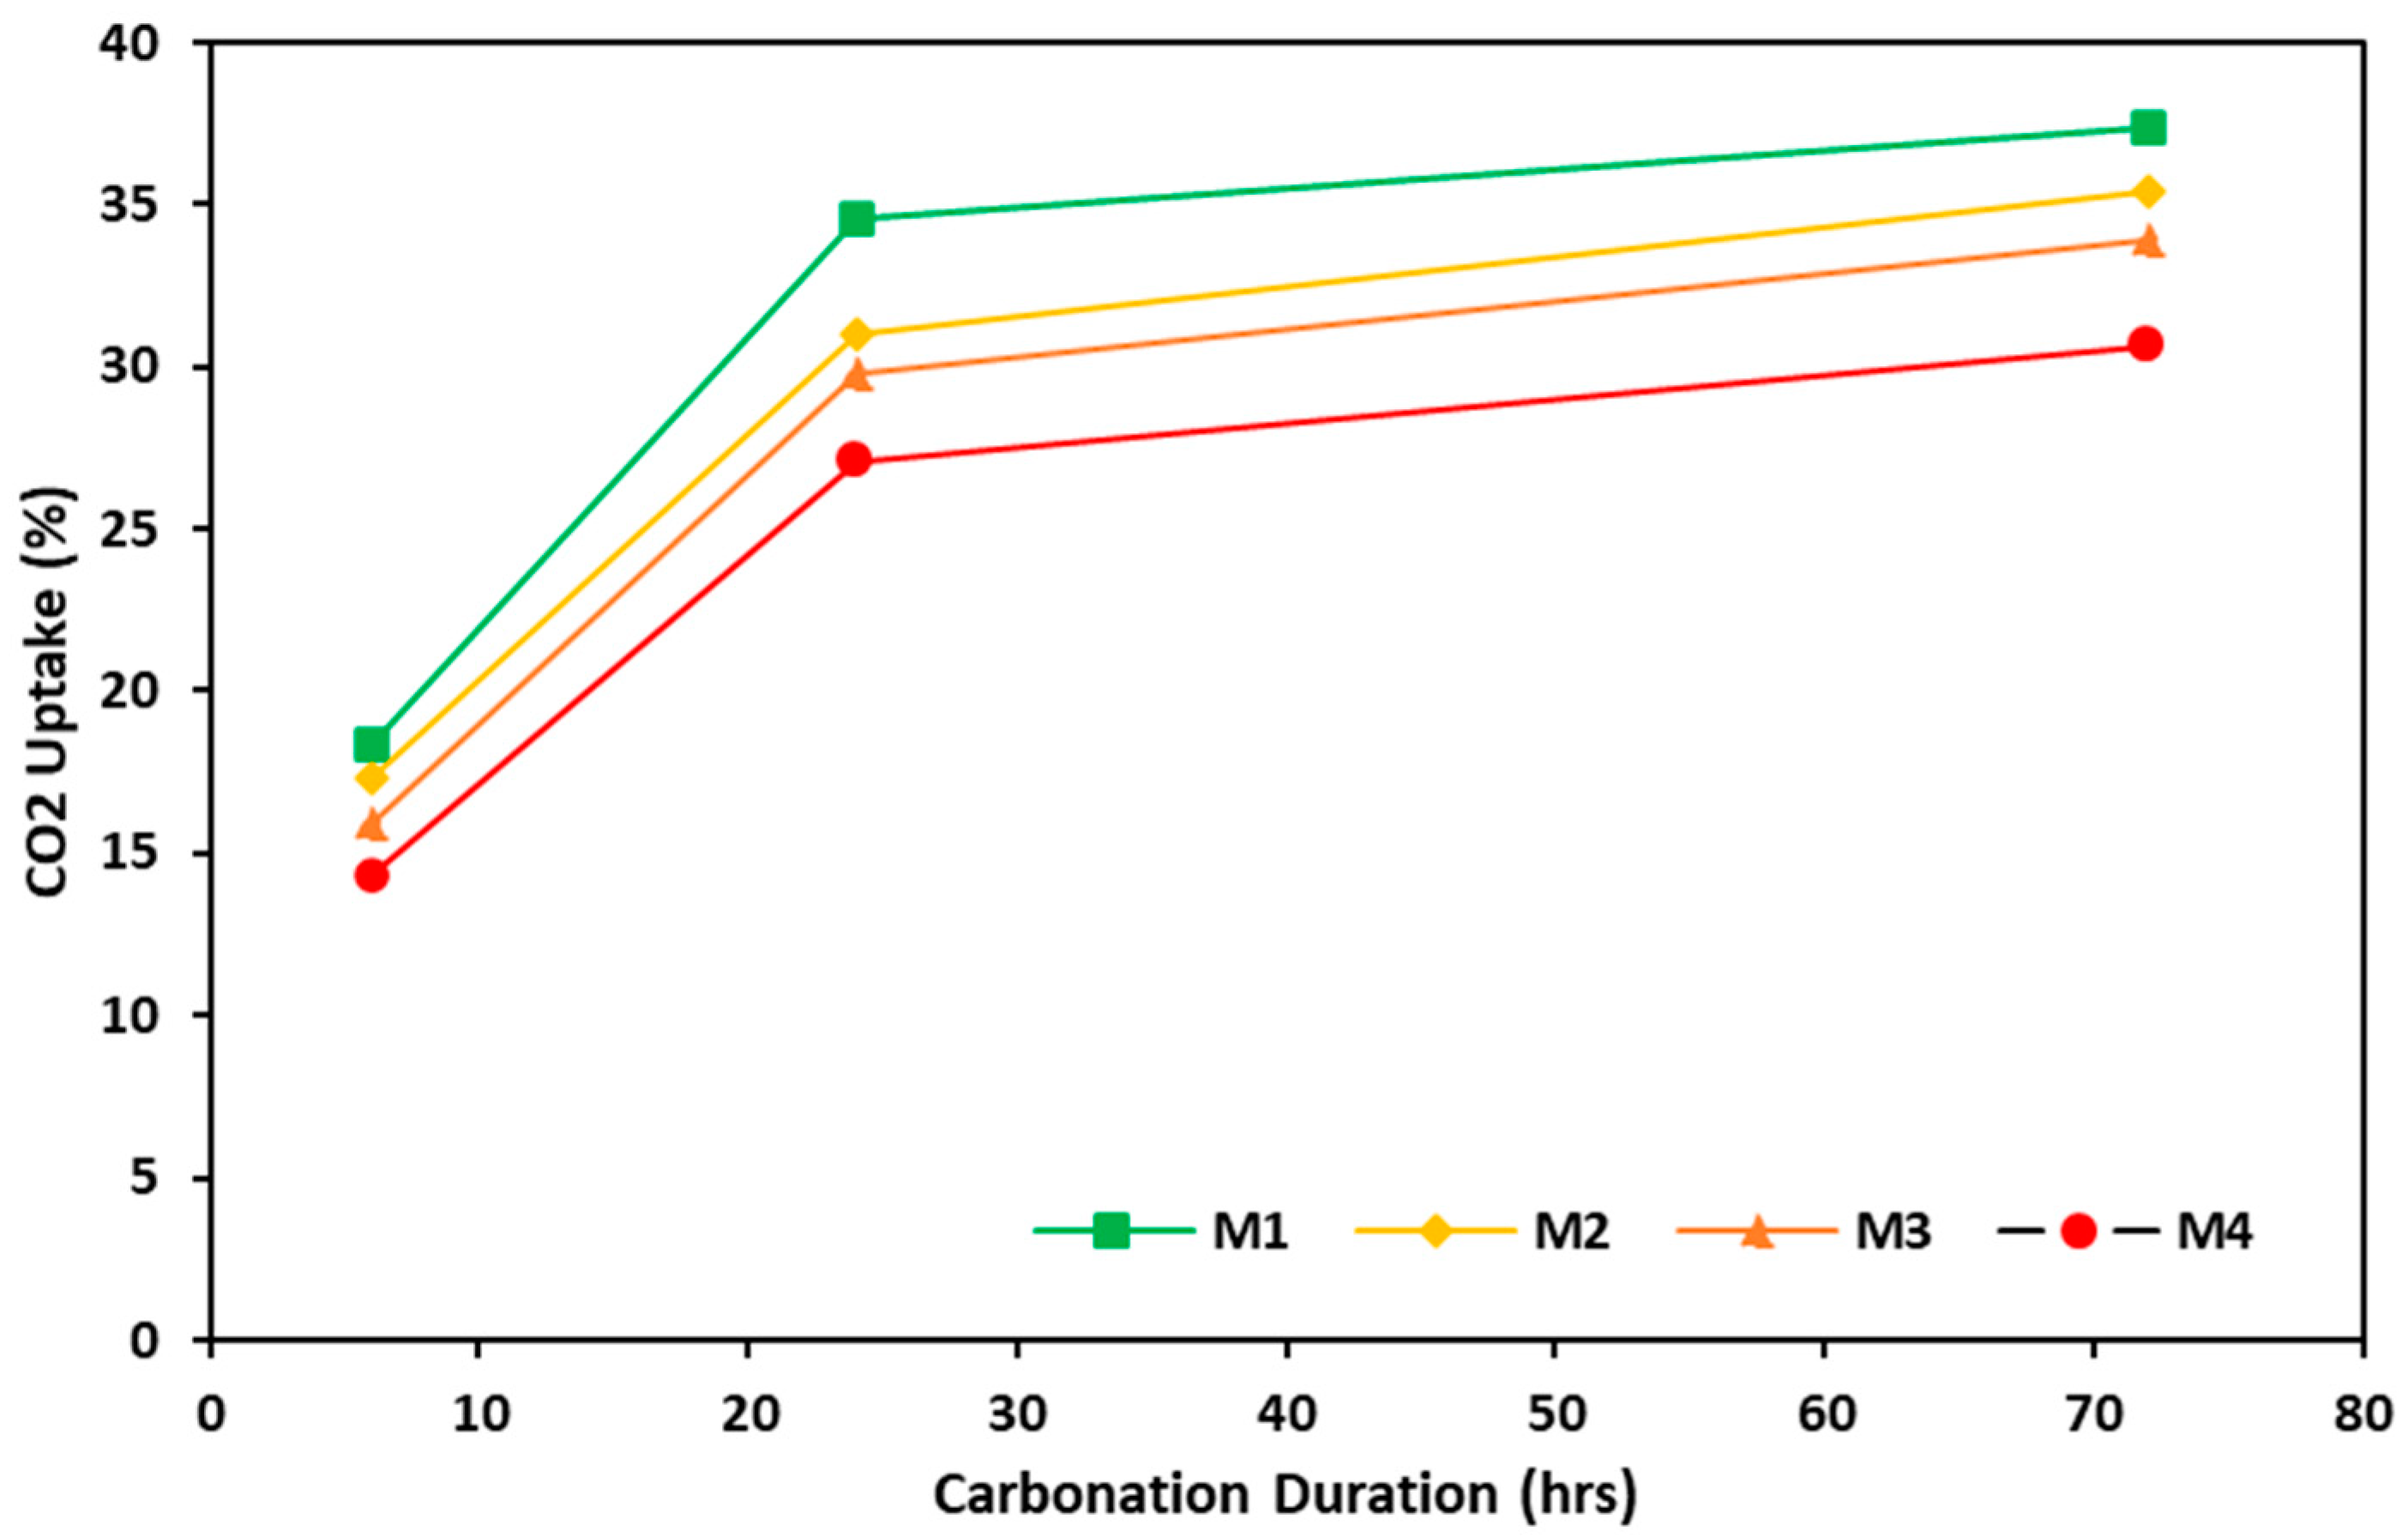
3.3.2. TGA and CO2 Uptake
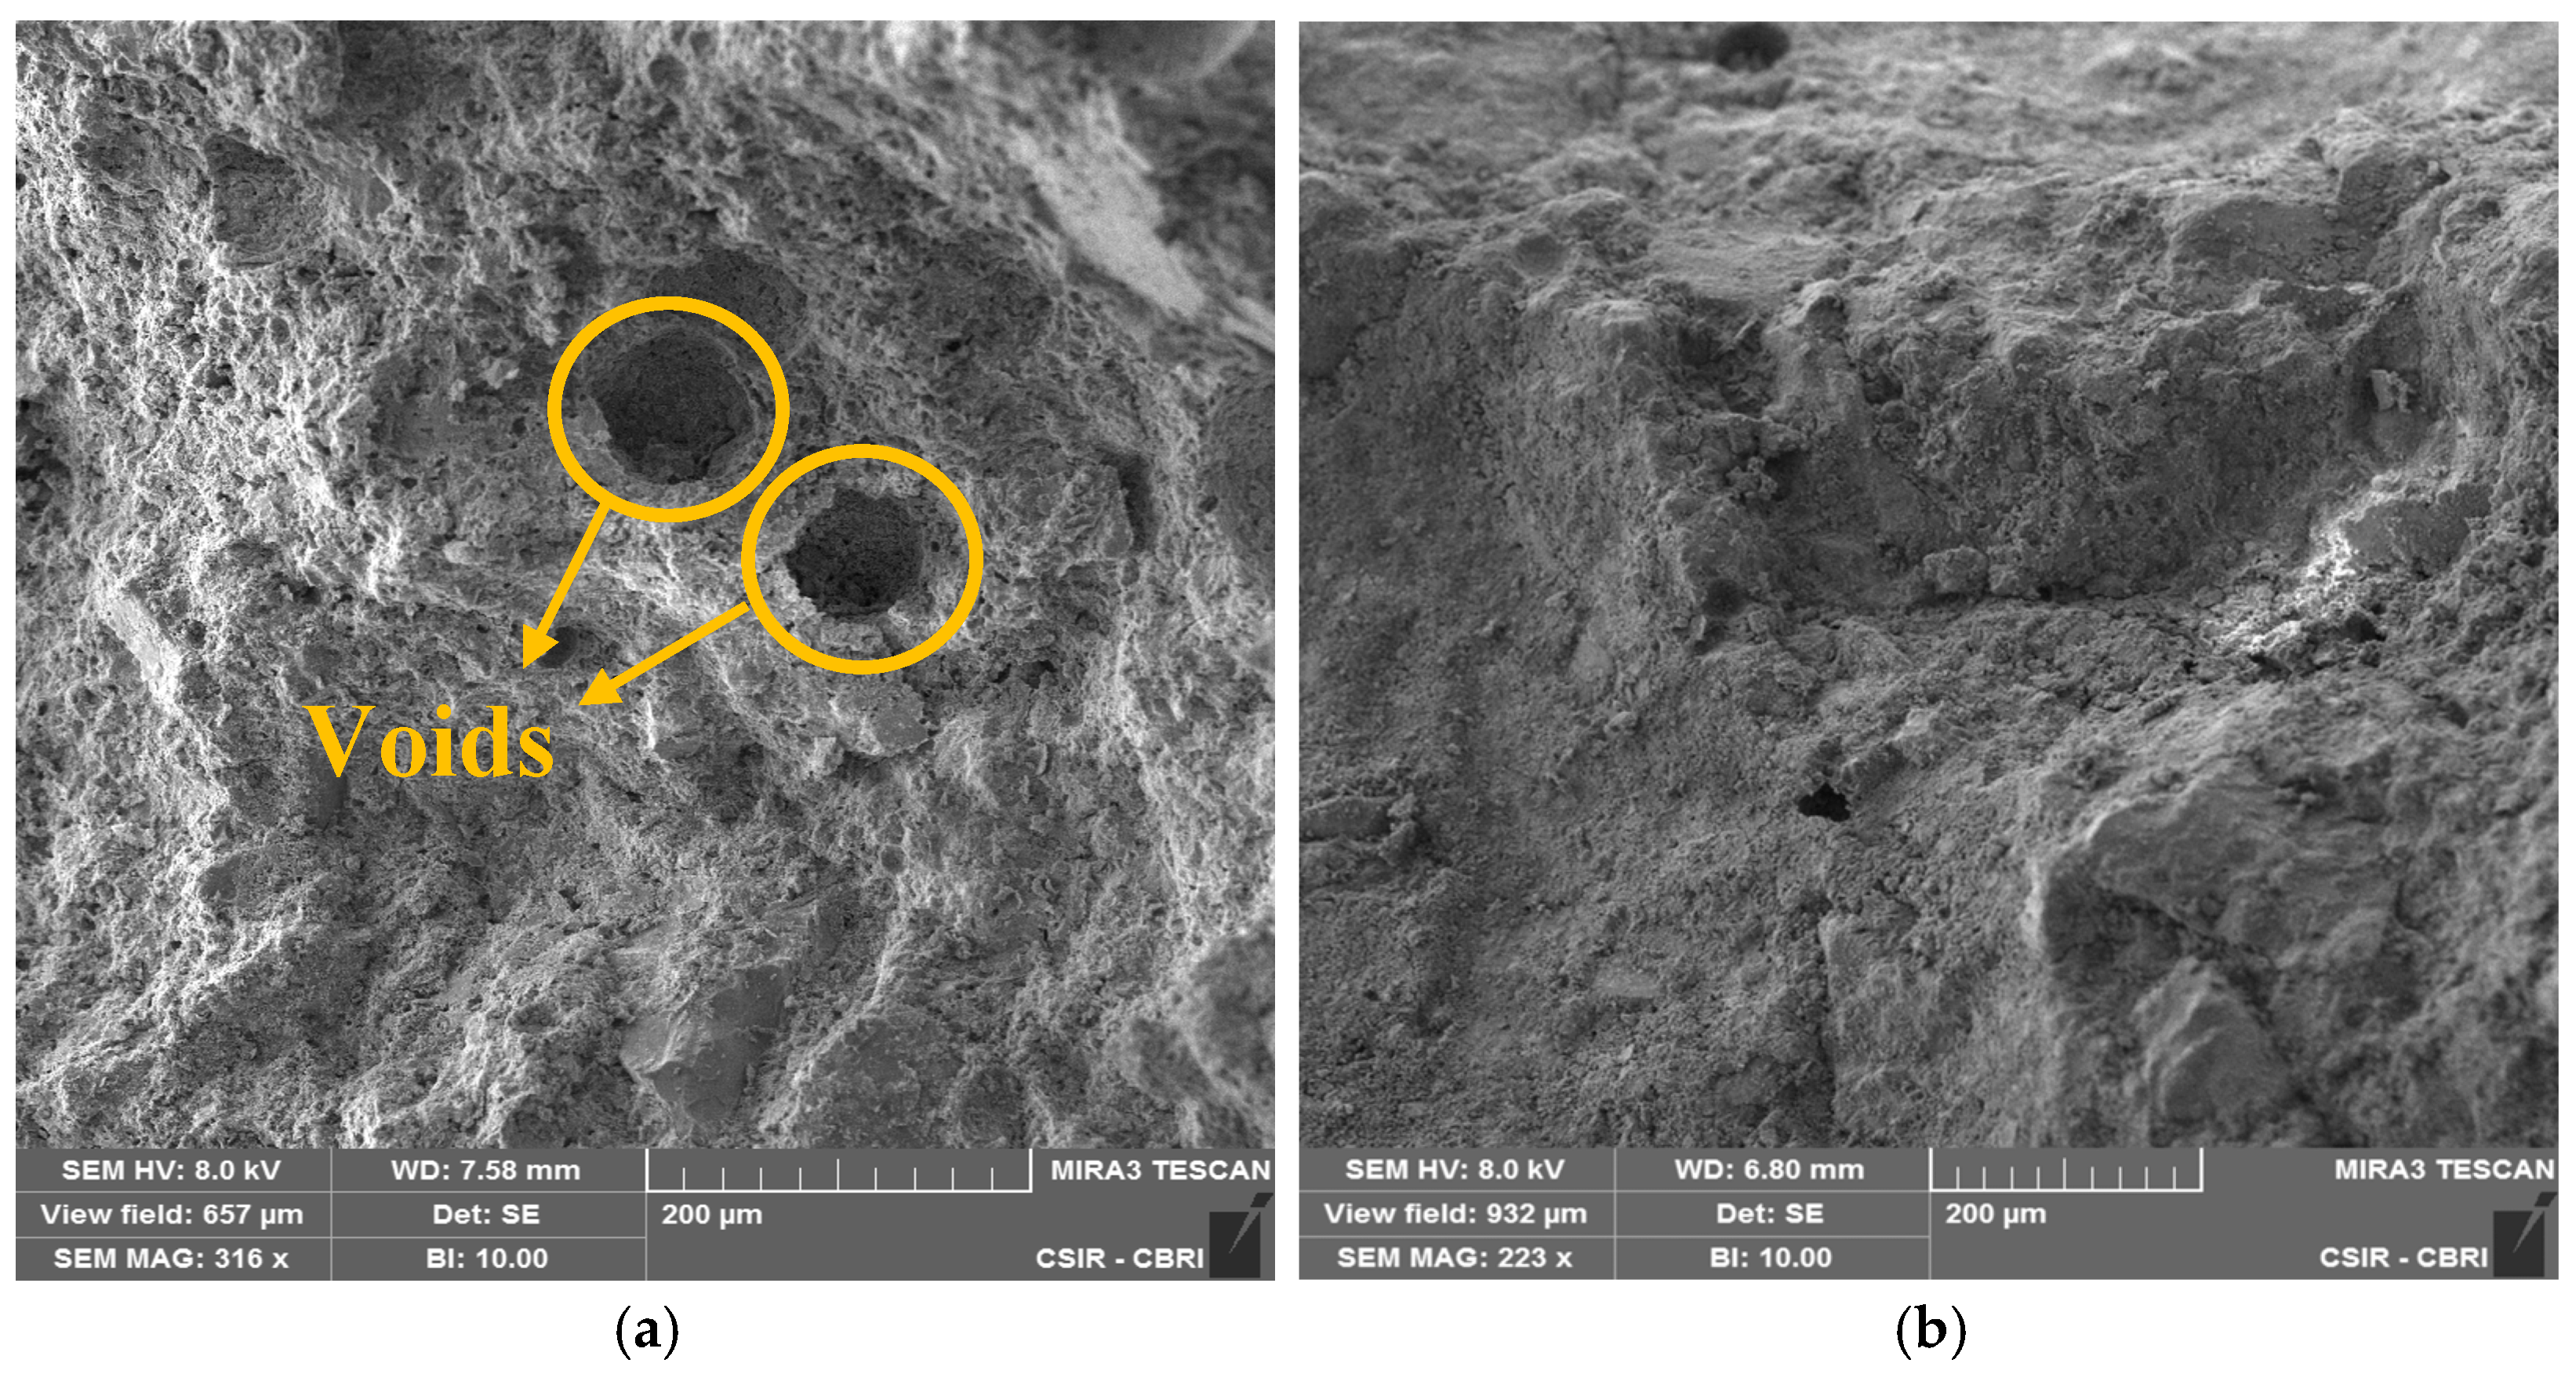
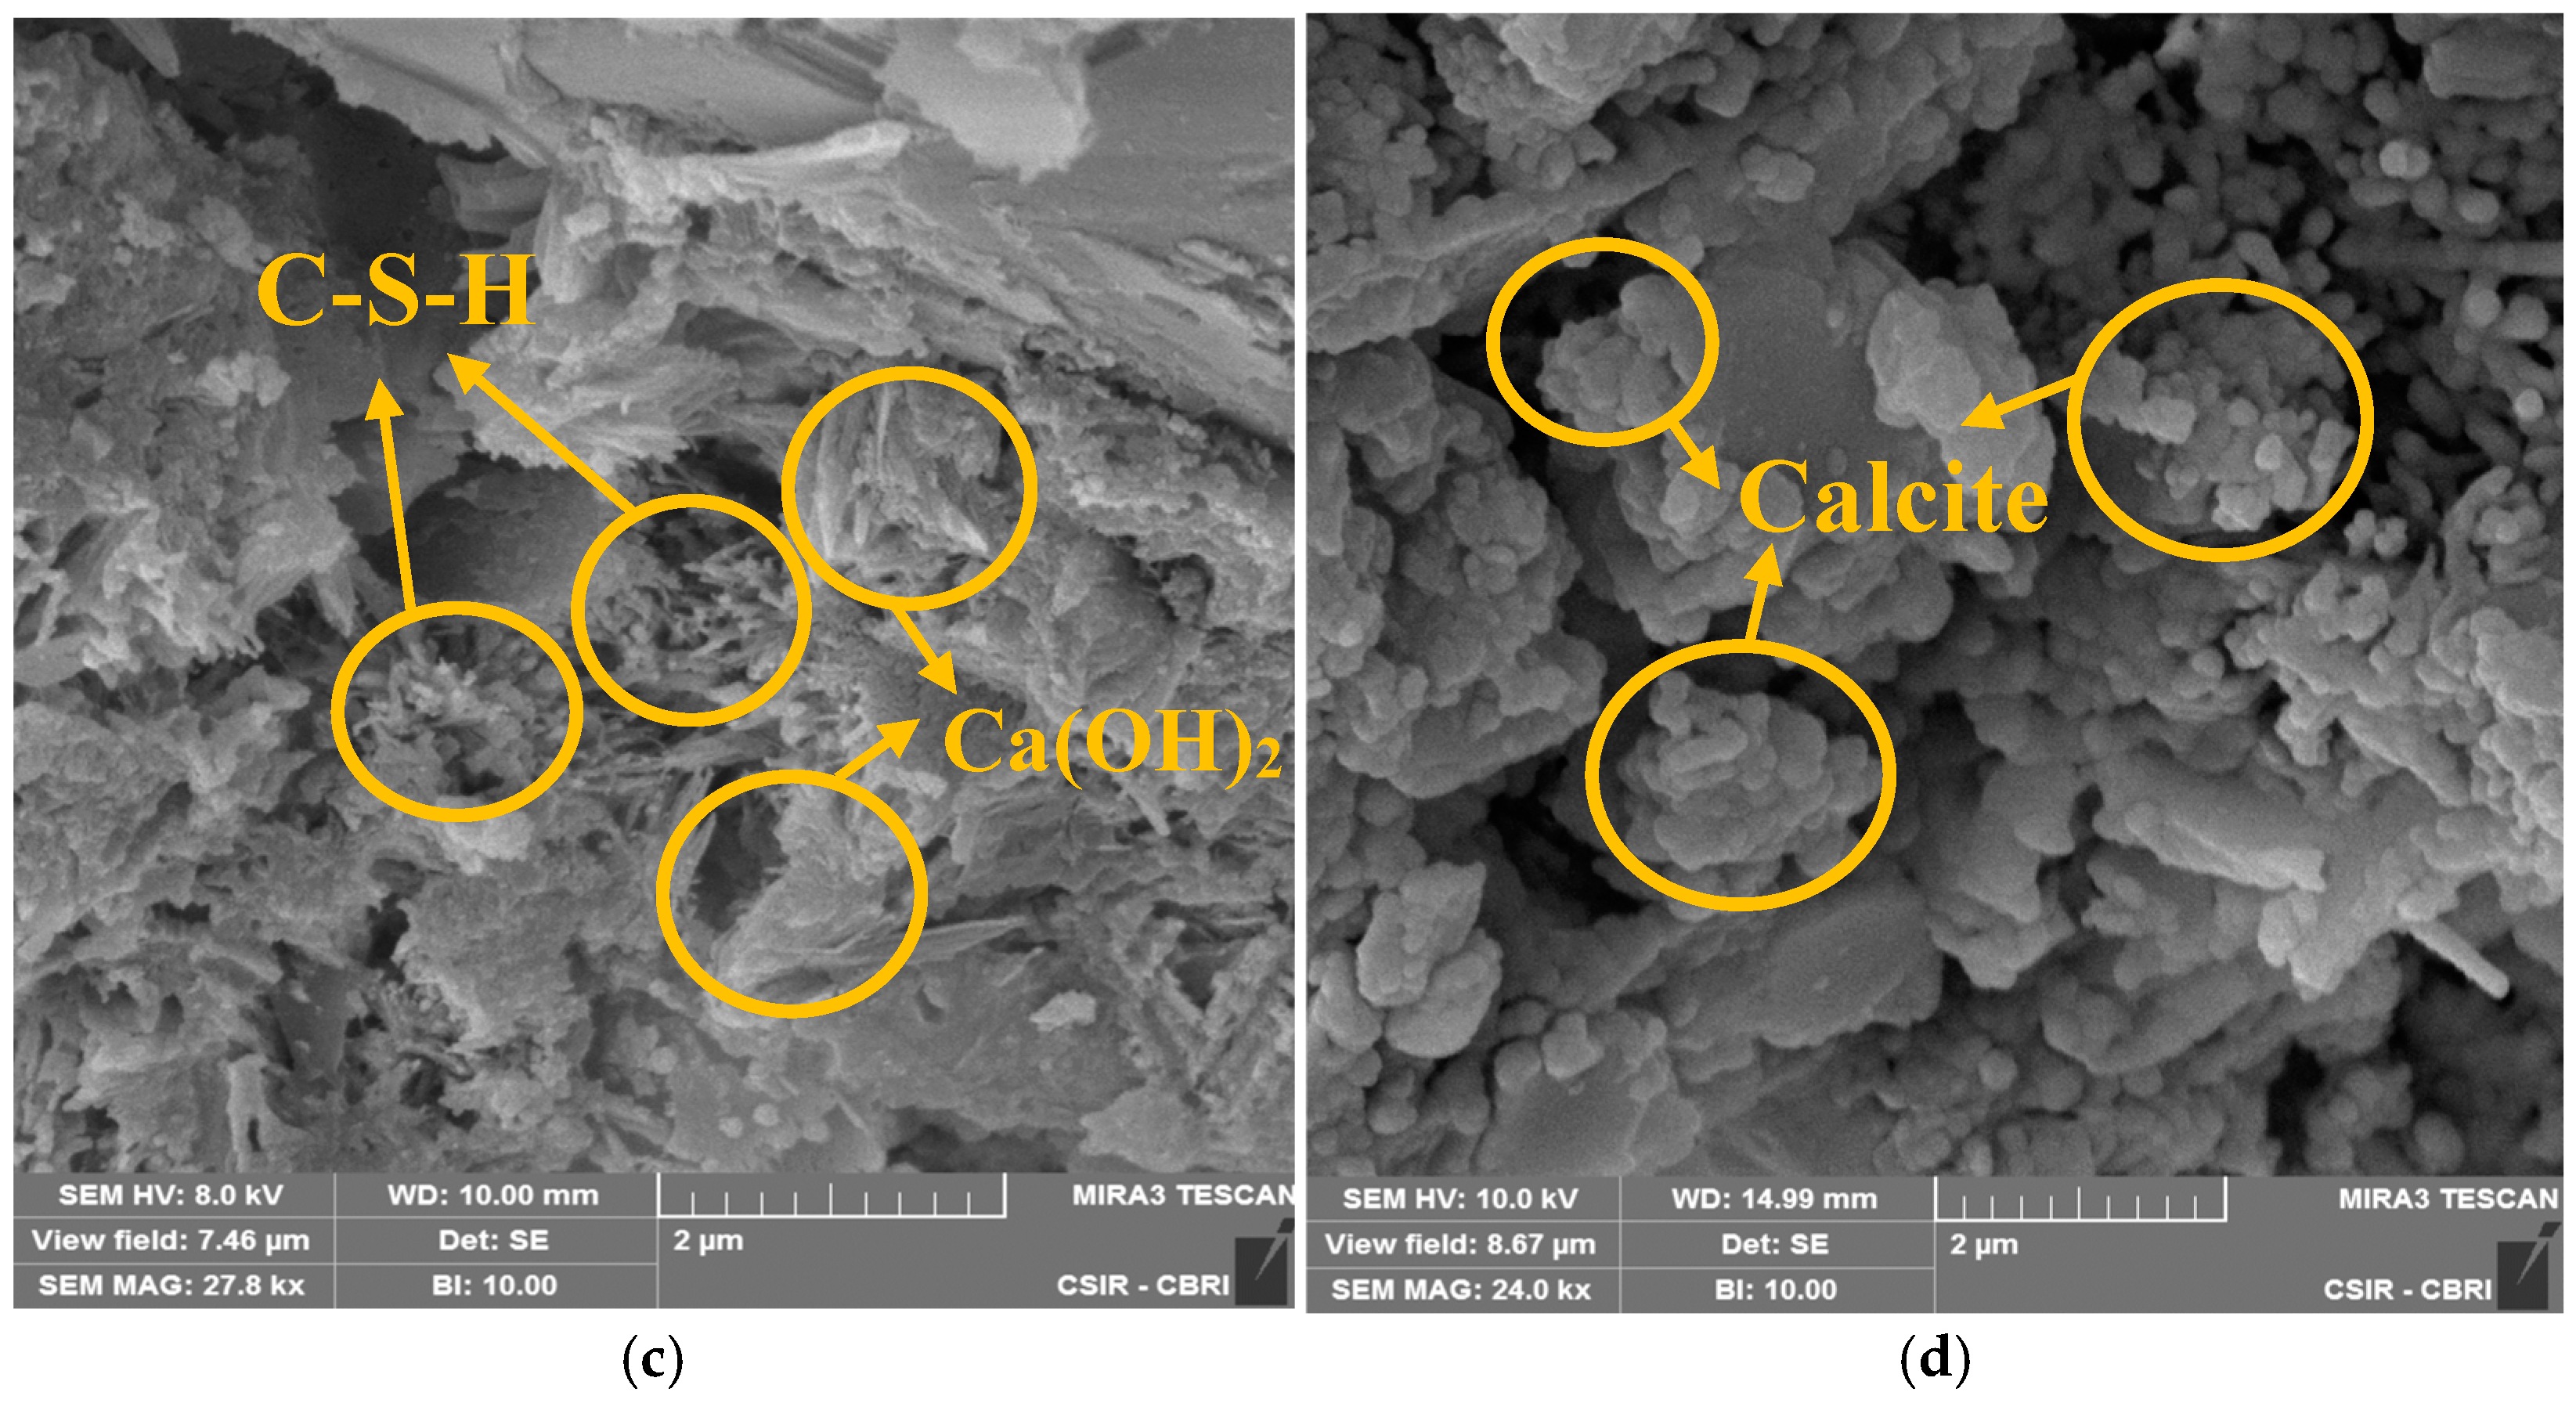
Understanding the environmental impact of concrete structures and evaluating their potential as carbon sinks requires the measuring of carbonation, which can be quantified through the CO2 uptake in concrete. The decomposition of Ca(OH)2 can be inferred from the mass loss between the temperature range of 400–460 °C, while the decomposition of CaCO3 occurs between 600–800 °C. Thus, the CO2 content of the samples after ACC was investigated using TGA. The analysis of CO2 uptake in concrete can be elucidated through the assessment of mass loss during TGA, as outlined in Equation (6), where the cement mass in the original sample could be calculated by multiplying the original mass of the concrete powder sample by the cement ratio derived from the mix design [29]. Figure 8 shows the TGA-DTG curve for mixes of M1 and M2 carbonation cured for 6 h and 72 h, and the mass loss obtained are 3.94%, 5.83%, 2.67%, and 5.48%, respectively. Figure 9 illustrates the CO2 uptake trends for the four concrete mixtures, namely M1, M2, M3, and M4. Notably, the observed CO2 uptake exhibits a direct correlation with the duration of curing, indicating that longer curing periods result in increased CO2 uptake. Conversely, a negative correlation is observed between CO2 uptake and the proportion of fly ash replacement in the concrete mixture. This implies that higher levels of fly ash substitution led to decreased CO2 uptake; this may be due to the fact that the fly ash is unreactive with CO2.
C O 2   U p t a k e   %   =   S a m p l e   m a s s   a t   600   ° C     S a m p l e   m a s s   a t   800   ° C C e m e n t   m a s s   i n   o r g i n a l   s a m p l e × 100

3.4. SEM

In the SEM image of water-cured concrete (Figure 10a,c), the microstructure shows the well-hydrated cement particles surrounded by a dense matrix of hydrated cement paste. The images display a uniform distribution of voids. The calcium hydroxide and calcium silicate hydrate gel formed as a result of hydration appear under the higher-magnification SEM images [30]. In contrast, Figure 10b,d concrete subjected to carbonation curing exhibit alterations in its microstructure due to the ingress of CO2. Carbonation leads to the dissolution of Ca(OH)2 and the formation of CaCO3, resulting in a decrease in voids due to CaCO3 precipitation within the pores, leading to a reduction in porosity and an increase in concrete density [31]. This outcome is consistent with the previous research findings. The CaCO3 crystals that formed occupy the voids and the small fractures within the interfacial transition zone (ITZ), which in turn can help to minimize the imperfections of the ITZ [28,29].

3.5. Statistical Analysis

The compressive strength of concrete depends on the presence of Flyash Content (FAC) and Carbonation Duration (CD). This study uses the statistical technique Analysis of variance (ANOVA) to evaluate the effect of Carbonation Duration (CD) and Flyash Content (FAC) on compressive strength, pH, and CO2 uptake of concrete. To determine the significance factor of experimental parameters of carbonated concrete, the ANOVA and F-test were performed. The F-test, originally introduced by Dr. Fisher, serves as a supplementary method to evaluate the primary factors at play [32]. ANOVA helps to quantify the dominance of the control factor and justify the effects of input changes on experimental responses.
The characteristics of compressive strength, pH, and CO2 uptake are always positive, and the higher the value, the better the performance of concrete. To achieve optimal conditions, the “larger is better (LB)” loss function was chosen, as it takes into account the importance of having larger values for compressive strength, pH, and CO2 uptake in concrete performance. The loss function Lij of LB performance characteristics is expressed as:
L i j = 1 n k = 1 n 1 y i j k 2
where, “Lij” is the loss function of the ith performance characteristics in the jth experiment, “n” is the number of tests, and “yijk” is the experimental value of the i-th performance characteristics in the j-th experiment at the k-th test. The loss function is further transformed into a signal-to-noise (S/N) ratio for determining the performance characteristics deviating from the desired value. The S/N ratio nij for the i-th performance characteristics in the j-th experiment is expressed as:
nij = −10log(Lij)
Table 3 displays the outcomes of ANOVA, which is employed for statistical analysis using Minitab 15 software.
From Table 3 it is observed that Carbonation Duration has great importance on compressive strength (85.50%) and CO2 uptake (75.26%) than Flyash Content, whereas the pH of concrete was highly dependent on Flyash Content (59.72%) than Carbonation Duration. The analysis indicates that the experimental error was very low-level. The larger F value indicates that the variation of the control parameters makes a big change in the performance characteristics. The p-Level value is less than 0.05, which indicates that both the Flyash Content and Carbonation Duration and retention period are significant. Figure 11 shows the variation of means of the S/N ratio with levels of input parameters.
Minitab software was utilized to develop models for the response surface. Response surface methodology consists of a series of mathematical and statistical techniques that are valuable for modeling and analyzing situations where a response of interest is influenced by various variables. Experimental data was employed to propose predictions for the compressive strength and CO2 uptake of concrete exposed to carbonation. Table 4 displays the individual coefficients for compressive strength and CO2 uptake response surface models.

4. Conclusions

Based on the ACC procedure utilized for the concrete mixture examined in this research, the following conclusions can be made:
(1)
Carbonation curing leads to accelerated strength development and densification of the concrete surface, resulting in improved durability over conventional water-curing methods.
(2)
The process of carbonation curing allows concrete to absorb CO2, offering potential benefits for reducing greenhouse gas emissions and mitigating global warming.
(3)
There is a significant improvement in the compressive strength with a percentage increase of 70.46%, 111.28%, 30.36%, and 36.69%, respectively, for 0%, 10%, 20%, and 30% fly ash contents in concrete samples subjected to 72 h of accelerated carbonation curing.
(4)
Longer durations of carbonation result in higher compressive strength gains, with 72-h durations showing the most significant improvement. Additionally, substituting fly ash with 10% in the mix can achieve comparable strength to conventional water-cured concrete.
(5)
While the pH of carbonated concrete is lower than water-cured concrete, it remains within safe limits to prevent reinforcement corrosion. Additionally, the average carbonation depth is minimal, reducing the risk of CO2-induced corrosion.
(6)
The use of carbonation curing with industrial waste fly ash not only creates eco-friendly concrete but also contributes to CO2 sequestration efforts, promoting sustainability in construction practices.

Author Contributions

Conceptualization K.S.K. and H.K.S.; formal analysis A.P., K.S.K. and P.R.; methodology K.S.K., H.K.S. and A.P.; software, K.S.K. and A.P.; investigation, K.S.K., A.P. and P.R.; supervision K.S.K. and H.K.S.; visualization K.S.K., A.P. and P.R.; writing—original draft preparation, A.P. and K.S.K.; writing—review and editing, K.S.K. and H.K.S.; Funding acquisition K.S.K. All authors have read and agreed to the published version of the manuscript.

Funding

This work was supported by the Council of Scientific and Industrial Research—Central Building Research Institute (CSIR–CBRI) under the project HCP 48.

Institutional Review Board Statement

Not applicable.

Informed Consent Statement

Not applicable.

Data Availability Statement

Data are contained within the article.

Conflicts of Interest

The authors declare no conflict of interest.

References

  1. Yoro, K.O.; Daramola, M.O. CO2 emission sources, greenhouse gases, and the global warming effect. In Advances in Carbon Capture; Elsevier: Amsterdam, The Netherlands, 2020; pp. 3–28. [Google Scholar] [CrossRef]
  2. Worrell, E.; Price, L.; Martin, N.; Hendriks, C.; Meida, L.O. Carbon dioxide emissions from the global cement industry. Annu. Rev. Energy Environ. 2001, 26, 303–329. [Google Scholar] [CrossRef]
  3. Huang, L.; Krigsvoll, G.; Johansen, F.; Liu, Y.; Zhang, X. Carbon emission of global construction sector. Renew. Sustain. Energy Rev. 2018, 81, 1906–1916. [Google Scholar] [CrossRef]
  4. Chen, J.; Wang, Y.; Shi, Q.; Peng, X.; Zheng, J. An international comparison analysis of CO2 emissions in the construction industry. Sustain. Dev. 2021, 29, 754–767. [Google Scholar] [CrossRef]
  5. Ye, J.; Liu, S.; Zhao, Y.; Li, Y.; Fang, J.; Zhang, H.; Guan, X. Development of Ultrafine Mineral Admixture from Magnesium Slag and Sequestration of CO2. Buildings 2023, 13, 204. [Google Scholar] [CrossRef]
  6. Davidovits, J. Global Warming Impact on the Cement and Aggregates Industries. World Resour. Rev. 1994, 6, 263–278. [Google Scholar]
  7. Huntzinger, D.N.; Eatmon, T.D. A life-cycle assessment of Portland cement manufacturing: Comparing the traditional process with alternative technologies. J. Clean. Prod. 2009, 17, 668–675. [Google Scholar] [CrossRef]
  8. Meyer, C. The greening of the concrete industry. Cem. Concr. Compos. 2009, 31, 601–605. [Google Scholar] [CrossRef]
  9. Pasupathy, K.; Sanjayan, J.; Rajeev, P. Evaluation of alkalinity changes and carbonation of geopolymer concrete exposed to wetting and drying. J. Build. Eng. 2021, 35, 102029. [Google Scholar] [CrossRef]
  10. Guleria, H.; Sharma, D.; Goyal, S. Long term performance of concrete using accelerated carbonation curing: An effective CCUS technique. Eur. J. Environ. Civ. Eng. 2023, 28, 2138–2159. [Google Scholar] [CrossRef]
  11. Goyal, S.; Sharma, D. CO2 Sequestration on Cement; Elsevier: Amsterdam, The Netherlands, 2020. [Google Scholar] [CrossRef]
  12. Rostami, V.; Shao, Y.; Boyd, A.J. Carbonation Curing versus Steam Curing for Precast Concrete Production. J. Mater. Civ. Eng. 2012, 24, 1221–1229. [Google Scholar] [CrossRef]
  13. Berger, R.L.; Young, J.F.; Leung, K. Acceleration of Hydration of Calcium Silicates by Carbon Dioxide Treatment. Nat. Phys. Sci. 1972, 240, 16–18. [Google Scholar] [CrossRef]
  14. Berger, R.L. Stabilization of silicate structures by carbonation. Cem. Concr. Res. 1979, 9, 649–651. [Google Scholar] [CrossRef]
  15. Rostami, V.; Shao, Y.; Boyd, A.J.; He, Z. Microstructure of cement paste subject to early carbonation curing. Cem. Concr. Res. 2012, 42, 186–193. [Google Scholar] [CrossRef]
  16. Liu, Y.; Zhuge, Y.; Chow, C.W.; Keegan, A.; Li, D.; Pham, P.N.; Huang, J.; Siddique, R. Properties and microstructure of concrete blocks incorporating drinking water treatment sludge exposed to early-age carbonation curing. J. Clean. Prod. 2020, 261, 121257. [Google Scholar] [CrossRef]
  17. Jang, J.; Kim, G.; Kim, H.; Lee, H. Review on recent advances in CO2 utilization and sequestration technologies in cement-based materials. Constr. Build. Mater. 2016, 127, 762–773. [Google Scholar] [CrossRef]
  18. Zhang, D.; Ghouleh, Z.; Shao, Y. Review on carbonation curing of cement-based materials. J. CO2 Util. 2017, 21, 119–131. [Google Scholar] [CrossRef]
  19. Sharma, D.; Goyal, S. Effect of accelerated carbonation curing on near surface properties of concrete. Eur. J. Environ. Civ. Eng. 2020, 26, 1300–1321. [Google Scholar] [CrossRef]
  20. Papadakis, V.G.; Vayenas, C.G.; Fardis, M.N. A reaction engineering approach to the problem of concrete carbonation. AIChE J. 1989, 35, 1639–1650. [Google Scholar] [CrossRef]
  21. Zhan, B.J.; Poon, C.S.; Shi, C.J. Materials characteristics affecting CO2 curing of concrete blocks containing recycled aggregates. Cem. Concr. Compos. 2016, 67, 50–59. [Google Scholar] [CrossRef]
  22. Xuan, D.; Zhan, B.; Poon, C.S. Development of a new generation of eco-friendly concrete blocks by accelerated mineral carbonation. J. Clean. Prod. 2016, 133, 1235–1241. [Google Scholar] [CrossRef]
  23. IS: 8112—2013; Specification for 43 Grade Ordinary Portland Cement. Bureau of Indian Standard (BIS): Delhi, Indian, 2013; p. 17.
  24. IS:3812 (Part-1); Pulverized Fuel Ash—Specification. Part 1: For use as Pozzolana in cement, Cement Mortar and Concrete (Second Revision). Bureau of Indian Standards: New Delhi, India, 2013; pp. 1–14.
  25. IS 383 (2016); Coarse and Fine Aggregate for Concrete-Specification. Bureau of Indian Standard: New Delhi, India, 2016; p. 110002.
  26. Assaggaf, R.; Adekunle, S.K.; Ahmad, S.; Maslehuddin, M.; Al-Amoudi, O.S.B.; Ali, S. Mechanical properties, durability characteristics and shrinkage of plain cement and fly ash concretes subjected to accelerated carbonation curing. J. S. Afr. Inst. Civ. Eng. 2019, 61, 73–81. [Google Scholar] [CrossRef]
  27. Rostami, V.; Shao, Y.; Boyd, A.J. Durability of concrete pipes subjected to combined steam and carbonation curing. Constr. Build. Mater. 2011, 25, 3345–3355. [Google Scholar] [CrossRef]
  28. Reddy, P.N.; Naqash, J.A. Experimental study on TGA, XRD and SEM analysis of concrete with ultra-fine slag. Int. J. Eng. Trans. B Appl. 2019, 32, 679–684. [Google Scholar] [CrossRef]
  29. Xian, X.; Zhang, D.; Lin, H.; Shao, Y. Ambient pressure carbonation curing of reinforced concrete for CO2 utilization and corrosion resistance. J. CO2 Util. 2022, 56, 101861. [Google Scholar] [CrossRef]
  30. Horn, L. Targeted/Emerging Therapies for Metastatic Non–Small Cell Lung Cancer. J. Natl. Compr. Cancer Netw. 2015, 13, 676–678. [Google Scholar] [CrossRef]
  31. Scrivener, K.L.; Kirkpatrick, R.J. Innovation in use and research on cementitious material. Cem. Concr. Res. 2008, 38, 128–136. [Google Scholar] [CrossRef]
  32. Douglas, C.M. Design and Analysis of Experiments; John Wiley & Sons, Inc.: New York, NY, USA, 2012. [Google Scholar]
Figure 1. Particle-size distribution curve of aggregates.
Buildings 14 02573 g001
Figure 2. (a) Basic setup for Accelerated Carbonation Curing. (b) Accelerated Carbonation Chamber.
Buildings 14 02573 g002
Figure 3. (a) Preparation of samples and (b) curing.
Buildings 14 02573 g003
Figure 4. Compressive strength of (a) M1, (b) M2, (c) M3, and (d) M4 mixes.
Buildings 14 02573 g004
Figure 5. Phenolphthalein-stained concrete specimen after ACC.
Buildings 14 02573 g005
Figure 6. pH Analysis results of (a) M1, (b) M2, (c) M3, and (d) M4 mixes.
Buildings 14 02573 g006
Figure 7. XRD of M1 and M2 accelerated carbonation-cured and water-cured mixes.
Buildings 14 02573 g007
Figure 8. (a) TGA (b) DTG analysis of carbonation cured M1 and M2 sample for 6 h and 72 h.
Buildings 14 02573 g008
Figure 9. CO2 uptake of the samples at different time durations.
Buildings 14 02573 g009
Figure 10. SEM images of concrete samples cured at different curing regimes: (a) M1 water cured (200 μm), (b) M1 CO2 cured (200 μm), (c) M1 water cured (2 μm), and (d) M1 CO2 cured (2 μm).
Buildings 14 02573 g010aBuildings 14 02573 g010b
Figure 11. S/N graphs of experimental parameters.
Buildings 14 02573 g011
Table 1. Chemical composition of cement and fly ash.
OxideCaOSiO2Al2O3Fe2O3MgO
Cement63.5021.706.604.602.40
Fly ash3.1362.5727.405.920.98
Table 2. Mix proportioning for 1 m3 of concrete mixture.
MaterialsM1M2M3M4
OPC375337.5300262.5
Fly ash-37.575112.5
Fine Aggregate672.06672.06672.06672.06
Coarse Aggregate1157.571157.571157.571157.57
Water168.75168.75168.75168.75
Table 3. Results of ANOVA.
Response FactorControl FactorDFSSMSF-LevelContribution (%)p-Level
Compressive StrengthFAC353.617.8711.9512.40.006
CD2369.37184.69123.4785.50
Error68.9822.55 2.1
pHFAC30.430.1410.759.720.008
CD20.210.17.7229.160.022
Error60.080.01
CO2 uptakeFAC 34.471.4912.521.30.005
CD215.297.8966.2375.260
Error60.720.012 3.44
Table 4. Interferences about the individual coefficient of the response surface models.
Input TermOutput Parameters
Compressive StrengthCO2 Uptake
CoefficientTpCoefficientTp
Constant10.51828.3730.0002.917967.7250.000
FAC0.12271.0450.336−0.11938−3.3820.015
CD0.39165.1210.0020.180377.8450.000
FAC × FAC−0.0094−2.6560.0380.001851.7380.133
CD × CD−0.0023−2.6000.041−0.0019−7.0290.000
FAC × CD−0.0003−0.2480.8130.000401.1830.282
Standard Deviation1.22673 0.36883
R Sq. (%)97.9 96.11
Note: FAC-Flyash Content, CD-Carbonation Duration.
Disclaimer/Publisher’s Note: The statements, opinions and data contained in all publications are solely those of the individual author(s) and contributor(s) and not of MDPI and/or the editor(s). MDPI and/or the editor(s) disclaim responsibility for any injury to people or property resulting from any ideas, methods, instructions or products referred to in the content.

