Article

Research on New Method for Safety Testing of Steel Structures—Combining 3D Laser Scanning Technology with FEA

1
Civil and Environmental Engineering, Harbin Institute of Technology, Shenzhen 518055, China
2
China Construction Science and Industry Corporation Ltd., Shenzhen 518054, China
3
Yuanyu Smart Data (Shenzhen) Technology Co., Ltd., Shenzhen 518063, China
*
Author to whom correspondence should be addressed.
Buildings 2024, 14(8), 2583; https://doi.org/10.3390/buildings14082583
Submission received: 18 July 2024 / Revised: 13 August 2024 / Accepted: 19 August 2024 / Published: 22 August 2024

Abstract

:
This paper introduces a novel approach to assessing structural safety, specifically aimed at evaluating the safety of existing structures. Firstly, a point cloud model of the existing commercial complex was captured utilizing three-dimensional (3D) laser scanning technology. Subsequently, an intelligent method for identifying holes within the point cloud model was proposed, built upon a YOLO v5-based framework, to ascertain the dimensions and locations of holes within the commercial complex. Secondly, Poisson surface reconstruction, coupled with partially self-developed algorithms, was employed to reconstruct the surface of the structure, facilitating the three-dimensional geometric reconstruction of the commercial complex. Lastly, a finite element model of the framed structure with holes was established using the reconstructed 3D model, and a safety analysis was conducted. The research findings reveal that the YOLO v5-based intelligent hole identification method significantly enhances the level of intelligence in point cloud data processing, reducing manual intervention time and boosting operational efficiency. Furthermore, through Poisson surface reconstruction and the self-developed algorithms, we have successfully achieved automated surface reconstruction, where the resulting geometric model accurately reflects the dimensional information of the commercial complex. Additionally, the maximum uniformly distributed surface load that the floor slabs within the framed structure with holes can withstand should not exceed 17.7 kN/m2, and its vertical deformation resistance stiffness is approximately 71.6% of that of a frame without holes.

1. Introduction

With continuous economic and social development, the decoration styles, usage functions, and structural performances of existing buildings are increasingly unable to satisfy the needs of modern individuals. Meanwhile, the demolition and reconstruction of these buildings lead to a significant waste of resources. Therefore, the reinforcement and retrofit upgrading of existing buildings has gradually become a development trend in the construction industry. These buildings may exhibit defects such as damage and deformation during prolonged usage, and many older buildings face a common issue: the loss of design and construction information due to age. Consequently, before undergoing reinforcement and retrofit upgrading, we must conduct thorough inspections, evaluations, and safety analyses of the existing building structures. This paper is based on the literature review proposed by Umar [1,2] to research the relevant literature.
Currently, many existing structural assessment and retrofit projects still rely on traditional measurement and inspection methods. Wang et al. [3] conducted a detailed inspection of the supporting structure of a billboard outside a shopping mall using instruments such as a crack width gauge, magnifying glass, verticality detector, and rebound hammer. They further analyzed the safety of the billboard and its supporting main structure using Midas software (https://www.midasoft.com/, accessed on 17 July 2024). Xu [4] comprehensively evaluated the safety of a completed bridge project through a combination of theoretical analysis, numerical simulation, and field testing. Gao [5] and Wang [6] have conducted detailed measurements and inspections on steel-structured roofing systems after prolonged usage. Based on the inspection results, they established finite element models for the roof structures and further analyzed the safety of these structures using these models. Ávila et al. [7] established finite element models for existing buildings based on historical data and proposed a new method to assess the reliability of existing masonry buildings based on the calculation results of these models. Lehner [8], Sedmak [9], and Rajchel [10] predicted the remaining lifespan of steel structural supports and truss bridges after prolonged usage based on historical data. Depale et al. [11] presented the French Institute of Mechanical Industry Technology’s method for evaluating the remaining life of existing equipment and steel structures, and evaluated the remaining life of a harbor crane. Radu et al. [12] evaluated a steel structure bridge that had been in service for almost one hundred years and assessed the impact of defects on structural integrity and life.
With the rapid progress of emerging technologies, the construction industry is embracing new opportunities for high-quality development. The continuous emergence of new technologies is driving the transformation, upgrading, and intelligent development of the construction industry. Scholars have introduced 3D laser scanning technology into the construction industry, demonstrating its immense potential. Chacon et al. [13] successfully measured the initial geometric defects of planar steel frames using terrestrial laser scanners. Xu et al. [14] comprehensively detected the geometric defects of circular steel tubes through 3D laser scanning technology and explored their impact on the compressive and bending capacities of steel tubes. Ban et al. [15] measured the dimensions and geometric defects of square hollow section short columns using 3D laser scanning technology, conducting in-depth research on their local buckling performance. Yastikli [16] applied 3D laser scanning technology to the documentation of historical artifacts, providing strong support for subsequent restoration and renovation work. Ma et al. [17] proposed a combined use of two (terrestrial and drone) laser scanning techniques to assess the dimensional quality of the bridge after construction. Wang et al. [18] proposed a new method that can automatically and rapidly extract geometric models from point cloud data, utilizing these models for the construction of Building Information Modeling (BIM). Kong et al. [19] proposed an automated method that can quickly generate editable engineering drawings from point cloud data in a short time, significantly improving efficiency. Li et al. [20] optimized existing algorithms and proposed new solutions to the problem of automatically extracting 2D drawings from 3D point cloud data. Stefanska et al. [21] analyzed the application potential of 3D laser scanning technology in the renovation and upgrading of existing buildings and concluded that this technology can not only save costs and time but also effectively reduce errors. Parent et al. [22] conducted a mechanical performance analysis of the vault of Notre Dame Cathedral after the fire based on 3D laser scanning data and proposed an innovative hybrid model. Gao et al. [23] utilized lidar technology to detect damages in reinforced concrete shear walls, updated finite element models based on point cloud models, and evaluated the seismic performance of damaged shear walls. Akhlaghi et al. [24] combined model updating theory with point cloud analysis methods to identify damage and assess the performance of a reinforced concrete structure after an earthquake. Tzortzinis et al. [25] measured the corrosion of bridges using 3D laser scanning technology and assessed the residual bearing capacity of steel beams by combining it with finite element methods. Bouzas et al. [26] used visual inspection, laser scanner measurement, ultrasonic testing, and environmental vibration testing to detect an existing bridge, and evaluated the safety of the structure based on reliability. Based on ultrasonic testing and 3D laser scanning, Wijaya et al. [27] measured the corrosion degree of the surface of the in-service steel lamp rod, and proposed a method to evaluate its reliability.
Given that the majority of current safety analyses fail to accurately consider the impact of existing structural geometric variations on structural performance, while 3D laser scanning technology has demonstrated exceptional operational efficiency and measurement accuracy in geometric measurements, this paper proposes the utilization of 3D laser scanning as an alternative to traditional measurement methods during safety analyses. This approach aims to precisely account for the influence of geometric transformations of existing structures on their performance. The research is conducted against the backdrop of a renovation project for an existing commercial complex (see Figure 1), exploring the implementation of this methodology.
The main contributions of this paper are as follows:
(1)
A novel approach is proposed for assessing the safety of existing steel structures by integrating 3D laser scanning technology with finite element analysis (FEA), which accurately considers the impact of geometric model variations on structural performance. These geometric model variations can be caused by a variety of factors, including stress-induced deformations, material corrosion, changes during structural use, repairs, etc.
(2)
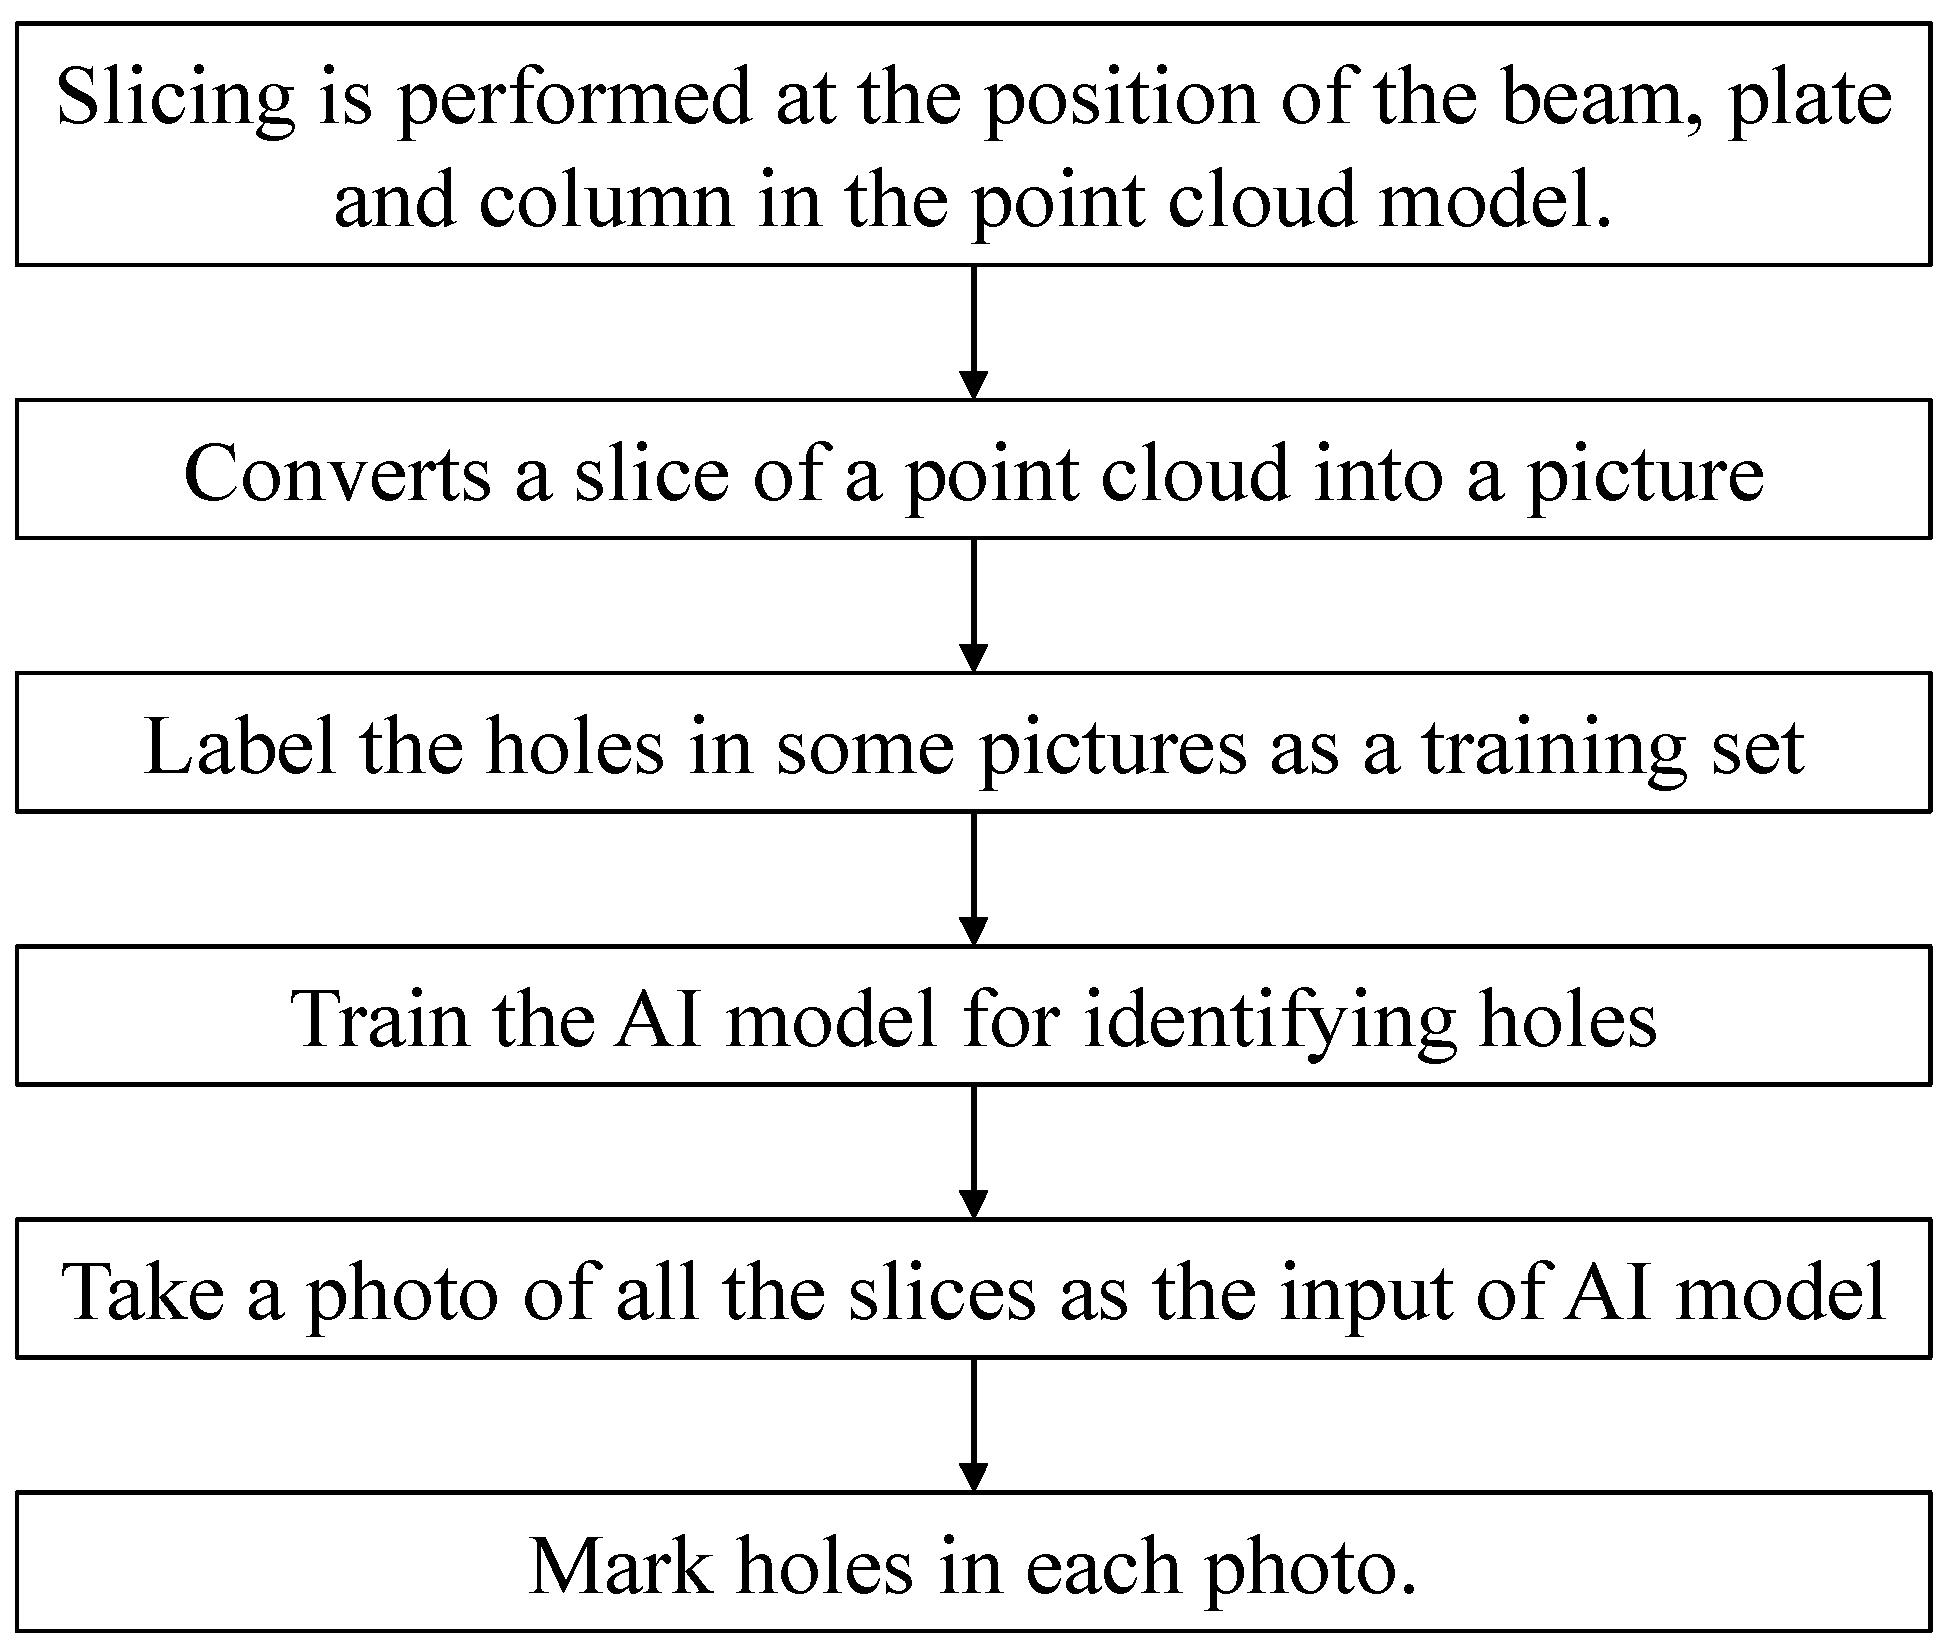
An intelligent method for identifying holes in point cloud models is introduced based on YOLO v5. This method addresses the challenges of high difficulty and significant workload associated with hole identification in point cloud models.
(3)
A method for automated modeling from point cloud data is presented, enhancing the efficiency and automation level of reverse modeling processes based on point cloud models.

2. Background

This study is conducted against the backdrop of an upgrade and renovation project of a commercial complex, which was converted from a retired luxury cruise ship. This luxury cruise ship was built in 1962 by the Saint-Nazaire Atlantic Shipyard, with a length of 168 m and a width of 21 m. The hull of the cruise ship adopts a steel structure, and the anti-corrosion coating system utilizes epoxy-based paints. The cruise ship consists of a total of nine floors (including seven floors above ground and two floors underground), with a total area of 17,346 square meters. In 1983, China Merchants Group purchased the retired Minghua cruise ship and transformed it into an onshore amusement park for use as a commercial complex.
Currently, the commercial complex is undergoing a new round of upgrading and renovation, aiming to re-emerge as an innovative cultural commercial complex in 2025. Since 1983, the commercial complex has undergone three renovations, but the specific information of the original structural design unit is untraceable, and the related original structural design and construction materials have also been lost. Therefore, the current priority is to conduct a comprehensive inspection, survey, and safety assessment of the hull structure, in order to provide an accurate basis for the subsequent renovation work.
Yiu Lian Dockyards (She Kou) Limited conducted a thorough measurement of the commercial complex within the accessible range, utilizing technical means such as 3D scanning and field measurement. This allowed the company to successfully obtain the existing structural form and precise dimensional data of the commercial complex. Based on these data, the company drew detailed structural drawings. Specifically, the plan view of the fifth deck and the cross-section view of 104# are shown in Figure 2.
The Central Research Institute of Building and Construction (Shenzhen) Co., Ltd., MCC Group in Shenzhen, China has conducted a comprehensive inspection of the structural layout, component dimensions, joint status, structural damage, and steel material properties of the commercial complex, and on-site operation photos are shown in Figure 3. The inspection results indicate that there are a total of 1553 holes in the components such as steel beams, decks, stiffeners, etc., on the ship, of which 413 are originally designed holes and 1140 are newly added holes. Furthermore, the randomly inspected 15 steel samples all meet the performance standards of Q235 construction steel, and the specific mechanical property distribution is detailed in Table 1. Additionally, the welded joint welds that were randomly inspected all meet the quality standards, and no issues such as fracture, loosening, falling off, screw bending, or corrosion were found in the bolt joints that were randomly inspected.

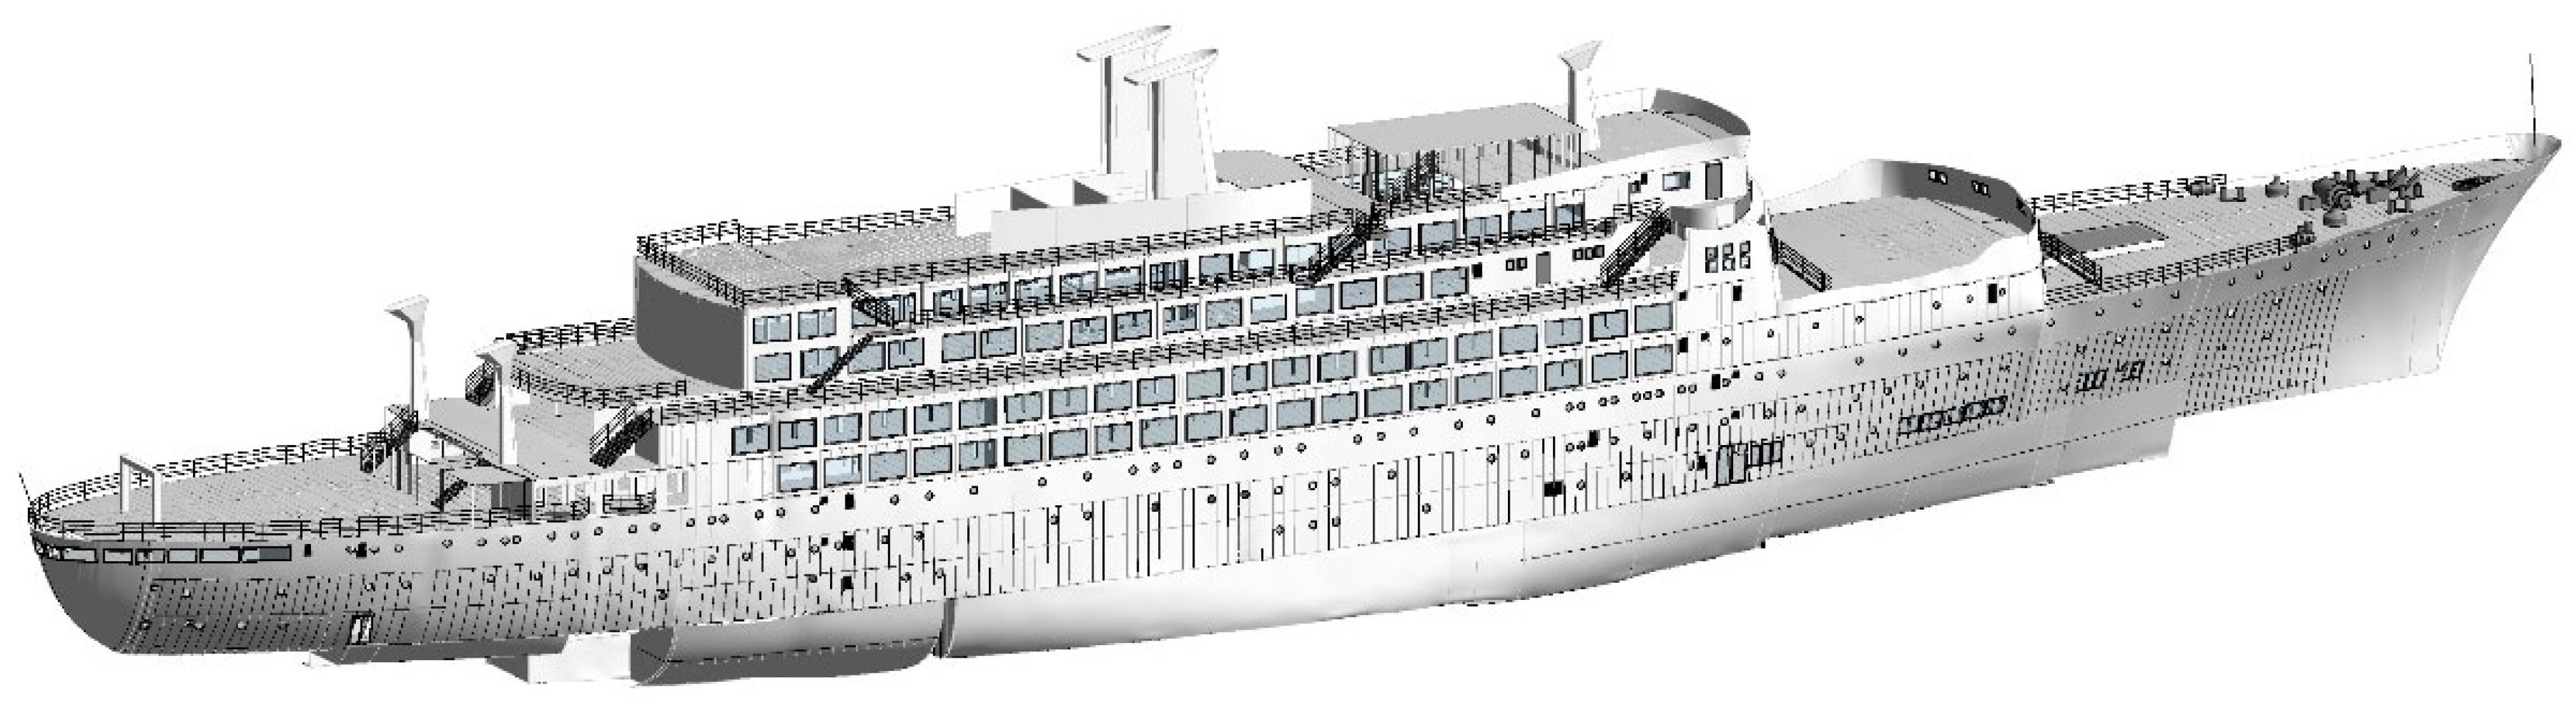
3. Three-Dimensional Geometric Reconstruction of Commercial Complex

3.1. Acquisition and Processing of Point Cloud

3.1.1. Acquisition of Point Cloud Data

This project employed 3D laser scanners to conduct multi-angle scanning of the interior and exterior of the commercial complex in order to rapidly acquire and record critical information such as coordinates, color, and reflectance. During the scanning process, two different types of scanning equipment were selected. For the exterior of the commercial complex, we utilized the Faro S350 scanner (Faro, Lake Mary, FL, USA), which boasts a maximum scanning range of 350 m and a scanning speed of up to 976,000 points, making it particularly suitable for outdoor scanning and effectively reducing scanning time. For the interior of the commercial complex, we chose the Trimble X7 scanner (Trimble, Westminster, CO, USA), which has a maximum scanning range of 80 m and a scanning speed of up to 500,000 points, perfectly suited for indoor scanning and capable of capturing detailed structural information within the commercial complex.
We require multiple scans of the commercial complex due to its immense size, as a single scan is insufficient to capture complete point cloud data. Prior to the on-site scanning, it is imperative to pre-plan the scanning routes and determine the number and locations of scans based on the scanner’s range and the dimensions of the commercial complex. During the planning phase, we must take into account the duration of the scanning operation, scanning accuracy, and the validity of the data comprehensively. After careful planning, we ultimately decided to conduct approximately 100 scans on the exterior of the commercial complex and around 700 scans on the interior.
To conduct precise control network measurements on the commercial complex, we deployed numerous survey pins at the site to ensure accurate determination of the coordinates for each scanning station. In establishing the control network, we took into account both the visibility between adjacent control points and the comprehensive coverage of the entire structure by the control points. To facilitate subsequent renovation work, we will first transform the coordinates of the point cloud through the control network and then introduce the transformed point cloud model into the geographic coordinate system.
To facilitate the smooth registration of point cloud data between various scanning stations, we affixed multiple black-and-white target papers at the site. After each scanning session, the scanning data were promptly inspected to ensure its accuracy before proceeding to the next scanning station. This practice ensures the validity and integrity of the scanning data, thereby enhancing the efficiency of point cloud data processing. The on-site operation is illustrated in Figure 4.

3.1.2. Processing of Point Cloud Data

To obtain a complete point cloud model of the commercial complex, the first step is to register the point cloud data acquired from over 800 scanning stations, followed by the removal of noise data unrelated to the commercial complex.
During the registration process of point cloud data, initially, we imported the interior and exterior point cloud data of the commercial complex into Trimble RealWorks 12.3 and FRAO Scene 2019.0 software, respectively, to perform color assignment and noise reduction on the scanning data from each scanning station. Secondly, the registered point cloud data were exported from Trimble RealWorks and FRAO Scene software. Finally, utilizing the Iterative Closest Point algorithm, the association and movement of point cloud data were achieved through iterative calculations of the closest distance from each point to its corresponding surface, thus completing the registration of the point cloud. The registered point cloud model is shown in Figure 5a.
Due to factors such as the scanner’s precision limitations, human operational errors, and the field environment, the registered point cloud model still contains noise points, necessitating further denoising processing for subsequent modeling tasks. Moreover, owing to the structural complexity of the commercial complex, its point cloud data are often disorganized, and it is difficult to achieve an ideal denoising effect through a single filter. Therefore, in this project, we employed a combination of filtering and manual processing for denoising. Firstly, we manually removed obvious noise points and point cloud data unrelated to the commercial complex. Then, we applied the bilateral filtering algorithm and K-nearest neighbor plane fitting filtering method separately to remove noise points within the commercial complex. After such denoising processing, the resulting point cloud model is shown in Figure 5b.

3.2. Intelligent Identification of Holes in the Structure

In the commercial complex, there are a total of 1553 holes of various sizes on components such as steel beams, decks, stiffeners, and so forth. These holes were formed during the initial design phase of the cruise ship and subsequent renovation processes. Specifically, 413 holes were created during the initial design, and an additional 1140 holes were added during subsequent renovations. Figure 6 illustrates the situation of the holes in the structure of the commercial complex.
During the BIM modeling process for the commercial complex, we require accurately determining the locations and dimensions of all holes from the point cloud model. However, if this task is solely reliant on manual efforts, it would be both time-consuming and laborious, with a high likelihood of missing some holes. The YOLO family, as a single-stage object detection algorithm, is favored for its fast detection speed and high accuracy. Scholars [28,29,30] have employed it as a method for identifying defects across different domains. Consequently, to address the aforementioned issues, this study proposes an intelligent method for identifying holes in point clouds based on the YOLO object detection algorithm.
The process of intelligent identification of holes is illustrated in Figure 7. Firstly, we perform slicing with appropriate thicknesses on the point cloud model at the positions of beams, plates, and columns. Secondly, these acquired point cloud slices are converted into images. Thirdly, a subset of the images is randomly selected, and labels are attached to the holes in the images. Subsequently, the labeled images are utilized to train the AI model. Finally, all cross-sectional images are used as input for the AI model to identify the holes in each cross-section.
The AI model for hole identification is derived from the YOLO v5 basic framework with modifications to the output layer, enabling the model to recognize not only the hole categories but also the hole sizes. For square holes, their sizes are equivalent to the dimensions of the rectangular boxes identified by the AI model. However, for circular holes, further calculations are required to determine their sizes. The specific calculation steps are as follows: Firstly, based on the recognition results of the AI model, the corresponding point cloud data within the rectangular box are extracted from the point cloud slice. Secondly, a point is randomly selected from the extracted point cloud as the center of a sphere, and the sphere is built and gradually enlarged until it contains a specific number (5) of points, at which point the radius of the sphere is recorded. Thirdly, this process is repeated multiple times (hundreds of times) to ensure that the center traverses all points within the rectangular box. Finally, the largest radius among the hundreds of recorded radii is identified, and this largest radius represents the size of the circular hole. It is worth noting that the 5 points mentioned in the second step are determined based on the analysis of point cloud noise.

3.3. Surface Reconstruction

Surface reconstruction refers to the process of converting discrete 3D point data into continuous surfaces. Therefore, to obtain the BIM model of the commercial complex, we need to perform surface reconstruction based on the processed point cloud model.
Currently, the primary methods for surface reconstruction include the Poisson Surface Reconstruction algorithm and the Greedy Projection Triangulation algorithm. The Poisson Surface Reconstruction algorithm is an efficient algorithm for triangular mesh reconstruction, which generates approximate surfaces by performing optimal interpolation on point cloud data. Surfaces obtained through this method exhibit excellent watertightness and are able to preserve the detailed features of the model. On the other hand, the Greedy Projection Triangulation algorithm is a rapid method for triangulating raw point clouds. It establishes topological relationships between point clouds through a greedy, projection, and triangulation process, converting point cloud data into surfaces. However, while suitable for non-closed point cloud data, the Greedy Projection Triangulation algorithm has a relatively cumbersome surface reconstruction process and achieves suboptimal results for data with uneven density variations. Taking into account the advantages and disadvantages of these two algorithms, this project will employ the Poisson Surface Reconstruction algorithm along with some self-developed algorithms to reconstruct the surface of the commercial complex. The primary role of the self-developed algorithms is to achieve automated modeling of the commercial complex.
It is widely acknowledged that automated solid modeling has been a technical challenge in the industry, often requiring the assistance of large AI models, which necessitates not only extensive training datasets but also lengthy and complex training procedures. However, despite the complexity of the structure of the commercial complex, it is actually composed of a series of fixed basic geometric primitives. Therefore, in the solid modeling process of the commercial complex, we do not need to reconstruct the structure from the point cloud inversely. Instead, we first establish a geometric component library based on the basic geometric primitives of the structure. Subsequently, by comparing the geometric characteristics of the point cloud or partially reconstructed surfaces with those in the geometric component library, the automated modeling of the commercial complex is achieved. The BIM model obtained after surface reconstruction is shown in Figure 8.
Due to the high similarity between the BIM model in Figure 8 and the actual structure, engineers can easily obtain the required geometric information through this model. Consequently, this BIM model can be geometrically considered as a geometric twin of the commercial complex.

4. Security Analysis

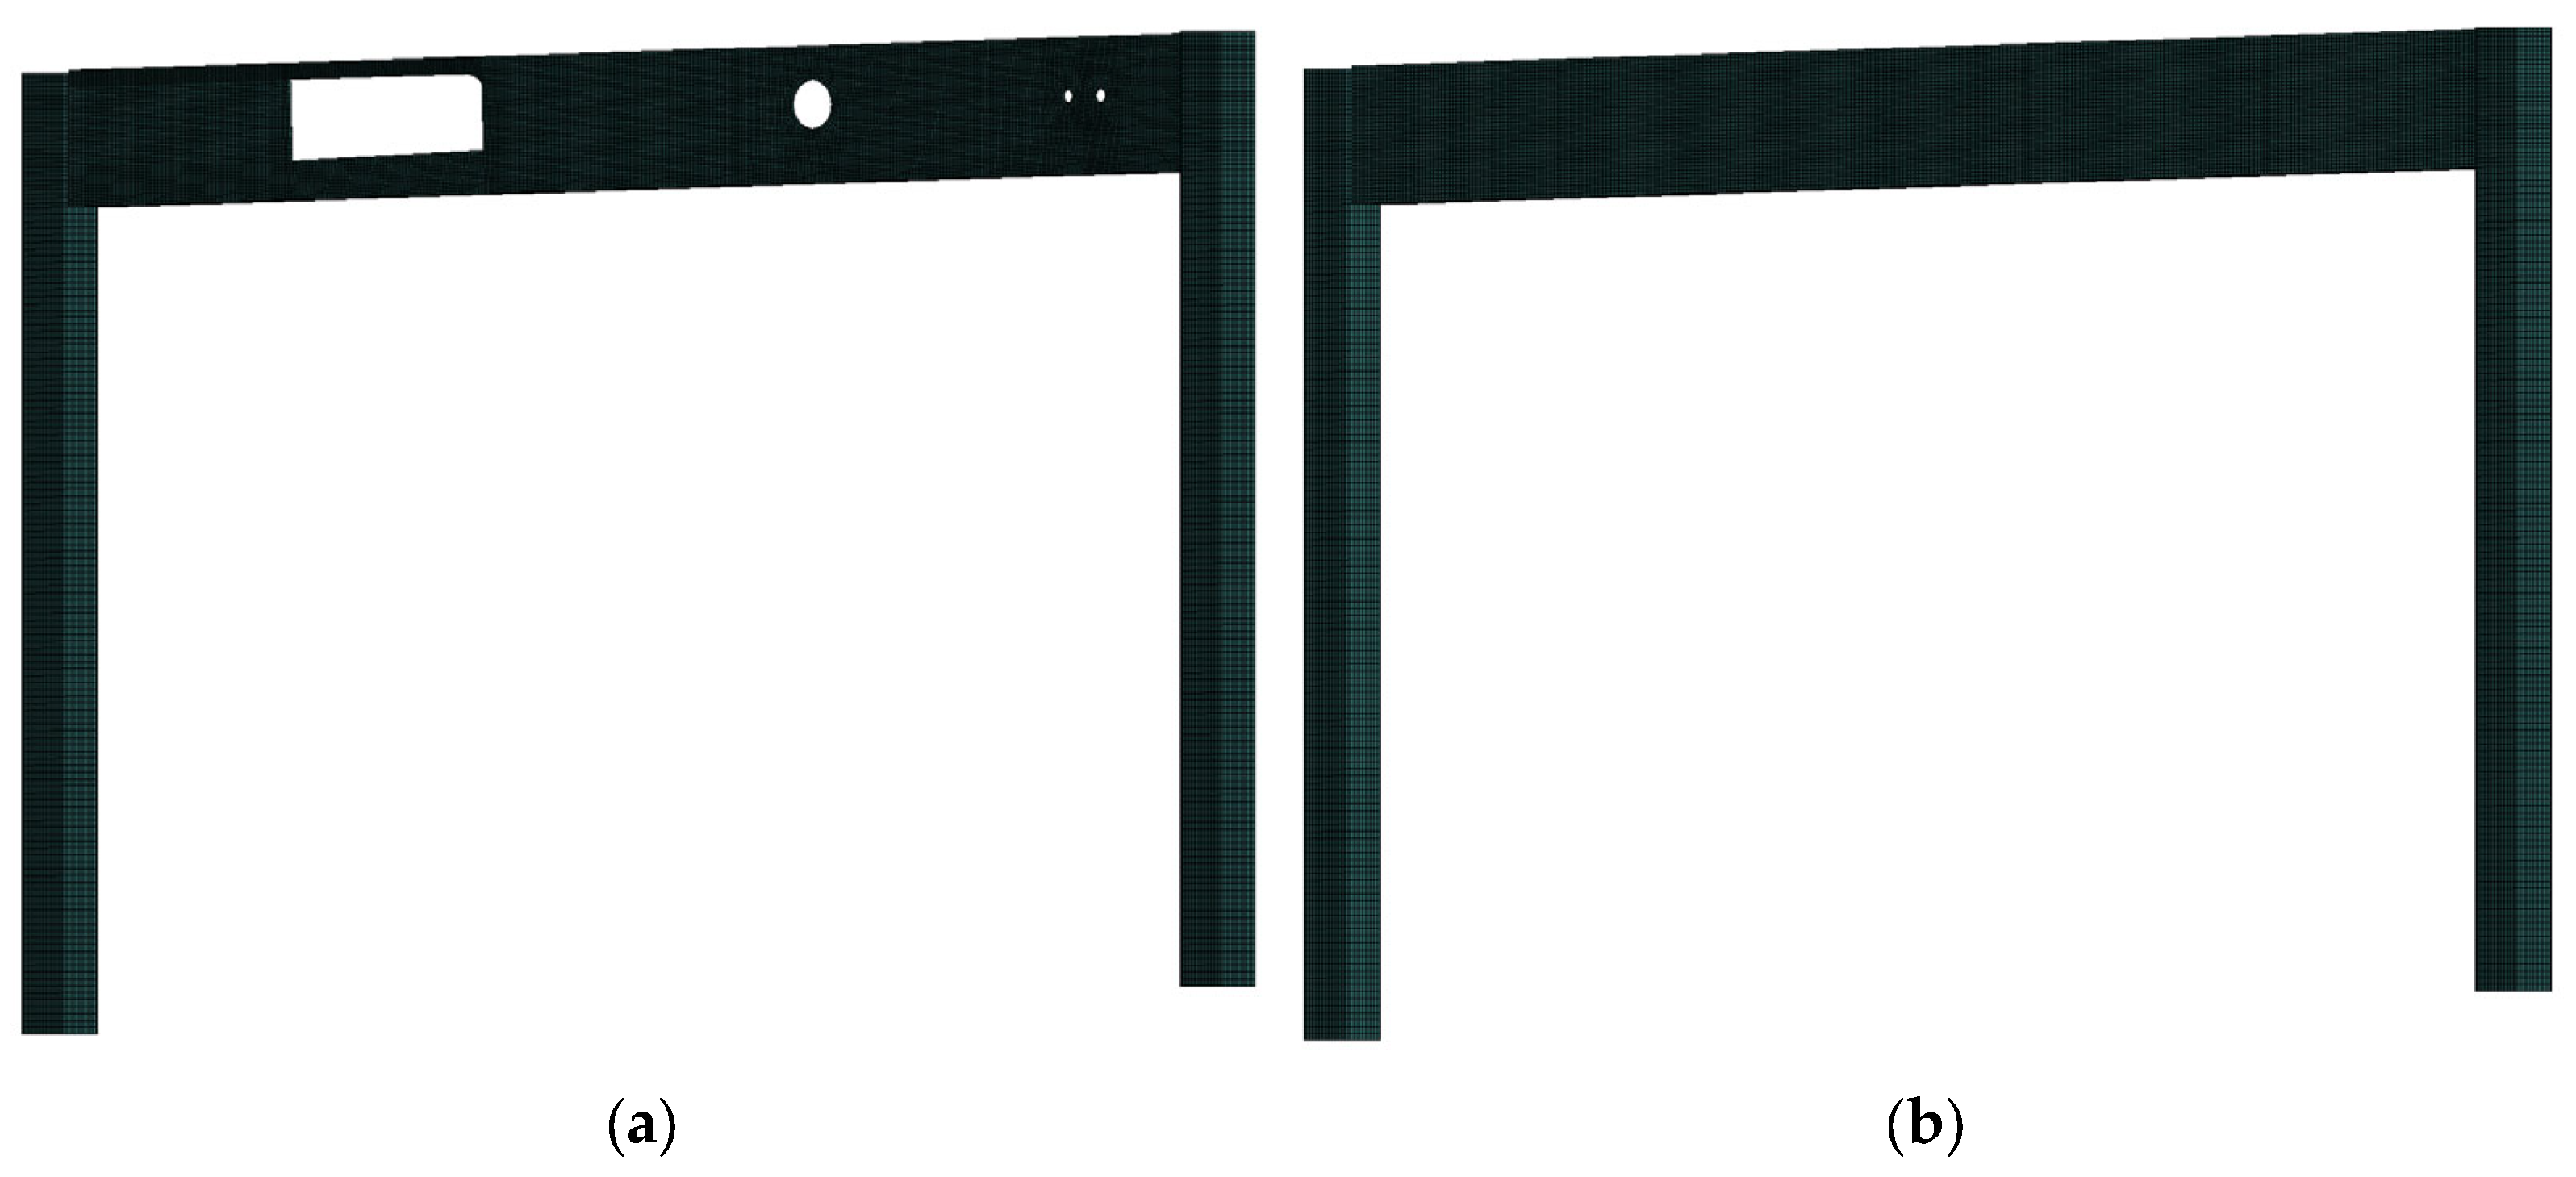
4.1. Finite Element Model

In this paper, the static in ANSYS Workbench 2020 R1 is used for analysis. During the safety analysis, we employed a geometric twin as the geometric model for finite element analysis, specifically utilizing the BIM model in Figure 8 as the geometric model for finite element analysis to ensure a precise evaluation of the model’s safety. As the relevant inspection units have already conducted a safety analysis on the entire structure, this study only selected a beam–column framework with larger holes on the structure for safety analysis.
The selected beam–column framework is illustrated in Figure 9. In Figure 9a, the red marker indicates the position of the beam–column framework within the structure, located between the fourth deck and the fifth deck. Figure 9b provides a detailed list of the number, type, and dimensions of the holes in the framework. Figure 9c–e demonstrate the simplified mechanical calculation diagram of the framework and the cross-sectional dimensions of the beam and column. During the process of simplifying the computational model, we assume that the loads on the deck are transmitted to the frame beams through secondary beams. Concurrently, the lateral displacement at the top of the frame beams is constrained by the deck and the secondary beams. Therefore, when establishing the finite element model, we set the length of the secondary beam’s influence zone on the frame beam to be 40 mm, and the height of the zone where the secondary beam restricts the lateral displacement of the frame beam to be 190 mm. In Figure 9c, F1 and F6 represent the loads transmitted to the frame columns by the upper-level columns and adjacent span plates, while F2, F3, and F5 are the loads transmitted to the frame beams by the secondary beams on the fifth deck. Additionally, F4 represents the load transmitted to the frame beams by the upper-level column and the secondary beams on the fifth deck.
Moreover, to investigate the specific impact of holes on the performance of the frame beams in-depth, this paper has also established a frame model without holes as a control group. This non-hole model was obtained by filling all the holes in the BIM model. The finite element models of the two frames (with holes and without holes) are presented in Figure 10.

4.2. Parameters

Prior to the renovation and upgrade, the inspection unit conducted a spot check on the steel quality of the commercial complex. The results of mechanical properties testing on the samples showed that the steel samples taken met the standards of construction steel Q235. Therefore, in the calculation and analysis, the materials used for structures such as beams, columns, cabin sidewalls, cabin ribs, and deck ribs of the commercial complex can be assumed as Q235. During the safety analysis, steel was considered an ideal elastic-plastic material, and its material parameters were determined according to the “Steel Structure Design Standard” [31], specifically: the elastic modulus is 2.06 × 10⁵ MPa, the yield strength is 235 MPa, and the plastic tangent modulus is 0. Additionally, during the inspection process, magnetic particle inspection was used to spot-check the welds of the structure, and the results showed that all the welded joints sampled were qualified. Therefore, in the safety analysis, a bonded connection was adopted between beams and columns to simulate the connection method in the actual structure.
During the safety analysis, we assumed the uniformly distributed surface load on the deck as Q. Based on the load transfer relationship, we can calculate the magnitude relationship of the forces F1 to F6, as shown in Table 2. To further investigate the load-bearing capacity and deformation capacity of the two frame structures, we gradually increased the value of Q during the safety analysis process.

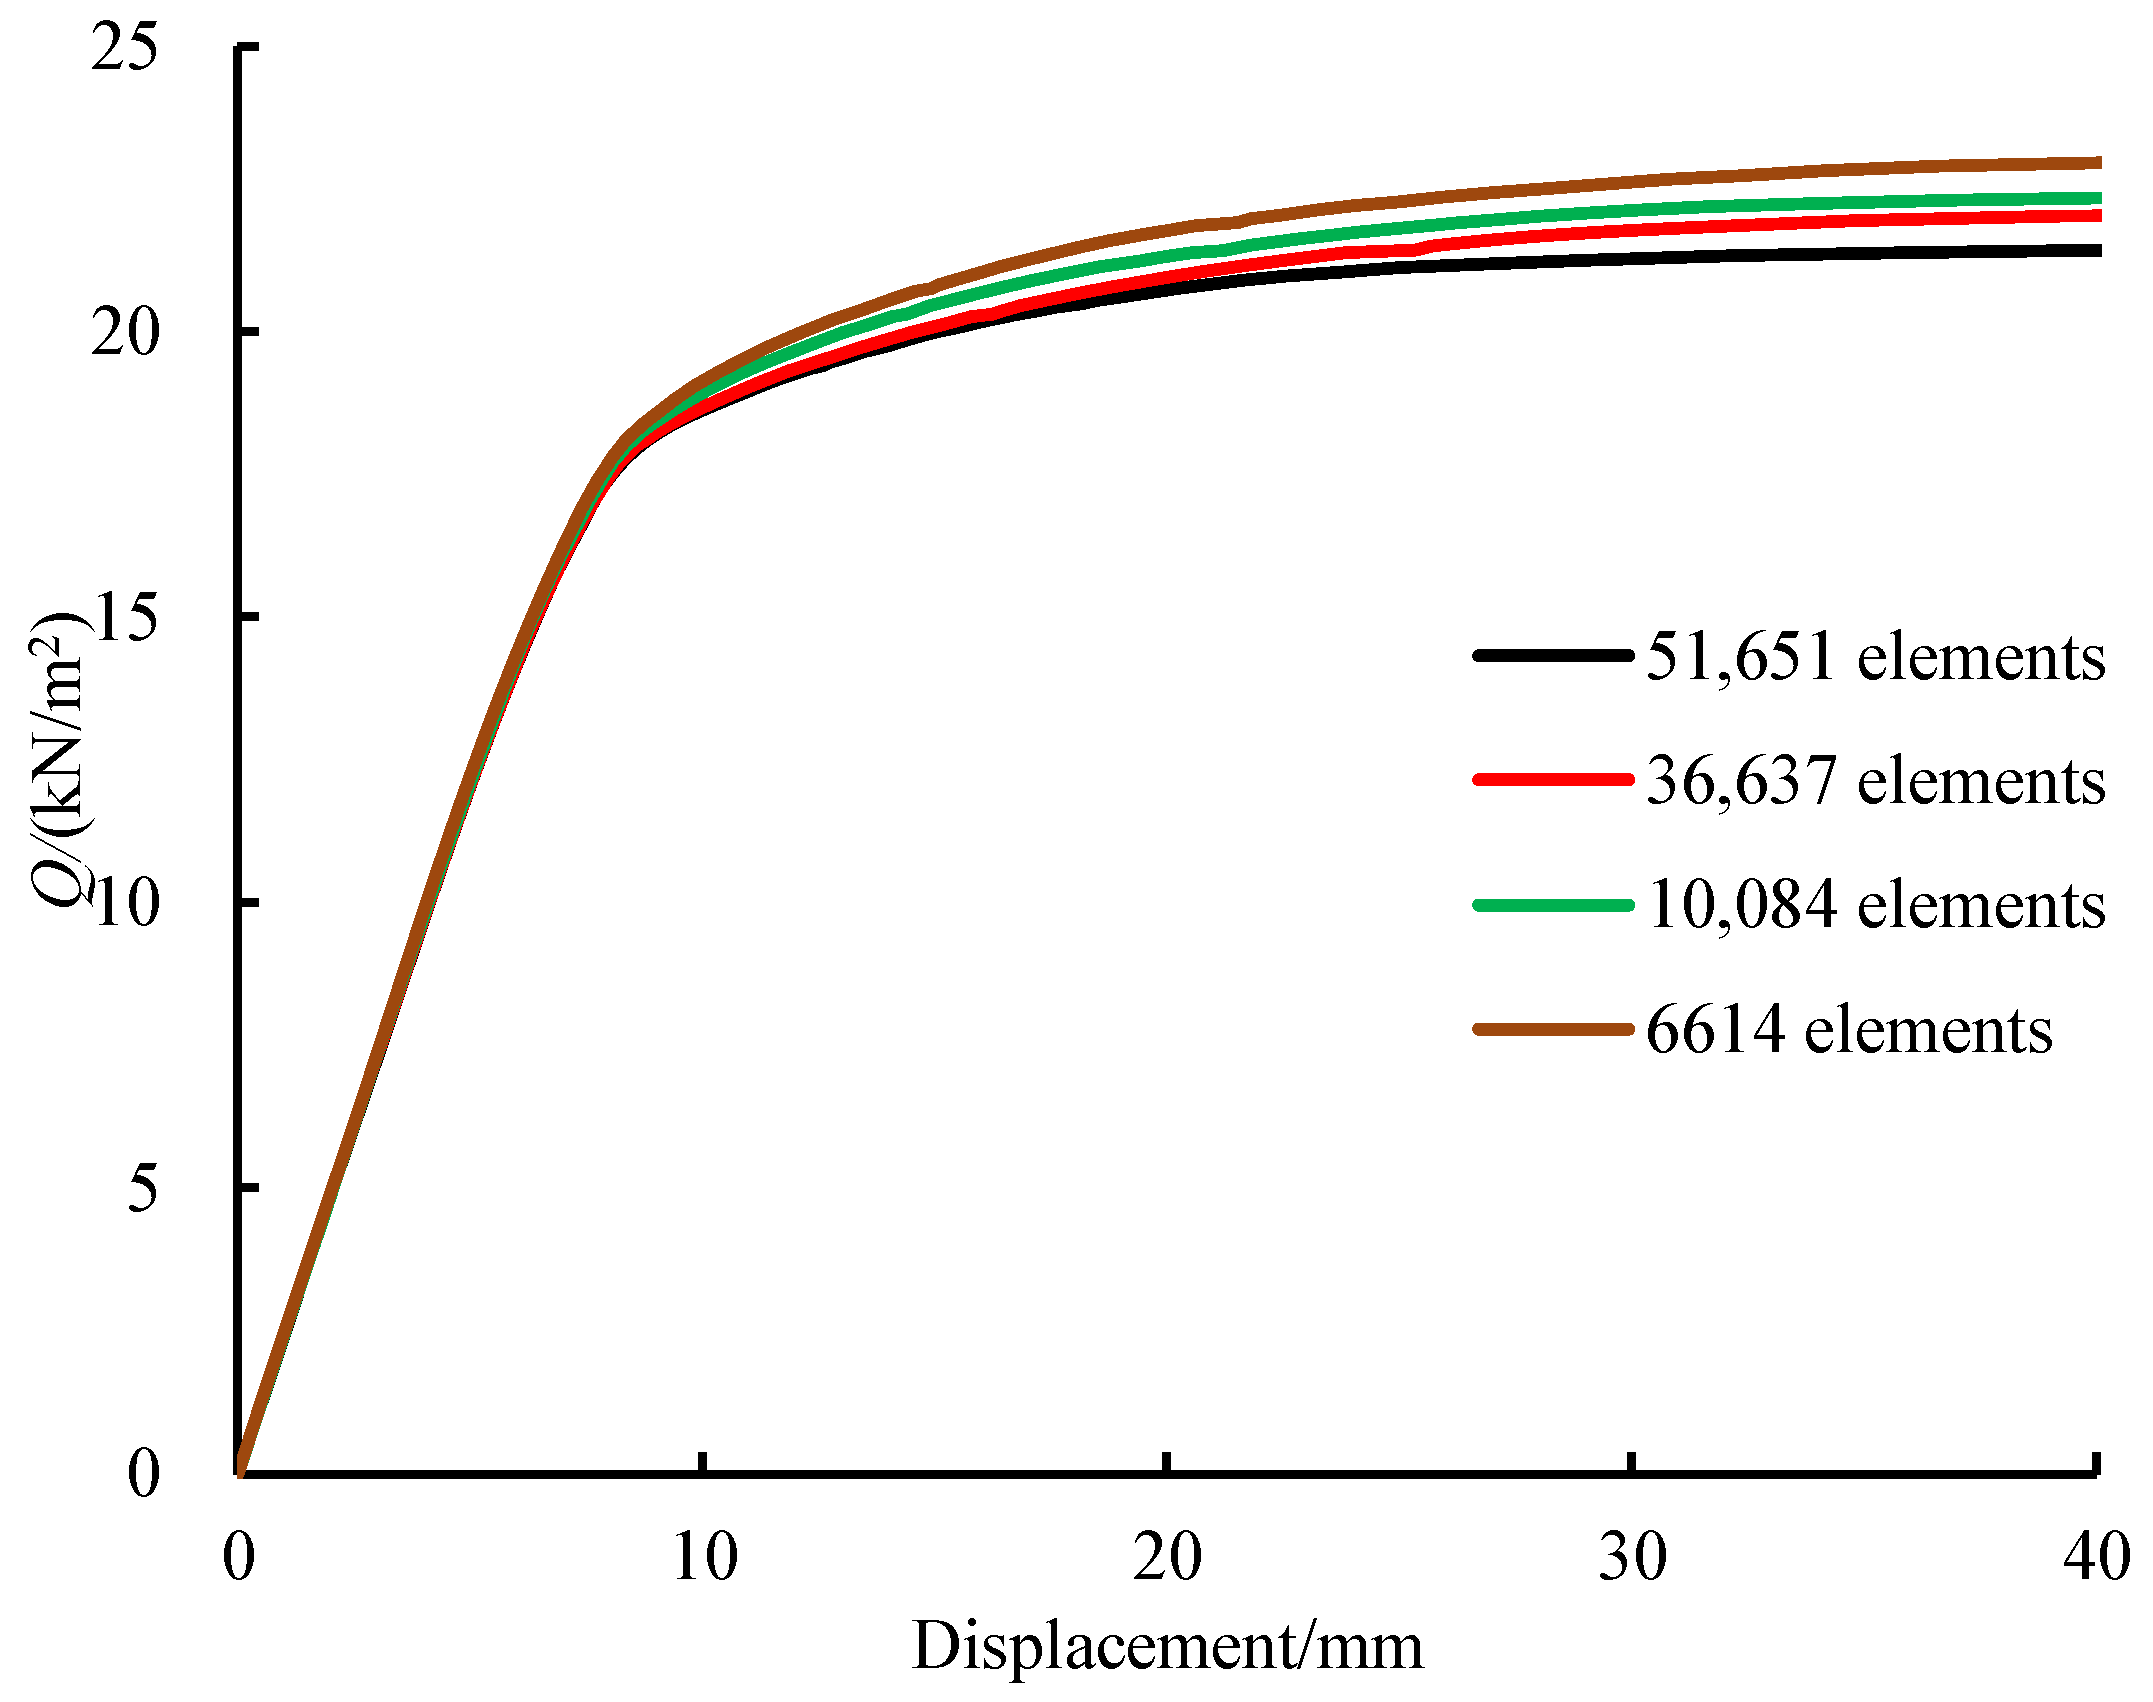
4.3. Analysis of Mesh Convergence
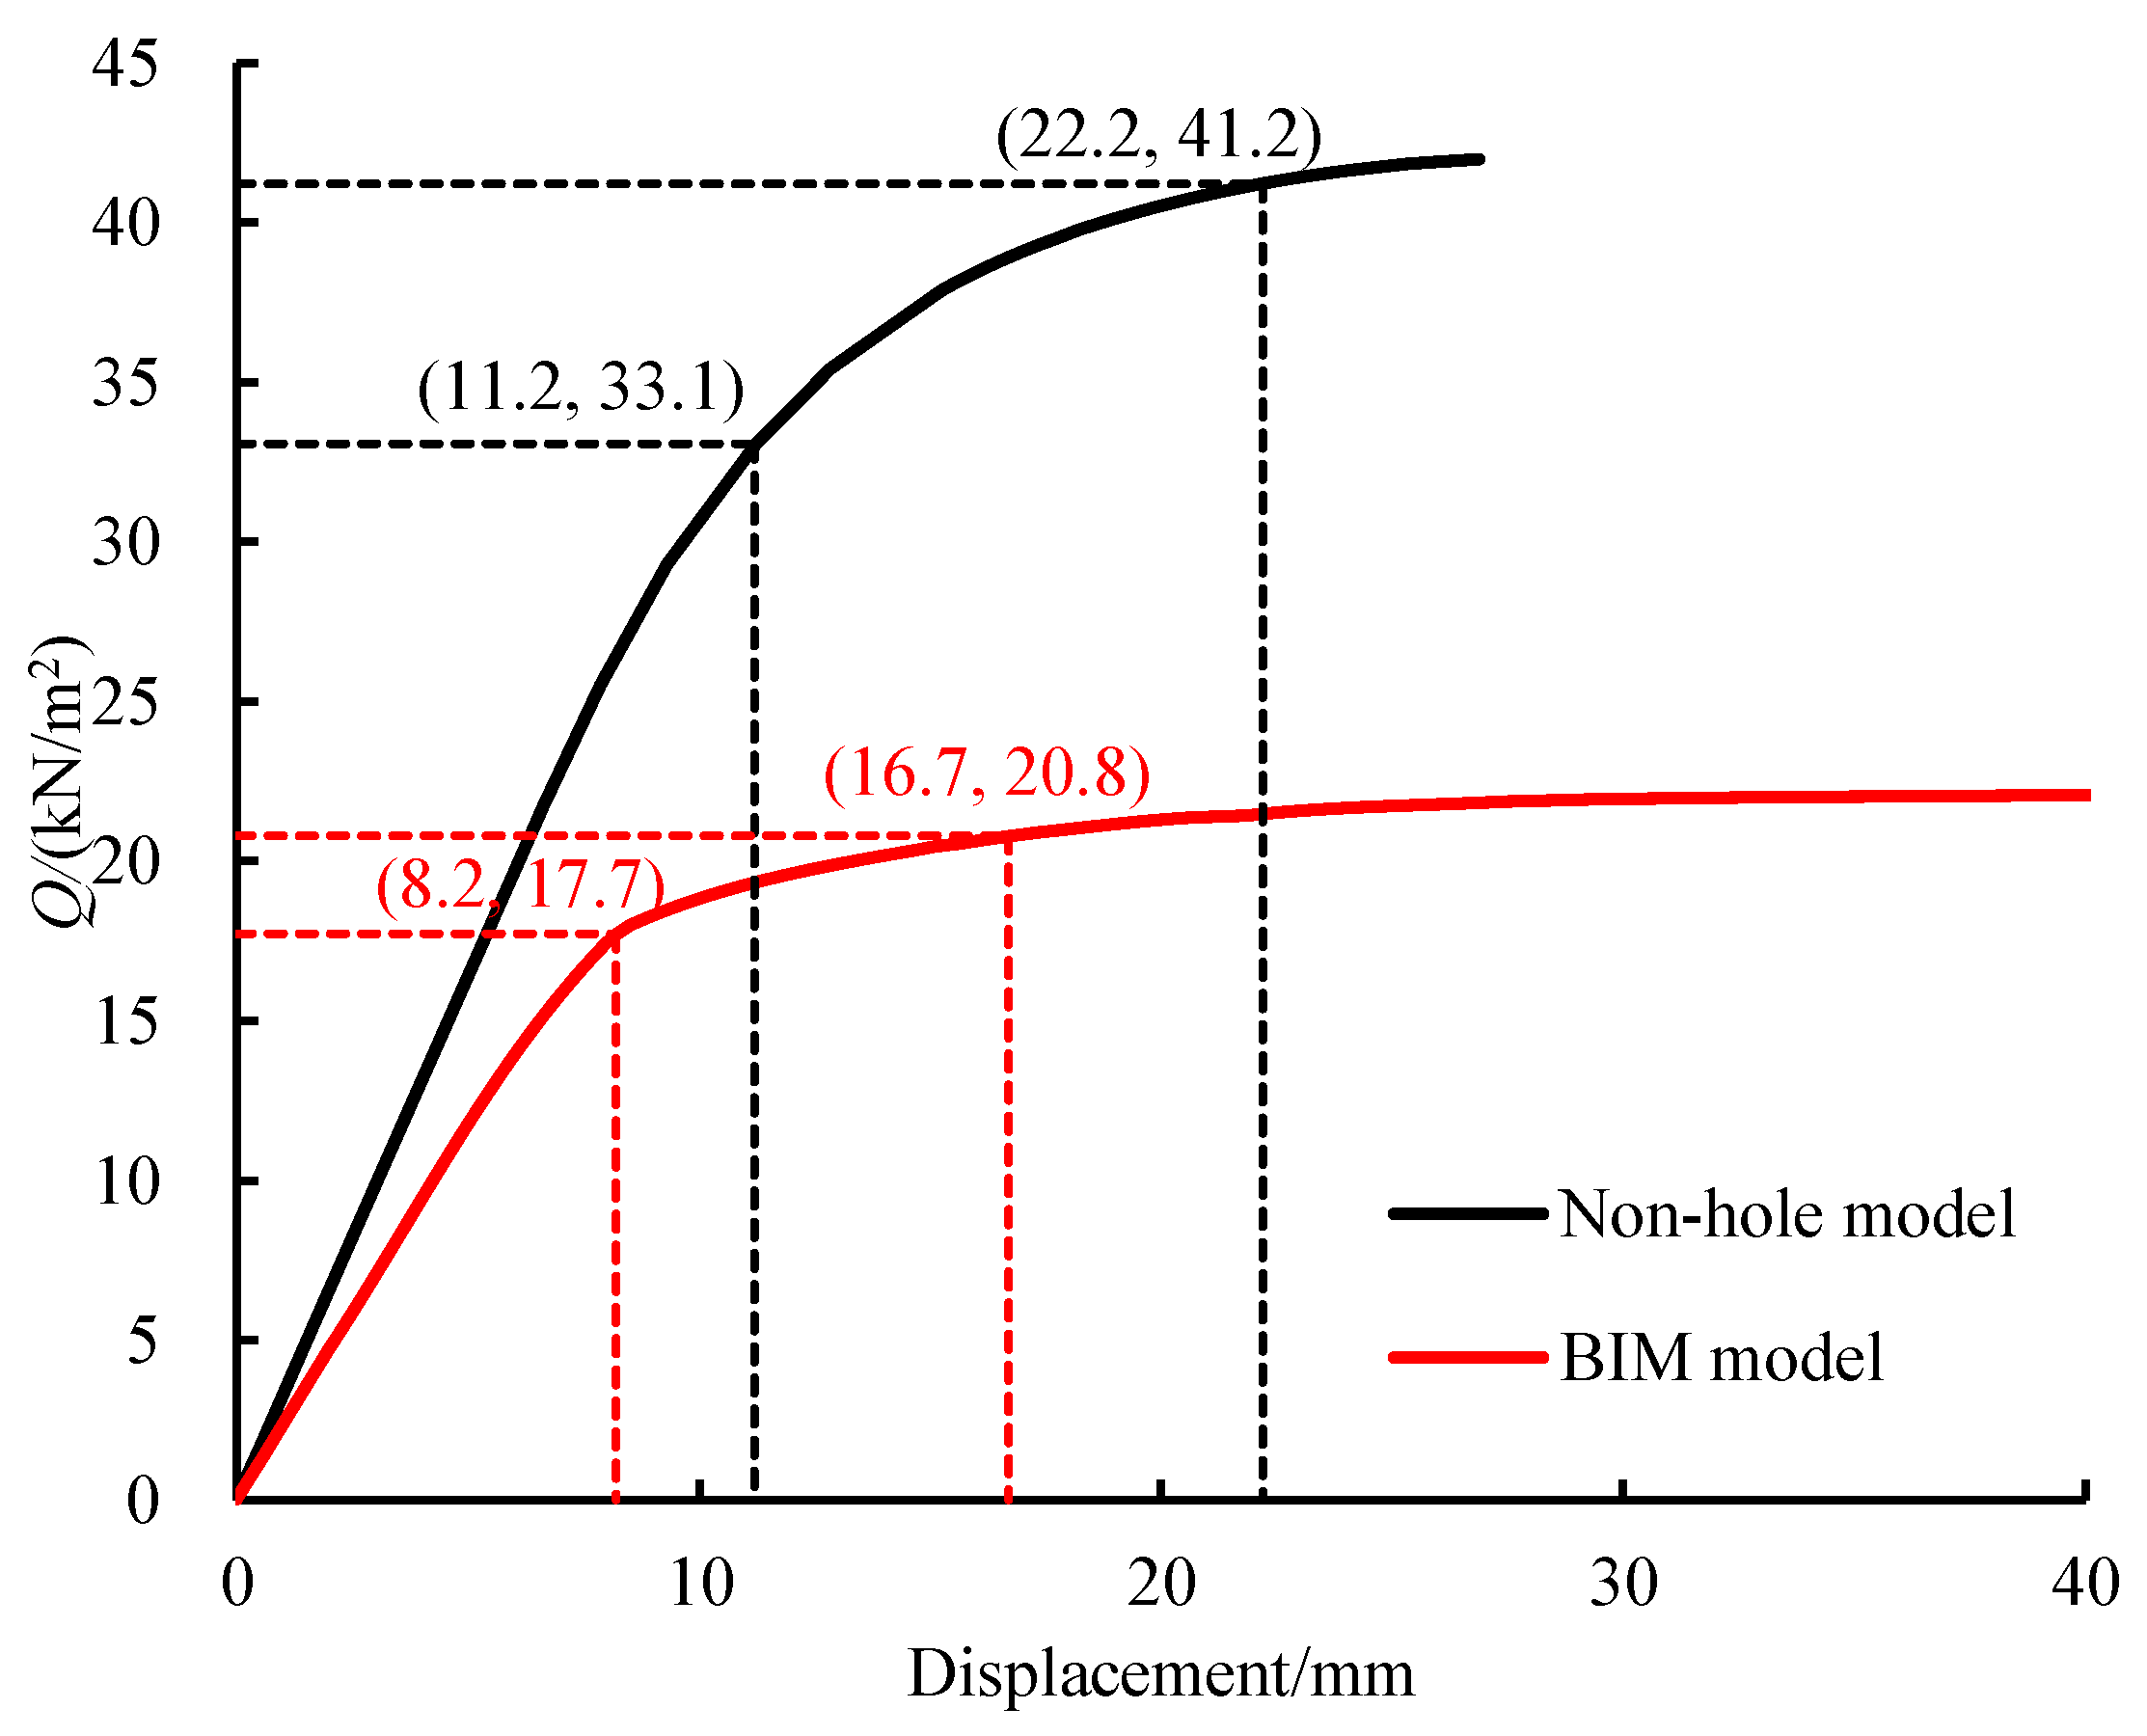
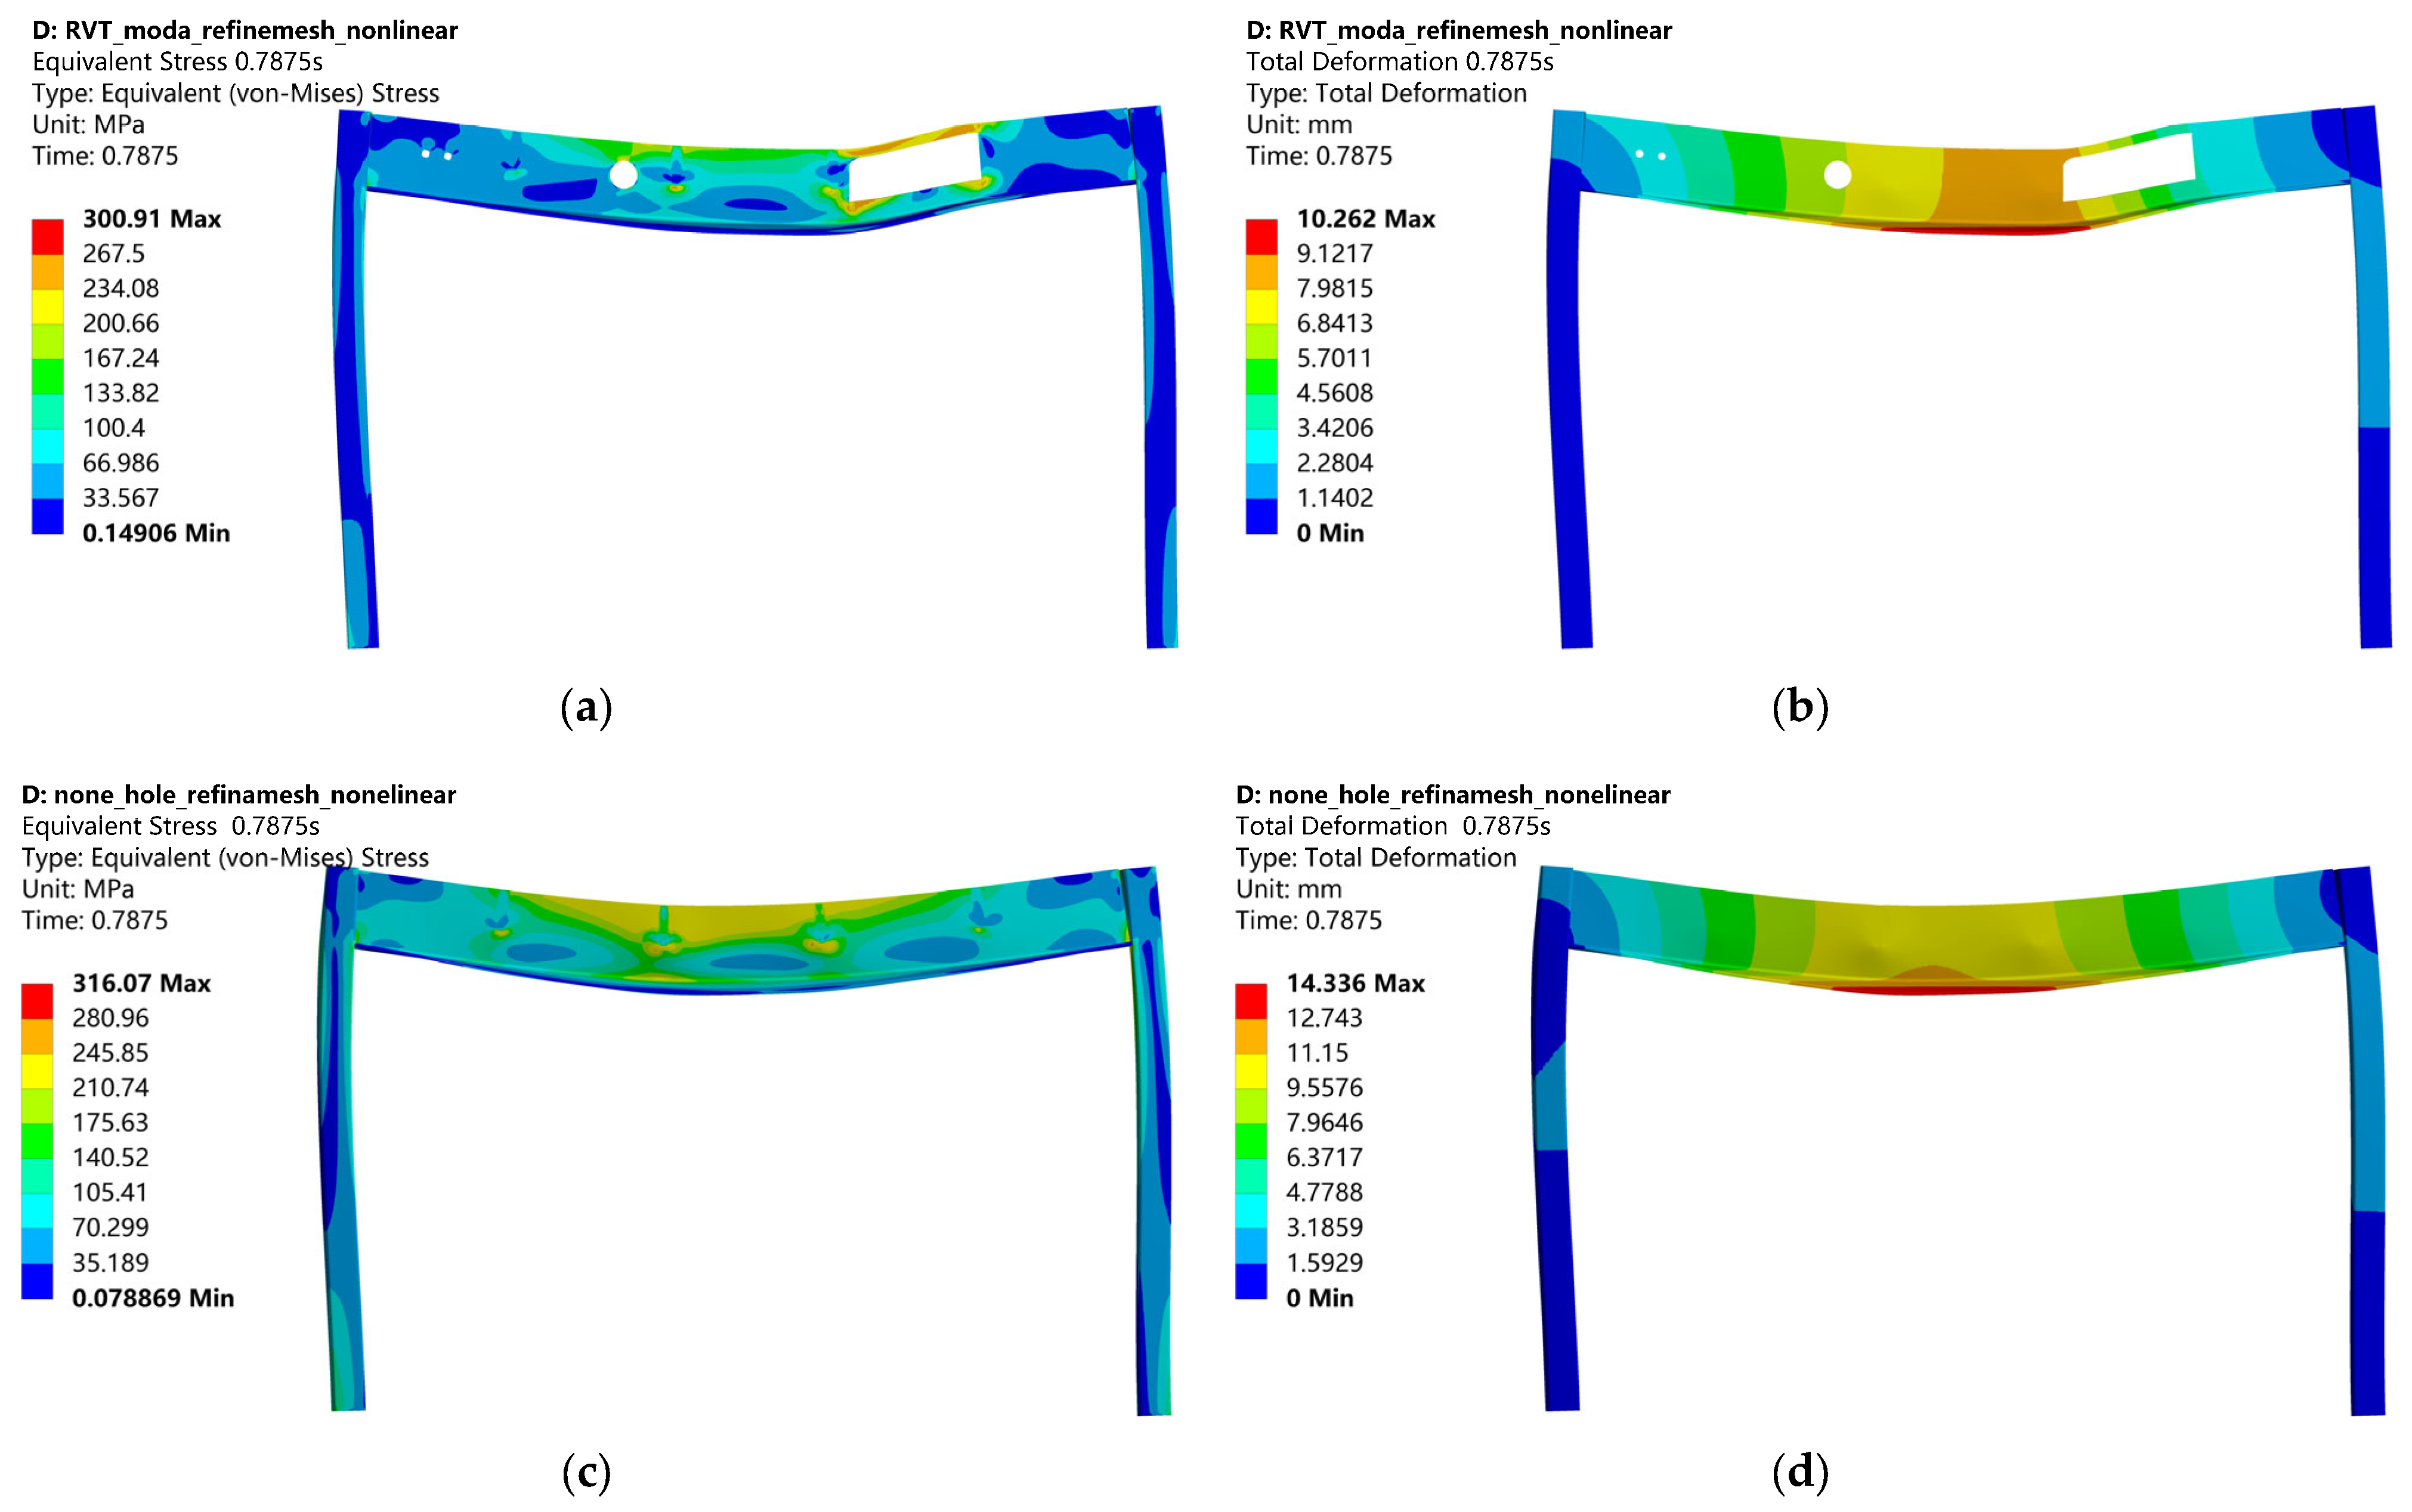
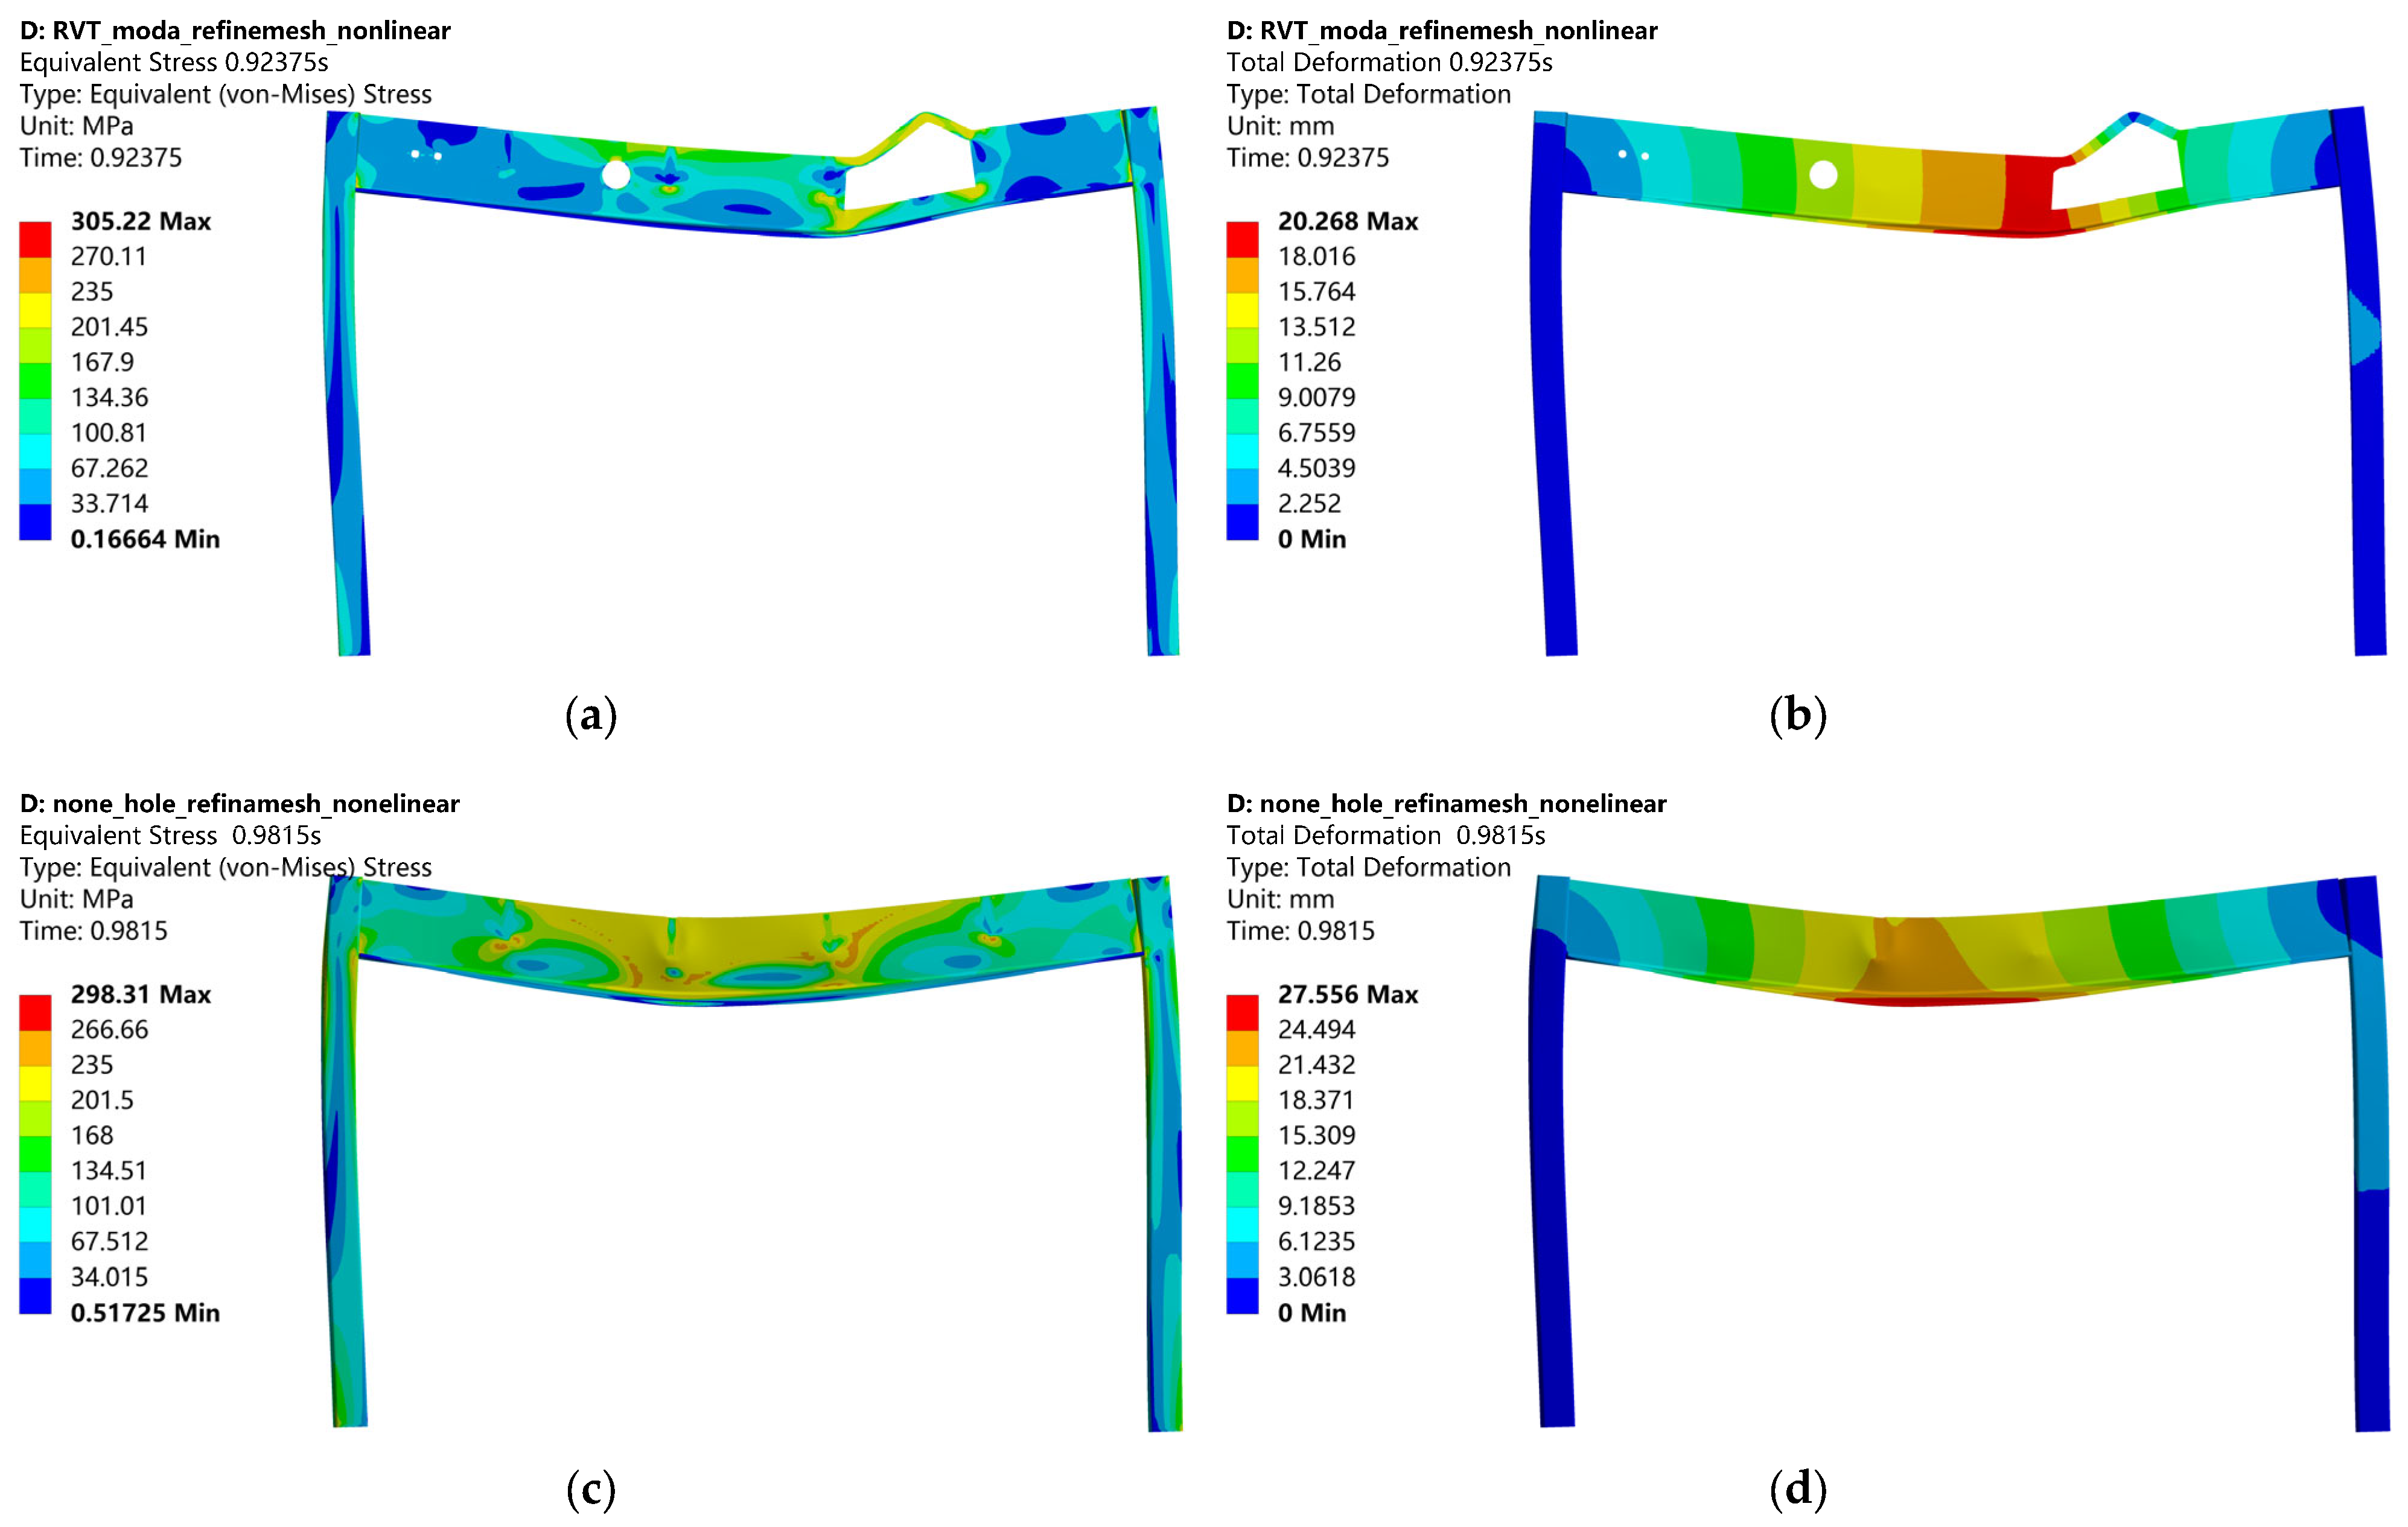
In the process of finite element analysis, the grid size significantly impacts the computational results. Generally speaking, a smaller grid size leads to more accurate model calculations. Nevertheless, it is not always advantageous to have the smallest possible grid size, as this would entail a greater number of nodes involved in the computation, thereby escalating the computational cost. Additionally, when the grid size decreases below a certain threshold, the improvement in computational accuracy becomes less pronounced. Consequently, when meshing the grid, a delicate balance must be struck between computational accuracy and cost.
In this paper, four finite element models with distinct grid sizes are established, with element counts of 6614, 10,084, 36,637, and 51,651, respectively. A corner node located at the lower right of the rectangular opening is selected, and the variation curves between the Z-direction displacement value of this node and the uniformly distributed load Q on the deck in different models are plotted, as shown in Figure 11. It can be observed from the figure that the four models completely overlap in the elastic stage, and their yield points are essentially the same. The load–displacement curves of the models with 36,637 and 51,651 elements almost overlap before the Z-direction displacement reaches twice the yield displacement. Therefore, considering both computational accuracy and cost, the computational model with 36,637 elements is selected for subsequent analyses.

4.4. Results

This paper primarily evaluates the overall performance of the frame structure based on two key indicators: the load-bearing capacity of the frame and the deformation degree of the beam span. We determine the load-bearing capacity of the frame by plotting the variation curve between the displacement of the beam span and the uniformly distributed load Q value.
As shown in Figure 12, the relationship between the beam mid-span displacement and the uniformly distributed deck load Q is shown. Using the farthest point method [32], the yield points of the two frame models are determined as (8.2, 17.7) and (11.2, 33.1), respectively. It is evident from the figure that the yield load capacity and ultimate load capacity of the BIM model with holes are approximately 53.0% and 53.6% of the model without holes, respectively. In addition, its vertical deformation resistance stiffness in the elastic state is about 71.6% of the model without holes. This indicates that the holes in the beams actually weaken the load-bearing capacity and vertical deformation resistance stiffness of the frame structure, and thus have a certain impact on the safety of the beam–column frame.
Based on the calculations of the yield load, the maximum uniformly distributed surface load Q that the BIM model and the non-hole model can bear on the deck is 17.7 kN/m2 and 33.1 kN/m2, respectively. However, when considering the limiting condition that the mid-span deflection does not exceed 1/400 of the span, the maximum uniformly distributed surface load Q that the BIM model and the non-hole model can bear on the deck is 18.4 kN/m2 and 29.3 kN/m2, respectively. Integrating the above two points, we can conclude that the maximum uniformly distributed surface load Q that the BIM model and the non-hole model can support on the deck is 17.7 kN/m2 and 29.3 kN/m2, respectively.
When the frame structure reaches the yield state, the von Mises equivalent stress and total displacement of the two models are shown in Figure 13. From Figure 13a,b, we can see that when the frame yields, the maximum equivalent stress in the structure has significantly exceeded the yield strength of the material of 230 MPa, and the maximum equivalent stress of the non-hole model is approximately 5% higher than that of the BIM model. In Figure 13a, the yielding is mainly concentrated near the rectangular holes, as these locations have the largest holes. The presence of holes not only reduces the stress-bearing area but also leads to stress concentration in local positions. In Figure 13b, the yielding is primarily concentrated in the upper half of the web panel at the mid-span of the beam, which is primarily related to the beam’s cross-sectional form and the magnitude of the external load. Further observation of Figure 13c,d reveals that the maximum deformation of the frame structure occurs near the mid-span of the beam, and the maximum deformation of the non-holed model is approximately 1.4 times that of the BIM model. In Figure 13c, due to the largest area of the rectangular hole, the position of the maximum displacement shifts toward the side of the rectangular hole. While in Figure 13d, due to the maximum load being applied at F4 on the beam, the position of the maximum displacement shifts toward the side of F4.
As shown in Figure 12, when the mid-span displacement of the two models reaches twice the yield displacement, the load applied to the frame almost reaches its ultimate bearing capacity. Since the load–displacement curve in Figure 12 has no descending segment, the instant at which the mid-span displacement is twice the yield displacement is defined in this paper as the failure instant of the frame model. The finite element analysis results during the frame failure are presented in Figure 14, which reveals that the maximum equivalent stress of both models is concentrated at the intersection of the beam and column. Among them, the maximum equivalent stress of the non-hole model is 0.977 times that of the BIM model, and the area exceeding the material yield strength in the non-hole model is larger than that of the BIM model. Furthermore, the maximum displacement of the non-hole model is 1.360 times that of the BIM model, and the location of the maximum displacement is similar to the one described in Figure 13. These results indicate that the holes on the beam reduce the fully utilized area of the steel beam and weaken the ductility of the frame.

5. Conclusions

This paper utilized 3D laser scanning technology to acquire the point cloud model of an existing commercial complex, and successfully reconstructs the geometric model of the complex through the developed AI model and surface reconstruction algorithms. Based on the reconstructed 3D model, a safety analysis was conducted on a beam–column frame structure within the commercial complex. The main research achievements are summarized as follows:
By modifying the output layer of the fundamental framework of YOLO v5, we devised an AI model proficient in precisely identifying the types and dimensional information of holes within point cloud models. The utilization of this AI model has resolved the intricate issues pertaining to the recognition and localization of holes in structural components, markedly elevating the level of intelligence in point cloud data processing. Consequently, it has led to a reduction in manual operation time and a substantial enhancement in overall work efficiency.
The automated modeling of commercial complexes has been achieved. Initially, a geometric component library of the basic structural elements of commercial complexes was established. Subsequently, by comparing the geometric features of point cloud data or partially reconstructed surfaces with the component features in the library, the automated modeling of commercial complexes was realized, significantly improving the efficiency of 3D model reconstruction.
In terms of structural safety analysis, the finite element model established using the reconstructed 3D model and material performance test results not only aids in accurately assessing the load-bearing capacity and deformation resistance stiffness of the actual structure, but also enables us to clearly identify any discrepancies in the mechanical properties of the actual structure compared to its initial design.
In summary, the effective integration of 3D geometric reconstruction technology based on point cloud data with structural safety analysis provides a novel approach for the safety assessment of existing structures. This methodology significantly contributes to enhancing structural safety.

6. Limitations

Currently, this method is suitable for local refinement analysis of structures. Since the element adopted in this paper for establishing the finite element model is a solid element, if the entire structure is analyzed, the computational load will be extremely heavy and convergence will be difficult to achieve. In the future, an algorithm can be developed to automatically extract the axes of beams and columns and the mid-surfaces of wall panels, so as to replace the solid elements used in the analysis with beam elements and shell elements.

Author Contributions

Conceptualization, K.W. and X.Z.; methodology, K.W. and X.Z.; software, K.W. and T.Y.; validation, K.W., G.Z. and T.Y.; data curation, G.Z. and T.Y.; writing—original draft preparation, K.W., X.Z. and T.Y.; writing—review and editing, K.W. and X.Z.; supervision, X.Z. and G.Z.; project administration, G.Z.; funding acquisition, X.Z. All authors have read and agreed to the published version of the manuscript.

Funding

This research was funded by the National Natural Science Foundation of China (grant No. 52178129), the Science and Technology Planning Project of Shenzhen Municipality (grant No. GJHZ20220913143007013 and KCXST20221021111408021).

Data Availability Statement

The data presented in this study are available on request from the corresponding author. The data are not publicly available due to privacy.

Acknowledgments

We are deeply grateful to the relevant units for providing us with valuable testing and measurement data. Additionally, we extend our heartfelt thanks to the National Natural Science Foundation of China and the Shenzhen Science and Technology Innovation Commission for their significant support and assistance.

Conflicts of Interest

Author Guojie Zhang is employed by the China Construction Science and Industry Corporation Ltd. Author Tianqi Yi is employed by the Yuanyu Smart Data (Shenzhen) Technology Co., Ltd. The remaining authors declare that the research was conducted in the absence of any commercial or financial relationships that could be construed as a potential conflict of interest.

References

  1. Umar, T. Making future floating cities sustainable: A way forward. Proc. Inst. Civ. Eng. Urban Des. Plan. 2020, 173, 214–237. [Google Scholar] [CrossRef]
  2. Umar, T. Key factors influencing the implementation of three-dimensional printing in construction. Proc. Inst. Civ. Eng. Manag. Procure. Law 2021, 174, 104–117. [Google Scholar] [CrossRef]
  3. Wang, Z.; Tao, O. Test Research on Loading Safety and Space Finite Element Analysis of Existing Buildings Reconstruction. In Proceedings of the International Conference on Civil, Architectural and Hydraulic Engineering, Zhangjiajie, China, 10–12 August 2012. [Google Scholar] [CrossRef]
  4. Xu, S. Analysis on Security Appraisa of the Existing Reinforced Concrete Bridges. In Proceedings of the 3rd International Conference on Civil Engineering and Transportation, Kunming, China, 14–15 December 2014. [Google Scholar] [CrossRef]
  5. Gao, W.; Yu, Y.; Liu, W.; Xu, M. Safety Inspection of Steel Structure for a Natatorium Under Service. J. Build. Struct. 2009, 30, 38–46. [Google Scholar] [CrossRef]
  6. Wang, H.; Feng, Z.; Wang, N.; Zhang, S. Safety Appraisal Analysis of a Large-span Reticulated Shell Supported by Steel Columns. Sci. Technol. Innov. Her. 2018, 15, 125–127+129. [Google Scholar] [CrossRef]
  7. Ávila, F.; Puertas, E.; Gallego, R. Probabilistic Reliability Assessment of Existing Masonry Buildings: The Church of San Justo y Pastor. Eng. Struct. 2020, 223, 111160. [Google Scholar] [CrossRef]
  8. Lehner, P.; Křivý, V.; Krejsa, M.; Pařenica, P.; Kozák, J. Stochastic Service Life Prediction of Existing Steel Structure Loaded by Overhead Cranes. In Proceedings of the 22nd European Conference on Fracture (ECF)—Loading and Environmental Effects on Structural Integrity, Belgrade, Serbia, 26–31 August 2018. [Google Scholar] [CrossRef]
  9. Sedmak, A.; Radu, D.; Aranđelović, M.; Sedmak, S.; Băncilă, R. Residual Life Assessment of the Historical Road Riveted Bridges. Eng. Fract. Mech. 2024, 299, 109960. [Google Scholar] [CrossRef]
  10. Rajchel, M.; Siwowski, T. Fatigue Assessment of a 100-Year-Old Riveted Truss Railway Bridge. J. Constr. Steel Res. 2024, 217, 108662. [Google Scholar] [CrossRef]
  11. Depale, B.; Bennebach, M. Residual life of steel structures and equipment: Problems and application to cranes. In Proceedings of the 9th Edition of the International Conference on Fatigue Design, Senlis, France, 17–18 November 2021. [Google Scholar] [CrossRef]
  12. Radua, D.; Băncilăb, R.; Boldușb, D.; Sedmakc, S.; Aranđelovićc, M. Solution for consolidation and retrofitting a historical steel bridge. In Proceedings of the ICSI 2021 The 4th International Conference on Structural Integrity, Funchal, Madeira, Portugal, 30 August–1 September 2021. [Google Scholar] [CrossRef]
  13. Chacon, R.; Polo, C.; Real, E. TLS Measurements of Initial Imperfections of Steel Frames for Structural Analysis within BIM-Enabled Platforms. Autom. Constr. 2021, 125, 103618. [Google Scholar] [CrossRef]
  14. Xu, Y.; Wu, B.; Zheng, B. Full-Field Geometric Imperfection and Effect on Cross-Section Capacity of Circular Steel Tubes. J. Constr. Steel Res. 2023, 201, 107749. [Google Scholar] [CrossRef]
  15. Ban, H.; Mei, Y. Local Buckling Behaviour of Stainless-Clad Bimetallic Steel Built-Up Square Hollow Section Stub Columns. Thin-Walled Struct. 2023, 182, 110207. [Google Scholar] [CrossRef]
  16. Yastikli, N. Documentation of Cultural Heritage Using Digital Photogrammetry and Laser Scanning. J. Cult. Herit. 2007, 8, 423–427. [Google Scholar] [CrossRef]
  17. Ma, Y.; Jiang, Z.; Ma, L.; Li, C.; Cui, S. Dimensional quality assessment of cablestayed bridge by combining terrestrial and drone laser scanner. Proc. Inst. Civ. Eng. Bridge Eng. 2022, 175, 105–117. [Google Scholar]
  18. Wang, C.; Cho, Y.; Kim, C. Automatic BIM Component Extraction from Point Clouds of Existing Buildings for Sustainability Applications. Autom. Constr. 2015, 56, 1–13. [Google Scholar] [CrossRef]
  19. Kong, Q.; Liao, L.; Yuan, C. Rapid Generation of Editable Engineering Drawings From 3D Point Cloud Reconstruction for Large-Scale Buildings. J. Build. Eng. 2023, 63, 105486. [Google Scholar] [CrossRef]
  20. Li, N.; Wang, Y.; Geng, W.; Li, Z. Enhancing Extraction of Two-Dimensional Engineering Drawings from Three-Dimensional Data of Existing Buildings. J. Build. Eng. 2023, 76, 107235. [Google Scholar] [CrossRef]
  21. Stefanska, A.; Markowski, H.; Dixit, S. Three-Dimensional Laser Scanning for Structure Documentation and Construction Management: A Case Study of Renovation and Rebuilt of Metro Tunnels. Ain Shams Eng. J. 2024, 15, 102665. [Google Scholar] [CrossRef]
  22. Parent, T.; Brocato, M.; Colas, A.; Domede, N.; Dubois, F.; Garnier, D.; Gros, A.; Mindeguia, J.; Morel, S.; Morenon, P.; et al. A Multi-Model Structural Analysis of the Vaults of Notre-Dame De Paris Cathedral After the 2019 Fire and a Proposal for a Hybrid Model Merging Continuum and Discrete Approaches. J. Cult. Herit. 2024, 65, 135–144. [Google Scholar] [CrossRef]
  23. Gao, W.; Zhang, C.; Lu, X.; Lu, W. Concrete Spalling Damage Detection and Seismic Performance Evaluation for RC Shear Walls Via 3D Reconstruction Technique and Numerical Model Updating. Autom. Constr. 2023, 156, 105146. [Google Scholar] [CrossRef]
  24. Akhlaghi, M.; Bose, S.; Mohammadi, M.; Moaveni, B.; Stavridis, A.; Wood, R. Post-Earthquake Damage Identification of an RC School Building in Nepal Using Ambient Vibration and Point Cloud Data. Eng. Struct. 2021, 227, 111413. [Google Scholar] [CrossRef]
  25. Tzortzinis, G.; Ai, C.; Breña, S.; Gerasimidis, S. Using 3D Laser Scanning for Estimating the Capacity of Corroded Steel Bridge Girders: Experiments, Computations and Analytical Solutions. Eng. Struct. 2022, 265, 114407. [Google Scholar] [CrossRef]
  26. Bouzas, O.; Conde, B.; Cabaleiro, M.; Riveiro, B. A holistic methodology for the non-destructive experimental characterization and reliability-based structural assessment of historical steel bridges. Eng. Struct. 2022, 270, 114867. [Google Scholar] [CrossRef]
  27. Wijaya, H.; Bandara, S.; Rajeev, P.; Gad, E.; Shan, J. Failure assessment of deteriorated steel light poles. Results Eng. 2024, 23, 102621. [Google Scholar] [CrossRef]
  28. Hu, H.; Fang, H.; Wang, N.; Ma, D.; Dong, J.; Li, B.; Di, D.; Zheng, H.; Wu, J. Defects identification and location of underground space for ground penetrating radar based on deep learning. Tunn. Undergr. Space Technol. 2023, 140, 105278. [Google Scholar] [CrossRef]
  29. Wang, G.; Zhang, C.; Chen, M.; Lin, Y.; Tan, X.; Kang, Y.; Wang, Q.; Zeng, W.; Zhao, W. A high-accuracy and lightweight detector based on a graph convolution network for strip surface defect detection. Adv. Eng. Inform. 2024, 59, 102280. [Google Scholar] [CrossRef]
  30. Lei, Y.; Wang, X.; An, A.; Guan, H. Deeplab-YOLO: A method for detecting hot-spot defects in infrared image PV panels by combining segmentation and detection. J. Real-Time Image Process. 2024, 21, 51–52. [Google Scholar] [CrossRef]
  31. GB 50017-2017; Ministry of Housing and Urban-Rural Development of the People’s Republic of China, Standard for Design of Steel Structures. China Architecture & Building Press: Beijing, China, 2017; pp. 22–28.
  32. Feng, P.; Qiang, H.; Ye, L. Discussion and Definition on Yield Points of Materials, Members and Structures. Eng. Mech. 2017, 34, 36–46. [Google Scholar] [CrossRef]
Figure 1. Photo of commercial complex: (a) external image; (b,c) are internal images.
Buildings 14 02583 g001
Figure 2. Part structural drawings of commercial complex: (a) the plan view of 5th deck; (b) the cross-section view of 104#.
Buildings 14 02583 g002
Figure 3. Photo of on-site inspection operation: (a) size inspection; (b) hole inspection; (c) status inspection of connection.
Buildings 14 02583 g003
Figure 4. Photo of on-site inspection operation: (a) 3D laser scanner; (b) control network measurement.
Buildings 14 02583 g004
Figure 5. Point cloud model of commercial complex: (a) before point cloud denoising; (b) after point cloud denoising.
Buildings 14 02583 g005aBuildings 14 02583 g005b
Figure 6. The holes on the commercial complex: (a) initial hole; (b) post-opening hole; (c) hole on the bulkhead; (d) hole on the deck stiffeners; (e) hole on the deck; (f) hole on the wall.
Buildings 14 02583 g006aBuildings 14 02583 g006b
Figure 7. The process of intelligent identification of holes.
Buildings 14 02583 g007
Figure 8. BIM Model of a commercial complex.
Buildings 14 02583 g008
Figure 9. Beam–column frame calculation model/mm: (a) position of the beam–column frame; (b) model of the beam–column frame; (c) diagram of mechanical calculation; (d) section dimensions of columns; (e) section dimensions of beam.
Buildings 14 02583 g009
Figure 10. Finite element models of beam–column frame: (a) BIM model; (b) Non-hole model.
Buildings 14 02583 g010
Figure 11. Analysis results of mesh convergency.
Buildings 14 02583 g011
Figure 12. Load–displacement curve of beam–column frames.
Buildings 14 02583 g012
Figure 13. Finite element results of frame yielding: (a) von Mises stress of BIM model/MPa; (b) Deformation of BIM model/mm; (c) von Mises stress of non-hole model/MPa; (d) Deformation of non-hole model/mm.
Buildings 14 02583 g013
Figure 14. The finite element results when the mid-span deformation is 2 times the yield deformation: (a) von Mises stress of BIM model/MPa; (b) Deformation of BIM model/mm; (c) von Mises stress of non-hole model/MPa; (d) Deformation of non-hole model/mm.
Buildings 14 02583 g014
Table 1. Mechanical properties of sampling components.
LocationLower Yield Strength (MPa)Ultimate Tensile Strength (MPa)Elongation (%)
minmaxminmaxminmax
Bulkhead stiffeners24334038948224.539.5
Deck stiffeners24030539243729.535
Deck2933704444811835
Table 2. Loads on beam–column frame.
F1F2F3F4F5F6
Magnitude of load/(Q kN)14.05.05.016.05. 017.5
Disclaimer/Publisher’s Note: The statements, opinions and data contained in all publications are solely those of the individual author(s) and contributor(s) and not of MDPI and/or the editor(s). MDPI and/or the editor(s) disclaim responsibility for any injury to people or property resulting from any ideas, methods, instructions or products referred to in the content.

