Abstract
It is well understood that the dominant approach in the seismic design of structures is to reduce the initial cost while meeting the required safety level, as dictated by compliance codes. Nevertheless, this approach often overlooks the long-term costs that are incurred over the lifetime of the structures. A comprehensive approach is thus required for a design based on life cycle cost (LCC), where both initial and long-term costs are considered. While LCC-based design has been employed on regular structures, irregular structures have not received adequate attention. This research aims to highlight the impact of irregularity on the LCC optimization of tall structures. To do this, a bi-objective heuristic optimization framework is developed to balance the initial and long-term costs. The framework is used to analyze six steel regular and setback irregular structures with 7, 10, and 13 stories. The structures are all designed to meet the life safety performance level. The findings show that the irregular structures reveal a higher sensitivity to variations in initial costs compared to regular structures, which are mainly buildings above 13 stories. We also show that reducing the LCCs of irregular structures requires a higher increase in the initial cost compared to regular structures; for example, in the regular and irregular 13-story structures, a 17% increase in the initial cost resulted in approximately 48% and 40% reductions in the LCCs, respectively. Overall, our results confirm that the long-term costs of irregular structures are more than those of regular ones; this is an important finding that should be considered for the seismic design of tall irregular structures.
1. Introduction
The life cycle cost (LCC) of an asset encompasses the costs from its initial stages, such as design, until its eventual retirement and disposal or reuse. In essence, it involves an economic evaluation considering capital costs, ongoing operational expenses, and replacement or disposal costs [1]. Thus, it recognizes the importance of present and future costs as a basis for decision-making. An LCC-based approach can optimize an asset’s ownership, construction, and operating costs over its lifetime [2]. This is achieved through techniques such as the present value, commonly known as discounting techniques [3], which facilitates accurate estimation and accounting practices [4].
Structural design has traditionally focused on reducing initial construction costs. However, it is crucial to consider the LCCs of buildings to ensure safety, cost-effectiveness, and long-term financial sustainability. Seismic assessment based on the asset’s life cycle has received increasing interest in regard to the time-dependent seismic analysis [5] for both new constructions [6] and retrofitted structures [7].
Initial research on the economic optimization of structures has predominantly concentrated on minimizing initial costs. For instance, Pezeshk et al. utilized a genetic algorithm (GA) and nonlinear analysis to optimize the design of a two-dimensional steel frame [8]. Kaveh et al. [9] explored weight optimization of steel structures. Goldberg and Samtani optimized a steel truss using a GA [10]. Jenkins carried out an optimized plan for a planar frame based on a GA [11].
Nevertheless, numerous studies have demonstrated that a significant portion of a project’s LCCs, depending on its nature, is associated with the operational period; it has been indicated that, in some cases, operational costs can account for more than 40% of the capital cost [12]. Huang et al. indicated that maintenance and operational costs can constitute 73.7% to 83.9% of the LCC [13]. Galibourg found that operating costs for commercial buildings can be up to 75% of the LCC, excluding land ownership costs [14]. Overall, it can be concluded that operating costs often exceed ownership costs [15].
On the other hand, in theory, it is possible to construct sufficiently reliable structures to withstand even rare seismic loads without significant damage, thereby minimizing financial and human losses [16]. However, such structures typically come with high initial costs, which may not be economically viable based on usage considerations. Therefore, selecting the appropriate design load level for a structure is not only a safety concern but also an optimization problem that balances benefits and costs in decision-making [17]. Hence, there is a need to identify an optimal design point that considers the structure’s LCCs. Recent research in building optimization has thus shifted towards reducing the LCCs of structures, encompassing both the initial and expected costs associated with earthquakes.
Calculations of the seismic damage costs were initially proposed in the work of Liu and Neghabat [18]. Wen and Kang also developed a model for calculating LCCs in the seismic design of steel moment-resisting frames [19]. They designed 12 different structures with varying yield strength coefficients to optimize the LCC, finding that a structure with a yield strength coefficient 1.85 times that of NEHRP regulations had a lower LCC than other structures. Ang and Lee analyzed the LCCs of reinforced concrete (RC) buildings using cost functions based on the Park–Ang damage index [20]. Kohno and Collins researched LCC optimization of RC structures using HAZUS [21]. Li and Cheng proposed a model for optimizing structures based on reducing earthquake damage, demonstrating improved seismic performance [22]. Sarma and Adeli presented a fuzzy logic-based model for optimizing the LCC of steel structures [23]. Shin and Singh [24] developed a method based on [19,23,24] to calculate secondary costs associated with different levels of uncertainty in the seismic response.
The studies mentioned above have all aimed to identify structures with the lowest possible LCC. However, their analysis was limited to a small number of structures, and these case studies may not necessarily represent the absolute minimum scenario.
Various algorithms have been proposed to solve optimization problems, which can be classified into two categories: exact and approximate algorithms. Exact algorithms are capable of finding the optimal solution precisely. However, they lack sufficient efficiency for complex optimization problems, and their execution time increases exponentially as the dimensions of the problem increase. In contrast, approximate algorithms can find near-optimal solutions more efficiently for complex optimization problems [25]. Approximate algorithms fall into three categories: heuristic, metaheuristic, and hyper-heuristic. Heuristic algorithms may become trapped at local optimal points and converge quickly to those points. Metaheuristic algorithms address these issues and offer strategies to escape local optimal points, making them applicable to various problems [25]. Well-known population-based metaheuristic algorithms include genetic algorithms introduced by Holland [26] and Sastry et al. [27], Ant Colony Optimization [28], Artificial Bee Colony Optimization [29], the Whale Optimization Algorithm [30], and the Battle Royal Optimization Algorithm [31].
Since optimizing a structure involves numerous variables and constraints, it is often a complex problem that necessitates using metaheuristic algorithms. Furthermore, considering that the LCC encompasses both initial and secondary construction costs, an ideal design procedure should balance economic and human losses with initial costs [32]. To tackle these challenges and achieve optimal states in terms of both initial and secondary costs, researchers have increasingly turned to multi-objective optimization and metaheuristic algorithms. Among these algorithms, GA has emerged as one of the most effective optimization methods. Inspired by the principles of natural evolution, GA incorporates the three primary operations of selection, crossover, and mutation. Also, its ability to handle nonlinear optimization problems with a large number of design variables has made it widely utilized in civil engineering and structural system optimization [33].
Previous studies by Shin and Singh [34], Kaveh et al. [9], Park et al. [35], and Basim et al. [36] have addressed seismic design optimization using a GA based on LCC. Liu et al. [37] proposed a multi-objective structural optimization method for steel frames using GA, considering weight, maximum inter-story drift for two performance levels, and design complexity criteria. Gencturk [38] performed the multi-objective analysis of the LCC of RC and composite frames using the evolutionary algorithm Tabu search. Fragiadakis et al. [39] estimated and optimized the dual objectives of initial costs and LCCs for steel structures affected by seismic damage through an evolutionary algorithm based on the work of Lagaros et al. [40].
However, despite the growing attention to seismic design based on LCCs, there are two notable weaknesses in most previous research. First, the models under study largely concentrate on 2D structures [41], and second, they often overlook the architectural aspects of buildings. The latter should be even further emphasized as, in reality, most urban buildings are irregular in different aspects, either in height or plan [42]. Given that irregular structures are often more susceptible to earthquake damage [43], the LCC-based design of these structures is a topic of interest.
Among many types of irregularities, setback irregularity is a widely observed one, for example, for meeting the aesthetic requirements (Figure 1). Numerous studies have highlighted the poor performance of setback structures against earthquakes [44]. Bohlouli and Poursha highlighted the degree of setback as a key factor in the seismic response of these buildings [44]. Jiang et al. demonstrated that setbacks in RC frame-shear wall structures increase inter-story drift at the setback location [45]. Shojaei and Behnam [46] indicated that setback RC structures sustain considerable seismic damage compared to regular ones.

Figure 1.
Examples of setback irregular buildings: (a) Atisaz Complex in Tehran; (b) Shiraz Grand Hotel; and (c) Shiraz Homa Hotel.
Considering the above notes, first, this study aims to explore the use of LCCs in the design process of steel structures. Given the limited studies on the LCC-based design of irregular buildings, the second goal here is to highlight the differences in potential seismic damage costs incurred by irregular structures compared to regular ones from a performance-based perspective. This is achieved through bi-objective optimization and the utilization of a metaheuristic algorithm. Here, six 3D models are examined to advance previous research, increase accuracy, and align results with real-world scenarios, including mid- and high-rise structures.
2. Methodology
The methodology developed here is summarized in Figure 2, comprising seven stages (a to g).
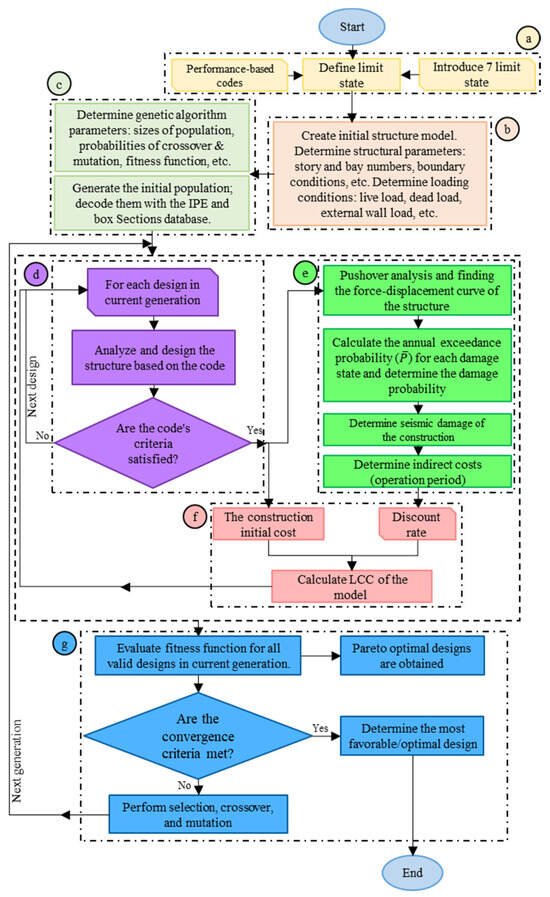
Figure 2.
Flowchart of optimization procedure based on NSGA-II.
Initially (Figure 2 a), the limit states of the structure are defined, which specify that its performance levels are not directly related to earthquake intensity but are associated with structural usage. According to performance-based design standards, the performance of a structure is determined by assigning a structural performance level based on seismic classification, which takes into account factors such as the type of use, potential consequences of earthquake damage, the importance of structural damage reduction, and enhancement of life safety. This study considers three earthquakes for three IO/LS/CP performance levels, corresponding to 50%/10%/2% exceedance probabilities in 50 years, respectively [47]. The annual exceedance probability (P) is determined based on the reciprocal of the return period, where the exceedance probability (p) for an earthquake in t years is calculated using Equation (1).
The probability of damage is often determined based on inter-story drifts experienced by the structures. It is understood that as drift increases, the level of damage increases too. In many performance-based codes, inter-story drifts are associated with different performance levels and corresponding levels of damage. For example, ATC-13 defines seven damage levels based on drift amounts, as presented in Table 1. This study considers these seven levels of damage as limit states.

Table 1.
Damage states and limits of maximum inter-story drift [48].
Determining the seismic performance of structures based on probability is known as “loss assessment” [49]. The PEER proposed Equation (2), which associates seismic performance with probabilistic earthquake intensity, demand, and damage models [50].
where the damage level (dm), numerical demand (edp) such as inter-story drift, spectrum acceleration (im), and decision variable (dv) like cost are involved. Once the performance level of a structure is considered, the structure is modeled.
In Figure 2 b, the initial structural model is created using ETABS version 18.1.1 (Computers and Structures, Berkeley, CA, USA). The geometric specifications are determined, and uniform loads are applied to side walls and dead and live loads to floors. In Figure 2 c, the GA parameters are selected carefully as they significantly influence its speed and accuracy. This study considers the following parameters: maximum iterations = 100, population size = 50, crossover percentage = 70%, mutation percentage = 40%, and mutation rate = 0.02. The design variables include the members of beams and columns of the typified structure. Due to practical reasons (see Section 4.2), the structure’s beam and column elements are grouped in a limited set. The number of variables for each type of structure naturally varies based on the number of floors and bays. Since the steel sections are selected from predefined sections, the optimization problem is performed in a discrete space. The initial population is randomly selected from defined IPE sections for beams and box sections for columns to initiate the process.
Then, the process enters the main loop of the optimization algorithm (Figure 2 d–f). The aim is to optimize LCCs while considering the cost–benefit concept against a reasonable initial cost; a bi-objective trade-off approach is employed, focusing on the initial cost of the structure and its LCCs. Multi-objective optimization is a branch of multi-criteria decision-making that involves simultaneously optimizing multiple objective functions. It finds applications in various fields of science and engineering when there is a need to balance between two or more objectives to make optimal decisions for the system.
In general, a multi-objective optimization problem consists of a set of n design variables, a set of m objective functions, and a set of i constraint functions. The optimization problem equation for this research is expressed by Equation (3):
mins∈F [CIC(s), CLCC(s)]T
subject to Cj(s) ≤ 0, j = 1, …, i
subject to Cj(s) ≤ 0, j = 1, …, i
Here, two objective functions, namely, CIC (representing the initial structural cost) and CLCC (representing the LCC), are considered. The vector s represents the sections of each structure’s components, and F represents a possible group in the design’s discrete space Rn, expressed as a group of design variables that satisfy the constraint functions Cj(s) (Equation (4)).
F = {s ∈ Rn|Cj(s) ≤ 0, j = 1, ..., i}
In a multi-objective optimization problem, there is not a single unique solution that represents the optimal solution for minimizing CIC or CLCC. Instead, the goal is to find a group of optimal designs that lie on the Pareto front of the optimization problem. A design vector s* ∈ F is a Pareto optimum for the optimization problem (3) only if no other design vector s ∈ F satisfies Equation (5).
To solve the problem, a candidate solution is examined to determine if it belongs to the possible group (Equation (4)) at any stage of the optimization procedure (Figure 2 d). The designs are assessed based on regulatory requirements and constraint functions. If a design fails to meet the given constraint, the design variables are adjusted. This design control stage includes various sub-stages like drift checking and adherence to the strong column–weak beam theory. Once the structure is approved against gravity loads, the process moves to Figure 2 e. In this stage, a nonlinear static analysis is performed to estimate the structure’s damage level considering its usage and the maximum inter-story drift Δ, resulting in secondary costs for the structure.
Since structural elements often enter the nonlinear zone during severe earthquakes, performing nonlinear analyses is crucial for accurate performance responses, especially for irregular structures. Due to its simplicity, small analysis volume, and less time requirement compared to nonlinear dynamic analysis, the pushover analysis effectively represents the structure’s behavior. According to ASCE-7 [51], the gravity load combination for nonlinear static analysis is given by Equation (6).
QD = 1.2QD + 1.6QL
After meeting the specified constraints, the pushover analysis is conducted. To do this, gravity load combinations are also obtained according to ASCE41-17 [51], as per Equations (7) and (8). Regardless of which one of these relations is applicable, a more critical impact on the structure is considered.
QD = 1.1(QD + QL)
QD = 0.9QD
Pushover analysis assesses the structure’s resistance and deformability at both the overall and element levels. This is achieved by pushing the structural model using a predetermined constant lateral load pattern; according to ASCE41-17, a single pattern based on the first mode shape is enough [51]. The analysis assumes that the structure’s response is related to that of a single-degree-of-freedom system with characteristics proportional to the structure’s first mode, and its period is less than two seconds; otherwise, one can use adaptive pushover methods (e.g., Chintanapakdee and Chopra’s model [52]), which consider the effects of higher modes. Since the structures in this study have a period of less than 2.0 s, adaptive pushover methods are not required. Moreover, Li et al. [53] demonstrated that incorporating higher mode effects in a 9-story steel building leads to a 13.2% increase in LCCs compared to traditional methods. In the context of optimization, when all structures are evaluated using a single method, there is no difference in the optimal structure. However, employing adaptive methods can enhance the accuracy of secondary costs for all structures simultaneously. On the other hand, compared to the time history nonlinear dynamic analysis, pushover analysis excludes the uncertainty of earthquake waves [54]. Because our purpose here is to perform the seismic performance analysis of the structure, rather than the uncertainty of earthquake waves, the pushover method is a more appropriate approach.
The pushover analysis requirements, including the combination of gravity load and target displacement, are all based on ASCE41-17, as described in Equation (9) [51].
where C0/C1/C2 represents correction factors. Te denotes the effective fundamental period of the structure in the studied direction, while Sa refers to the spectral acceleration related to Te, which is normalized with g.
We first need to find the equivalent spectral acceleration (Sa) to determine the base shear due to each earthquake. This “design Sa” represents the Sa equivalent for an earthquake with a 10% probability of occurrence within 50 years. To determine the Sa for earthquakes with probabilities of occurrence of 2% and 50% within 50 years, the design Sa is scaled using a hazard curve. The hazard curve is constructed based on the annual exceedance rate and peak ground acceleration (PGA). Note that the specific hazard curve used for case studies depends on the building’s location. Nevertheless, the framework for optimizing structures remains consistent and independent of the specific case studies.
Here, the cases studied are assumed to be in Tehran city. According to the fourth edition of Iran’s seismology code, the PGA associated with Tehran’s design earthquake is 0.35g. Referring to the hazard curve for Tehran provided by Tsang and colleagues [55], the PGAs for earthquakes with annual exceedance probabilities of 2475−1 and 72−1 are 0.58 and 0.18, respectively. By calculating the ratio of these PGAs to the design earthquake PGA, the equivalent Sa for these seismic hazard levels is scaled, as illustrated in Figure 3. Subsequently, in part e of Figure 2, the pushover analysis and the generated spectra are used to determine the target displacement for each annual exceedance probability (refer to Section 3 and Section 4.2). Considering the obtained damage levels, the secondary costs of the building are calculated. In part f of Figure 2, considering the structure’s weight, its initial cost is calculated (refer to Section 3.1). By using the discount rate and the useful life of the building, the LCCs are calculated (for more details, see Section 3).
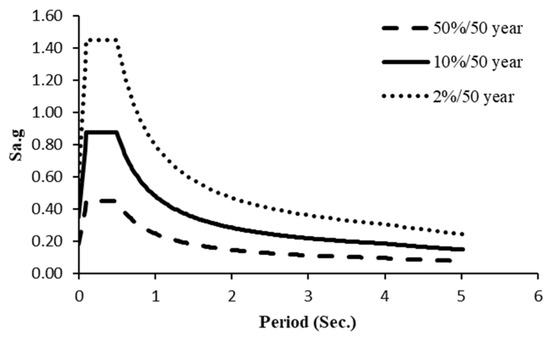
Figure 3.
Spectrum accelerations of 2%/10%/50% probability of exceedance over 50 years for Tehran with Type II soil (Vs = 375–750 m/s).
The pushover analyses are performed within the ETABS environment, wherein potential locations for plastic hinge formation are defined at distances of 0.05 and 0.95 of the beams and columns, utilizing lumped plasticity. Notably, according to Inel and Ozmen’s research, the capacity curve for default joint models is reasonable for analysis programs for structures compliant with new codes [56]. Here, the default ETABS plastic joint settings from ASCE41-17 are employed [51].
Multi-Objective Optimization Algorithm
Acknowledging that the effectiveness of evolutionary algorithms in handling multi-objective optimization problems has been proven in many studies, here, a GA-based algorithm is employed to create a balance between initial cost and LCC. As the variables (structure elements) are discrete and the number of possible scenarios is huge, we decided to adopt the NSGA-II algorithm [57], known for its efficiency and versatility in solving engineering multi-objective optimization problems and effectively covering the Pareto front.
The key features of the NSGA-II algorithm [57] involve evaluating the quality of various solutions through non-dominated ranks and crowding distances, which are obtained using a sorting algorithm. Solutions with lower non-dominated ranks are deemed superior. If two solutions share the same non-dominated rank, NSGA-II favors the one with a greater crowding distance. The steps of NSGA-II, corresponding to Figure 2 c–f, are outlined in Figure 4.
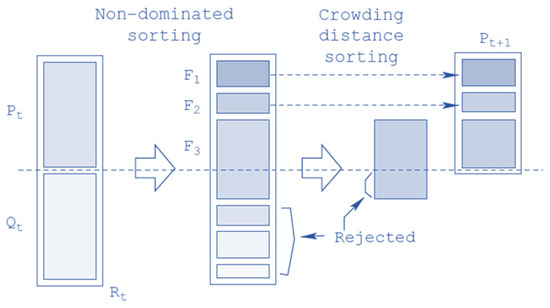
Figure 4.
NSGA-II procedure [57].
- Initial population: Generate Pt parent vectors of the first generation (si, I = 1,2, …, Pt).
- Design and control stage: Perform structural analysis and review code constraints.
- Calculation of fitness indicators: Evaluate the objective functions CIC(si) and CLCC(si) for Pt parent vectors.
- Non-dominated sorting: Create a temporary Pareto front curve.
- Generation of offspring: Produce offspring vectors Qt by applying crossover and mutation processes to parent vectors.
- Design and control stage: Perform structural analysis and review code constraints.
- Calculation of fitness indicators: Evaluate the objective functions CIC(si) and CLCC(si) for Qt parent vectors.
- Non-dominated sorting: Sort Pt + Qt vectors based on dominance conditions.
- Selection stage: Calculate crowding distance and obtain new parents Pt+1 from Pt + Qt vectors.
- Sorting: Create a new temporary Pareto front curve.
- Convergence check: The algorithm stops if the stopping condition is met; otherwise, return to step 3.
The static penalties method was employed in this research for constraint review. In this method, if a design fails to satisfy the desired constraints, the penalty parameters remain independent of the current generation number and a fixed penalty is applied to infeasible solutions [58].
3. Initial and LCC Objective Functions
As pointed out earlier, the costs associated with a structure consist of direct costs, encompassing the initial construction cost (Cc), maintenance cost, and disposal cost [16]. However, for this study, we focused solely on the initial construction cost as the objective function. In typical urban structures, maintenance costs are often negligible compared to other expenses, leading us to disregard them in the analysis. The initial cost of steel structures is generally proportional to the total weight of their components. While other factors, such as non-structural parts, protective coatings against fire or corrosion, etc., could influence the initial cost, they are not considered in this study.
The objective function of LCCs involves the initial construction and indirect costs (CID). To calculate CID, potential earthquake damages that might occur during the structure’s lifetime are considered. Equation (10) demonstrates that CID comprises various costs, including the cost of death (Cf), injury cost (Cinj), economic damage (Ce), relocation cost (Cr), loss of content (Cp), and repair cost (Cre). In this analysis, we assumed that repair costs and other factors only pertain to the structure under study, and the damage to infrastructure does not directly impact it.
CID = Cre + Cp+ Cr + Ce + Cinj + Cf
To calculate LCC, different probabilistic methods have been put forth. In this study, we employed the function proposed by Van and Kong [59], as shown in Equation (11).
In Equation (11), t represents the useful life of the structure under study, set to 50 years for residential use. It is assumed that after an earthquake, the structure will be reconstructed and restored to its original state [39]. The parameter v represents the annual rate of significant earthquakes, modeled using the Poisson process. Pk denotes the kth probability of the extreme state considering the occurrence of an earthquake, while Ck represents the associated cost. Pk is determined using Equations (12) and (13). Notably, Ck will impact the structure in the future, whereas construction costs are calculated in the present. Consequently, all future values of indirect costs must be converted to their actual value at the time of construction. To achieve this, the exponential expression in Equation (11) is used to convert CID to its value at the time of construction, considering an annual discount rate (λ) of 5%, which falls within the range of 5–8% discount rates for Asia [60].
where signifies the annual probability of exceeding the maximum inter-story drift. Each damage state is defined by one of the maximum inter-story drift states (column 3, Table 1). When the drift surpasses one of these states, it has reached the corresponding allowable limit. is determined using Equation (14).
The above expression is a logarithmic graph, and the parameters α and β are obtained through a graph representing the pair of values . These pairs correspond to the responses to earthquakes with 2%/10%/50% probabilities in 50 years, and their exceedance probabilities are known (Equation (1)). For instance, a 50/50 earthquake has an annual exceedance probability of .
3.1. Indirect Costs
3.1.1. Cost of Repair
The ATC13 provides the cost of repairing and rebuilding a destroyed building as a percentage of the original construction cost (Table 2, column 3). The specified percentages for reconstruction costs correspond to the percentage of damage sustained by the structure. While reconstruction costs are similar to construction costs, the volume of operations differs based on the level of reconstruction.

Table 2.
Repair costs and days of downtime according to the damage states [45].
It is worth noting that when damage exceeds 50% of the building, the demolition and reconstruction of the structure becomes more cost-effective than attempting to restore it [16]. So, the repair cost for the high damage level was also assumed to be 100%.
3.1.2. Loss of Possessions
The contents of a residential building are typically of lower value than commercial buildings. Nonetheless, the items within residential buildings still hold their value, and in case of destruction, they need replacement. Naturally, the value of the building’s contents varies depending on many factors, such as the building area, city, neighborhood, and number of residents. A questionnaire was prepared and distributed to 200 individuals from various areas of Tehran city to determine the value of the building’s contents per square meter. The questionnaire sought a general estimate of the value of household items and the area of their homes. Based on the responses, the average price of household items per square meter was estimated at US$212.5.
3.1.3. Relocation Cost
During the repair period of a building, temporary accommodation is required, which incurs substitute residence expenses. We need to determine the average rent per square meter in Tehran to calculate the cost of temporary substitute residences. By examining the national real estate transaction registration system, this study adopted a value of US$9 per square meter per month as the rental cost in Tehran. Accordingly, the average daily rent in Tehran amounts to US$0.3 per square meter (. It should be mentioned that it was assumed that the rental unit would have an area equivalent to the existing building.
Calculating the exact amount of this section requires knowledge of the time required to rebuild the building. However, the reconstruction time for damaged buildings in the city is influenced by numerous factors, such as blocked communication routes, budget constraints, lack of specialized human resources, inconsistencies, mismanagement, and improper earthquake disaster management. As a result, it may not be feasible to specify an exact time for rebuilding a building. Here, we independently evaluated the models, disregarding other urban factors. It is worth mentioning that the reconstruction time might be underestimated, potentially leading to a reduction in the calculated LCC compared to its actual value. Nevertheless, since the conditions are assumed to be the same for all models, it will not disrupt the main optimization problem.
The time required for reconstruction based on the levels of damage, presented as a percentage of the time required to rebuild a destroyed building, is given in Table 2, column 4.
The construction time for conventional buildings has been explored in many studies [61,62,63,64]. Although factors such as financial resources can influence a building’s execution time, this study utilizes the Delphi method to collect opinions from 20 active companies with over 20 years of experience in the construction industry. After three rounds of feedback, the results converged, leading us to assume construction times of 17 months, 23 months, and 30 months for 7, 10, and 13-story buildings, respectively.
3.1.4. Economic Cost
The economic loss resulting from the interruption in the building’s functionality is divided into rent and income loss. For rental damage, the average building rent rate is specified per square meter per month. This section considers the loss incurred by the building’s owner due to the building’s inefficiency in generating rental income until it has been reconstructed after the earthquake. This loss is calculated based on the average daily rent in Tehran, similar to the previous section, amounting to US$0.3/m2 per day.
In the current study, the economic damage is limited to rental costs for residential use. However, it is essential to note that economic losses resulting from commercial activities vary depending on the type of trade and economic activity. These losses should be calculated precisely for each building, considering its income. This estimation helps determine the loss incurred due to income reduction during complete or partial functionality loss.
3.1.5. Cost of Injuries
Following an earthquake, injured individuals typically require emergency medical care within the first 3–5 days. For severe injuries, medical services are often needed for weeks afterward. FEMA227 classifies injuries among residents into two categories: minor and severe. The corresponding injury incidence rates are provided in Table 3, columns 3 and 4.

Table 3.
The incidence rate of human injury and fatality in the damaged states [65].
Based on the data from the Social Security Research Institute of Iran, the average cost of treating minor and outpatient injuries is US$828, while the average cost of treating severe injuries that require hospitalization is US$8725 [66].
3.1.6. Cost of Human Fatality
Various approaches exist for estimating the value of human life, with each approach offering different methods, including the willingness to pay [67], future income discount [68], market valuation [69], non-market valuation [70], human capital [71], and court penalty [72]. Miller proposed a method based on GDP to calculate the average value of a person’s life in society [73]. According to that work, the value of life in any society can be determined by considering its GDP and population. Specifically, the value of life in each country is estimated to be 120–140 times the GDP of that country.
It is important to note that this value is considered average for all members of society. The International Monetary Fund reported Iran’s per capita GDP in 2023 as US$4250. Thus, the minimum value of life is considered as 120 × GDP/Capita = 120 × 4250 = US$510,000. The rate of losses is determined based on the level of damage in the building, following FEMA-227 and ATC-13 regulations (see Table 3, column 5).
Another crucial factor for assessing damage and human injury costs is the number of residents in residential units. Studies in Iran indicate that the average residential space per capita in Tehran is 21.9 m2 [74], which was taken to be 25 m2 for simplicity. This means that per m2, 0.04 people are at risk due to earthquakes.
The factors obtained in the calculation of the secondary costs are summarized in Table 4.

Table 4.
Factors used in the calculations of the secondary costs of the life cycle.
4. Numerical Study
4.1. Basic Information
The method described in the previous section determines and compares the optimal LCC of six steel moment-resisting frame structures, namely, regular and setback irregular 7-, 10-, and 13-story structures. For regular buildings, the models consist of three equal spans of 5 m in each direction, as shown in Figure 5. Each floor has a height of 3.2 m. Thus, the total height of the 7-story structure is 22.4 m, the 10-story structure is 32 m, and the 13-story structure is 41.6 m. The three types of structures are transformed into setback irregular configurations to investigate the effects of irregularities, as depicted in Figure 6. Here, a “setback irregular” structure is one where the horizontal dimensions of one floor are more than 130% of the adjacent floors [75]. As shown in Figure 7, the dimensions of the floors of the building are 5/10/15 m; thus, the lower floors span a length that is 200%/150% more than the upper floors, and as a result, the models are considered setback irregular. The structures are located in Tehran and follow the Iranian National Building Regulations-section 6 (INBC6), equivalent to UBC Zone IV (z = 0.4) and ASCE-07 Seismic Zone E. The peak ground acceleration (PGA) is considered 0.35, with the soil type corresponding to INBC6 number II, equivalent to Class C in ASCE-07. The buildings are designed according to the special moment frame rules of the Iranian National Building Regulations-section 10 (INBC10), which closely resembles AISC360–05 and AISC341-05 standards. These buildings are designated as residential and evaluated for the LS performance level based on ASCE41-17.
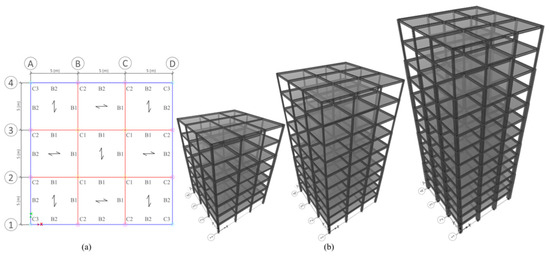
Figure 5.
(a) Structural plan and (b) 3D views of the regular 7, 10, and 13-story structures.
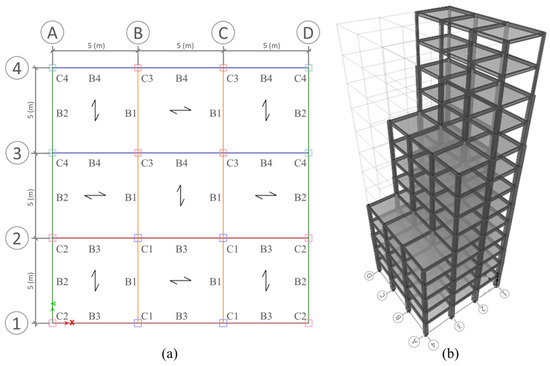
Figure 6.
Structural plan (a) and 3D view (b) of the setback irregular 13-story structure.
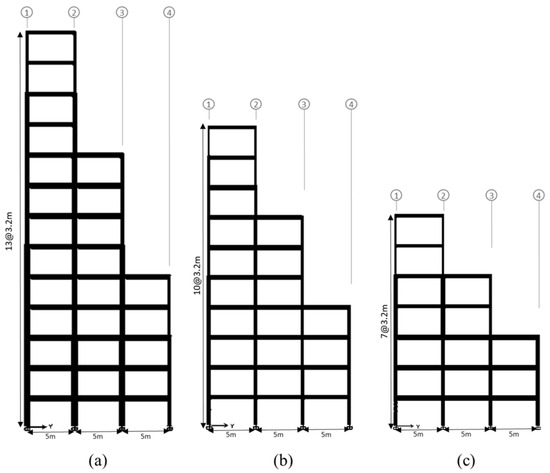
Figure 7.
Sections of the setback irregular (a) 13, (b) 10, and (c) 7-story structures.
To account for perpendicular loads and to ensure that the results are more relevant to real-life scenarios, the structures are modeled in three dimensions. The dead load of each floor is 650 kg/m2, the live load of all floors, except the roof, is 200 kg/m2, and the roof floor carries 150 kg/m2. The load of the surrounding walls is applied linearly to the surrounding beams, which is 250 kg/m2. The floors are modeled as a composite type, consisting of a 9 cm concrete slab with a final strength of 28 MPa and a 7.5 cm deep steel deck with an ultimate strength of 370 MPa. The composite floors are modeled such that they are checkered to ensure an even distribution of load on structural members. A combination of 100% dead load and 20% live load is used for earthquake load calculation to determine the required mass. The beams are designed using IPE profiles, and the columns are designed using box sections. The seismic compactness of all sections is assessed according to INBC10. The beam-to-column connections are all assumed to be fixed.
4.2. Optimization Procedure
There are two approaches to optimizing a structure. The first involves carefully selecting the sections of each beam and column to achieve the most optimal state. The second approach groups the beams and columns into types and modifies the sections of these types to reach the optimal state. While the first method offers high accuracy, it requires considerable processing time, making it impractical for real-world applications, especially when designing individual elements for each column. Instead, designers and builders commonly employ the typification method, which considers sections for elements spanning two or three stories. The second method is also influenced by the standard lengths of steel sheets produced in factories, usually 6 m (approximately two stories) or 12 m (approximately 3–4 stories). Also, columns spanning two or three stories have a stress ratio difference of about 0.3, making typified sections economically viable. For instance, the 7-story regular structure in this context consists of 168 beams and 112 columns, totaling 280 elements. However, using proper typification, this structure can be optimized with only 15 types (six types of beams and nine types of columns). It is evident that employing a GA with 15 members significantly speeds up the optimization process compared to working with 280 members.
To improve efficiency and reduce optimization time, we implement typification based on both plan configurations (Figure 5 and Figure 6) and the height of beams and columns, as described earlier. The chromosome in the GA represents a potential solution. It contains 15 genes for the regular 7-story structures (nine columns and six beams), 20 genes for the 10-story regular structures (12 columns and eight beams), and 25 genes for the 13-story regular structures (15 columns and ten beams). For the setback irregular structures, the chromosome comprises 20 genes for 7-story structures (ten columns and ten beams), 27 genes for 10-story structures (14 columns and 13 beams), and 36 genes for 13-story structures (20 columns and 16 beams). To illustrate the typified sections, we present sample configurations for the 7-story regular and setback irregular structures in Figure 8. The format uses the first number to denote plan typification (Figure 5). The second number represents height typification (Figure 8). Combining plan and height typification for the 7-story regular structure results in the chromosome shown in Figure 9. The GA then searches for superior chromosomes and, consequently, the optimal structure by exploring various section combinations using crossover and mutation operations on the parent vectors.
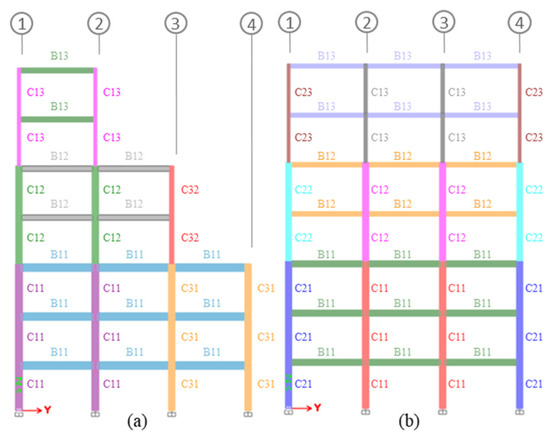
Figure 8.
Section type-casting of Section C of (a) setback irregular 7-story and (b) regular 7-story structures (each color corresponds to a typification group).

Figure 9.
Chromosome of the GA for optimizing the regular 7-story structure.
The number of candidate sections for each gene in the chromosome (Figure 9) depends on the type of element (column or beam) and its position on different floors. This is crucial to ensure that structures have the potential to resist design constraints, facilitating faster convergence of the algorithm. More information about the candidate sections used in designing the structures is given in Appendix A. The GA employs those candidate sections during chromosome assembly.
After satisfying the primary design constraints, such as controlling the lateral displacement, ensuring the force-to-capacity ratio of beams and columns, and adhering to the principle of weak beam-strong columns, the GA focuses on the objective function. This function evaluates each structure that was initially produced to determine its value. The bi-objective GA considers the initial construction cost and the LCC as outputs of the objective function.
The initial construction costs are influenced by various factors, such as time, geographical location, number of floors, structural system, and material quality. The average construction costs are estimated to be approximately US$513/m2 for a 7-story building, US$577/m2 for a 10-story building, and US$670/m2 for a 13-story building. The calculation of initial construction costs involves using a constant cost for non-structural parts and the product of the costs of beams and columns, with their weight as the structural cost. It is estimated that around 20% of the construction costs are attributed to the structural components, with the remaining 80% being non-structural costs. Therefore, for a 7-story structure, the cost of non-structural parts would be approximately US$410. Similarly, for the 10- and 13-story structures, the cost of non-structural parts would be approximately US$462 and US$536, respectively. To determine the cost of preparing and constructing a skeleton, Iran’s building price list indicates that it costs US$1.1/kg to prepare, construct, and install a square cross-section column and US$0.9/kg for a main beam. Considering various coefficients specified in the construction laws of Iran, the average cost of building a steel structure is estimated to be US$1.63/kg. The initial cost of the structure is then obtained by multiplying the weight of the initial structure by this value. Indirect LCCs are also calculated using performance-based design concepts and the information provided in Section 3 and Equations (11)–(14).
The proposed methodology is implemented using API writing to connect MATLAB (Version R2018b, MathWorks, Portola Valley, CA, USA) and ETABS. The process involves creating codes for reviewing code constraints, implementing the NSGA-II algorithm in MATLAB, and optimizing the structure. The initial model of the desired structure is created in ETABS, and elements are grouped and typed according to the structure’s design. Required sections are defined for each type, and the model is prepared for analysis and optimization. Codes for the NSGA-II algorithm in MATLAB are then created, and the optimization process begins, wherein elements of each type are changed, constraints are reviewed, the pushover analysis is performed to obtain the force-displacement curve of the structure, and the annual exceedance probability () for each damage state is then calculated. The objective function is reviewed next; after generating 500 generations, the algorithm provides the best possible solutions and produces the Pareto front curve for each model. The computing time for solving the multi-objective optimization problem was between 4 and 9 days (depending on the models) on a computer with the following system information: Processor: Intel Xeon(R) CPU E5-2670 0 @ 2.60 GHz, 8 Core(s), 16 Logical/RAM: 24.0 GB DDR3/Hard: SSD 750 EVO 500 GB. An example of the obtained Pareto front curve for the regular 7-story structures is shown in Figure 10.
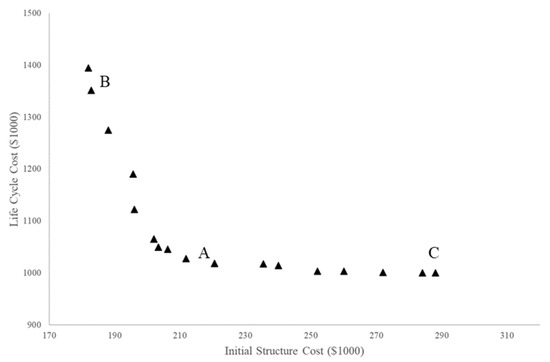
Figure 10.
Pareto front plot of the 7-story regular structures using NSGA-II algorithm.
Figure 11 and Table 5 and Table 6 explain the LCC objective function calculation for model A, as depicted in Figure 10. Utilizing Equation (10) and the information from Section 3.1, along with the area of the regular 7-story structure (which is 1575 m2), the Ck for each level of damage is obtained, as shown in Table 5. To calculate Pk, a pushover analysis is performed. The structures are designed based on special moment frame regulations, and lateral loads are applied in 100 increasing displacement-controlled steps until the structure reaches the target displacement based on ASCE41-17. Once the pushover curve is obtained, the target displacement for each of the three annual exceedance probabilities (0.58 g/0.35 g/0.18 g for 2%/10%/50% earthquakes in 50 years) is determined, resulting in three pairs of maximum inter-story drift and annual exceedance probability (∆, P) for model A: (0.0047, 0.0139), (0.01361, 0.0021), and (0.02325, 0.000404). An exponential function in the form of Equation (14) is fitted to obtain the curve shown in Figure 11 using MATLAB. Using this curve function and Equations (12) and (13), the annual exceedance probabilities for each Pk for the seven damage states introduced in Table 1 are obtained. Finally, the LCC of the structure is calculated using Equation (11). All the required calculations for model A are presented in Table 6.
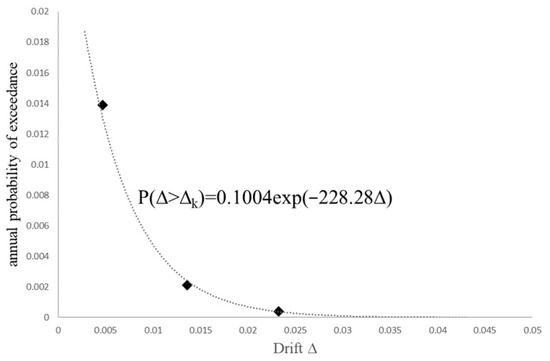
Figure 11.
Calculation of annual exceedance probability () for each damage state of model A.

Table 5.
Calculation of Ck for Model A according to Tehran’s conditions.

Table 6.
Calculation of indirect costs for model A.
In the same vein, secondary costs for models B and C (in Figure 10) are calculated. As seen in Table 7, model B, with the lowest initial cost, has a higher LCC than models A and C. On the other hand, model C, with a higher initial cost than the other two models, does not exhibit a significant difference in LCCs compared to model A. Although its secondary costs decreased, the substantial increase in initial costs offset the benefits in LCCs compared to model A. Consequently, by balancing initial and secondary costs, model A emerges as the most favorable option for long-term investment. The pushover curves of these three models can be observed in Figure 12. Similarly, the Pareto front curves of the remaining models can be seen in Figure 13.

Table 7.
Comparing the cost results of models A, B, and C.
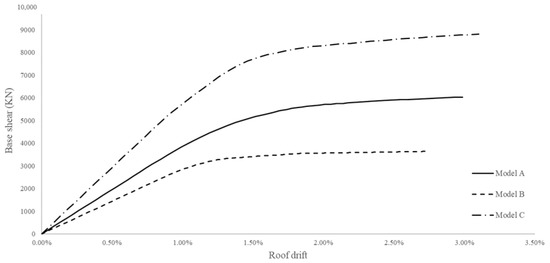
Figure 12.
Pushover curves of models A, B, and C.
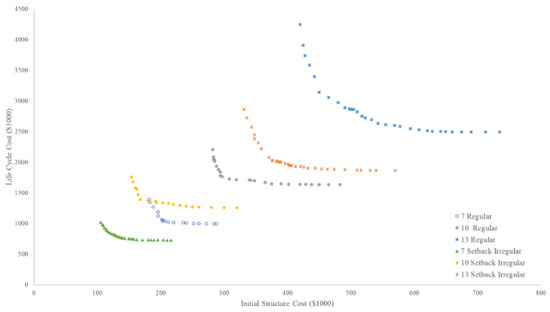
Figure 13.
Comparison of Pareto front graphs of regular and setback irregular structures.
As depicted in Figure 13, as the initial cost of the structure increases, the secondary costs and the LCC of the building decrease. However, beyond a certain point, further increases in initial costs do not significantly reduce the LCC as some secondary costs will not decrease significantly.
In Figure 13, regular and irregular structures are compared, and the impact of structure height on their LCC is assessed by placing all the Pareto front graphs side by side. The behavior of each graph and the derived numbers leads to the following observations.
Generally, the effect of irregularity in the seismic behavior of structures is significant and notably changes their LCC. For instance, in the regular 7-story structure, a 16% increase in initial costs can reduce around 26% of LCCs. In comparison, a 35% increase in the initial cost of the irregular 7-story setback structure results in an approximately 37% reduction in LCC. For the 10-story building, a 22% increase in initial cost results in a 32% decrease in LCC, while for the irregular 10-story building, a 27% increase in initial cost was needed to achieve a 32% reduction in LCC. Regarding the regular 13-story structure, a 17% increase in initial cost can reduce around 48% of LCCs, while the same increase in initial cost for the irregular 13-story setback structure results in an approximately 40% decrease in its LCC.
The comparison of these cases showed that taller structures are more sensitive to initial and LCCs, such that a smaller increase in initial costs results in a larger decrease in LCCs. This can be due to two factors: first, the effects of earthquakes become more significant as the building’s height increases, and second, more people and contents are at risk of damage due to increased floor area.
Among the story structures, the regular structure is more sensitive to changes in initial cost than the irregular one. This can be because the regular structure has a greater area, thus leading to the structure bearing more secondary costs. However, the difference in the area does not impact the behavior of the regular and irregular 10- and 13-story structures. Even though irregular structures have a lower area than regular ones, they show more sensitive behavior regarding initial costs. By comparing the slope of the graphs of the regular and irregular 10-story structures, one can see that their behavior is roughly similar. However, in the case of the 13-story structures, unlike the 7-story structures, by examining the behavior of regular and irregular structures through the slope of the graph, one can notice that the LCC of irregular structures is more sensitive to changes in the structure’s initial weight. This could be due to the intensifying effect of seismic forces with increasing structure height, especially for irregular structures. In other words, as the height of the structure increases, the impact of irregularity on the seismic behavior of the structure and, consequently, its LCC, becomes more apparent. In the 7-story structure, irregularity does not substantially affect the LCC of the structure compared to the regular structure. However, in the 13-story structure, a slight decrease in the structure’s weight results in a considerable increase in secondary costs and, hence, its LCC. Also, Figure 13 illustrates that as initial costs decrease, the Pareto front graph of the regular 10- and 13-story structures gradually shifts towards higher secondary costs. In contrast, the setback 10- and 13-story structures exhibit a sudden break in the graph, with secondary costs sharply increasing, even with a slight reduction in the structure’s initial weight. This re-affirms that irregular structures may be associated with more seismic damage than regular structures.
Figure 14 further demonstrates that in high-rise structures, the indirect costs of the setback irregular structures are much higher than those of the regular structures. Therefore, we recommend, especially for tall structures in seismic regions, minimizing the use of complex and excessive irregularities in the design or considering performance-based methods like the one proposed in this study to evaluate and compare different design options based on initial and life cycle cost considerations.
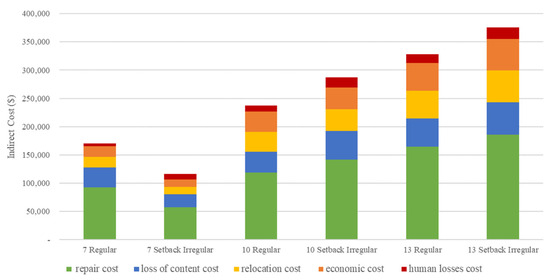
Figure 14.
Comparison of the indirect cost of regular and setback irregular structures.
Ultimately, to assess the sensitivity of LCCs to the discount rate, the LCCs of an optimized model (OM) and a code-based design model (CBM) of the 10-story regular structure are compared. This is performed assuming discount rates of 1%/2%/5%/10% and varying operational years. As seen in Figure 15, there is no significant difference between the LCC trends of the OM and CBM. The figure also indicates that after 5 years, under all the assumptions, the LCC of the OM will be profitable and lower than that of CBM.
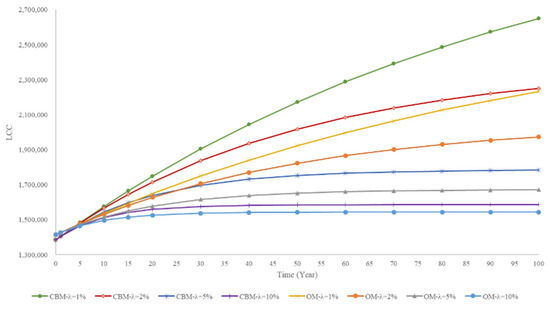
Figure 15.
LCC sensitivity analysis of the OM and CBM of the 10-story regular structure concerning the discount rate and operating lifespan.
5. Conclusions
Seismic design plays a crucial role in ensuring the safety of buildings located in seismically active urban areas. However, many seismic codes focus mainly on the initial construction costs, often ignoring the life cycle costs (LCCs). This study presented a framework for optimizing the seismic design of steel structures based on performance to assess damage levels under various earthquake intensities. Through three-dimensional modeling of six mid- and high-rise regular and irregular setbacks structures (7, 10, and 13-story), this study investigated the influence of height and irregularity on the LCCs of steel structures using the performance-based design optimization framework with the NSGA-II algorithm. The results obtained from the NSGA-II algorithm depicted in the form of Pareto front graphs revealed the following findings:
- As structures increase in height, their LCC becomes more sensitive to changes in the initial cost. Even slight alterations in the initial cost can have significant long-term cost implications.
- Reducing the LCC of irregular structures requires a higher initial cost than regular structures. For instance, in the 13-story model, increasing the initial cost by 17% resulted in LCC reductions of approximately 48% and 40% for regular and setback irregular structures, respectively.
- The results showed that 7- and 10-story buildings had minimal differences, but the outcomes for 13-story buildings were markedly different. From economic and urban perspectives, this suggests that the number of floors has little impact on mid-rise buildings, beyond a certain limit, compared to high-rise buildings. Thus, the ideal number of floors should be determined based on each city’s economic and social considerations to achieve greater cost-effectiveness in construction.
- In mid-rise structures, the LCCs of regular buildings were more sensitive to changes in the initial costs compared to setback irregular structures. However, this relationship was reversed in high-rise buildings, and setback irregular structures displayed greater sensitivity to changes in initial costs despite having a lower floor area than regular buildings.
- Irregular high-rise structures exhibited a critical threshold where even a slight decrease in initial construction costs significantly increased LCCs. This is evident in the Pareto front curve, which displayed a noticeable break in those regions. It suggests that irregular high-rise structures are more susceptible to damage from seismic loads, leading to significantly higher financial and lifetime costs. Thus, optimizing structures exclusively based on minimizing initial weight may not be the most financially sound and safest approach.
- Compared to research using manual methods and limited models for optimization, utilizing a metaheuristic algorithm for optimizing LCCs not only identified the optimal LCCs but also reduced the structure’s weight due to its ability to explore more models. In other words, applying the bi-objective GA facilitated the simultaneous optimization of structure LCCs and weight reduction.
Our observations suggest that when the primary focus is on minimizing the initial weight of a building, it may lead to designs that are more vulnerable to damage and, as a result, incur higher lifetime secondary costs; this is particularly the case in high-rise and irregular structures. However, the use of the proposed model can potentially reduce the secondary costs. This study does not imply that optimizing for initial weight would result in the construction of tall and highly irregular buildings that would fail under severe seismic loads. Instead, it emphasizes that design strategies can be employed to create profitable structures that not only enhance safety but also reduce LCCs; they implicitly address social and economic efficiency.
It is essential to recognize that the numerical models shown here depend on the studied region. The design of structures is influenced by various factors such as soil type, hazard curves, and seismic codes. Also, the data used to calculate LCCs are subject to the economic (discount rate), social (cost of human fatality and injury), and welfare conditions (the contents of the building) of each region, which can vary significantly. However, the model proposed in this study is adaptable to different regions, and it demonstrates the importance of employing performance-based design strategies integrated with GA to optimize seismic performances, ultimately providing increased safety and financial benefits for building occupants.
The study results are based on pushover analysis, which is not applicable to skyscrapers; future studies could explore more precise methods to account for the LCC of these kinds of structures, which are also often irregular. In addition, future studies can address other types of architectural irregularities, such as soft stories and short columns, both of which are widely observed in urban buildings.
Author Contributions
Conceptualization, B.B.; Methodology, S.T.J.; Software, S.T.J.; Formal analysis, S.T.J.; Resources, B.B.; Writing—original draft, S.T.J.; Supervision, B.B.; Project administration, B.B. All authors have read and agreed to the published version of the manuscript.
Funding
This research received no external funding.
Data Availability Statement
The authors confirm that the data supporting the findings of this study are available within the article.
Conflicts of Interest
The authors declare that there are no conflicts of interest.
Appendix A

Table A1.
Candidate sections for beams and columns in the regular 7-story structure (the first value is the width of the section and the second value is the thickness of the section (in mm)).
Table A1.
Candidate sections for beams and columns in the regular 7-story structure (the first value is the width of the section and the second value is the thickness of the section (in mm)).
| Story | Typical | Section |
|---|---|---|
| 1–3 | C11 | BOX380X30, BOX400X25, BOX400X30, BOX420X25, BOX420X30, BOX440X30, BOX460X30, BOX440X25, BOX360X20, BOX340X20, BOX280X20, BOX300X20, BOX320X20, BOX480X25, BOX480X30, BOX500X25, BOX500X30, BOX520X25, BOX520X30, BOX540X25, BOX540X30, BOX560X25, BOX560X30, BOX580X25, BOX580X30, BOX600X25, BOX600X30 |
| C21 | BOX400X20, BOX380X25, BOX400X25, BOX400X30, BOX420X25, BOX420X30, BOX380X20, BOX440X25, BOX440X30, BOX460X30, BOX360X20, BOX340X20, BOX320X20, BOX300X20, BOX480X25, BOX480X30, BOX500X25, BOX500X30, BOX520X25, BOX520X30, BOX540X25, BOX540X30 | |
| C31 | BOX400X20, BOX380X25, BOX400X25, BOX400X30, BOX420X25, BOX420X30, BOX380X20, BOX440X25, BOX440X30, BOX460X30, BOX360X20, BOX340X20, BOX320X20, BOX300X20, BOX480X25, BOX480X30, BOX500X25, BOX500X30, BOX520X25, BOX520X30, BOX540X25, BOX540X30 | |
| B11 | IPE600, IPE550, IPE500, IPE450, IPE400 | |
| B21 | IPE600, IPE550, IPE500, IPE450, IPE400, IPE360 | |
| 4–5 | C12 | BOX340X20, BOX360X20, BOX360X25, BOX340X25, BOX420X30, BOX380X25, BOX380X30, BOX380X20, BOX400X20, BOX400X25, BOX400X30, BOX420X20, BOX320X20, BOX260X20, BOX280X20, BOX300X20, BOX240X20, BOX420X25, BOX440X20, BOX440X25, BOX440X30, BOX460X20, BOX460X25 |
| C22 | BOX320X20, BOX340X20, BOX360X20, BOX380X20, BOX400X20, BOX400X25, BOX400X30, BOX420X25, BOX340X25, BOX360X15, BOX360X25, BOX380X25, BOX380X30, BOX300X20, BOX240X20, BOX260X20, BOX280X20, BOX420X30, BOX440X20, BOX440X25, BOX440X30, BOX460X20, BOX460X25, BOX460X30, BOX480X25, BOX480X30 | |
| C32 | BOX320X20, BOX280X20, BOX300X20, BOX340X20, BOX340X25, BOX260X20, BOX360X25, BOX300X15, BOX320X15, BOX220X20, BOX240X20, BOX220X15, BOX220X12, BOX380X20, BOX380X25, BOX380X30, BOX400X20, BOX400X25, BOX400X30, BOX420X20, BOX420X25, BOX420X30, BOX440X20, BOX440X25, BOX440X30, BOX460X20, BOX460X25, BOX460X30, BOX480X25, BOX480X30 | |
| B12 | IPE550, IPE500, IPE450, IPE400, IPE360, IPE330 | |
| B22 | IPE500, IPE450, IPE400, IPE360, IPE330 | |
| 6–7 | C13 | BOX240X20, BOX260X20, BOX280X20, BOX300X20, BOX320X20, BOX340X20, BOX240X15, BOX260X15, BOX280X15, BOX300X15, BOX320X15, BOX340X15, BOX200X12, BOX200X15, BOX200X20, BOX220X12, BOX220X15, BOX220X20, BOX340X25, BOX360X15, BOX360X20, BOX360X25 |
| C23 | BOX220X20, BOX240X20, BOX260X20, BOX280X20, BOX300X20, BOX220X15, BOX240X15, BOX260X15, BOX280X15, BOX180X10, BOX180X12, BOX200X12, BOX200X15, BOX200X20, BOX320X15, BOX320X20, BOX340X15, BOX340X20, BOX340X25, BOX360X15 | |
| C33 | BOX200X12, BOX220X15, BOX220X20, BOX180X12, BOX200X20, BOX200X15, BOX220X12, BOX180X10, BOX240X15, BOX240X20, BOX260X15, BOX260X20, BOX280X15, BOX280X20 | |
| B13 | IPE500, IPE450, IPE400, IPE360, IPE330, IPE300, IPE270 | |
| B23 | IPE450, IPE400, IPE360, IPE330, IPE300, IPE270, IPE240 |

Table A2.
Candidate sections for beams and columns in the setback irregular 7-story structure (the first value is the width of the section and the second value is the thickness of the section (in mm)).
Table A2.
Candidate sections for beams and columns in the setback irregular 7-story structure (the first value is the width of the section and the second value is the thickness of the section (in mm)).
| Story | Typical | Section |
|---|---|---|
| 1–3 | C11 | BOX300X20, BOX320X20, BOX340X20, BOX360X20, BOX380X20, BOX380X25, BOX400X20, BOX400X25, BOX400X30, BOX420X25, BOX420X30, BOX440X25, BOX440X30, BOX460X30, BOX480X25, BOX480X30, BOX500X25, BOX500X30, BOX520X25, BOX520X30, BOX540X25, BOX540X30, BOX560X25, BOX560X30, BOX580X25, BOX580X30, BOX600X25, BOX600X30 |
| C21 | BOX300X20, BOX320X20, BOX340X20, BOX360X20, BOX380X20, BOX380X25, BOX400X20, BOX400X25, BOX400X30, BOX420X25, BOX420X30, BOX440X25, BOX440X30, BOX460X30, BOX480X25, BOX480X30, BOX500X25, BOX500X30, BOX520X25, BOX520X30, BOX540X25, BOX540X30 | |
| C31 | BOX240X20, BOX260X20, BOX280X20, BOX300X15, BOX300X20, BOX320X15, BOX320X20, BOX340X20, BOX340X25, BOX360X25, BOX380X20, BOX380X25, BOX380X30, BOX400X20, BOX400X25, BOX400X30, BOX420X20, BOX420X25, BOX420X30, BOX440X20, BOX440X25, BOX440X30 | |
| C41 | BOX240X20, BOX260X20, BOX280X20, BOX300X15, BOX300X20, BOX320X15, BOX320X20, BOX340X20, BOX340X25, BOX360X25, BOX380X20, BOX380X25, BOX380X30, BOX400X20, BOX400X25, BOX400X30, BOX420X20, BOX420X25, BOX420X30, BOX440X20, BOX440X25, BOX440X30 | |
| B11 | IPE500, IPE450, IPE400, IPE360 | |
| B21 | IPE500, IPE450, IPE400, IPE360, IPE330, IPE300 | |
| B31 | IPE600, IPE550, IPE500, IPE450, IPE400, IPE360 | |
| B41 | IPE450, IPE400, IPE360, IPE330, IPE300 | |
| 4–5 | C12 | BOX240X20, BOX260X20, BOX280X20, BOX300X20, BOX320X20, BOX340X20, BOX340X25, BOX360X15, BOX360X20, BOX360X25, BOX380X20, BOX380X25, BOX380X30, BOX400X20, BOX400X25, BOX400X30, BOX420X25, BOX420X30, BOX440X20, BOX440X25, BOX440X30, BOX460X20, BOX460X25, BOX460X30, BOX480X25, BOX480X30 |
| C22 | BOX240X20, BOX260X20, BOX280X20, BOX300X20, BOX320X20, BOX340X20, BOX340X25, BOX360X15, BOX360X20, BOX360X25, BOX380X20, BOX380X25, BOX380X30, BOX400X20, BOX400X25, BOX400X30, BOX420X25, BOX420X30, BOX440X20, BOX440X25, BOX440X30, BOX460X20, BOX460X25 | |
| C32 | BOX180X10, BOX180X12, BOX200X12, BOX200X15, BOX200X20, BOX220X12, BOX220X15, BOX220X20, BOX240X15, BOX240X20, BOX260X15, BOX260X20, BOX280X15, BOX280X20, BOX300X15, BOX300X20, BOX320X15, BOX320X20 | |
| C42 | BOX180X10, BOX180X12, BOX200X12, BOX200X15, BOX200X20, BOX220X12, BOX220X15, BOX220X20, BOX240X15, BOX240X20, BOX260X15, BOX260X20, BOX280X15, BOX280X20 | |
| B12 | IPE450, IPE400, IPE360, IPE330, IPE300, IPE270 | |
| B22 | IPE500, IPE450, IPE400, IPE360, IPE330 | |
| B32 | IPE500, IPE450, IPE400, IPE360, IPE330, IPE300 | |
| B42 | IPE400, IPE360, IPE330, IPE300, IPE270 | |
| 6–7 | C13 | BOX180X10, BOX180X12, BOX200X12, BOX200X15, BOX200X20, BOX220X12, BOX220X15, BOX220X20, BOX240X15, BOX240X20, BOX260X15, BOX260X20, BOX280X15, BOX280X20, BOX300X15, BOX300X20 |
| C23 | BOX180X10, BOX180X12, BOX200X12, BOX200X15, BOX200X20, BOX220X12, BOX220X15, BOX220X20, BOX240X15, BOX240X20, BOX260X15, BOX260X20, BOX280X15, BOX280X20 | |
| B13 | IPE450, IPE400, IPE360, IPE330, IPE300, IPE270 | |
| B23 | IPE450, IPE400, IPE360, IPE330, IPE300, IPE270 | |
| B33 | IPE400, IPE360, IPE330, IPE300, IPE270, IPE240 |
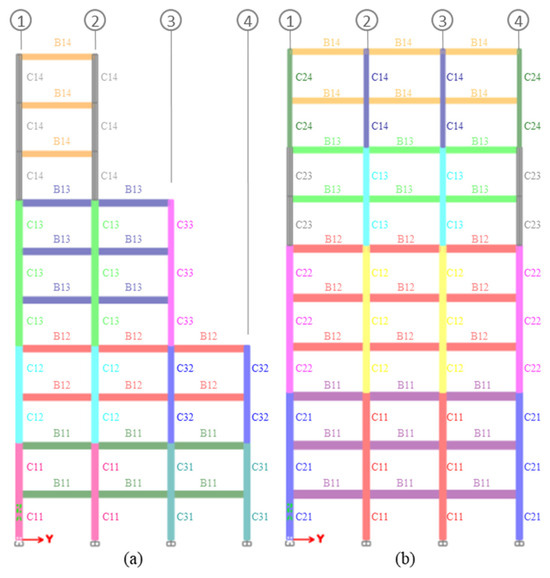
Figure A1.
Section type-casting of Section C of (a) setback irregular 10-story and (b) regular 10-story structures (each color corresponds to a typification group).

Table A3.
Candidate sections for beams and columns in the regular 10-story structure (the first value is the width of the section and the second value is the thickness of the section (in mm)).
Table A3.
Candidate sections for beams and columns in the regular 10-story structure (the first value is the width of the section and the second value is the thickness of the section (in mm)).
| Story | Typical | Section |
|---|---|---|
| 1–3 | C11 | BOX440X25, BOX440X30, BOX460X30, BOX480X25, BOX480X30, BOX500X25, BOX500X30, BOX520X25, BOX520X30, BOX540X25, BOX540X30, BOX560X25, BOX560X30, BOX580X25, BOX580X30, BOX600X25, BOX600X30 |
| C21 | BOX380X25, BOX380X30, BOX400X20, BOX400X25, BOX400X30, BOX420X25, BOX420X30, BOX440X25, BOX440X30, BOX460X30, BOX480X25, BOX480X30, BOX500X25, BOX500X30, BOX520X25, BOX520X30, BOX540X25, BOX540X30 | |
| C31 | BOX380X25, BOX380X30, BOX400X20, BOX400X25, BOX400X30, BOX420X25, BOX420X30, BOX440X25, BOX440X30, BOX460X30, BOX480X25, BOX480X30, BOX500X25, BOX500X30, BOX520X25, BOX520X30, BOX540X25, BOX540X30 | |
| B11 | IPE450, IPE500, IPE550, IPE600 | |
| B21 | IPE400, IPE450, IPE500, IPE550, IPE600 | |
| 4–6 | C12 | BOX360X20, BOX360X25, BOX380X20, BOX380X25, BOX380X30, BOX400X20, BOX400X25, BOX400X30, BOX420X25, BOX420X30, BOX440X20, BOX440X25, BOX440X30, BOX460X20, BOX460X25, BOX460X30, BOX480X25, BOX480X30 |
| C22 | BOX360X20, BOX360X25, BOX380X20, BOX380X25, BOX380X30, BOX400X20, BOX400X25, BOX400X30, BOX420X25, BOX420X30, BOX440X20, BOX440X25, BOX440X30, BOX460X20, BOX460X25, BOX460X30 | |
| C32 | BOX360X20, BOX360X25, BOX380X20, BOX380X25, BOX380X30, BOX400X20, BOX400X25, BOX400X30, BOX420X25, BOX420X30, BOX440X20, BOX440X25, BOX440X30, BOX460X20, BOX460X25, BOX460X30 | |
| B12 | IPE400, IPE450, IPE500, IPE550, IPE600 | |
| B22 | IPE360, IPE400, IPE450, IPE500 | |
| 7–8 | C13 | BOX260X20, BOX280X15, BOX280X20, BOX300X20, BOX320X20, BOX340X20, BOX340X25, BOX360X20, BOX360X25 BOX380X20, BOX380X25, BOX380X30, BOX400X20, BOX400X25, BOX400X30, BOX420X20 |
| C23 | BOX240X20, BOX260X15, BOX260X20, BOX280X15, BOX280X20, BOX300X15, BOX300X20, BOX320X15, BOX320X20, BOX340X20, BOX340X25, BOX360X15, BOX360X20 | |
| C33 | BOX240X20, BOX260X15, BOX260X20, BOX280X15, BOX280X20, BOX300X15, BOX300X20, BOX320X15, BOX320X20, BOX340X20, BOX340X25, BOX360X15, BOX360X20 | |
| B13 | IPE330, IPE360, IPE400, IPE450 | |
| B23 | IPE300, IPE330, IPE360, IPE400 | |
| 9–10 | C14 | BOX200X12, BOX200X15, BOX200X20, BOX220X12, BOX220X15, BOX220X20, BOX240X15, BOX240X20, BOX260X15, BOX260X20, BOX280X15, BOX280X20, BOX300X15, BOX300X20, BOX320X15, BOX360X20, BOX360X25, BOX380X20 |
| C24 | BOX180X10, BOX180X12, BOX200X12, BOX200X15, BOX200X20, BOX220X12, BOX220X15, BOX220X20, BOX240X15, BOX240X20, BOX260X15, BOX260X20, BOX280X15, BOX280X20 | |
| C34 | BOX180X10, BOX180X12, BOX200X12, BOX200X15, BOX200X20, BOX220X12, BOX220X15, BOX220X20, BOX240X15, BOX240X20, BOX260X15, BOX260X20, BOX280X15, BOX280X20 | |
| B14 | IPE270, IPE300, IPE330, IPE360 | |
| B24 | IPE270, IPE300, IPE330 |

Table A4.
Candidate sections for beams and columns in the setback irregular 10-story structure (the first value is the width of the section and the second value is the thickness of the section (in mm)).
Table A4.
Candidate sections for beams and columns in the setback irregular 10-story structure (the first value is the width of the section and the second value is the thickness of the section (in mm)).
| Story | Typical | Section |
|---|---|---|
| 1–2 | C11 | BOX380X25, BOX380X30, BOX400X20, BOX400X25, BOX400X30, BOX420X20, BOX420X25, BOX420X30, BOX440X20, BOX440X25, BOX440X30, BOX460X20, BOX460X25, BOX460X30, BOX480X20, BOX480X25, BOX480X30, BOX500X25, BOX500X30 |
| C21 | BOX340X20, BOX340X25, BOX360X15, BOX360X20, BOX380X20, BOX380X25, BOX380X30, BOX400X20, BOX400X25, BOX400X30, BOX420X20, BOX420X25, BOX420X30, BOX440X20, BOX440X25, BOX440X30, BOX460X20, BOX460X25, BOX460X30 | |
| C31 | BOX320X20, BOX340X15, BOX340X20, BOX340X25, BOX360X15, BOX360X20, BOX360X25, BOX380X20, BOX380X25, BOX380X30, BOX400X20, BOX400X25, BOX400X30, BOX420X20, BOX420X25, BOX420X30, BOX440X20, BOX440X25, BOX440X30, BOX460X20 | |
| C41 | BOX320X20, BOX340X15, BOX340X20, BOX340X25, BOX360X15, BOX360X20, BOX360X25, BOX380X20, BOX380X25, BOX380X30, BOX400X20, BOX400X25, BOX400X30, BOX420X20, BOX420X25, BOX420X30, BOX440X20, BOX440X25, BOX440X30, BOX460X20 | |
| B11 | IPE330, IPE360, IPE400, IPE450, IPE500 | |
| B21 | IPE330, IPE360, IPE400, IPE450, IPE500 | |
| B31 | IPE400, IPE450, IPE500, IPE550, IPE600 | |
| B41 | IPE300, IPE330, IPE360, IPE400, IPE450 | |
| 3–4 | C12 | BOX340X20, BOX340X25, BOX360X15, BOX360X20, BOX360X25, BOX380X20, BOX380X25, BOX380X30, BOX400X20, BOX400X25, BOX400X30, BOX420X20, BOX420X25, BOX420X30, BOX440X20, BOX440X25, BOX440X30, BOX460X20, BOX460X25, BOX460X30, BOX480X20, BOX480X25, BOX480X30, BOX500X25, BOX500X30 |
| C22 | BOX340X20, BOX340X25, BOX360X15, BOX360X20, BOX380X20, BOX380X25, BOX380X30, BOX400X20, BOX400X25, BOX400X30, BOX420X20, BOX420X25, BOX420X30, BOX440X20, BOX440X25, BOX440X30, BOX460X20, BOX460X25, BOX460X30, BOX480X20, BOX480X25, BOX480X30 | |
| C32 | BOX280X15, BOX280X20, BOX300X15, BOX300X20, BOX320X15, BOX320X20, BOX340X15, BOX340X20, BOX340X25, BOX360X15, BOX360X20, BOX360X25, BOX380X20, BOX380X25, BOX380X30, BOX400X20, BOX400X25, BOX400X30, BOX420X20, BOX440X20, BOX440X25, BOX440X30 | |
| C42 | BOX320X15, BOX320X20, BOX340X15, BOX340X20, BOX340X25, BOX360X15, BOX360X20, BOX360X25, BOX380X20, BOX380X25, BOX380X30, BOX400X20, BOX400X25, BOX400X30, BOX420X20, BOX420X25, BOX420X30 | |
| B11 | IPE300, IPE330, IPE360, IPE400, IPE450, IPE500 | |
| B21 | IPE300, IPE330, IPE360, IPE400, IPE450, IPE500 | |
| B31 | IPE360, IPE400, IPE450, IPE500, IPE550, IPE600 | |
| B41 | IPE300, IPE330, IPE360, IPE400, IPE450 | |
| 5–7 | C13 | BOX320X20, BOX340X15, BOX340X20, BOX340X25, BOX360X15, BOX360X20, BOX360X25, BOX380X20, BOX380X25, BOX380X30, BOX400X20, BOX400X25, BOX400X30, BOX420X20, BOX420X25, BOX420X30, BOX440X20, BOX440X25, BOX440X30, BOX460X20, BOX460X25, BOX460X30 |
| C23 | BOX340X20, BOX340X25, BOX360X15, BOX360X20, BOX360X25, BOX380X20, BOX380X25, BOX380X30, BOX400X20, BOX400X25, BOX400X30, BOX420X20, BOX420X25, BOX420X30 | |
| C33 | BOX280X20, BOX300X15, BOX300X20, BOX320X15, BOX320X20, BOX340X20, BOX340X25, BOX360X15, BOX360X20, BOX360X25, BOX380X20, BOX380X25, BOX380X30, BOX400X20, BOX400X25, BOX400X30, BOX420X20, BOX420X25, BOX420X30, BOX440X20 | |
| C43 | BOX260X15, BOX260X20, BOX280X15, BOX280X20, BOX300X15, BOX300X20, BOX320X15, BOX320X20, BOX340X20, BOX340X25, BOX360X15, BOX360X20, BOX360X25, BOX380X20, BOX380X25, BOX380X30, BOX400X20, BOX400X25 | |
| B13 | IPE300, IPE330, IPE360, IPE400, IPE450, IPE500 | |
| B23 | IPE300, IPE330, IPE360, IPE400, IPE450, IPE500 | |
| B33 | IPE300, IPE330, IPE360, IPE400, IPE450, IPE500 | |
| B43 | IPE270, IPE300, IPE330, IPE360, IPE400, IPE450 | |
| 8–10 | C14 | BOX180X10, BOX180X12, BOX200X12, BOX200X15, BOX200X20, BOX220X12, BOX220X15, BOX220X20, BOX240X15, BOX240X20, BOX260X15, BOX260X20, BOX280X15, BOX280X20, BOX300X15, BOX300X20, BOX320X15, BOX320X20, BOX340X20, BOX340X25, BOX360X15, BOX360X20, BOX360X25, BOX380X20, BOX380X25, BOX380X30, BOX400X20, BOX400X25 |
| C24 | BOX180X10, BOX180X12, BOX200X12, BOX200X15, BOX200X20, BOX220X12, BOX220X15, BOX220X20, BOX240X15, BOX240X20, BOX260X15, BOX260X20, BOX280X15, BOX280X20, BOX300X15, BOX300X20, BOX320X15, BOX320X20, BOX340X20, BOX340X25, BOX360X15, BOX360X20, BOX360X25 | |
| B14 | IPE270, IPE300, IPE330, IPE360, IPE400, IPE450 | |
| B24 | IPE270, IPE300, IPE330, IPE360, IPE400, IPE450 | |
| B34 | IPE240, IPE270, IPE300, IPE330, IPE360, IPE400 |
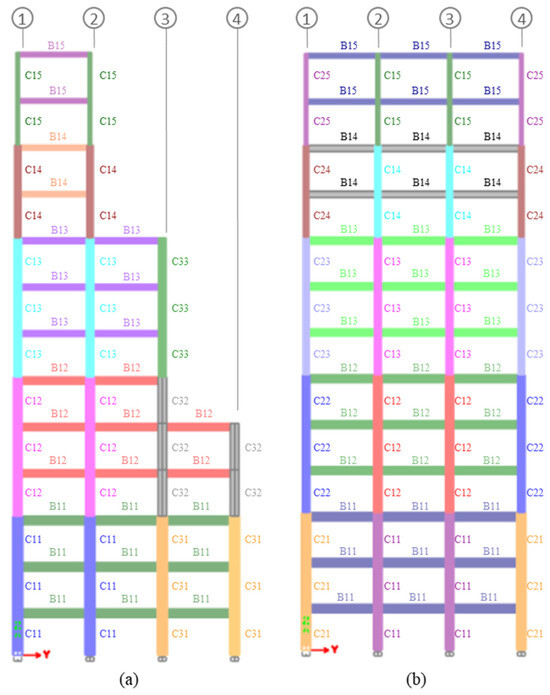
Figure A2.
Section type-casting of Section C of (a) setback irregular 13-story and (b) regular 13-story structures (each color corresponds to a typification group).

Table A5.
Candidate sections for beams and columns in the regular 13-story structure (the first value is the width of the section and the second value is the thickness of the section (in mm)).
Table A5.
Candidate sections for beams and columns in the regular 13-story structure (the first value is the width of the section and the second value is the thickness of the section (in mm)).
| Story | Typical | Section |
|---|---|---|
| 1–3 | C11 | BOX600X25, BOX600X30, BOX620X30, BOX640X30, BOX660X30, BOX660X35, BOX680X30, BOX680X35, BOX700X35, BOX700X40, BOX750X35, BOX750X40, BOX800X35, BOX800X40 |
| C21 | BOX560X25, BOX560X30, BOX580X25, BOX580X30, BOX600X25, BOX600X30, BOX620X30, BOX640X30, BOX660X30, BOX660X35, BOX680X30, BOX680X35, BOX700X35, BOX700X40, BOX750X35 | |
| C31 | BOX520X25, BOX520X30, BOX540X25, BOX540X30, BOX560X25, BOX560X30, BOX580X25, BOX580X30, BOX600X25, BOX600X30, BOX620X30, BOX640X30, BOX660X30, BOX660X35 | |
| B11 | IPE500, IPE550, IPE600 | |
| B21 | IPE500, IPE550, IPE600 | |
| 4–6 | C12 | BOX540X25, BOX540X30, BOX560X25, BOX560X30, BOX580X25, BOX580X30, BOX600X25, BOX600X30, BOX620X30, BOX640X30, BOX660X30, BOX660X35, BOX680X30, BOX680X35 |
| C22 | BOX500X30, BOX520X25, BOX520X30, BOX540X25, BOX540X30, BOX560X25, BOX560X30, BOX580X25, BOX580X30, BOX600X25, BOX600X30, BOX620X30, BOX640X30 | |
| C32 | BOX480X20, BOX480X25, BOX480X30, BOX500X20, BOX500X25, BOX500X30, BOX520X25, BOX520X30, BOX540X25, BOX540X30, BOX560X25, BOX560X30, BOX580X25, BOX580X30, BOX600X25 | |
| B12 | IPE450, IPE500, IPE550 | |
| B22 | IPE450, IPE500, IPE550 | |
| 7–9 | C13 | BOX460X20, BOX460X25, BOX460X30, BOX480X20, BOX480X25, BOX480X30, BOX500X20, BOX500X25, BOX500X30, BOX520X25, BOX520X30, BOX540X25, BOX540X30, BOX560X25, BOX560X30 |
| C23 | BOX440X20, BOX440X25, BOX440X30, BOX460X20, BOX460X25, BOX460X30, BOX480X20, BOX480X25, BOX480X30, BOX500X20, BOX500X25BOX500X30 | |
| C33 | BOX400X20, BOX400X25, BOX400X30, BOX420X20, BOX420X25, BOX420X30, BOX440X20, BOX440X25, BOX440X30, BOX460X20, BOX460X25, BOX460X30, BOX480X20 | |
| B13 | IPE400, IPE450, IPE500 | |
| B23 | IPE360, IPE400, IPE450 | |
| 10–11 | C14 | BOX400X20, BOX400X25, BOX400X30, BOX420X20, BOX420X25, BOX420X30, BOX440X20, BOX440X25, BOX440X30, BOX460X20, BOX460X25, BOX460X30, BOX480X20 |
| C24 | BOX340X20, BOX360X20, BOX380X20, BOX380X25, BOX380X30, BOX400X20, BOX400X25, BOX400X30, BOX420X20, BOX420X25, BOX420X30, BOX440X20, BOX440X25, BOX440X30 | |
| C34 | BOX260X20, BOX280X20, BOX300X20, BOX320X20, BOX340X20, BOX360X20, BOX380X20, BOX380X25, BOX380X30 | |
| B14 | IPE360, IPE400, IPE450 | |
| B24 | IPE330, IPE360, IPE400 | |
| 12–13 | C15 | BOX200X20, BOX220X15, BOX220X20, BOX240X15, BOX240X20, BOX260X20, BOX280X20 |
| C25 | BOX200X15, BOX200X20, BOX220X15, BOX220X20, BOX240X15, | |
| C35 | BOX180X10, BOX180X12, BOX200X15, BOX200X20, BOX220X15, BOX220X20 | |
| B15 | IPE300, IPE330, IPE360 | |
| B25 | IPE270, IPE300, IPE330 |

Table A6.
Candidate sections for beams and columns in the setback irregular 13-story structure (the first value is the width of the section and the second value is the thickness of the section (in mm)).
Table A6.
Candidate sections for beams and columns in the setback irregular 13-story structure (the first value is the width of the section and the second value is the thickness of the section (in mm)).
| Story | Typical | Section |
|---|---|---|
| 1–3 | C11 | BOX700X35, BOX700X40, BOX750X35, BOX750X40, BOX800X35, BOX800X40 |
| C21 | BOX660X35, BOX680X30, BOX680X35, BOX700X35, BOX700X40, BOX750X35, BOX750X40, BOX800X35, BOX800X40 | |
| C31 | BOX540X25, BOX540X30, BOX560X25, BOX560X30, BOX580X25, BOX580X30, BOX600X25, BOX600X30, BOX620X30, BOX640X30, BOX660X30, BOX660X35, BOX680X30, BOX680X35, BOX700X35, BOX700X40, BOX750X35, BOX750X40 | |
| C41 | BOX500X20, BOX500X25, BOX500X30, BOX520X25, BOX520X30, BOX540X25, BOX540X30, BOX560X25, BOX560X30, BOX580X25, BOX580X30, BOX600X25, BOX600X30, BOX620X30, BOX640X30, BOX660X30, BOX660X35, BOX680X30, BOX680X35, BOX700X35, BOX700X40 | |
| B11 | IPE500, IPE550, IPE600 | |
| B21 | IPE500, IPE550, IPE600 | |
| B31 | IPE500, IPE550, IPE600 | |
| B41 | IPE500, IPE550, IPE600 | |
| 4–6 | C12 | BOX600X30, BOX620X30, BOX640X30, BOX660X30, BOX660X35, BOX680X30, BOX680X35, BOX700X35, BOX700X40, BOX750X35, BOX750X40 |
| C22 | BOX560X30, BOX580X25, BOX580X30, BOX600X25, BOX600X30, BOX620X30, BOX640X30, BOX660X30, BOX660X35, BOX680X30, BOX680X35, BOX700X35, BOX700X40 | |
| C32 | BOX420X20, BOX420X25, BOX420X30, BOX440X20, BOX440X25, BOX440X30, BOX460X20, BOX460X25, BOX460X30, BOX480X20, BOX480X25, BOX480X30, BOX500X20, BOX500X25, BOX500X30, BOX520X25, BOX520X30, BOX560X30, BOX580X25, BOX580X30, BOX600X25, BOX600X30, BOX620X30, BOX640X30, BOX660X30, BOX660X35 | |
| C42 | BOX360X20, BOX380X20, BOX380X25, BOX380X30, BOX400X20, BOX400X25, BOX400X30, BOX420X20, BOX420X25, BOX420X30, BOX440X20, BOX440X25, BOX440X30, BOX460X20, BOX460X25, BOX460X30, BOX500X20, BOX500X25, BOX500X30, BOX520X25, BOX520X30, BOX540X25, BOX540X30, BOX560X25, BOX560X30, BOX580X25, BOX580X30, BOX600X25, BOX600X30, BOX620X30, BOX640X30 | |
| B11 | IPE450, IPE500, IPE550 | |
| B21 | IPE450, IPE500, IPE550 | |
| B31 | IPE500, IPE550, IPE600 | |
| B41 | IPE450, IPE500, IPE550 | |
| 7–9 | C13 | BOX500X30, BOX520X25, BOX520X30, BOX560X30, BOX580X25, BOX580X30, BOX600X25, BOX600X30, BOX620X30, BOX640X30, BOX660X30, BOX660X35 |
| C23 | BOX480X25, BOX480X30, BOX500X20, BOX500X25, BOX500X30, BOX520X25, BOX520X30, BOX560X30, BOX580X25, BOX580X30, BOX600X25, BOX600X30 | |
| C33 | BOX440X20, BOX440X25, BOX440X30, BOX460X20, BOX460X25, BOX460X30, BOX480X20, BOX480X25, BOX480X30, BOX500X20, BOX500X25, BOX500X30, BOX520X25, BOX520X30, BOX540X25, BOX540X30 | |
| C43 | BOX360X20, BOX380X20, BOX380X25, BOX380X30, BOX400X20, BOX400X25, BOX400X30, BOX420X20, BOX420X25, BOX420X30, BOX440X20, BOX440X25, BOX440X30, BOX460X20, BOX460X25, BOX460X30 | |
| B13 | IPE400, IPE450, IPE500 | |
| B23 | IPE360, IPE400, IPE450 | |
| B33 | IPE400, IPE450, IPE500 | |
| B43 | IPE400, IPE450, IPE500 | |
| 10–11 | C14 | BOX400X20, BOX400X25, BOX400X30, BOX420X20, BOX420X25, BOX420X30, BOX440X20, BOX440X25, BOX440X30, BOX460X20, BOX460X25, BOX460X30, BOX480X20, BOX480X25, BOX480X30, BOX500X20, BOX500X25, BOX500X30, BOX520X25, BOX520X30 |
| C24 | BOX360X20, BOX380X20, BOX380X25, BOX380X30, BOX400X20, BOX400X25, BOX400X30, BOX420X20, BOX420X25, BOX420X30, BOX440X20, BOX440X25, BOX440X30, BOX460X20, BOX460X25, BOX460X30 | |
| B14 | IPE360, IPE400, IPE450 | |
| B24 | IPE330, IPE360, IPE400 | |
| B34 | IPE360, IPE400, IPE450 | |
| 12–13 | C15 | BOX300X20, BOX320X20, BOX340X20, BOX360X20, BOX380X20, BOX380X25, BOX380X30, BOX400X20, BOX400X25, BOX400X30, BOX420X20, BOX420X25, BOX420X30, BOX440X20, BOX440X25 |
| C25 | BOX240X20, BOX260X15, BOX260X20, BOX280X15, BOX280X20, BOX300X20, BOX320X20, BOX340X20 | |
| B15 | IPE300, IPE330, IPE360 | |
| B25 | IPE270, IPE300, IPE330 | |
| B35 | IPE300, IPE330, IPE360 |
References
- Vasishta, T.; Hashem Mehany, M.; Killingsworth, J. Comparative life cycle assesment (LCA) and life cycle cost analysis (LCCA) of precast and cast–in–place buildings in United States. J. Build. Eng. 2023, 67, 105921. [Google Scholar] [CrossRef]
- Dwaikat, L.N.; Ali, K.N. Green buildings life cycle cost analysis and life cycle budget development: Practical applications. J. Build. Eng. 2018, 18, 303–311. [Google Scholar] [CrossRef]
- Heydari, M.H.; Heravi, G. A BIM-based framework for optimization and assessment of buildings’ cost and carbon emissions. J. Build. Eng. 2023, 79, 107762. [Google Scholar] [CrossRef]
- Biolek, V.; Hanák, T. LCC Estimation Model: A Construction Material Perspective. Buildings 2019, 9, 182. [Google Scholar] [CrossRef]
- Zhang, W.-P.; Liu, Y.; Yu, Q.-Q. Life-cycle seismic fragility evolution of RC structures subjected to chloride-induced corrosion: State-of-the-art review. J. Build. Eng. 2024, 91, 109584. [Google Scholar] [CrossRef]
- Reisinger, J.; Kugler, S.; Kovacic, I.; Knoll, M. Parametric Optimization and Decision Support Model Framework for Life Cycle Cost Analysis and Life Cycle Assessment of Flexible Industrial Building Structures Integrating Production Planning. Buildings 2022, 12, 162. [Google Scholar] [CrossRef]
- Cao, X.-Y.; Feng, D.-C.; Wu, G.; Xu, J.-G. Probabilistic Seismic Performance Assessment of RC Frames Retrofitted with External SC-PBSPC BRBF Sub-structures. J. Earthq. Eng. 2022, 26, 5775–5798. [Google Scholar] [CrossRef]
- Pezeshk, S.; Camp, C.V.; Chen, D. Design of Nonlinear Framed Structures Using Genetic Optimization. J. Struct. Eng. 2000, 126, 382–388. [Google Scholar] [CrossRef]
- Kaveh, A.; Laknejadi, K.; Alinejad, B. Performance-based multi-objective optimization of large steel structures. Acta Mech. 2012, 223, 355–369. [Google Scholar] [CrossRef]
- Goldberg, D.E.; Samtani, M.P. Engineering optimization via genetic algorithms. In Proceedings of the Ninth Conference on Electronic Computation, Birmingham, AL, USA, 2–3 February 1986; ASCE: New York, NY, USA, 1986; pp. 471–482. [Google Scholar]
- Jenkins, W.M. Plane Frame Optimum Design Environment Based on Genetic Algorithm. J. Struct. Eng. 1992, 118, 3103–3112. [Google Scholar] [CrossRef]
- Rum, N.A.M.; Akasah, Z.A. Implementing Life Cycle Costing in Malaysian Construction Industry: A Review. J. Civ. Eng. Archit. 2012, 6, 1202–1209. [Google Scholar] [CrossRef][Green Version]
- Huang, Z.; Lu, Y.; Wong, N.H.; Poh, C.H. The true cost of “greening” a building: Life cycle cost analysis of vertical greenery systems (VGS) in tropical climate. J. Clean. Prod. 2019, 228, 437–454. [Google Scholar] [CrossRef]
- Arja, M.; Sauce, G.; Souyri, B. External uncertainty factors and LCC: A case study. Build. Res. Inf. 2009, 37, 325–334. [Google Scholar] [CrossRef]
- Chung, S.-H.; Hong, T.; Han, S.; Son, J.-H.; Lee, S. Life cycle cost analysis based optimal maintenance and rehabilitation for underground infrastructure management. KSCE J. Civ. Eng. 2006, 10, 243–253. [Google Scholar] [CrossRef]
- Behnam, B. Seismic design of steel moment-resisting structures based on life-cycle cost. Struct. Build. 2019, 29, 23–30. [Google Scholar] [CrossRef]
- Sanati, S.H.; Karamodin, A. Optimum seismic design of frame structures with and without metallic yielding dampers considering life-cycle cost. J. Build. Eng. 2023, 76, 107335. [Google Scholar] [CrossRef]
- Liu, S.C.; Neghabat, F. A Cost Optimization Model for Seismic Design of Structures. Bell Syst. Tech. J. 1972, 51, 2209–2225. [Google Scholar] [CrossRef]
- Wen, Y.K.; Kang, Y.J. Minimum building life-cycle cost design criteria. I: Methodology. J. Struct. Eng. 2001, 127, 330–337. [Google Scholar] [CrossRef]
- Ang, A.H.S.; Lee, J.-C. Cost optimal design of R/C buildings. Reliab. Eng. Syst. Saf. 2001, 73, 233–238. [Google Scholar] [CrossRef]
- Liu, M.; Wen, Y.K.; Burns, S.A. Life cycle cost oriented seismic design optimization of steel moment frame structures with risk-taking preference. Eng. Struct. 2004, 26, 1407–1421. [Google Scholar] [CrossRef]
- Li, G.; Cheng, G. Damage-reduction-based structural optimum design for seismic RC frames. Struct. Multidiscip. Optim. 2003, 25, 294–306. [Google Scholar] [CrossRef]
- Sarma, K.C.; Adeli, H. Life-cycle cost optimization of steel structures. Int. J. Numer. Methods Eng. 2002, 55, 1451–1462. [Google Scholar] [CrossRef]
- Shin, H.; Singh, M.P. Minimum failure cost-based energy dissipation system designs for buildings in three seismic regions—Part II: Application to viscous dampers. Eng. Struct. 2014, 74, 275–282. [Google Scholar] [CrossRef]
- Haupt, R.L.; Haupt, S.E. Practical Genetic Algorithms; Wiley: Hoboken, NJ, USA, 2004; ISBN 9780471671749. [Google Scholar]
- Holland, J.H. Adaptation in Natural and Artificial Systems; MIT press, Ed.; The MIT Press: Cambridge, UK, 1992; ISBN 9780262275552. [Google Scholar]
- Sastry, K.; Goldberg, D.; Kendall, G. Genetic Algorithms. In Search Methodologies; Springer: Boston, MA, USA, 2005; pp. 97–125. [Google Scholar]
- Dorigo, M.; Blum, C. Ant colony optimization theory: A survey. Theor. Comput. Sci. 2005, 344, 243–278. [Google Scholar] [CrossRef]
- Karaboga, D.; Basturk, B. A powerful and efficient algorithm for numerical function optimization: Artificial bee colony (ABC) algorithm. J. Glob. Optim. 2007, 39, 459–471. [Google Scholar] [CrossRef]
- Gharehchopogh, F.S.; Gholizadeh, H. A comprehensive survey: Whale Optimization Algorithm and its applications. Swarm Evol. Comput. 2019, 48, 1–24. [Google Scholar] [CrossRef]
- Rahkar Farshi, T. Battle royale optimization algorithm. Neural Comput. Appl. 2021, 33, 1139–1157. [Google Scholar] [CrossRef]
- Hu, S.; Lei, X. Machine learning and genetic algorithm-based framework for the life-cycle cost-based optimal design of self-centering building structures. J. Build. Eng. 2023, 78, 107671. [Google Scholar] [CrossRef]
- Bakhshinezhad, S.; Mohebbi, M. Multi-objective optimal design of semi-active fluid viscous dampers for nonlinear structures using NSGA-II. Structures 2020, 24, 678–689. [Google Scholar] [CrossRef]
- Shin, H.; Singh, M.P. Minimum life-cycle cost-based optimal design of yielding metallic devices for seismic loads. Eng. Struct. 2017, 144, 174–184. [Google Scholar] [CrossRef]
- Park, H.S.; Lee, D.C.; Oh, B.K.; Choi, S.W.; Kim, Y. Performance-based multiobjective optimal seismic retrofit method for a steel moment-resisting frame considering the life-cycle cost. Math. Probl. Eng. 2014, 2014, 305737. [Google Scholar] [CrossRef]
- Basim, M.; Estekanchi, H.E.; Vafai, A. A methodology for value based seismic design of structures by the endurance time method. Sci. Iran. 2016, 23, 2514–2527. [Google Scholar] [CrossRef][Green Version]
- Liu, M.; Burns, S.A.; Wen, Y.K. Multiobjective optimization for performance-based seismic design of steel moment frame structures. Earthq. Eng. Struct. Dyn. 2005, 34, 289–306. [Google Scholar] [CrossRef]
- Gencturk, B. Life-cycle cost assessment of RC and ECC frames using structural optimization. Earthq. Eng. Struct. Dyn. 2013, 42, 61–79. [Google Scholar] [CrossRef]
- Fragiadakis, M.; Lagaros, N.D.; Papadrakakis, M. Performance-based multiobjective optimum design of steel structures considering life-cycle cost. Struct. Multidiscip. Optim. 2006, 32, 1–11. [Google Scholar] [CrossRef]
- Lagaros, N.D.; Papadrakakis, M.; Plevris, V. Multiobjective Optimization of Space Structures under Static and Seismic Loading Conditions. In Evolutionary Multiobjective Optimization; Abraham, A., Jain, L., Goldberg, R., Eds.; Springer: London, UK, 2005; pp. 273–300. [Google Scholar]
- Jebelli, S.T.; Behnam, B.; Tehrani, P. Seismic design of setback irregular steel structures based on life cycle cost. Sci. Rep. 2022, 12, 16784. [Google Scholar] [CrossRef]
- Satheesh, A.J.; Jayalekshmi, B.R.; Venkataramana, K. Effect of in-plan eccentricity on vertically stiffness irregular buildings under earthquake loading. Soil Dyn. Earthq. Eng. 2020, 137, 106251. [Google Scholar] [CrossRef]
- Behnam, B.; Shojaei, F. A Risk Index for Mitigating Earthquake Damage in Urban Structures; Elsevier: Amsterdam, The Netherlands, 2018; ISBN 9780128120576. [Google Scholar]
- Bohlouli, Z.; Poursha, M. Seismic evaluation of geometrically irregular steel moment resisting frames with setbacks considering their dynamic characteristics. Bull. Earthq. Eng. 2016, 14, 2757–2777. [Google Scholar] [CrossRef]
- Jiang, H.; Huang, Y.; He, L.; Huang, T.; Zhang, S. Seismic performance of RC frame-shear wall structures with vertical setback. Structures 2021, 33, 4203–4217. [Google Scholar] [CrossRef]
- Shojaei, F.; Behnam, B. Seismic vulnerability assessment of low-rise irregular reinforced concrete structures using cumulative damage index. Adv. Concr. Constr. 2017, 5, 407–422. [Google Scholar] [CrossRef]
- NIBS(National Institute of Building Sciences). Fema 450: Recommended Provisions for Seismic Regulations for New Buildings and Other Structures, Part 1; NIBS: Washington, DC, USA, 2003. [Google Scholar]
- ATC. Earthquake Damage Evaluation Data for California; Applied Technology Council: Redwood City, CA, USA, 1985. [Google Scholar]
- Rahnama, M.; Seneviratna, P.; Morrow, G.; Rodriguez, A. Seismic Performance Based Loss Assessment. In Proceedings of the 13th World Conference on Earthquake Engineering, Vancouver, BC, Canada, 1–6 August 2004. [Google Scholar]
- Cornell, C.A.; Krawinkler, H. Progress and Challenges in Seismic Performance Assessment. PEER Cent. News 2000, 3, 1–3. [Google Scholar]
- ASCE41-17; Seismic Evaluation and Retrofit of Existing Buildings. American Society of Civil Engineers (ASCE): Reston, VA, USA, 2017.
- Chintanapakdee, C.; Chopra, A.K. Evaluation of modal pushover analysis using generic frames. Earthq. Eng. Struct. Dyn. 2003, 32, 417–442. [Google Scholar] [CrossRef]
- Li, G.; Jiang, Y.; Yang, D. Modified-modal-pushover-based seismic optimum design for steel structures considering life-cycle cost. Struct. Multidiscip. Optim. 2012, 45, 861–874. [Google Scholar] [CrossRef]
- Cao, X.-Y.; Feng, D.-C.; Wu, G. Pushover-based probabilistic seismic capacity assessment of RCFs retrofitted with PBSPC BRBF sub-structures. Eng. Struct. 2021, 234, 111919. [Google Scholar] [CrossRef]
- Tsang, H.H.; Yaghmaei-Sabegh, S.; Anbazhagan, P.; Sheikh, M.N. A checking method for probabilistic seismic-hazard assessment: Case studies on three cities. Nat. Hazards 2011, 58, 67–84. [Google Scholar] [CrossRef][Green Version]
- Inel, M.; Ozmen, H.B. Effects of plastic hinge properties in nonlinear analysis of reinforced concrete buildings. Eng. Struct. 2006, 28, 1494–1502. [Google Scholar] [CrossRef]
- Deb, K.; Pratap, A.; Agarwal, S.; Meyarivan, T. A fast and elitist multiobjective genetic algorithm: NSGA-II. IEEE Trans. Evol. Comput. 2002, 6, 182–197. [Google Scholar] [CrossRef]
- Homaifar, A.; Qi, C.X.; Lai, S.H. Constrained Optimization Via Genetic Algorithms. Simulation 1994, 62, 242–253. [Google Scholar] [CrossRef]
- Wen, Y.K.; Kang, Y.J. Minimum Building Life-Cycle Cost Design Criteria. II: Applications. J. Struct. Eng. 2001, 127, 338–346. [Google Scholar] [CrossRef]
- Abdoli, G. Estimation of social discount rate for Iran. Econ. Res. Rev. 2009, 10, 135–156. [Google Scholar]
- Abu Hammad, A.A.; Alhaj Ali, S.M.; Sweis, G.J.; Bashir, A. Prediction model for construction cost and duration in Jordan. Jordan J. Civ. Eng. 2008, 2, 250–266. [Google Scholar]
- Ujong, J.A.; Mbadike, E.M.; Alaneme, G.U. Prediction of cost and duration of building construction using artificial neural network. Asian J. Civ. Eng. 2022, 23, 1117–1139. [Google Scholar] [CrossRef]
- Lin, M.C.; Tserng, H.P.; Ho, S.P.; Young, D.L. Developing a construction-duration model based on a historical dataset for building project. J. Civ. Eng. Manag. 2011, 17, 529–539. [Google Scholar] [CrossRef]
- Dursun, O.; Stoy, C. Determinants of construction duration for building projects in Germany. Eng. Constr. Archit. Manag. 2012, 19, 444–468. [Google Scholar] [CrossRef]
- FEMA (USA Federal Emergency Management Agency). A Benefit-Cost Model for the Seismic Rehabilitation of Buildings (FEMA 227); FEMA, Building Seismic Safety Council: Washington, D.C., USA, 1992. [Google Scholar]
- Shojaei, F.; Tabatabai Zavareh, F.; Begdeli, F.; Mirsaeidi, S.; Khazaei, Z.; Azizi, F. An Overview of the Health Service Provision of the Social Security Organization; Social Security Organization Research Institute: Tajrish, Iran, 2021. [Google Scholar]
- Mishan, E.J. Evaluation of Life and Limb: A Theoretical Approach. J. Polit. Econ. 1971, 79, 687–705. [Google Scholar] [CrossRef]
- Rice, D.P.; Cooper, B.S. The economic value of human life. Am. J. Public Health Nations Health 1967, 57, 1954–1966. [Google Scholar] [CrossRef]
- Kucharčíková, A. Human Capital-Definitions and Approaches. Hum. Resour. Manag. Ergon. 2011, V, 60–70. [Google Scholar]
- Baker, R.; Ruting, B. Environmental Policy Analysis: A Guide to Non-Market Valuation; Media and Publications: Melbourne, VIC, Australia, 2014; ISBN 978-1-74037-468-2. [Google Scholar]
- Max, W.; Rice, D.P.; Sung, H.-Y.; Michel, M. Valuing Human Life: Estimating the Present Value of Lifetime Earnings, 2000; UCSF Center for Tobacco Control Research and Education: San Francisco, CA, USA, 2004. [Google Scholar]
- Viscusi, W.K. Corporate Risk Analysis: A Reckless Act? Stanford Law Rev. 2000, 52, 547. [Google Scholar] [CrossRef]
- Miller, T.R. Variations Between Countries in Values of Statistical Life. J. Transp. Econ. Policy 2000, 34, 169–188. [Google Scholar]
- Rezaei, M.; Ranjbardar, H.; Talkhabi, H. Evaluation of sustainability indicators of Tehran metropolis based on sustainable development. In Proceedings of the First National Conference on Architecture, Civil Engineering and Urban Environment, Hamedan, Iran, 22 May 2014. [Google Scholar]
- Soni, D.P.; Mistry, B.B. Qualitative review of seismic response of vertically irregular building frames. ISET J. Earthq. Technol. 2006, 43, 121–132. [Google Scholar]
Disclaimer/Publisher’s Note: The statements, opinions and data contained in all publications are solely those of the individual author(s) and contributor(s) and not of MDPI and/or the editor(s). MDPI and/or the editor(s) disclaim responsibility for any injury to people or property resulting from any ideas, methods, instructions or products referred to in the content. |
© 2024 by the authors. Licensee MDPI, Basel, Switzerland. This article is an open access article distributed under the terms and conditions of the Creative Commons Attribution (CC BY) license (https://creativecommons.org/licenses/by/4.0/).