Article

Building Safety Evaluation and Improvement for Northern Vietnam Mountainous Environments Empirical Study Combining Japanese Experience with Local Conditions

1
Department of Space Design, Nagoya University of Art, Nagoya 481-8503, Japan
2
Department of Creative Media, City University of Hong Kong, Hong Kong 999077, China
*
Author to whom correspondence should be addressed.
Buildings 2024, 14(9), 2626; https://doi.org/10.3390/buildings14092626
Submission received: 14 July 2024 / Revised: 16 August 2024 / Accepted: 19 August 2024 / Published: 24 August 2024

Abstract

:
This study addressed the insufficient structural strength and inadequate disaster resistance in building designs in the mountainous regions of Northern Vietnam. By integrating Japanese construction experience with local conditions, we proposed optimized building structures and simplified safety evaluation methods. Through an analysis of climate, terrain, geological hazards, soil conditions, and construction material costs, building design and foundation construction were optimized, and these optimizations were validated through wind tunnel experiments and finite element analysis. The results indicated that the optimized structures exhibited superior wind load stability, with external wind pressure coefficients ranging from −1.5 to −0.7, compared with the traditional structure’s range of −1 to −3.5. The redesigned foundation improved landslide resistance, reducing excavation and foundation construction costs relative to Japanese methods. The foundation’s safety factor reached 4.42–5.13, surpassing the standard of 2.5, and the retaining wall’s sliding resistance safety factor reached 1.87, exceeding the requirement of 1.5. These enhancements dramatically boosted building safety under extreme weather conditions. This study provides practical solutions for building design in Vietnam’s mountainous regions and serves as a valuable reference for similar research in other developing countries, underscoring significant practical and social implications.

1. Introduction

1.1. Building Design Challenges in Southeast Asian Rural Areas

In Southeast Asia, excluding Singapore, most countries and regions remain underdeveloped. Building designs in these developing countries and regions often rely on traditional experience or adopt foreign construction standards without adequately considering local disasters, terrain, and structural strength factors [1,2,3,4]. This approach has led to numerous issues regarding the strength and comfort of buildings. In addition to environmental and climatic factors and the lack of detailed building construction standards set by the governments of these Southeast Asian developing countries [1], the poor quality of local infrastructure, limited use of new technologies, and low levels of education among the population also result in the rough construction of building foundations, low construction efficiency, and, consequently, high construction costs and poor disaster resistance in local buildings [2,3,4,5,6,7]. In the context building design challenges in Southeast Asian rural areas, it is crucial to consider local conditions when adopting foreign construction standards. The study “Key Assessment Criteria for Organizational BIM Capabilities: A Cross-Regional Study” by Rajabi illustrates how BIM implementation strategies must be tailored to the specific cultural and infrastructural context of each region. For instance, while Malaysia emphasizes the availability of infrastructure and technology adoption, Iran places greater importance on staff experience and formal agreements. This finding underscores the necessity of adapting international best practices to align with local needs, ensuring that BIM capabilities are both effective and sustainable in different regional contexts [7]. Particularly in regions of developing countries that are vulnerable to natural disasters, it is necessary not only to optimize building structures to improve disaster resistance and functionality but also to develop adaptive building construction systems based on the local social environment [2,3].
The countries surrounding the South China Sea region are particularly vulnerable to the severe destruction caused by typhoons. The strength and position of the western Pacific subtropical high significantly influence the formation and intensity of typhoons in this region and the area east of the Philippines. During the cold phase of the Pacific decadal oscillation (PDO), sea surface temperatures in these regions are lower, and the subtropical high is weaker, contributing to the intensification of typhoons. Consequently, a higher proportion of strong typhoons affect the South China Sea and the Philippines during these periods [8]. These climate changes have resulted in a gradual increase in the frequency of typhoons passing through Vietnam in recent years.
Currently, there is a gap in the research on optimizing building structures under the existing conditions and environments of developing countries, as well as for developing straightforward safety evaluation methods suitable for the local environment and educational levels.

1.2. Research Questions

To address the aforementioned research gaps, this research proposed the following questions:
How can disaster-resistant buildings be designed considering the local climate and existing conditions?
While referencing construction methods from developed countries in developing nations, how can the issue of performance overspecification and incompatibility caused by directly applying these methods to local foundations be minimized, ensuring building safety while lowering costs associated with these unnecessary features?
How can building performance evaluation methods be simplified so that they can be used effectively by individuals with a high school education or less for preliminary safety assessments of planned buildings?

1.3. Research Methods

To address the aforementioned questions, this study selected the building land in the mountainous region of Tan Lap District, Luc Yen City, Yen Bai Province, Northern Vietnam, as the research area. Local building facility design projects were utilized to analyze these issues and develop a design process, as shown in Figure 1.
In the research on building structure and foundation construction methods, the study analyzed the local climate, terrain, geological disasters, soil conditions, building material costs, and existing building problems. It also referenced the experiences of Japan, which faces similar disaster threats [9]. Based on this analysis, the study refined construction methods and compared various indicators with the original methods to propose customized optimized construction solutions [5].
For the preliminary establishment of a building safety evaluation system, the study investigates and evaluates the educational level of local residents [10], their comprehension of construction drawings, and other aspects of knowledge understanding. Combining these factors with local geological conditions, the study designed a building safety evaluation system tailored for mountainous terrain that is accessible for local residents.
These solutions encompassed optimizing structural design to improve wind load resistance, redesigning economical and practical foundation construction methods to bolster resistance against mudslides, and utilizing local materials and traditional building techniques to attenuate construction costs and simplify the construction process for local residents. Additionally, based on the survey of local residents’ educational levels and their proficiency in mathematics, a relatively easy-to-understand preliminary building safety evaluation formula was developed.
The methods for generating experimental data included the following:
Soil sampling and testing: Soil samples were randomly extracted from the mountainous building land. The liquid limit and plastic limit of the sample soil were measured using the thread-rolling method and a liquid limit device [1,2,3,4,5,6,7,11,12]. Subsequently, the plasticity index was calculated to delve into the properties of the local soil.
Deriving soil parameters: Using data from the aforementioned experiments, the soil’s friction angle and cohesion were determined. Terzaghi’s bearing capacity formula was employed to analyze the maximum bearing capacity of the foundation, and the constant values for the parameters needed in the simplified formula were deduced [1,2,3,4,5,6].
Wind tunnel experiments: Wind tunnel experiments were conducted to assess and compare the wind load resistance of optimized building models and traditional building models [4,5,6,7,11,12,13].
Coulomb’s earth pressure theory: Coulomb’s earth pressure theory formula was adopted to evaluate the safety of building components on the retaining wall and to assess its resistance against sliding and overturning [14].
Finite element analysis with SAP2000: The SAP2000 finite element analysis software was introduced to simulate and analyze the deformation of the building structure under local extreme weather and extreme load conditions, thereby verifying its structural safety.
To scientifically validate that the optimized construction method is more suitable for local conditions than directly adopting Japanese construction methods, we employed the particle swarm optimization (PSO) algorithm [15]. This algorithm allowed us to compare the Japanese construction methods with the newly optimized approach.

1.4. Research Results

The study demonstrated the following:
The refined building structural design exhibited enhanced stability in wind load tests, showing substantial reductions in the variation of external and internal wind pressure coefficients [4,5,6,7,10,11,12,13,16,17].
Redesigning the foundation of the mountainous building land effectively mitigated damage caused by mudslides [18]. Comparing the new construction methods with the existing referenced methods revealed reduced performance overspecification, improved economic efficiency, and lowered construction costs while ensuring building safety.
By assessing the local soil quality through soil experiments and referencing Terzaghi’s bearing capacity formula and Coulomb’s earth pressure theory formula [7], certain constant parameters in these formulas can be derived. This simplification ensures that the formulas are comprehensible to residents with a high school education level [2,3,4,5,6,7,11,12,13,19].
Considering different construction methods as particles in the model, we used their anti-sliding coefficients, anti-overturning coefficients, ratio of unit building area to unit foundation volume, and ratio of construction area to excavation volume as the coordinates in the PSO algorithm program that was defined. After six iterations, the results demonstrated that the optimized method exhibited the most stable trend in fitness variations. Among all particles, it required the fewest iterations to reach the near-optimal solution region. Therefore, this further validated the rationality of the optimized method.

1.5. Research Significance

This study aims to address diverse challenges in building design and construction in developing countries, particularly in disaster-prone regions, through the optimization of structural design and streamlining of building performance evaluation methods. This effort holds substantial practical and social implications, including the following:
Improving building safety: Through the analysis of the specific conditions in Tan Lap District, Luc Yen City, Yen Bai Province, Northern Vietnam, the study proposed a range of optimized building structural design methods, including improving the wind load resistance of buildings and redesigning foundation construction techniques. Such optimizations can significantly enhance building stability and safety under extreme weather conditions, thereby mitigating damage from natural disasters and safeguarding the lives and property of local residents.

2. Materials and Methods

2.1. Survey of Yen Bai Province

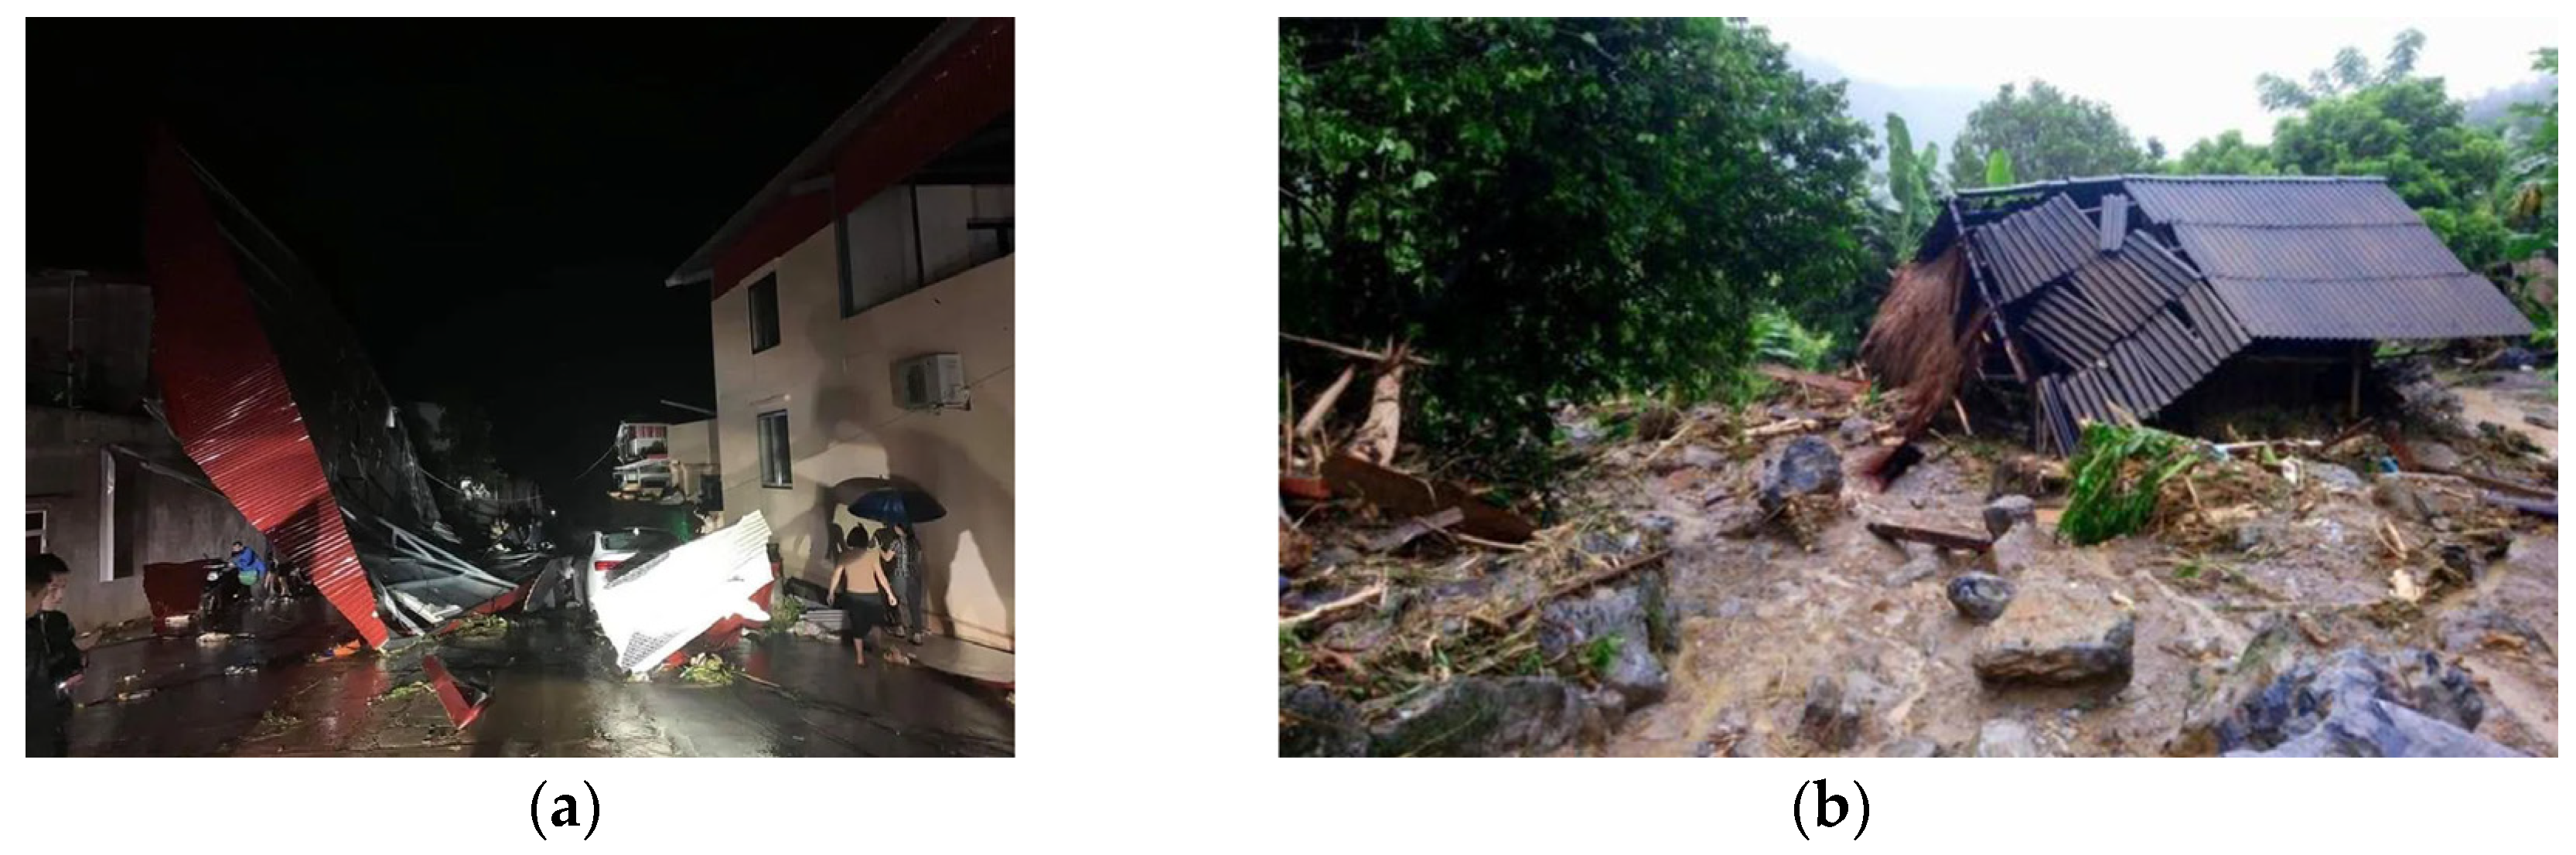
2.1.1. Local Typical Wind and Landslide Damages to Buildings

The study site is situated in a village in Tan Lap District, Luc Yen City, Yen Bai Province, surrounded by mountains and lakes, and characterized by a tropical monsoon climate. The annual average temperature in this area ranges from 22 °C to 24 °C. Summers, particularly from June to September, experience elevated temperatures, heavy rainfall, and short-term intense rainfall. Given Yen Bai Province’s mountainous topography, heavy rainfall can destabilize the soil, increasing the risk of landslides [16].
According to the wind speed and rainfall data from 2022 to 2023 for Yen Bai Province and the adjacent Lao Cai Province [3], along with annual data on wind direction and speed [20], it was observed that the prevailing annual wind direction in this area was southeast. Wind speeds in both provinces exhibited remarkable seasonal fluctuations over the two years. The annual average wind speed was approximately 5 km/h, with variations ranging from 3 to 7 km/h. Wind speeds were higher in summer and winter, and relatively lower in spring and autumn.
The rainfall in both provinces showed notable variation over the span of two years, characterized by distinct seasonal patterns. The annual average rainfall ranged from 5 to 15 mm, with a maximum rainfall of up to 50 mm. The rainy season predominantly occurred during summer (June to September), marked by substantial increases in precipitation [21]. Landslide disasters were particularly concentrated from June to September, coinciding with rise in the frequency of intense rainfall in recent years.
To provide an overview of wind and landslide disasters, this study examined their impacts on both non-engineered houses and typical wind damage to engineered buildings. Strong winds can inflict severe damage on buildings primarily through high wind pressure and the impact of flying debris. Inadequate wind resistance further heightens the likelihood of damage. Typical manifestations of wind damage include roofs being blown off, windows breaking, and exterior walls peeling off.
Regarding landslides, Yen Bai Province features numerous mountainous and hilly regions predominantly composed of clayey soils. The inadequate drainage of these soils renders them susceptible to loosening during heavy rainfall, thereby increasing the likelihood of landslides. Typical landslide damages include houses being buried, building foundations being destroyed, and roads being cut off [16].
The following content illustrates instances of wind damage, large-scale landslides, and floods triggered by heavy rains in Yen Bai Province in August 2023 [22]. Figure 2a depicts the damage to residential buildings in the town, with roofing materials blown off and roof structures damaged.
Figure 2b displays the damage to residential buildings located on a mountainside slope. As illustrated, local residents construct houses on slopes by leveling the ground for the foundation, resulting in varying heights between the front and back of the ground. The absence of foundation enhancements or retaining walls leads to complete destruction of buildings during landslides. This lack of measures heightens the vulnerability of buildings on slopes.
As demonstrated by these examples, enhancing the strength of existing buildings solely from the perspective of wind engineering is insufficient [4]. Therefore, designing a systematic building safety evaluation system based on local environmental characteristics is imperative.

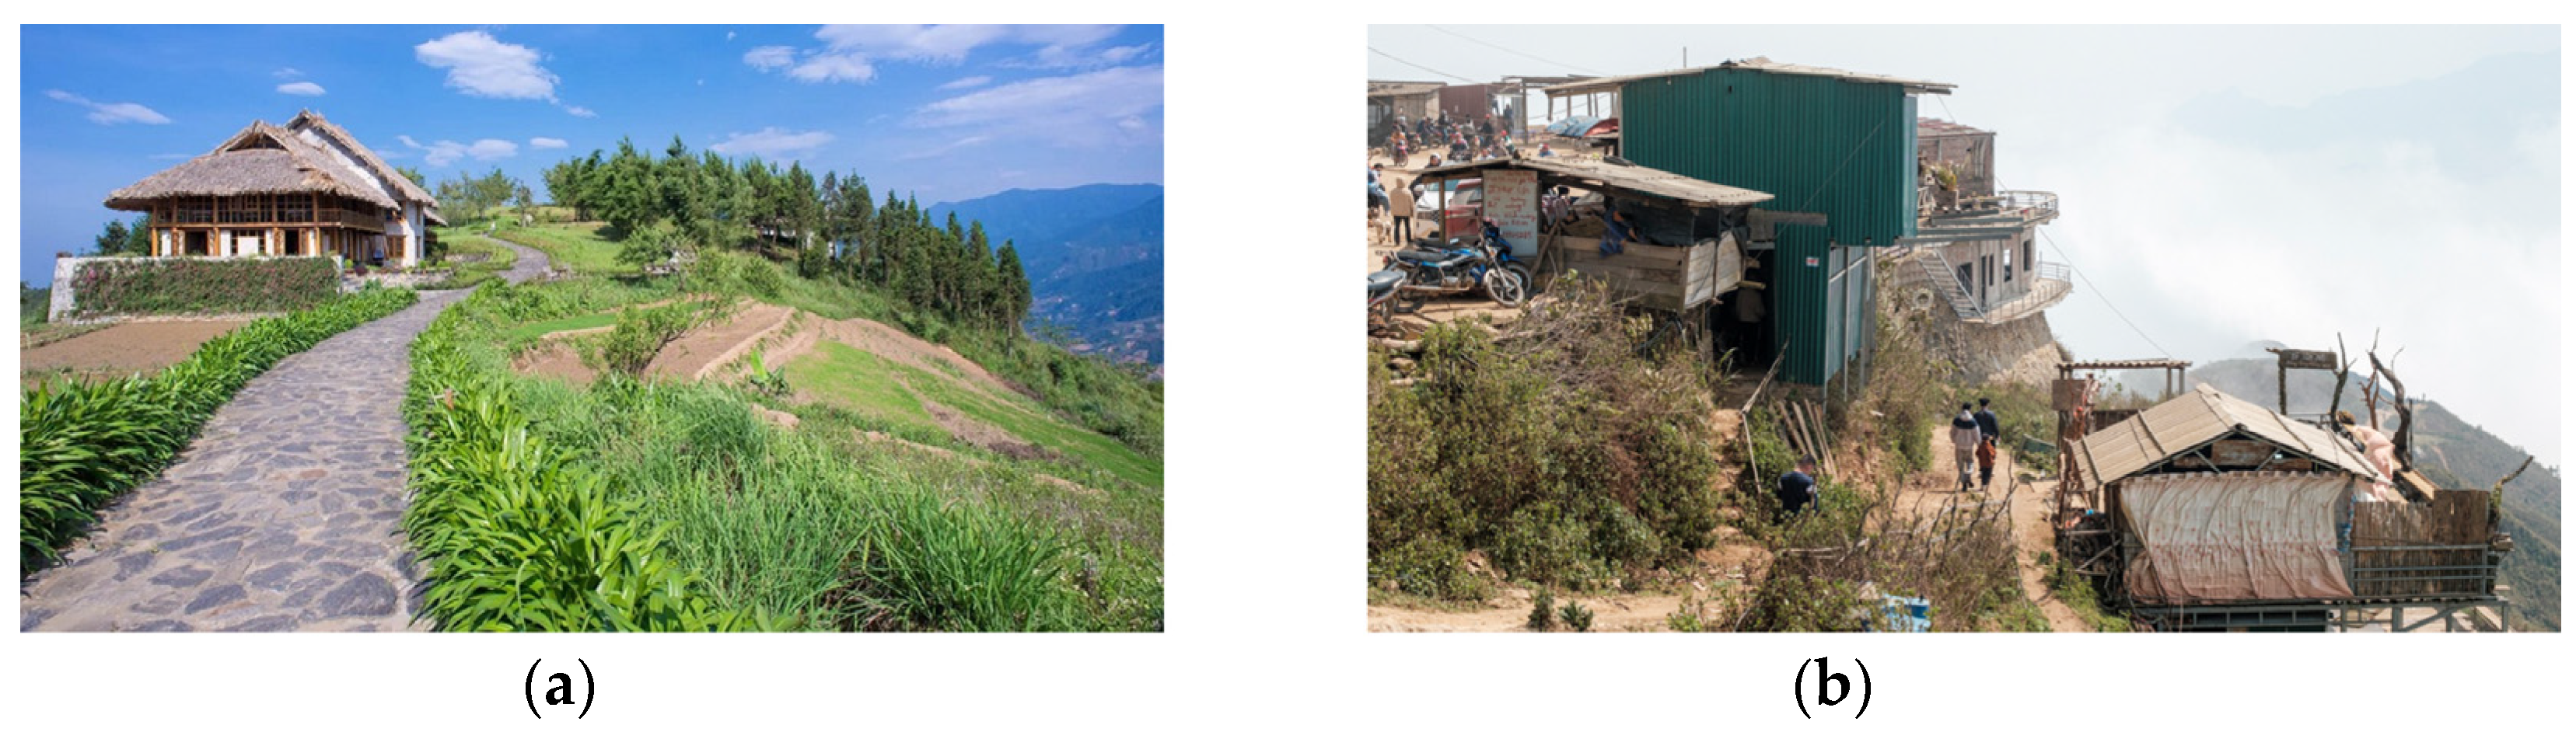
2.1.2. Characteristics of Local Buildings

Yen Bai Province is situated in the mountainous regions of Northern Vietnam, where residential buildings exhibit the following distinct local characteristics, as shown in Figure 3:
Stilt houses: Due to the mountainous terrain and heavy rainfall in Yen Bai Province [16], many residents opt to build stilt houses. This type of construction can prevent flooding and moisture intrusion, while also mitigating animal infestation.
Use of wood: Local buildings primarily utilize wood for supporting columns, walls, and roofs. Wood is readily available and offers excellent insulation and ventilation properties [23].
Roofing: Traditional houses commonly employ thatch or bamboo for roofing, which provides good insulation and waterproofing. This reflects the utilization of local natural resources. The roofs are steeply pitched to facilitate faster drainage [3,4,5,6,7,10,11,12,13,16,21,23].
Open space design: These houses typically embrace open layouts with expansive interiors and minimal partitions, fostering family interaction and enhancing ventilation [4,5,6,7,10,11,12,13,16,21,23].
On the other hand, as displayed in Figure 3, Figure 3a illustrates houses in Yen Bai Province’s tourist areas that incorporate traditional elements. Aside from tourist spots, local residents frequently construct non-engineered (or partially non-engineered) houses, as shown in Figure 3b. These self-built houses are structurally vulnerable and have poor disaster resistance. In such contexts, the escalating impacts of climate change, with their unpredictable consequences, are likely to heighten the vulnerability of these houses, posing potential threats to residents’ safety [2,3,4,5,6,7,10,11,12,13,16,21,23,24].

2.2. Analysis of the Village in Tan Lap District

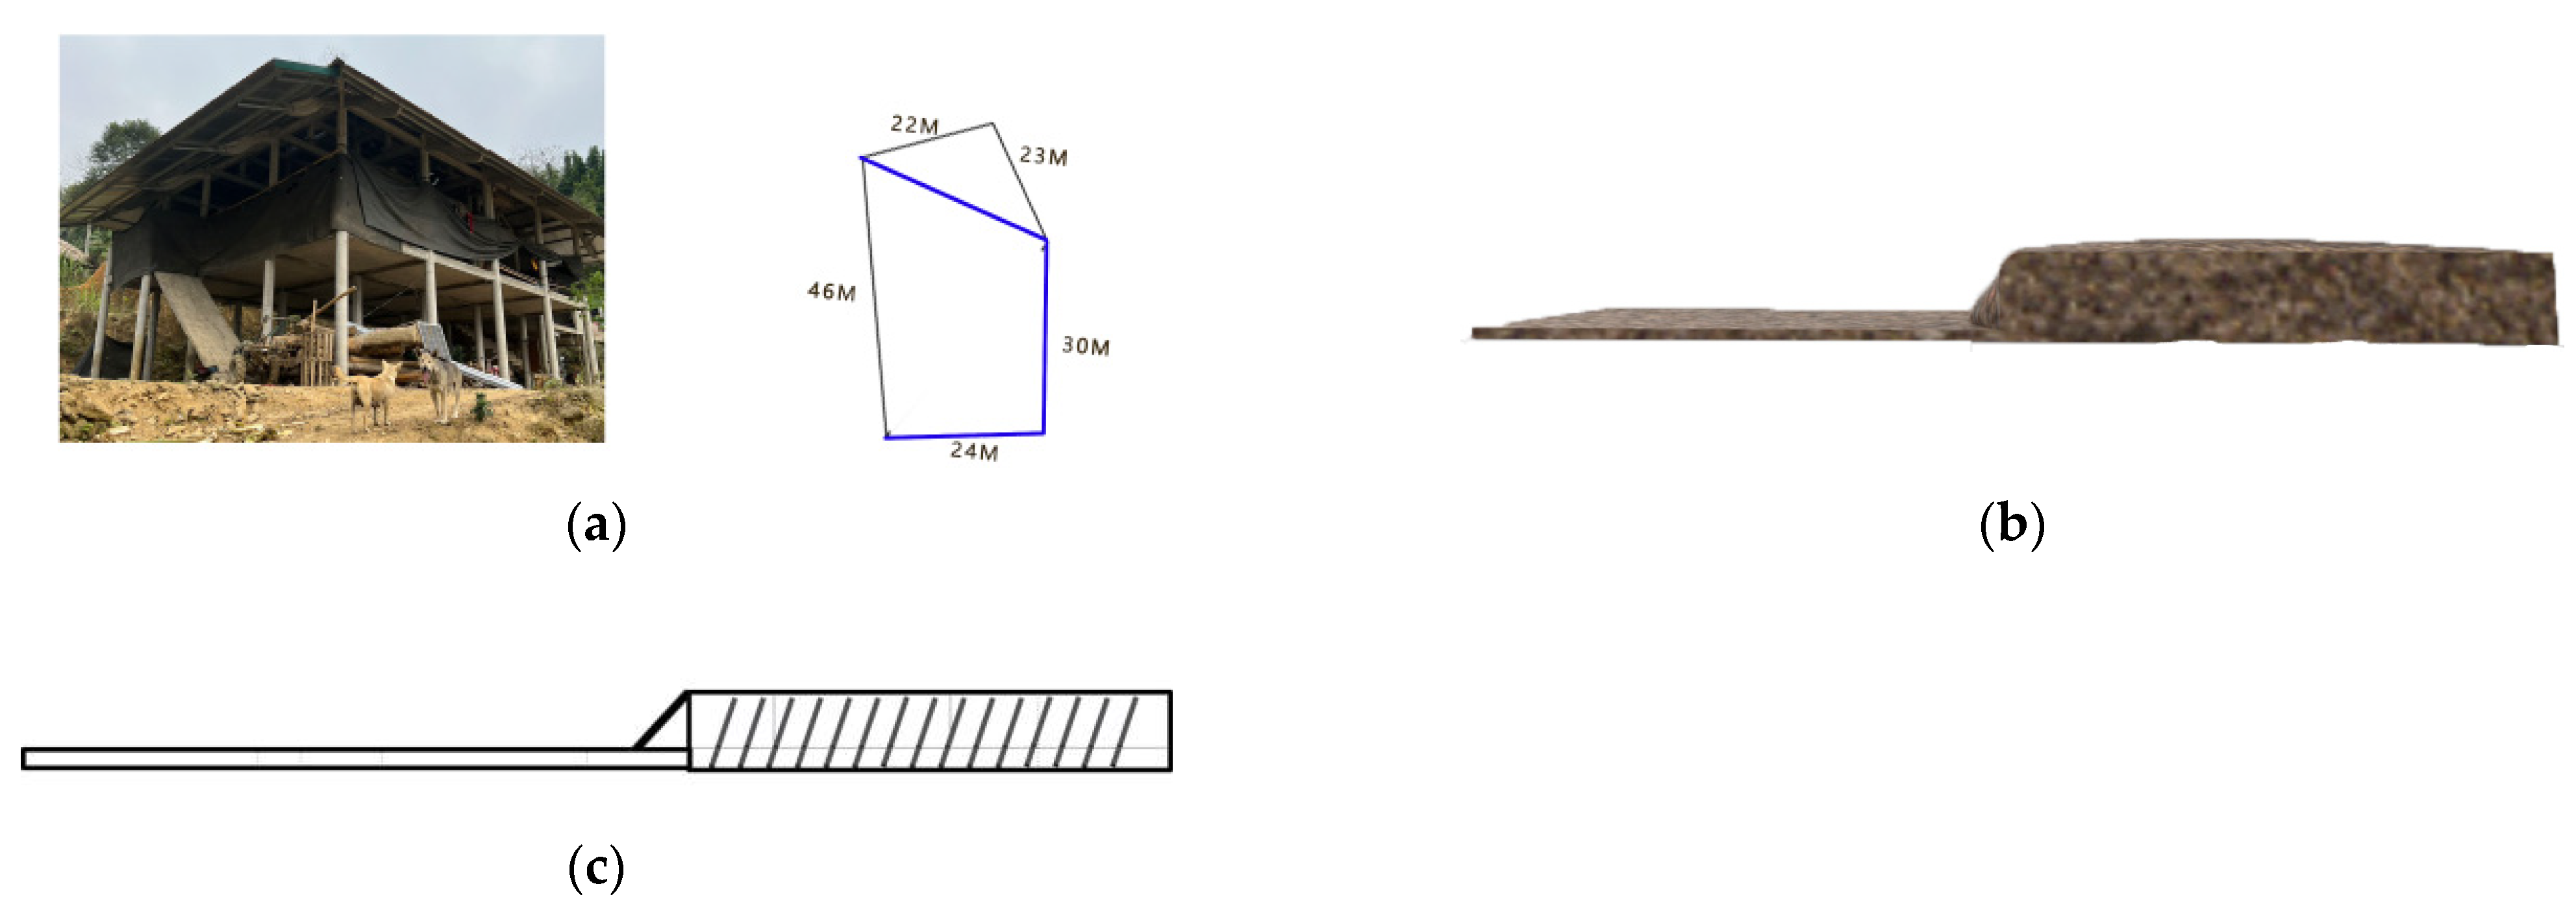
2.2.1. Village Topography and Current Building Status

According to Figure 4, villagers’ homes are generally distributed based on their industries. The village residences are primarily situated on three types of terrain. Houses in mountainous areas are mostly built on slopes, rendering them susceptible to landslides during heavy rains. Houses in flat areas are surrounded by hills on both sides, creating a valley-like configuration that exacerbates the tunnel effect.
Additionally, Northern Vietnam features a tropical monsoon climate characterized by frequent occurrences of strong monsoon winds [21]. These winds intensify significantly as they funnel through valleys. During Vietnam’s monsoon season, the interaction of strong winds with valley topography and the tunnel effect significantly augments wind speeds [25].
Alongside the topographical survey, an assessment of the current building status in the village was conducted. The village buildings were categorized into waterside buildings, mountainous buildings, and flatland buildings. The survey revealed that the proportions of non-engineered buildings in each settlement area are 66.6%, 70%, and 57.9%, respectively. This indicates that more than half of the buildings in the village lack adequate structural strength and exhibit poor disaster resistance.

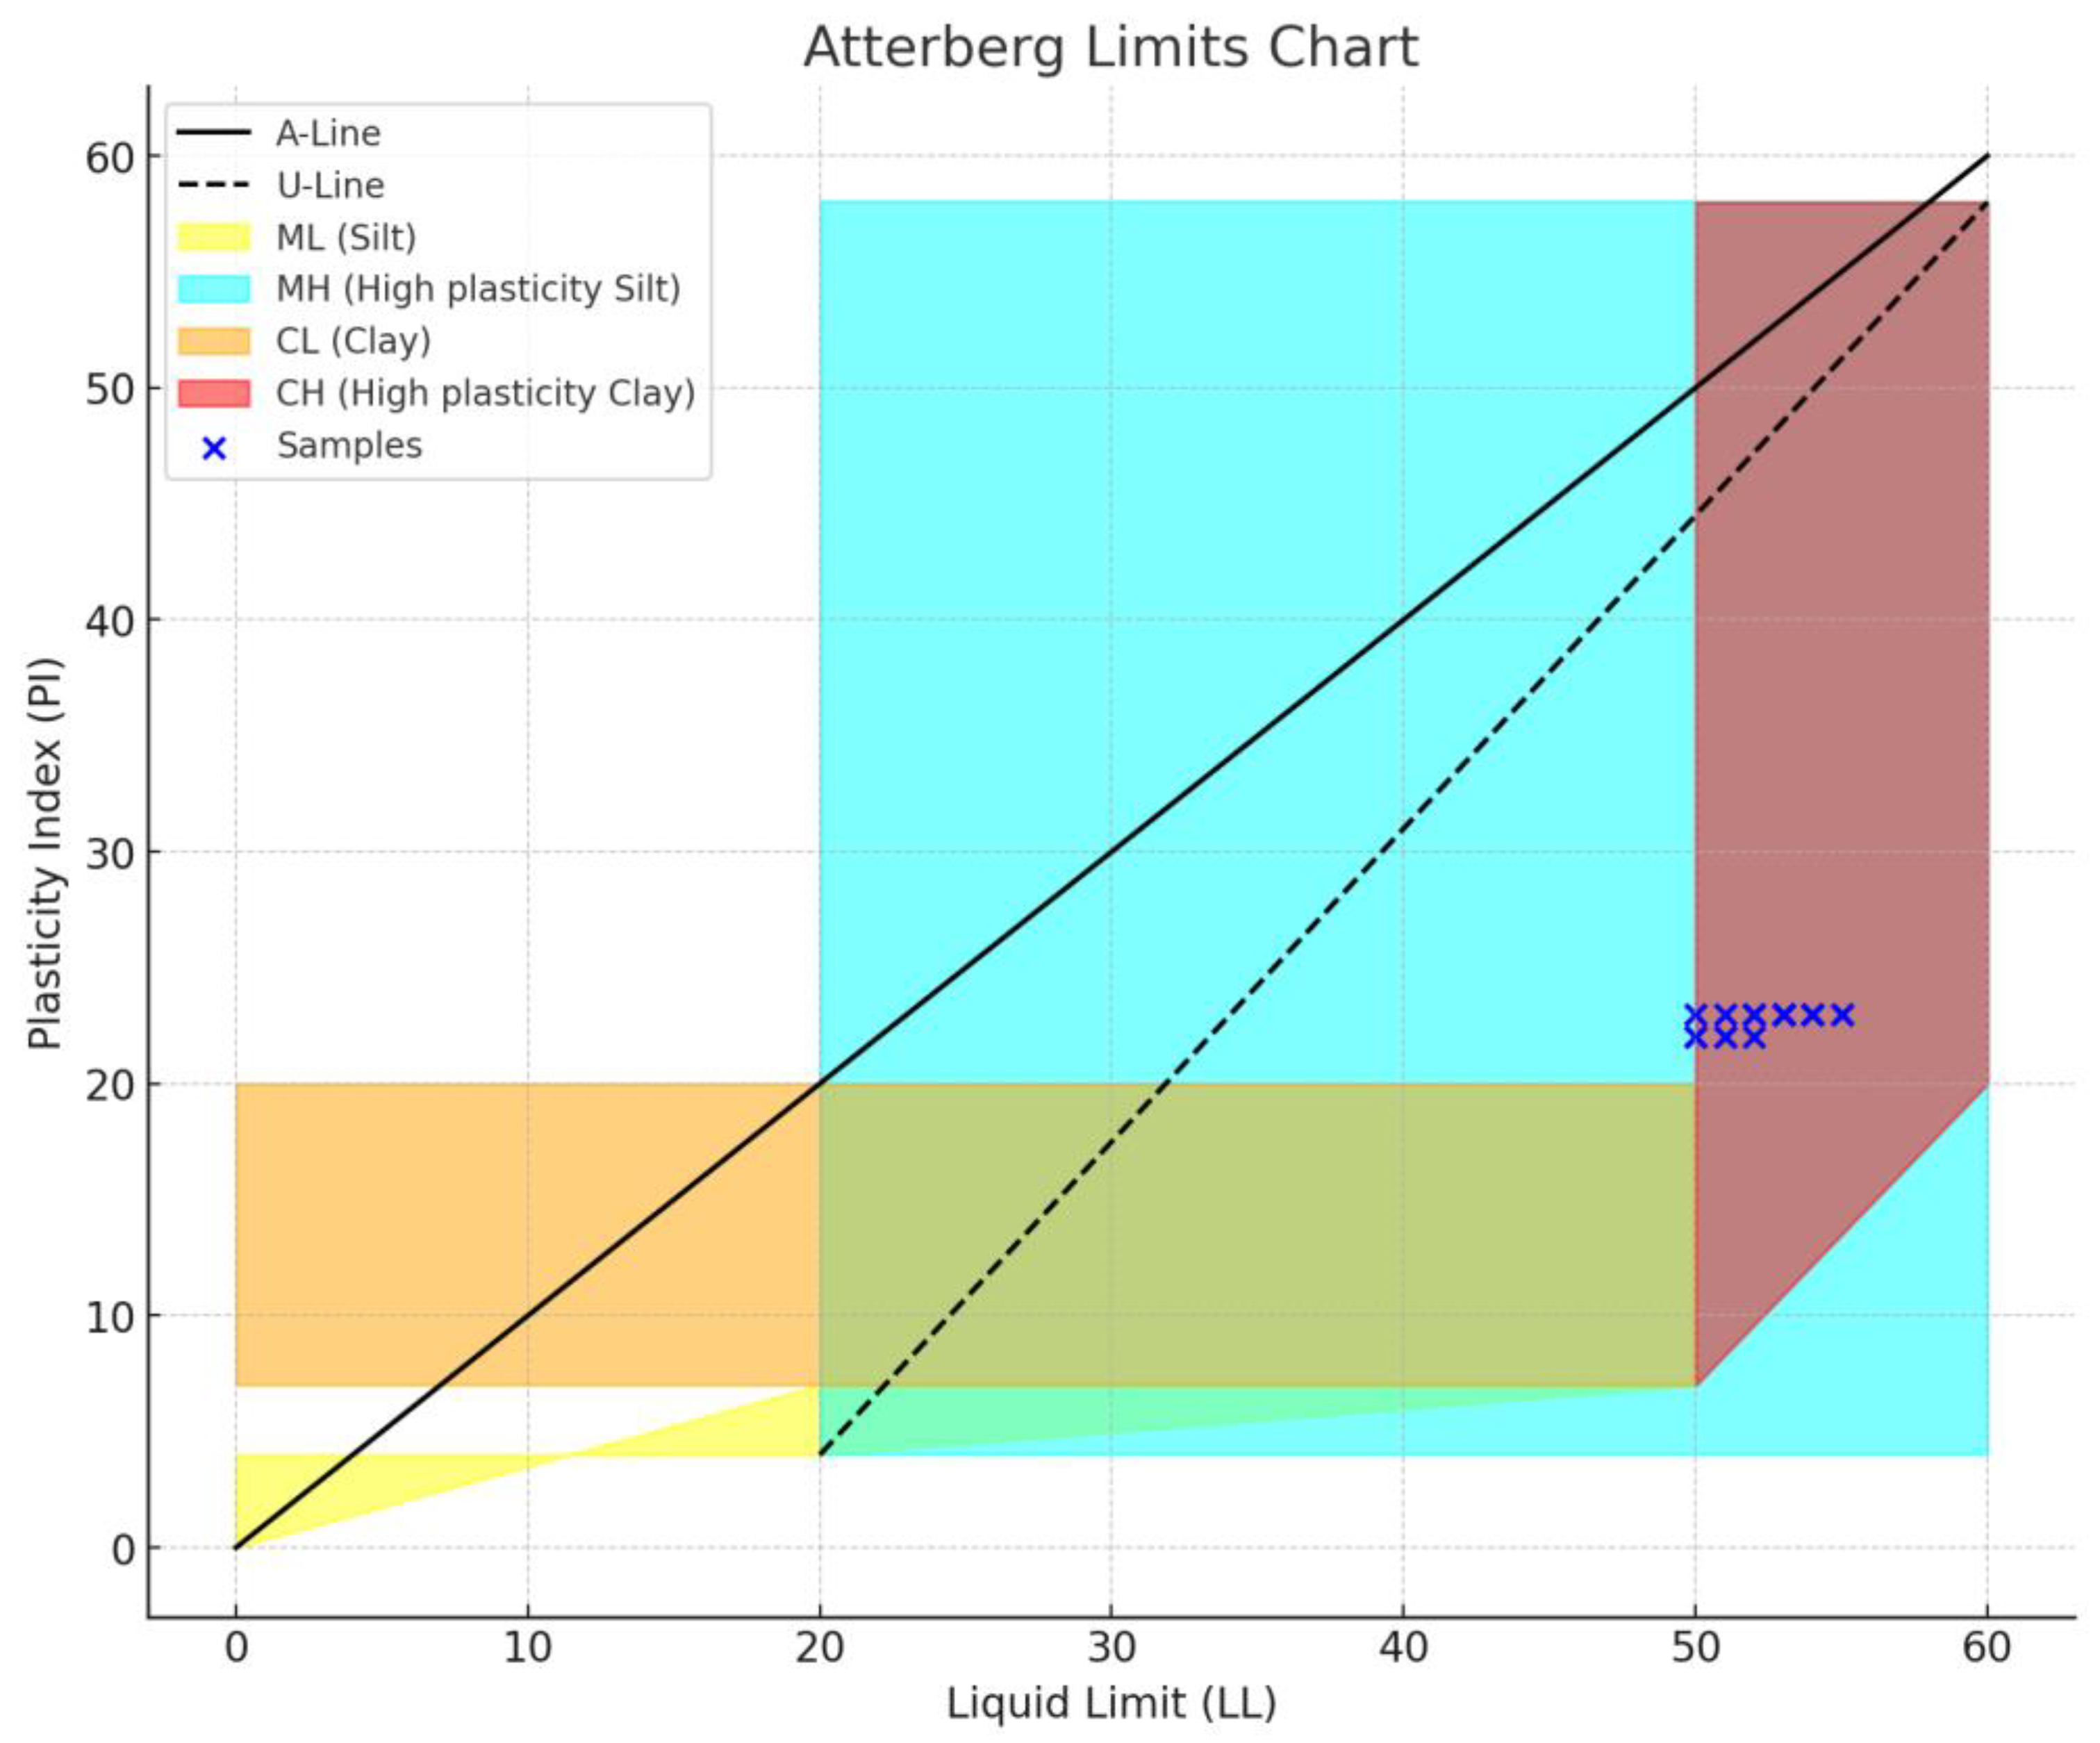
2.2.2. Soil Analysis for Building Foundations

Since the planned facilities are wooden structures with a maximum height of three stories, the building foundations are classified as shallow foundations. Given the location in a mountainous area, an accurate determination of soil properties is crucial. Soil samples were extracted from four locations at a depth of 50 cm in the mountainous building land. Each soil sample was divided into five parts, resulting in a total of four groups with twenty samples.
Plastic limit and liquid limit tests were conducted using the thread-rolling method and a liquid limit device [11] to ascertain the soil properties [12]. The density of the soil samples was measured using the ring knife method. Table 1 presents the water content, plastic limit, liquid limit, and plasticity index of the soil samples. Formula (1) represents the calculation formula for the plasticity index, where PI denotes the plasticity index, LL signifies the liquid limit, and PL represents the plastic limit.
P I = L L P L
Figure 5 is the Atterberg limits chart, utilized for soil classification based on its liquid limit and plasticity index. Different colored areas on the chart denote various soil types [26]. The blue cross marks indicate the data points of the soil samples. As depicted in the chart, the majority of sample data points fall within the red area, indicating that these soil samples consist of high plasticity clays. This information is pivotal for guiding foundation optimization strategies and calculating bearing capacities.

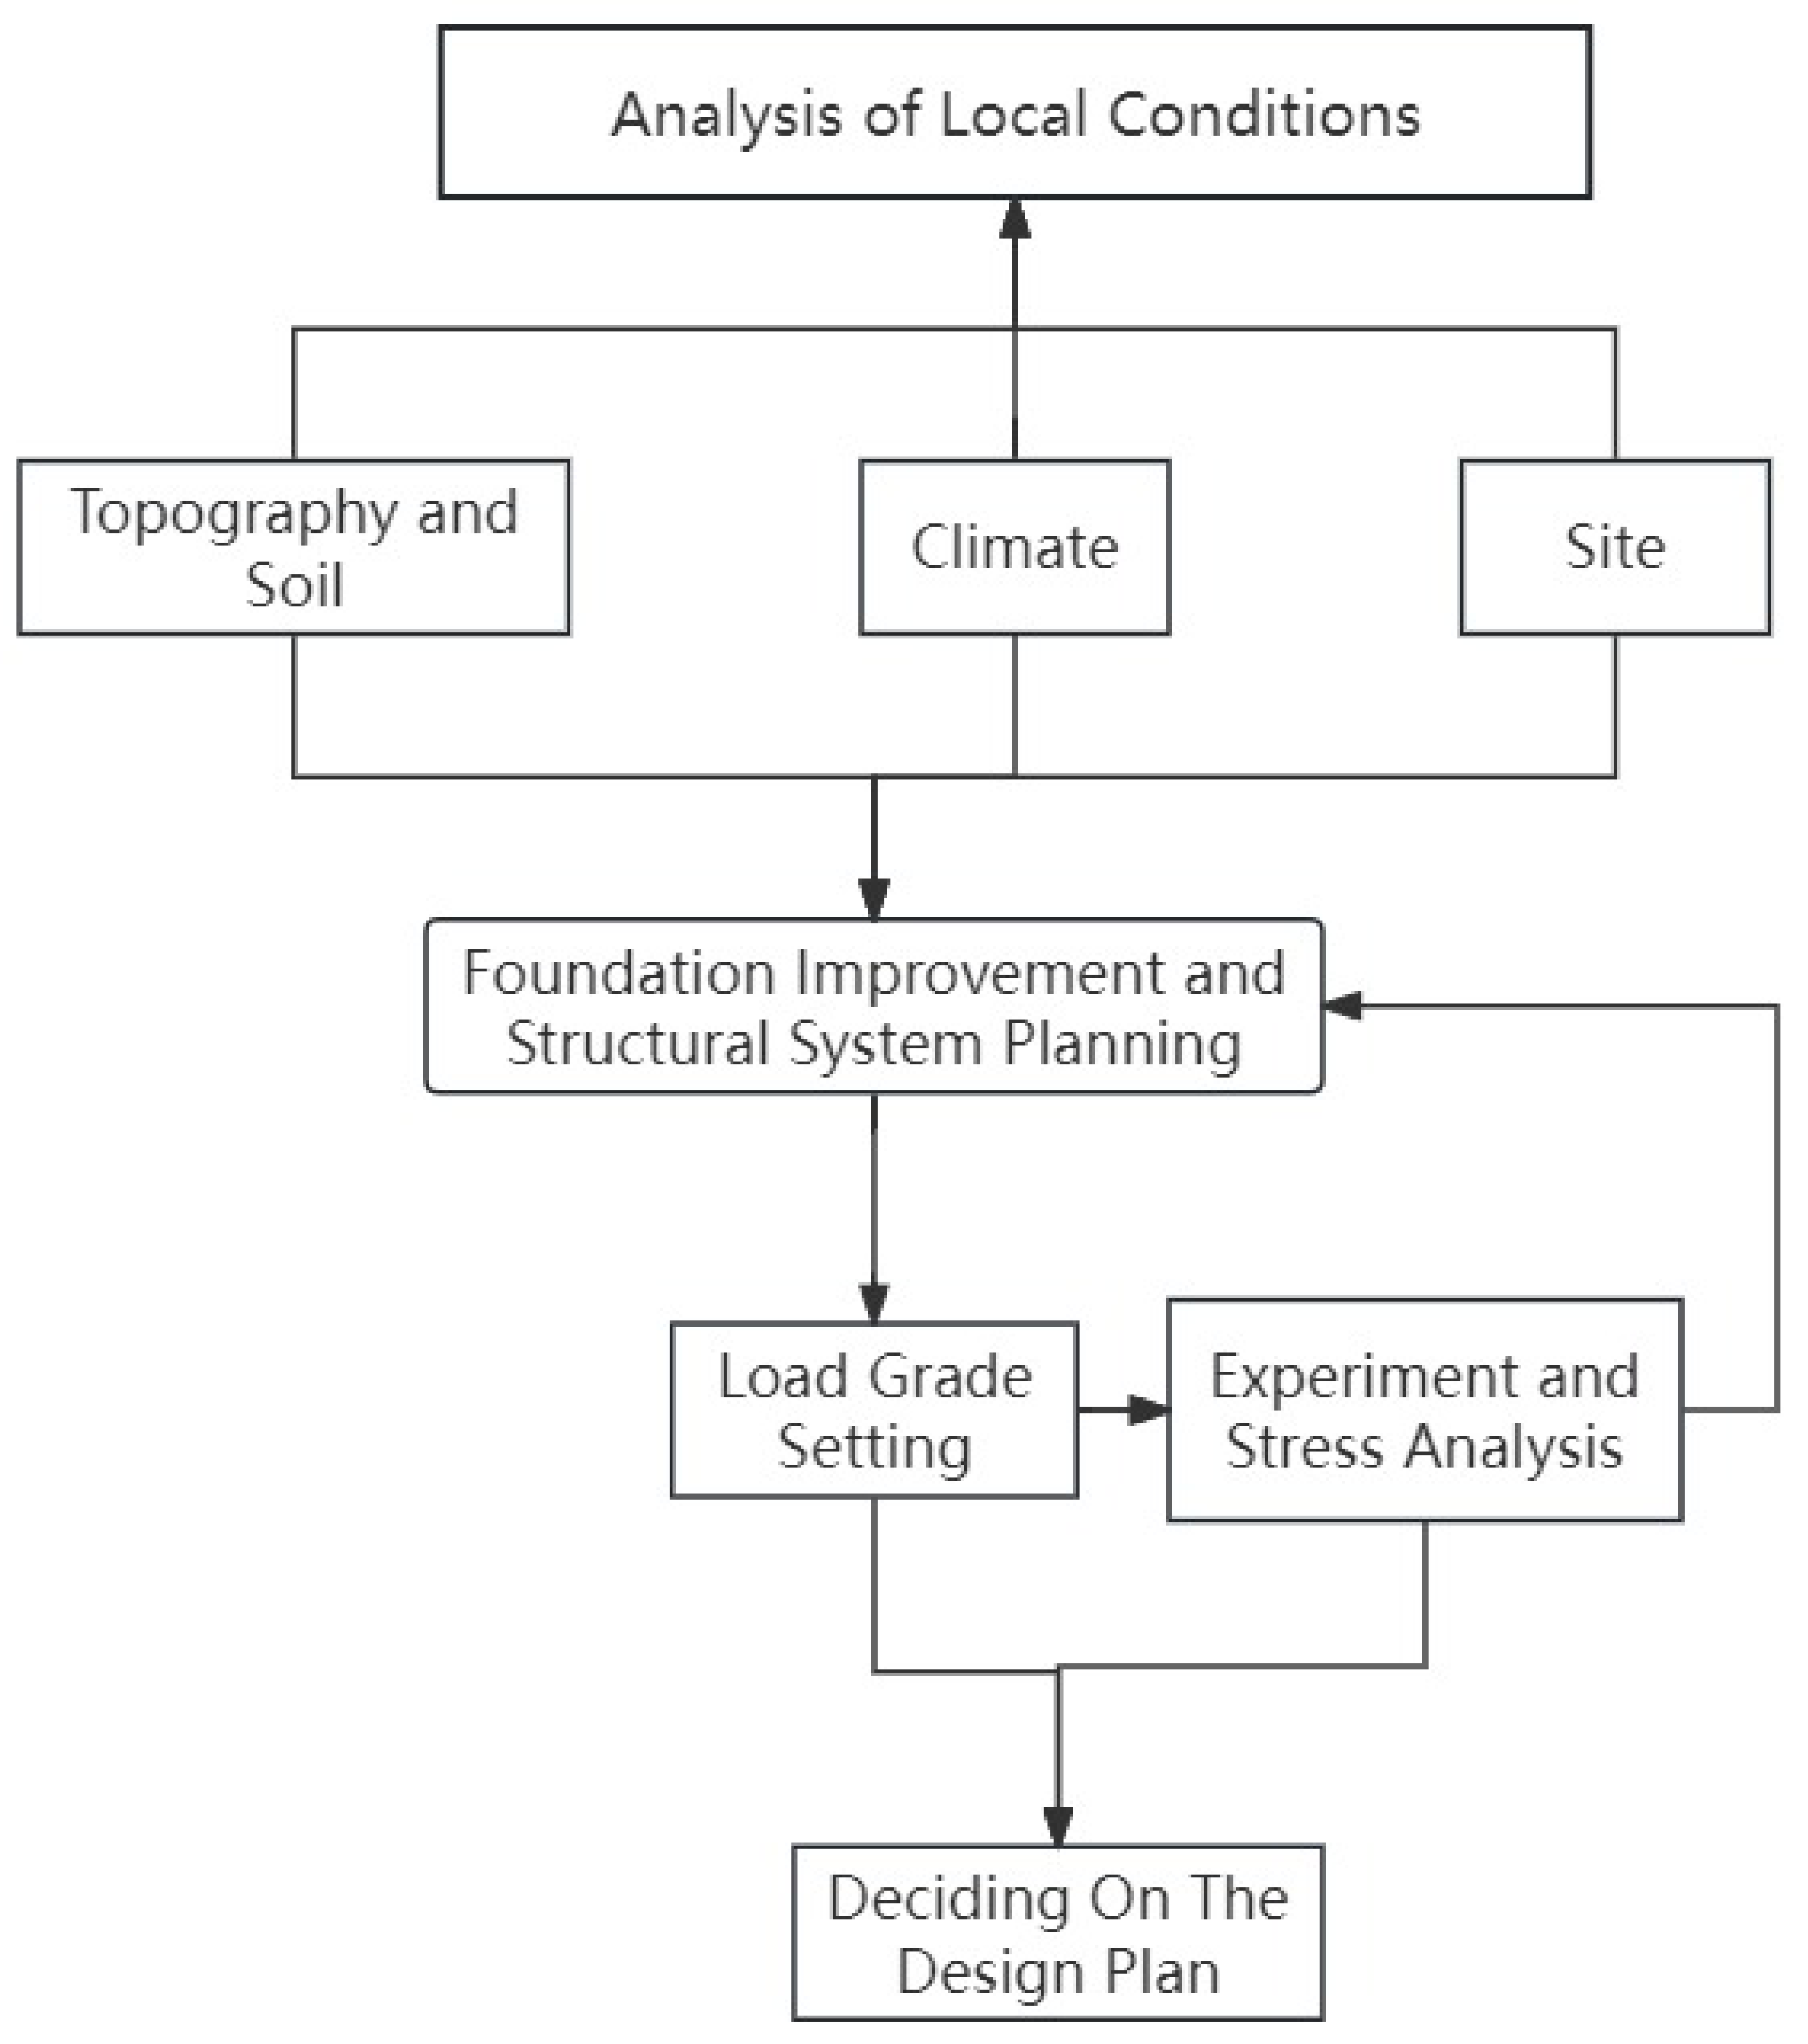
2.3. Foundation Analysis of the Actual Project Site

As exhibited in Figure 6a,b, the dimensions and the restored foundation conditions of the building site were surveyed. Situated in the yellow area of Figure 4, the site features sloped terrain with a height difference of 3.4 m between the rear 20 m and the front of the building site. The existing public facilities consist of non-engineered structures self-built by villagers. Construction involves leveling the sloped ground and installing wooden structural poles on basic foundations, with excavated soil piled at the rear of the building site.
This primitive construction method not only results in inefficient land use but also increases the height difference by depositing excavated soil at the rear, without proper foundation construction and retaining structures. Coupled with the inherent fragility of the buildings, this heightens their vulnerability to significant damage or potential collapse during landslides.
To address these challenges and optimize site utilization, the design of facilities in Tan Lap District should prioritize the following points.
Ensuring structural safety is paramount in local facility planning. Given the frequent incidence of strong winds and landslides, it is essential to account for not only permanent loads but also dynamic loads, such as wind loads. Building on slopes necessitates a meticulous assessment of slope stability and lateral earth pressure, distinct from construction on flat terrain.
Construction costs: Given the constraints of the local government budget, it is imperative to employ cost-effective approaches for enhancing building site foundations and redesigning structures while ensuring safety.

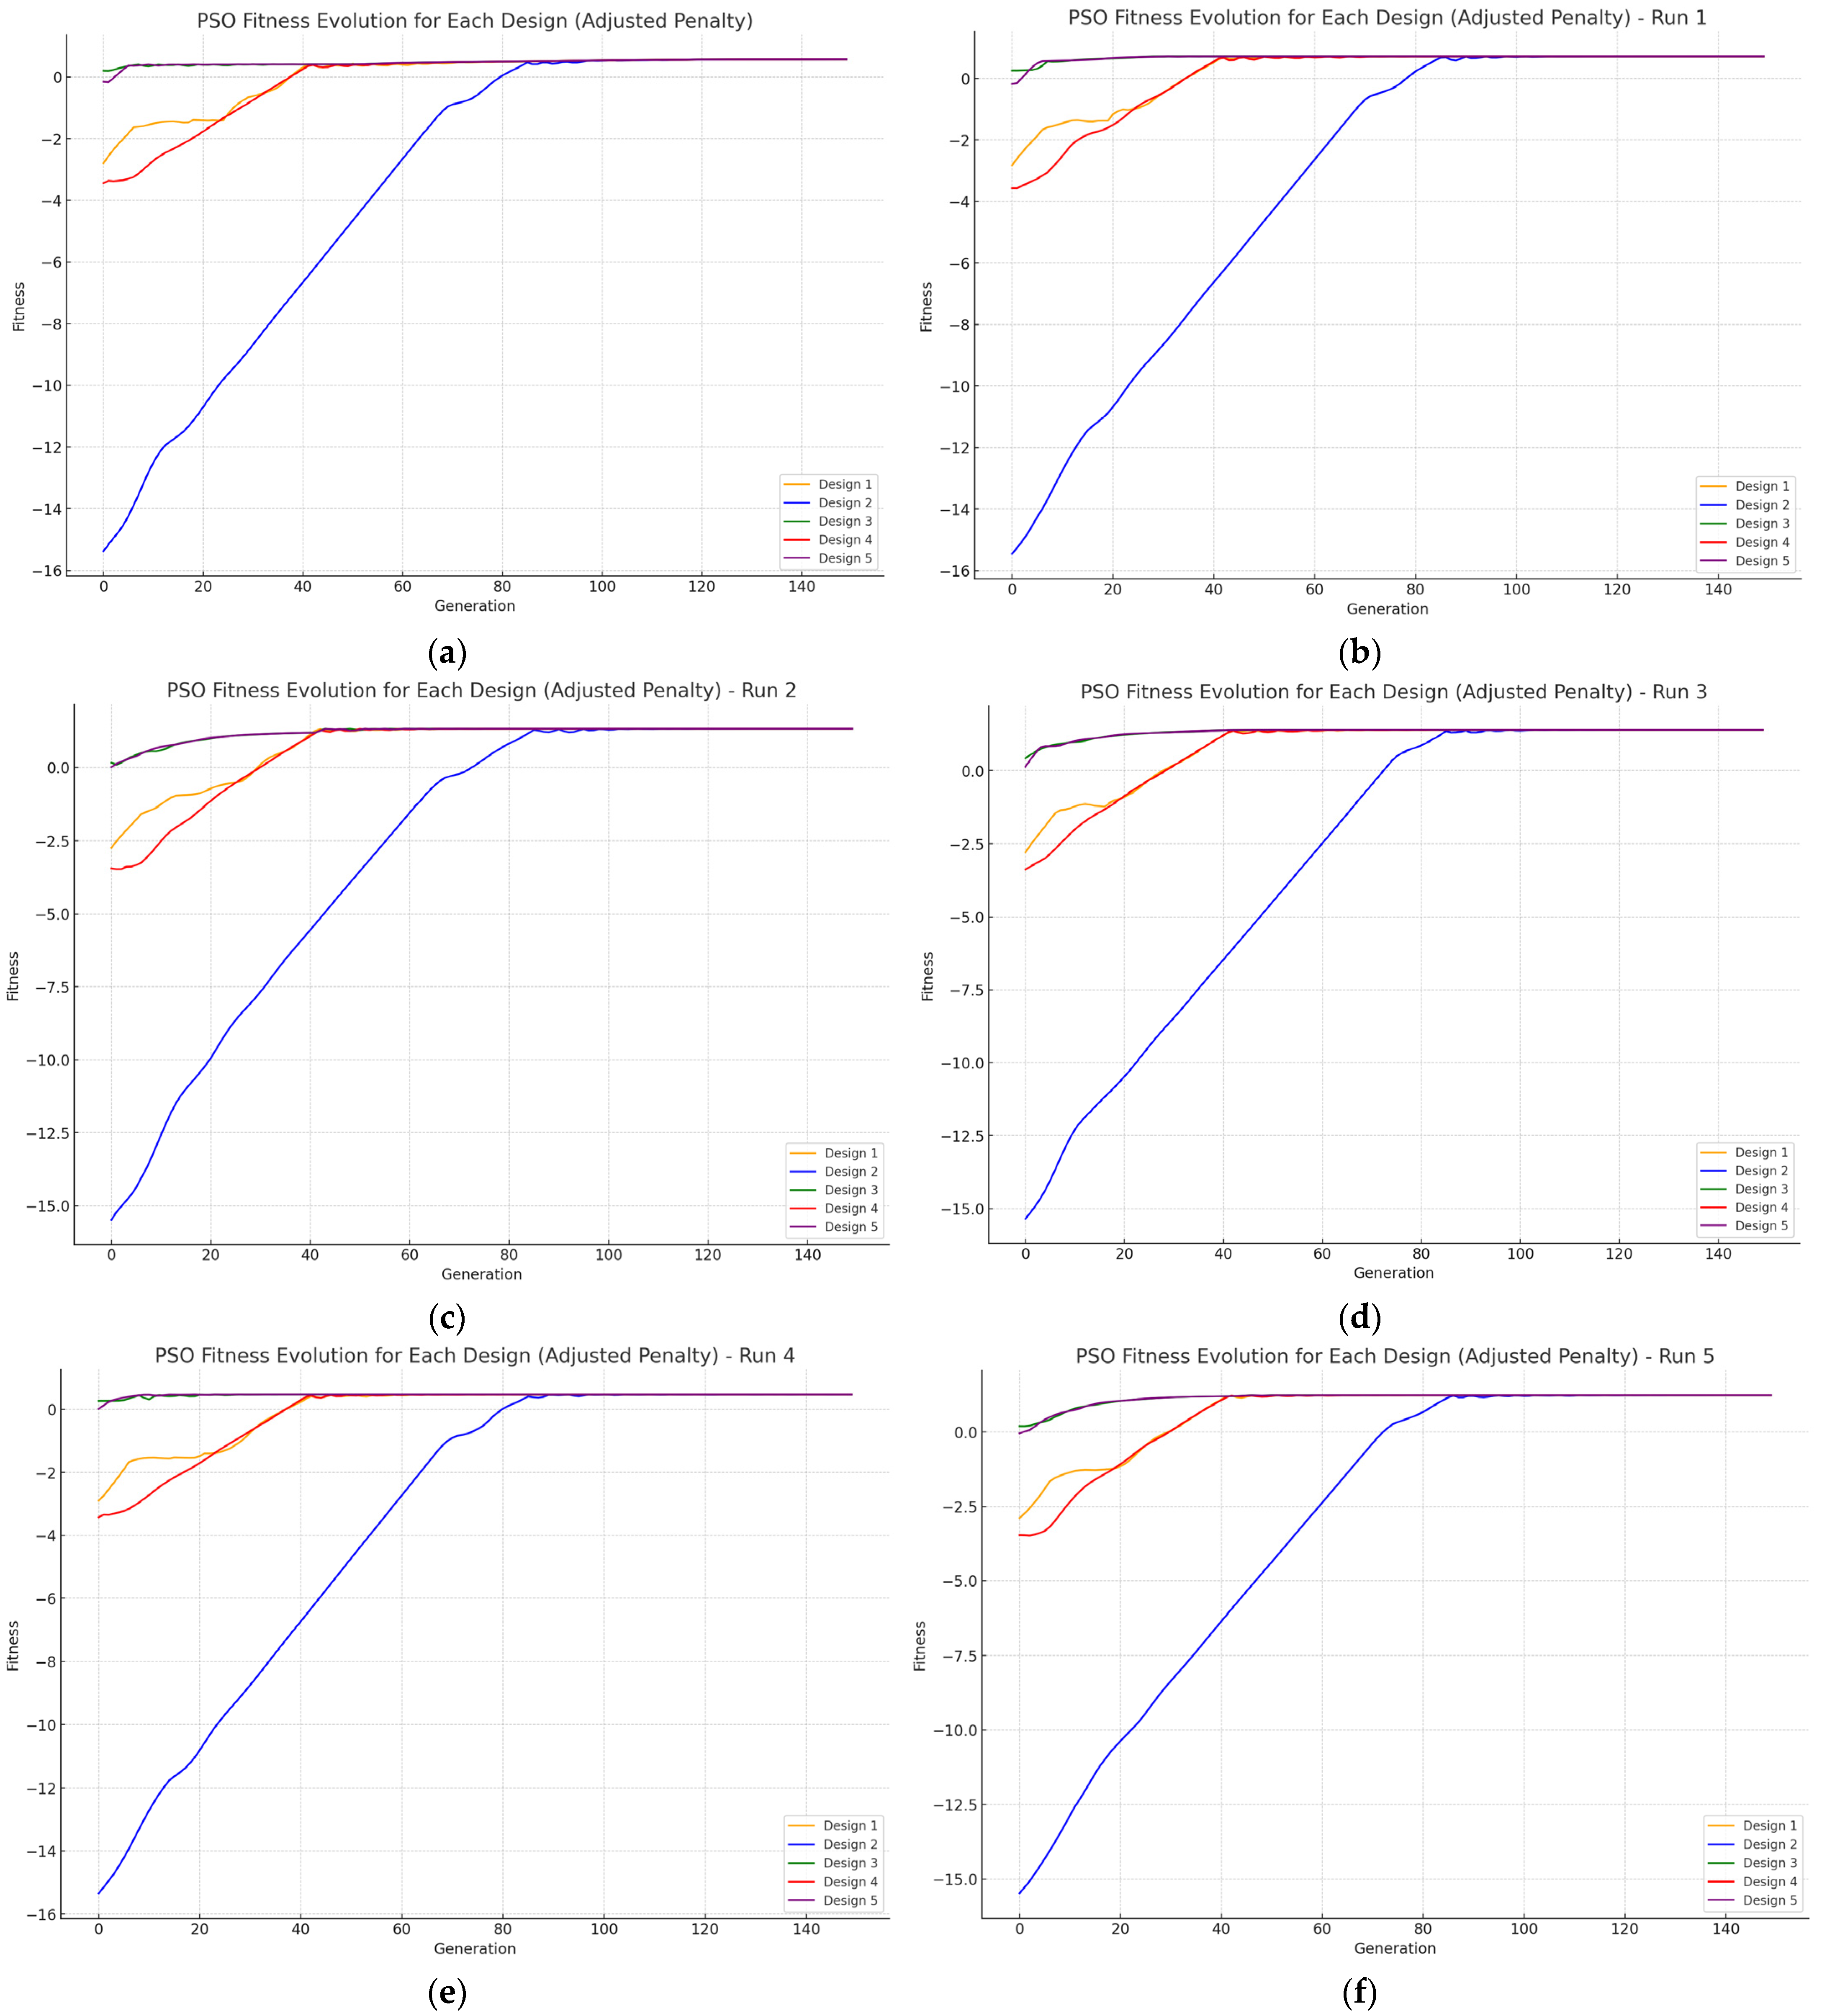
2.4. Optimization Design for the Actual Project

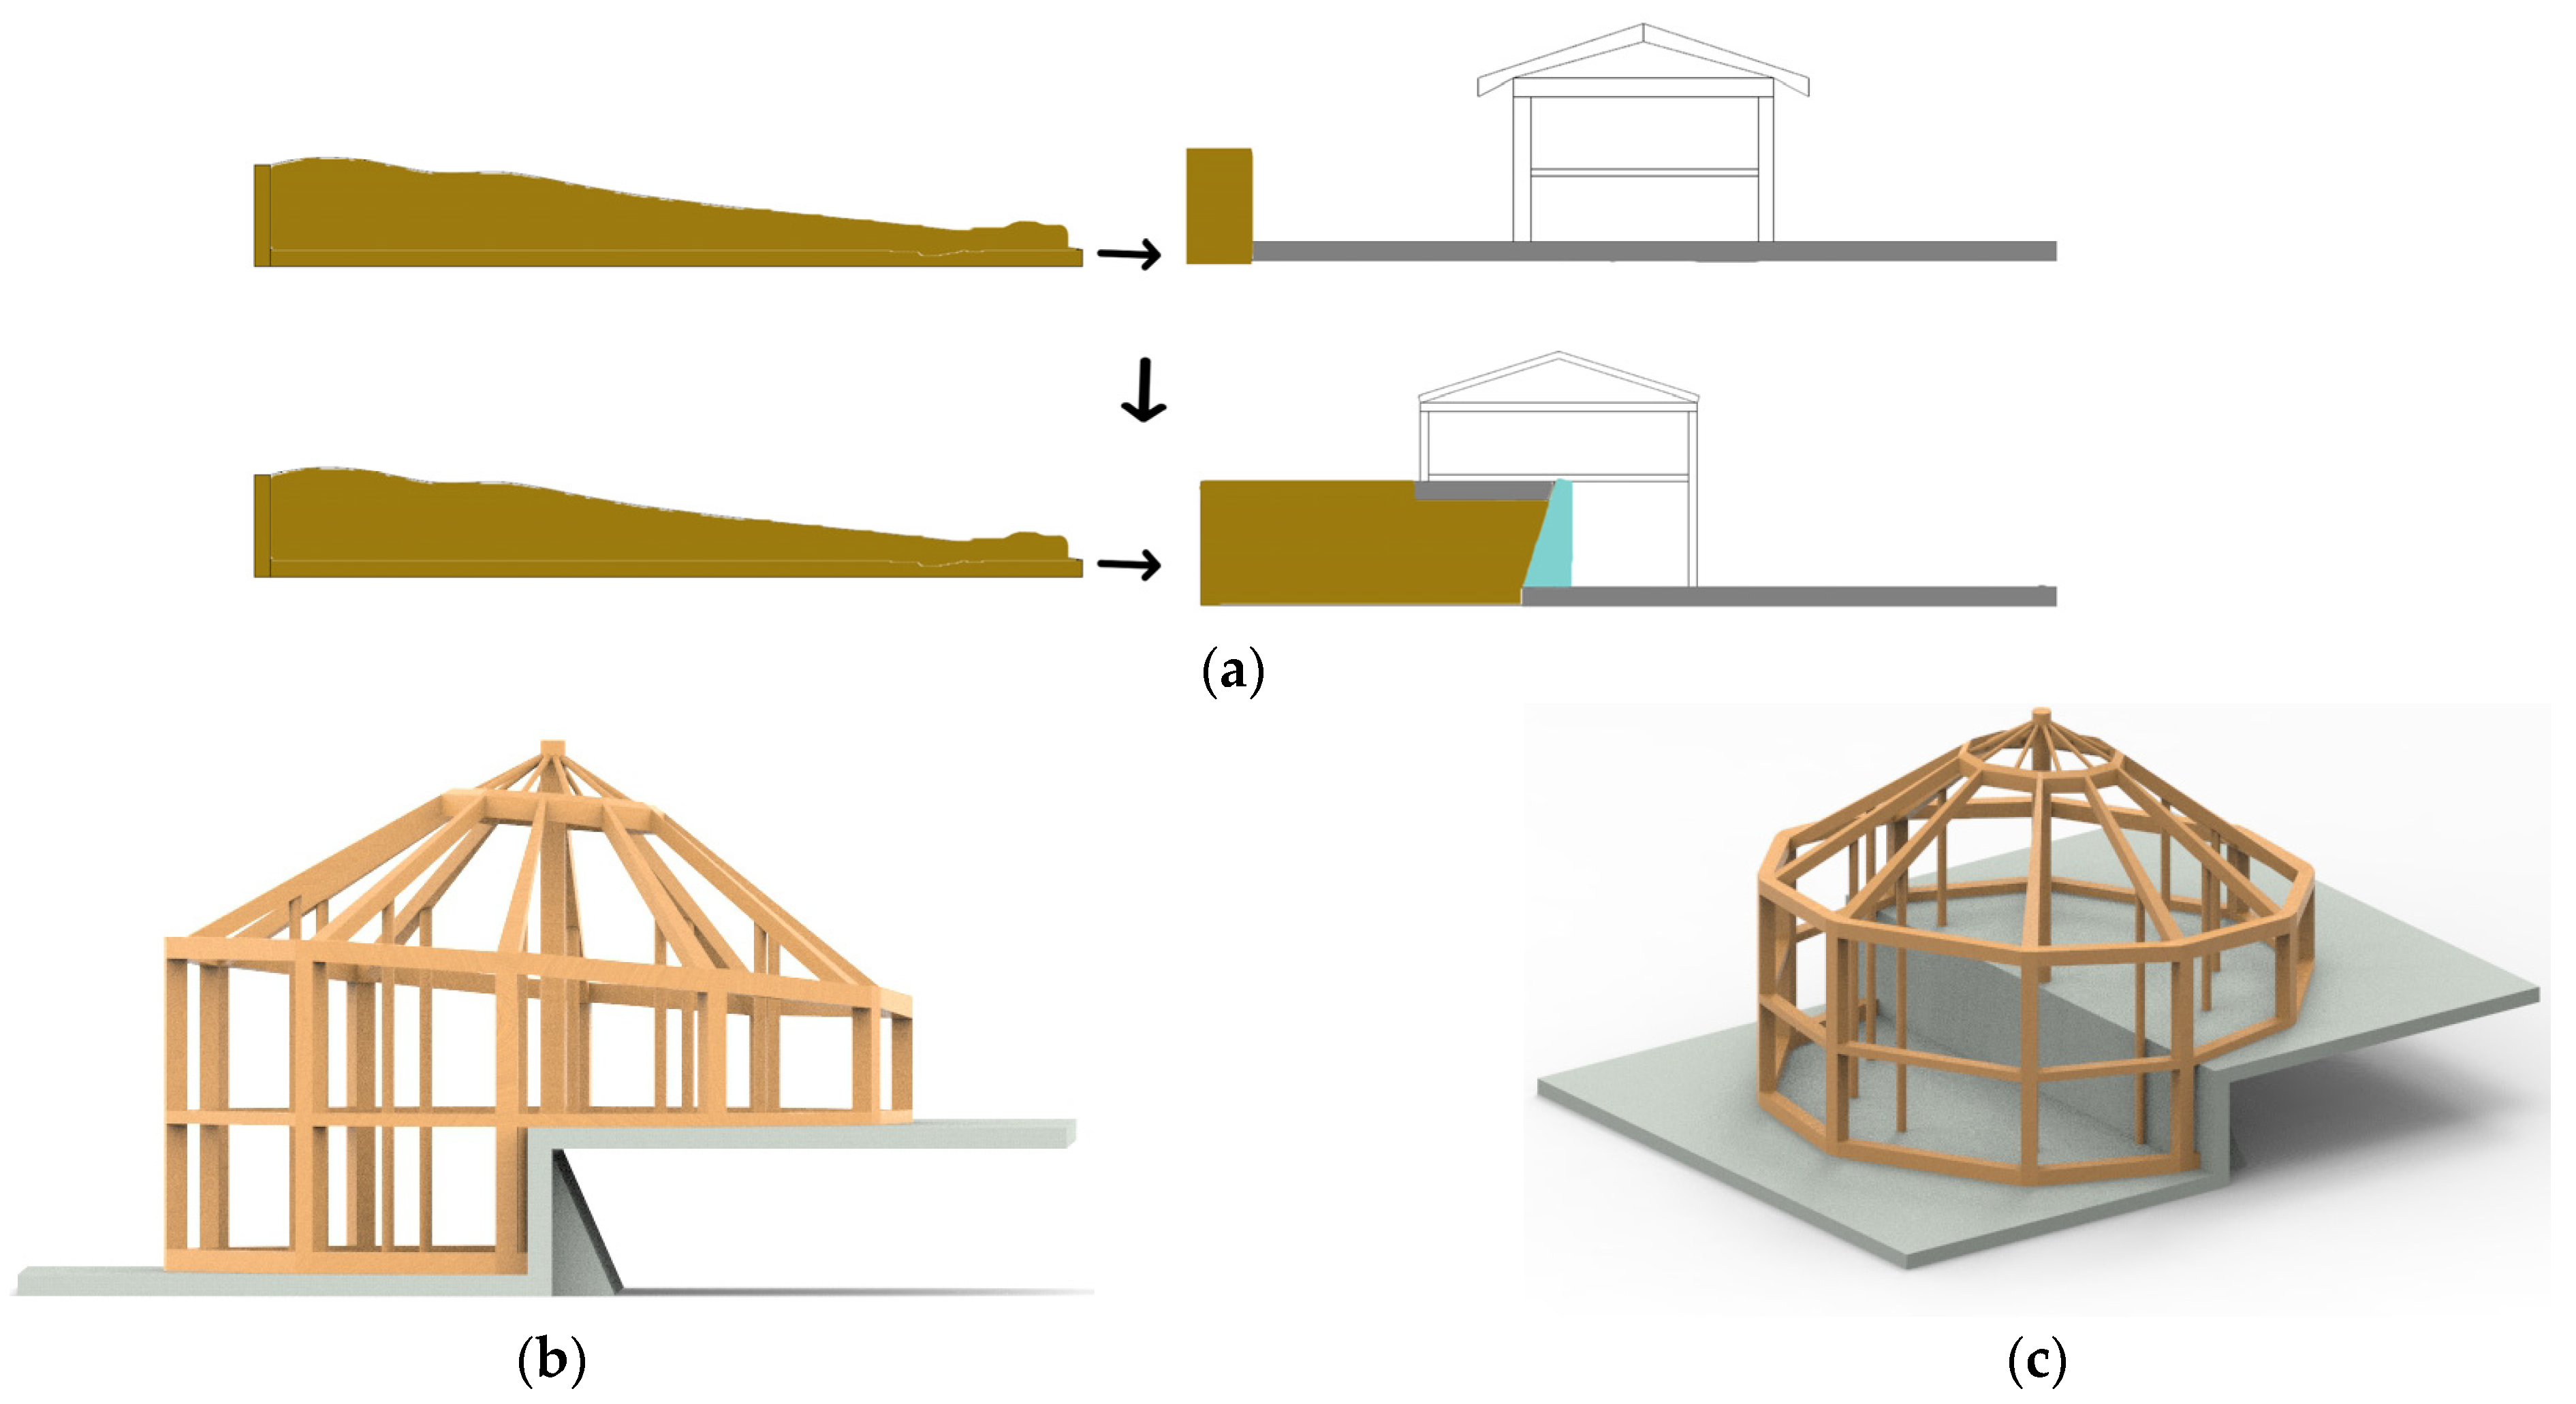
2.4.1. Foundation Improvement

Mainland Japan predominantly consists of mountainous terrain, with a summer climate characterized by typhoons and heavy rainfall, similar to Yen Bai. Typhoons often bring strong winds and intense, short-term rainfall, leading to secondary disasters, such as landslides [27]. Compared with Yen Bai Province in Vietnam, Japan faces more severe disaster challenges. Consequently, the disaster prevention standards in Japanese building codes are set higher than in other regions [28,29]. The foundation design methods and safety standards for mountainous areas in Japan provide valuable references for Vietnam.
Figure 7 illustrates the four primary construction methods used for building sites on slopes in Japan [9]. Method A involves leveling the slope before constructing buildings. This method is commonly employed in urban slope construction because the building site has a good road foundation in both the front and back [1,2,3,4,5,6,7,9,10,11,12,13,16,19,20,21,22,23,24,25,26,28,30,31,32,33,34,35,36]. Method B involves constructing the foundation up to the height of the highest point of the building site, followed by the construction of houses on this prepared foundation [37]. Methods C and D are suitable for rural mountainous areas where there are no engineered structures or disaster prevention facilities in the front and back. These methods necessitate the installation of retaining walls or the reinforcement of the first floor of buildings [9,19,20,21,22,23,24,25,26,28,29,30,31,32,33,34,35,36,37].
Method A requires robust surrounding infrastructure and stable soil conditions, limiting its suitability to specific environmental settings.
Method B involves considerable expense and aims to improve seismic resistance through extensive foundation reinforcement.
Methods C and D align well with the project’s requirements. However, implementing them at the building site depicted in Figure 7 would potentially compromise land use efficiency.
The Indochina Peninsula, home to Vietnam, has relatively stable geological activity, with earthquakes being a low-priority disaster. Given the region’s low income levels, the design budget prioritizes enhancing resistance to landslides and wind disasters [24].
Given the site conditions, when constructing buildings on sloped terrain, retaining walls must be placed where there are height differences in the foundation [29] to resist soil pressure. Unlike earthquake-prone Japan, statistics show that Vietnam’s geological environment is relatively stable. Since records began, Yen Bai Province has not experienced an earthquake above magnitude 5. Therefore, as shown in Figure 8a, the modification plan references the retaining wall design from Method C, reducing the amount of excavation and incorporating buttressed retaining walls at height-differential points. This approach not only improves land use efficiency and attenuates excavation costs, but also enhances the foundation’s ability to withstand landslides.
The design prioritizes structures that can resist soil pressure and are cost-effective. Therefore, the retaining wall design can draw upon commonly used, cost-efficient retaining walls in civil engineering, which have relatively simple safety calculation formulas to improve the building site’s foundation [7].

2.4.2. Design for Landslide and Wind Load

Design for Landslides and Soil Pressure

In order to enhance the building’s resistance to mudslides and soil pressure, a buttressed retaining wall was designed based on the aforementioned comparison of retaining wall data [3,4,5,6,7,10,11,12,13,16,20,21,22,23,24,25,26,28,30,31], due to the 3.4 m height difference at the site. The height of the buttressed retaining wall was 3.4 m. To prevent the formation of a secondary failure plane and to resist soil pressure, the length of the heel slab was restricted to between 1.5 m and 3.4 m, with a thickness of 0.4 m.

Reducing Wind Load from Strong Winds

To resist strong winds, the roof was designed with a 5° incline towards the northwest, inspired by the concept of tilting an umbrella against wind pressure during strong winds.

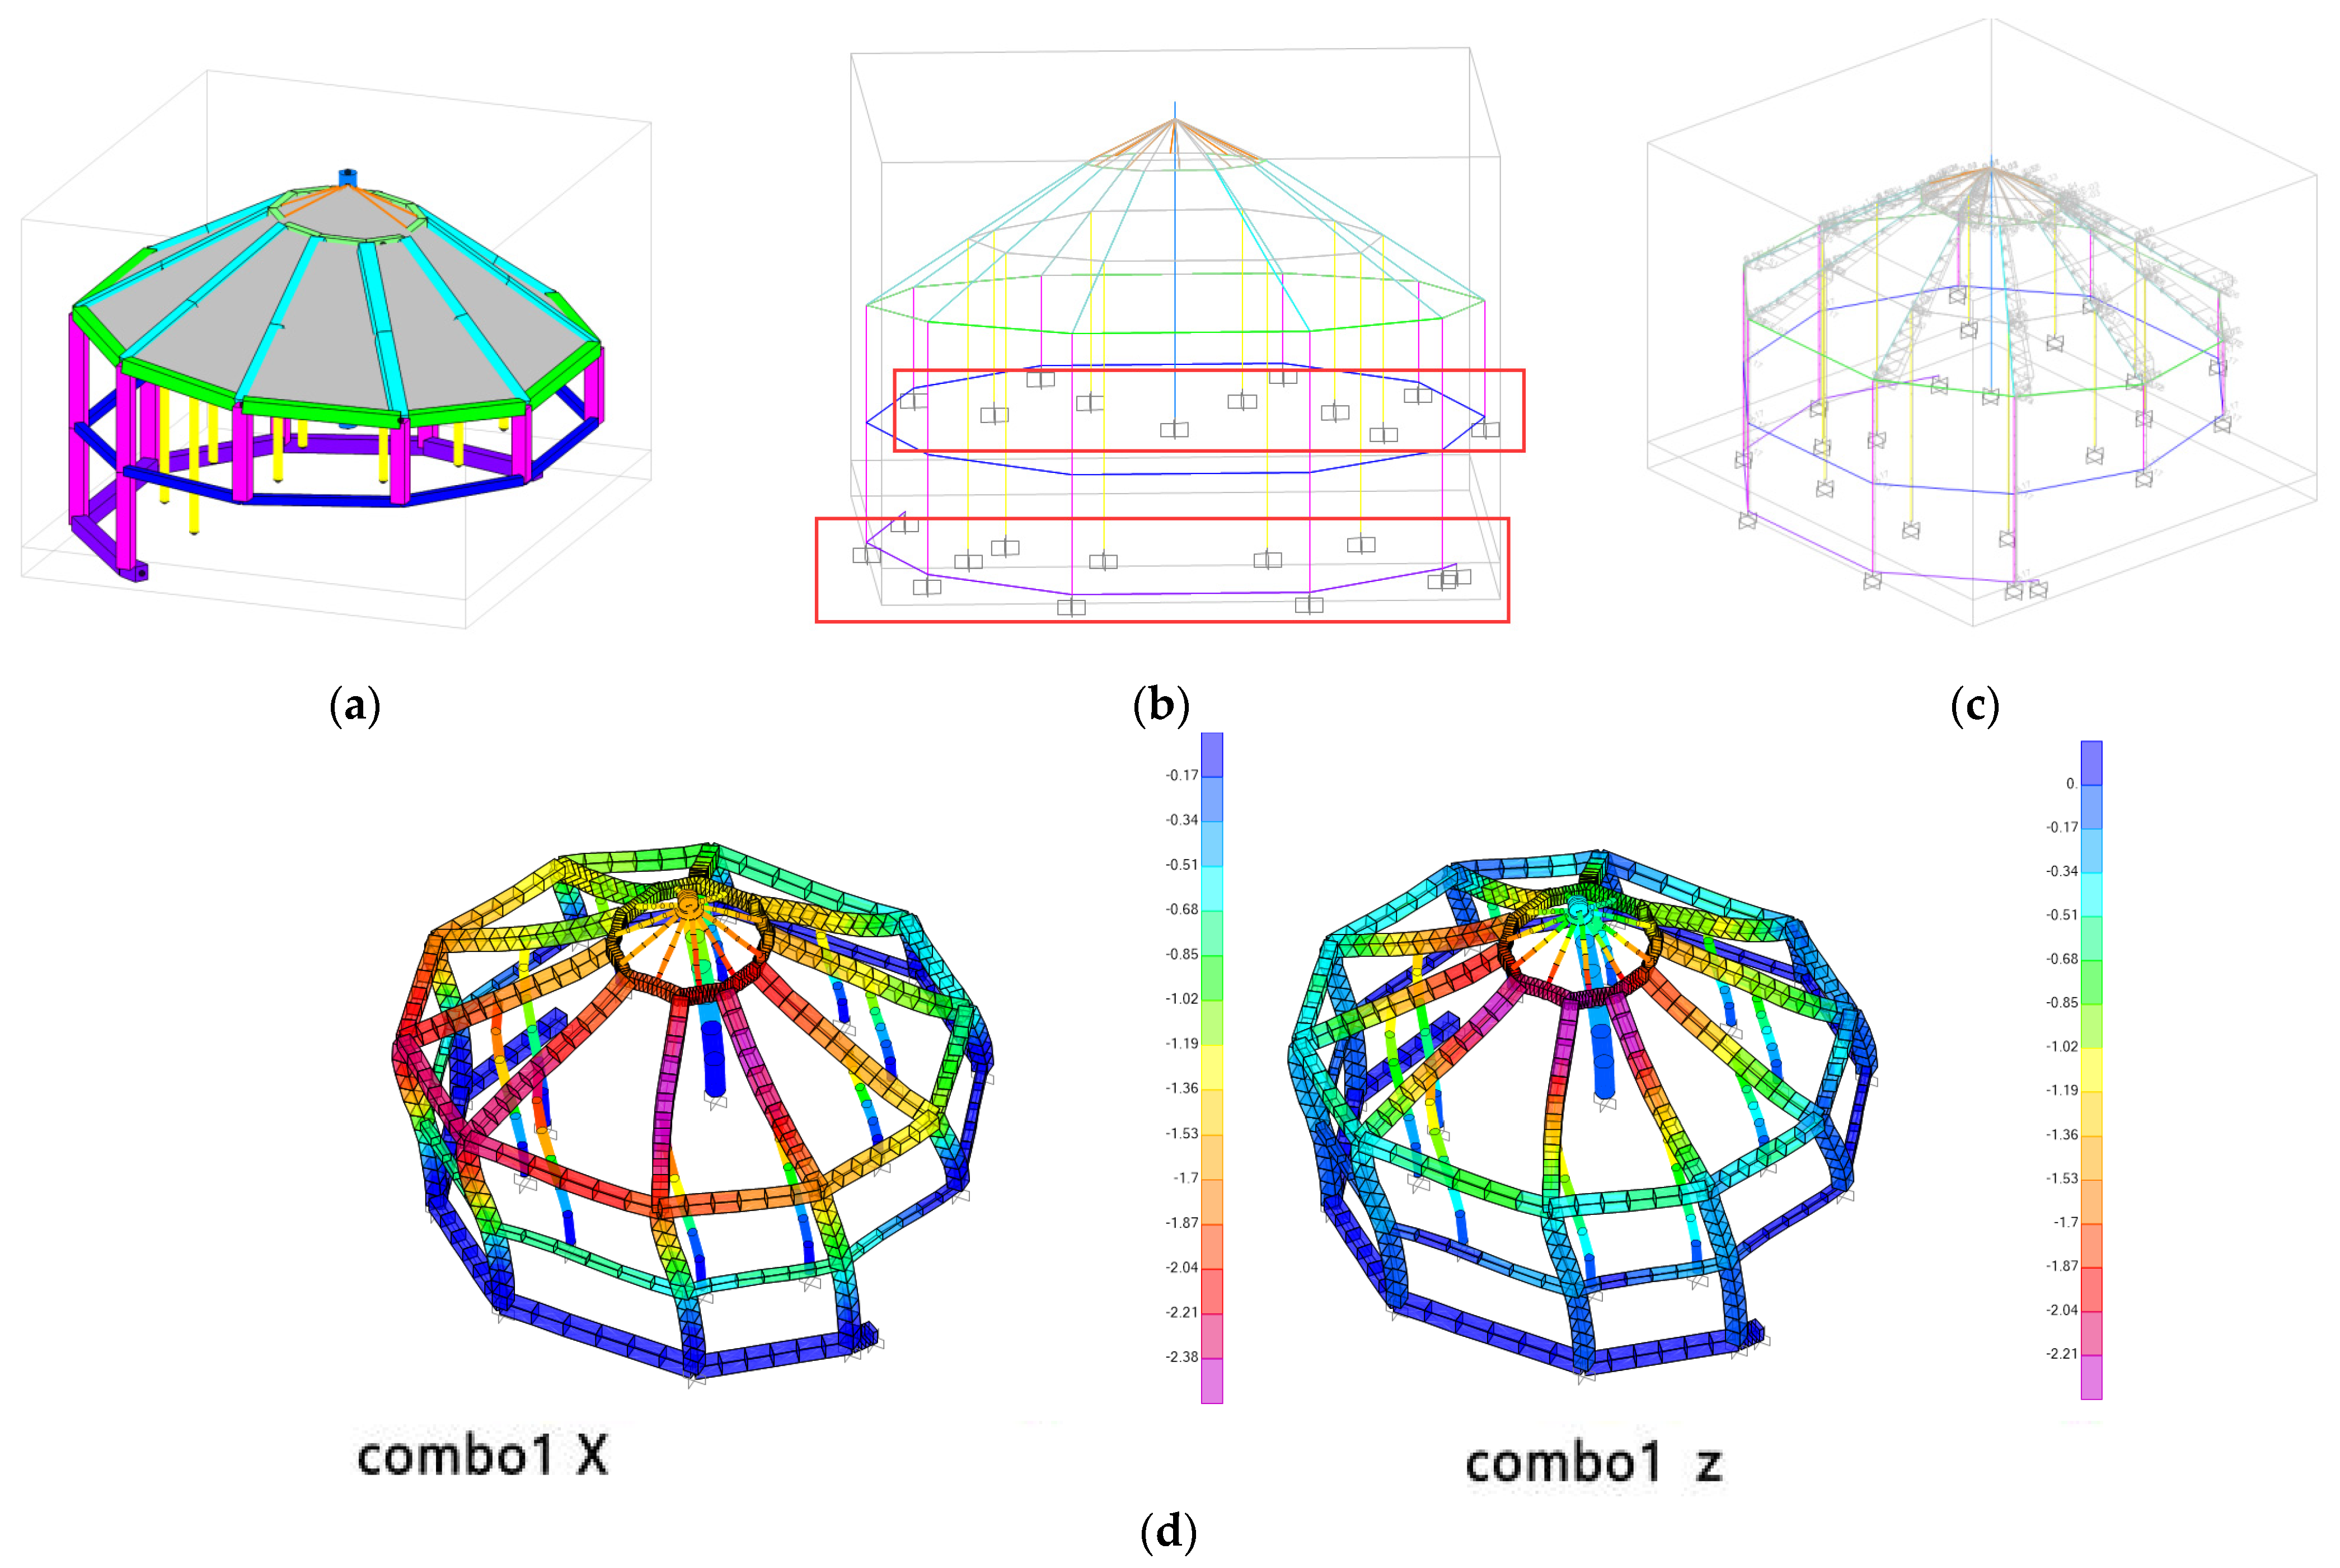
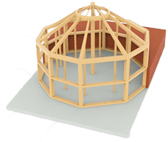
Columns and Beams Structural System

As shown in Figure 8b, the structural system of columns and beams was modified based on the Japanese Yamagata frame design. Given the building’s diameter of 17.5 m, the wind-induced bending moments on the columns and beams, as well as the roof load, are significant. To address this, a primary column with a diameter of 1 m was placed at the center of the second floor, connecting the other columns and beams. Additionally, ten slender columns were arranged around the main column to enhance structural stability.

2.4.3. Selection of Retaining Walls

Table 2 displays the performance of five main types of retaining walls. In the design of this project, both load-bearing performance and maintenance and material costs were considered [31]. Ultimately, a counterfort retaining wall was chosen due to its high hardness, load-bearing capacity, and low maintenance costs.
Given the priority focus on construction costs and stability, the counterfort retaining wall was selected based on the data from the chart. It offers low construction and maintenance costs while still providing adequate stability and load-bearing capacity. Compared with the cantilever retaining wall, which has similar construction and maintenance costs but higher earthquake resistance, the counterfort retaining wall is less seismic-resistant [32]. Nevertheless, considering the stable geological activity in the area, the counterfort retaining wall was ultimately chosen to improve the building site’s foundation.
Figure 9 illustrates the stress diagram of the buttressed retaining wall in the new construction method. Due to Japan’s mountainous volcanic terrain, most of the soil consists of sandstone. Compared with Vietnam’s hard clay, sandstone has a friction angle exceeding 35°. Additionally, Japan’s sliding coefficient ranges from 0.45 to 0.5, compared with Vietnam’s 0.35 to 0.4 [38]. Therefore, when designing structures based on Vietnamese soil conditions, it is crucial to increase the soil pressure angle to enhance the wall’s overturning resistance. According to the overturning resistance calculation in Formula (11) and the overturning force calculation in Formula (14), it can be analyzed that, under the same soil and wall material conditions, a greater angle of soil pressure on the wall results in higher overturning resistance. As depicted in Figure 9, vis a vis other retaining wall structures, the heel slab behind the buttressed retaining wall increases the angle of the soil pressure on the wall, thereby enhancing its overturning resistance. According to Formula (10), the greater the vertical pressure the retaining wall bears, the stronger its sliding resistance. Since the buttressed retaining wall itself has relatively weak sliding resistance, in general civil engineering projects, it is typically considered only when the height difference exceeds 5 m in general civil engineering projects due to its reliance on self-weight and heel slab soil weight for vertical pressure [18]. However, in the new construction method, the weight of the building structure and the foundation built on the retaining wall serve as additional sources of vertical pressure, compensating for the insufficient sliding resistance caused by the inadequate height of the buttressed retaining wall. Therefore, choosing a buttressed retaining wall as part of the building in the new construction method enhances the building’s resistance to landslides and compensates for the inadequate sliding resistance of the retaining wall. Considering all factors, the buttressed retaining wall stands as the most economical choice in the new construction method.

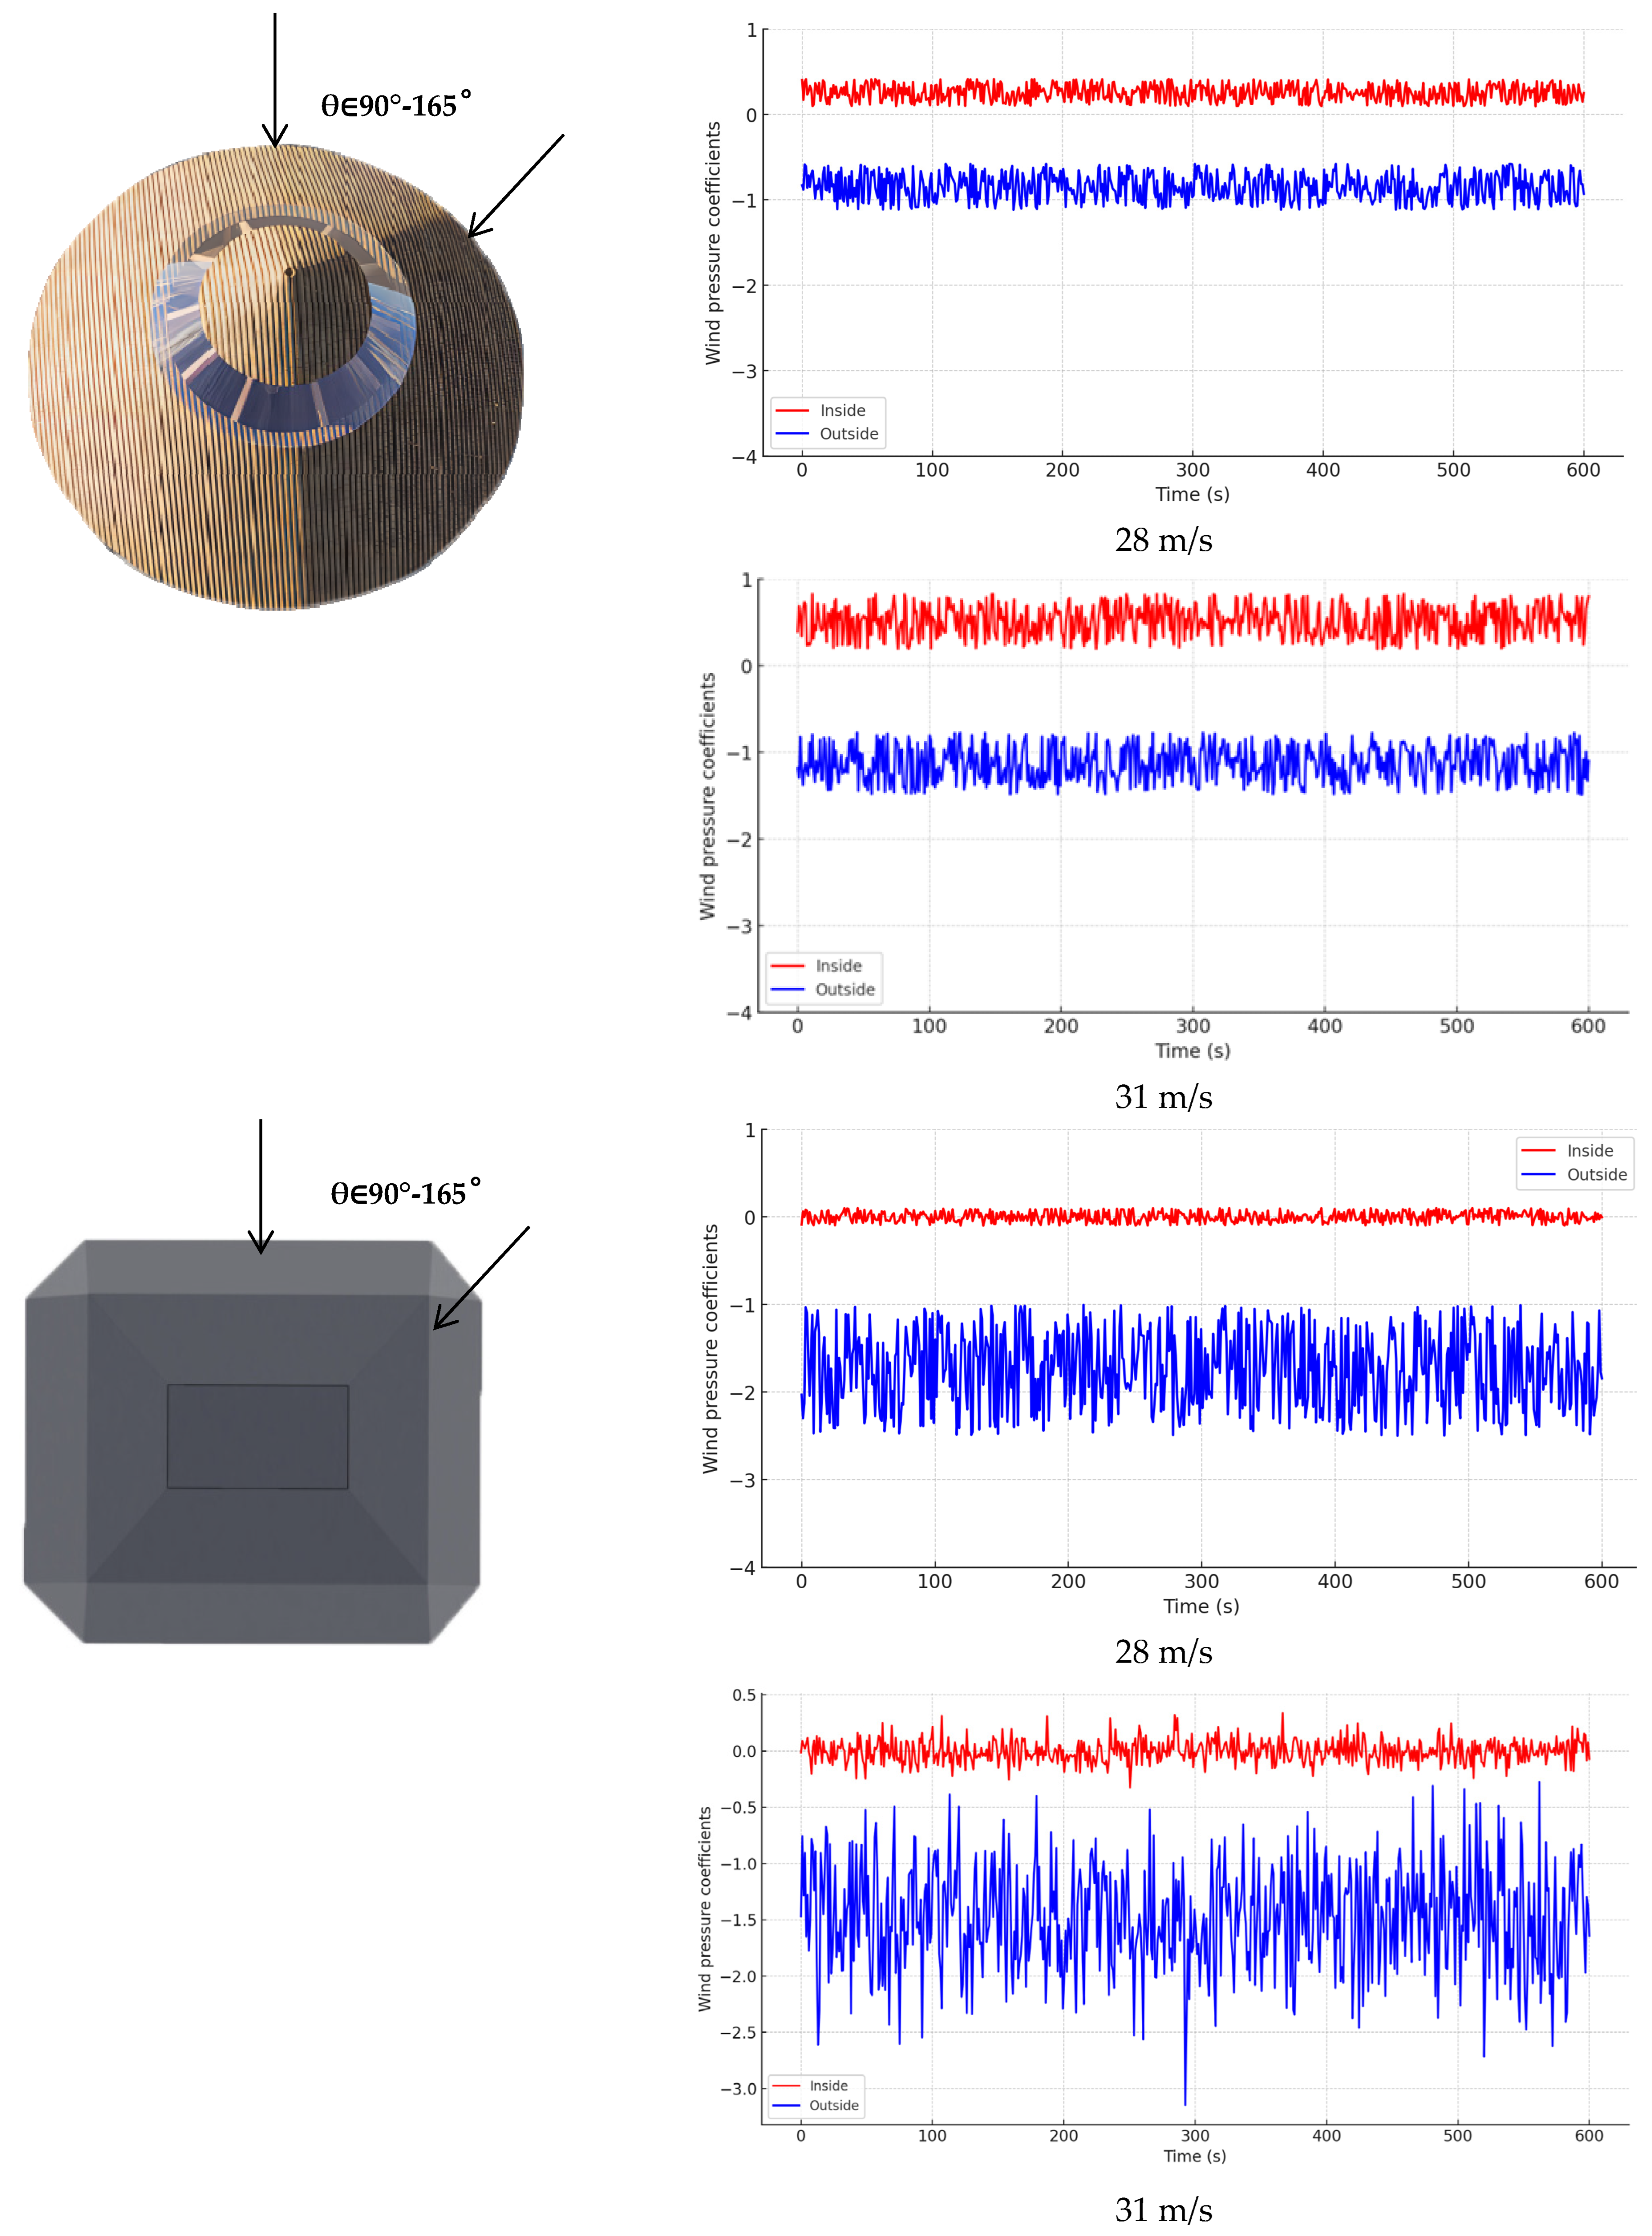
2.4.4. Wind Tunnel Experiment

To verify the performance of the new structure in resisting strong winds compared with traditional structures, a wind tunnel experiment was conducted in an Eiffel-type wind tunnel based on local climate data [4].
The model for the wind tunnel experiment was scaled at 1:25. The measurement height was set to the height of the experimental building model’s roof, which is 732 mm. The boundary layer flow index (α) was set to 0.3, and the turbulence intensity (I) was set to 0.2. Due to the complex terrain and high surface roughness in the northern mountainous regions of Vietnam, wind speed variation with height is more pronounced, resulting in a higher vertical wind speed exponent (α). According to data from the Engineering Toolbox, the vertical wind speed exponent in mountainous and hilly areas is generally around 0.25 [39]. However, given the intricate terrain of Northern Vietnam, a conservative estimate of 0.3 was chosen to more accurately represent local environmental conditions and to conservatively assess the wind resistance of buildings. According to data from the GLOBALWINDATLAS, the annual average wind speed at a height of 50 m in the mountainous regions of Yên Bái Province is 5.19 m/s, with a standard deviation of 1.12 based on data from 2010 to 2024 [20]. Using the ratio of the standard deviation to the mean wind speed, the turbulence intensity was calculated to be 0.216. For conservative estimation, a value of 0.2 was adopted. The vertical distribution of the average wind speed and turbulence intensity is exhibited in Figure 10.
During the experiment, wind direction simulations for the improved structure and the original framework model were applied based on the local climate, varying from 90° to 165° at 15° intervals. At each direction, two wind pressure time series data points were measured for each measurement point. The duration of each time series measurement corresponded to 10 min at full scale. The effective wind pressure at each measurement point was determined by calculating the difference between the external and internal wind pressures. The effective wind pressure time series was then normalized using the reference velocity pressure to calculate the effective wind pressure coefficient time series. The wind tunnel experiment parameters are shown in Table 3. The assumed maximum wind speeds were the local historical record maximum wind speed of 28 m/s and 1.1 times that, resulting in 31 m/s.
Based on the trends in wind pressure coefficients depicted in Figure 11, the following analyses can be inferred.
  • External Wind Pressure Coefficients:
Existing structure: The external wind pressure coefficients ranged from approximately −1 to −3.5, exhibiting large negative values and significant variation.
Circular structure: The range of external wind pressure coefficients narrowed to −1.5 to −0.7, with notably reduced variation.
  • Internal Wind Pressure Coefficients:
Existing structure: The internal wind pressure coefficients were nearly zero, exhibiting minimal variation.
Circular structure: The internal wind pressure coefficients remained close to zero, with further reduced variation.
  • Summary:
Through a comparative analysis of wind pressure coefficient variations between traditional and circular structures, the circular structure exhibited superior stability in managing wind pressure. Both external and internal wind pressure coefficient variations were significantly reduced, contributing to enhanced overall building stability [17,33].

2.5. Impact Analysis

  • Reduced Variation in External Wind Pressure Coefficients:
Compared with the existing structure, the optimized structure displayed smoother edges, resulting in reduced variation in external wind pressure coefficients. This reduction indicated decreased fluctuations in wind loads exerted on the building’s exterior components, including walls, windows, and roofs. As a result, the impact on the building exterior was reduced, and the structural stress and fatigue caused by localized wind pressure were also abated [6,7,10,11,12,13,16,20,21,22,23,24,25,26,28,30,31,32,33].
  • Stability of Internal Wind Pressure Coefficients:
The reduced variation in internal wind pressure coefficients ensures a stable indoor air pressure environment, effectively reducing the stress concentration within the internal structure. This stability contributed to maintaining indoor environmental stability and mitigating internal structural damage.
  • Reduced Effective Wind Pressure Coefficients:
The decrease in effective wind pressure coefficients (the difference between the external and internal wind pressure coefficients) signified a reduced pressure differential across the building’s structure. This reduction is advantageous for overall structural integrity, as lower pressure differentials lessen the total wind load acting on the structure, thereby decreasing the risk of structural deformation and damage.
  • Conclusion:
In summary, the circular structure demonstrated several advantages over the traditional structure based on changes in wind pressure coefficients:
Reduced external wind pressure variation: Decreased impact and stress concentration on the building exterior.
Stable internal air pressure: Maintained indoor environmental stability and mitigated internal structural damage.
Reduced effective wind pressure coefficient: Lowered overall wind load and reduced risk of structural deformation and damage.

2.6. Simplified Load Safety Calculation Formula for Foundation Structures

Table 4 presents findings from a survey on the educational attainment of local residents. Ten respondents from each age group in the area were surveyed regarding their educational attainment. The results showed that, due to recent economic development and educational outreach in Vietnam, more than half of the young population had received at least a secondary school education and could understand basic functional expressions. The Vietnamese middle school mathematics curriculum incorporates functions and basic quadratic functions as part of its teaching content [19,34,35]. This survey provided a reference for streamlining the formulas used in building safety assessments.
Table 5 outlines the definition of each symbol used in the formula according to the optimized foundation construction method. To simplify the formula and calculation process, the load safety assessment of the foundation was divided into the following three sections:
Assessing whether the safety factor of the lower foundation meets the standard.
Assessing whether the safety factor of the upper foundation meets the standard.
Assessing whether the safety factor of the retaining wall’s overturning and sliding resistance meets the standard.
If the evaluation outcomes of the aforementioned three sections meet the standards, it can be preliminarily determined that the building complies with safety standards.
The formula for foundation bearing capacity is based on Terzaghi’s bearing capacity formula [13,35]. Evaluation of the sliding and overturning resistance of the counterfort retaining wall structure incorporates Coulomb’s earth pressure formula [6,34]. To conservatively evaluate building safety, safety factor standards were referenced from the implementation regulations of the Basic Building Law of Japan’s Ministry of Land, Infrastructure, Transport, and Tourism [36]. The safety assessment of foundation bearing capacity primarily relies on the following formulas:
Q u = C × N c + 1 2 γ × B × N γ + γ × D f × N q
N q = K p × e π tan ϕ N c = N q 1 cot ϕ N γ = 2 N q + 1 tan ϕ
C = 0.2 × L L P L ϕ = 28 0.15 P L
K p = 1 sin ϕ 1 + sin ϕ
P a = 1 2 γ × W h 2 × K p
E x = P a × L
Based on the experiments summarized in Table 1, the density and plasticity index of the soil samples were determined. To standardize the parameters, the average soil density was set at 18.5 KN/m3, and the plasticity index was conservatively estimated at 22. Considering the potential variability in soil properties, a conservative estimation approach was adopted. Specifically, for each parameter, the range of values was determined using both the parameters of the sample with the minimum confidence interval (17.2 KN/m3) and the average parameters of all samples. This method ensures that the variability is adequately captured and addressed in the analysis. As a result, the soil cohesion (C) was derived to be in the range of 4.2–4.4 Kpa, and the internal friction angle (φ) was determined to be between 23.35° and 24.7°.
Based on these values, we further derived Kp ≈ 0.41–0.43, Nq ≈ 1.67–1.74, Nγ ≈ 2.3–2.53, and Nc ≈ 1.55–1.61. Consequently, the local foundation safety assessment Formula (2) was simplified to the following Equation (8):
Q u = 7.9462 + 1.978 B , 8.6935 + 2.34 B
Based on the Japanese standard safety factor [36], which stipulates Fs ≥ 2.5, we derived Formula (9) as follows:
Q u Σ n 2.5
Based on the derived formula (Equation (9)) and in accordance with the Vietnamese Land Law, which mandates that the land use coefficient must not exceed 70% of the total residential plot area [40], the parameter for the maximum residential width (B) can be derived. By substituting the value of B into the equation and dividing by the safety factor of 2.5, the ultimate load limit value for the residential land can be obtained. This value is essential for designing building dimensions, structural configurations, and material selections.
As illustrated in Figure 12, which depicts the relationship between ultimate load (Σn), building width (B), and the safety factor, the maximum width of the building plot can be used to determine a safe permanent load combined with a live load. Within this safe load value, decisions regarding the number of floors, structural design, and building materials can be made.
This enabled the derivation of two simplified linear equations for the foundation bearing capacity, thereby notably reducing the complexity involved in analyzing local building safety assessments.
The safety assessment formula for retaining walls is as follows:
K c = 0.35 × N × H i × L S 2 + T γ + W l + D × 0.5 × L × H i E x 1.5
F a = M r M o 1.8
M o = E x × O
O = H × C × S
M r = W 1 × H i 2 + W 2 × H i 2 + Σ N × A S 2 × H i 2

2.6.1. Verification of the Building Safety Evaluation System

According to the simplified Formula (8), we obtained the following:
Qu = [32.27, 37.47] KPa/m2, ∑n/S1/2 = 7.3 KPa/m2.
∑N/S2 = 2.4 KPa/m2. Fs = [4.42, 5.13] > 2.5, Fs = [13.44, 14.36] > 2.5
Thus, it can be concluded that the foundation is capable of bearing the weight of the building.
Verification of Sliding Resistance of the Counterfort Retaining Wall:
Using Formulas (6) and (7), and the parameters mentioned in Table 6, we derived the following:
Pa = [40.7, 43.84]
Ex = [725.75, 767.22]
Tγ = [1659, 1784] KN,
The mass of the structure on the heel slab was 22.6 KN, and the mass of the foundation on the heel slab was 1345.56 KN, W1 = 946.56. Using Formula (10), we calculated Kc = [1.87, 2.44] > 1.5

2.6.2. Verification of Sliding and Overturning

Substituting the parameters in Table 6 into Formulas (12) and (13), we obtained the following results: O = 1.19 m, Mo = 913 KN, Mr = 2910.95, Fa = 3.19 > 1.8.
Therefore, it can be concluded that the counterfort retaining wall meets the safety requirements for both sliding and overturning resistance.

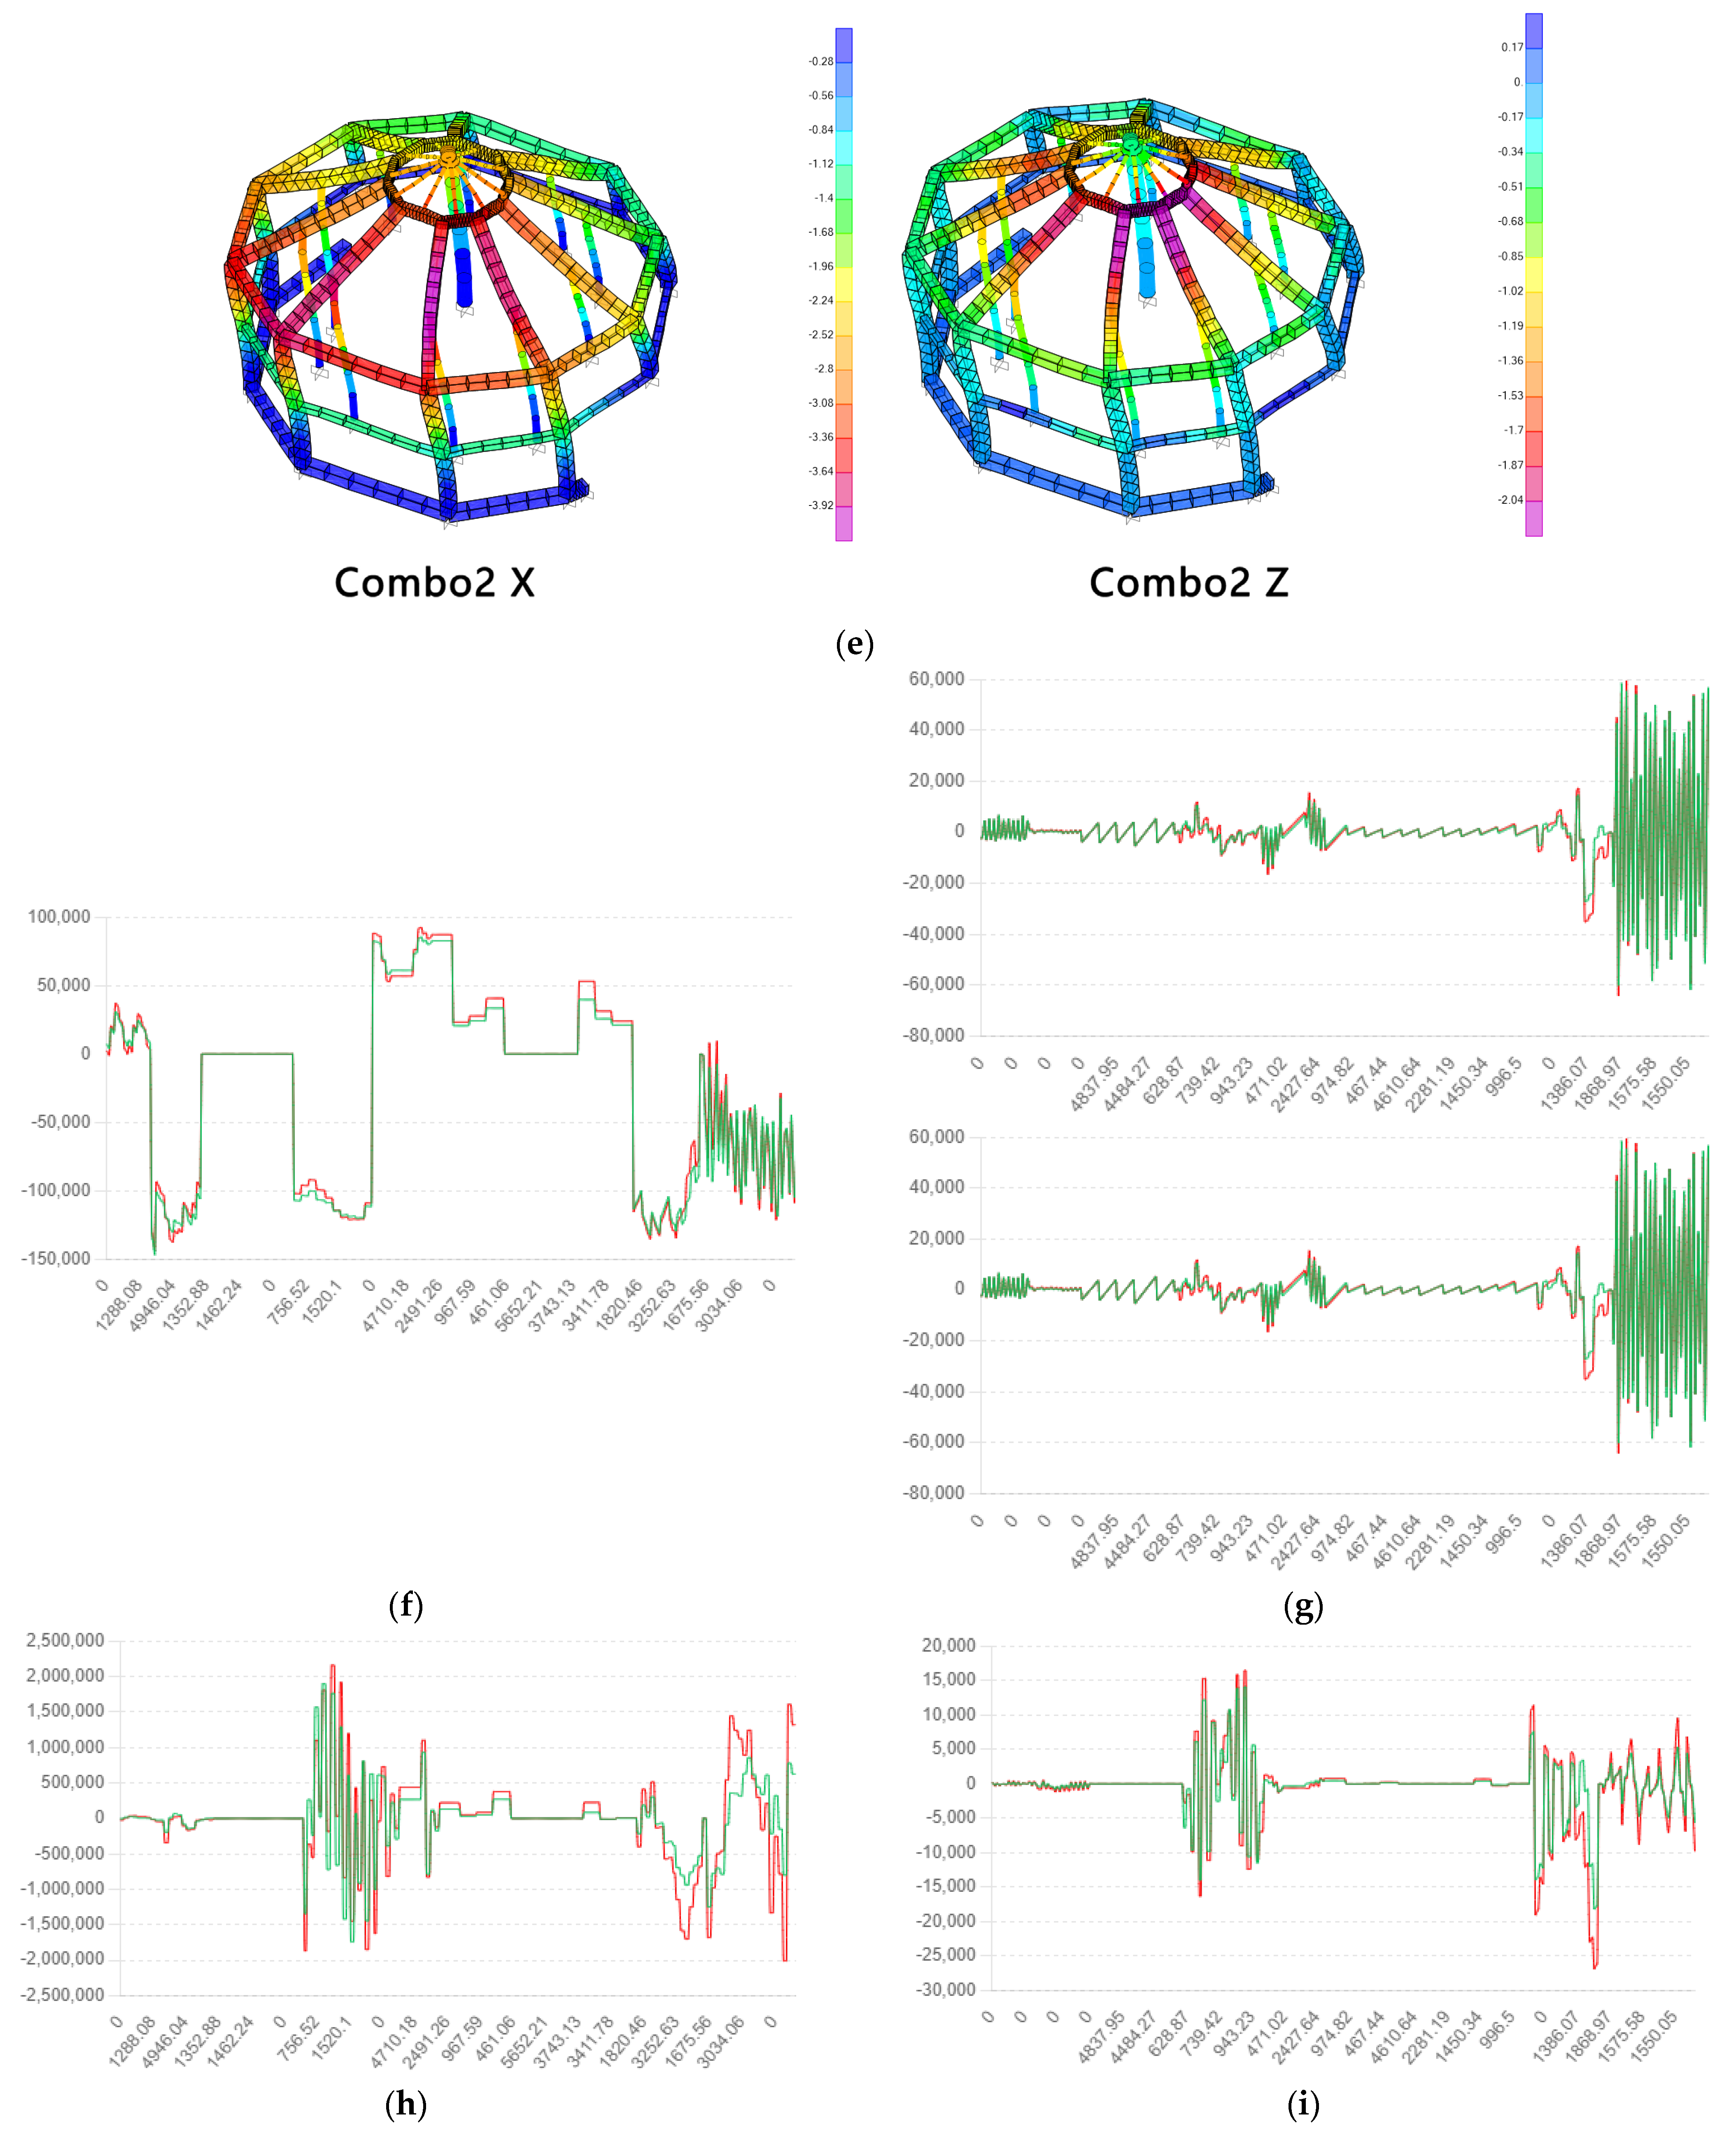
2.7. Comprehensive Load Analysis

To further validate the stability of the optimized foundation and structure and to simulate the actual renovation effects, SAP2000 finite element analysis software was introduced for modeling. The structural model is depicted in Figure 13.
The structural model was subjected to fixed constraints at the bottom of the columns, as illustrated in Figure 13b. For conservative analysis, the load conditions included the self-weight of the structure, a dead load of 0.85 kN/m2 required for important places, a live load of 5 kN/m2, and a wind load of 0.4802 kN/m2, applied according to the local coordinate system. The live load on non-pedestrian roofs was set to 0.5 kN/m2.
Combo1: 1.3 times the dead load + 1.5 times the live load + 0.9 times the wind load.
Combo2: 1.3 times the dead load + 1.05 times the live load + 1.5 times the wind load.
The wind load was simulated at a 45-degree angle, as shown in Figure 13c.
Since this design is for a facility where local villagers work together, hold events, and store harvested grain, the extreme load simulation analysis will consider two load combinations: the live load generated by large quantities of harvest stored in the building or large-scale events during the harvest season, and the wind load generated during extreme weather conditions in the summer.
Based on the analysis results under the above conditions, the analysis yielded the following horizontal and vertical deformations:
The horizontal deformation for Combo1 was 2.38 mm, and the vertical deformation was 2.21 mm.
The horizontal deformation for Combo2 was 3.92 mm, and the vertical deformation was 2.04 mm.
These findings further confirmed the stability and effectiveness of the optimized foundation and structural design.
In Figure 13d and e illustrate the displacements in the X and Z directions of the building under different load combinations, and f, g, h, and I represent different lengths of structural elements in the building subjected to axial force (P N), shear force V2, shear force V3, and torque (T N mm), respectively.
X-axis: Represents the different measurement points along the structure.
Y-axis: Represents the force (N) at each measurement point under Combo1 (1.3 times the dead load + 1.5 times the live load + 0.9 times the wind load).
X-axis: Represents the different measurement points along the structure.
Y-axis: Represents the force (N) at each measurement point under Combo1.
X-axis: Represents the different measurement points along the structure.
Y-axis: Represents the force (N) at each measurement point under Combo2 (1.3 times the dead load + 1.05 times the live load + 1.5 times the wind load).
X-axis: Represents the different measurement points along the structure.
Y-axis: Represents the force (N) at each measurement point under Combo2.
According to the Japanese Agricultural Standard JAS 0600-2 [41] and the Vietnamese standard 1350FB-1 [9,19,20,22,23,24,25,26,27,28,29,30,31,32,33,34,35,36,37,41] for Vietnamese cedar, the primary load-bearing elements of the building have a cross-sectional area of 0.25 m2. Based on the calculation results, the following conclusions can be drawn:
Axial stress: The axial stress (0.088 MPa) was significantly lower than the compressive strength of the timber used (22–30 MPa×0.25 m2), indicating that it will not cause compressive failure.
Shear stress: The shear stress (0.018 MPa) was much lower than the shear strength of the timber used (4–6 MPa×0.25 m2), suggesting that it will not cause shear failure.
Torque stress: The torque stress (0.0393 MPa) was much lower than the bending strength of the timber used (50–70 MPa×0.25 m2), denoting that it will not cause torque failure. Therefore, Vietnamese cedar with a cross-sectional area of 0.25 m2 will not fail under the applied forces and moments.
According to the “Wooden Building Standards Act” [41] and the “Building Standards Law Enforcement Order” [36], for wooden structures, the overall horizontal displacement must be within 10 mm to ensure safety under seismic and wind loads. Typically, the design requires that the horizontal displacement of a building does not exceed 1% to 2% of the building’s height.
Based on the analysis results in Figure 12 and adherence to Japanese standards, the structural design was deemed safe. Thus, it can be inferred that this structure would also be considered safe in Northern Vietnam, where typhoons are infrequent and seismic hazards are absent.
Under local climatic conditions, designing the roof on the windward side to be lower than the leeward side can enhance the building’s wind resistance and reduce the deformation caused by wind loads.

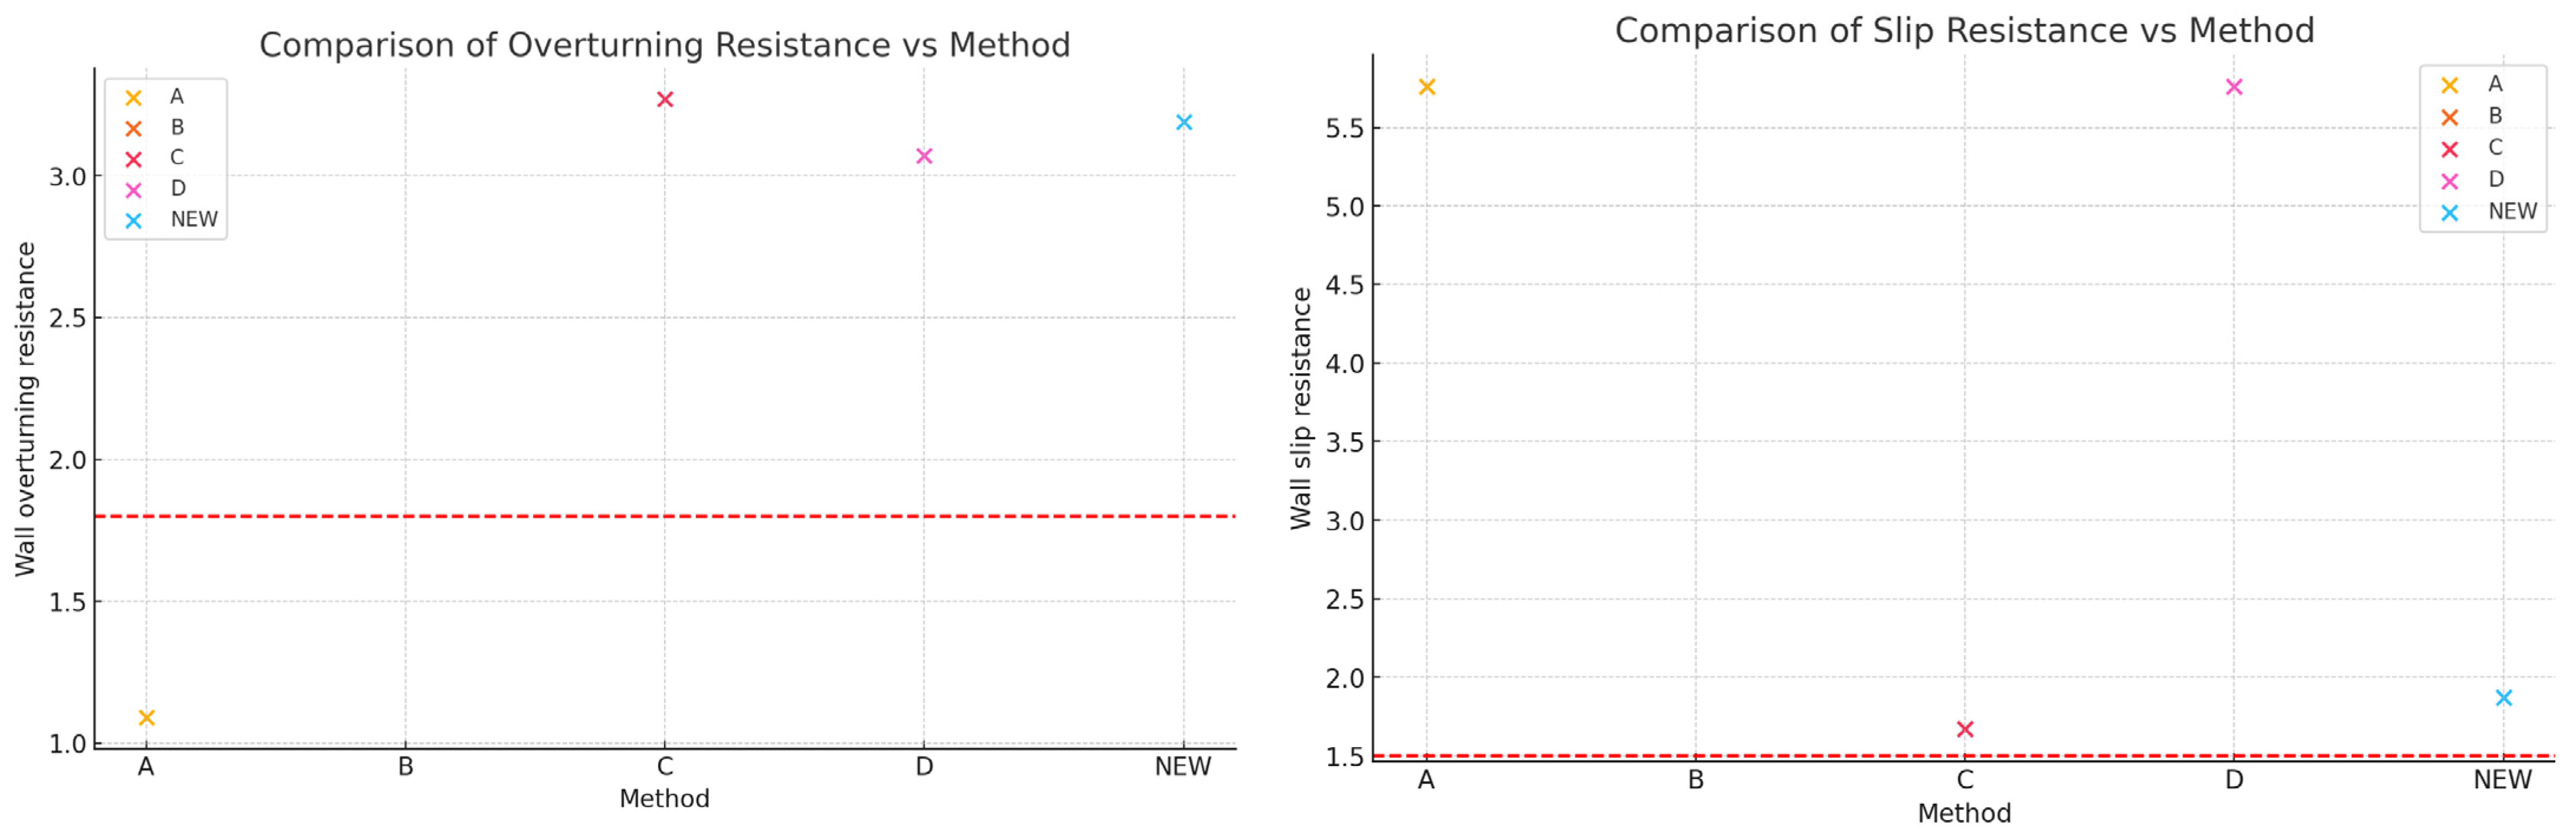
2.8. Comparison with Reference Construction Methods

Table 7 compares the four construction methods (a, b, c, and d) exhibited in Figure 7 with the optimized method under the conditions in Figure 6. Under the condition that the building structures are identical across the five methods, different foundation construction methods were compared to verify whether the new method achieves the highest overall performance in the local context. The comparison is based on cost-effectiveness, safety, and the cost per unit foundation area relative to the constructed building area.
MethodA references the construction method shown in Figure 7a, where only the necessary building area is leveled before constructing the building structure. Since the building has a circular structure, the walls resisting earth pressure function similarly to an arch dam. The arch-shaped structure better distributes earth pressure, thereby enhancing anti-sliding and anti-overturning properties, which in turn improves disaster resistance [42].
MethodB references the construction method shown in Figure 7b, which utilizes cement-stabilized soil technology, where the weak load-bearing hard clay is excavated and replaced with stronger load-bearing cement, filling it up to the level of the highest point of the building site. By enhancing the disaster resistance of the foundation, this method improves the overall disaster resistance of the building [43].
MethodC references the construction method shown in Figure 7c, where the entire building site is leveled before constructing the foundation and building structure. To prevent damage from debris flows, an L-shaped retaining wall is designed at the rear of the building site, where there is a height difference with the hillside.
MethodD references the construction method shown in Figure 7d, where disaster resistance is improved by enhancing the material strength of the building itself. Cement shear walls are installed between the columns to strengthen the structural integrity, prevent collapse mechanisms, and improve the distribution of the building’s center of gravity and mass. This, in turn, increases the building’s anti-overturning capability and seismic resistance [44].
The safety factor for foundation bearing capacity was calculated using Formula (9).
The overturning resistance of the walls functioning as retaining walls was evaluated using Formula (11).
For Method C, which employs L-shaped retaining walls, the sliding resistance safety factor was calculated using Formula (15).
The parameters for the retaining walls and foundation are detailed in Table 6. Equation (15) is as follows:
K c = Σ n × tan ϕ E x
Table 7 compares the performance, cost, and material utilization of buildings constructed using the optimized foundation method and the reference construction methods under identical conditions. Figure 14 illustrates the comparison of anti-slip coefficients and anti-overturning coefficients for various structural methods. The safety standard is denoted by the red line.
  • Characteristics of Each Method:
Method A:
Application: Designed for constructing high-rise buildings on urban slopes, requiring highly stable surrounding soil.
Drawbacks: The building would face soil pressure from three sides, and the wall height, designed to function as a retaining wall, would be insufficient, resulting in overturning resistance below the standard threshold.
Method B:
Application: Compensates for height differences in sloped areas by building up the foundation, which must bear the soil pressure.
Drawbacks: High costs for foundation construction and excessive resistance to seismic and soil pressure.
Method C:
Application: Utilizes L-shaped retaining walls, suitable for scenarios requiring high slip resistance.
Drawbacks: Significant costs for excavation and foundation construction, making the construction expenses 755.65 units higher than the optimized method.
Method D:
Application: Reinforces the first-floor structure to enhance seismic resistance.
Drawbacks: Overperformance in seismic resistance not necessary for local buildings, resulting in low material-to-building area efficiency and unnecessary costs.
Method NEW:
Advantages: Prioritizes cost-effective foundation construction and material utilization while ensuring building safety.
Advantages of the optimized foundation construction method:
The optimized foundation construction method proposed in this study prioritized cost-effective foundation construction and material utilization while ensuring building safety. Compared with the four construction methods (A, B, C, and D), the optimized approach attenuated performance overshoot for the local environment, converting these excesses into cost savings while marginally sacrificing building area. This improved the ratio of building area to materials used.
  • Cost Analysis:
Excavation cost:
Method NEW and Method B exhibited the lowest excavation costs, both at 731.85 cubic meters.
Method C showed the highest excavation cost at 1497.5 cubic meters.
Foundation and wall volume:
Method B recorded the highest foundation and wall volume at 947.1 cubic meters.
Methods C and NEW displayed the lowest foundation and wall volumes, at 245 cubic meters and 245.94 cubic meters, respectively.
Construction area:
Methods A, B, C, and D all had construction areas of 402 square meters.
Method NEW boasted the smallest construction area at 304 square meters.
Material utilization efficiency:
Method C achieved the highest ratio of unit building area to unit foundation volume at 1.64.
Method B exhibited the lowest ratio of unit building area to unit foundation volume at 0.692.
Method NEW achieved a ratio of unit building area to unit foundation volume of 1.236.
Method NEW achieved the highest ratio of construction area to excavation volume at 0.415.
Method C displayed the lowest ratio of construction area to excavation volume at 0.27.
Building Maintenance Costs
Given that the main structure of the building is wooden, the maintenance differences primarily arise in the upkeep of the concrete structural walls. The maintenance of concrete structures involves regular inspections for cracks, corrosion, and spalling, as well as vegetation management and drainage checks. As compared with methods C and D, where the concrete structural walls and retaining walls are fully exposed, the new method places the walls indoors as part of the building. This setting reduces the rate of environmental erosion relative to methods C and D and eliminates the need for regular cleaning of moss and vegetation growing on the walls and around the corners. Consequently, all maintenance costs and the difficulty of the new method are the lowest among the feasible options.
PSO Algorithm Analysis
Based on Table 7, the optimal design direction for local building structures can be preliminarily identified. The key criteria include ensuring that both the anti-sliding coefficient and the anti-overturning coefficient exceed the safety threshold, and that the unit building material and unit excavation volume yield as much building area as possible. Under the same set of requirements, an economically optimal design can be determined if a solution produces more building area with lower construction costs while maintaining safety.
Following this logic and Table 8’s parameters, a four-dimensional space can be constructed, with each axis representing the anti-overturning coefficient, the anti-sliding coefficient, the ratio of unit building area to unit foundation volume, and the ratio of construction area to excavation volume, respectively. Each design solution can be visualized as a particle within this space, with its coordinates determined by the calculated values of these coefficients. A global optimum region is then defined within this space at the coordinates (1.5, 1.8, Rfv > 0, Rev > 0) [15]. If a particle enters this optimum region, the iteration process should first focus on adjusting the anti-overturning and anti-sliding coefficients, striving to bring them as close as possible to 1.5 and 1.8, respectively, thereby reducing functional overshoot. Subsequently, the iterations should target the ratio of unit building area to unit foundation volume and the ratio of construction area to excavation volume to maximize economic efficiency while ensuring safety.
From this, we can derive the function for the following Equation (16):
f(x) = x3 + x4 − [max (0, 1.8 − x1) + max (0, 1.5 − x2)]
where x1 represents the anti-sliding coefficient, x2 represents the anti-overturning coefficient, x3 represents the ratio of unit building area to unit foundation volume, and x4 represents the ratio of building area to excavation volume.
The terms MAXf(x)(0, 1.8 − x1) and MAXf(x)(0, 1.5 − x2) serve as penalty functions, representing the deviation from the target region when the coefficients do not meet the specified thresholds.
The fitness function f(x)f(x)f(x) integrates the maximization of the target parameters with the degree of compliance to the defined region, thereby driving the optimization process towards solutions that satisfy all specified conditions.
Equation (17) represents the velocity update formula for the particle.
Vit = ω × Vik + C1 × γ1 × (pit − xit) + C2 × γ2 × (gt − xit)
Since the coefficient values of the solutions are all less than 10, the position limit is set to [0, 10] to control the range. Given that the coefficients are accurate to two decimal places, the initial velocity is set to [−0.1, 1] to allow particles to more precisely approach the global optimal region. If a particle’s distance from the global optimal region is less than 0.5, the velocity is further restricted to [−0.2, 0.2]. The five schemes from Table 7 are then treated as particles, with the four coefficients representing their coordinates in the space. (Since Method 2 uses concrete to fill the height difference of the building site, its anti-sliding and anti-overturning coefficients are set to the maximum value of 10 in the space.) The PSO algorithm is then applied to run the optimization.
Figure 15 shows the fitness trend chart generated by the PSO algorithm execution. To ensure accurate results, the program was run six times. The path curve results indicate that methods 1,2, and 4 require more than 40 iterations to approach the global optimal region and stabilize, whereas methods 3 and 5 only need fewer than 20 iterations to reach the global optimal region. Among the six program runs, Method 5 consistently found the direction of the global optimal solution more rapidly than Method 3 and surpassed Method 3’s curve after 10–15 iterations, stabilizing shortly thereafter. This further demonstrates the rationality of the optimized scheme based on local conditions.
Comprehensive Construction Cost Summary:
Method A: Despite high excavation costs and a relatively large foundation and wall volume, it failed to meet overturning resistance standards and demonstrated relatively low material utilization efficiency.
Method B: While it features low excavation costs, it suffered from excessively large foundation and wall volumes, resulting in the lowest material utilization efficiency among the methods.
Method C: With the highest excavation costs, Method C met both overturning and slip resistance standards and boasted the highest material utilization efficiency but incurred high construction expenses.
Method D: Method D entailed high excavation costs, as well as moderate foundation and wall volume. It met both overturning and slip resistance standards with high material utilization efficiency.
Method NEW: Method NEW exhibited the lowest excavation and foundation construction costs, surpassed safety standards for both overturning and slip resistance, demonstrated high material utilization efficiency, and represented the best overall economic efficiency.
  • Conclusion:
Method NEW performed the best in terms of comprehensive construction costs, with the lowest excavation and foundation construction costs. It also exceeded safety standards for both overturning and slip resistance and exhibited high material utilization efficiency. Therefore, Method NEW emerges as the optimal choice, displaying exceptional performance across all evaluated aspects.

3. Results

3.1. Findings

This study conducted a preliminary investigation into building conditions in developing countries in Southeast Asia, focusing on Tan Lap District, Luc Yen City, Yen Bai Province, Vietnam. The main findings are as follow.
Building Design and Disaster Resistance:
In Southeast Asia, excluding Singapore, many regions remain underdeveloped, relying on traditional practices or foreign standards that may not consider local disasters, terrain, and structural strength factors. The optimized building structural design significantly enhanced disaster resistance, particularly against wind and landslides.
Building Costs and Efficiency:
Despite the annual improvement in urban construction due to industrial transfers from Western, Japanese, and American companies to Southeast Asian developing countries [41], rural areas continue to face challenges, such as poor infrastructure, limited adoption of new technologies, and low educational levels among the population. These factors contribute to rough foundation construction and low construction efficiency, resulting in compromised disaster resistance and high construction costs. The optimized design and simplified evaluation methods introduced in this study effectively lowered construction costs and improved efficiency.
Soil and Foundation Analysis:
Soil sample analysis unveiled the prevalence of high plasticity clay in the local soil, which is prone to landslides during heavy rainfall. The redesigned foundation construction method improved landslide resistance and economic efficiency by employing straightforward structural calculations, thereby avoiding the performance overshoot associated with other methods.

3.2. Observations

During the course of the study, the following observations were noted,
Vulnerability of Traditional Buildings:
Non-engineered buildings suffered severe damage from wind and landslides, displaying structural fragility and poor disaster resistance.
Soil Characteristics:
Soil samples presented with high plasticity clay properties, making them prone to landslides during heavy rains, thus posing a threat to building safety.
Trends in Local Residents’ Education Levels and Their Understanding of Simplified Safety Assessment Methods:
Although the overall educational level of local residents is generally low, there is an increasing trend among the younger generation (under 35 years old) of receiving at least a junior high school education. This observation suggests that through the utilization of local soil properties and experimental data, the parameters in the building safety evaluation formulas can be converted into constant values, simplifying the formulas to a level that can be understood by those with a high school education or less for preliminary safety assessments.
To facilitate local residents’ understanding of safety value assessment principles, a visual function graph (Figure 11) was created based on Equation (9). This graph illustrates the correlation between safety values, building design width, and load, with the safety factor represented by colors.
After the purpose and usage of this chart were explained to villagers with at least a middle school education, they can use the land size information from their Vietnamese rural residential land use right certificates to identify the safe load range for their residential plots within the chart and perform necessary calculations. They can also elucidate the principles of building safety assessment to others.
Thus, through this visual chart, residents can more intuitively find the safe load range for their building plots and better understand the method of residential land safety assessment. This chart not only helps local residents comprehend the principles of foundation load safety assessment for local residences but also assists in the structural design and material selection for residential buildings, thereby making local residential design more efficient.
Construction Experience from Developed Countries:
The construction methods from Japan, which frequently experiences wind and landslide disasters, can serve as important references for local building design. However, given Japan’s seismic activity, seismic performance remains a primary focus in their construction methods. Directly importing Japanese methods to the local context may lead to significant performance overshoot.

3.3. Conclusions

Based on the findings and observations from the optimized design of the foundation to the building structure, the following conclusions were drawn:
Improved disaster resistance: The optimized building structural design significantly enhances the ability of buildings to withstand wind loads and landslide disasters. This improvement ensures greater stability and safety, particularly under extreme climatic conditions.
Reduced construction costs: Through the optimization of foundation construction methods, the utilization of cost-effective materials, and the elimination of unnecessary construction costs, overall construction costs are effectively minimized while construction efficiency is enhanced.
Simplified evaluation methods: A simplified building safety evaluation system was developed based on the educational level of local residents. This enables individuals with a high school education or less to conduct preliminary safety assessments, fostering greater community participation and self-awareness. Moreover, it can be adapted for the renovation of other non-engineered buildings within the village.
Customized design: Tailored structural solutions and safety evaluation algorithms were proposed based on local climate, terrain, soil, and geological disaster factors. This provided a reference for building renovation processes and models that can be applied to similar regions in other developing countries.
In summary, systematic building safety evaluations and optimized designs can significantly improve the disaster resistance of buildings in Tan Lap District, ensuring the safety and stability of the structures. This study not only filled the theoretical gap in building structure optimization and safety evaluation in developing countries, but also provided practical references for improving building safety and construction efficiency.

4. Discussion

4.1. Summary of Findings

This study developed optimized structural designs and safety assessment methods tailored for developing countries, specifically in Southeast Asia. The main findings are summarized as follows:
Structural design and disaster resistance: The optimized building structures demonstrated substantial improvements in resisting wind and landslide disasters. Wind tunnel experiments and finite element analysis revealed reduced deformation under wind pressure and load conditions.
Cost and efficiency: The new design methods and simplified evaluation systems effectively lowered construction costs and improved construction efficiency, which is particularly crucial for rural areas in developing countries with poor infrastructure and limited resources.
Soil and foundation analysis: Soil sample analysis identified the prevalence of high plasticity clay in the local soil, making it susceptible to landslides during heavy rainfall. The new foundation construction methods, including the use of retaining walls and simplified structural calculations, markedly improved landslide resistance and economic efficiency.

4.2. Consistency with Existing Research

The findings of this study are consistent with other research in structural engineering and disaster resistance. For example, Tamura et al. demonstrated that modifications to building corners can significantly mitigate wind loads, supporting this study’s conclusion that optimized building designs exhibit enhanced stability under wind conditions [3,4,5,6,7,9,10,11,12,13,16,19,20,21,22,23,24,25,26,27,28,29,30,31,32,33,34,35,36,37,41,45,46]. Similarly, Mandal et al. pointed out that rounded corners perform well in reducing wind resistance and lift [17], which corresponds with the optimization results in this study.
Moreover, using retaining walls to enhance slope stability is a common strategy in geotechnical engineering. Numerous studies emphasize the importance of integrating factors, such as soil properties, soil pressure, slope stability, design loads, and seismic considerations, into retaining wall design. For instance, RetainPro elaborates on the need to integrate these factors to ensure stability and durability [47].
This study primarily focuses on the optimization of local building structures and construction methods, which are based on the actual public facility construction project in the region. As described in the finite element analysis section, the main purpose of the project is to provide local residents with a venue for communal activities and collaborative workspaces. Beyond the engineering considerations of optimizing building structures, from a sociological perspective, the construction of public activity facilities plays a crucial role in providing a space for residents engaged in various industries to interact, thereby maintaining social cohesion within the community. This is consistent with the emphasis by Nostikasari et al. (2018) [48] on the critical role of community feedback in addressing transportation and infrastructure issues, particularly in enhancing community connectivity and safety. It also aligns with the challenges observed in Northern Vietnam, where inadequate infrastructural planning has adversely affected community cohesion.

4.3. Contributions to the Field

Customized solutions for developing countries: The study proposed practical solutions tailored to the specific needs and constraints of rural areas in developing countries. considering local materials, educational levels, and environmental conditions. These solutions were crafted with considerations for local materials, educational levels, and environmental conditions, offering a more pragmatic approach compared with the direct importation of foreign standards and technologies without adaptation.
Simplified safety assessment methods: Through the development of streamlined safety assessment formulas, the study facilitated people with basic educational backgrounds to understand and apply these formulas for building safety assessments, and increased community participation and self-awareness.

4.4. Taking into Consideration the Impact of Future Extreme Weather Events in the Design

Due to the dramatic climate changes in recent years, the frequency of strong typhoons in the South China Sea region has increased significantly. This escalation poses severe climate challenges for the countries surrounding the South China Sea [8]. Therefore, future building designs must not only incorporate reinforced structural elements but must also consider the recent typhoon trajectories. For instance, in this design, the recent typhoons passing through Northern Vietnam have typically made landfall from the southeastern South China Sea region, resulting in southeastern wind directions in the affected areas. Based on this information and inspired by the concept of tilting an umbrella to withstand wind pressure during rain, we designed a building structure with enhanced wind resistance. Therefore, it is essential for future designs to thoroughly understand the characteristics of current extreme weather and to take proactive measures to anticipate even more severe climatic conditions.

4.5. Limitations

Despite significant progress, this study has certain limitations.
Generalizability: The research was conducted under specific conditions in Yen Bai Province, Vietnam. While the principles can be adapted to similar regions, further studies are needed to validate their applicability in different environments and socioeconomic contexts or to extend the solution’s applicability to broader regions [18].
Educational level survey: The simplified safety assessment methods were tailored to the educational level of the local population. In regions with lower educational attainment, additional training or further simplification may be necessary. Developing a visual operating system could ensure the effective implementation of these methods.
Resource constraints: Implementing the optimized design and construction methods requires initial investment in materials and training, which can be challenging in resource- constrained environments. Future research should explore strategies to promote these solutions more economically.
In this study, the PSO algorithm was used to verify the optimized foundation construction method. However, the PSO algorithm has certain limitations, specifically: it requires a specific value or range of values to define the global optimal solution, thereby guiding the design in the correct direction [15]. If the design of the building is further refined, it will not only involve fixed values but will also be influenced by local traditions and religious factors. Additionally, adjustments to local government land policies may also become a variable in the design process.

4.6. Future Research Directions

Future research should focus on the following areas.
Adapting methods to different regions: It is important to conduct similar studies in various geographical and cultural contexts to refine and validate the generalizability of the findings [18].
Long-term monitoring and evaluation: It is important to etablish long-term monitoring of implemented structures to assess their performance under different environmental conditions.
Enhancing community engagement: It is important to develop comprehensive training programs to empower local communities in effectively applying safety assessment methods and construction techniques.
Addressing these areas will further enhance the safety and disaster resilience of buildings in developing countries, building upon the foundation laid by this study.
A more scientific algorithm: In future research, efforts will be made to optimize the algorithm to more comprehensively guide building design and evaluate design schemes for local mountainous terrain.
Exploring lower-cost construction methods for debris flow mitigation: Field investigations revealed that in the local area, the mineral content of soil near water bodies is higher than that of the hard clay found in mountainous regions. Geological studies of Luc Yen District in Yen Bai Province also confirm that due to the region’s proximity to mining areas, the soil near water bodies has a higher mineral content [49]. Therefore, it can be inferred that soil near water bodies is denser and has a larger friction angle. By mixing the hard clay from the mountains with the mineral-rich soil from near the water and compacting it, followed by mechanical stabilization [50], the soil’s load-bearing capacity would increase due to the higher density. This would also improve the soil’s drainage performance, all at a relatively low cost. As a result, more cost-effective construction methods beyond just counterfort retaining walls can be employed, further optimizing the construction approach.

Author Contributions

Conceptualization: H.Z. and Y.L. Methodology: H.Z. Software: H.Z. Validation: H.Z. and Y.L. Formal analysis: H.Z. Investigation: H.Z. Resources: H.Z. and Y.L. Data curation: H.Z. and Y.L. Writing-original draft preparation: H.Z. Writing-review and editing: Y.L. and S.K. Visualization: H.Z. and Y.L. Supervision: S.K. Project administration: S.K. Funding acquisition: H.Z. All authors have read and agreed to the published version of the manuscript.

Funding

This research received no external funding.

Data Availability Statement

The raw data supporting the conclusions of this article will be made available by the authors on request.

Conflicts of Interest

The authors declare that there are no conflicts of interest regarding the publication of this paper.

References

  1. Garg, S.; Misra, S. Causal Model for Rework in Building Construction for Developing Countries. J. Build. Eng. 2021, 43, 103180. [Google Scholar] [CrossRef]
  2. Thi Huong, L.V.; Quoc, B.T. Renovation of the Forgotten Ruins and Urban Public Spaces in Sapa Town, Vietnam for Sustainable Development. IJSCET 2021, 12, 17. [Google Scholar] [CrossRef]
  3. Yap, J.B.H.; Low, P.L.; Wang, C. Rework in Malaysian Building Construction: Impacts, Causes and Potential Solutions. JEDT 2017, 15, 591–618. [Google Scholar] [CrossRef]
  4. Nishijima, K. Housing Resilience to Wind-Induced Damage in Developing Countries. In Climate Adaptation Engineering; Elsevier: Amsterdam, The Netherlands, 2019; pp. 301–327. ISBN 978-0-12-816782-3. [Google Scholar]
  5. Poulos, H.G. Sven Hansbo Lecture: Deep Foundation Design—Issues, Procedures and Inadequacies. In Geotechnics for Sustainable Infrastructure Development; Duc Long, P., Dung, N.T., Eds.; Lecture Notes in Civil Engineering; Springer Singapore: Singapore, 2020; Volume 62, pp. 3–26. ISBN 9789811521836. [Google Scholar]
  6. Xiang, X.; Zi-Hang, D. Numerical Implementation of a Modified Mohr–Coulomb Model and Its Application in Slope Stability Analysis. J. Mod. Transport. 2017, 25, 40–51. [Google Scholar] [CrossRef]
  7. Rajabi, M.S.; Radzi, A.R.; Rezaeiashtiani, M.; Famili, A.; Rashidi, M.E.; Rahman, R.A. Key Assessment Criteria for Organizational BIM Capabilities: A Cross-Regional Study. Buildings 2022, 12, 1013. [Google Scholar] [CrossRef]
  8. Qin, W.; Cai, Y.; He, L. The Relationship between the Typhoons Affecting South China and the Pacific Decadal Oscillation. Atmosphere 2024, 15, 285. [Google Scholar] [CrossRef]
  9. Kawasaki City Imposes Regulations on Basement Buildings on Sloped Land. Available online: https://www.city.kawasaki.jp/500/page/0000017846.html (accessed on 27 June 2023).
  10. Lo, V.P. The Challenges of Rural Students in Vietnam towards Higher Education. IJTE 2022, 2, 225–237. [Google Scholar] [CrossRef]
  11. Sharma, B.; Bora, P.K. Plastic Limit, Liquid Limit and Undrained Shear Strength of Soil—Reappraisal. J. Geotech. Geoenviron. Eng. 2003, 129, 774–777. [Google Scholar] [CrossRef]
  12. Zhang, M. Comparative analysis on liquid limit and plastic test methods of different standard. Shanxi Architecture. 2010, 36, 78–79. [Google Scholar]
  13. Pantelidis, L. Bearing Capacity of Shallow Foundations: A Focus on the Depth Factors in Combination with the Respective N-Factors. Arab. J. Geosci. 2024, 17, 169. [Google Scholar] [CrossRef]
  14. Wei, L.I.; Chen, G.J. Finite Element Analysis on Buttressed Retaining Wall. Transp. Stand. 2011, 19, 4. [Google Scholar] [CrossRef]
  15. Modiri, A.; Gu, X.; Hagan, A.; Bland, R.; Iyengar, P.; Timmerman, R.; Sawant, A. Inverse 4D Conformal Planning for Lung SBRT Using Particle Swarm Optimization. Phys. Med. Biol. 2016, 61, 6181–6202. [Google Scholar] [CrossRef]
  16. Khuc, T.D.; Truong, X.Q.; Tran, V.A.; Bui, D.Q.; Bui, D.P.; Ha, H.; Tran, T.H.M.; Pham, T.T.T.; Yordanov, V. Comparison of Multi-Criteria Decision Making, Statistics, and Machine Learning Models for Landslide Susceptibility Mapping in Van Yen District, Yen Bai Province, Vietnam. IJG 2023, 19, 33–45. [Google Scholar] [CrossRef]
  17. Tse, K.T.; Hu, G.; Song, J.; Park, H.S.; Kim, B. Effects of Corner Modifications on Wind Loads and Local Pressures on Walls of Tall Buildings. Build. Simul. 2021, 14, 1109–1126. [Google Scholar] [CrossRef]
  18. Konstandakopoulou, F.; Tsimirika, M.; Pnevmatikos, N.; Hatzigeorgiou, G.D. Optimization of Reinforced Concrete Retaining Walls Designed According to European Provisions. Infrastructures 2020, 5, 46. [Google Scholar] [CrossRef]
  19. Do, D. Mathematics teaching and learning in Vietnam. Int. J. Learn. Teach. Educ. Res. 2020, 19, 255–275. [Google Scholar]
  20. Global Wind Atlas. Available online: www.globalwindatlas.info/en (accessed on 2 June 2024).
  21. Yen, N.T.H.; Hop, N.T.; Thanh, T.H.; Phuong, N.V.; Chien, N.T.H.; Linh, B.K.; Dung, D.T. Detection of Ascaris Suum in the Livers of Chickens Infected Naturally by the Nested Multiplex PCR Assay. VJAS 2020, 3, 606–611. [Google Scholar] [CrossRef]
  22. Vietnam Television; Voice of Vietnam Radio The Prime Minister of Vietnam Issued a Notice to Guide the Prevention and Response of Heavy Rain and Flood Disasters. Available online: https://cn.baochinhphu.vn/ (accessed on 29 June 2024).
  23. Nguyen, H.M. Lessons Learned from Traditional Vietnam Northern Lowland Habitation. ajE-Bs 2018, 3, 57–64. [Google Scholar] [CrossRef]
  24. Hung, T.Q.; Mizoguchi, M.; Takase, Y. Strengthening Effect of the Fixing Method of Polypropylene Band on Unreinforced Brick Masonry in Flexural, Shear, and Torsion Behaviors. Buildings 2023, 13, 2863. [Google Scholar] [CrossRef]
  25. Huang, W.; Chan, J.C.L.; Wang, S. A Planetary-scale Land–Sea Breeze Circulation in East Asia and the Western North Pacific. Quart. J. R. Meteoro. Soc. 2010, 136, 1543–1553. [Google Scholar] [CrossRef]
  26. Vardanega, P.J.; Haigh, S.K.; O’Kelly, B.C.; Zhang, X.; Liu, X.; Chen, C.; Wang, G. Use of Fall-Cone Flow Index for Soil Classification: A New Plasticity Chart. Géotechnique 2023, 73, 648–654. [Google Scholar] [CrossRef]
  27. Matsumoto, J.; Fujibe, F.; Takahashi, H. Urban Climate in the Tokyo Metropolitan Area in Japan. J. Environ. Sci. 2017, 59, 54–62. [Google Scholar] [CrossRef]
  28. The Building Center of Japan (BCJ) The Building Standard Law of Japan. Available online: https://www.bcj.or.jp/upload/international/baseline/BSLIntroduction201307_e.pdf (accessed on 23 June 2024).
  29. Law No. 211 of 1950 Building Standards Law. Available online: https://elaws.e-gov.go.jp/document?lawid=325AC0000000201_20240619_506AC0000000053 (accessed on 19 May 2024).
  30. Kashani, A.R.; Gandomi, M.; Camp, C.V.; Gandomi, A.H. Optimum Design of Shallow Foundation Using Evolutionary Algorithms. Soft Comput. 2020, 24, 6809–6833. [Google Scholar] [CrossRef]
  31. Tuhta, S.; Günday, F. Structural Performance Evaluation of RC Retaining Wall Strengthened with Counterfort. In Proceedings of the Proceeding Book of 2nd International Conference on Contemporary Academic Research ICCAR 2023, Konya, Turkey, 4–5 November 2023; All Sciences Academy: Konya, Turkey. [Google Scholar]
  32. Zeng, Y.; Hu, W.; Chen, M.; Zhang, Y.; Liu, X.; Zhu, X. Study on the Failure Characteristics of Sliding Surface and Stability Analysis of Inverted T-Type Retaining Wall in Active Limit State. PLoS ONE 2024, 19, e0298337. [Google Scholar] [CrossRef] [PubMed]
  33. Jha, A.K.; Sinha, A.; Raj, R. Effect of Wind Loads on Low-Rise Pitched and Circular Arch Roof Structures: A Comparative Study Based on Numerical Simulation. CEA 2022, 10, 1129–1141. [Google Scholar] [CrossRef]
  34. Kumar, R.; Bhargava, K.; Choudhury, D. Estimation of Engineering Properties of Soils from Field SPT Using Random Number Generation. INAE Lett. 2016, 1, 77–84. [Google Scholar] [CrossRef]
  35. Zein, A.K.M. Estimation of Undrained Shear Strength of Fine Grained Soils from Cone Penetration Resistance. Int. J. Geo-Eng. 2017, 8, 9. [Google Scholar] [CrossRef]
  36. Ministry of Land, Infrastructure, Transport and Tourism Act on Promotion of Earthquake Retrofitting of Buildings. Available online: https://www.mlit.go.jp/jutakukentiku/build/jutakukentiku_house_fr_000054.html (accessed on 23 June 2024).
  37. Meguro City City Ordinance on Restrictions on Buildings on Sloping Land. Available online: https://www.city.meguro.tokyo.jp/kenchiku/shigoto/kenchiku/syamenti.html (accessed on 27 May 2024).
  38. Nakada, S. Volcanic Archipelago: Volcanism as a Geoheritage Characteristic of Japan. In Natural Heritage of Japan; Chakraborty, A., Mokudai, K., Cooper, M., Watanabe, M., Chakraborty, S., Eds.; Geoheritage, Geoparks and Geotourism; Springer International Publishing: Berlin/Heidelberg, Germany, 2018; pp. 19–28. ISBN 978-3-319-61895-1. [Google Scholar]
  39. Engineering ToolBox. Available online: https://www.engineeringtoolbox.com/wind-shear-d_1215.html (accessed on 27 July 2024).
  40. Vietnam Briefing Vietnam’s 2024 Land Law: Significant Amendments and Key Changes. Available online: https://www.vietnam-briefing.com/news/vietnams-2024-land-law-significant-amendments-and-key-changes.html/ (accessed on 28 July 2024).
  41. JAPANESE AGRICULTURAL STANDARD Structural Lumber and FingerJointed Structural Lumber for Wood Frame Construction. Available online: https://www.maff.go.jp/j/jas/jas_standard/attach/pdf/index-170.pdf (accessed on 28 June 2024).
  42. Wang, J.; Jin, F.; Zhang, C. Seismic Safety of Arch Dams with Aging Effects. In Seismic Safety Evaluation of Concrete Dams; Elsevier: Amsterdam, The Netherlands, 2013; pp. 387–406. ISBN 978-0-12-408083-6. [Google Scholar]
  43. Roshan, M.J.; Rashid, A.S.B.A. Geotechnical Characteristics of Cement Stabilized Soils from Various Aspects: A Comprehensive Review. Arab. J Geosci. 2024, 17, 1. [Google Scholar] [CrossRef]
  44. Ugalde, D.; Almazán, J.L.; Santa María, H.; Guindos, P. Seismic Protection Technologies for Timber Structures: A Review. Eur. J. Wood Prod. 2019, 77, 173–194. [Google Scholar] [CrossRef]
  45. Nguyen, Q.H. Technology Transfer and the Promotion of Technical Skills from Japan to Southeast Asia: Case Study of Vietnam. J. ASEAN Stud. 2019, 6, 179. [Google Scholar] [CrossRef]
  46. Alkhatib, F.; Kasim, N.; Goh, W.I.; Shafiq, N.; Amran, M.; Kotov, E.V.; Albaom, M.A. Computational Aerodynamic Optimization of Wind-Sensitive Irregular Tall Buildings. Buildings 2022, 12, 939. [Google Scholar] [CrossRef]
  47. Brooks, H.; Nielsen, J. Basics of Retaining Wall Design; HBA Publication: Newport Beach, CA, USA, 2010. [Google Scholar]
  48. Nostikasari, D.; Patterson, G.; Shelton, K. Planning From Inside Out: Using Community Responses to Address Transportation, Infrastructure and Safety Concerns; Rice University: Huston, TX, USA, 2018. [Google Scholar]
  49. Huong, L.T.T.; Haeger, T.; Phan, L. Study of Impurity in Blue Spinel from the Luc Yen Mining Area, Yen Bai Province, Vietnam. Vietnam. J. Earth Sci. 2017, 40, 46–54. [Google Scholar] [CrossRef]
  50. Maria Alves De Oliveira, A. Mechanical Strength of Materials Applied in Soil Stabilization: A Literature Review. JID 2023, 3, 161–177. [Google Scholar] [CrossRef]
Figure 1. The process of optimizing the design.
Buildings 14 02626 g001
Figure 2. This is the damage to buildings in urban (a) mountainous settlements (b) caused by heavy rainfall and strong winds in Yen Bai Province in 2023.
Buildings 14 02626 g002
Figure 3. The appearance of engineered buildings (a) non-engineered buildings (b) in the mountainous areas of Yen Bai Province.
Buildings 14 02626 g003
Figure 4. Distribution of target rustic settlements.
Buildings 14 02626 g004
Figure 5. Atterberg limits chart.
Buildings 14 02626 g005
Figure 6. The current state of local buildings captured during on-site surveys. (a) is the appearance of existing buildings and the site plan of the current residence, (b) is the terrain of the building site recreated in the modeling software, (c) is a simplified diagram of the terrain.
Buildings 14 02626 g006
Figure 7. The four main construction methods for sloped building sites in Japan, with red arrows indicating the entrances of circulation paths. (a) Method A, (b) Method B, (c) Method C, (d) Method D.
Buildings 14 02626 g007
Figure 8. The foundation and building structure construction methods optimized based on the construction method shown in Figure 7c to adapt to local conditions (a), (b,c) are renderings of the optimized house construction and foundation structure.
Buildings 14 02626 g008
Figure 9. Retaining wall stress analysis.
Buildings 14 02626 g009
Figure 10. Relationship between height (z) and two key variables: normalized mean wind speed and turbulence intensity. (0–1000 mm).
Buildings 14 02626 g010
Figure 11. Comparison of wind pressure coefficients between the optimized structure and existing structure.
Buildings 14 02626 g011
Figure 12. Relationship between ultimate load (Σn) and building width (B).
Buildings 14 02626 g012
Figure 13. SAP2000 building model load analysis. (a) is the model structure, (b) is the fixed constraints, (c) is the wind load direction, (d) is the building deformation under the combo1 load combination, (e) is the building deformation under the combo2 load combination. The deformation of buildings under different loading conditions and the loads borne by structural members in the planar system (fi).
Buildings 14 02626 g013aBuildings 14 02626 g013b
Figure 14. Comparison of anti-slip and anti-overturn coefficients.
Buildings 14 02626 g014
Figure 15. The trend chart of the distance from the global optimal solution after 150 iterations of the PSO algorithm for the five methods over six runs (af).
Buildings 14 02626 g015
Table 1. Soil sample plastic limit index and density experimental data.
Sample Serial NumberWater ContentLiquid LimitPlastic LimitPlasticity IndexWet DensityDensity
1-115.249.8728.1121.761.861.62
1-214.852.4529.6422.811.821.59
1-316.155.2331.7923.441.891.63
1-415.551.128.8722.231.941.68
1-514.952.6529.9622.691.821.59
2-115.349.6528.2821.371.831.59
2-215.051.5628.722.861.931.68
2-316.054.3631.0123.351.901.64
2-414.751.1029.0922.011.811.58
2-515.453.2129.5523.661.881.63
3-114.951.5229.122.421.811.58
3-215.654.4730.6723.81.821.58
3-315.251.3327.5623.771.851.61
3-415.152.7130.4522.261.721.5
3-515.351.6829.4622.221.741.51
4-115.554.6832.3122.371.811.57
4-215.049.826.8122.991.781.55
4-314.852.0228.623.431.861.62
4-415.453.9331.1822.751.791.55
4-515.152.7929.9422.851.761.53
Table 2. Comparison of different types of retaining walls.
Type of Retaining WallStabilityLoad-Bearing CapacityConstruction DifficultyMaterial CostMaintenance Requirement
Gravity retaining wall76563
Cantilever retaining wall87754
Reinforced earth wall98673
Embedded retaining wall99865
Counterfort retaining wall88754
Table 3. Parameters of the wind tunnel experiment.
Reference Wind Speed at Roof Height4.6 m/s
Exponent of the vertical mean wind speed Profileα = 0.3
Wind direction90° to 165° at 15° interval
Sampling frequency200 Hz
Geometrical scale1:25
Time scale40:200
Assumed wind speed in full scale28 m/s, 31 m/s
Averaging time in full scale1 s
Evaluation time in full scale600 s
Number of time series2
Table 4. Sample survey on educational attainment of local people of different age groups.
Age Range of RespondentsHigh School and AboveMiddle School EducationPrimary Education LevelAble to Understand Simple Functions
18–2557107
26–353554
36–451462
45+1240
Table 5. Nomenclature.
ΘInternal friction angleW1Wall weight
CCohesionW2Soil weight
FsSafety factorMrWithstand overturning moment
QuUltimate bearing capacity of foundationMoOverturning moment
ΓUnit weight of soilS1Total building area acting on the underlying foundation
B
H
L
Foundation width
Foundation height difference
Foundation length
S2Total building area acting on the upper foundation
DfFoundation depthKcAnti-slip safety factor
NcCohesion load factorFaSafety factor against overturning
Soil weight bearing capacity coefficientOOverturning moment action point
NqGround additional sum in coefficientRRetaining wall volume
KpPassive earth pressure coefficientSoil load on heel plate
WhRetaining wall heightμ = 0.35Slip coefficient
WcRetaining wall thicknessS = 0.7Earth pressure coefficient
WlRetaining wall length∑nLower foundation load
HiHeel plate length∑NUpper foundation load
HcHeel plate thicknessAArea of the building on the heel plate
DFoundation and retaining wall densityPaActive soil pressure
Table 6. Parameters.
Bdown12.3 m
Bup12.3 m
Df0.5 m
Kp0.41
γ17.2–18.5 KN/m3
Wh3.4 m
Wc0.5 m
Wl17.5 m
Hi1.9 m
Hc0.4 m
D24 KN/m3
∑n340 KN
∑N78.4 KN
A33.25 m2
S1103 + 103 m2
S298 m2
R39.44 m3
Table 7. Comparison of foundation construction methods.
Construction MethodExcavation Volume (m3)Foundation and Wall Volume (m3)Wall Overturning ResistanceWall Slip ResistanceConstruction Area (m2)Ratio of Unit Building Area to Unit Foundation VolumeRatio of Construction Area to Excavation Volume
Buildings 14 02626 i0011065.05258.11.095.764021.550.377
Buildings 14 02626 i002731.85947.1//4020.6920.55
Buildings 14 02626 i0031487.52453.271.674021.640.27
Buildings 14 02626 i0041065.05250.1253.075.764021.60.377
Buildings 14 02626 i005731.85245.943.191.873041.2360.415
Table 8. Nomenclature.
ω = 0.8Inertia weight
C1 = 0.5Self-awareness coefficient
C2 = 0.5Social cognition coefficient
VtThe velocity of particle i in generation t
PtThe best position of particle i in generation t
gtGlobal optimal position
XtThe position of particle i in generation t
γ1,γ2Random number between [0, 1]
Disclaimer/Publisher’s Note: The statements, opinions and data contained in all publications are solely those of the individual author(s) and contributor(s) and not of MDPI and/or the editor(s). MDPI and/or the editor(s) disclaim responsibility for any injury to people or property resulting from any ideas, methods, instructions or products referred to in the content.

