Article

Experimental and Analytical Study on Non-Damaged Reinforcement Method for Pipe Rack Steel Structures

Regional Center for Land, Infrastructure and Transport Technology, Kyungpook National University, Dae-gu 41566, Republic of Korea
*
Author to whom correspondence should be addressed.
Buildings 2024, 14(9), 2637; https://doi.org/10.3390/buildings14092637
Submission received: 31 July 2024 / Revised: 21 August 2024 / Accepted: 23 August 2024 / Published: 25 August 2024
(This article belongs to the Section Building Structures)

Abstract

:
Pipe racks are steel structures that support various pipes transporting materials in industrial complexes. The pipes on pipe racks may transport hazardous substances, which imposes limitations on their structural reinforcement. Therefore, this study aimed to propose methods for reinforcing the joints of pipe rack structures through non-welding and non-drilling techniques. The joints of pipe rack structures were connected by end plates. Initially, this study evaluated the capacity of existing end plates in a real-world experiment and conducted cyclic loading tests with two additional reinforcement methods to validate their performance. Finally, finite element analysis was conducted to explore additional variables that were not covered in the experiments, and the optimal reinforcement method that demonstrated the best performance was proposed.

1. Introduction

Pipe rack structures are used in industrial facilities, such as refineries and chemical plants, to support pipelines that transport crude oil, chemicals, and various gases. Extensive research has been conducted on the structural safety of these critical systems [1,2]. As illustrated in Figure 1, a pipe rack structure typically consists of beams and columns made of structural steel, with components being manufactured and processed in factories and assembled on site using bolts to form beam–column connections [3]. Such connections are predominantly composed of angle or H-section steel, with end plate connections being employed for bolt fastening.
Research on end plate connections has been ongoing. Work by Krawinkler et al. describes how shear deformation, following yielding in the panel zone under lateral dynamic loads such as earthquakes, can involve rotational movement in the joint, thereby enhancing the structure’s ductility and energy dissipation capabilities [4]. Furthermore, various papers have documented how the ductility of end plates changes according to different variables under repeated loading [5,6,7,8]. Following the 1994 Northridge earthquake and the 1995 Kobe earthquake, significant research was conducted on end plates in order to avoid the brittle failures observed in conventional welded joints, and it was believed that the ductility of the joint could be improved [9]. The AISC Steel Design Guide 4 presents design methods for extended end plate connections and introduces joints using rib plates and finger shims [10]. Based on prior research, Shi et al. conducted cyclic loading tests considering variables such as end plate thickness, bolt diameter, end plate stiffeners, and column stiffeners and proposed a hysteretic moment–rotation model for extended end plate connections [11]. Thus, various studies on end plate connections have been conducted.
For pipelines supported by pipe racks, the material is predominantly steel pipes, which are connected to the pipe rack structure through pipe supports. Being made of steel, the critical deformation of both the pipes and supports is determined by their material properties, generating internal forces such as tension, bending, and shear in response to external forces. The critical deformation of steel used for pipes can vary depending on the internal pressure of the material being transported, as well as differences in pipe diameter and thickness. In cases where the beam and column members are relatively small, the thickness of the column web and flanges may be reduced, leading to a lower shear strength in the panel zone and a lower buckling strength of the column flanges than the strength of the beam and column members. This can result in a decrease in the initial stiffness and strength of the joint. Therefore, when lateral loads such as earthquake forces are applied, the ductile capacity of the joint can increase through yielding and plastic deformation of the panel zone and column flanges, but the plastic moment strength of the beams may be engaged at relatively large inter-story drift ratios. Consequently, considering the joint as a rigid connection becomes challenging, and significant deformation of the pipe rack structure at low strengths may exceed the elastic limit of the supported pipeline, potentially leading to excessive deformation. This can cause leakage of the transported material, leading to economic losses and hazards such as fires and explosions. Thus, it is considered necessary to reinforce the initial stiffness and strength while ensuring the ductile capacity of the joint.
Various reinforcement methods are being proposed for beam–column joints that currently utilize end plates [12,13]. Research is underway on producing reinforcement members in the form of knee braces and welding them to the beam–column joint [14,15,16]. Additionally, damping devices can be installed to enhance the seismic performance. Furthermore, reinforcement methods such as increasing the thickness of the panel zone, which is a vulnerable part of the beam–column joint, or installing haunches have also been utilized [17,18,19]. However, in the case of pipe rack structures, reinforcement should be carried out in a way that minimizes external damage. Therefore, an assembly-type reinforcement method for strengthening the beam–column joint is proposed. Although assembly-type reinforcement methods are commonly used for concrete beam–column joints [20,21], there is limited research on their use in steel structures, as welding or drilling exhibits superior performance. Hence, this paper proposes an assembly-type reinforcement method that can be used for steel beam–column joints.
The reinforcement method used in this study can be applied both in the presence and absence of loads. Previous research has shown that reinforcement through external attachments is effective, whether or not loads are present [22,23,24]. However, the method presented here is a modular reinforcement technique, making it particularly suitable for strengthening existing structures that are already in use. For structures without existing loads, alternative reinforcement methods implemented during the initial design phase are often more cost-effective. Therefore, this reinforcement method is best suited for retrofitting and strengthening structures that are already in service.
This study focuses on researching pipe rack frames with extended end plate joints with a span of 5 m and a column height of 3 m to compare and evaluate the behavior of joints according to the reinforcement type. For the analysis of frames with smaller members where the shear strength of panel zones and the flexural strength of column flanges are lower than the strength of the members, a relatively small member size was targeted, and the axial loads of columns were not considered due to the small size of the vertical loads. Additionally, to minimize fire risk and vibration resulting from reinforcement, which makes the method applicable to pipelines transporting hazardous materials, reinforcement of joints was performed using reinforcement methods that do not involve welding and drilling. Finally, based on the experimental results, a finite element analysis model is proposed, and based on this, an approach to designing reinforcement methods is proposed.

2. Experimental Research Plan

In this paper, a stress assessment of extended-type end plates constituting pipe rack structures was conducted, along with a stress evaluation of reinforcement methods in accordance with the characteristics of the pipe racks. Table 1 presents a summary of the specimens used. All specimens were based on the EP-non specimen, consisting of H-244 × 175 × 7 × 10 for both beams and columns, with a 25 mm end plate, reflecting the actual sizes of existing pipe rack structures in use. The widely used methods for reinforcing beam–column connections were categorized into two types: one was the knee brace configuration using H-section steel, and the other used a round steel bar. The EP-H150 and EP-H100 specimens were reinforced using H-section steel, while the EP-SB specimen was reinforced using a round steel bar. For the reinforcement method using H-section steel, the full-threaded bolts’ tension was used as a variable to evaluate the behavior of the specimens. The method utilizing H-section steel was designed as a rigid type of reinforcement, while the method using round steel bars was designed as a pinned–pinned connection type of reinforcement.
Figure 2 shows the details of the specimens. Figure 2a shows a drawing of the EP-non specimen, which used H-244 × 175 × 7 × 11 sections for both beams and columns and joint stiffeners of 11 mm and 12 mm. The end plate was 25 mm thick and an extended type. Figure 2b is a detailed drawing of the EP-H150 and EP-H100 specimens, using H-150 × 150 × 7 × 10 and H-244 × 175 × 6 × 8, respectively. The two specimens were designed to form friction on the upper and lower flanges of the main member to induce the sliding. In addition, the angle of the H-section steel was set at 64 degrees. Figure 2c shows details of the EP-SB specimen. A D28 round steel bar was used for reinforcement with the same angle, and the specimen was designed with clevises to induce pinned–pinned behavior. This made assembly easier than the reinforcement method using an H-section.
Figure 3 depicts the installation setup for the specimens. The experiments were conducted using an actuator with a load capacity of 250 kN and a max displacement of 500 mm. The displacement of the specimen was measured by installing LVDTs at the loading point, as well as at the vertical and horizontal positions of the hinge. The load was measured using a load cell embedded in the actuator. Figure 3a shows the EP-non specimen with column members installed along with beam members. High-tension bolts with a minimum bolt tension of 182 kN, M20(F10T), were fastened with the end plates [25]. Figure 3b–d show specimens reinforced with additional h-section members. The loading protocol for the reversed cyclic test was described in FEMA 350 [26].
Figure 4 presents the moment distribution diagram according to the design method of the reinforcement specimens. The EP-H150 and EP-H100 specimens were designed so that the reinforcing member was joined in a fixed–fixed configuration at its ends, as shown in Figure 4a. In addition, Figure 4b shows the moment distribution diagram for the specimen with a rigid connection. The EP-SB specimen was designed in a pinned–pinned configuration, as shown in Figure 4c, resulting in the moment distribution that is shown in Figure 4d. To achieve such a moment distribution, the connection between the main and reinforcement members must be connected in a rigid joint. In this study, reinforced members were only connected with bolted joints, without welding or drilling. To ensure that the bolted joints acted like rigid joints, bolt tension force was applied according to the corresponding reaction forces.
To determine the bolt tension applied to the reinforced specimen, the tension was calculated based on the moment distribution diagrams to ensure optimal bending performance of the structure. At the M1 point in Figure 4, the moment reaches its maximum value, and we assume that the moment at the M1 point reaches the plastic moment ( = M p ). Subsequently, as depicted in Figure 5, the axial force ( = P u ) acting on the reinforcement due to the force’s distribution is separated, resulting in the calculation of the corresponding horizontal force ( = H u ) and vertical force ( = V u ). the blue arrows indicate the axial force applied to the reinforcement, while the red arrows show the axial force being divided into horizontal and vertical components due to the separation of forces. Table 2 summarizes the calculated design slip load ( = R n ). The slip load of the beam member matches the horizontal force, and that of the column member matches the vertical force. Based on this, a slip load of 337.79 kN was assumed for the specimen, and the calculation for this slip load is given by Equation (1) below:
R n = μ D u h f T b n s
Here, a friction coefficient ( μ ) of 0.5 for steel-on-steel was assumed, resulting in a calculated tension force ( T b ) of 84.45 kN per bolt [25]. To assess the potential failure of existing members due to tension force, all possible failure modes were investigated, such as flange local buckling, web local yield strength, and crippling strength. All failure modes were found to be safe. Additionally, the flexural strength of the reinforcement plate was calculated assuming the structure to be a cantilever, as shown in Figure 6, and it was determined that the tensile strength was reached at a tension of 113 kN. To ensure the safety of the specimen, the bolt tension was ultimately planned to be 80 kN. Furthermore, to analyze the behavior under varying levels of tension, the specimen’s tension was planned at 80 kN and 40 kN.

3. Experimental Results

Prior to the experiment, material coupon tests were conducted according to the ASTM guidelines for the steel used in the specimens [27]. All components except for the end plates were A36, while the end plates were made of A572, and the bolts were made of S45C material. Table 3 presents the results of the material coupon tests. There were no significant differences in strength between different thicknesses.
The strengths of the beams, columns, panel zones, and end plates of the test specimen were calculated based on the design equations provided by the AISC. Table 4 shows the theoretical results. The capacity of the beams and columns were calculated to be 171.49 kN·m, and the panel zone to be 103.82 kN·m. For the end plates, the column flange’s local buckling, bolt’s rupture failure, and plate’s internal strength were investigated separately, resulting in strengths of 176.40 kN·m, 104.73 kN·m, and 171.99 kN·m, respectively. Through theoretical analysis, it was determined that the panel zone and column flange would yield first.
Figure 7 shows the load–displacement curves obtained from the cyclic loading tests. It is common to compare capacity in terms of moment–rotation curves in cyclic loading tests. However, due to the reinforcing member in the specimens, comparing the moments at the joints was not straightforward. Therefore, the test results were investigated based on each load–displacement curve. Figure 7a compares the test results of the EP-non and EP-H150 specimens. Initially, similar levels of stiffness were observed, but the yield strength and maximum strength of the EP-H150 increased more than those of the EP-non specimen. The maximum strengths were determined to be 99.03 kN for EP-non, 175.93 kN for EP-H150-80, and 146.92 kN for EP-H150-40, respectively. Furthermore, it was noted that the difference in bolt tension forces led to different results.
Figure 7b presents the load–displacement curves for the EP-non and EP-H100-80 specimens. The EP-H100-80 specimen exhibited similar stiffness to the previous specimens, but the yield and maximum strength increased. The maximum strength of the EP-H100-80 specimen was measured as 133.02 kN.
Figure 7c shows the load–displacement curves for the EP-non and EP-SB-80 specimens. The load increased before it yielded, similar to the EP-non specimen, but the maximum strength, measured as 120.74 kN, increased more than that of the EP-non specimen.
Figure 8 illustrates the actual failure modes of all specimens. The blue square highlights the area where the final failure mode of the specimen is observed. It was observed that all specimens experienced yielding of the column flange and panel zone. Additionally, for the reinforced specimens, ultimate failure occurred at the welded joint, leading to a decrease in strength. In the case of the EP-SB-80 specimen, buckling of the round bar was also observed.
Figure 9 presents the cumulative energy dissipation capacity with respect to displacement based on the cyclic loading test. It can be observed that the energy dissipation capacity increased compared with the unreinforced specimen. Comparing at the point at which the story drift reached 2%, the cumulative energy dissipation values were measured as 7.08 kN·m for the EP-non specimen, 15.22 kN·m for the EP-H150-40 specimen, 16.61 kN·m for the EP-H150-80 specimen, 15.22 kN·m for the EP-H100-80 specimen, and 12.87 kN·m for the EP-SB-80 specimen. It was therefore concluded that the energy dissipation capacity also increased after reinforcement of the beam–column connection.
Finally, the experimental results are summarized in Table 5. The EP-H150-80 specimen exhibited the highest ultimate strength of the specimens, and higher strengths were measured when the reinforced member was in compression. The rotation angle at the point at which maximum strength was reached for EP-H150 specimen was slightly larger compared with that of the EP-non specimen. The strength of the EP-H150-80 specimen was found to be 1.78 times higher than that of the unreinforced specimen, indicating a favorable reinforcement effect in the order of EP-H150-80 > EP-H150-40 > EP-H100-80 > EP-SB-80. The failure mode was confirmed to be yielding of the column flange and panel zone based on the strain of all specimens. The final failure mode was bolt rupture mode for the EP-non specimen and weld rupture mode for all the reinforced specimens. Finally, the EP-H150-80 specimen was determined to have the most superior reinforcement effect. In addition, it was found that the reinforcement method using H-section steel was more effective than using a steel bar.

4. FEA Model Presentation

The analysis model used solid 3D elements (C3D8R) with eight nodes considering large deformations, and reduced integration elements were used to enhance the computational efficiency. General contact elements were utilized for contact modeling, and the penalty condition was applied for contact, specifying the friction coefficient. The bolt pre-tension was set to the actual applied tension of 182 kN for the cyclic loading test. Material properties were defined based on the material coupon test results, inputting the true stress–strain curve. The boundary conditions for the analysis model were set as in the experimental setup. Figure 10 shows the actual modeling, where all structures are modeled as in the real test setup. The red arrows indicate the direction and location of the applied load, while the red triangles mark the support points. Mesh sizes of 5 were assigned to panels, end plates, and reinforcements where deformation was concentrated, while other areas were divided with a size of 60 for analysis.
The finite element analysis was conducted to analyze the reinforcement method using H-section steel, which has an excellent reinforcement effect.
The computational analysis was carried out for both unreinforced and reinforced specimens to validate the reliability of the finite element analysis model. Subsequently, based on the validated finite element analysis model, a variable analysis was conducted considering the bolt pre-tension and the size of the reinforcing member. Finally, based on these results, an actual design method for reinforcements was proposed.
Initially, a finite element analysis model for the unreinforced specimen was proposed. Using Equations (2) and (3), true stress–strain curves based on the material coupon test results were applied to the modeling [28]. In Abaqus, two methods for applying bolt pre-tension exist: applying force and fixing at the current length. If applying force, the bolt pre-tension remains the same even when an external force is applied, but if fixing at the current length, the stress changes in accordance with the length after the initial bolt pre-tension is applied. Consequently, for the analysis of the bolts under the actual applied external forces, the fixing at the current length method was utilized.
σ t r u e = σ n o m ( 1 + ε n o m )
ε l n p l = ln 1 + ε n o m σ t r u e E
Figure 11 shows the analysis results for the EP-non specimen, revealing a high similarity in behavior, stiffness, and strengths compared with the result of the cyclic loading test. Furthermore, Figure 12 illustrates the von Mises stress distribution of the EP-non specimen at a displacement of 100 mm. It can be seen that the panel zone and flange of the column yield first, and then the stresses are concentrated in the bolts and the connection of the end plate to the beam, which is the same as the behavior during the cyclic loading test. It is believed that failure eventually occurred at the bolts and at the end plate with the beam. The behavior in the actual test and the FEM analysis were very similar, and thus it is concluded that the finite element analysis model is reliable.
Based on the analysis of the EP-non specimen, the reliability of the finite element analysis model was established. In the case of the actual test specimen, the beam member tended to sag downwards, so a pushover analysis was conducted in the positive direction to improve the efficiency of the analysis. For these reinforcement methods, the friction force between the reinforcing member and the existing members was a significant variable. Hence, an analysis based on different friction coefficients (μ) was conducted first. Figure 13 shows the analysis results for the EP-H150-80 specimen according to the friction coefficient, and it was determined that a friction coefficient of 0.2 was suitable. The reason for the coefficient of friction being smaller than in previous studies is that the reinforcement plate bent during tension and compression during the test, creating a gap between the existing flange and the reinforcement plate.
Figure 14 illustrates the parametric analysis results according to the bolt pre-tension when the friction coefficient is 0.2. It was observed that the yield strength decreased as the bolt pre-tension decreased. When a bolt pre-tension of 80 kN was applied in the analysis, the result was similar to the experimental result.
Figure 15 depicts the analysis results for the EPH-H100 specimen. A parametric analysis was conducted with a friction coefficient of 0.2 in accordance with the bolt pre-tension. It was found that the experimental and analytical curves matched. Additionally, Figure 16 shows the stress distribution at the joint of the end plate when the EP-H100 was deformed by 65 mm. In the actual cyclic loading test result, the weld joint was fractured under repeated loading, as shown in Figure 16, with the stress being concentrated in the weld. Thus, the finite element analysis model also predicted that failure in the welds would occur when a displacement of 60~75 mm is reached. Finally, it was concluded that the finite element analysis model was reliable based on the results.

5. Variable Analysis

Based on the finite element analysis model presented earlier, other cases of various specimens that were not considered in the experiment were analyzed. Table 6 outlines the list of variables for this analysis. Two main variables were considered: the first variable was the bolt pre-tension at the connection of the reinforcement member and each original member, while the second variable was the size of the reinforcement, such as an H-section and round bar. Additionally, an analysis based on an assumption that the reinforcement was welded was also conducted at the final stage. In the case of the bolt pre-tension being used as the variable, the pre-tension was increased until either the yield strength of the specimen did not increase further, or localized buckling occurred.
Figure 17 depicts an overview of all the curves after analysis. Figure 17a represents the analysis results for the EP-H175 specimen. It was observed that the stiffness and strength increased as the bolt pre-tension increased due to the reinforcement effect. However, in the case of an 80 kN bolt pre-tension, it was noted that as the cyclic loading progressed, the increase in compressive and tensile stress transmitted by the reinforcement member led to a decrease in strength due to web buckling. Therefore, this was investigated for EP-H175 to limit the appropriate bolt pre-tension to below 80 kN.
Figure 17b shows the analysis results of the EP-H150 specimen. Similar to the previous specimen, an increase in strength was observed. However, the yield strength decreased due to web buckling, similarly to the EP-H175 specimen, in the case of a 140 kN bolt pre-tension. Additionally, the effect of the increasing strength was insignificant when the bolt pre-tension applied exceeded 100 kN. Therefore, it was found that it was appropriate in terms of safety to limit the bolt pre-tension to below 100 kN.
Figure 17c represents the analysis results for the EP-H125 specimen. Similar to the previous specimen, a decrease in strength due to web buckling was observed when a bolt pre-tension of 160 kN was applied. Similarly, as with the previous model, the effect of the increasing strength was found to be insignificant when the bolt pre-tension exceeded 100 kN.
Figure 17d shows the analysis results of the EP-H100 specimen. Similar to the previous specimens, an increase in bolt pre-tension led to an increase in strength. However, the analysis was terminated due to compressive buckling at the location where the reinforcement plate was installed.
On the other hand, the analysis results revealed that the reinforcement plate yielded with a bolt pre-tension of 80 kN, as shown in Figure 18. The yielding of the reinforcement plate and column flange occurred when the bolt pre-tension exceeded 80 kN, thereby affecting the structural safety. Therefore, it was concluded that applying tension exceeding 80 kN for reinforcement is not advisable in terms of safety and efficiency.
Figure 19 illustrates a curve comparing the strength of the reinforcement with the size of the reinforcement under the same bolt tension conditions. In addition, the case of the reinforcement member and conventional member being welded together was compared with the EP-non specimen. It was observed that the strength and stiffness of the specimens increased as the size of the reinforcing member increased. The reinforced specimens exhibited intermediate performance between the unreinforced and fully welded joints. In the case of fully welded joints, there was a significant increase in both stiffness and strength; however, due to local flange yielding or weld failure, significant deformable capacity was not exhibited. Therefore, the reinforcement allows us to obtain the strength and deformable capacity simultaneously. Ultimately, the suggested reinforcement method in this paper is considered effective for enhancing the strength and stiffness according to the desired performance.

6. Conclusions

This study aimed to propose a reinforcement method for beam–column joints using end plates in pipe rack structures. Pipe rack structures are highly challenging to reinforce due to their transportation of hazardous chemicals. Therefore, this research aimed to suggest a non-welded, non-perforated reinforcement method using frictional joints and verify its performance.
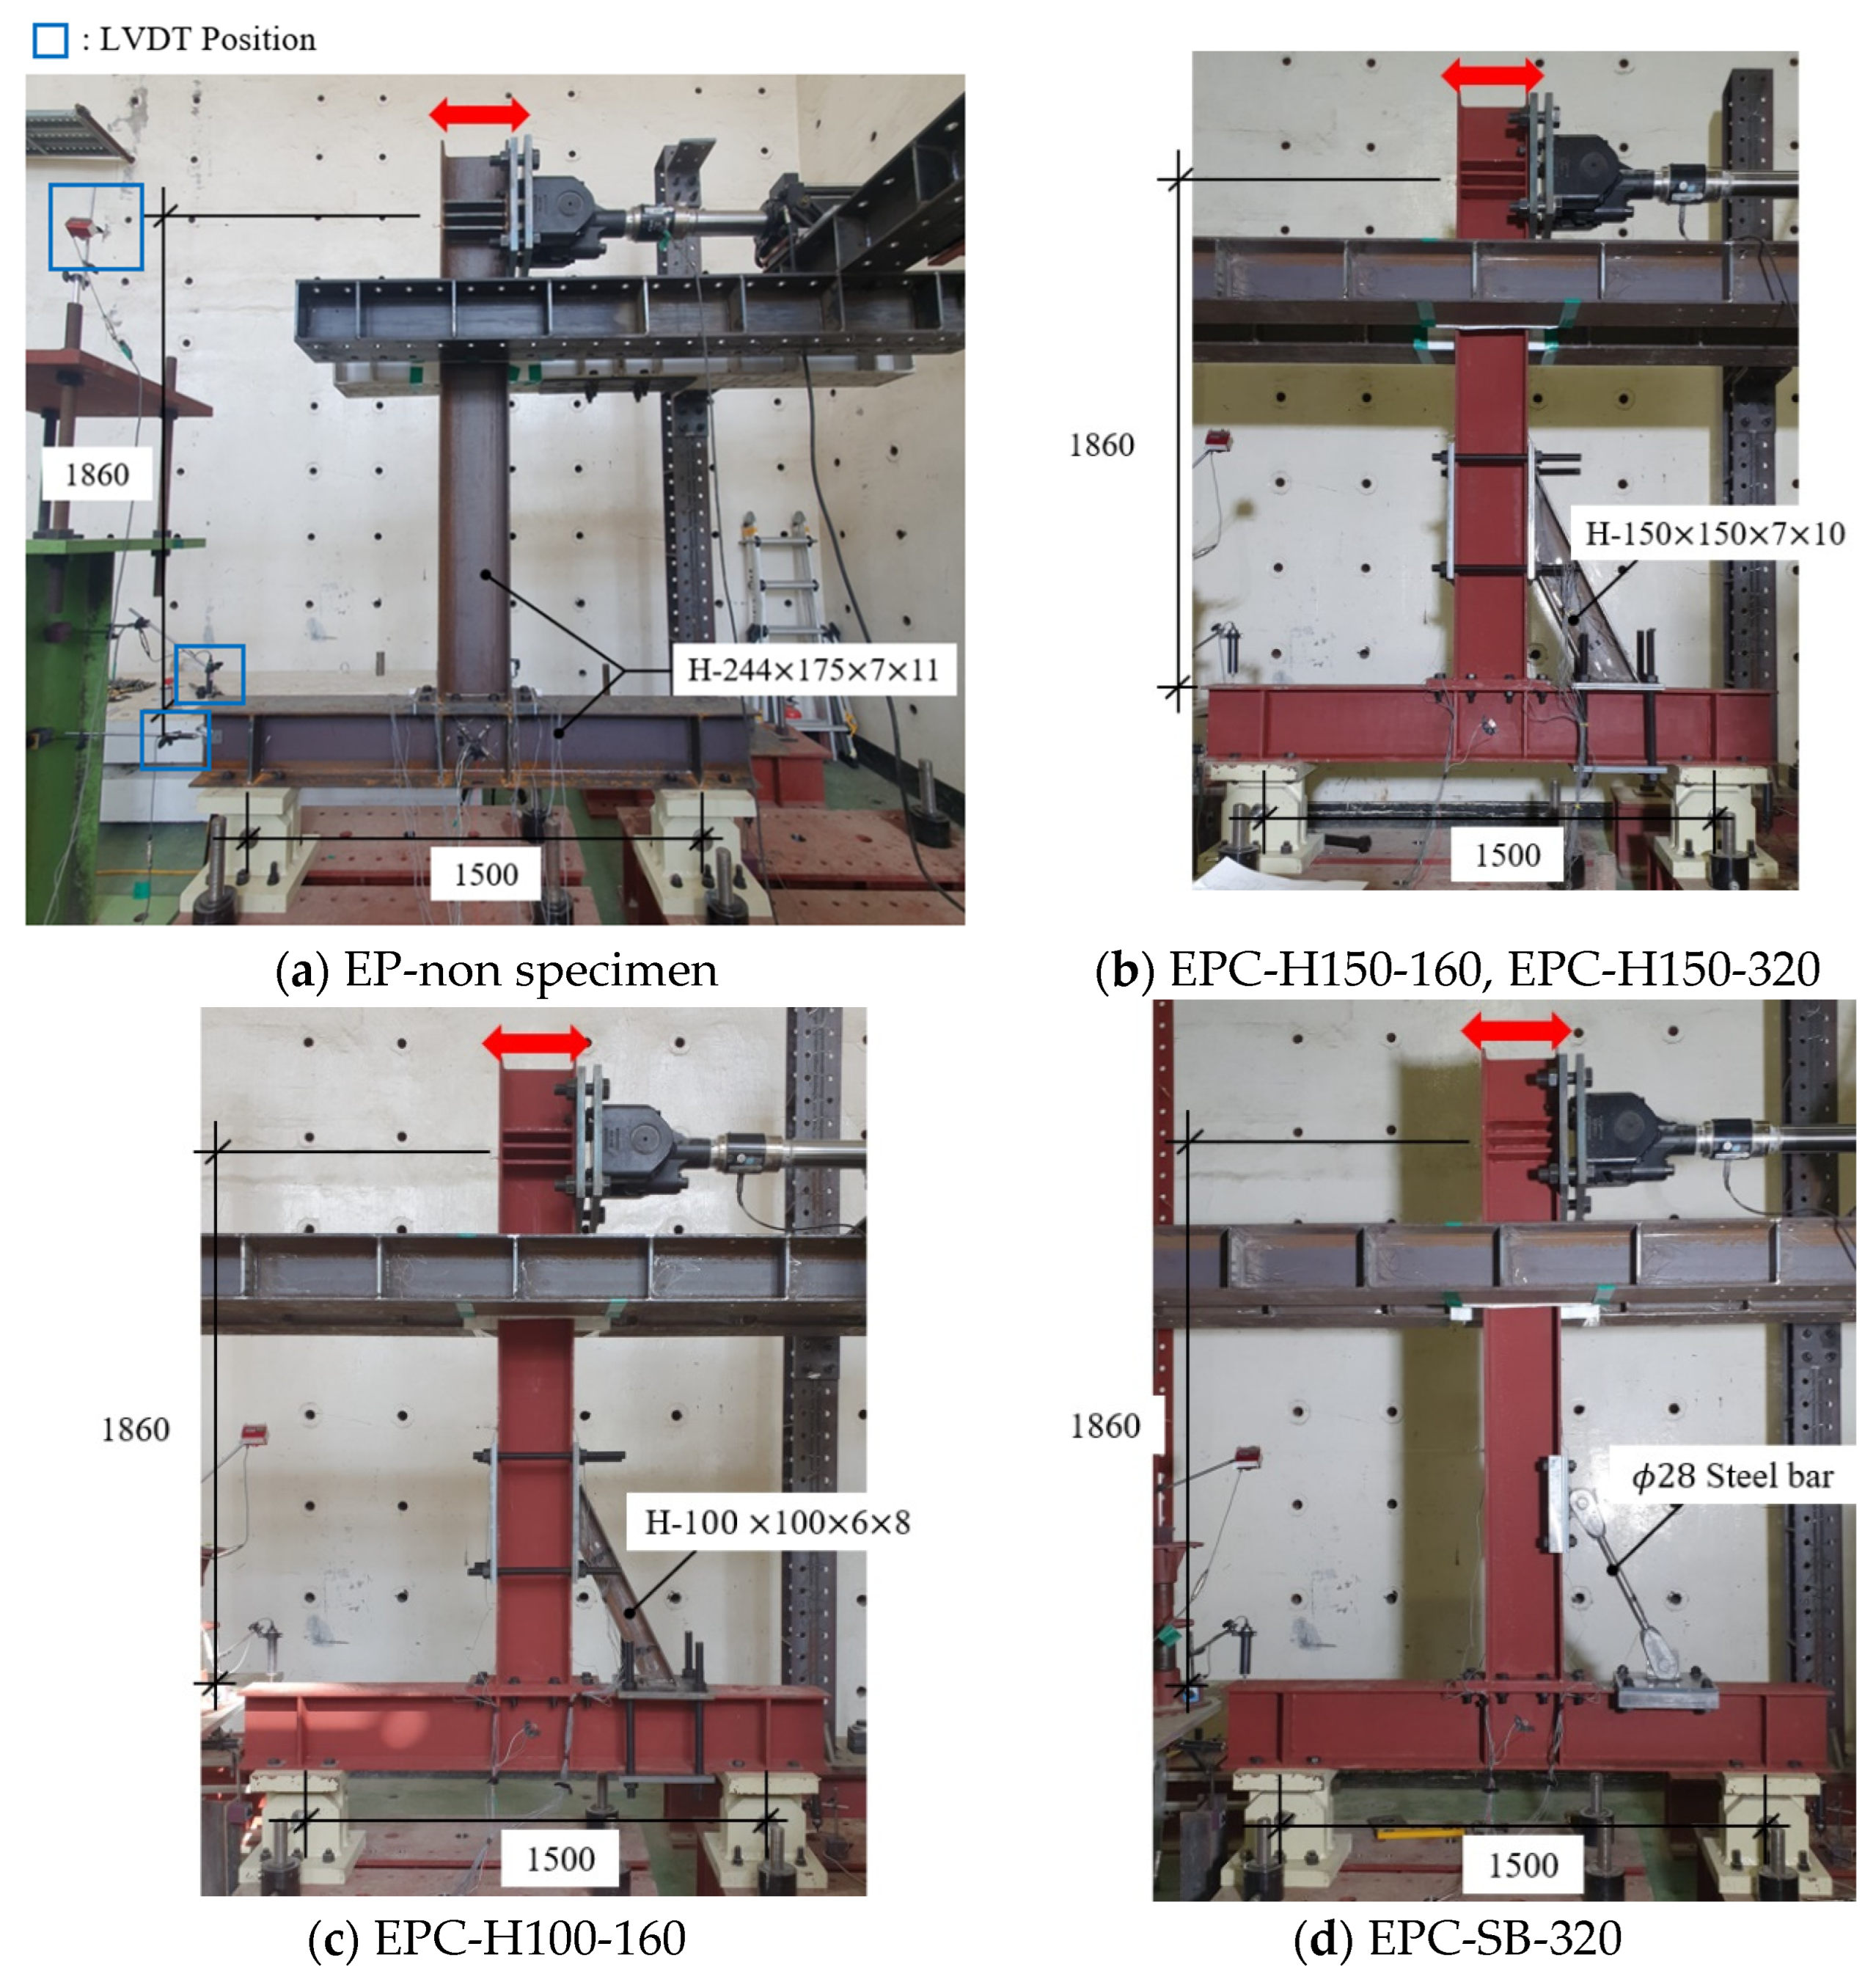
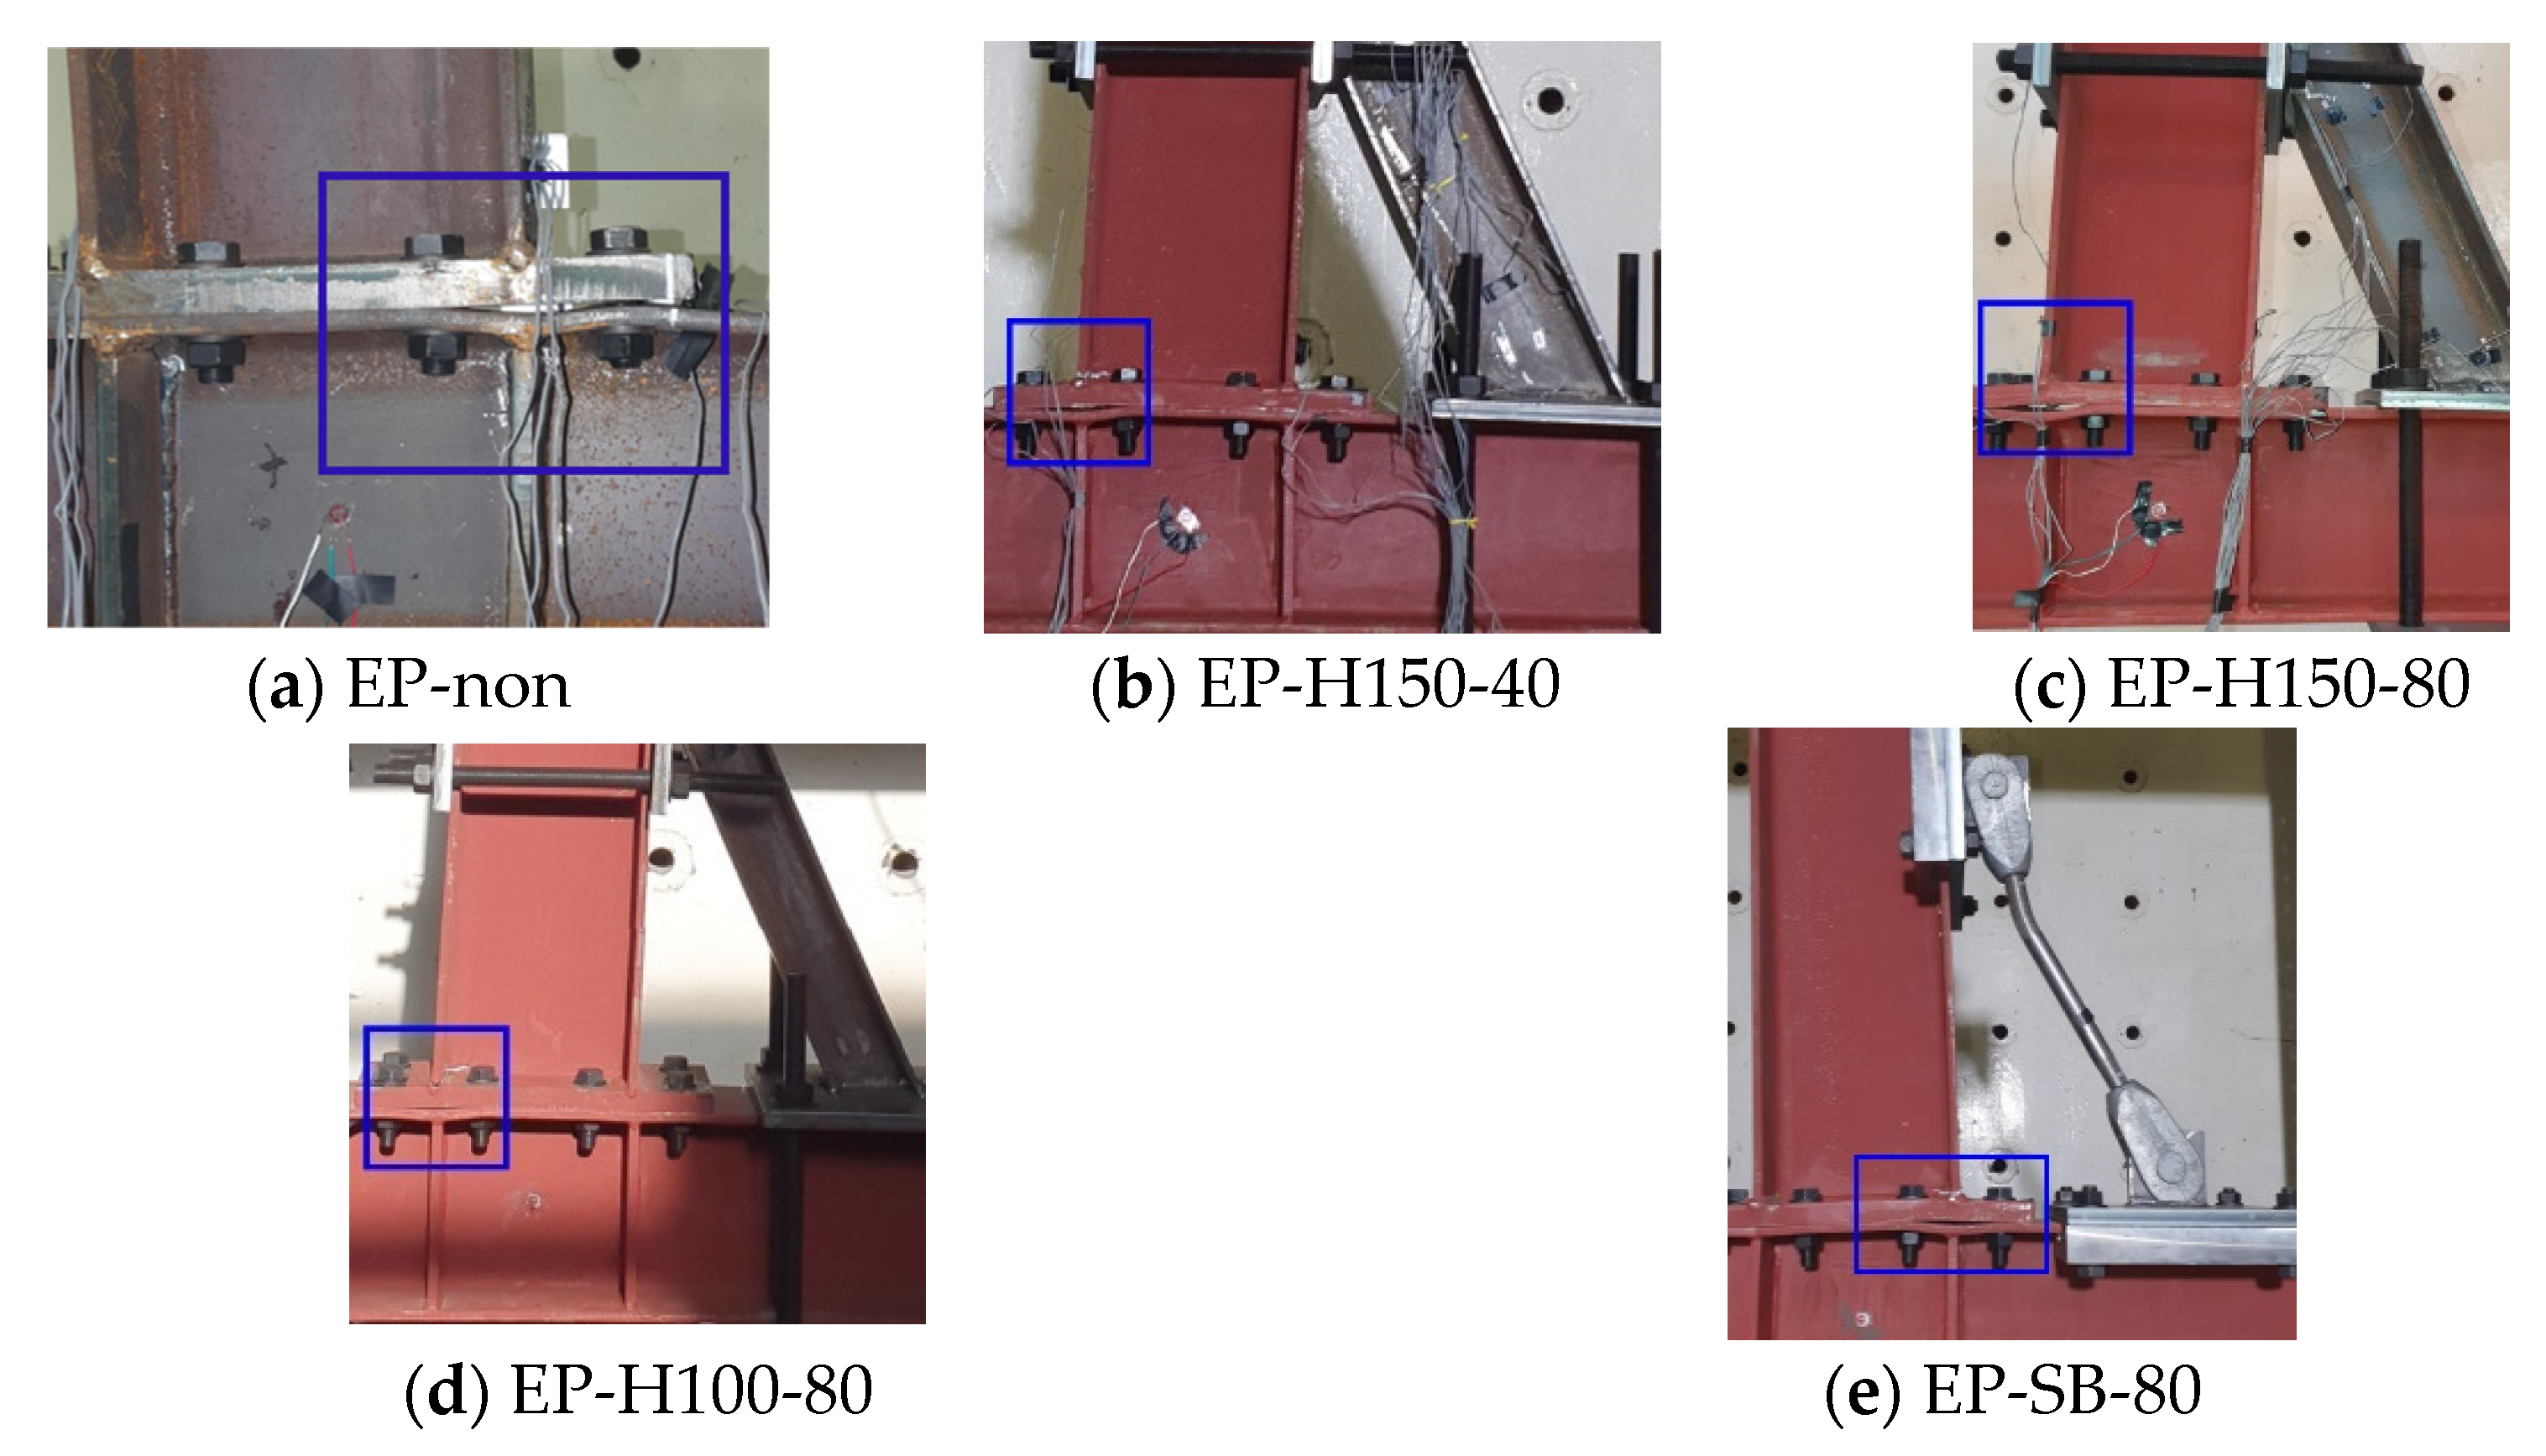
  • Experiments were conducted on specimens representing the actual size of beam–column joints used in industrial complexes. Five specimens were tested: one unreinforced specimen, three specimens reinforced with H-beams, and one specimen reinforced with steel bars. The H-beam specimens were tested with varying axial forces and H-beam sizes. The results showed that larger H-beams and higher axial forces led to a maximum strength enhancement of 1.78 times. The reinforcement using steel bars achieved a maximum strength enhancement of 1.22 times, but it was less effective compared with the H-beam reinforcement method.
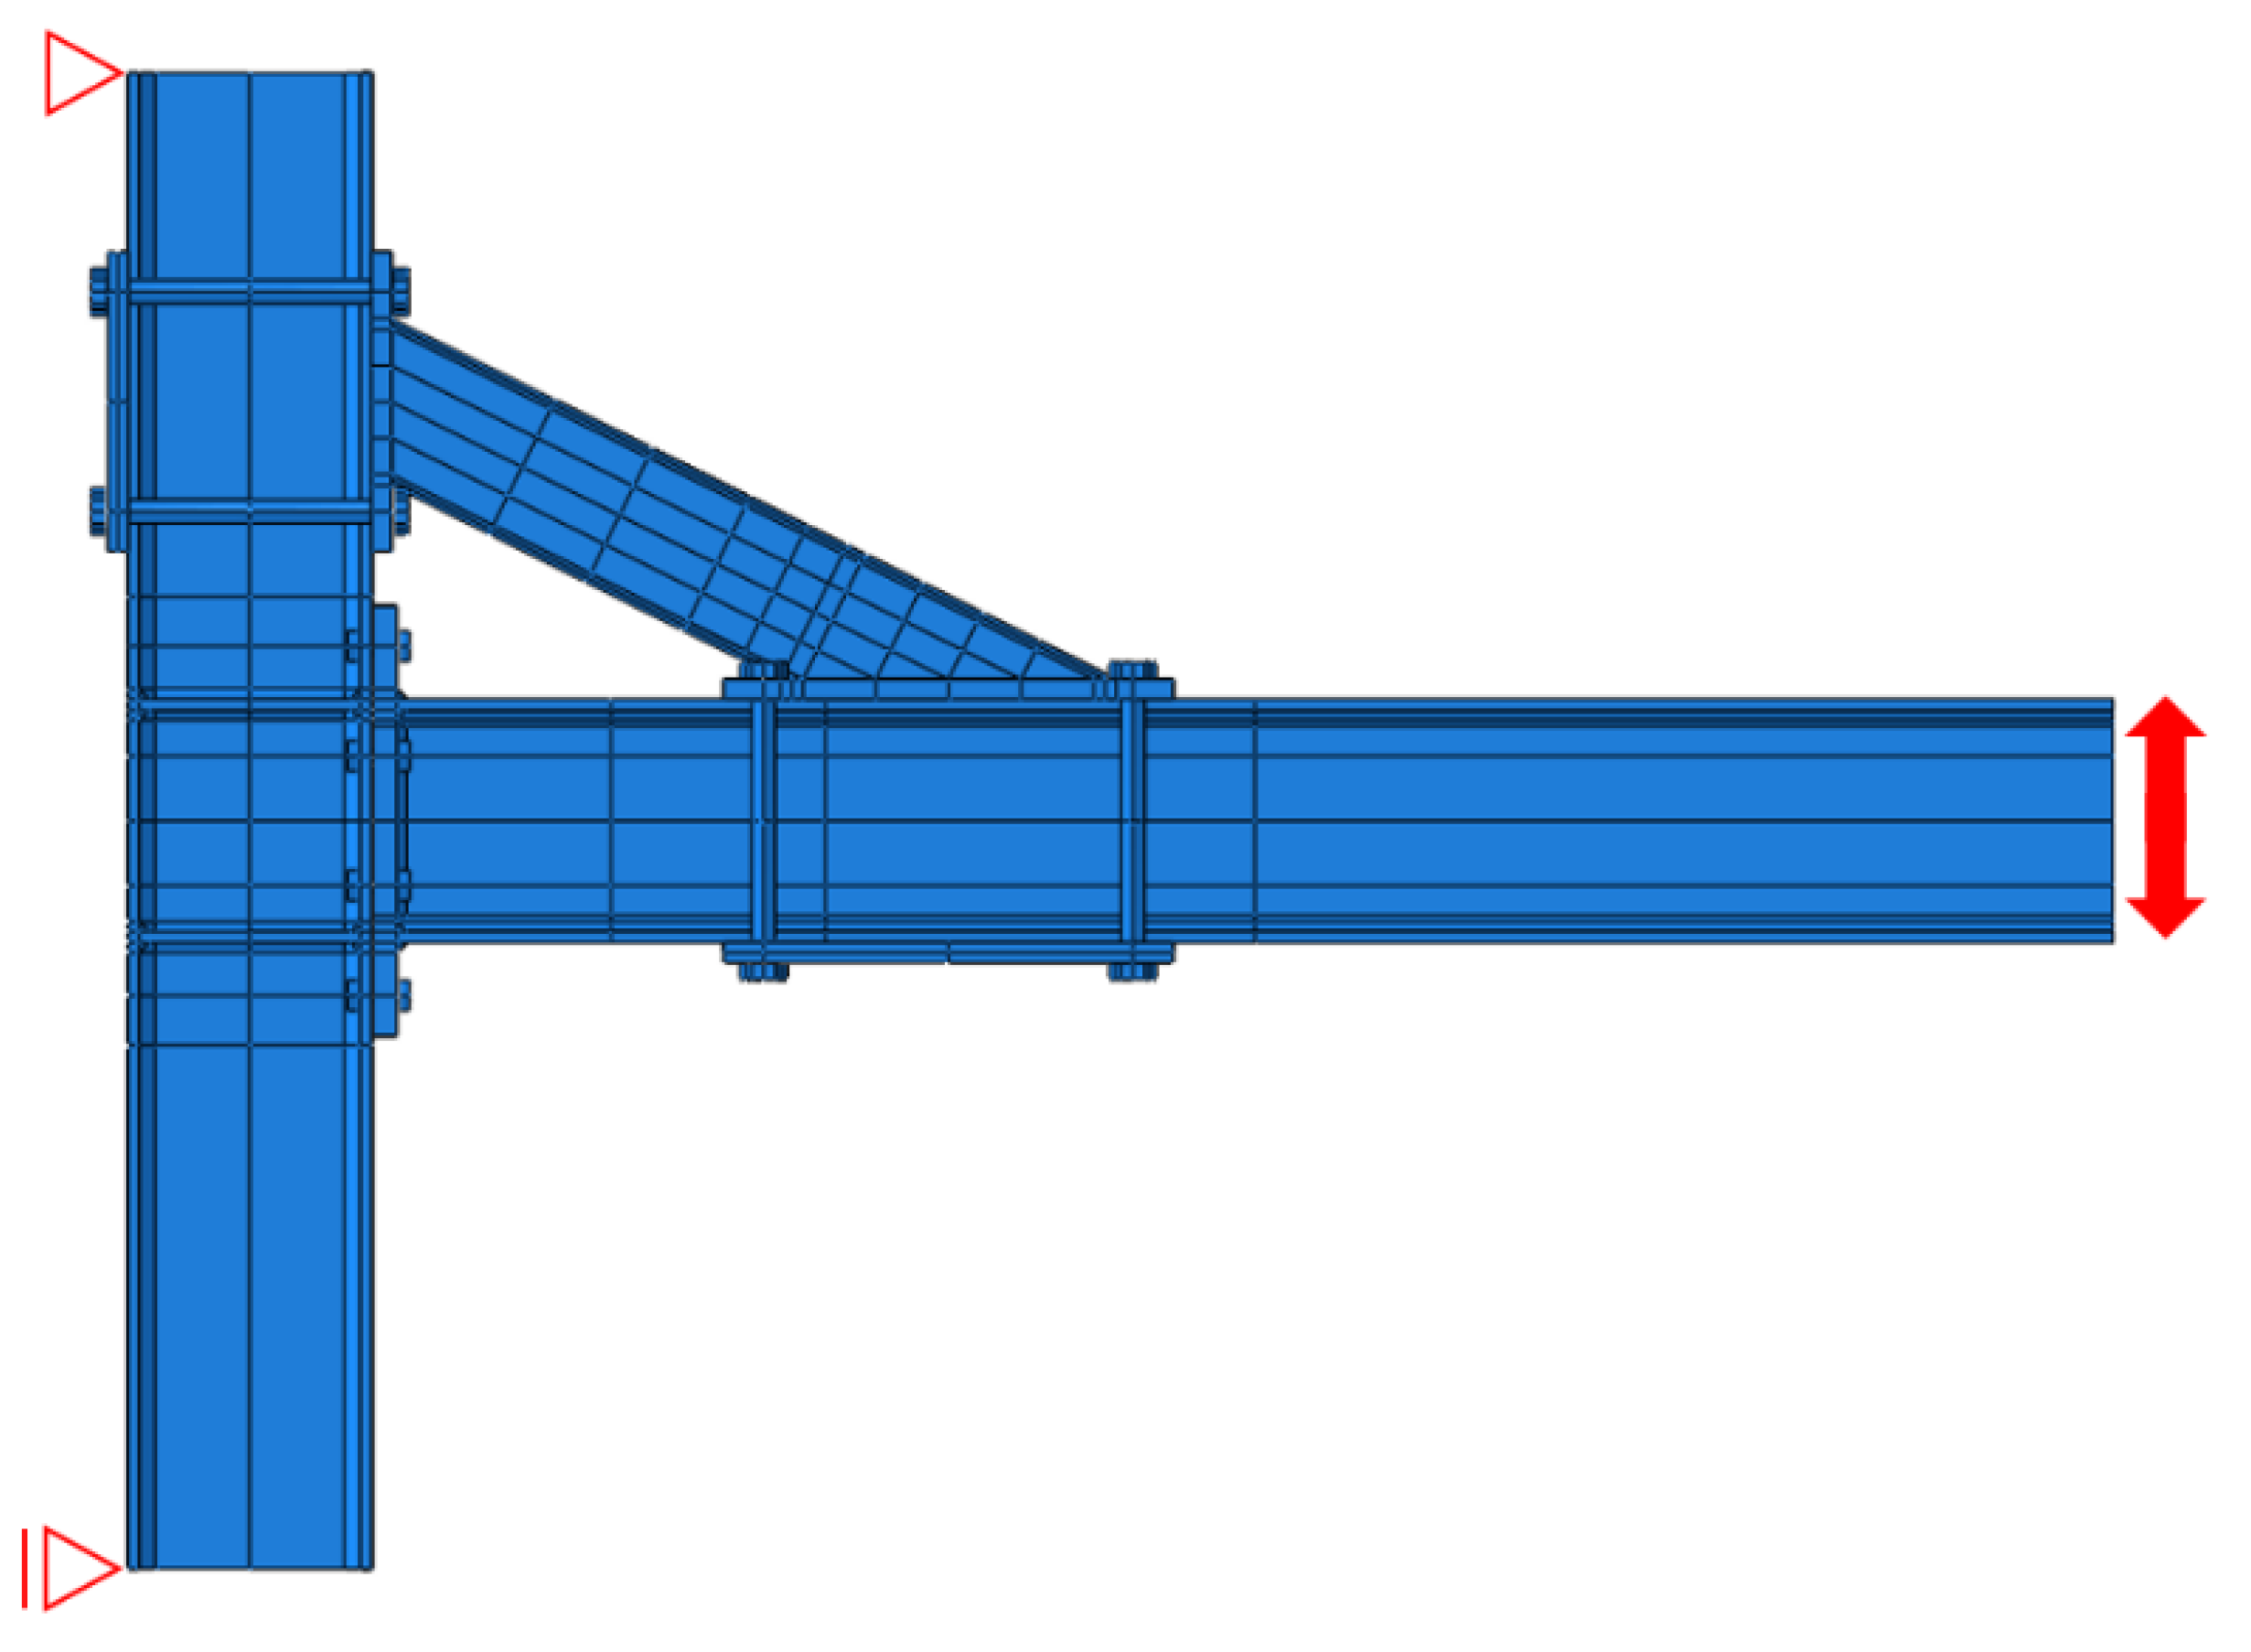
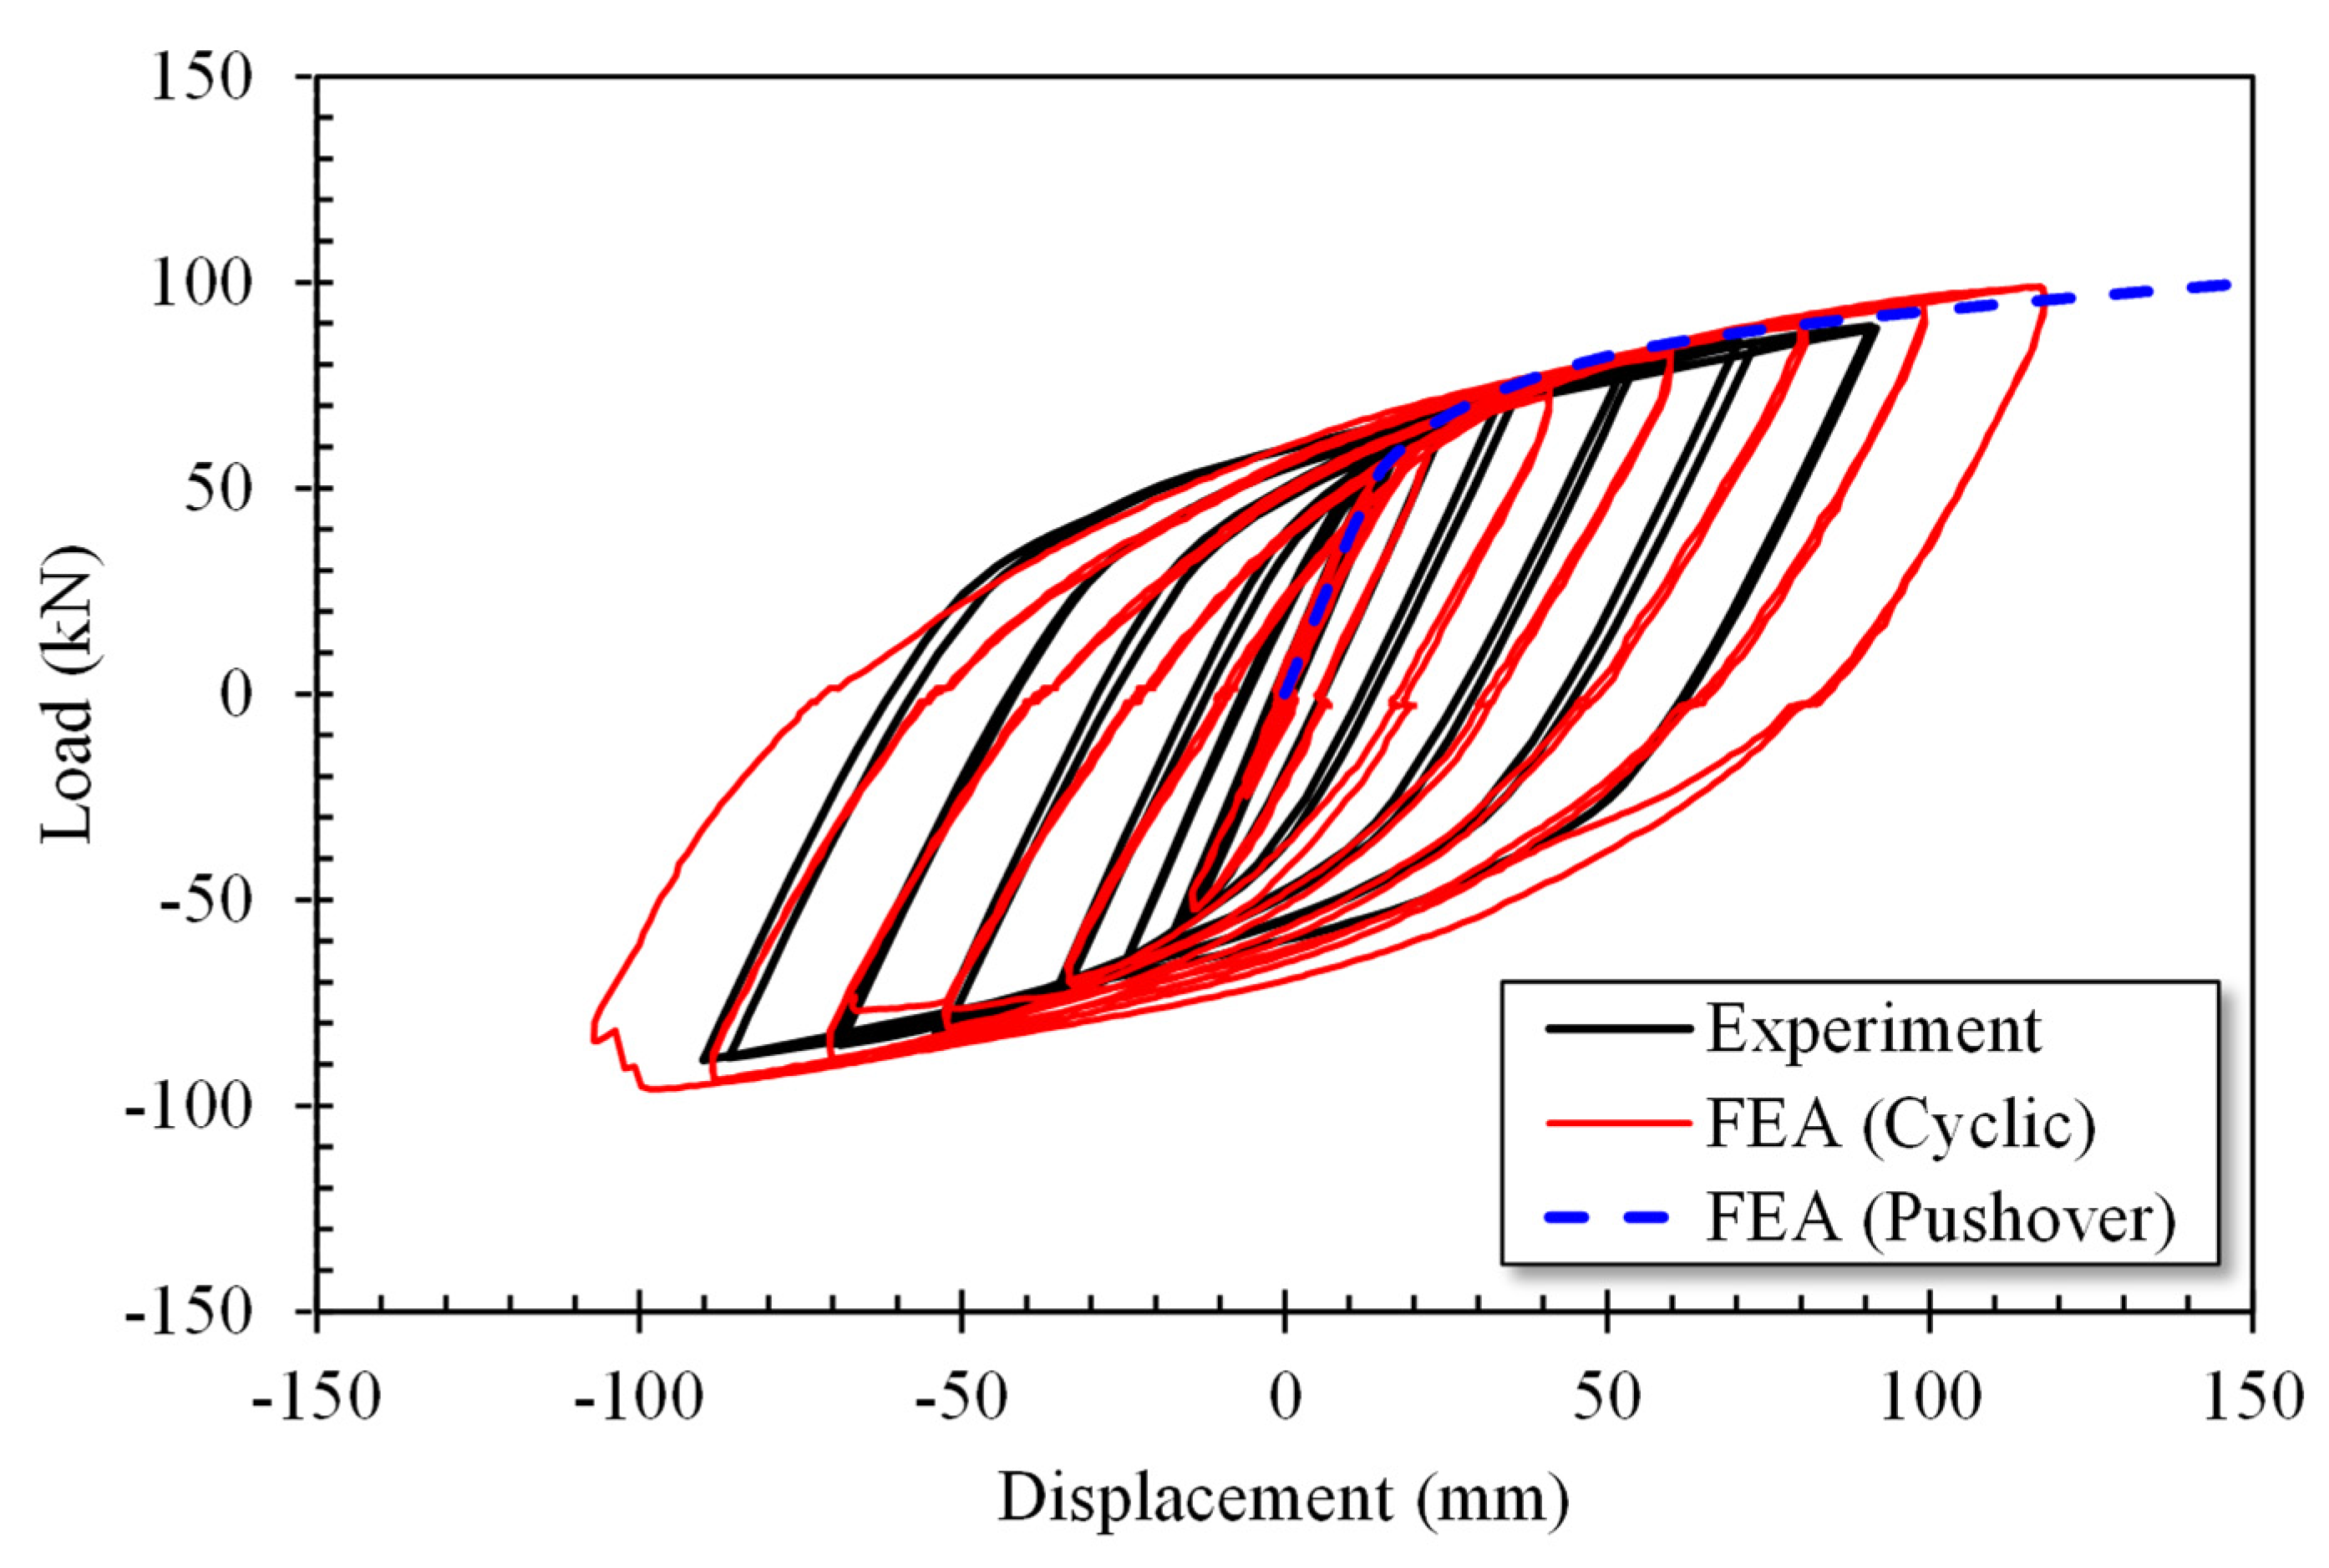
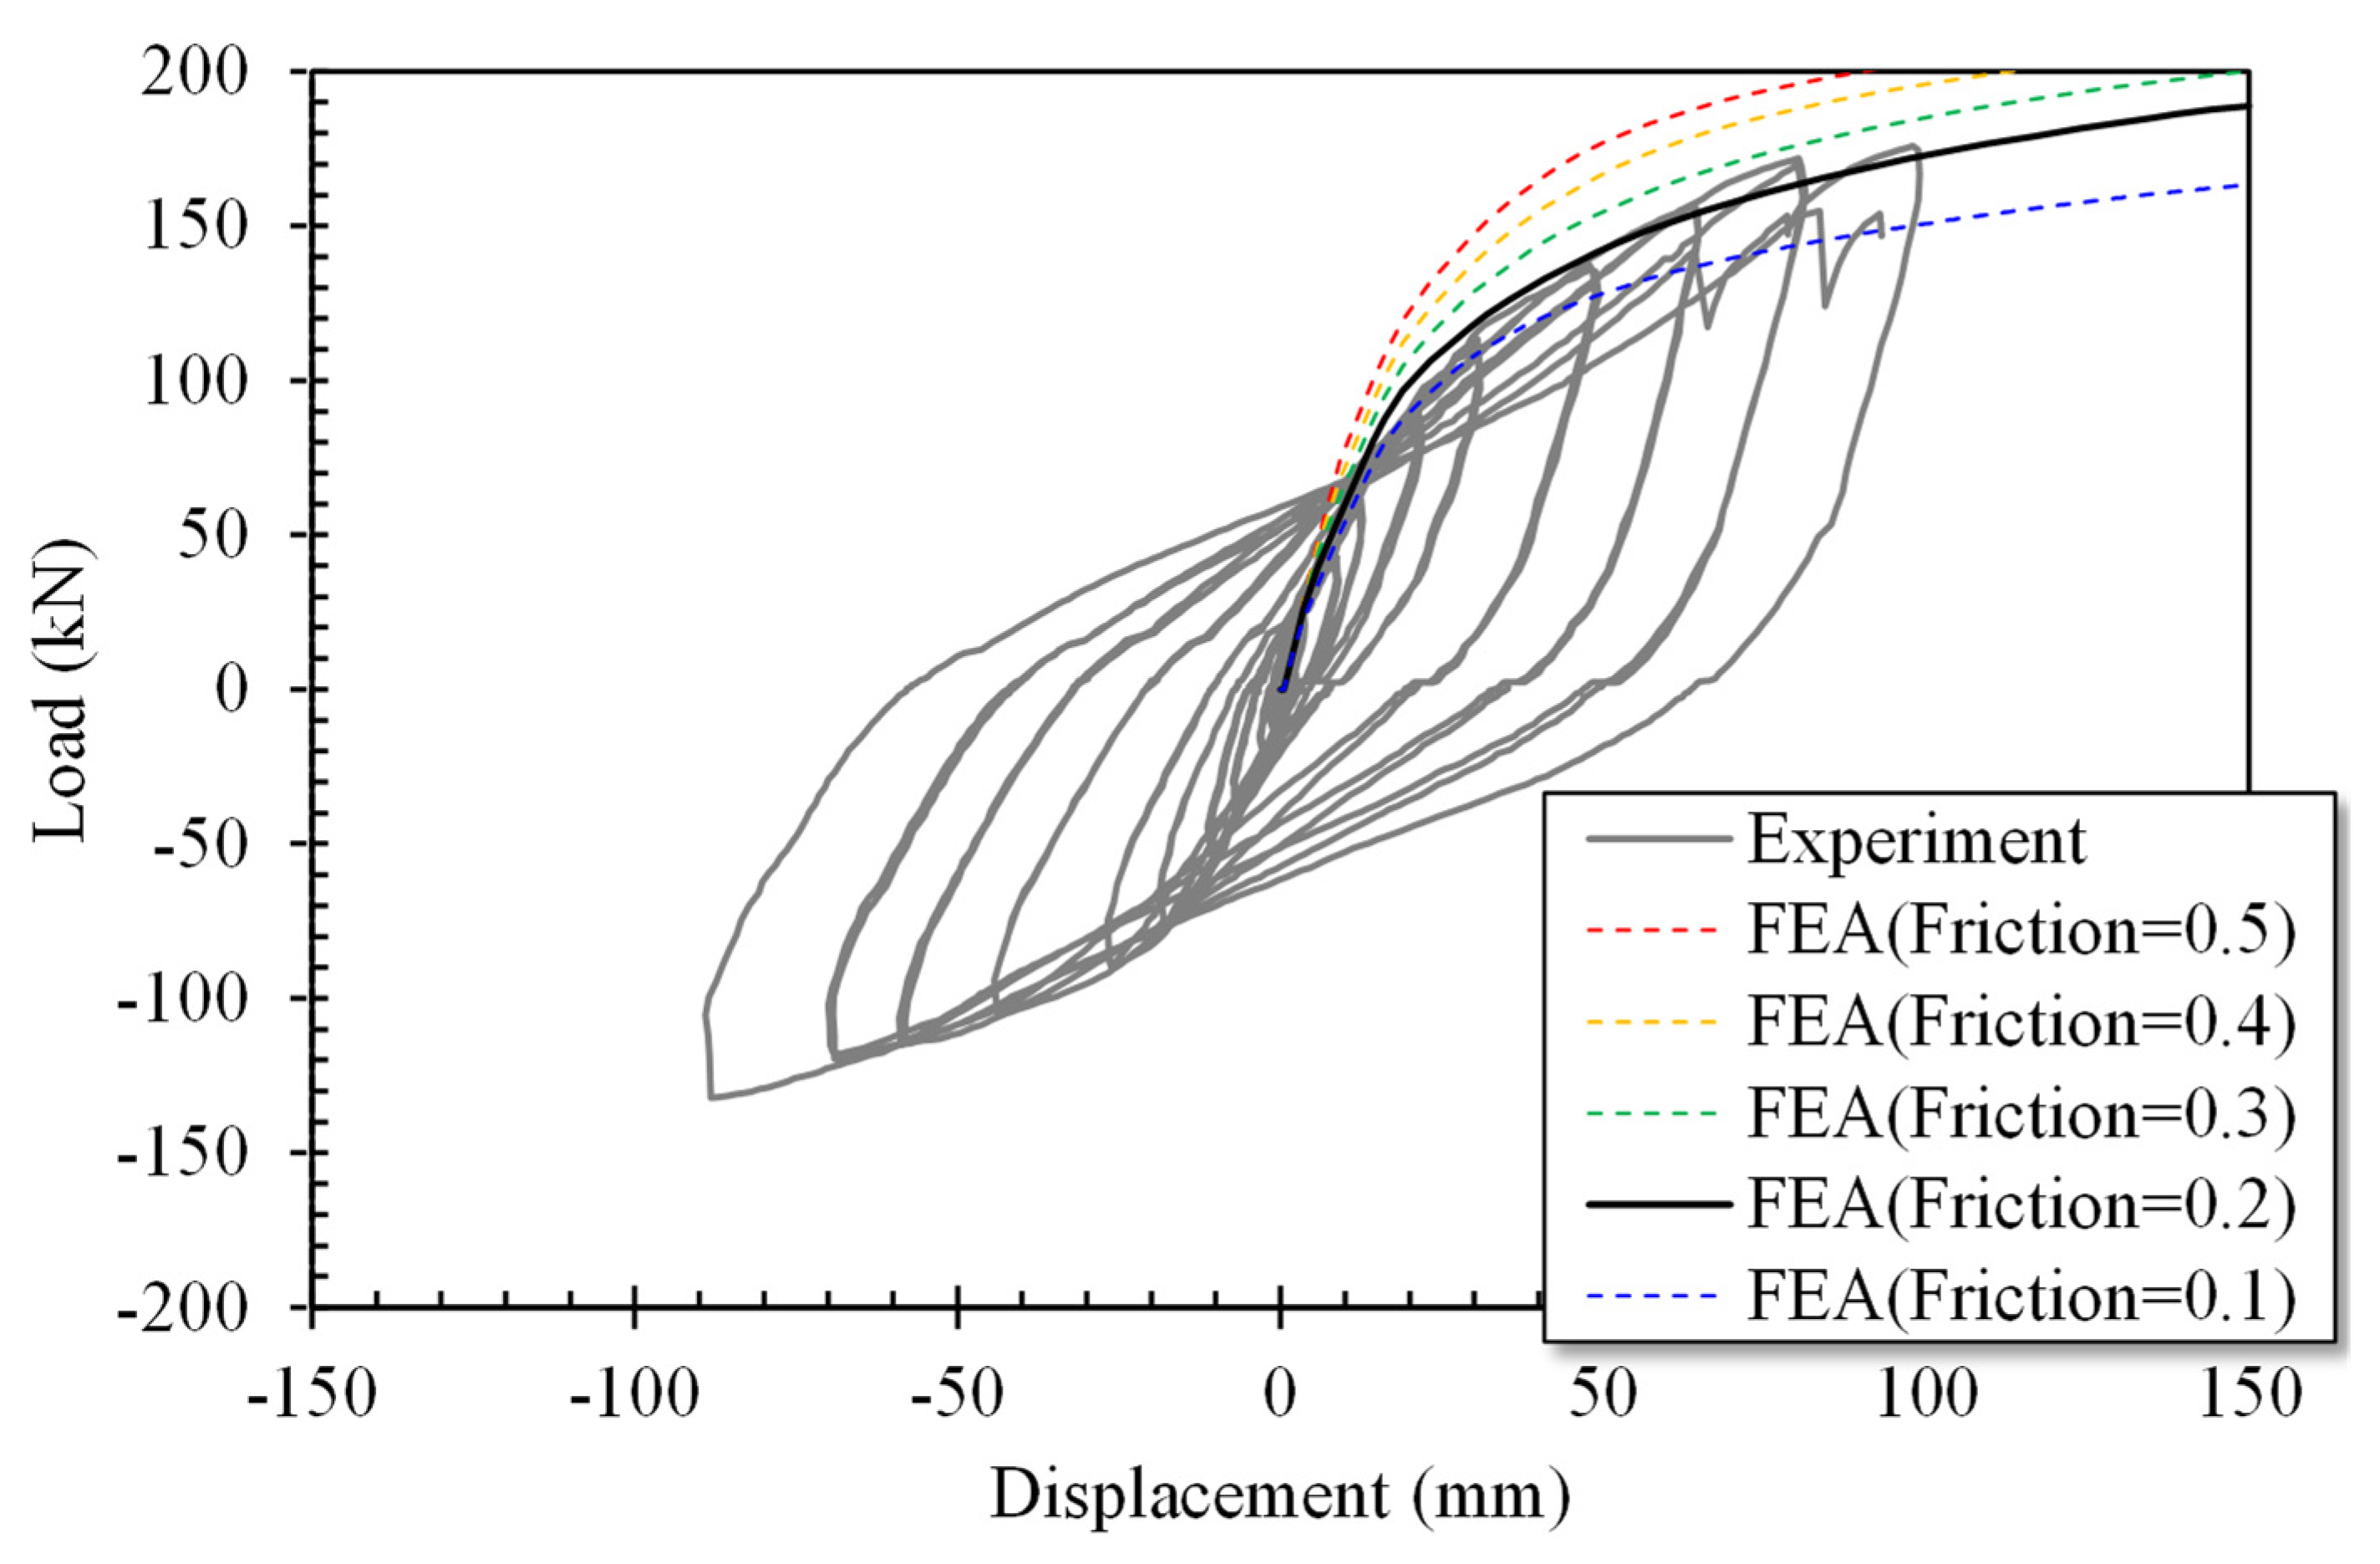
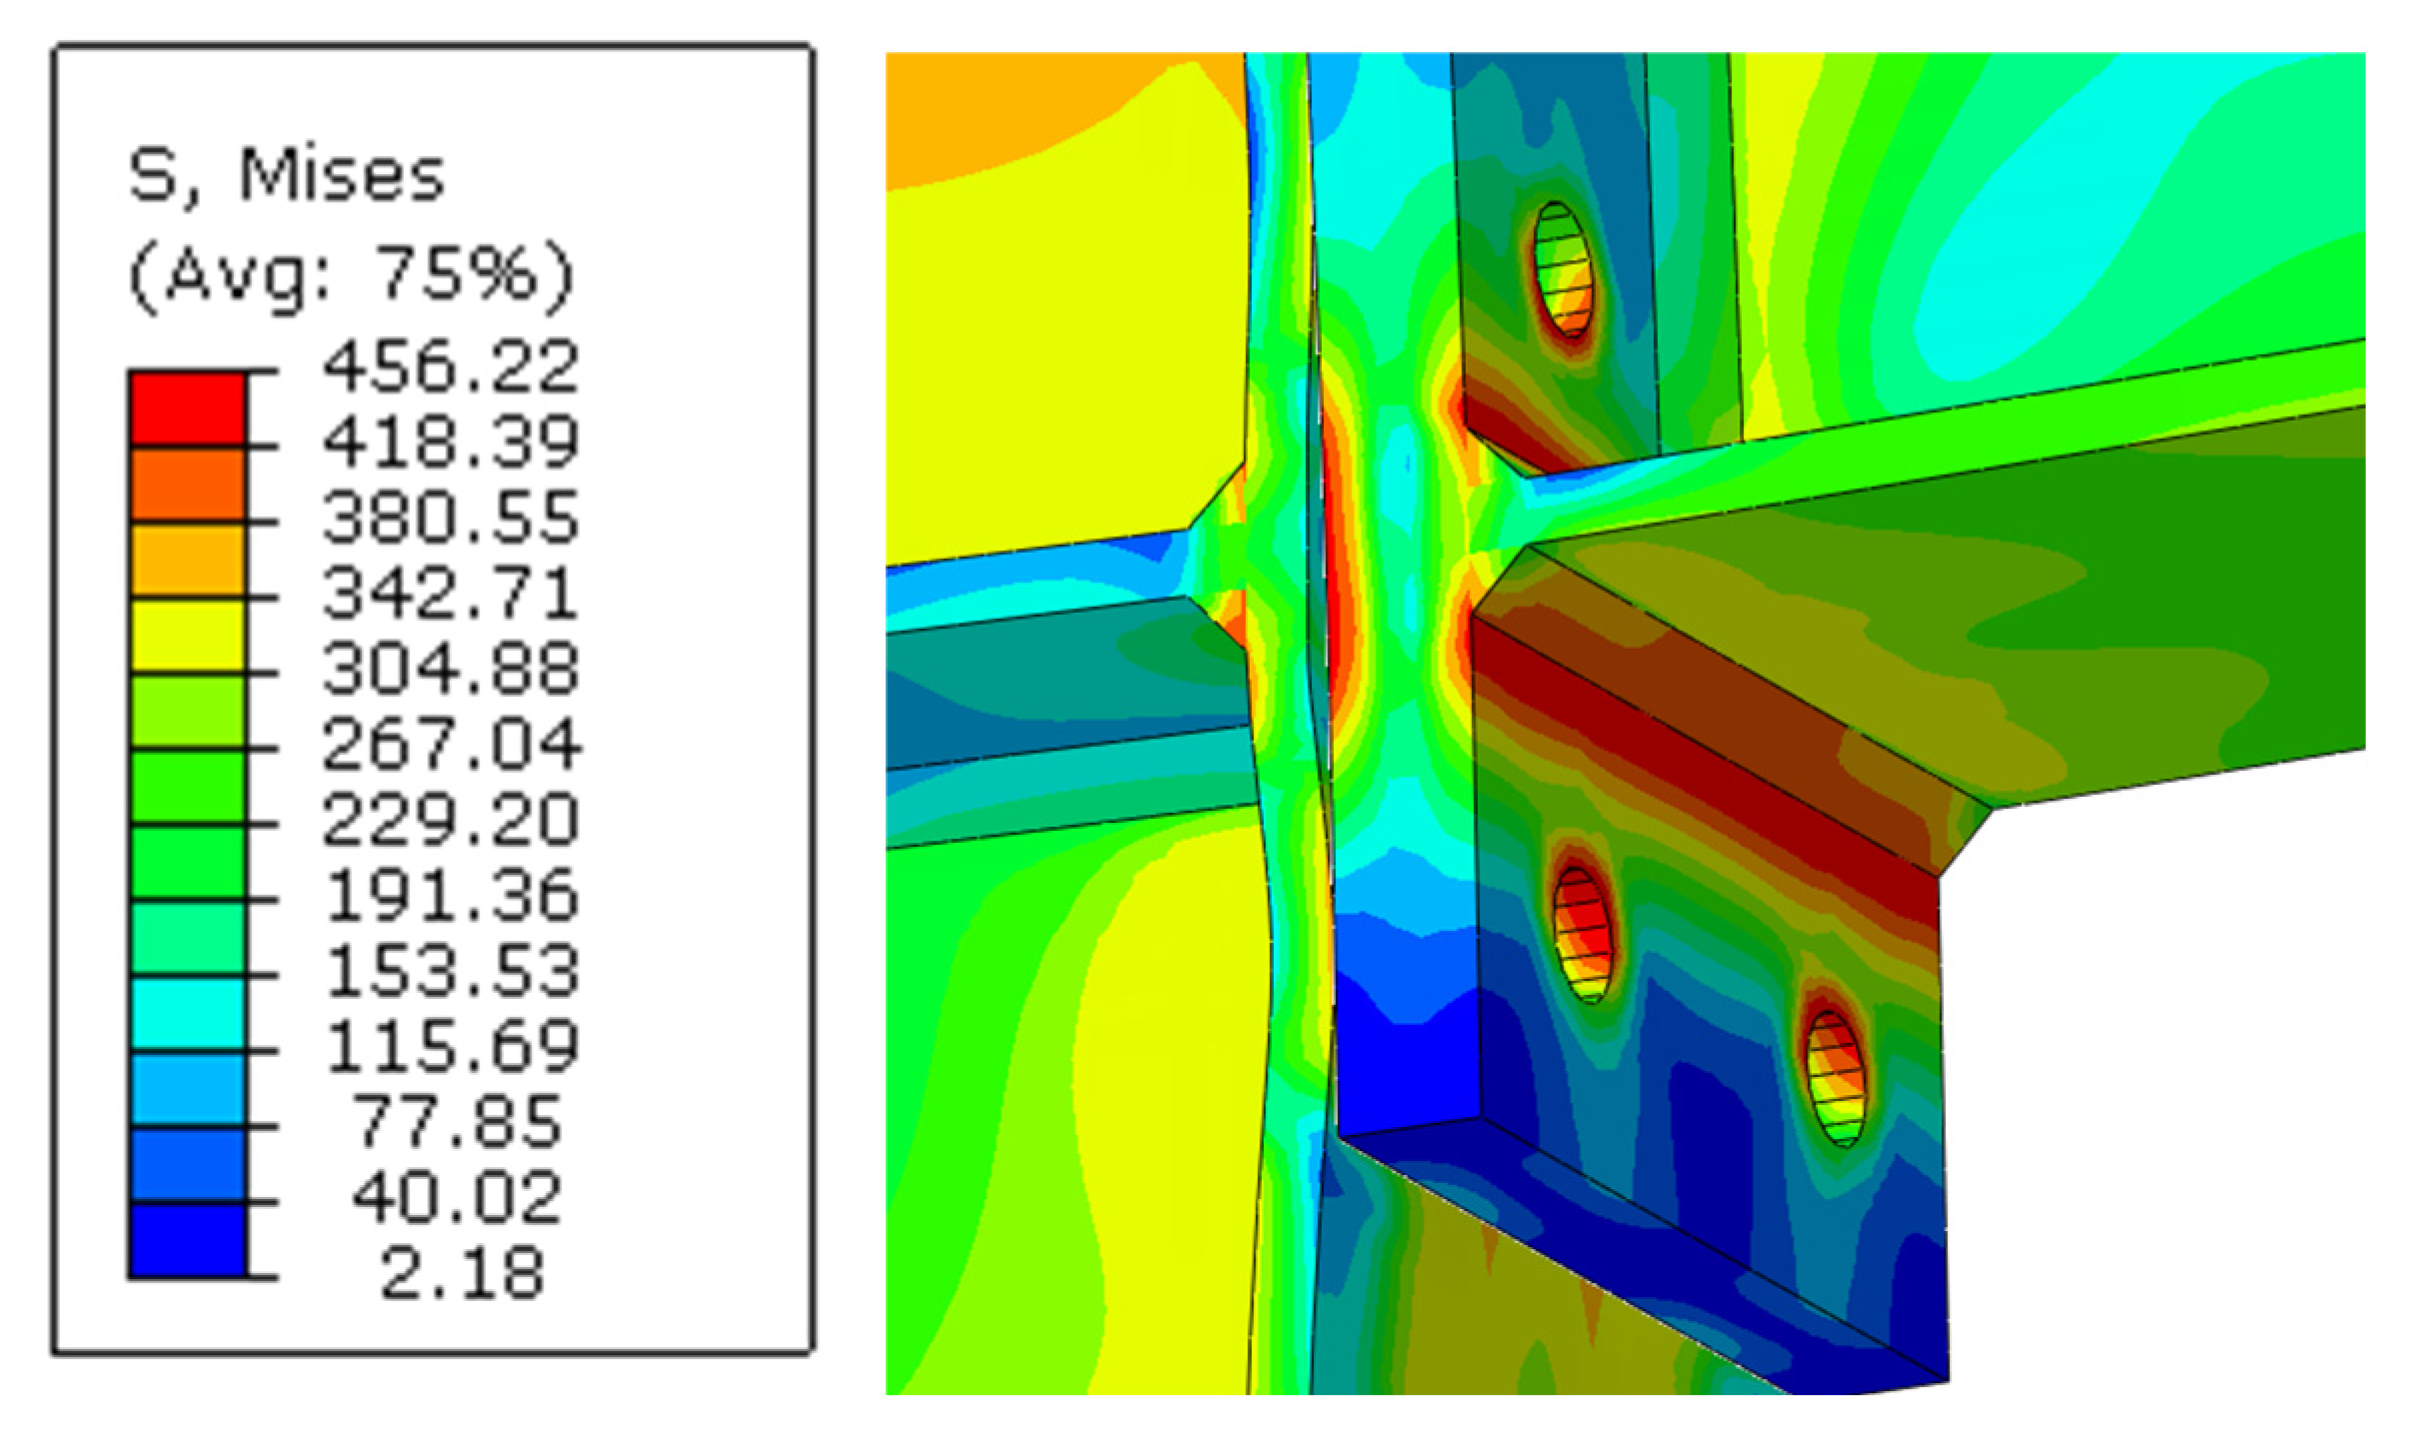
  • The experiment confirmed that the reinforcement method using H-beams had the best performance. Consequently, a computational analysis was conducted to evaluate this method further. The analysis was performed using the general-purpose finite element analysis software Abaqus 2022. The first step was to validate the reliability of the finite element model based on experimental results. For the unreinforced specimen, the finite element analysis results were highly consistent with the experimental data. However, for the reinforced specimens, the results varied significantly depending on the contact elements. Since the contact between surfaces in the actual experiments was not purely frictional, the friction coefficient was adjusted to increase the similarity to the experimental results. Ultimately, it was found that a friction coefficient of 0.2 yielded results similar to those observed in the experiments.
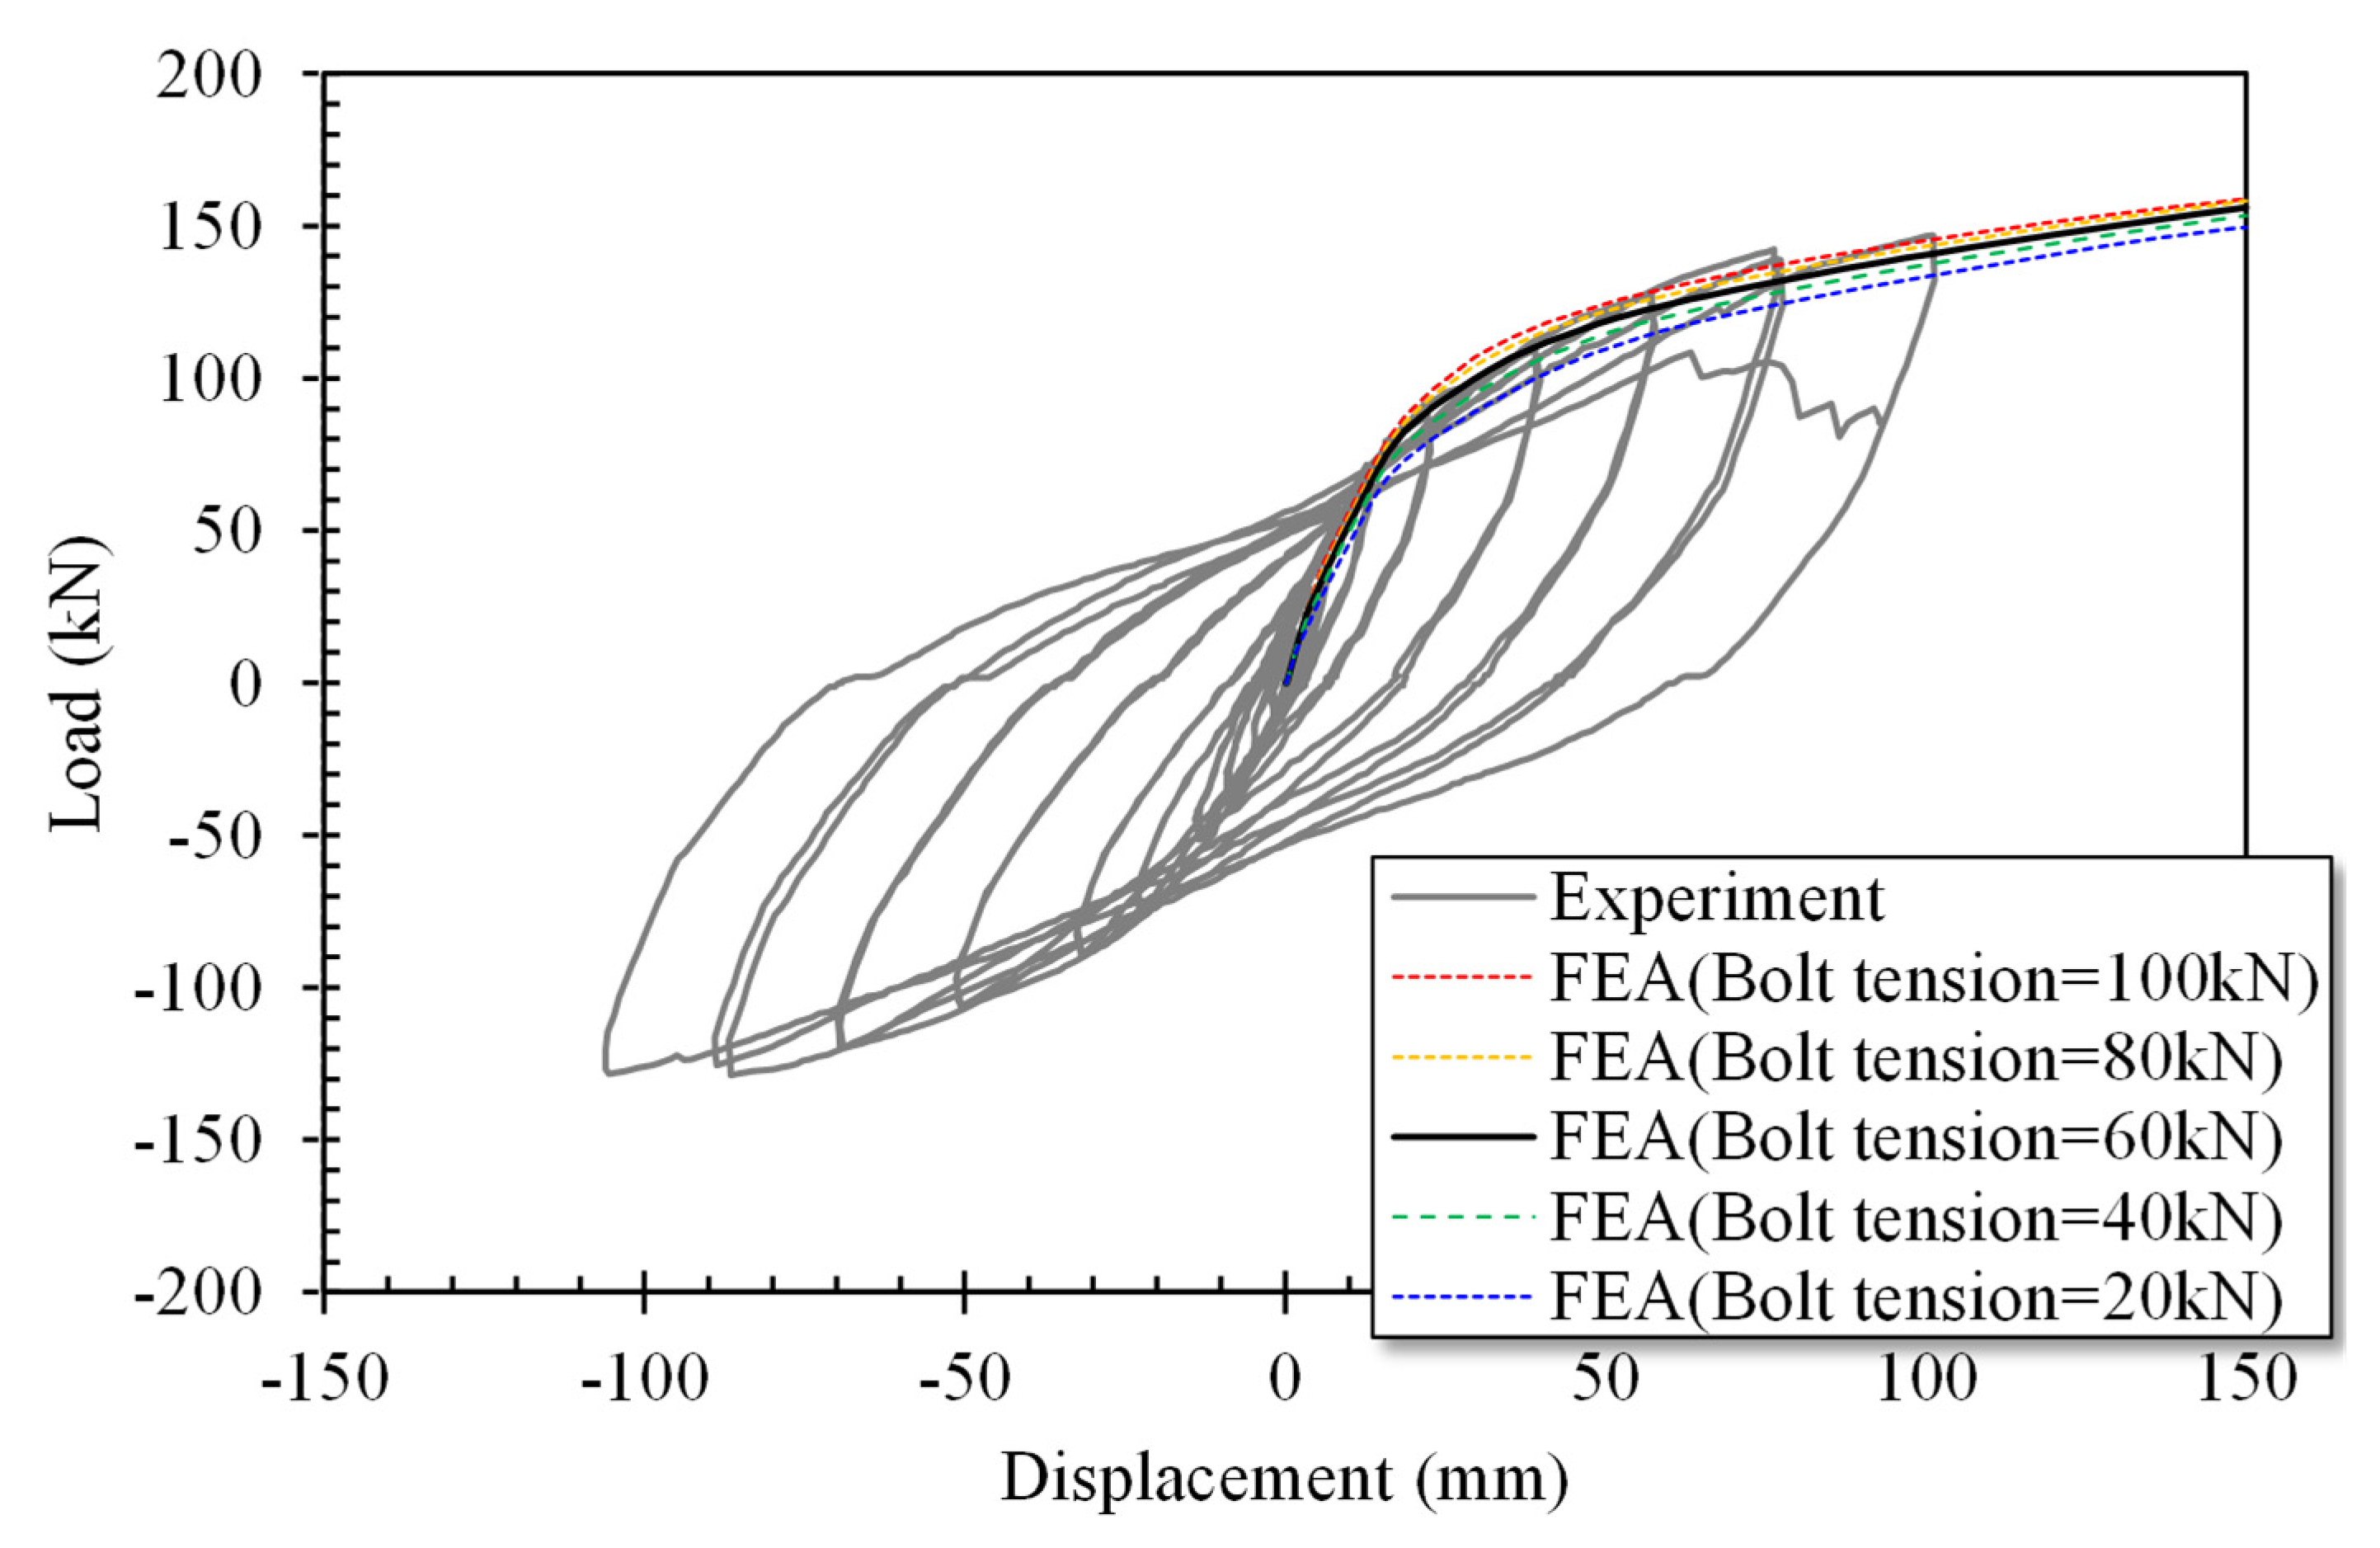
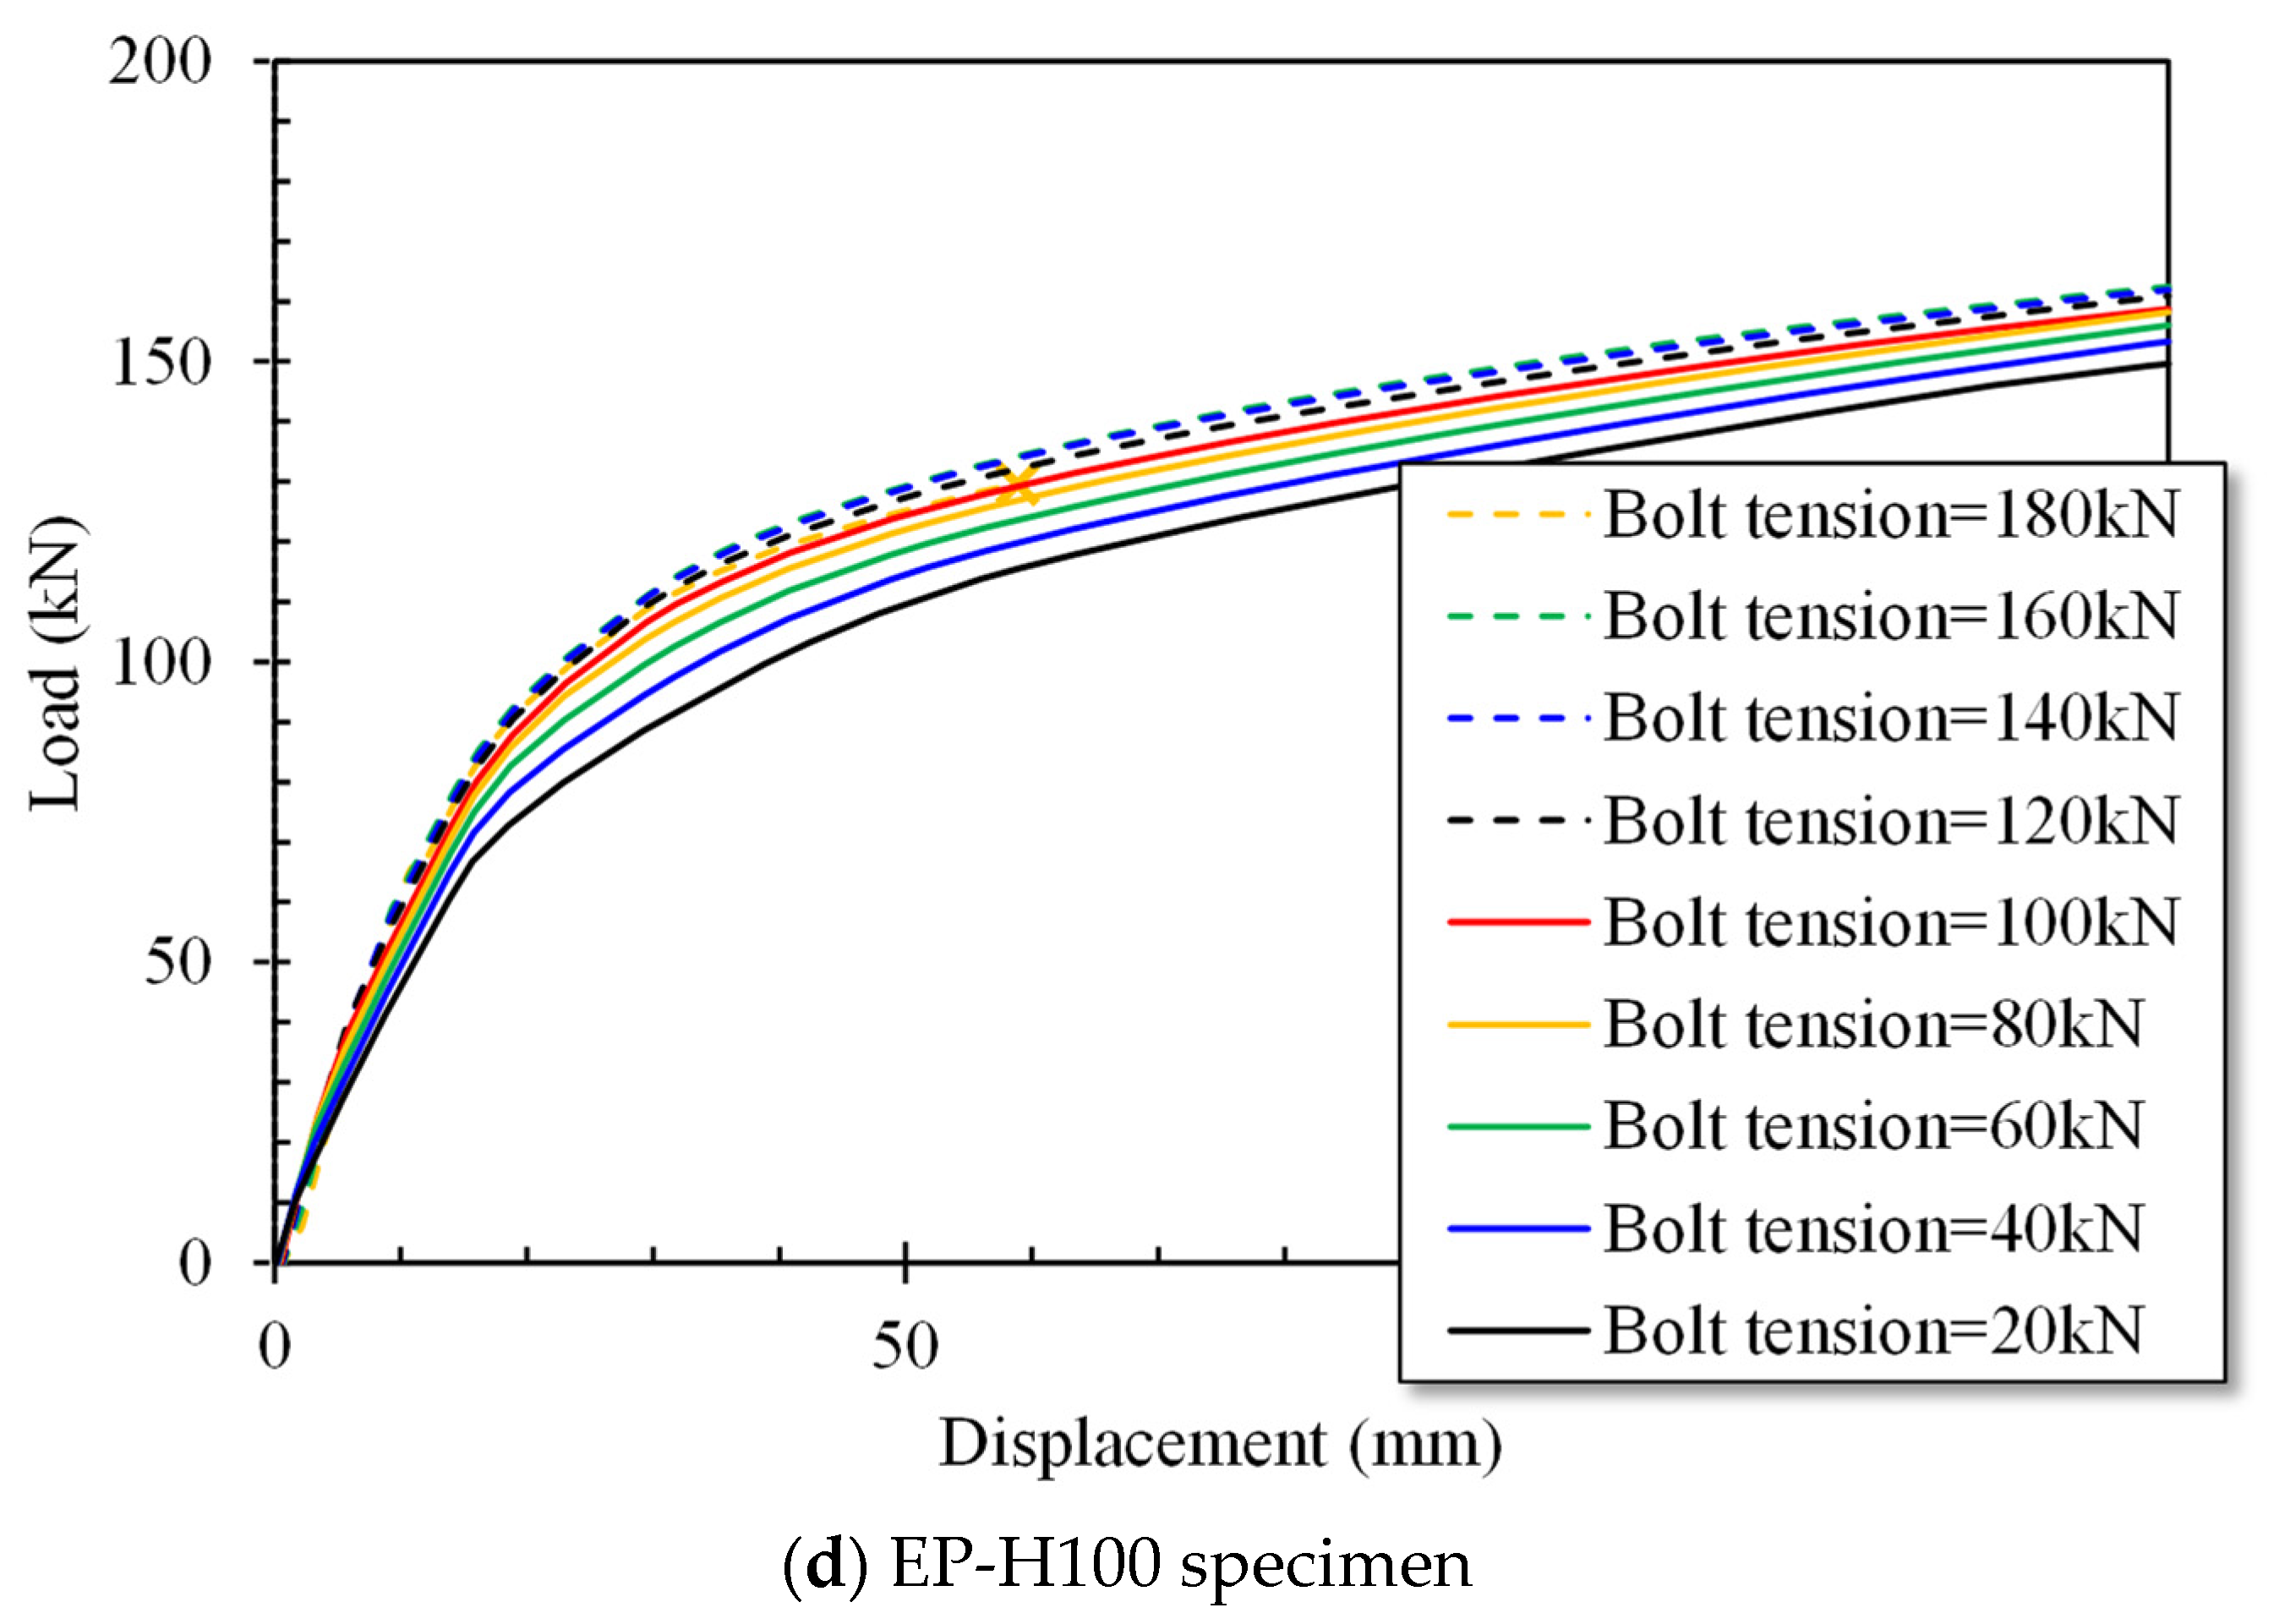
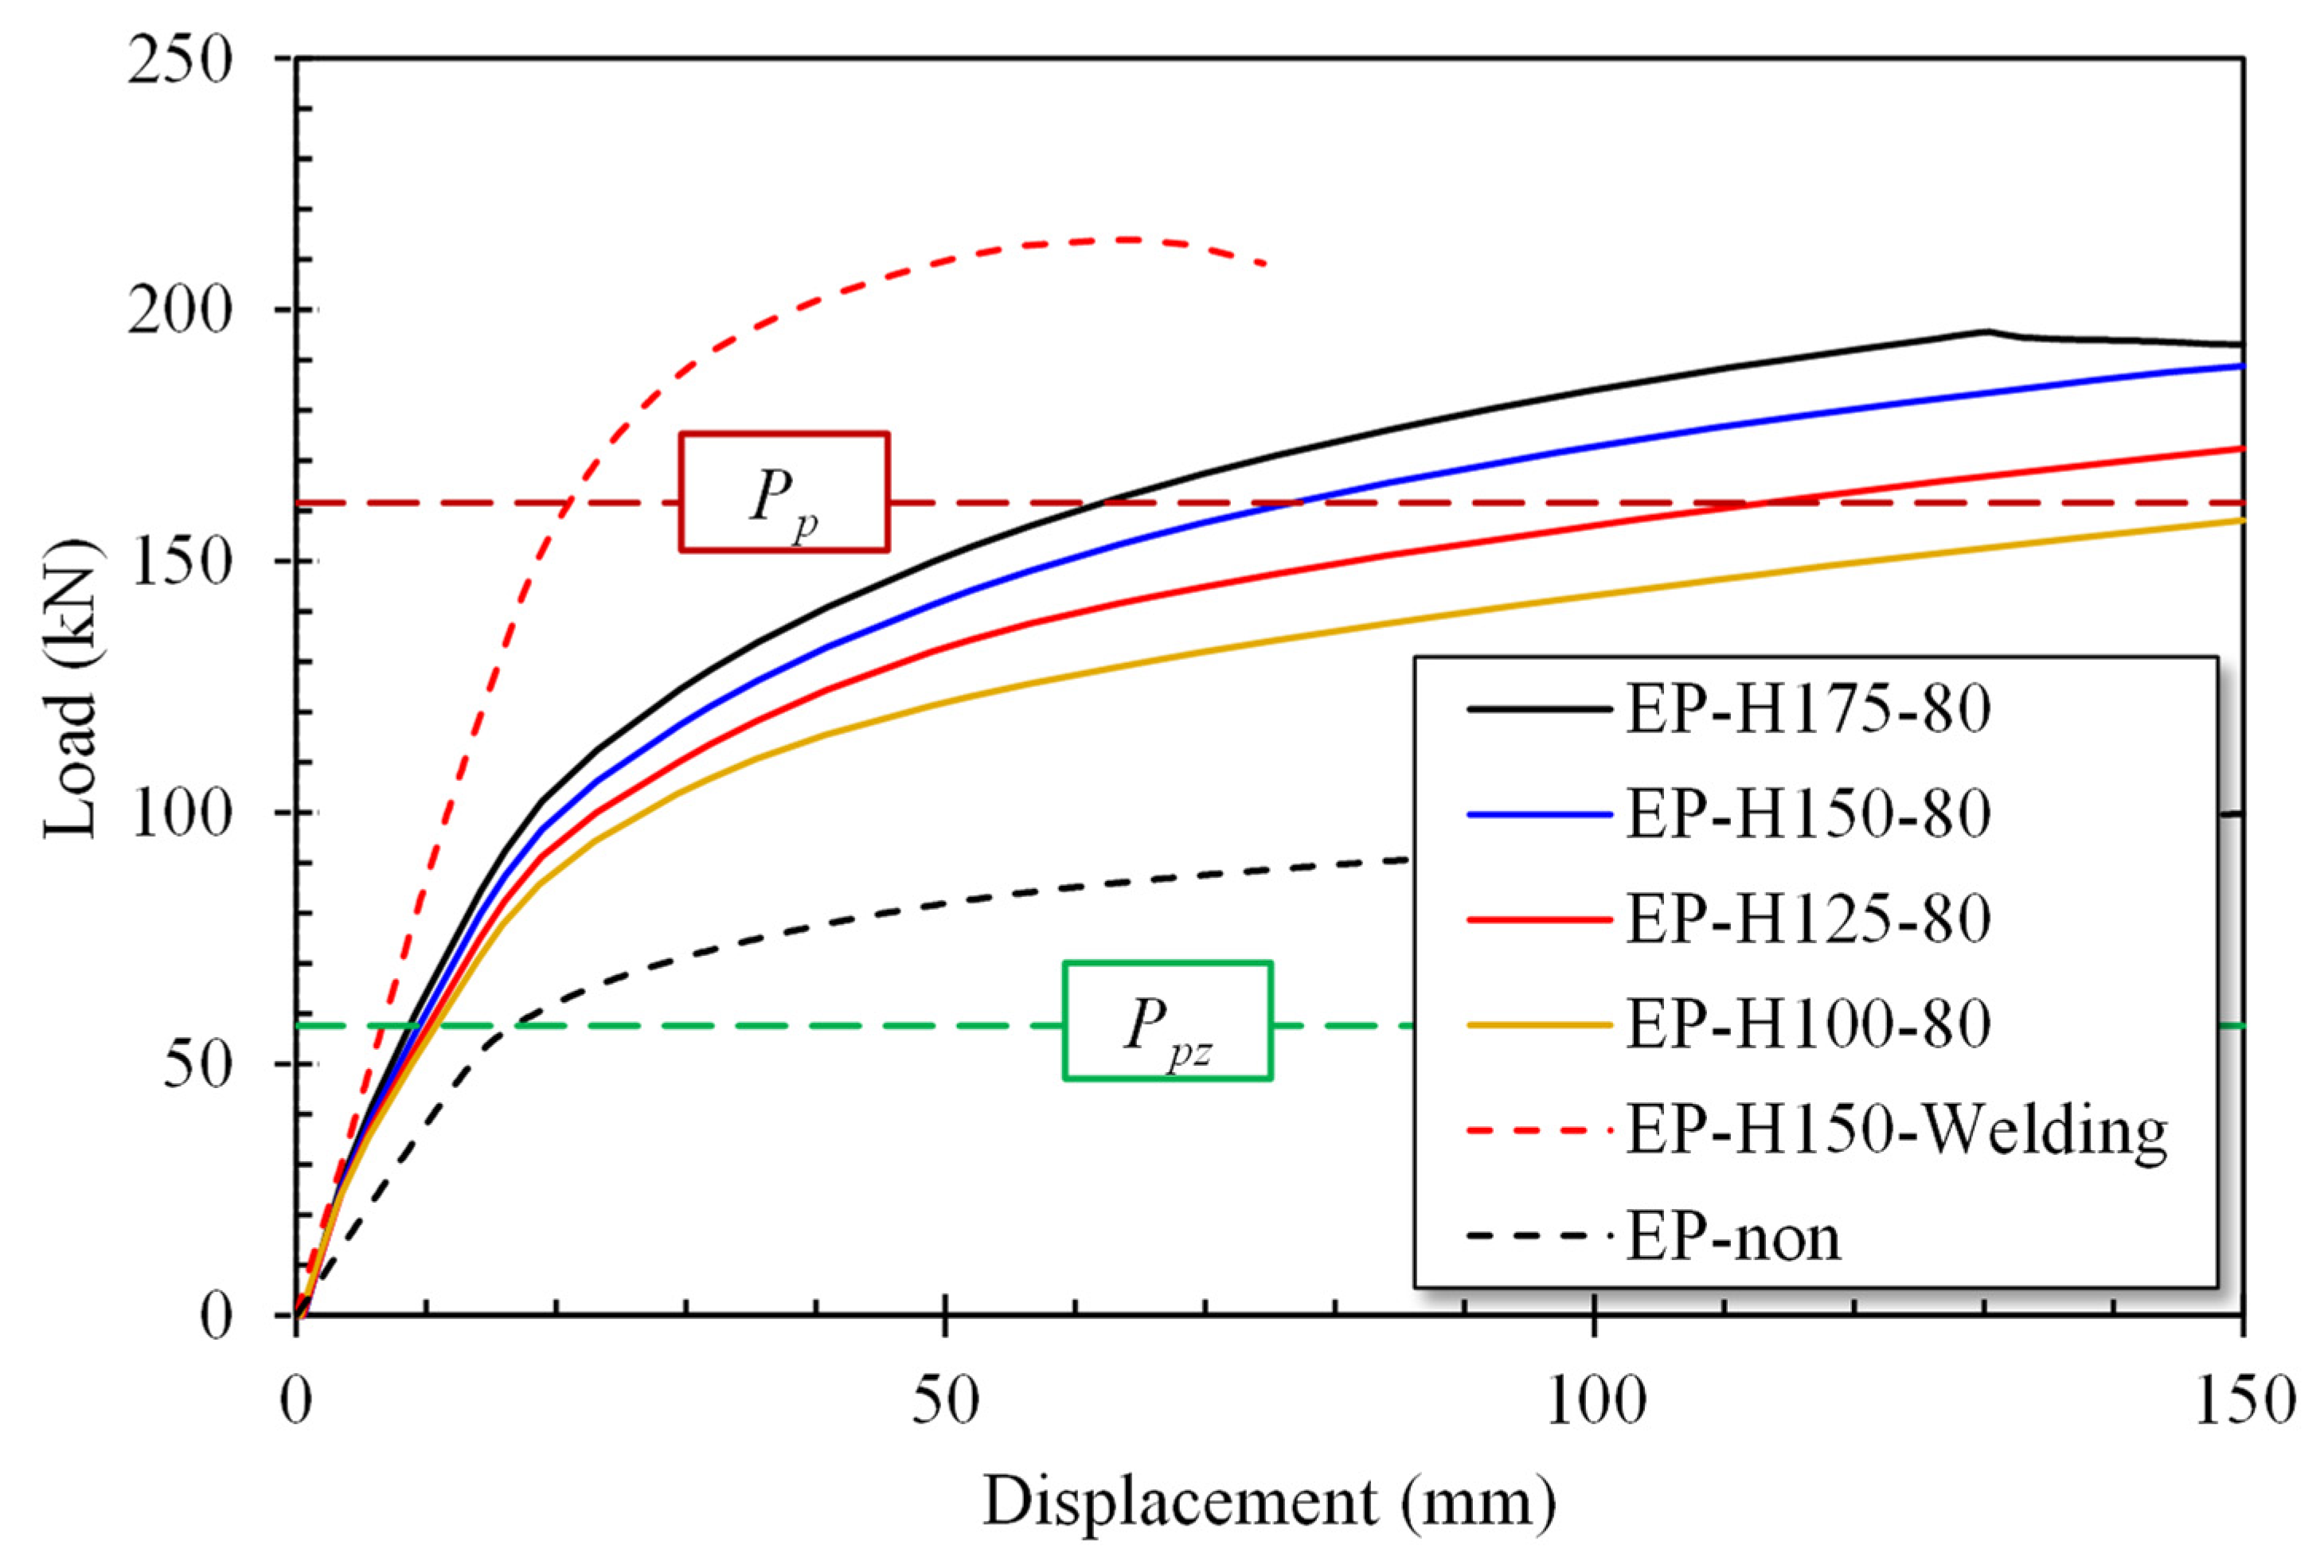
  • Additional parametric analyses were conducted on the tension and member size using the validated finite element model of the reinforcement method. The results indicated that while the stiffness and strength increased with tension, the increases were negligible beyond a certain level of tension. Additionally, the yielding of the reinforcement plate due to increased tension suggested that a tension of 80 kN is safe for this reinforcement method. As the size of the members increased, the internal forces on the reinforcement members also increased, leading to greater stiffness and strength.
  • This reinforcement method is considered highly suitable for strengthening structures in industrial complexes. In such environments, even minor displacements can lead to significant accidents. Traditional reinforcement methods, such as welding or drilling, can increase the risk of accidents. However, using this reinforcement method can reduce the likelihood of such incidents while ensuring sufficient strength enhancement. It is important to note, however, that the effectiveness of this method is highly sensitive to the bolt axial force, and this factor must be carefully considered.
  • This study describes the reinforcement effect of the proposed method. Further research is needed to investigate various factors such as the size of existing members and reinforcement components. Ultimately, in future research, we aim to propose design methods utilizing this reinforcement method.

Author Contributions

Conceptualization, J.-S.L. and J.-H.W.; data curation, J.-S.L. and J.-H.W.; formal analysis, J.-S.L. and J.-H.W.; investigation, J.-S.L. and J.-H.W.; methodology, J.-S.L. and K.-J.S.; project administration, K.-J.S.; resources, J.-S.L. and J.-H.W.; software, J.-S.L.; supervision, K.-J.S. and J.-H.W.; validation, K.-J.S. and J.-H.W.; visualization, J.-S.L. and J.-H.W.; writing—original draft, J.-S.L. and J.-H.W.; writing—review and editing, K.-J.S. and J.-H.W. All authors have read and agreed to the published version of the manuscript.

Funding

This work was supported by the Technology Innovation Program (or Industrial Strategic technology development program, 20017750, Structural Evaluation and Enhancement for Common-use Pipe-Racks in Yeosu National Industrial Complex).

Data Availability Statement

The data presented in this study are available upon request from the corresponding author.

Conflicts of Interest

The authors declare no conflict of interest.

Abbreviations

D u In critical slip connections, a multiplier that reflects the ratio of the mean installed bolt pre-tension to the specified minimum bolt pre-tension.
F u The tensile stress of the coupon.
F y The yield stress of the coupon.
H u 
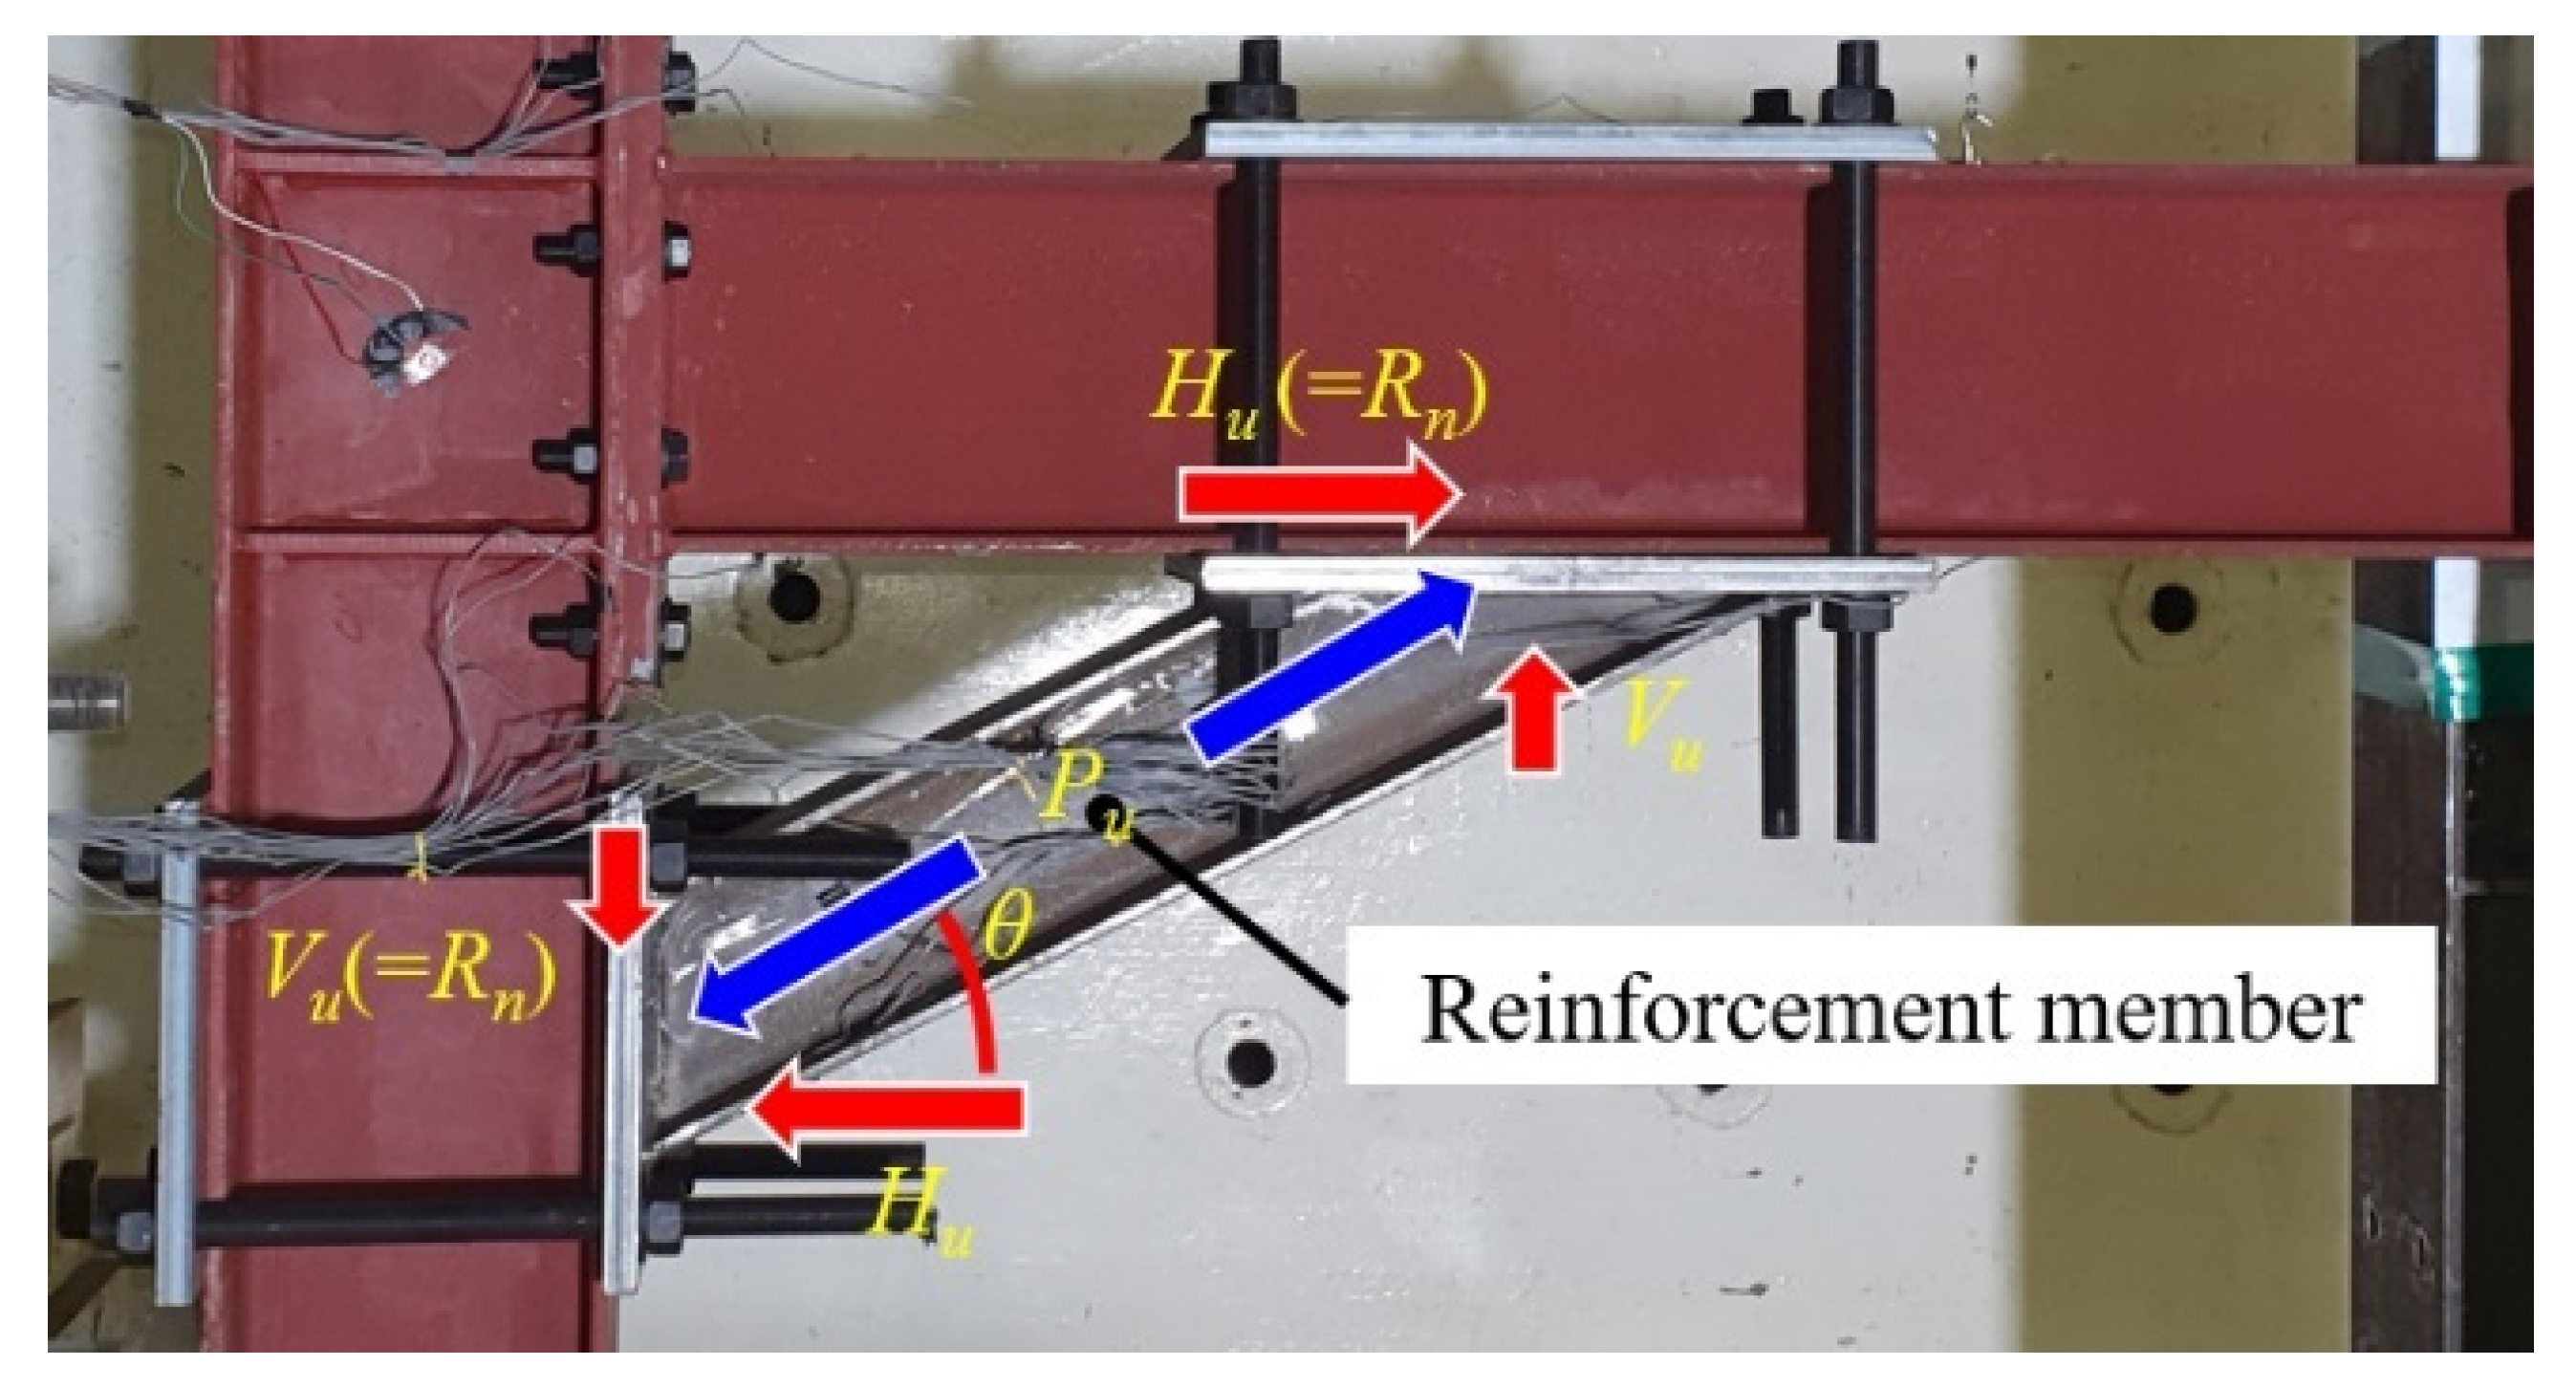
The horizontal force separated from the axial force (= P u ).
M c f The column flange’s flexural strength.
M p The beam’s plastic bending moment.
M p l The end plate’s flexural strength.
M p z The panel zone’s flexural strength.
M r u p No-prying moment for the bolt strength.
P m a x The maximum strength of the specimen.
P u The axial force applied to the reinforcement.
R n The nominal slip resistance.
T b The minimum fastener tension.
V u The vertical force separated from the axial force (= P u ).
h f The factor for fillers.
n s The number of slip planes required to permit the connection to slip.
t The thickness of the coupon.
μ The slip coefficient.
ε l n p l The true plastic strain.
ε n o m The nominal strain.
σ n o m The nominal stress.
σ t r u e The true strain.

References

  1. Xiong, Z.; Zhu, H.; Li, W.; Zhang, A.; Xin, H. Seismic Risk Assessment of a Novel Bridge-Aqueduct Cobuilt Structure. ASCE-ASME J. Risk Uncertain. Eng. Syst. Part A Civ. Eng. 2022, 8, 4–10. [Google Scholar] [CrossRef]
  2. Uckan, E.; Akbas, B.; Shen, J.; Wen, R.; Turandar, K.; Erdik, M. Seismic Performance of Elevated Steel Silos during Van Earthquake, October 23, 2011. Nat. Hazards 2015, 75, 265–287. [Google Scholar] [CrossRef]
  3. Solhmirzaei, A.; Tahamouli Roudsari, M.; Hosseini Hashemi, B. A New Detail for the Panel Zone of Beam-to-Wide Flange Column Connections with Endplate. Structures 2021, 34, 1108–1123. [Google Scholar] [CrossRef]
  4. Krawinkler, H.; Mohasseb, S. Effects of Panel Zone Deformations on Seismic Response. J. Constr. Steel Res. 1987, 8, 233–250. [Google Scholar] [CrossRef]
  5. Ghobarah, A.; Osman, A.; Korol, R.M. Behaviour of Extended End-Plate Connections under Cyclic Loading. Eng. Struct. 1990, 12, 15–27. [Google Scholar] [CrossRef]
  6. Ghobarah, B.A.; Korol, R.M.; Osman, A.; Member, A. Cyclic Behavior of Extended End-Plate Joints. J. Struct. Eng. 1992, 118, 1333–1353. [Google Scholar] [CrossRef]
  7. Özkılıç, Y.O. Cyclic and Monotonic Performance of Unstiffened Extended End-Plate Connections Having Thin End-Plates and Large-Bolts. Eng. Struct. 2023, 281, 115794. [Google Scholar] [CrossRef]
  8. Francavilla, A.B.; Latour, M.; Piluso, V.; Rizzano, G. Design of Full-Strength Full-Ductility Extended End-Plate Beam-to-Column Joints. J. Constr. Steel Res. 2018, 148, 77–96. [Google Scholar] [CrossRef]
  9. Sumner, E.A.; Murray, T.M. Behavior of Extended End-Plate Moment Connections Subject to Cyclic Loading. J. Struct. Eng. 2002, 128, 501–508. [Google Scholar] [CrossRef]
  10. Murray, T.M.; Sumner, E.A. Extended End-Plate Moment Connections Seismic and Wind Applications, 2nd ed.; American Institute of Steel Construction: Chicago, IL, USA, 2003; pp. 1–166. [Google Scholar]
  11. Shi, G.; Shi, Y.; Wang, Y. Behaviour of End-Plate Moment Connections under Earthquake Loading. Eng. Struct. 2007, 29, 703–716. [Google Scholar] [CrossRef]
  12. Saberi, V.; Gerami, M.; Kheyroddin, A. Seismic Rehabilitation of Bolted End Plate Connections Using Post-Tensioned Tendons. Eng. Struct. 2016, 129, 18–30. [Google Scholar] [CrossRef]
  13. Ding, F.X.; Chen, Y.B.; Wang, L.; Pan, Z.C.; Li, C.Y.; Yuan, T.; Deng, C.; Luo, C.; Yan, Q.W.; Liao, C.B. Hysteretic Behavior of CFST Column-Steel Beam Bolted Joints with External Reinforcing Diaphragm. J. Constr. Steel Res. 2021, 183, 106729. [Google Scholar] [CrossRef]
  14. Cao, J.; Du, J.; Fan, Q.; Yang, J.; Bao, C.; Liu, Y. Reinforcement for Earthquake-Damaged Glued-Laminated Timber Knee-Braced Frames with Self-Tapping Screws and CFRP Fabric. Eng. Struct. 2024, 306, 117787. [Google Scholar] [CrossRef]
  15. He, M.; Luo, J.; Tao, D.; Li, Z.; Sun, Y.; He, G. Rotational Behavior of Bolted Glulam Beam-to-Column Connections with Knee Brace. Eng. Struct. 2020, 207, 110251. [Google Scholar] [CrossRef]
  16. Junda, E.; Leelataviwat, S.; Doung, P. Cyclic Testing and Performance Evaluation of Buckling-Restrained Knee-Braced Frames. J. Constr. Steel Res. 2018, 148, 154–164. [Google Scholar] [CrossRef]
  17. Kang, S.H.; Woo, J.H.; Lee, H.D.; Lee, W.G.; Shin, K.J. An Experimental Study on Seismic Performance of Pipe-Rack Using Extended End-Plate Connection. J. Korean Soc. Steel Constr. 2022, 34, 269–277. [Google Scholar] [CrossRef]
  18. Park, H.I.; Kang, S.H.; Lee, H.D.; Lee, Y.J. Strength Evaluation of Flush Type End Plate Connection According to Haunch Shape. J. Korean Soc. Steel Constr. 2023, 35, 199–208. [Google Scholar] [CrossRef]
  19. Nie, S.; Li, J.; Wang, H.; Deng, Y.; Chen, Z.; Elchalakani, M.; Liu, M. Seismic Behavior of Welded High-Performance Steel Beam-to-Column Joints with Different Reinforced Configurations. J. Constr. Steel Res. 2023, 210, 108113. [Google Scholar] [CrossRef]
  20. Ong, C.B.; Chin, C.L.; Ma, C.K.; Tan, J.Y.; Awang, A.Z.; Omar, W. Retrofit of Exterior Reinforced Concrete Beam-Column Joint Using Pre-Tensioned Stiffened Steel Angles. Structures 2022, 46, 1293–1312. [Google Scholar] [CrossRef]
  21. Liu, X.; Gernay, T.; Li, L.Z.; Lu, Z. dao Seismic Performance of Post-Fire Reinforced Concrete Beam-Column Joints Strengthened with Steel Haunch System. Eng. Struct. 2021, 234, 111978. [Google Scholar] [CrossRef]
  22. Sheikh, S.A. Performance of Concrete Structures Retrofitted with Fibre Reinforced Polymers. Eng. Struct. 2002, 24, 869–879. [Google Scholar] [CrossRef]
  23. Manikandan, R.K.; Shunmugapriya, K.; Arunprasad, J.; Sugumar, S.; Manikandan, D. Retrofitting of Reinforced Concrete Beams Using CFRP with Various Adhesive. Mater. Today Proc. 2022, 68, 1635–1640. [Google Scholar] [CrossRef]
  24. Lee, S.H.; Lee, H. Du Shear Strengthening Effect by External Post-Tensioning Steel Rods in Damaged Reinforced Concrete Beams. Structures 2024, 62, 106327. [Google Scholar] [CrossRef]
  25. American Institute of Steel Construction. Specification for Structural Steel Buildings. 2010, pp. 1–612. Available online: https://www.aisc.org/globalassets/aisc/publications/standards/a360-16-spec-and-commentary.pdf (accessed on 30 July 2024).
  26. FEMA 350—Recommended Seismic Design Criteria for New Steel Moment-Frame Buildings. Available online: https://nehrpsearch.nist.gov/static/files/FEMA/PB2007111285.pdf (accessed on 30 July 2024).
  27. ASTMA370-22; Standard Test Methods and Definitions for Mechanical Testing of Steel Products. ASTM International: West Conshohocken, PA, USA, 2017.
  28. ABAQUS. AbaqusUser’s Manual Version 2021; Dassault Systèmes Simulia Corp.: Providence, RI, USA, 2021. [Google Scholar]
Figure 1. Pipe rack steel structures.
Buildings 14 02637 g001
Figure 2. Details of specimens.
Buildings 14 02637 g002
Figure 3. Test setup.
Buildings 14 02637 g003
Figure 4. Moment distribution of reinforcements.
Buildings 14 02637 g004
Figure 5. Calculation process for determining bolt tension for reinforcement.
Buildings 14 02637 g005
Figure 6. Method of reinforcement for plate strength calculation.
Buildings 14 02637 g006
Figure 7. Load−displacement curves of tests.
Buildings 14 02637 g007aBuildings 14 02637 g007b
Figure 8. Failure modes of examined specimens.
Buildings 14 02637 g008
Figure 9. Energy dissipation values of examined specimens.
Buildings 14 02637 g009
Figure 10. Modeling of FEA.
Buildings 14 02637 g010
Figure 11. Analysis results (EP-non specimen).
Buildings 14 02637 g011
Figure 12. Distribution of von Mises stress (end of experiment).
Buildings 14 02637 g012
Figure 13. FEA results according to friction coefficient.
Buildings 14 02637 g013
Figure 14. Analysis results for bolt tension (EP-H150-80).
Buildings 14 02637 g014
Figure 15. Analysis results for bolt tension (EP-H100-80).
Buildings 14 02637 g015
Figure 16. von Mises stress distribution at weld joint.
Buildings 14 02637 g016
Figure 17. Results of the variable analysis.
Buildings 14 02637 g017aBuildings 14 02637 g017b
Figure 18. von Mises stress on reinforcement plate (bolt tension 80 kN).
Buildings 14 02637 g018
Figure 19. Comparison based on member size.
Buildings 14 02637 g019
Table 1. Details of the test specimens.
No.Specimens *End Plate Thickness
(mm)
H-Beam Size (mm)Reinforcement Member SizeBolt Pre-Tension
(kN)
Note
1EP-non25H-244 × 175 × 7 × 11---
2EP-H150-40H-150 × 150 × 7 × 1040Fixed–Fixed
Reinforcement Method
3EP-H150-8080
4EP-H100-80H-100 × 100 × 6 × 8
5EP-SB-80D28 Steel barPinned–Pinned
Reinforcement Method
* EP (end plate)–reinforcement member size–bolt tension.
Table 2. Calculation results of slip resistance.
Specimens P u
(kN)
H u ( = R n )
(kN)
V u
(kN)
EP-H150-40393.93337.79202.68
EP-H150-80
EP-H100-80390.34334.72200.83
EP-SB-80274.28235.20141.12
Table 3. Material test results.
No.Steel Gradet
(mm)
Fy
(MPa)
Fu
(MPa)
Elongation
(%)
1A366326.40465.2036.86
27318.67470.3339.03
38330.20475.2035.61
410318.70461.8034.41
511307.78466.9439.89
620284.40445.9033.70
7A57225400.97540.8138.74
8S45CD = 28630.43765.5223.61
Table 4. Theoretical calculation results.
Mp
(kN·m)
Mpz
(kN·m)
Mpl
(kN·m)
Mcf
(kN·m)
Mrup
(kN·m)
171.49103.82176.40104.73171.99
Table 5. Test results.
No.SpecimensMaximum Load (kN)Displacement
(mm)
Rotation Angle
(rad)
P m a x P m a x , E P n o n Failure
Mode
Positive (+)Negative (−)Positive (+)Negative (−)Positive (+)Negative (−)
1EP-non99.0396.08117.3896.070.0630.0531.00Bolt
failure
2EP-H150-40146.92128.85101.1586.520.0540.0471.48Weld
failure
3EP-H150-80175.93132.2197.8888.260.0530.0471.78Weld
failure
4EP-H100-80133.02118.8954.7354.810.0290.0291.34Weld
failure
5EP-SB-80120.7498.62120.7498.620.0450.0561.22Weld failure
Steel bar buckling
Table 6. Summary of variable analysis.
No.SpecimensReinforcement
Member Size
Bolt Tension
(kN)
1EP-H175-20H-175 × 175 × 7.5 × 1120
2EP-H175-4040
3EP-H175-6060
4EP-H175-8080
5EP-H175-100100
6EP-H150-20H-150 × 150 × 7 × 1020
7EP-H150-4040
8EP-H150-6060
9EP-H150-8080
10EP-H150-100100
11EP-H150-120120
12EP-H150-140140
13EP-H150-WeldingWelding
14EP-H125-20H-125 × 125 × 6.5 × 920
15EP-H125-4040
16EP-H125-6060
17EP-H125-8080
18EP-H125-100100
19EP-H125-120120
20EP-H125-140140
21EP-H125-160160
22EP-H100-20H-100 × 100 × 6 × 820
23EP-H100-4040
24EP-H100-6060
25EP-H100-8080
26EP-H100-100100
27EP-H100-120120
28EP-H100-140140
29EP-H100-160160
30EP-H100-180180
Disclaimer/Publisher’s Note: The statements, opinions and data contained in all publications are solely those of the individual author(s) and contributor(s) and not of MDPI and/or the editor(s). MDPI and/or the editor(s) disclaim responsibility for any injury to people or property resulting from any ideas, methods, instructions or products referred to in the content.

