
Forward Simulation and Complex Signal Analysis of Concrete Crack Depth Detection Using Tracer Electromagnetic Method


Abstract
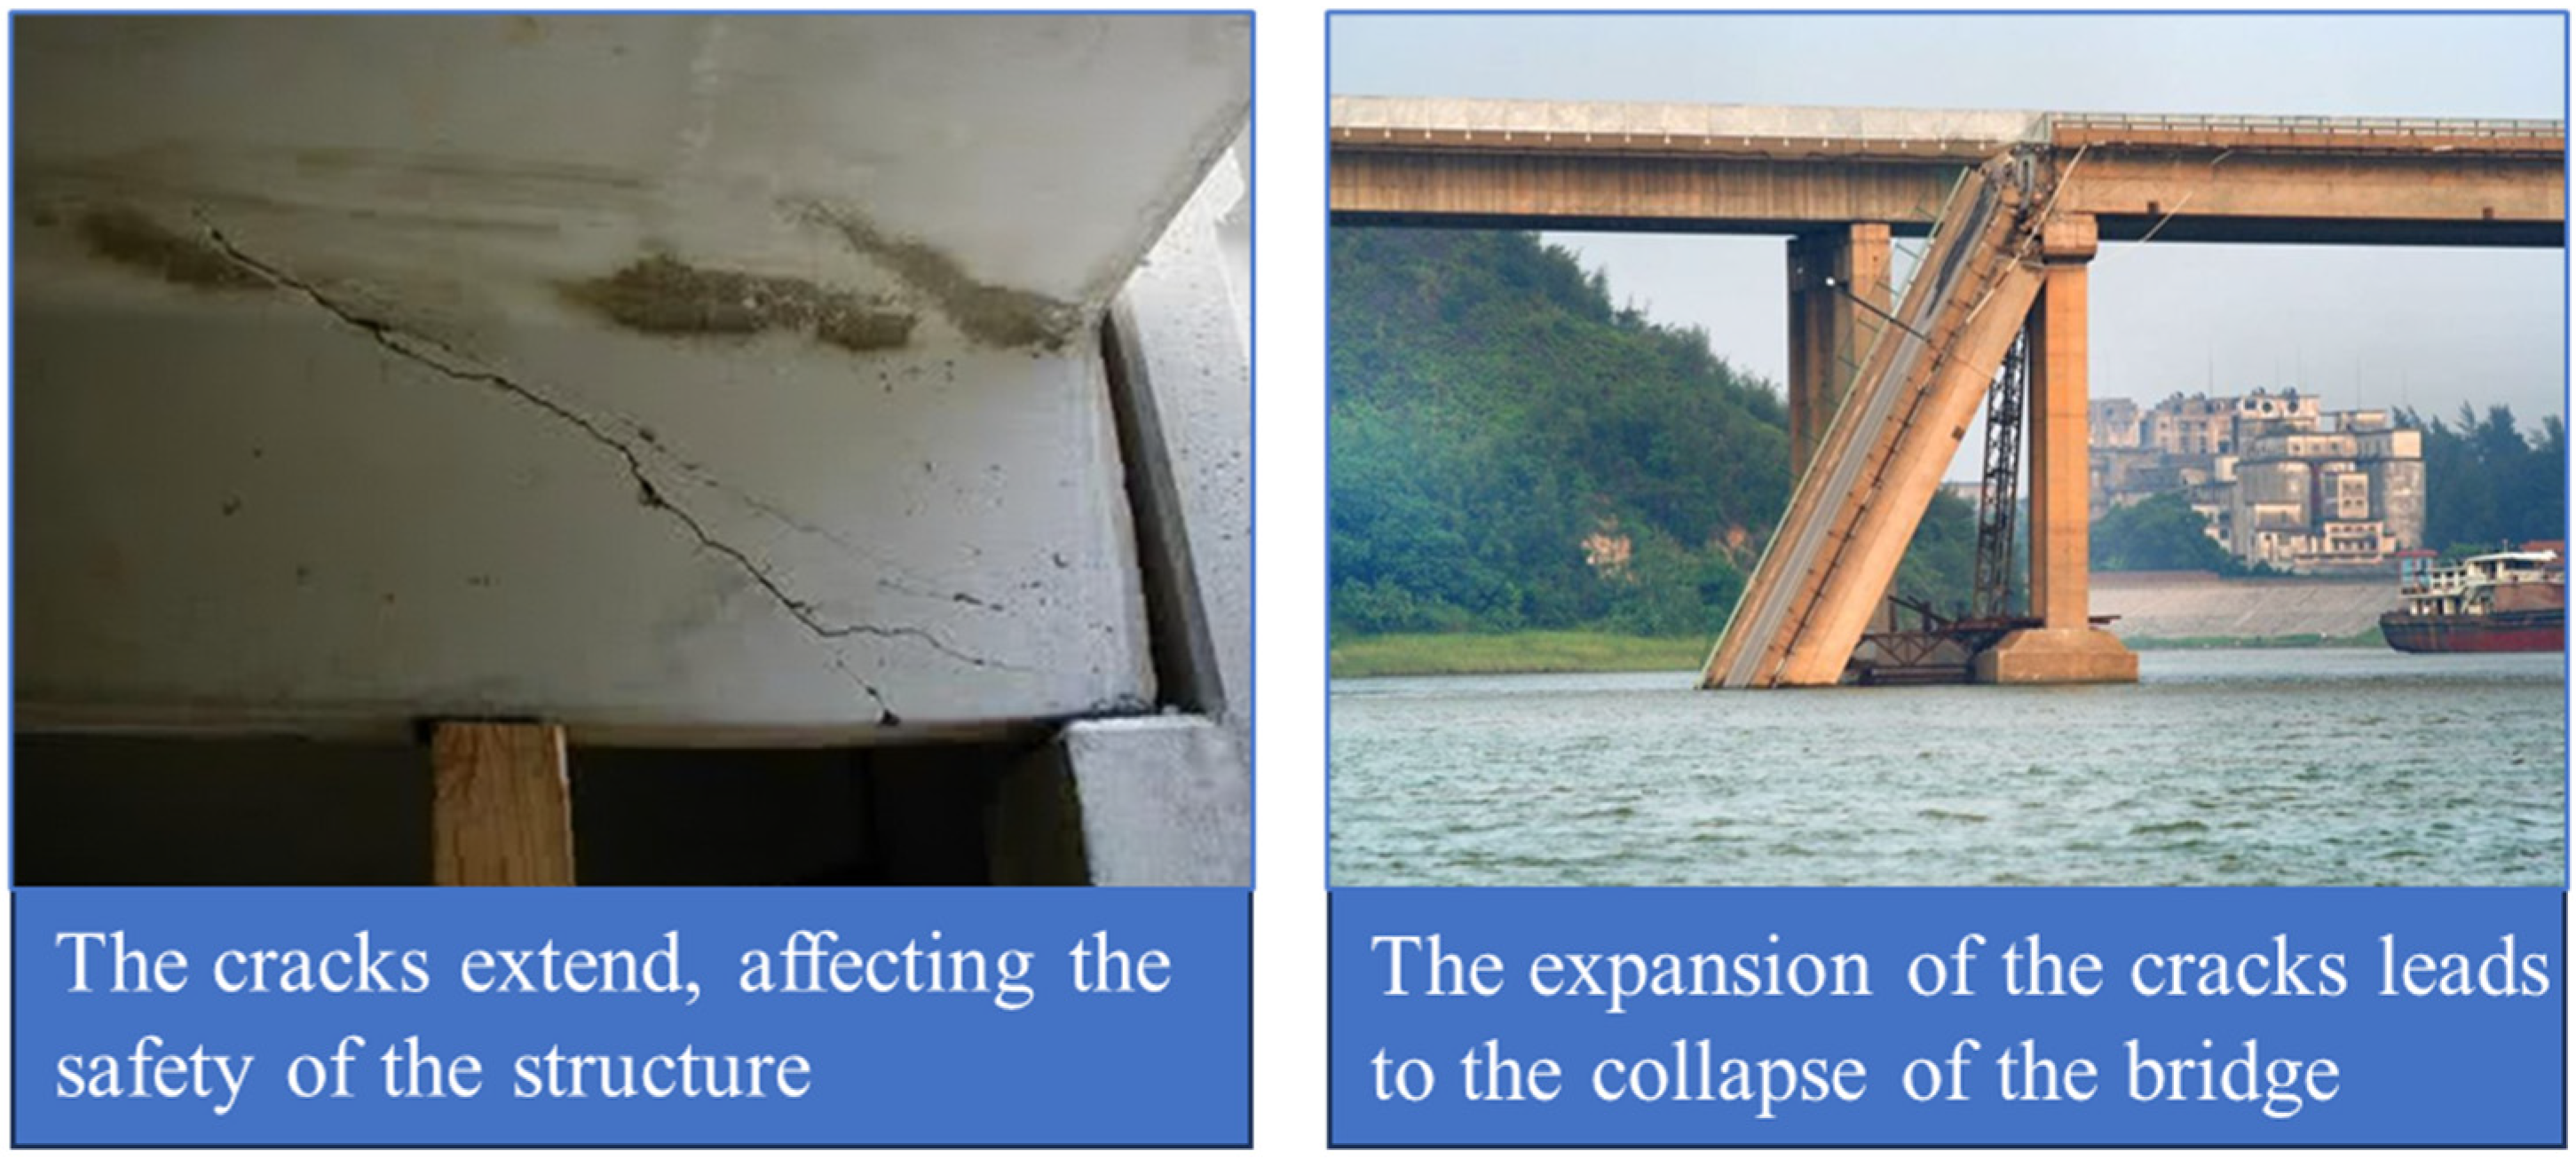
:1. Introduction
2. Principal Analysis
2.1. Tracer Electromagnetic Detection Principle
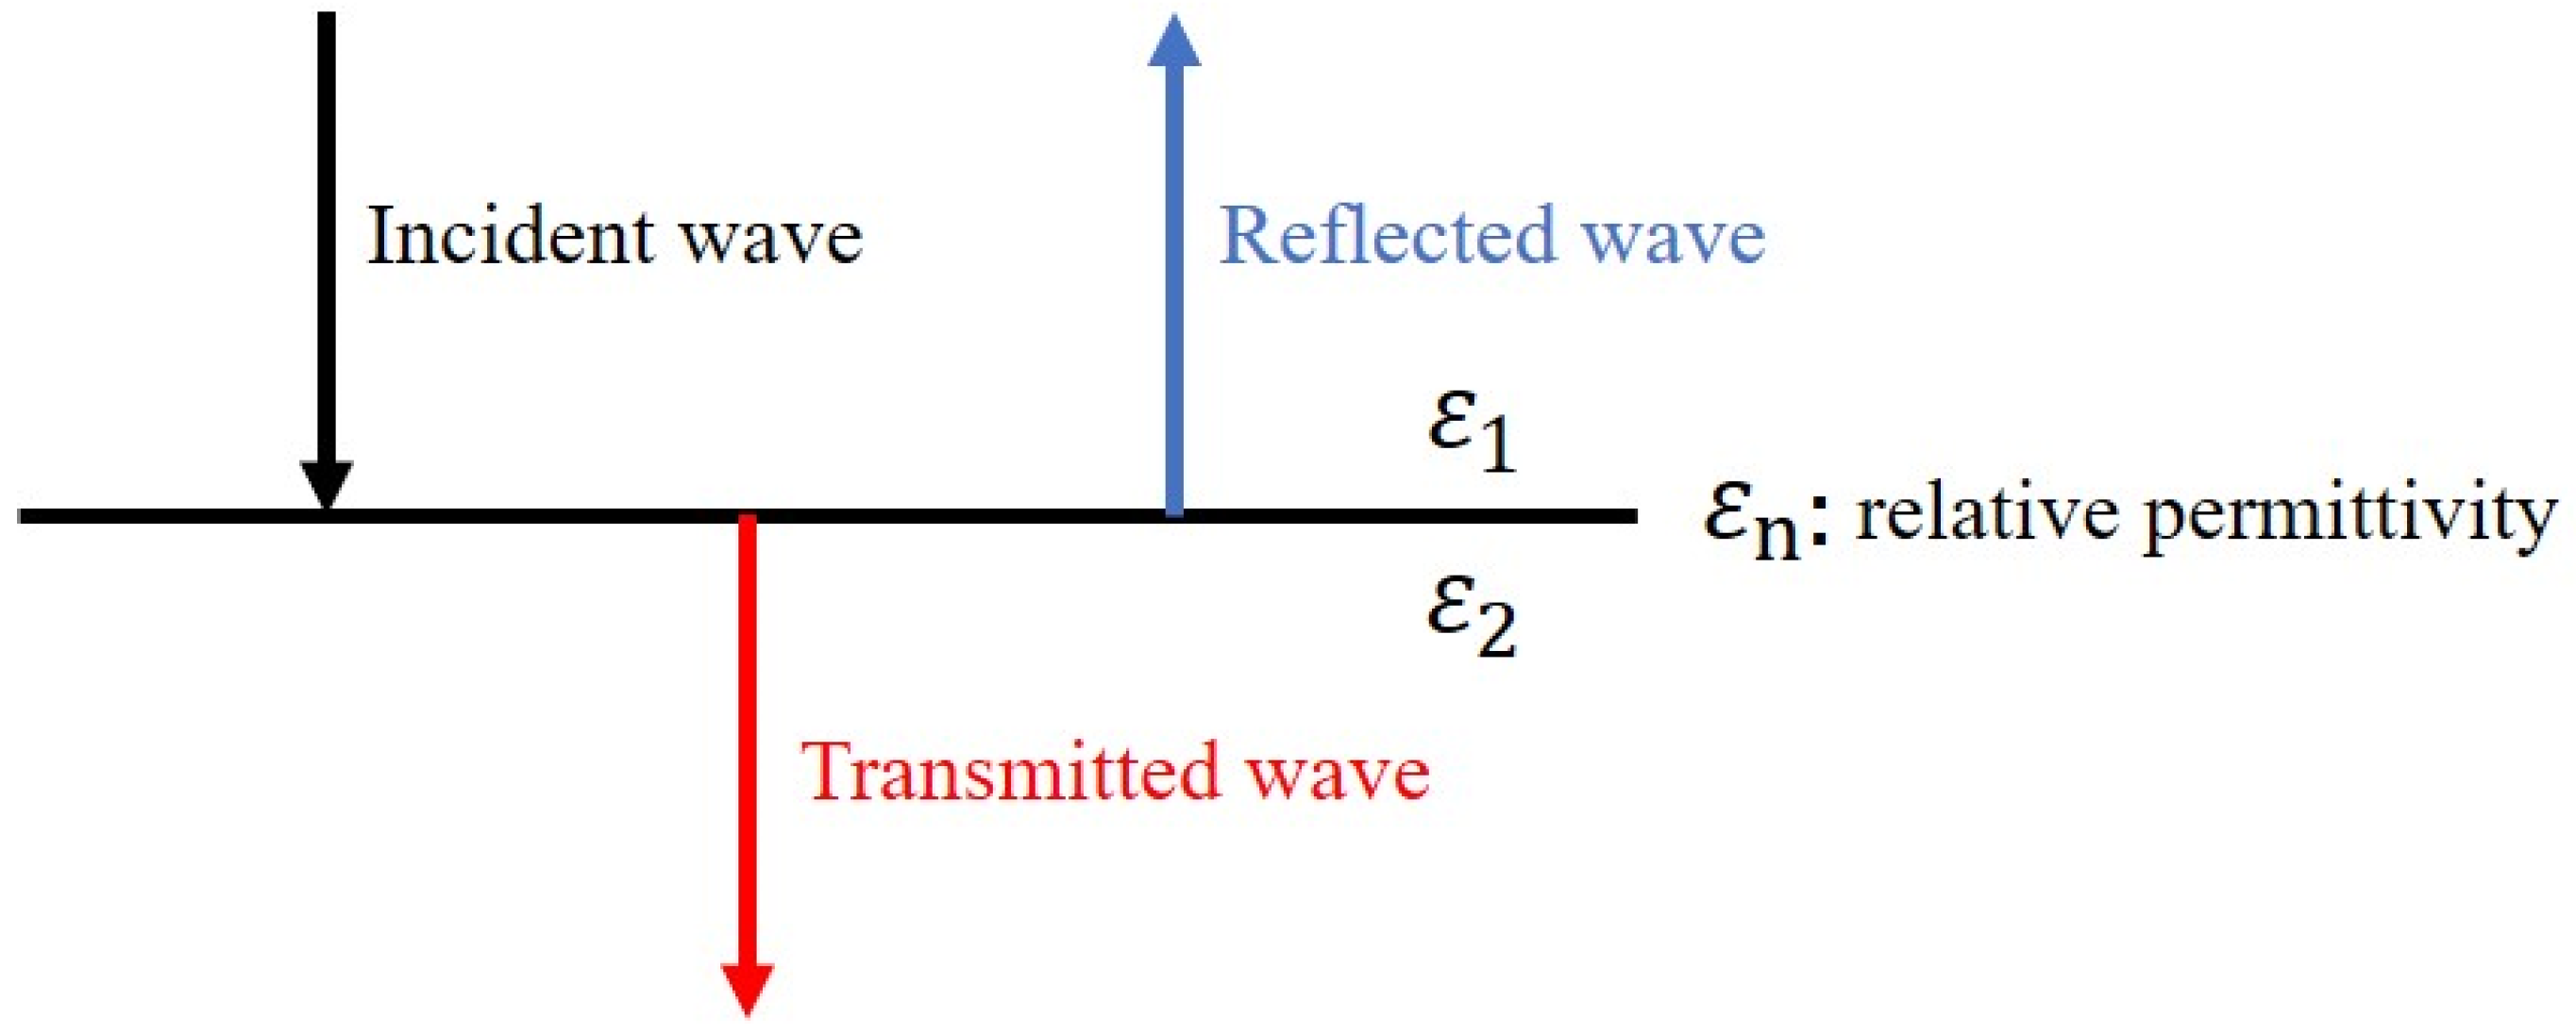
2.1.1. Electromagnetic Wave Propagation Characteristics
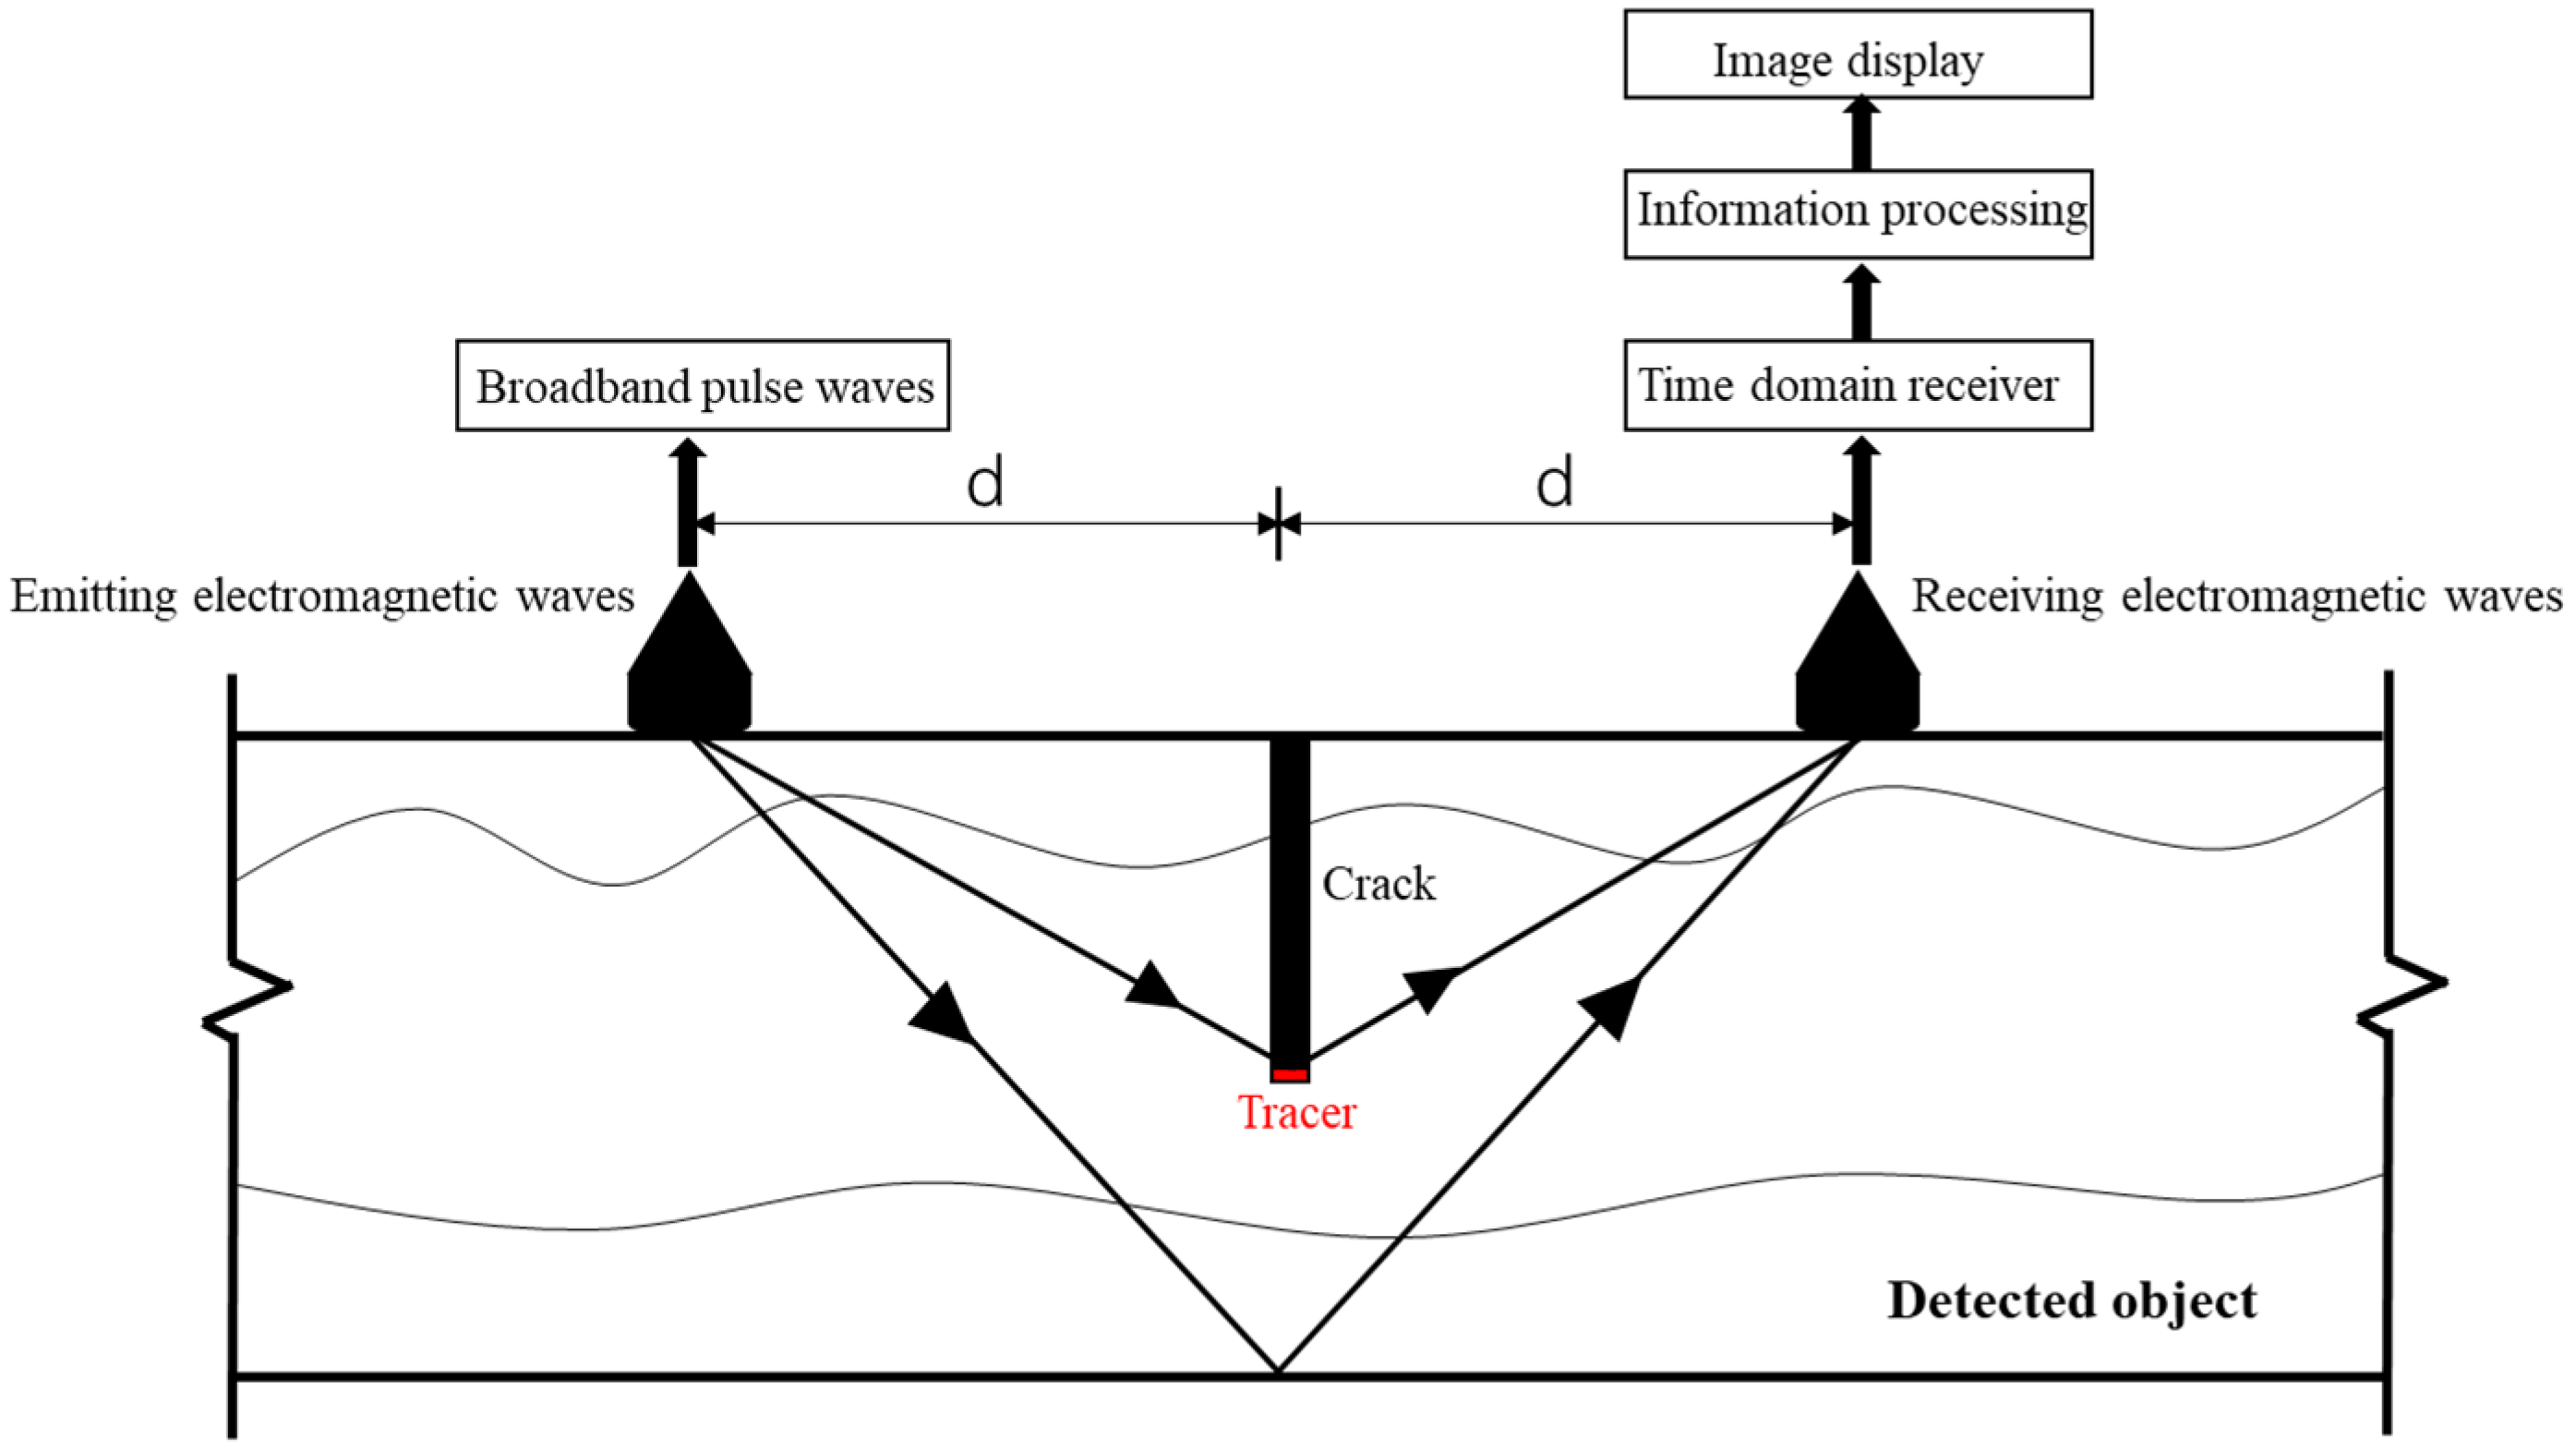
2.1.2. Analysis of the Detection Principle of Tracer Electromagnetic Method
2.2. Principles of Complex Signal Analysis
3. Numerical Examples
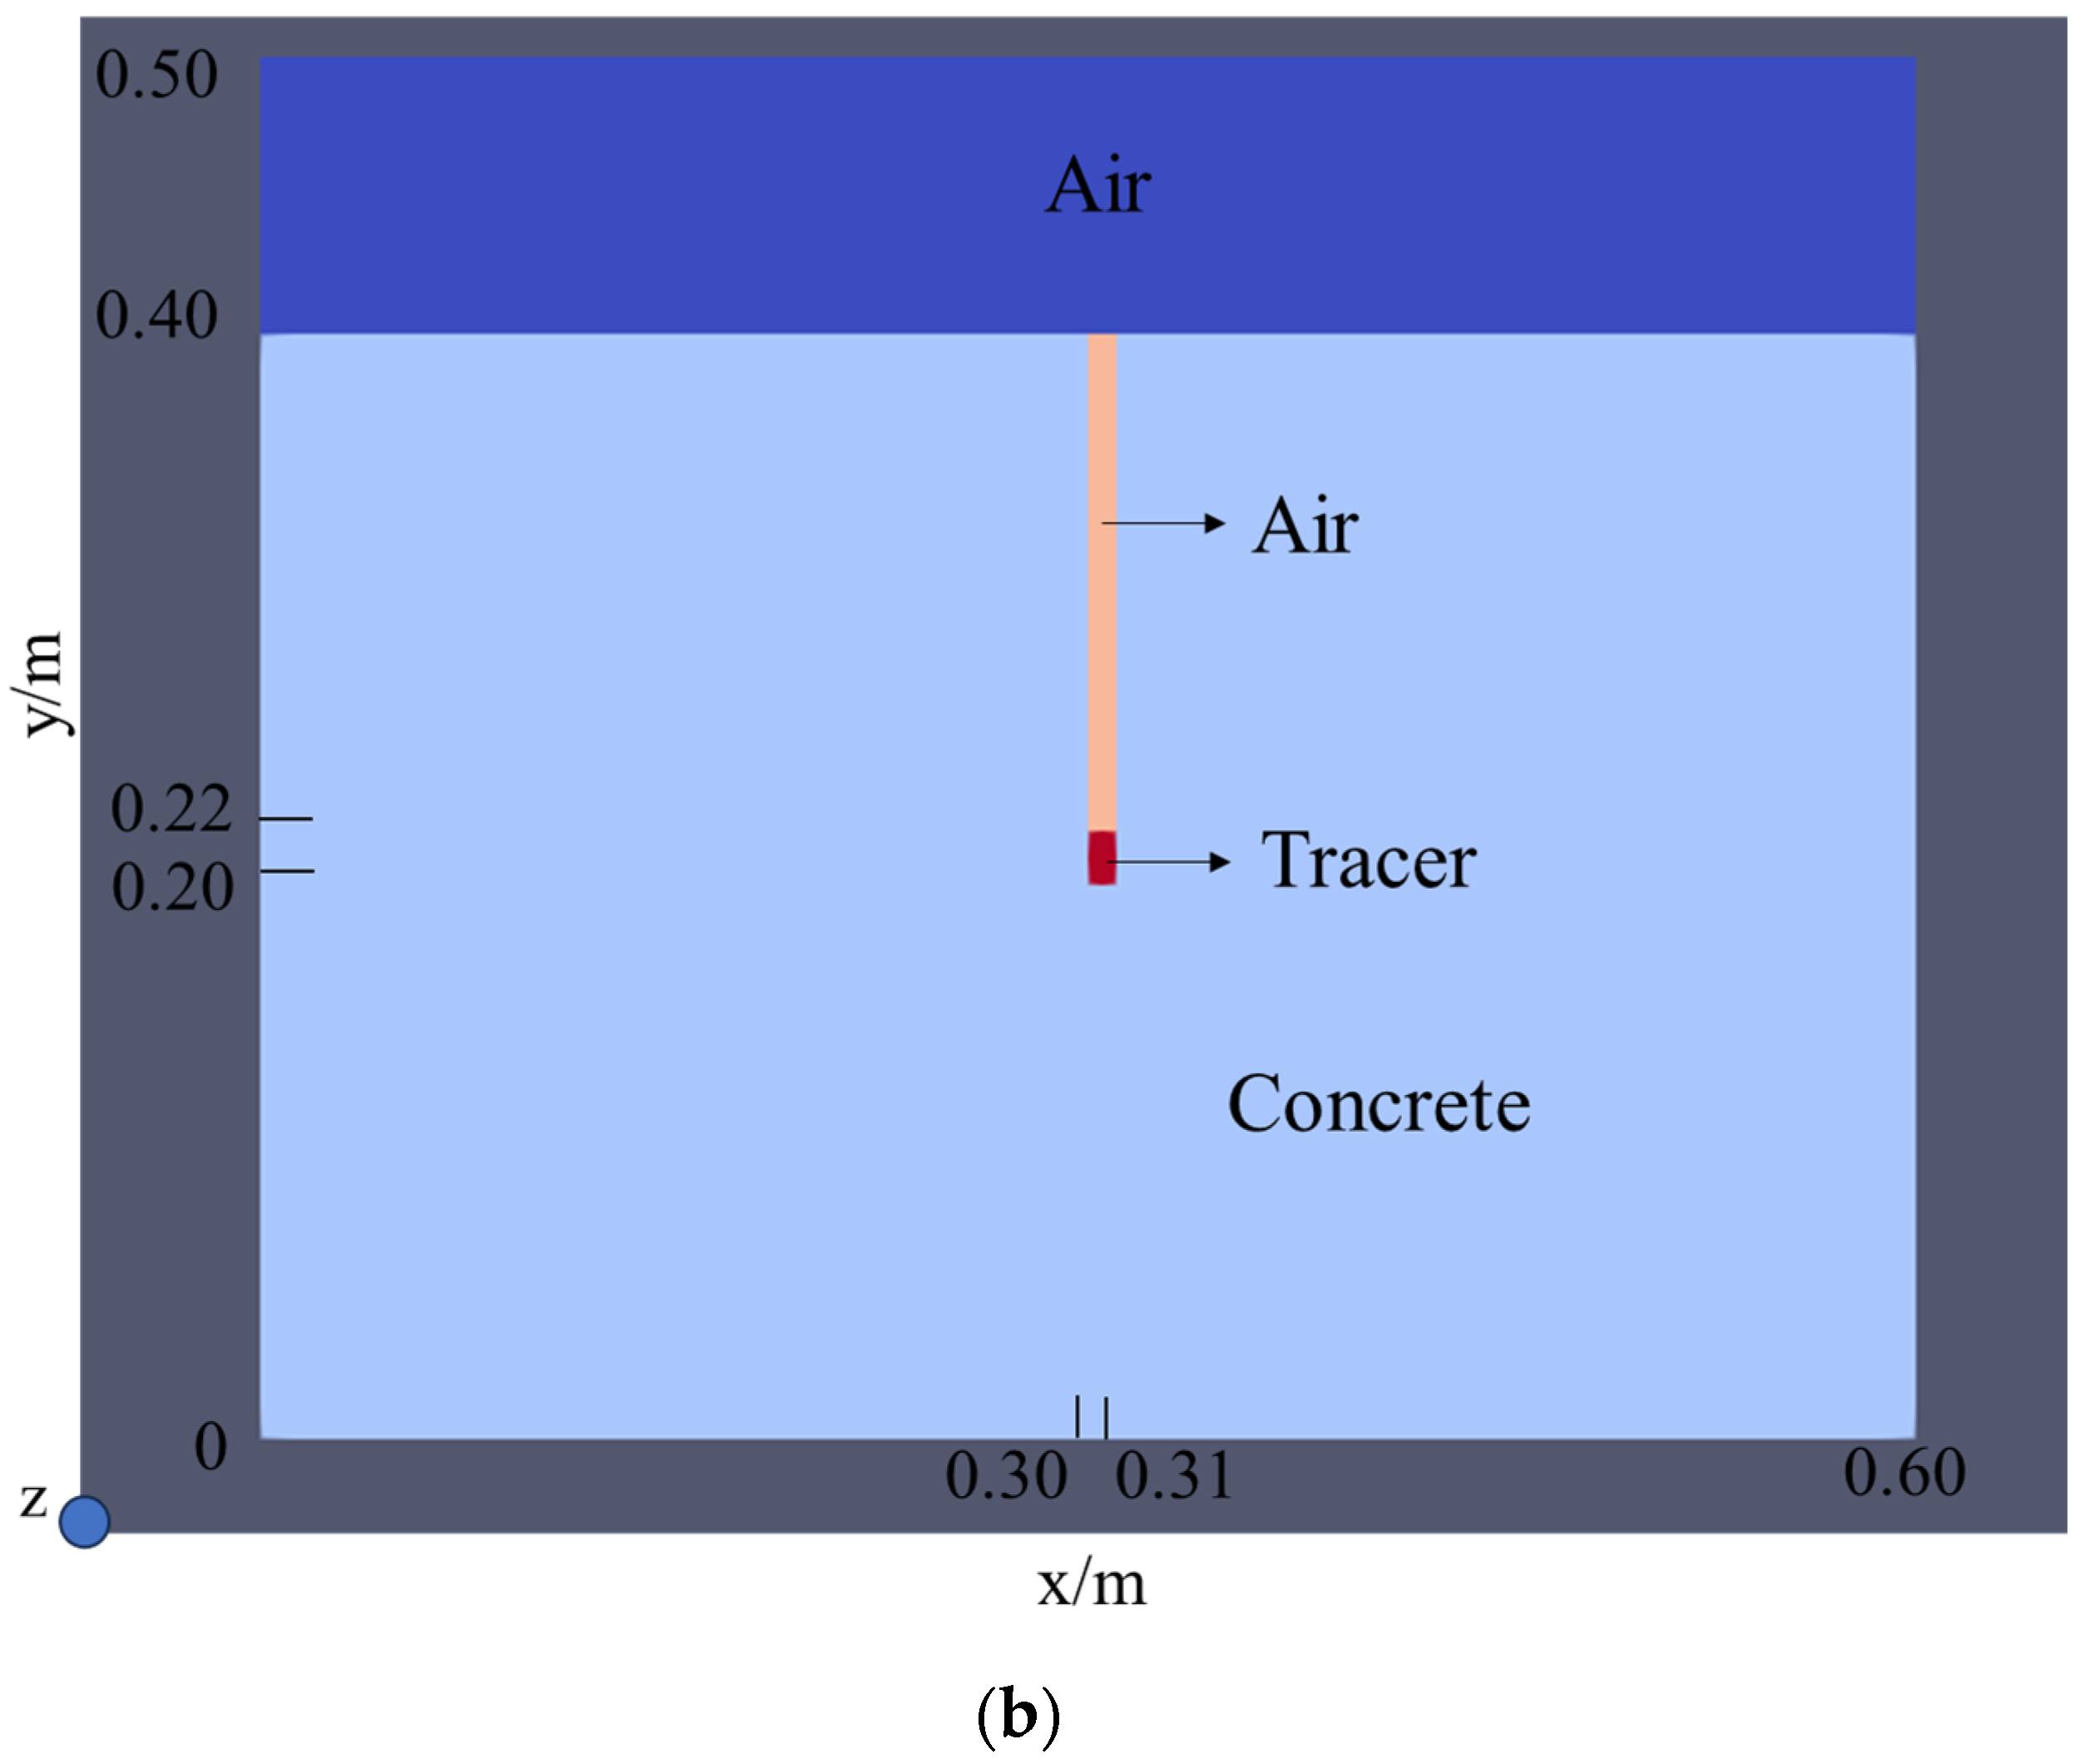
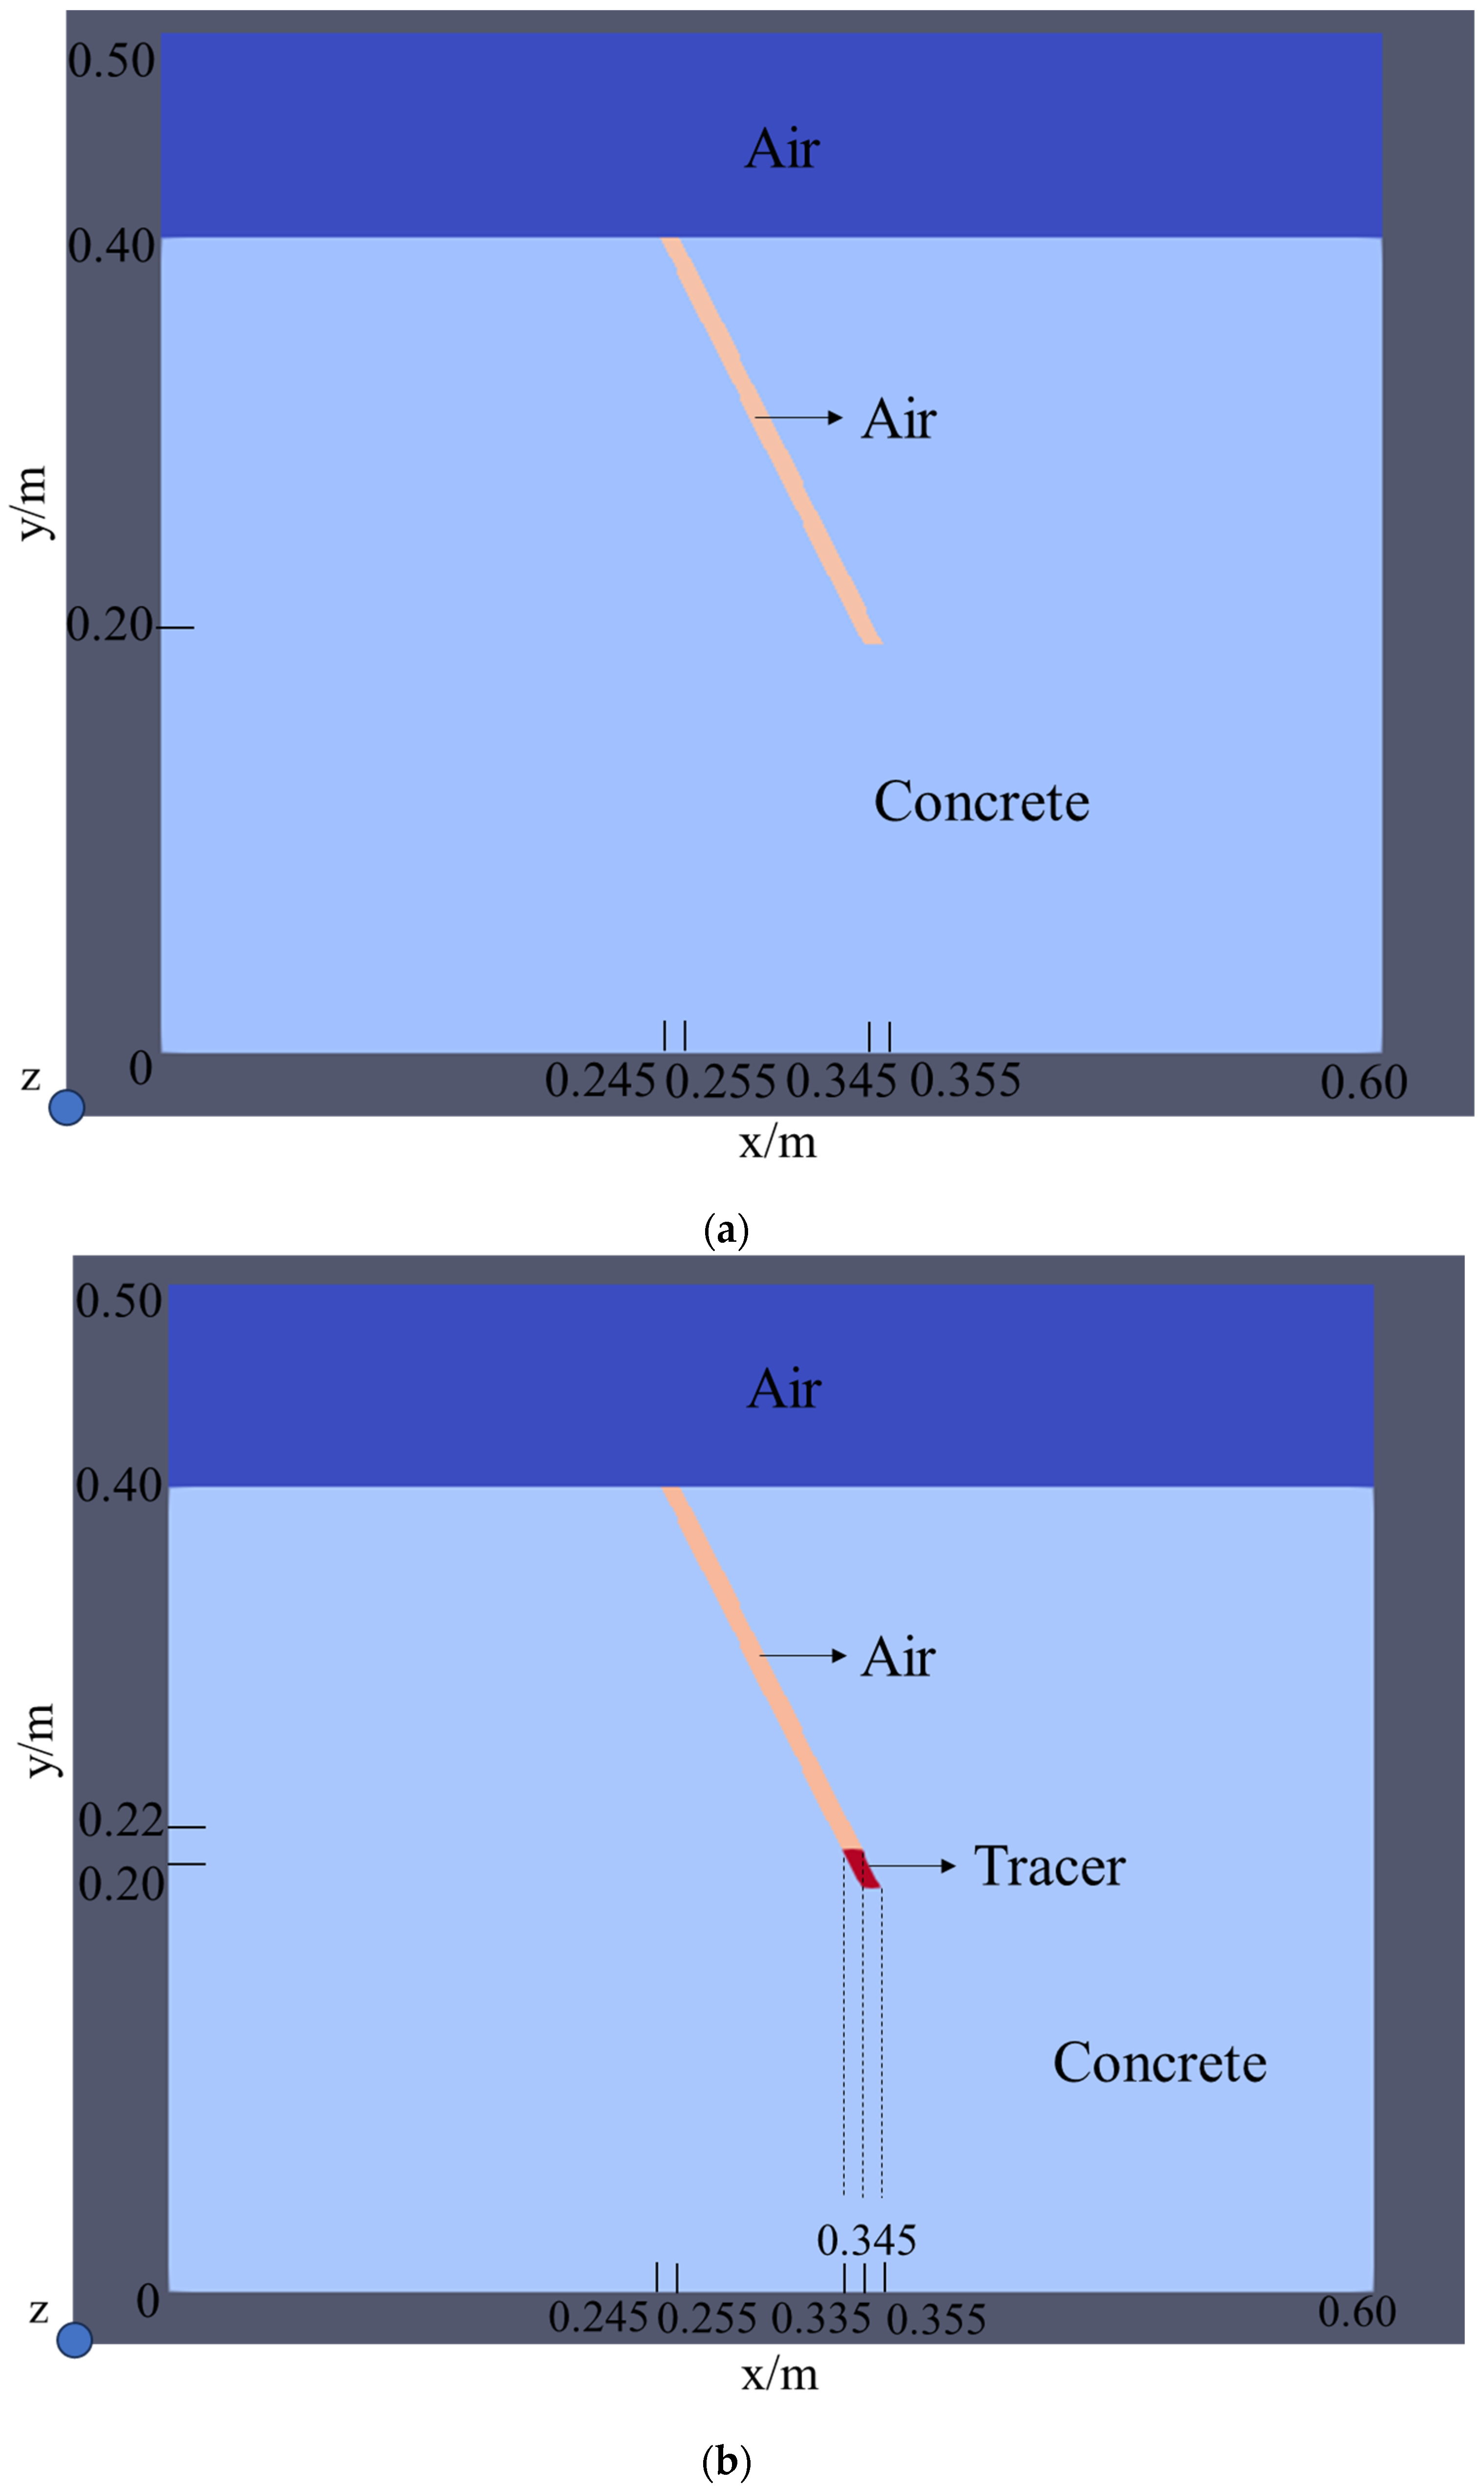
3.1. Example of Vertical Crack
3.2. Example of Diagonal Crack
4. Example Exploration
4.1. Test Materials and Equipment
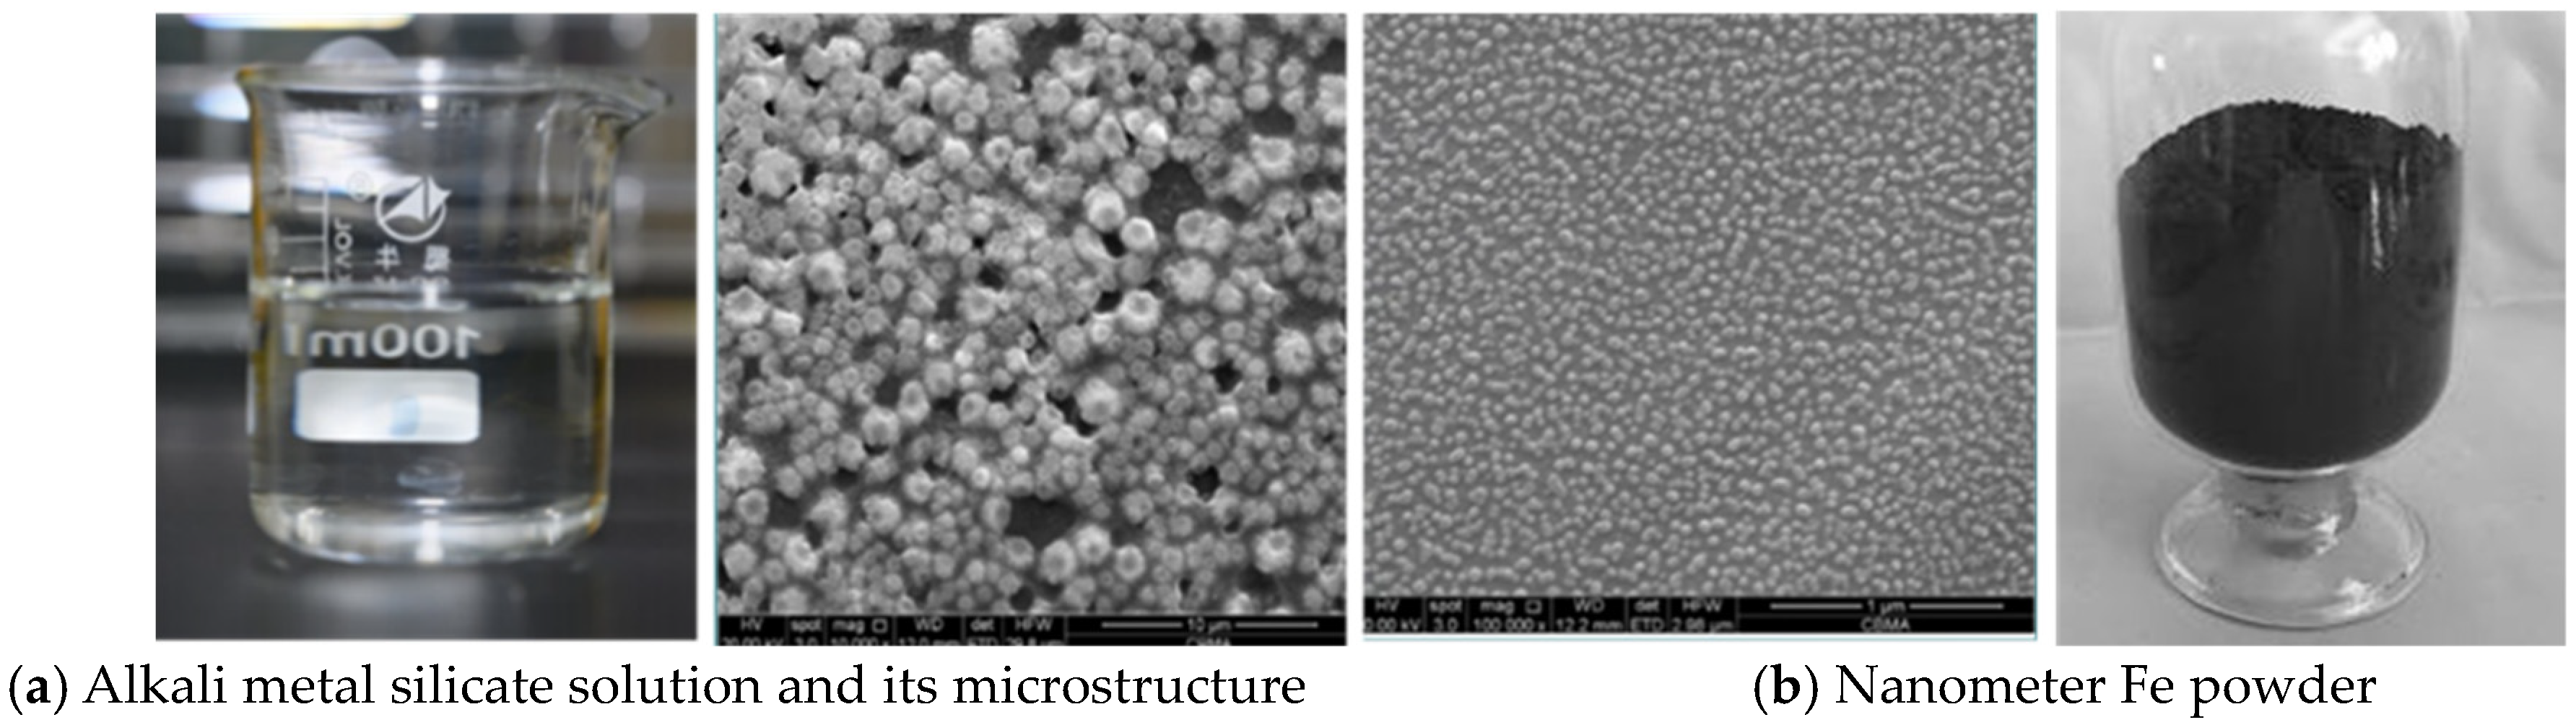
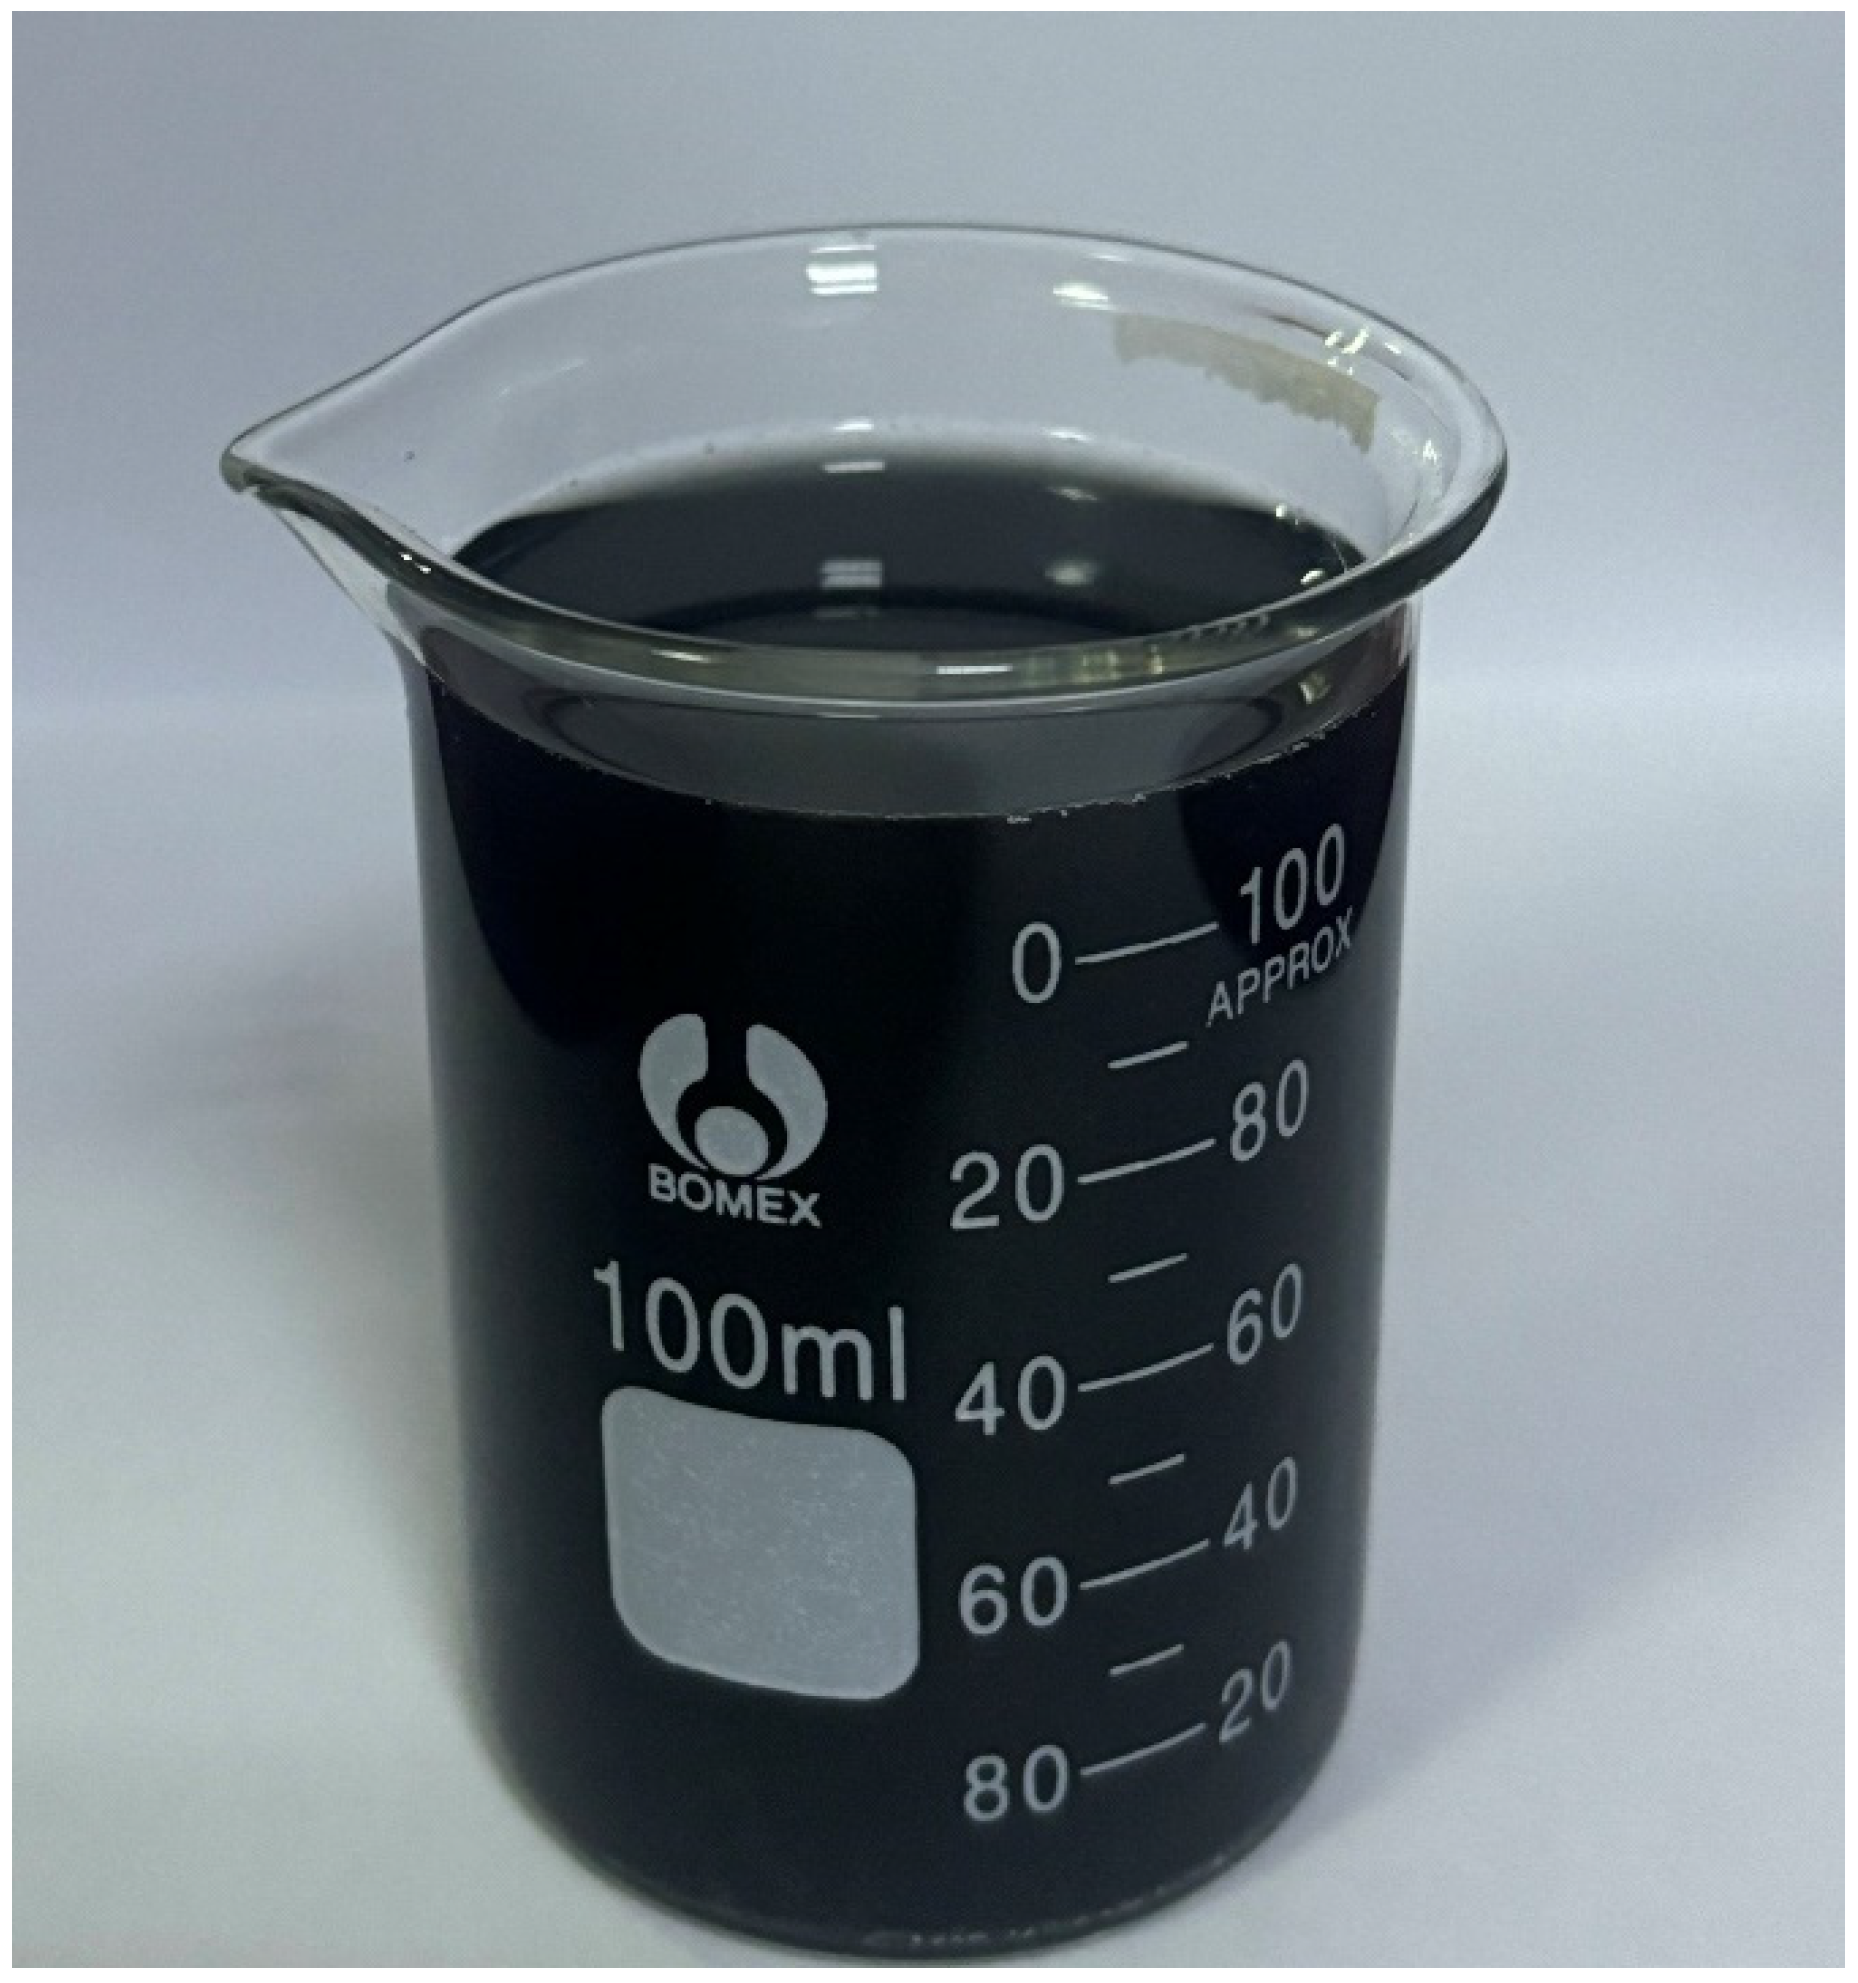
- (1)
- Indicator
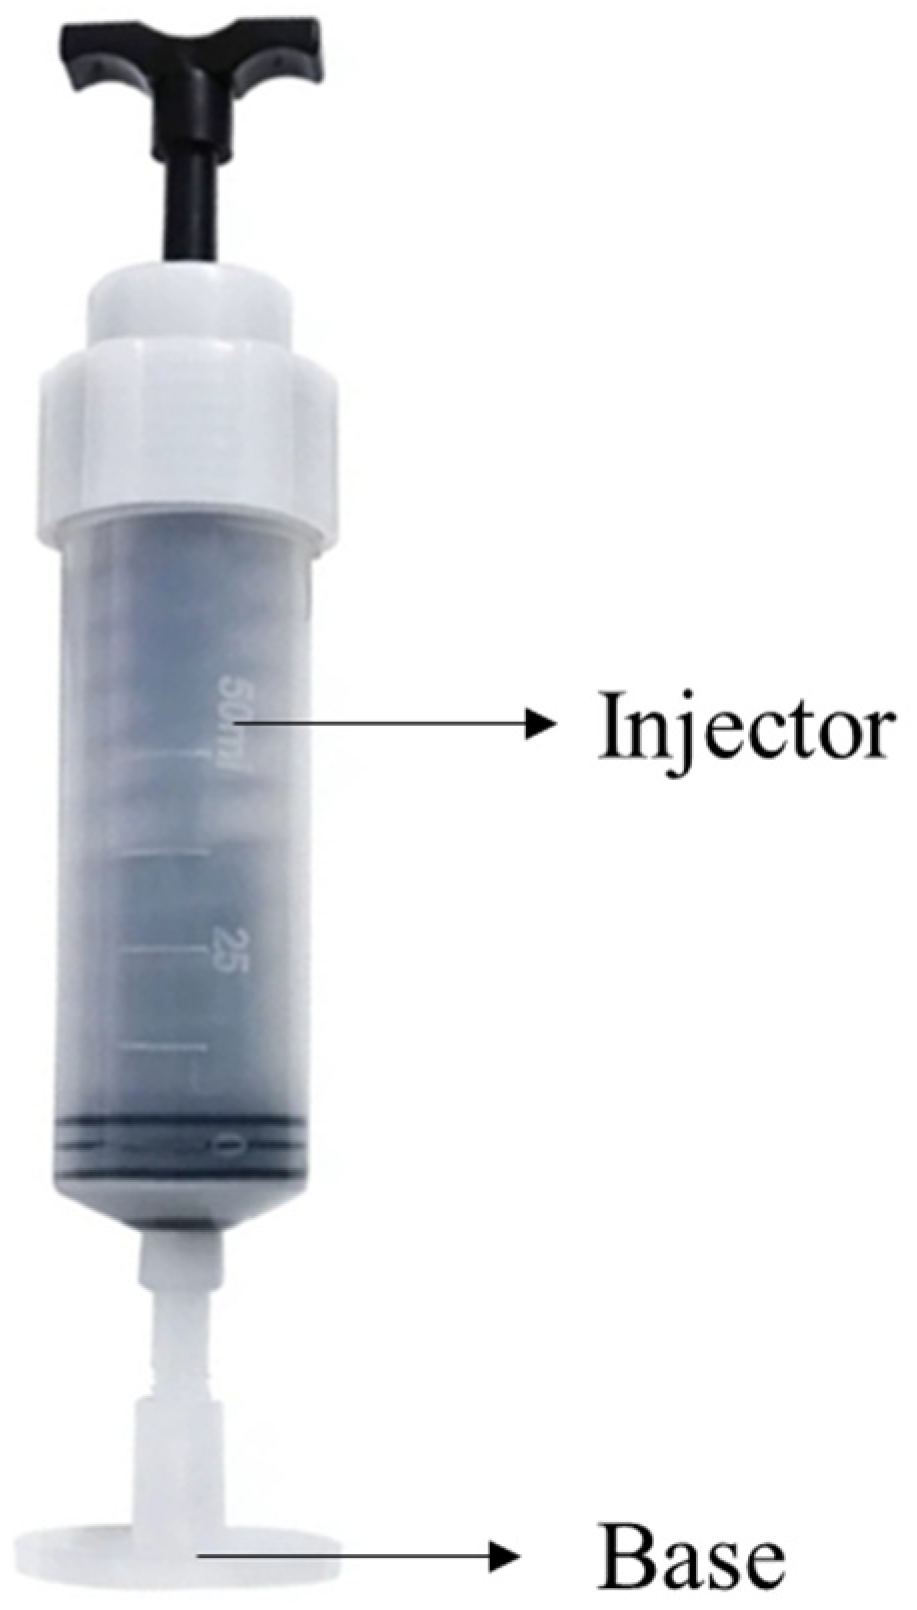
- (2)
- Indicator filling equipment
- (3)
- Ground-penetrating radar
4.2. Test Methods and Procedures
- (1)
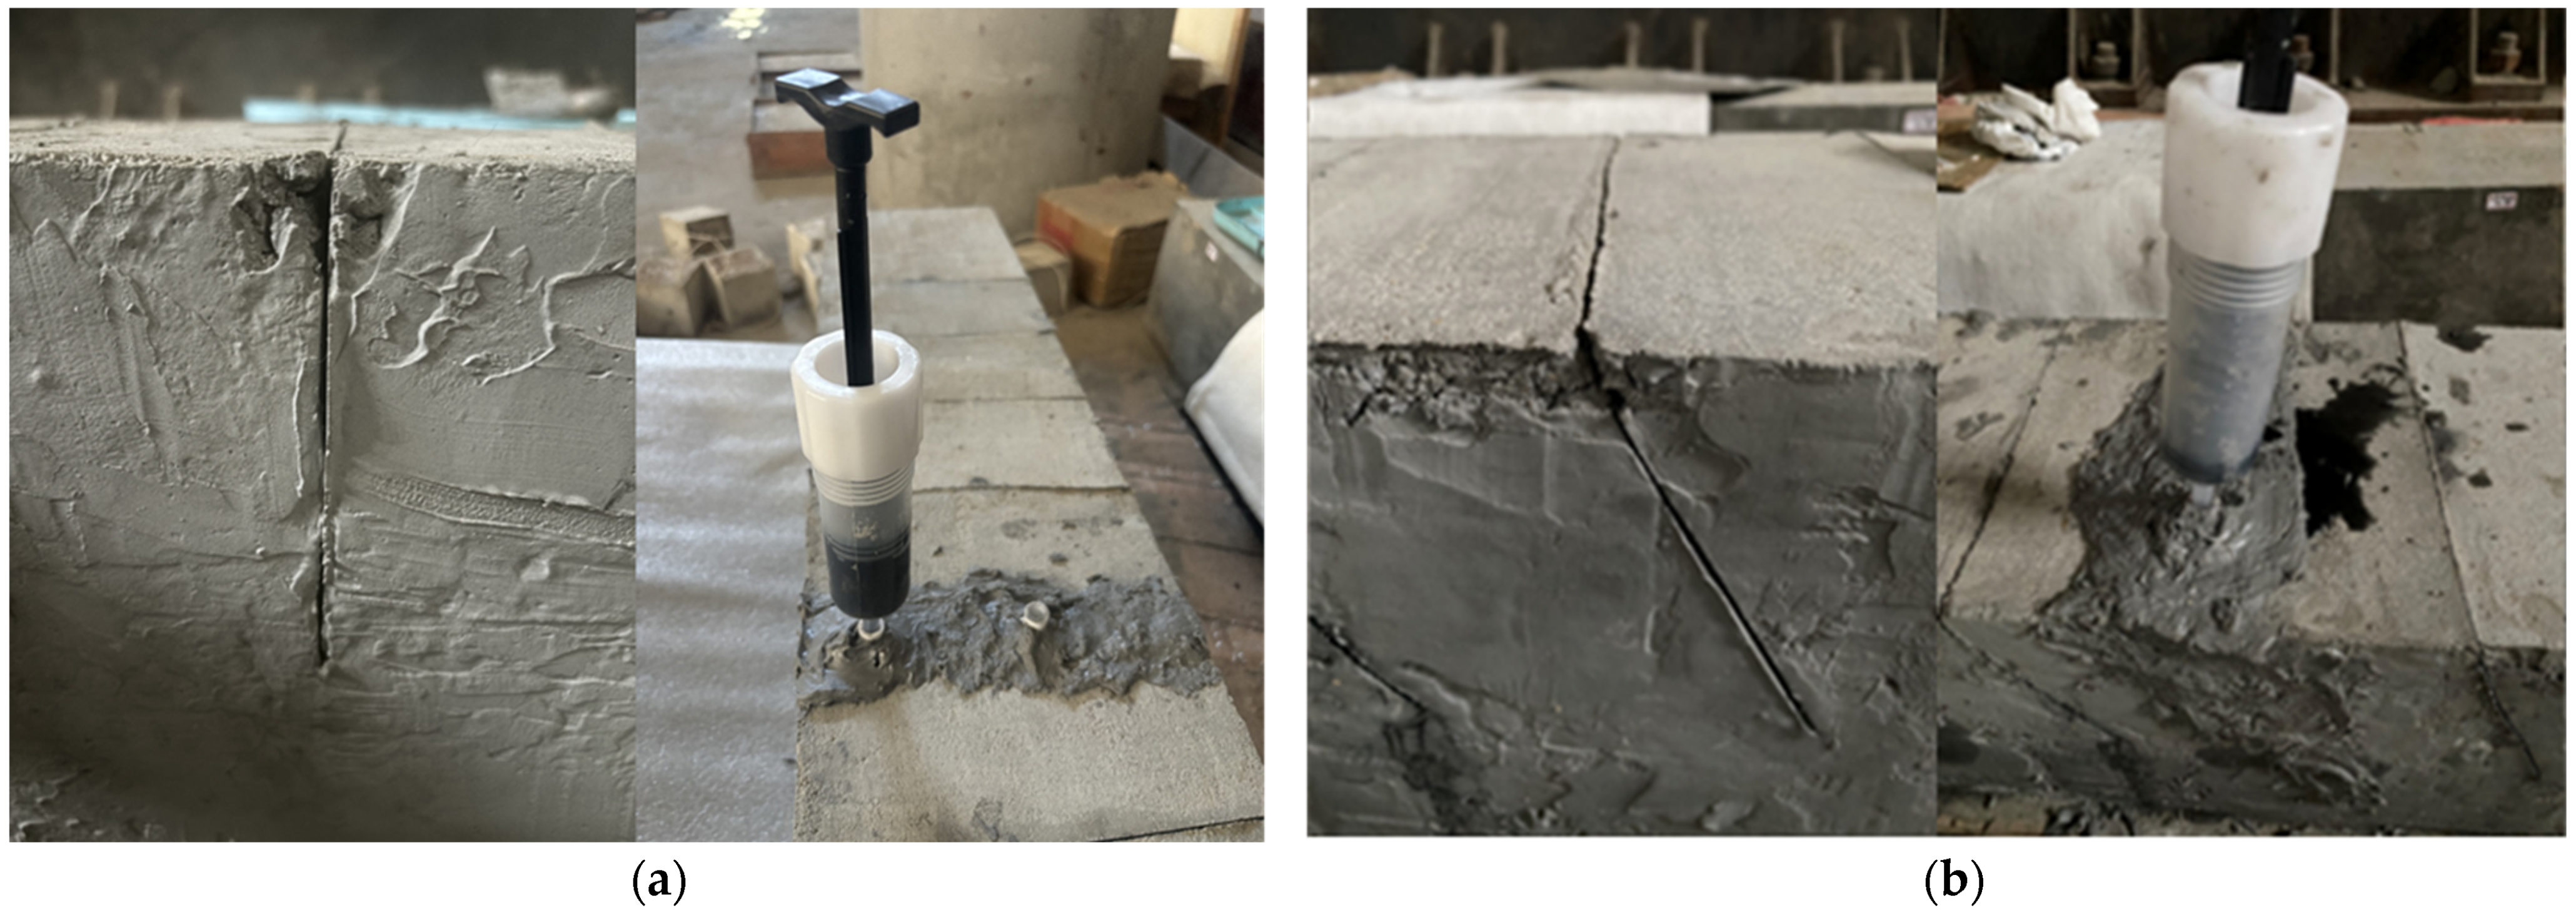
- Clean the structure’s surface of dust and impurities in the cracks before testing, place two bases on the cracks on the structure’s top surface, seal the top surface of the structure’s cracks with epoxy cement on both sides, and fix the grouting bases.
- (2)
- Fill the indicator into one of the bases using a filler, using 20 mL of indicator for this test.
- (3)
- After indicator filling, take the centerline of the concrete specimen perpendicular to the crack as the direction of ground-penetrating radar detection, and overlap the front and rear laser marking lines of the ground-penetrating radar with the centerline when detecting.
- (4)
- Start the detection at 40 cm from the crack opening of the concrete member, put the hand-held radar close to the detection surface and keep a uniform speed, travel through the crack until the detection ends at 40 cm from the other end of the crack opening, and record and save the data. When detecting diagonal cracks, extend the detection length in the direction of crack inclination.
4.3. Test Results and Analysis
- (1)
- Vertical crack depth test results
- (2)
- Oblique crack depth detection results
5. Conclusions and Outlook
5.1. Conclusions
- (1)
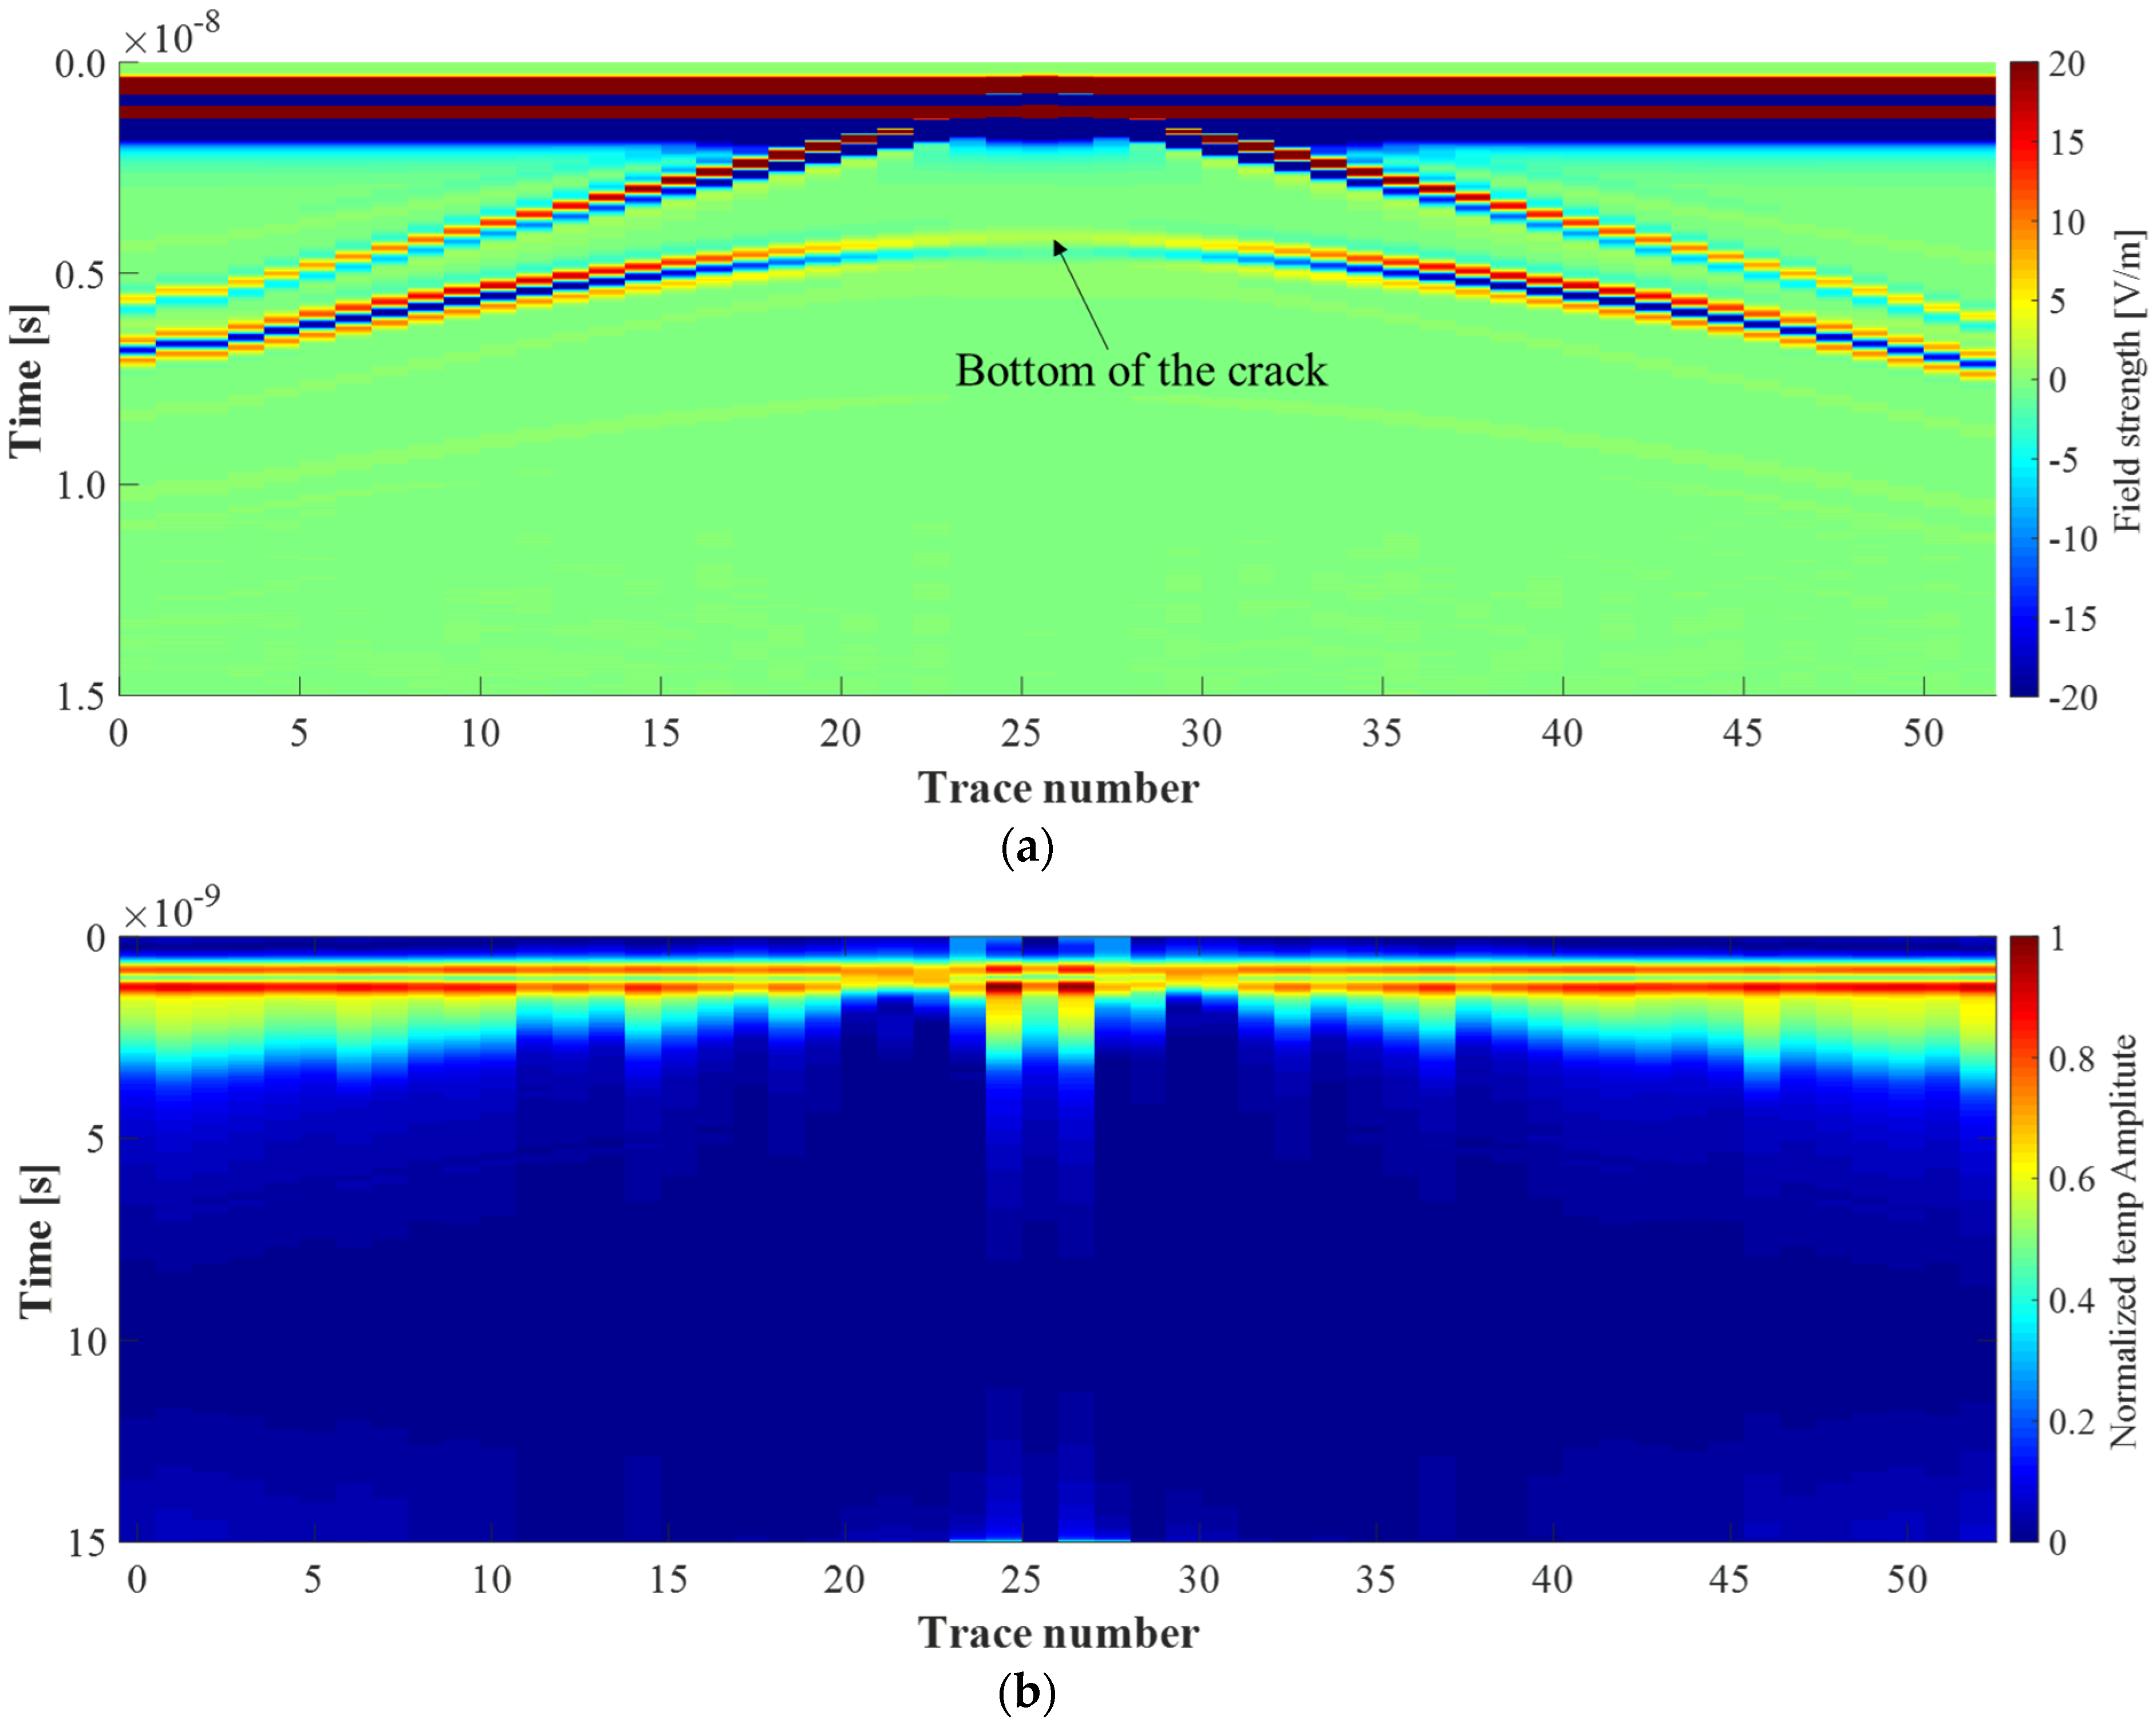
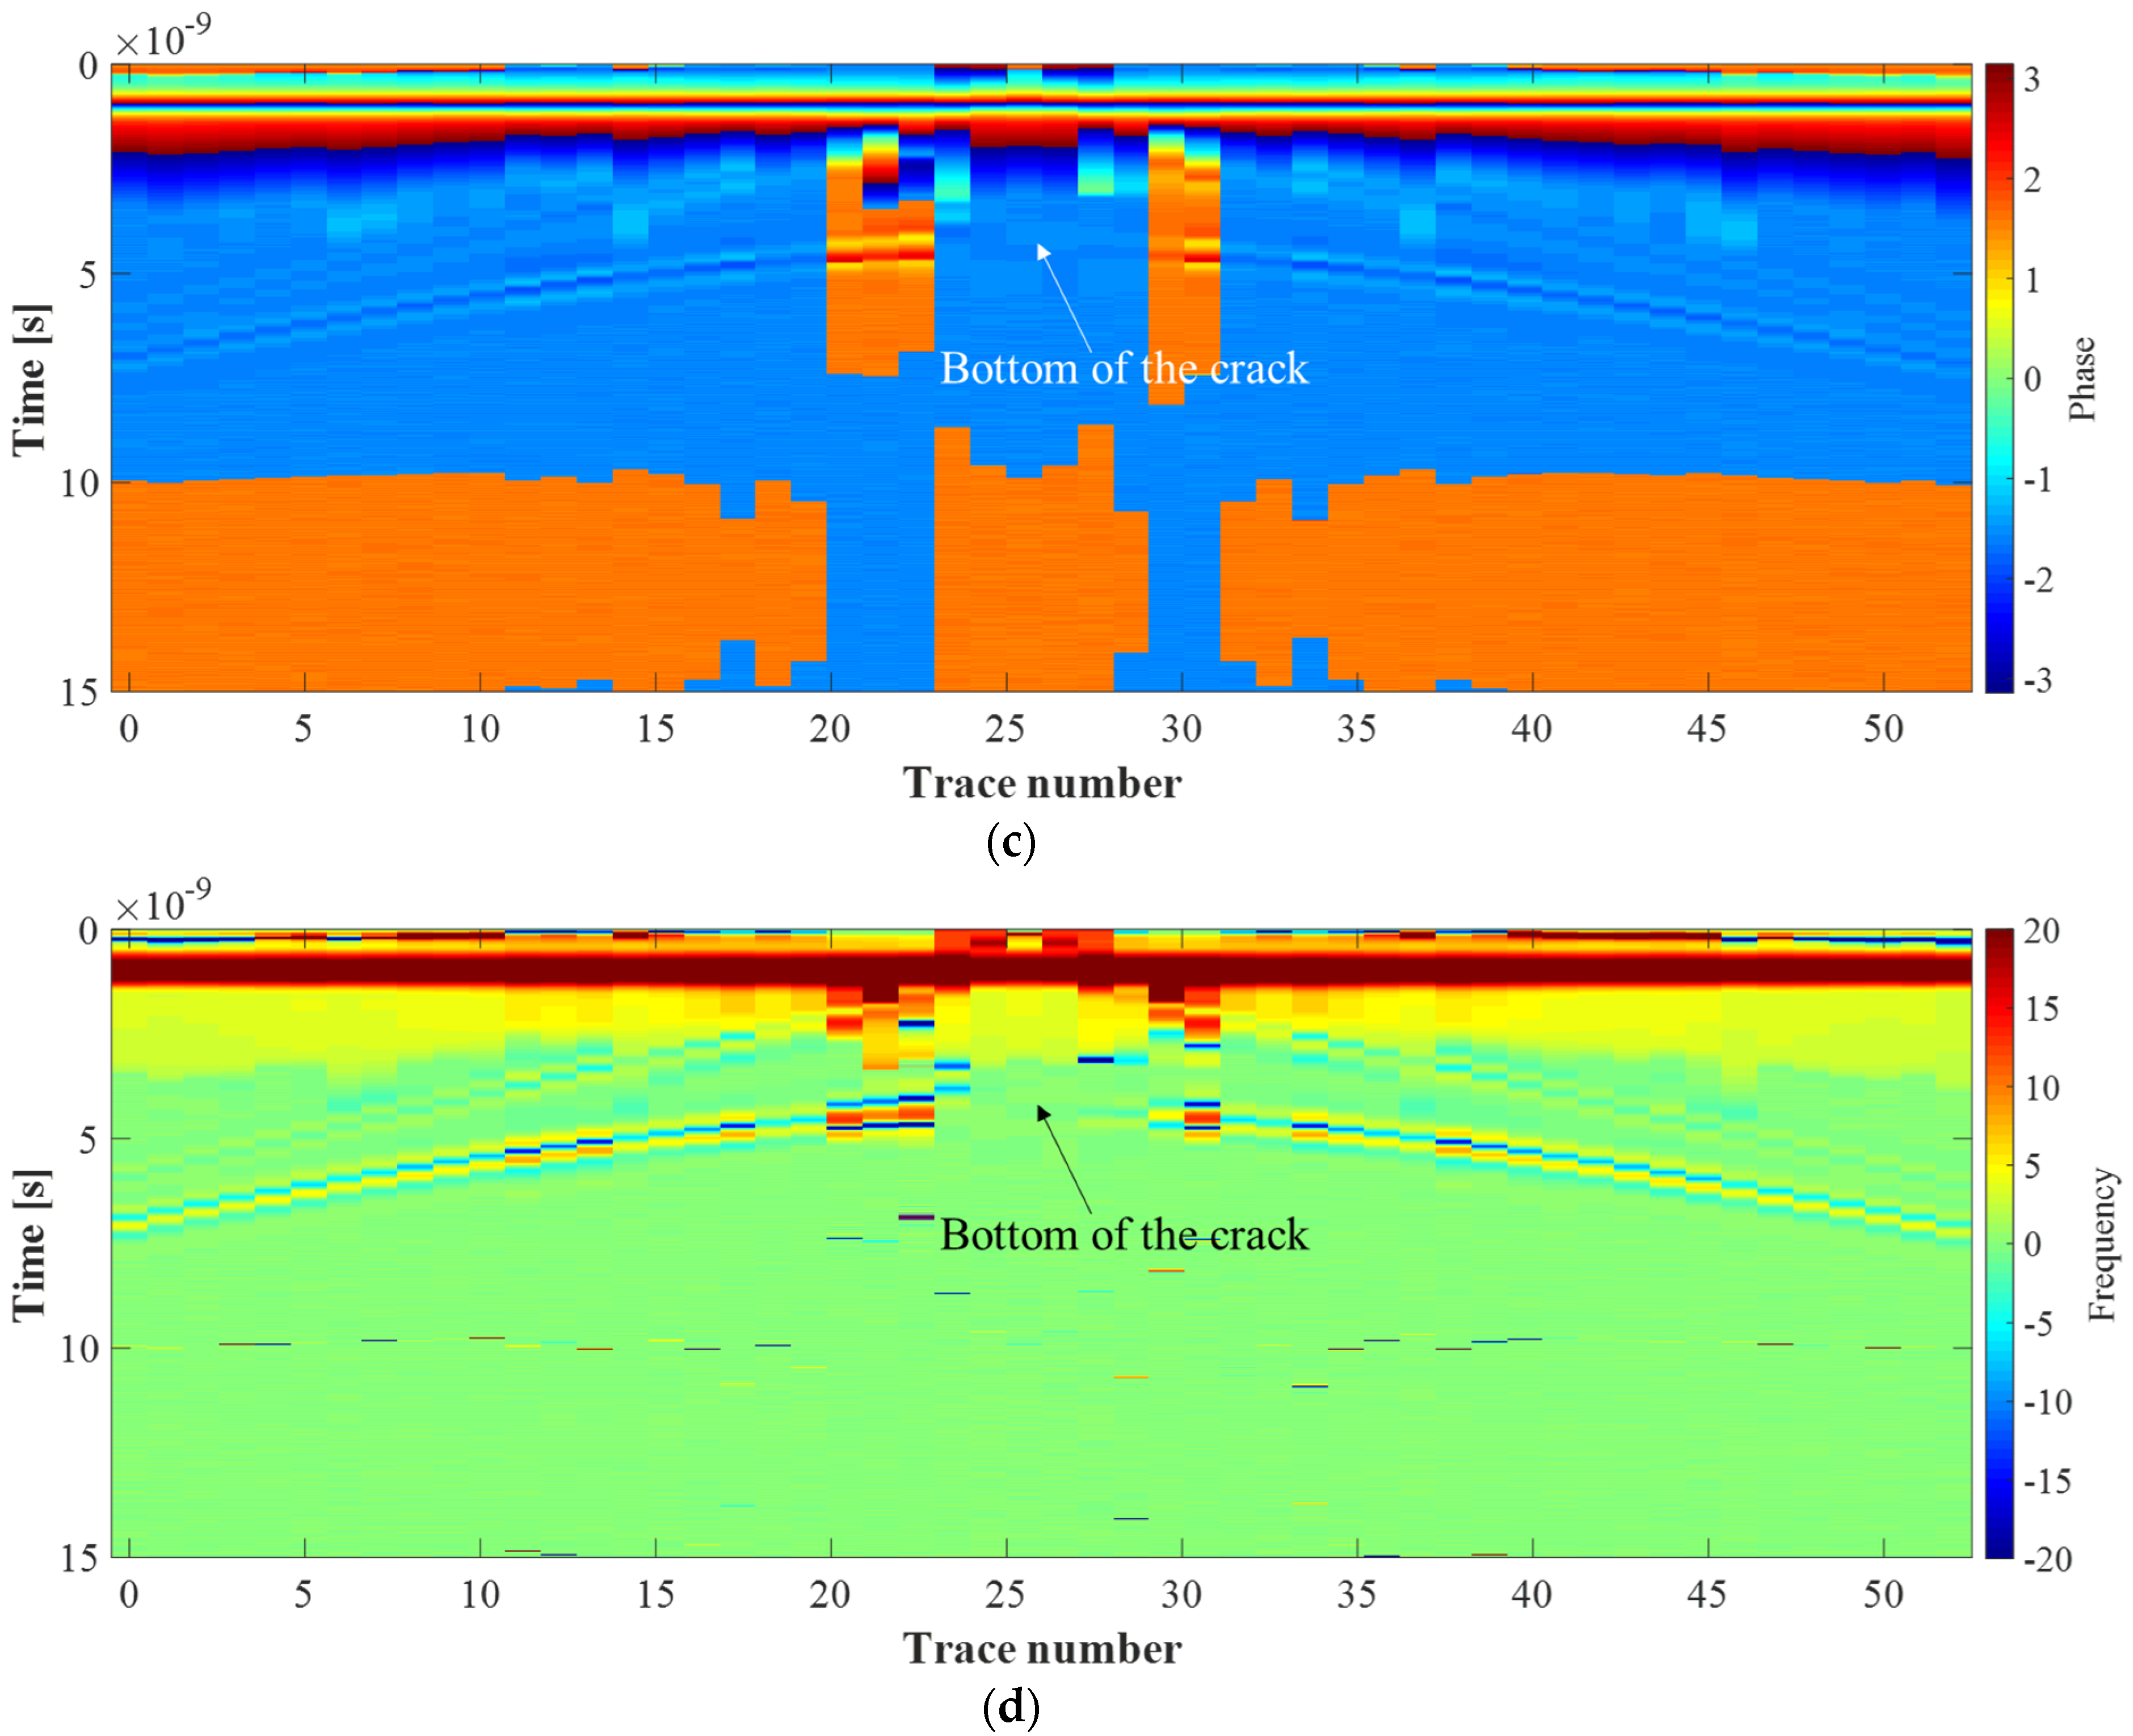
- The homogeneous axis of the crack reflection signal is hyperbolic. The location of the crack can be inferred from the homogeneous axis, and it is difficult to distinguish the bottom of the crack. Meanwhile, the homogeneous axis of the crack reflection signal is consistent with its shape. After injecting the indicator into the crack, the reflection signal at the bottom of the crack is more obvious. The height of the indicator affects the detection accuracy of the tracer electromagnetic method. The detected crack depth is smaller than the actual crack depth.
- (2)
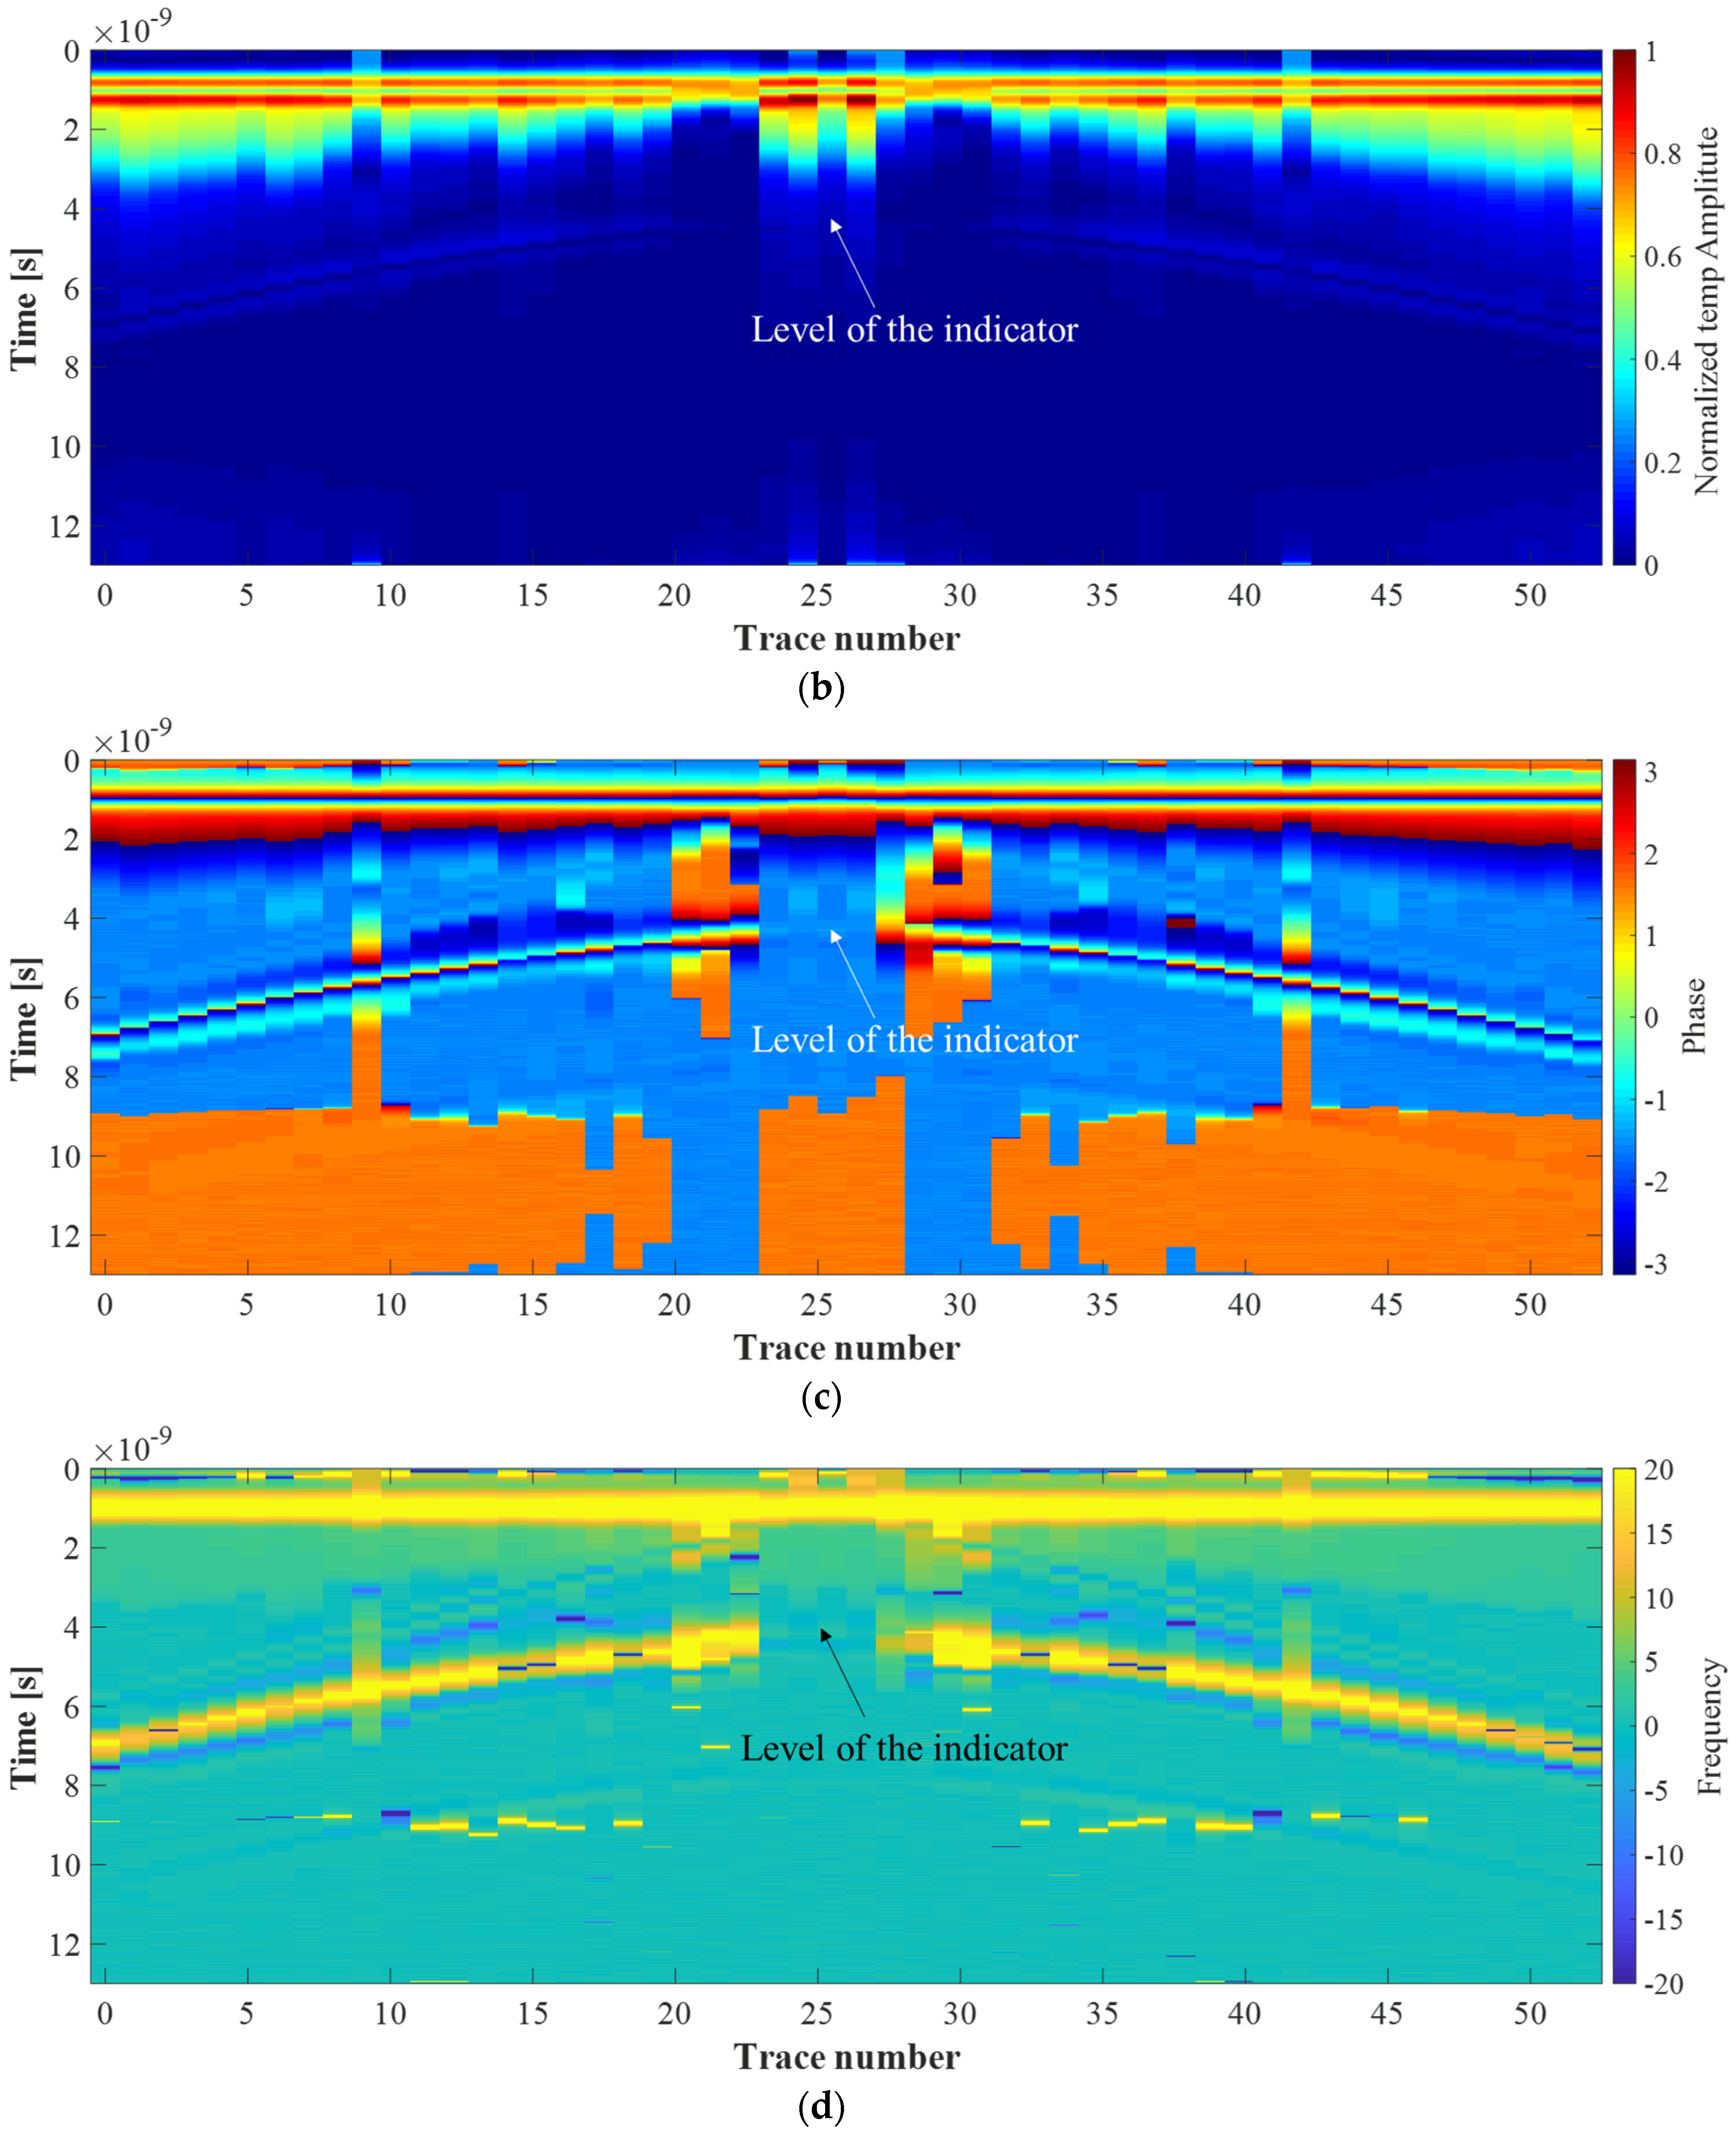
- Compared with an indicator-free crack, the bottom amplitude of an indicator-containing crack is significantly enhanced. The instantaneous phase can be acquired with higher resolution, and even very weak signals can be displayed, so the location of the bottom end of the crack can be distinguished more easily. When the bottom of a crack contains an indicator, the phase is reversed by 180, and the instantaneous frequency reflects the physical change in the concrete structure and is significantly lower when the bottom of the crack contains an indicator.
- (3)
- Both the forward simulation and the actual physical test show that the crack morphology distribution and the location of the crack bottom can be analyzed more conveniently using the complex signal analysis technique, which improves the precision and accuracy of the crack depth detection and interpretation.
5.2. Outlook
Author Contributions
Funding
Data Availability Statement
Conflicts of Interest
Correction Statement
References
- Liu, X.; Chen, J.; Wang, H.; Jia, Z.; Wu, Z. Earthquake Economic Loss Assessment of Reinforced Concrete Structures Using Multiple Response Variables. Buildings 2023, 13, 1719. [Google Scholar] [CrossRef]
- Wang, X.; Wang, P.; Zhang, Y.; Liu, B. Seismic performance impacts of staircases in reinforced concrete frame structures under rarely occurred earthquake. J. Comput. Methods Sci. Eng. 2024, 24, 2447–2467. [Google Scholar] [CrossRef]
- Li, N.; Zhu, B.; Zhang, L.; Kishiki, S. Damage analysis of a pseudoclassic reinforced concrete frame structure under the action of the Ms 6.8 Luding earthquake in China. Structures 2024, 60, 58–87. [Google Scholar] [CrossRef]
- Bai, Z.; Liu, T.; Zou, D.; Zhang, M.; Hu, Q.; Li, Y. Multi-scale image-based damage recognition and assessment for reinforced concrete structures in post-earthquake emergency response. Eng. Struct. 2024, 314, 118402. [Google Scholar] [CrossRef]
- Arab, A.R.; Banan, M.R.; Banan, M.R. Post-earthquake Performance Level Investigation of ACI-Based Designed Simplified Reinforced Concrete Structures. Iran. J. Sci. Technol. Trans. Civ. Eng. 2022, 46, 1049–1058. [Google Scholar] [CrossRef]
- Wang, Y.; Tang, L.; Jia, Y.; Zhang, S. Scheme Design and experimental study of selective thermal stimulation for concrete microcracks based on ir thermography. Nondestr. Eval. 2021, 40, 32. [Google Scholar] [CrossRef]
- Golding, V.P.; Gharineiat, Z.; Munawar, H.S.; Ullah, F. Crack Detection in Concrete Structures Using Deep Learning. Sustainabilit 2022, 14, 8117. [Google Scholar] [CrossRef]
- Jia, Y.; Tang, L.; Ming, P.; Xie, Y. Ultrasound-excited thermography for detecting microcracks in concrete materials. NDT E Int. 2019, 101, 62–71. [Google Scholar] [CrossRef]
- Hosoda, A.; Akmal, A.; Toshida, Y.; Saleem, M. Prediction of Maximum Crack Width by Machine Learning Using Concrete Construction Data in Yamaguchi System. Int. J. Intell. 2022, 3, 898–905. [Google Scholar]
- Belattar, S.; Rhazi, J.; Ballouti, A.E. Non-destructive testing by infrared thermography of the void and honeycomb type defect in the concrete. Int. J. Microstruct. Mater. Prop. 2012, 7, 235–253. [Google Scholar] [CrossRef]
- Jia, Y.; Tang, L.; Ming, P.; Xie, Y. Crack detection in concrete parts using ultrasound excited thermography. Nondestr. Eval. 2019, 38, 21. [Google Scholar]
- Seher, M.; In, C.W.; Kim, J.Y.; Kurtis, K.E.; Jacobs, L.J. In numerical and experimental study of crack depth measurement in concrete using diffuse ultrasound. J. Nondestruct. Eval. 2013, 32, 81–92. [Google Scholar] [CrossRef]
- Chang, J.; Yuan, J.; Zhao, Y. Impact on ultrasonic level test method of concrete crack depth. Appl. Mech. Mater. 2014, 3306, 1016–1019. [Google Scholar]
- Rucka, M.; Wilde, K. Application of continuous wavelet transform in vibration based damage detection method for beams and plates-Science Direct. J. Sound Vib. 2006, 297, 536–550. [Google Scholar] [CrossRef]
- Feng, K.; Li, Z.; Gao, G.-Y.; Su, X.-Y. Damage detection method in complicated beams with varying flexural stiffness. Appl. Math. Mech. 2011, 32, 469–478. [Google Scholar] [CrossRef]
- Lu, X.; Sun, Q.; Lu, Y. Fundamentals of impact elastic wave-based CT and its application to non-destructive inspection of hydraulic concrete structures. Water Resour. Hydropower Eng. 2013, 44, 107–112. [Google Scholar]
- Chai, H.K.; Momoki, S.; Aggelis, D.G.; Shiotani, T. Characterization of Deep Surface-Opening Cracks in Concrete: Feasibility lmpact Generated Rayleigh Waves. ACI Mater. J. 2010, 107, 305–311. [Google Scholar]
- Yao, Z.; Hui, Z. Detection Method of Track Slab Surface Crack Depth Based on Rayleigh Wave. Urban Mass Transit. 2022, 25, 46–51. [Google Scholar]
- Yu, H.; Zhu, L.; Li, D.; Wang, Q.; Liu, X.; Shen, C. Comparative Study on Concrete Crack Detection of Tunnel Based on Different Deep Learning Algorithms. Front. Earth Sci. 2022, 9, 817785. [Google Scholar] [CrossRef]
- Cheng, B.; Zhang, S.; Wang, Z. Research and engineering application about defects detection of concrete-filled steel tube by ultrasonic method. Concrete 2008, 108–110+114. [Google Scholar] [CrossRef]
- Zhou, Z.; Sun, G.; Li, Z. Application of Laser Ultrasonic Testing Technique on the Detection of Composite Structures. J. Harbin Univ. Sci. Technol. 2012, 17, 119–122. [Google Scholar]
- Adams, M.; Sines, G. Crack extension from flaws in a brittle material subjected to compression. Tectonophysics 1978, 49, 97–118. [Google Scholar] [CrossRef]
- Hsiao, C.; Cheng, C.C.; Liou, T.; Juang, Y. Detecting flaws in concrete blocks using the impact-echo method. NDT E Int. 2008, 41, 98–107. [Google Scholar] [CrossRef]
- Wang, Y.; Jia, Y.; Liang, J.; Tang, L.; Guan, F.; Li, P.; Zhang, S.; Tian, H. Crack depth measurement and key points of accurate identification in concrete structures a review. Nondestruct. Test. Eval. 2024, 1–35. [Google Scholar] [CrossRef]
- Wang, Y.; Tang, L.; Zhang, S.; Jia, Y.; Tian, H.; Liang, J. Research on visualization of plain concrete crack depth detection based on tracer and hand-held radar. Nondestruct. Test. Eval. 2023, 39, 408–425. [Google Scholar] [CrossRef]
- Wu, Y.; Jiang, P.; Yu, Y. Study on Ultrasonic Detection of Concrete Crack Depth. J. Civ. Eng. Urban Plan. 2022, 4, 53–58. [Google Scholar]
- Yang, X.; Hui, B.; Lu, B.; Yuan, B.; Li, Y. Effect of 3D laser point spacing on cement concrete crack width measurement. Meas. Sci. Technol. 2023, 34, 085018. [Google Scholar] [CrossRef]
- Hongkuan, S. Combination Logging Tool of Electromagnetic Flowmeter and Tracer Correlation Flowmeter. Well Logging Technol. 2010, 34, 386–388. [Google Scholar] [CrossRef]
- Hussein, R.; Etete, B.; Mahdi, H.; Al-Shukri, H. Detection and delineation of cracks and voids in concrete structures using the ground penetrating radar technique. J. Appl. Geophys. 2024, 226, 105379. [Google Scholar] [CrossRef]
- Wu, Q.; Wang, Q.; Pi, Q. Analysis on the image features of ground penetrating radar for cavity of concrete pavement. Coal Geol. Explor. 2018, 46, 181–185. [Google Scholar]
- Sun, X.; Guo, X.; Guo, L.; Wu, B.; Wang, Y. Multiscale Analysis of Concrete Damage and Crack Propagation Under High Cycle Loading. Int. J. Comput. Methods 2019, 17, 93. [Google Scholar] [CrossRef]
- Brabants, L.; Reniers, B.; Cavus, H.; Paepen, J.; Vandoren, B.; Schroeyers, W. Computed tomography to evaluate the influence of the internal concrete structure on attenuation coefficients. Radiat. Phys. Chem. 2022, 201, 110433. [Google Scholar] [CrossRef]
- Zhang, C.; Liu, Y.; Si, W. Synthetic algorithm for deinterleaving radar signals in a complex environment. IET Radar Sonar Navig. 2020, 14, 1918–1928. [Google Scholar]
- Zhang, C.; Han, Y.; Zhang, P.; Song, G.; Zhou, C. Research on modern radar emitter modelling technique under complex electromagnetic environment. J. Eng. 2019, 2019, 7134–7138. [Google Scholar] [CrossRef]
- Xie, X.; Wan, M. The application of complex signal analysis to process ground penetrating radar data. Comput. Tech. Geophys. Geochem. Explor. 2000, 22, 108–112. [Google Scholar]
- Bin, L.; Shu Cai, L. Study of application of complex signal analysis to predicting karst-fractured ground water with GPR. Rock Soil Mech. 2009, 30, 2191–2196. [Google Scholar]


| Media | Media | ||
|---|---|---|---|
| Silty clay | 6 | Dry sand | 3~5 |
| Concrete | 6~8 | Water | 80 |
| Air | 1 | Metal | 300 |
| Medium | Conductivity σ/(S/m) | |
|---|---|---|
| atmosphere | 1 | 0 |
| concrete | 8 | 1 × 10⁻³ |
| indicator | 270 | 1.6 × 10⁴ |
| Physical and Chemical Projects | Parameter |
|---|---|
| Appearance | Black transparent liquid |
| Density (g/cm3) | ≥1.10 |
| pH value | 11 ± 1 |
| Viscosity (s) | 11.0 ± 1.0 |
| Surface tension (mN/m) | ≤26.0 |
| Dielectric constant | 270 |
| Conductivity (s/m) | 1.25 × 10⁴ |
Disclaimer/Publisher’s Note: The statements, opinions and data contained in all publications are solely those of the individual author(s) and contributor(s) and not of MDPI and/or the editor(s). MDPI and/or the editor(s) disclaim responsibility for any injury to people or property resulting from any ideas, methods, instructions or products referred to in the content. |
© 2024 by the authors. Licensee MDPI, Basel, Switzerland. This article is an open access article distributed under the terms and conditions of the Creative Commons Attribution (CC BY) license (https://creativecommons.org/licenses/by/4.0/).
Share and Cite
Wang, Y.; Zhang, S.; Jia, Y.; Tang, L.; Tao, J.; Tian, H. Forward Simulation and Complex Signal Analysis of Concrete Crack Depth Detection Using Tracer Electromagnetic Method. Buildings 2024, 14, 2644. https://doi.org/10.3390/buildings14092644
Wang Y, Zhang S, Jia Y, Tang L, Tao J, Tian H. Forward Simulation and Complex Signal Analysis of Concrete Crack Depth Detection Using Tracer Electromagnetic Method. Buildings. 2024; 14(9):2644. https://doi.org/10.3390/buildings14092644
Chicago/Turabian StyleWang, Yulei, Shengxing Zhang, Yu Jia, Lei Tang, Jin Tao, and Hui Tian. 2024. "Forward Simulation and Complex Signal Analysis of Concrete Crack Depth Detection Using Tracer Electromagnetic Method" Buildings 14, no. 9: 2644. https://doi.org/10.3390/buildings14092644
APA StyleWang, Y., Zhang, S., Jia, Y., Tang, L., Tao, J., & Tian, H. (2024). Forward Simulation and Complex Signal Analysis of Concrete Crack Depth Detection Using Tracer Electromagnetic Method. Buildings, 14(9), 2644. https://doi.org/10.3390/buildings14092644